Article

Effects of Climate and Land-Use Change on the Supply and Demand Relationship of Water Provision Services in the Yellow River Basin

1
Key Laboratory of Ecosystem Network Observation and Modeling, Institute of Geographic Sciences and Natural Resources Research, Chinese Academy of Sciences, Beijing 100101, China
2
College of Resources and Environment, University of Chinese Academy of Sciences, Beijing 100190, China
3
College of Geography and Environmental Sciences, Hainan Normal University, Haikou 571158, China
*
Author to whom correspondence should be addressed.
Land 2023, 12(12), 2089; https://doi.org/10.3390/land12122089
Submission received: 12 October 2023 / Revised: 17 November 2023 / Accepted: 19 November 2023 / Published: 21 November 2023
(This article belongs to the Special Issue Integrating Ecosystem Service Assessments into Land Use Decisions)

Abstract

:
The Yellow River Basin (YRB) has undergone profound climate and land-use change. These transformations are anticipated to affect the availability of water resources, potentially causing substantial perturbations to the equilibrium between water availability and societal needs. Consequently, research is warranted to explore the ramifications of climate and land-use change on the water provision service, particularly their impacts on the delicate equilibrium between supply and demand. To quantify the water supply–demand relationship, this study introduces the water supply and demand index (WSDR). This study examines the impacts of climate and land-use change on the actual evapotranspiration, water yield, and WSDR in the YRB from 1995 to 2019. According to the results, the YRB experienced an increase in forest land by 4.72%, grassland by 1.71%, and a substantial surge of 595.36% in construction land; however, cropland witnessed a decrease of 5.95%. The climate exhibited a discernible wetting trend (3.38 mm/year, p < 0.01). The actual evapotranspiration significantly increased by 2.45 mm/year (p < 0.01), but this increase was not substantial enough to result in a decline in the water yield, since precipitation also increased. The annual water demand depth demonstrated a statistically significant increasing trend (0.13 mm/year, p < 0.01), but this increase was not sufficient to cause a decrease in the WSDR, since the water yield also increased (0.94 mm/year). Land use had a significantly negative effect on the water yield and WSDR, but this negative effect was offset by the positive effects of climate variability. At the basin scale, there exists a surplus of water resources (WSDR > 0). Nevertheless, regions grappling with water resource deficits (WSDR < 0) have witnessed an increase from 18% in 1995 to 26% in 2019. This indicates that the primary water resource problem in the YRB is the uneven spatial distribution of water resources. Hence, implementing spatial management strategies at larger scales may be instrumental in mitigating water scarcity in the region. These findings can serve as a valuable reference for the management of water resources, as well as for basin planning and construction.

1. Introduction

Water provision services provide human beings with the water resources necessary for production and life. It is a crucial factor that restricts the sustainable development of socio-ecological systems [1,2]. Recently, global climate change and alterations in land use have become increasingly significant worldwide; these significant transformations have profound effects on water availability [3]. Simultaneously, due to population growth, and economic and social development, the human demand for water is also increasing [4]; these factors may lead to potential conflicts between the water supply and societal needs [5]. Water scarcity often stems from the unsustainable long-term utilization of water resources [6]. It depends on both the supply side and the demand side, but, policymakers often prefer to maximize the supply side to reduce conflicts [7]. Therefore, from the perspective of the supply side, assessing the spatial distribution and patterns of change in the water supply and demand relationship under the backdrop of climate and land-use changes is beneficial for alleviating conflicts in water resource supply and demand and optimizing water resource management.
Precipitation and potential evapotranspiration are recognized as crucial climatic factors that govern the terrestrial water yield by reflecting water and energy conditions [8,9]. Precipitation serves as the primary source of water, and the magnitude of precipitation events intricately influences the quantity of the water yield [7]. On the other hand, the potential evapotranspiration predominantly affects the water yield through water loss mechanisms [10]. Additionally, land use exerts a substantial impact on water resource availability through various processes such as transpiration, interception, and evaporation [3]. The expansion of artificial urban areas has resulted in increased surface runoff due to the reduced infiltration capacity [3]. However, the effect of natural landscape changes on the water yield remains a subject of debate. It is widely acknowledged that the transition from sparse vegetation to dense vegetation is associated with a decline in regional runoff due to heightened rates of evapotranspiration [11,12]. Nevertheless, some studies have indicated that vegetation with a high evapotranspiration capacity can enhance regional precipitation and subsequently increase the water yield [13]. These divergent findings highlight the need for further research to elucidate the impacts of climate and land-use change on water production [14,15,16].
Natural conditions impact the water supply by shaping the structure and functioning of ecosystems [17], while the demand side is influenced not only by natural conditions but also by socio-economic conditions [2]. Due to the inherent spatial heterogeneity within ecosystems and social systems, there can often be a lack of alignment between regions characterized by a high water demand and regions possessing a sufficient water supply capacity [18,19]. Recent research efforts have contributed to our understanding of the quantitative methods for analyzing the supply–demand relationship. For instance, Boithias et al. [6] assessed the spatial characteristics of the water supply–demand ratio in the Mediterranean basin under different global change scenarios and mitigation scenarios; Li et al. [20] used the common logarithm of the water supply–demand ratio to evaluate the water security level in Beijing–Tianjin–Hebei region; Xu et al. [21] investigated the state of water resources by measuring the difference between the supply and demand in the Ningxia region of China. While these studies aimed to analyze and comprehend the dynamics of water availability and utilization in specific geographical areas, the reasons for the observed changes were not thoroughly explored [19]. It is evident that climate change affects the availability of water, while land use not only affects the hydrological cycle, leading to variations in the water yield [22], but also impacts the overall magnitude and spatial distribution of the water demand [20,22]. There is still a lack of explicit understanding regarding how and to what extent climate and land-use change affect the water supply and demand relationship [22,23]. Therefore, as the climate and land use continue to undergo transformations, it remains imperative to further explore and comprehend the evolving patterns of the water supply and demand relationship. Meanwhile, understanding the individual and comprehensive effects of climate and land-use change on the water resource supply and demand relationship can provide theoretical basis for the integrated management and allocation of water resources in basins and the formulation of future land-use development planning.
In order to study the effects of climate and land-use change on the supply and demand relationship of water provision services in detail, we choose the Yellow River basin (YRB) as the research area [24]. The excessive exploitation of water resources has resulted is a severe water scarcity issue within the YRB [17,25]. In recent years, various ecological restoration measures in the region have been implemented [26], which will have a profound impact on the water supply. Concurrently, the rapid growth in the population and economy has led to a significant increase in the water demand across residential, agricultural, and industrial sectors [27]. These aforementioned changes are poised to exacerbate the water resource predicament in the YRB. Extensive scholarly research has been conducted to investigate the influence of climate and vegetation on the water yield within the YRB [28,29,30]. However, there is a notable scarcity of comprehensive studies that explore the ramifications of climate and land-use change on the intricate dynamics of the water supply–demand relationship. The preservation of ecological integrity and the pursuit of high-quality development within the YRB have gained significant national attention [31]. Therefore, obtaining a comprehensive understanding of the spatiotemporal fluctuations in the dynamics of the water supply and demand relationship, particularly in the context of climate and land-use change, assumes paramount importance for the sustainable governance of social-ecological systems.
The research objectives encompass the following aspects: (a) analyzing the spatiotemporal patterns of climate and land-use change within the YRB; (b) evaluating the spatiotemporal variations in the actual evapotranspiration, water yield, and the water supply and demand index (WSDR) across the YRB; and (c) quantifying the influences of climate and land-use change on the actual evapotranspiration, water yield, and WSDR within the YRB.

2. Materials and Methods

2.1. Study Area

The YRB is the birthplace of the Chinese nation, irrigating 15% of the country’s irrigation area and providing water to 12% of its population [32]. The YRB is geographically positioned between 95° E~119° E longitude and 32° N~42° N latitude, encompassing an extensive area of approximately 7.95 × 10⁵ km2. This study concentrated on the upper and middle regions above the Huayuankou (HYK) station (Figure 1). The middle and upper regions are further divided into seven secondary basins (D01~D07). The upstream region encompasses the secondary watersheds of D01~D03, whereas the middle region comprises the secondary watersheds of D04~D06 [33], and D07 is an isolated interior river basin [34]. The YRB is dominated by the Southeast Asian summer monsoon [35]. The mean annual precipitation exhibits a gradual increase from north to south, with precipitation during the period from May to October contributing significantly, constituting over 70% of the total annual precipitation [30]. The annual mean temperature exhibits a gradient, spanning from −14.5 °C in the western region to 15.6 °C in the eastern region. The peak temperatures are observed during July, while the lowest temperatures occur in January [33].
The YRB is a vital irrigated agricultural area and an important industrial belt in China [36]. The source region of the YRB is characterized by a sparse population and backward industrial development. In contrast, the middle reaches of the basin are economically developed but ecologically fragile, encompassing arid agricultural areas that heavily rely on irrigation [37]. Among all the water consumption within the YRB, agricultural water accounts for the largest proportion [38].

2.2. Data

2.2.1. Meteorological Data

The meteorological dataset used in this study was obtained from the National Earth System Science Data Center (http://www.geodata.cn/ accessed on 25 April 2023). Precipitation data were generated in China using the Delta spatial downscaling scheme, based on global 0.5° climate data released by CRU and global high-resolution climate data released by WorldClim. The potential evapotranspiration dataset was calculated using the Hargreaves method [39,40], and the calculation formula is as follows:
P E T = 0.0023 × S 0 × M a x T M i n T 0.5 × M e a n T + 17.8
where PET represents the potential evapotranspiration, S0 represents the extraterrestrial radiation, MaxT, MinT, and MeanT represents the maximum temperature, minimum temperature, and mean temperature, respectively.

2.2.2. Land-Use and Cover Data

The land-use dataset was derived from the land-cover maps developed by the European Space Agency in the context of climate change (https://esa-worldcover.org/en accessed on 15 November 2023). The original land-use dataset initially consisted of twenty-two distinct land-cover types, which were subsequently reclassified into seven land types: forest, shrubland, cropland, grassland, water, construction land, and others.

2.2.3. Soil Data and Plant Water Availability Data

Soil depth data were obtained from the Depth to Bedrock map of China, as published by Yan et al. in 2020 [41]. Plant Available Water Content (PAWC) information was sourced from a global PAWC raster dataset titled “SoilGrids250m 2017-03—Derived available soil water capacity (volumetric fraction) until wilting point”.

2.2.4. Socio-Economic Data and Water Resource Data

The data on the gross domestic product (GDP) density and population (POP) density were ac-quired from the Resource and Environment Science and Data Center (https://www.resdc.cn accessed on 28 April 2023) [42,43].
All datasets underwent resampling to achieve a resolution of 1 km.

2.3. Water Yield Model

In this study, we employed InVEST to simulate the regional water supply, utilizing input data encompassing land use, precipitation, the potential evapotranspiration, soil properties, plant water availability data, and various biophysical coefficients [44]. The model is built on the Budyko curve and the annual average precipitation [41]. The annual water yield for each pixel is determined as follows:
Y x = 1 A E T x P x P x
A E T x P x = 1 + P E T x P x 1 + P E T x P x ω x 1 / ω x
ω x = Z A W C x P x + 1.25
A W C x = M i n s o i l . d e p t h , r o o t . d e p t h P A W C
where Yx represents the water yield, Px represents precipitation, AETx represents the actual evapotranspiration, PETx represents the potential evapotranspiration, ωx represents an empirical parameter, and AWCx represents the volumetric plant available water content. Z is an empirical constant, which was determined by comparing the simulation results with the observed data.

2.4. Quantification of Water Demand

The water demand includes agricultural, industrial, and domestic water consumption [6], which were determined in this study as follows:
W d = W a g r + W d o m + W i n d
where Wagr represents agricultural consumption, Wdom represents domestic consumption, and Wind represents the industrial consumption. To determine the amount of water consumption by each sector, we obtained the industrial, agricultural, and domestic water consumption data for the secondary basins from the Yellow River Water Resources Bulletin (http://www.yrcc.gov.cn/ accessed on 11 May 2023). We assigned the basin statistics to the grid level in order to conduct a precise analysis of the spatial distribution of human water usage. Specifically, we employed a systematic approach for allocating water consumption within grids [20]. The industrial water usage was allocated based on the GDP density as the weighting factor, the agricultural water demand was distributed across the cropland, and the domestic water demand was assigned to grids using the population density as the weighting factor. By aggregating these allocations, we obtained a comprehensive spatial distribution of the total water consumption at the grid scale, encompassing the industrial, agricultural, and domestic sectors.

2.5. Quantification of Water Supply–Demand Relationship

The ratio between the water supply and demand has consistently served as a critical indicator for elucidating the extent of matching. Within this study, the logarithm of the water supply–demand ratio was employed as a means to visually and comparatively depict the spatial heterogeneity associated with the contradiction between the supply and demand. The water supply and demand index (WSDR) is defined as follows [20,42]:
W S D R = l g W s W d
where Ws is the water supply (water yield) for the pixel grid, and Wd is the water demand for the pixel grid. The supply–demand relationship is categorized into three grades based on the WSDR values: Grade I represents WSDR < 0, indicating a water deficit (unable to meet demand); Grade II represents 0 < WSDR < 0.4, indicating a surplus of water but unsustainability (able to meet demand unsustainably); and Grade III represents WSDR > 0.4, indicating sustainable water resources (able to meet demand sustainably).

2.6. The Precipitation Concentration Index (PCI)

In this research, we used the modified PCI to investigate the inconsistency in precipitation. The PCI [43] was calculated using the following formula:
P C I = 100 × i = 1 12 p i 2 / i = 1 12 p i 2
where pi is the precipitation amount in month i. PCI values below 10 signify a low level of precipitation concentration. In the range of 11 to 15, the PCI values indicate a moderate precipitation concentration. Within the span of 16 to 20, the PCI values signal an irregular precipitation distribution. Notably, the PCI values surpassing 20 suggest a strongly irregular precipitation distribution [45].

2.7. Design of Experiment

In order to evaluate the effects of climate (precipitation and reference evapotranspiration) and land-use change on water provision services, two simulation scenarios were designed. Firstly, the actual evapotranspiration, water yield, and WSDR were estimated by allowing land use and climatic variables to change dynamically from 1995 to 2019. These results reflect the combined effects resulting from the interplay between climate and land-use change (S1). Secondly, an experiment was designed to investigate the isolated impact of land use on the actual evapotranspiration, water yield, and WSDR by allowing only land use to change with time and fixing the climate variables at the 1995 level (S2). The impacts of climate changes were quantitatively described by analyzing the differences between the simulation results under S1 and S2.

3. Results

3.1. Climate and Land-Use Variations

The findings indicate a statistically significant upward trend (p < 0.01) in annual precipitation, exhibiting a rate of 3.38 mm/year (Figure 2a). The mean annual precipitation varied spatially, spanning a range from 109 mm in the northern region to 893 mm in the southern region (Figure 2c). Temporally, precipitation increased throughout the entire study region from 1995 to 2019 (Figure 2e). A statistically significant increase was observed in 42% of the study area, primarily concentrated in the secondary basins D01, D02, and D04. Illustrated by the spatial distribution of the PCI value (refer to Figure 2g), the precipitation concentration characteristics exhibit distinct regional features, with a noticeable upward trend observed from the southern to the northern regions. Within the YRB, the PCI values spanned from 13.53 to 21.88. Overall, the variation intensity was moderate or higher. Notably, the precipitation distribution in the D03 and D04 basins displayed the highest degree of irregularity.
The analysis revealed that the annual average potential evapotranspiration displayed a nonsignificant increasing trend (p = 0.29), exhibiting a rate of 0.52 mm/year and a CV of 0.02 (Figure 2b). The spatial distribution of the potential evapotranspiration exhibited a decreasing trend from 1284 mm in the eastern region to 140 mm in the western region (Figure 2d). Temporally, the potential evapotranspiration increased in 76.97% of the study area from 1995 to 2019 (Figure 2f). However, the increase was found to be statistically significant in only 10.89% of the study area, primarily located in the northwest corner of the YRB. The remaining 23% of the YRB area showed a nonsignificant decreasing trend in the potential evapotranspiration.
Figure 3a,b depict the spatial distribution of land use in 1995 and 2019, respectively. The YRB mainly comprises grassland, farmland, and forest land types, accounting for approximately 95% of its total area. Grassland is the predominant vegetation type in the upstream, and in the middle reaches, cropland and forest land types emerge as the predominant land types. Between 1995 and 2019, the spatial coverage of forest, grassland, water, and construction land increased by 4.72%, 1.71%, 12.12%, and 595.36%, respectively (Table 1). Conversely, the area of shrubland, cropland, and others decreased by 27.69%, 5.95%, and 2.96%, respectively, in the YRB. Notably, cropland exhibited the most significant changes in the area (Table 1), while construction land showed the most significant percentage change. The study period observed a significant land-use change, with 28.14% of the YRB experiencing transfers between land-use types from 1995 to 2019 (Figure 3c). However, the net transfer accounted for only approximately 3.85% of the basin. The primary net land-use type transfer patterns were cropland → grassland (28.2%), others → grassland (24.63%), grassland → construction land (16.39%), cropland → construction land (15.06%), and grassland → forest (9.58%) (Figure 3d).

3.2. Actual Evapotranspiration and Water Yield Variations

The mean annual actual evapotranspiration was found to be 404.87 mm. The actual evapotranspiration exhibited a substantial and statistically significant increasing trend (p < 0.01) over the period from 1995 to 2019, with a rate of 2.45 mm/year, as illustrated in Figure 4a. Spatially, there was substantial variation in the actual evapotranspiration, and a discernible declining trend is observed in the spatial gradient from the southeast to the northwest, as depicted in Figure 4c. Temporally, a positive trend in the actual evapotranspiration was observed over 97% of the basin, as demonstrated in Figure 4e. The increase was statistically significant (p < 0.05) in 50.83% of the region.
The mean annual water yield was calculated to be 60.89 mm. From 1995 to 2019, the annual water yield depth displayed a statistically significant increasing trend (p < 0.05), characterized by a slope of 0.94 mm/year, as depicted in Figure 4b. Spatially, the water yield decreased from 648 mm in the southern region to 0 mm in the northern part, as illustrated in Figure 4d. Temporally, the water yield increased in 85.13% of the study area, as shown in Figure 4f. The increase was statistically significant in 21.08% of the area. Furthermore, no significant reduction was observed in the YRB.
The statistical results of the water yield and actual evapotranspiration across different land-use types (Figure 5a) indicate that the evapotranspiration capacity of forests is the strongest, with an average annual evapotranspiration of nearly 600 mm. Conversely, shrubland and other land-use types exhibit the weakest evapotranspiration capacity, at around 200 mm. Furthermore, grassland, cropland, and construction land all have similar average evapotranspiration values of approximately 400 mm. In terms of the water-yielding capacity, construction land demonstrates the highest capacity, followed by cropland and grassland, while forests and shrubland have comparatively weaker water-yielding capacities. In addition, we also calculated the changes in the water yield for the main land-use transformation under the S2 scenario. The results indicate that the top five transformation types with the highest proportion all led to a reduction in the yield (Figure 5b).

3.3. Water Demand and WSDR Variations

The mean annual water demand depth was 23.68 mm. Over the period of 1995 to 2019, the annual total water demand depth displayed a statistically significant upward trend (p < 0.01), characterized by an annual growth rate of 0.134 mm/year, as shown in Figure 6a. The agricultural water demand, accounting for the largest proportion (80~90%), showed an insignificant increasing trend (slope = 0.001 mm/year). The industrial water demand, accounting for approximately 7~12%, manifested a statistically significant upward trend (p < 0.01), denoted by a slope of 0.069 mm/year. The domestic water demand, accounting for approximately 3~10%, also exhibited a statistically significant upward trend (p < 0.01), characterized by a slope of 0.064 mm/year. In terms of the relative change, the domestic water demand showed the most significant percentage change, with a 294% increase, as presented in Figure 6b. The industrial water consumption demonstrated a less pronounced relative change (82%), while the agricultural water demand remained relatively stable. Spatially, the water demand exhibited a significant variation, ranging from 0 mm to 919 mm, with the water demand intensity of the secondary basins D03 and D05 being relatively high, as shown in Figure 6c. Temporally, the water demand increased in 76.76% of the regions, with the increase being statistically significant in 67.18% of the study area, as depicted in Figure 6d. The decrease was observed to be statistically significant in 12.5% of the study area, primarily distributed in the secondary basin D02.
From 1995 to 2019, the WSDR results for the basin scale ranged from 0.25 to 0.57, all of which were above grade II. The WSDR showed an insignificant increasing trend (p = 0.15) with a slope of 0.0042/year and a coefficient of variation of 0.25 (Figure 7a). The grade changed from II to III from 1995 to 2019, indicating a gradual improvement in the supply–demand relationship in the YRB. Spatially, the water resource deficit area (grade I) was primarily located in the secondary basins D03, D05, and D06 in 1995 (Figure 8a) and in the secondary basins D03, D04, and D06 in 2019 (Figure 8b). Temporally, the WSDR increased in 39.83% of the region (Figure 7b), with statistically significant increases found in 17.17% of the area, mainly distributed in the secondary basin D02. The area of grade III decreased from 72% in 1995 to 57% in 2019, while the area of grade I increased from 18% in 1995 to 26% in 2019. This indicates that the areas with sustainable water resources decreased, while the areas with water resource deficits increased. Significant changes in the WSDR grades were observed during the study period (Figure 8c). The grade transfers occurred in 43.27% of the YRB from 1995 to 2019, primarily in the eastern region. WSDR upgrades were observed in the southeast, while downgrades were observed in the northeast. Only three net grade transfer patterns were identified: grade III → grade I showed the largest area (75,773 km2), followed by grade III → grade II (44,522 km2), while grade I → grade II showed the smallest area (7788 km2).

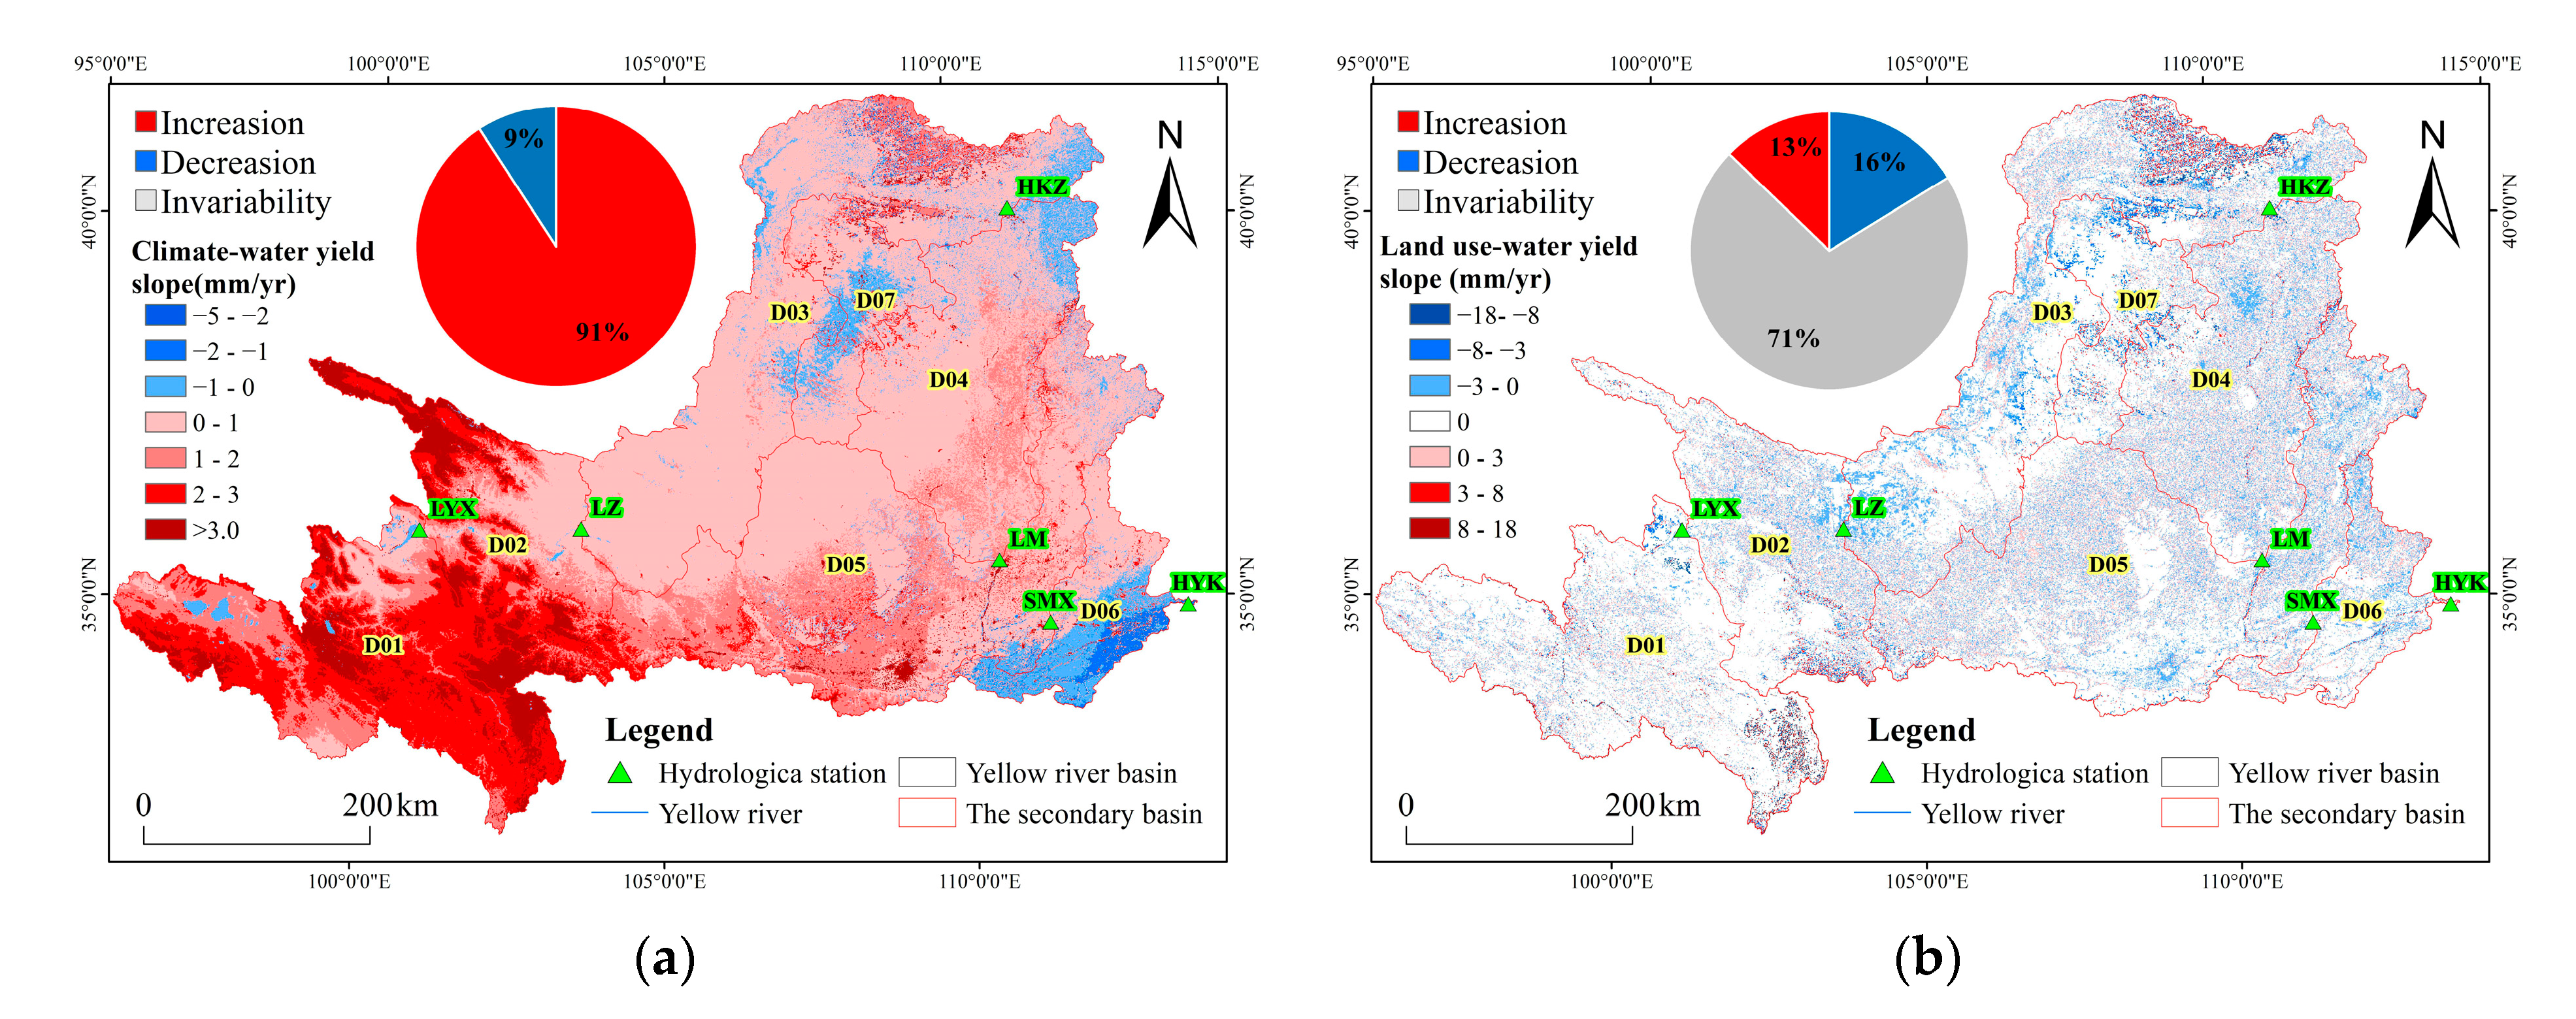
3.4. Climate and Land-Use Effects on Actual Evapotranspiration and Water Yield

Between 1995 and 2019, there was a significant positive trend in the actual evapotranspiration, with an increase of 2.38 mm/year (p < 0.01), primarily attributed to climate changes. Notably, land use exerted a discernible influence on the actual evapotranspiration, contributing to an additional growth rate of 0.07 mm/year (p < 0.01) (Table 2). Consequently, when considering the combined effects of climate and land-use change, the actual evapotranspiration followed a gradual upward trajectory, exhibiting an overall increase rate of 2.45 mm/year (p < 0.01). Regarding the spatial distribution, the actual evapotranspiration displayed an ascending trend in 98% of the total area, driven by climate changes (Figure 9a), with the variation rate diminishing from the southeast to northwest. The positive impact of land use on the actual evapotranspiration was evident in 14% of the YRB (Figure 9b), while a negative impact was observed in 11% of the YRB.
From 1995 to 2019, the water yield exhibited a significant positive trend of 0.99 mm/year (p < 0.01) due to climate changes. However, land use had a significant negative impact on the water yield, with a rate of −0.05 mm/year (p < 0.05) (Table 2). Nevertheless, the effects of climate variability offset the negative effects of land use and resulted in a significant increase in the water yield, with a rate of 0.94 mm/year (p < 0.05). Regarding the spatial distribution, water yield showed an increasing trend in 91% of the total area due to climate changes (Figure 10a), with the variation rate decreasing from the southwest to northeast. Moreover, the impact of land use on the water yield was negative in 16% of the YRB (Figure 10b), whereas an increasing trend of the water yield (p < 0.05) due to land use was observed in 13% of the YRB. The remaining areas were not significantly affected by land use.

3.5. Climate and Land-Use Effects on WSDR

The WSDR exhibited a significant positive trend of 0.007 mm/year (p < 0.01) from 1995 to 2019 due to climate changes (Table 2). However, land use had a significant negative effect on the WSDR, with a rate of −0.003 mm/year (p < 0.05). The negative effects of land use on the WSDR were partially offset by the effects of climate variability, resulting in an insignificant increase in the WSDR, with a rate of 0.004 mm/year (p = 0.15). Spatially, an increasing trend of the WSDR was observed over 95% of the basin due to climate changes, with the most significant WSDR increase observed in the secondary basin D04 (Figure 11a). However, a decreasing trend of the WSDR due to climate change was observed in 5% of the YRB. The variation of land use exerted a negative effect on the WSDR in 76% of the YRB (Figure 11b), which was primarily distributed in the central and eastern areas. Conversely, an increasing trend of the WSDR due to land use was observed in 24% of the YRB.

4. Discussion

4.1. Climate and Land-Use Effects on Actual Evapotranspiration and Water Yield

The study’s results indicate that both climate and land-use change exerted a noticeable positive influence on the actual evapotranspiration. For land use, The Grain for Green Project is believed to have played a crucial role in driving the increase trend [46], as previous studies have indicated that the conversion of croplands to forests leads to augmented evapotranspiration rates [30,47,48]. However, it is worth noting that climate change had a more significant impact on the actual evapotranspiration variation compared to land use. This outcome can be attributed to two main factors. Firstly, although significant changes in land use occurred, the net transfer area only accounted for 3.85% of the study region. Secondly, prior studies have demonstrated that water availability significantly affects the actual evapotranspiration in the semi-arid and arid regions of China [10,49]. Given that the study area is situated in a water-limited region, climate variations likely exert a substantial influence on the actual evapotranspiration. This finding aligns with Li et al.’s [50] research, which examined the separate influences of climate and land use on the evapotranspiration in China between 2001 and 2013. Their research concluded that climate change exerted a more pronounced influence on the evapotranspiration compared to land use.
Under the influence of climate change, the research findings disclose a notable and statistically significant increase in the water yield; conversely, land use exhibited an adverse impact on the water yield. The impact of land use on the water yield is manifested in two opposing aspects. Firstly, the expansion of impervious surfaces resulting from urbanization exerts a discernible positive impact on the water yield [3,7]. In contrast, the conversion of croplands to forests as part of the Grain for Green Project exhibits a detrimental effect on the water yield, which is attributable to an associated increase in the actual evapotranspiration. Within this study, land-use change showcased an unfavorable impact on the water yield at the watershed scale. However, the influence of climate variability counterbalanced the negative repercussions of land use, resulting in a substantial increase in the water yield during the period from 1995 to 2019. Other studies have yielded corroborating results, further substantiating these findings. For example, Zhang et al. [51] provided evidence that within the Yangtze River Basin, the amplification of precipitation overshadowed the negative effects of vegetation. Furthermore, according to Zhang et al. [46], a significant portion of the Loess Plateau has witnessed a substantial and consistent increase in the surface water yield since the initiation of large-scale vegetation restoration efforts. This can be primarily attributed to the augmented regional precipitation, which outweighs the additional evapotranspiration resulting from revegetation. Feng et al. [52] discovered that climate variability either masked or intensified the water yield response to vegetation restoration across the Loess Plateau area, with 37% of the study area experiencing a decrease in the water yield and 35% of the study area observing an increase. To obtain more in-depth results, future research should incorporate zoning strategies.
Both small watershed experiments and continental-scale modeling studies have demonstrated that the hydrologic response to climate and vegetation varies according to background climate, basin size, and the magnitude of disturbances [8,46,52]. In particular, the hydrological responses in large basins are comparatively lower, attributed to the presence of intricate landforms, enhanced buffering capacities, and prolonged residence times [8]. Despite the challenges involved in studying the hydrological response of large-scale watersheds, doing so has significant practical implications, given that policy decisions are typically made at the large basin or regional scale.

4.2. Climate and Land-Use Effects on WSDR

The water demand was primarily concentrated along the river below the Longyangxia hydrological station, which has a high development intensity, as confirmed by a previous study [21]. The water demand has been further exacerbated by the acceleration of urbanization and industrialization processes [27], resulting in a 300% increase in the water demand for domestic purposes and a 100% increase for industrial purposes. Despite a decrease in cropland area, there has been no significant change in agricultural water consumption, which can be attributed to the growing food demand driven by population growth [53]. In order to meet this demand and ensure an adequate food supply, irrigation has had to be increased.
Land use exhibited a notable adverse impact on the WSDR. This effect can be primarily attributed to the Grain for Green Project and urbanization. Firstly, the process of afforestation was discovered to enhance the actual evapotranspiration, leading to a reduction in the water yield and posing a threat to water supply–demand security [27]. Furthermore, the process of urbanization has resulted in a surge in the water demand, primarily driven by the escalating population and rapid industrial advancements. Although urbanization has concurrently facilitated an augmented capacity for the water yield by introducing impermeable surfaces, it has been inadequate in meeting the escalating water demand stemming from socioeconomic progress [3,19]; consequently, this insufficiency has resulted in a negative effect on the WSDR. Interestingly, the negative impacts of land use on the WSDR were offset by the effects of climate variability, resulting in an overall increasing trend of the WSDR under the combined effects of climate and land-use change. Spatially, the variation in land use exerted a negative effect on the WSDR in the central and eastern areas where intense human activity has been implemented [54]. In contrast, the increasing trend of the WSDR due to land use was observed in the source region of the YRB, where anthropogenic disturbances are absent [37].
Between 1995 and 2019, the water supply–demand relationship on the basin scale gradually improved due to climate change. However, spatially, water resource deficit areas increased during this period, with a decrease in the WSDR grade in 29% of the YRB. This could be attributed to significant variations in land use resulting from urbanization and the Grain for Green Project. These alterations not only affect the spatial and temporal patterns and accessibility of water resources [55], but also influence the spatial and temporal distribution of the water demand, exacerbating the issue of the water supply–demand mismatch in specific regions [19]. In summary, the primary water resource challenge in the YRB is the uneven spatial distribution of water resources. While water scarcity is a localized issue, meeting water demands at larger spatial scales is feasible, as reported in similar studies on the Mediterranean basin [6]. Therefore, implementing spatial management strategies at broader scales holds the potential to alleviate water scarcity within the YRB.

5. Conclusions

This study analyzed the impacts of climate and land-use change on the supply and demand relationship of water provision services in the YRB between 1995 and 2019. The results showed that land use exerted a substantial adverse influence on the water yield and the WSDR. Nevertheless, the positive effects of climate variability offset these negative effects, leading to a significant overall increase in the water yield and WSDR. At the basin scale, there exists a surplus of water resources (WSDR > 0). Nevertheless, regions grappling with water resource deficits (WSDR < 0) have witnessed an increase from 1995 to 2019. This indicates that the primary water resource problem in the YRB is produced by the uneven spatial distribution of water resources. Therefore, implementing spatial management strategies at broader scales holds the potential to alleviate water scarcity within the YRB. These insights can inform sustainable water resource management and basin planning in the region. However, this study has certain limitations. For example, the quantification of the water demand is simplistic, since, in this study, it was considered only as an input, and the underlying factors driving its changes were not explored. In the future, there is a need to actively develop a water demand model that incorporates factors influencing the water demand. This approach would allow for a more comprehensive analysis of the mechanisms behind changes in the supply and demand relationship.

Author Contributions

Conceptualization, Y.L. and F.G.; methodology, C.Z.; validation, C.Z.; formal analysis, F.G.; data curation, F.G.; writing—original draft, F.G.; writing—review and editing, F.G.; supervision, Y.L.; project administration, Y.L.; funding acquisition, Y.L. All authors have read and agreed to the published version of the manuscript.

Funding

This study was supported by the Strategic Priority Research Program of the Chinese Academy of Sciences, Pan-Third Pole Environment Study for a Green Silk Road (grant number XDA20060301).

Data Availability Statement

The data presented in this study are available upon request from the first author. The data are not publicly available due to the research not being fully completed.

Conflicts of Interest

The authors declare no conflict of interest.

References

  1. Costanza, R.; de Groot, R.; Braat, L.; Kubiszewski, I.; Fioramonti, L.; Sutton, P.; Farber, S.; Grasso, M. Twenty years of ecosystem services: How far have we come and how far do we still need to go? Ecosyst. Serv. 2017, 28, 1–16. [Google Scholar] [CrossRef]
  2. Wang, J.; Zhai, T.; Lin, Y.; Kong, X.; He, T. Spatial imbalance and changes in supply and demand of ecosystem services in China. Sci. Total Environ. 2019, 657, 781–791. [Google Scholar] [CrossRef]
  3. Chen, D.; Li, J.; Yang, X.; Zhou, Z.; Pan, Y.; Li, M. Quantifying water provision service supply, demand and spatial flow for land use optimization: A case study in the YanHe watershed. Ecosyst. Serv. 2020, 43, 101117. [Google Scholar] [CrossRef]
  4. Xiang, H.; Zhang, J.; Mao, D.; Wang, Z.; Qiu, Z.; Yan, H. Identifying spatial similarities and mismatches between supply and demand of ecosystem services for sustainable Northeast China. Ecol. Indic. 2022, 134, 108501. [Google Scholar] [CrossRef]
  5. Tao, Y.; Tao, Q.; Sun, X.; Qiu, J.; Pueppke, S.G.; Ou, W.; Guo, J.; Qi, J. Mapping ecosystem service supply and demand dynamics under rapid urban expansion: A case study in the Yangtze River Delta of China. Ecosyst. Serv. 2022, 56, 101448. [Google Scholar] [CrossRef]
  6. Boithias, L.; Acuna, V.; Vergonos, L.; Ziv, G.; Marce, R.; Sabater, S. Assessment of the water supply:demand ratios in a Mediterranean basin under different global change scenarios and mitigation alternatives. Sci. Total Environ. 2014, 470, 567–577. [Google Scholar] [CrossRef]
  7. Chen, J.; Jiang, B.; Bai, Y.; Xu, X.; Alatalo, J.M. Quantifying ecosystem services supply and demand shortfalls and mismatches for management optimisation. Sci. Total Environ. 2019, 650, 1426–1439. [Google Scholar] [CrossRef]
  8. Zhou, G.; Wei, X.; Chen, X.; Zhou, P.; Liu, X.; Xiao, Y.; Sun, G.; Scott, D.F.; Zhou, S.; Han, L.; et al. Global pattern for the effect of climate and land cover on water yield. Nat. Commun. 2015, 6, 5918. [Google Scholar] [CrossRef]
  9. Ma, S.; Wang, L.-J.; Jiang, J.; Chu, L.; Zhang, J.-C. Threshold effect of ecosystem services in response to climate change and vegetation coverage change in the Qinghai-Tibet Plateau ecological shelter. J. Clean. Prod. 2021, 318, 128592. [Google Scholar] [CrossRef]
  10. Liu, Y.; Zhou, Y.; Ju, W.; Chen, J.; Wang, S.; He, H.; Wang, H.; Guan, D.; Zhao, F.; Li, Y.; et al. Evapotranspiration and water yield over China’s landmass from 2000 to 2010. Hydrol. Earth Syst. Sci. 2013, 17, 4957–4980. [Google Scholar] [CrossRef]
  11. Sheil, D. Forests, atmospheric water and an uncertain future: The new biology of the global water cycle. For. Ecosyst. 2018, 5, 19. [Google Scholar] [CrossRef]
  12. Wang, Q.; Cheng, L.; Zhang, L.; Liu, P.; Qin, S.; Liu, L.; Jing, Z. Quantifying the impacts of land-cover changes on global evapotranspiration based on the continuous remote sensing observations during 1982–2016. J. Hydrol. 2021, 598, 126231. [Google Scholar] [CrossRef]
  13. Teo, H.C.; Raghavan, S.V.; He, X.; Zeng, Z.; Cheng, Y.; Luo, X.; Lechner, A.M.; Ashfold, M.J.; Lamba, A.; Sreekar, R.; et al. Large-scale reforestation can increase water yield and reduce drought risk for water-insecure regions in the Asia-Pacific. Glob. Change Biol. 2022, 28, 6385–6403. [Google Scholar] [CrossRef]
  14. Xu, X.; Yang, D.; Sivapalan, M. Assessing the impact of climate variability on catchment water balance and vegetation cover. Hydrol. Earth Syst. Sci. 2012, 16, 43–58. [Google Scholar] [CrossRef]
  15. Zhao, M.; Geruo, A.; Zhang, J.; Velicogna, I.; Liang, C.; Li, Z. Ecological restoration impact on total terrestrial water storage. Nat. Sustain. 2021, 4, 56–62. [Google Scholar] [CrossRef]
  16. Xue, B.; Yinglan, A.; Wang, G.; Helman, D.; Sun, G.; Tao, S.; Liu, T.; Yan, D.; Zhao, T.; Zhang, H.; et al. Divergent Hydrological Responses to Forest Expansion in Dry and Wet Basins of China: Implications for Future Afforestation Planning. Water Resour. Res. 2022, 58, e2021WR031856. [Google Scholar] [CrossRef]
  17. Geng, W.; Li, Y.; Zhang, P.; Yang, D.; Jing, W.; Rong, T. Analyzing spatio-temporal changes and trade-offs/synergies among ecosystem services in the Yellow River Basin, China. Ecol. Indic. 2022, 138, 108825. [Google Scholar] [CrossRef]
  18. Zhang, L.; Peng, J.; Liu, Y.; Wu, J. Coupling ecosystem services supply and human ecological demand to identify landscape ecological security pattern: A case study in Beijing-Tianjin-Hebei region, China. Urban Ecosyst. 2017, 20, 701–714. [Google Scholar] [CrossRef]
  19. Deng, C.; Zhu, D.; Nie, X.; Liu, C.; Zhang, G.; Liu, Y.; Li, Z.; Wang, S.; Ma, Y. Precipitation and urban expansion caused jointly the spatiotemporal dislocation between supply and demand of water provision service. J. Environ. Manag. 2021, 299, 113660. [Google Scholar] [CrossRef]
  20. Li, D.; Wu, S.; Liu, L.; Liang, Z.; Li, S. Evaluating regional water security through a freshwater ecosystem service flow model: A case study in Beijing-Tianjian-Hebei region, China. Ecol. Indic. 2017, 81, 159–170. [Google Scholar] [CrossRef]
  21. Xu, J.; Xiao, Y.; Xie, G.; Liu, J.; Qin, K.; Wang, Y.; Zhang, C.; Lei, G. How to coordinate cross-regional water resource relationship by integrating water supply services flow and interregional ecological compensation. Ecol. Indic. 2021, 126, 107595. [Google Scholar] [CrossRef]
  22. Liu, X.; Liu, Y.; Wang, Y.; Liu, Z. Evaluating potential impacts of land use changes on water supply-demand under multiple development scenarios in dryland region. J. Hydrol. 2022, 610, 127811. [Google Scholar] [CrossRef]
  23. Fu, B.; Wu, X.; Wang, Z.; Wu, X.; Wang, S. Coupling human and natural systems for sustainability: Experience from China’s Loess Plateau. Earth Syst. Dyn. 2022, 13, 795–808. [Google Scholar] [CrossRef]
  24. Fu, G.B.; Chen, S.L.; Liu, C.M.; Shepard, D. Hydro-climatic trends of the Yellow River basin for the last 50 years. Clim. Chang. 2004, 65, 149–178. [Google Scholar] [CrossRef]
  25. Guo, S.; Wu, C.; Wang, Y.; Qiu, G.; Zhu, D.; Niu, Q.; Qin, L. Threshold effect of ecosystem services in response to climate change, human activity and landscape pattern in the upper and middle Yellow River of China. Ecol. Indic. 2022, 136, 108603. [Google Scholar] [CrossRef]
  26. Yin, L.; Feng, X.; Fu, B.; Wang, S.; Wang, X.; Chen, Y.; Tao, F.; Hu, J. A coupled human-natural system analysis of water yield in the Yellow River basin, China. Sci. Total Environ. 2021, 762, 143141. [Google Scholar] [CrossRef]
  27. Feng, X.; Fu, B.; Piao, S.; Wang, S.; Ciais, P.; Zeng, Z.; Lu, Y.; Zeng, Y.; Li, Y.; Jiang, X.; et al. Revegetation in China’s Loess Plateau is approaching sustainable water resource limits. Nat. Clim. Chang. 2016, 6, 1019–1022. [Google Scholar] [CrossRef]
  28. Li, R.-l.; Shu, G. Impacts of Climate Change on Agriculture and Adaptive Strategies in China. J. Integr. Agric. 2013, 12, 1402–1408. [Google Scholar] [CrossRef]
  29. Liang, W.; Bai, D.; Wang, F.; Fu, B.; Yan, J.; Wang, S.; Yang, Y.; Long, D.; Feng, M. Quantifying the impacts of climate change and ecological restoration on streamflow changes based on a Budyko hydrological model in China’s Loess Plateau. Water Resour. Res. 2015, 51, 6500–6519. [Google Scholar] [CrossRef]
  30. Bao, Z.; Zhang, J.; Wang, G.; Chen, Q.; Guan, T.; Yan, X.; Liu, C.; Liu, J.; Wang, J. The impact of climate variability and land use/cover change on the water balance in the Middle Yellow River Basin, China. J. Hydrol. 2019, 577, 123942. [Google Scholar] [CrossRef]
  31. Lu, D.; Sun, D. Development and management tasks of the Yellow River Basin:A preliminary understanding and suggestion. Acta Geogr. Sin. 2019, 74, 2431–2436. [Google Scholar]
  32. China Water Resources Bulletin; Ministry of Water Resources: Beijing, China, 2015.
  33. Chang, J.; Wei, J.; Wang, Y.; Yuan, M.; Guo, J. Precipitation and runoff variations in the Yellow River Basin of China. J. Hydroinform. 2017, 19, 138–155. [Google Scholar] [CrossRef]
  34. Yan, Z.; Zhou, Z.; Liu, J.; Wang, H.; Li, D. Water use characteristics and impact factors in the Yellow River basin, China. Water Int. 2020, 45, 148–168. [Google Scholar] [CrossRef]
  35. Wang, S.; Fu, B.; Liang, W.; Liu, Y.; Wang, Y. Driving forces of changes in the water and sediment relationship in the Yellow River. Sci. Total Environ. 2017, 576, 453–461. [Google Scholar] [CrossRef]
  36. Zhang, N.; Su, X.; Zhou, Y.; Niu, J. Water resources carrying capacity evaluation of the Yellow River Basin based on EFAST weight algorithm. J. Nat. Resour. 2019, 34, 1759–1770. [Google Scholar] [CrossRef]
  37. Singh, D.K.; Xu, M.; Singh, N.; Lei, F. Perspectives on emerging pressures and their integrated impact on large river systems: An insight from the Yellow River basin. J. Environ. Manag. 2021, 298, 113423. [Google Scholar] [CrossRef]
  38. Lu, C.; Ji, W.; Hou, M.; Ma, T.; Mao, J. Evaluation of efficiency and resilience of agricultural water resources system in the Yellow River Basin, China. Agric. Water Manag. 2022, 266, 107605. [Google Scholar] [CrossRef]
  39. Peng, S.; Ding, Y.; Wen, Z.; Chen, Y.; Cao, Y.; Ren, J. Spatiotemporal change and trend analysis of potential evapotranspiration over the Loess Plateau of China during 2011–2100. Agric. For. Meteorol. 2017, 233, 183–194. [Google Scholar] [CrossRef]
  40. Peng, S.; Ding, Y.; Liu, W.; Li, Z. 1 km monthly temperature and precipitation dataset for China from 1901 to 2017. Earth Syst. Sci. Data 2019, 11, 1931–1946. [Google Scholar] [CrossRef]
  41. Yang, D.; Liu, W.; Tang, L.; Chen, L.; Li, X.; Xu, X. Estimation of water provision service for monsoon catchments of South China: Applicability of the InVEST model. Landsc. Urban Plan. 2019, 182, 133–143. [Google Scholar] [CrossRef]
  42. Deng, C.-x.; Zhu, D.-m.; Liu, Y.-j.; Li, Z.-w. Spatial matching and flow in supply and demand of water provision services: A case study in Xiangjiang River Basin. J. Mt. Sci. 2022, 19, 228–240. [Google Scholar] [CrossRef]
  43. Oliver, J.E. Monthly Precipitation Distribution—A Comparative Index. Prof. Geogr. 1980, 32, 300–309. [Google Scholar] [CrossRef]
  44. Sharp, R.; Tallis, H.T.; Ricketts, T. InVEST 3.7.0 User’s Guide; The Natural Capital Project; Stanford University: Stanford, CA, USA; University of Minnesota: Stanford, CA, USA; The Nature Conservancy: Stanford, CA, USA; World Wildlife Fund: Stanford, CA, USA, 2020. [Google Scholar]
  45. Lu, Y.; Jiang, S.; Ren, L.; Zhang, L.; Wang, M.; Liu, R.; Wei, L. Spatial and Temporal Variability in Precipitation Concentration over Mainland China, 1961–2017. Water 2019, 11, 881. [Google Scholar] [CrossRef]
  46. Zhang, B.; Tian, L.; Yang, Y.; He, X. Revegetation does not decrease water yield in the Loess Plateau of China. Geophys. Res. Lett. 2022, 49, e2022GL098025. [Google Scholar] [CrossRef]
  47. Yu, P.; Krysanova, V.; Wang, Y.; Xiong, W.; Mo, F.; Shi, Z.; Liu, H.; Vetter, T.; Huang, S. Quantitative estimate of water yield reduction caused by forestation in a water-limited area in northwest China. Geophys. Res. Lett. 2009, 36, L02406. [Google Scholar] [CrossRef]
  48. Teuling, A.J.; de Badts, E.A.G.; Jansen, F.A.; Fuchs, R.; Buitink, J.; van Dijke, A.J.H.; Sterling, S.M. Climate change, reforestation/afforestation, and urbanization impacts on evapotranspiration and streamflow in Europe. Hydrol. Earth Syst. Sci. 2019, 23, 3631–3652. [Google Scholar] [CrossRef]
  49. Wang, K.; Dickinson, R.E.; Wild, M.; Liang, S. Evidence for decadal variation in global terrestrial evapotranspiration between 1982 and 2002: 1. Model development. J. Geophys. Res. Atmos. 2010, 115, D20112. [Google Scholar] [CrossRef]
  50. Li, G.; Zhang, F.; Jing, Y.; Liu, Y.; Sun, G. Response of evapotranspiration to changes in land use and land cover and climate in China during 2001–2013. Sci. Total Environ. 2017, 596, 256–265. [Google Scholar] [CrossRef]
  51. Zhang, J.; Zhang, Y.; Sun, G.; Song, C.; Li, J.; Hao, L.; Liu, N. Climate Variability Masked Greening Effects on Water Yield in the Yangtze River Basin During 2001–2018. Water Resour. Res. 2022, 58, e2021WR030382. [Google Scholar] [CrossRef]
  52. Feng, X.M.; Sun, G.; Fu, B.J.; Su, C.H.; Liu, Y.; Lamparski, H. Regional effects of vegetation restoration on water yield across the Loess Plateau, China. Hydrol. Earth Syst. Sci. 2012, 16, 2617–2628. [Google Scholar] [CrossRef]
  53. Peng, S.; Zheng, X.; Wang, Y.; Jiang, G. Study on water-energy-food collaborative optimization for Yellow River basin. Adv. Water Sci. 2017, 28, 681–690. [Google Scholar]
  54. Jiang, W.; Yuan, L.; Wang, W.; Cao, R.; Zhang, Y.; Shen, W. Spatio-temporal analysis of vegetation variation in the Yellow River Basin. Ecol. Indic. 2015, 51, 117–126. [Google Scholar] [CrossRef]
  55. Wang, Q.; Xu, Y.; Xu, Y.; Wu, L.; Wang, Y.; Han, L. Spatial hydrological responses to land use and land cover changes in a typical catchment of the Yangtze River Delta region. Catena 2018, 170, 305–315. [Google Scholar] [CrossRef]
Figure 1. The location of study area (LYX: Longyangxia; LZ: Lanzhou; HKZ: Hekouzhen; SMX: Sanmenxia; HYK: Huayuankou).
Land 12 02089 g001
Figure 2. The temporal variation in precipitation (a) and potential evapotranspiration (b); the spatial distribution of precipitation (c) and potential evapotranspiration (d); the spatial variation of precipitation (e) and potential evapotranspiration (f); the spatial distribution of PCI (g).
Land 12 02089 g002aLand 12 02089 g002b
Figure 3. The spatial distribution of land use in 1995 (a) and 2019 (b); the spatial distribution of land-use transformation from 1995 to 2019 (c); the net transfer area of land use from 1995 to 2019 (d); Note: FL: forest, SL: shrubland, CL: cropland, GL: grassland, WL: water, CSL: construction land, and OL: others.
Land 12 02089 g003
Figure 4. The temporal dynamics of actual evapotranspiration (a) and water yield (b); the spatial distribution of actual evapotranspiration (c) and water yield (d); the spatial variability of actual evapotranspiration (e) and water yield (f).
Land 12 02089 g004
Figure 5. The evapotranspiration and water yield of each land-use type (a); changes of water yield in major land-use transformation (b).
Land 12 02089 g005
Figure 6. The temporal absolute variation (a) and relative variation (b) of water demand; the spatial distribution of water demand (c); the spatial variation of water demand from 1995 to 2019 (d).
Land 12 02089 g006
Figure 7. The temporal variation (a) and spatial variation (b) in WSDR.
Land 12 02089 g007
Figure 8. The spatial distribution of WSDR in 1995 (a) and 2019 (b); the WSDR grade transfer from 1995 to 2019 (c); the net change area of WSDR grade (d).
Land 12 02089 g008
Figure 9. The spatial distribution of climate change effects on actual evapotranspiration (a); the spatial distribution of land-use change effects on actual evapotranspiration (b).
Land 12 02089 g009
Figure 10. The spatial distribution of climate change effects on water yield (a); the spatial distribution of land-use change effects on water yield (b).
Land 12 02089 g010
Figure 11. The spatial distribution of climate change effects on WSDR (a); the spatial distribution of land-use change effects on WSDR (b).
Land 12 02089 g011
Table 1. Changes in land-use area.
LAND USEArea in 1995 (km2)Area in 2019 (km2)Absolute Variation (km2)Relative Variation (%)
Forest69,57372,85932864.72%
Shrubland903653−250−27.69%
Grassland445,250452,88376331.71%
Water3457387641912.12%
Cropland217,203204,276−12,927−5.95%
Construction land163911,3979758595.36%
Others33,05725,138−7919−23.96%
Table 2. The effects of land use and climate on actual evapotranspiration, water yield, and WSDR.
EffectsActual Evapotranspiration
Change Rate
Water Yield
Change Rate
WSDR
Change Rate
mm/yearpmm/yearpmm/yearp
Combined2.45<0.010.94<0.050.0040.15
Climate2.38<0.010.99<0.010.007<0.01
Land use0.07<0.01−0.05<0.05−0.003<0.05
Disclaimer/Publisher’s Note: The statements, opinions and data contained in all publications are solely those of the individual author(s) and contributor(s) and not of MDPI and/or the editor(s). MDPI and/or the editor(s) disclaim responsibility for any injury to people or property resulting from any ideas, methods, instructions or products referred to in the content.

