
Housing and Food Production: Resident and Grower Perceptions of Peri-Urban Food-Production Landscapes
_Chen.jpg)

Abstract
:1. Introduction
2. Methods
2.1. Survey of Residents
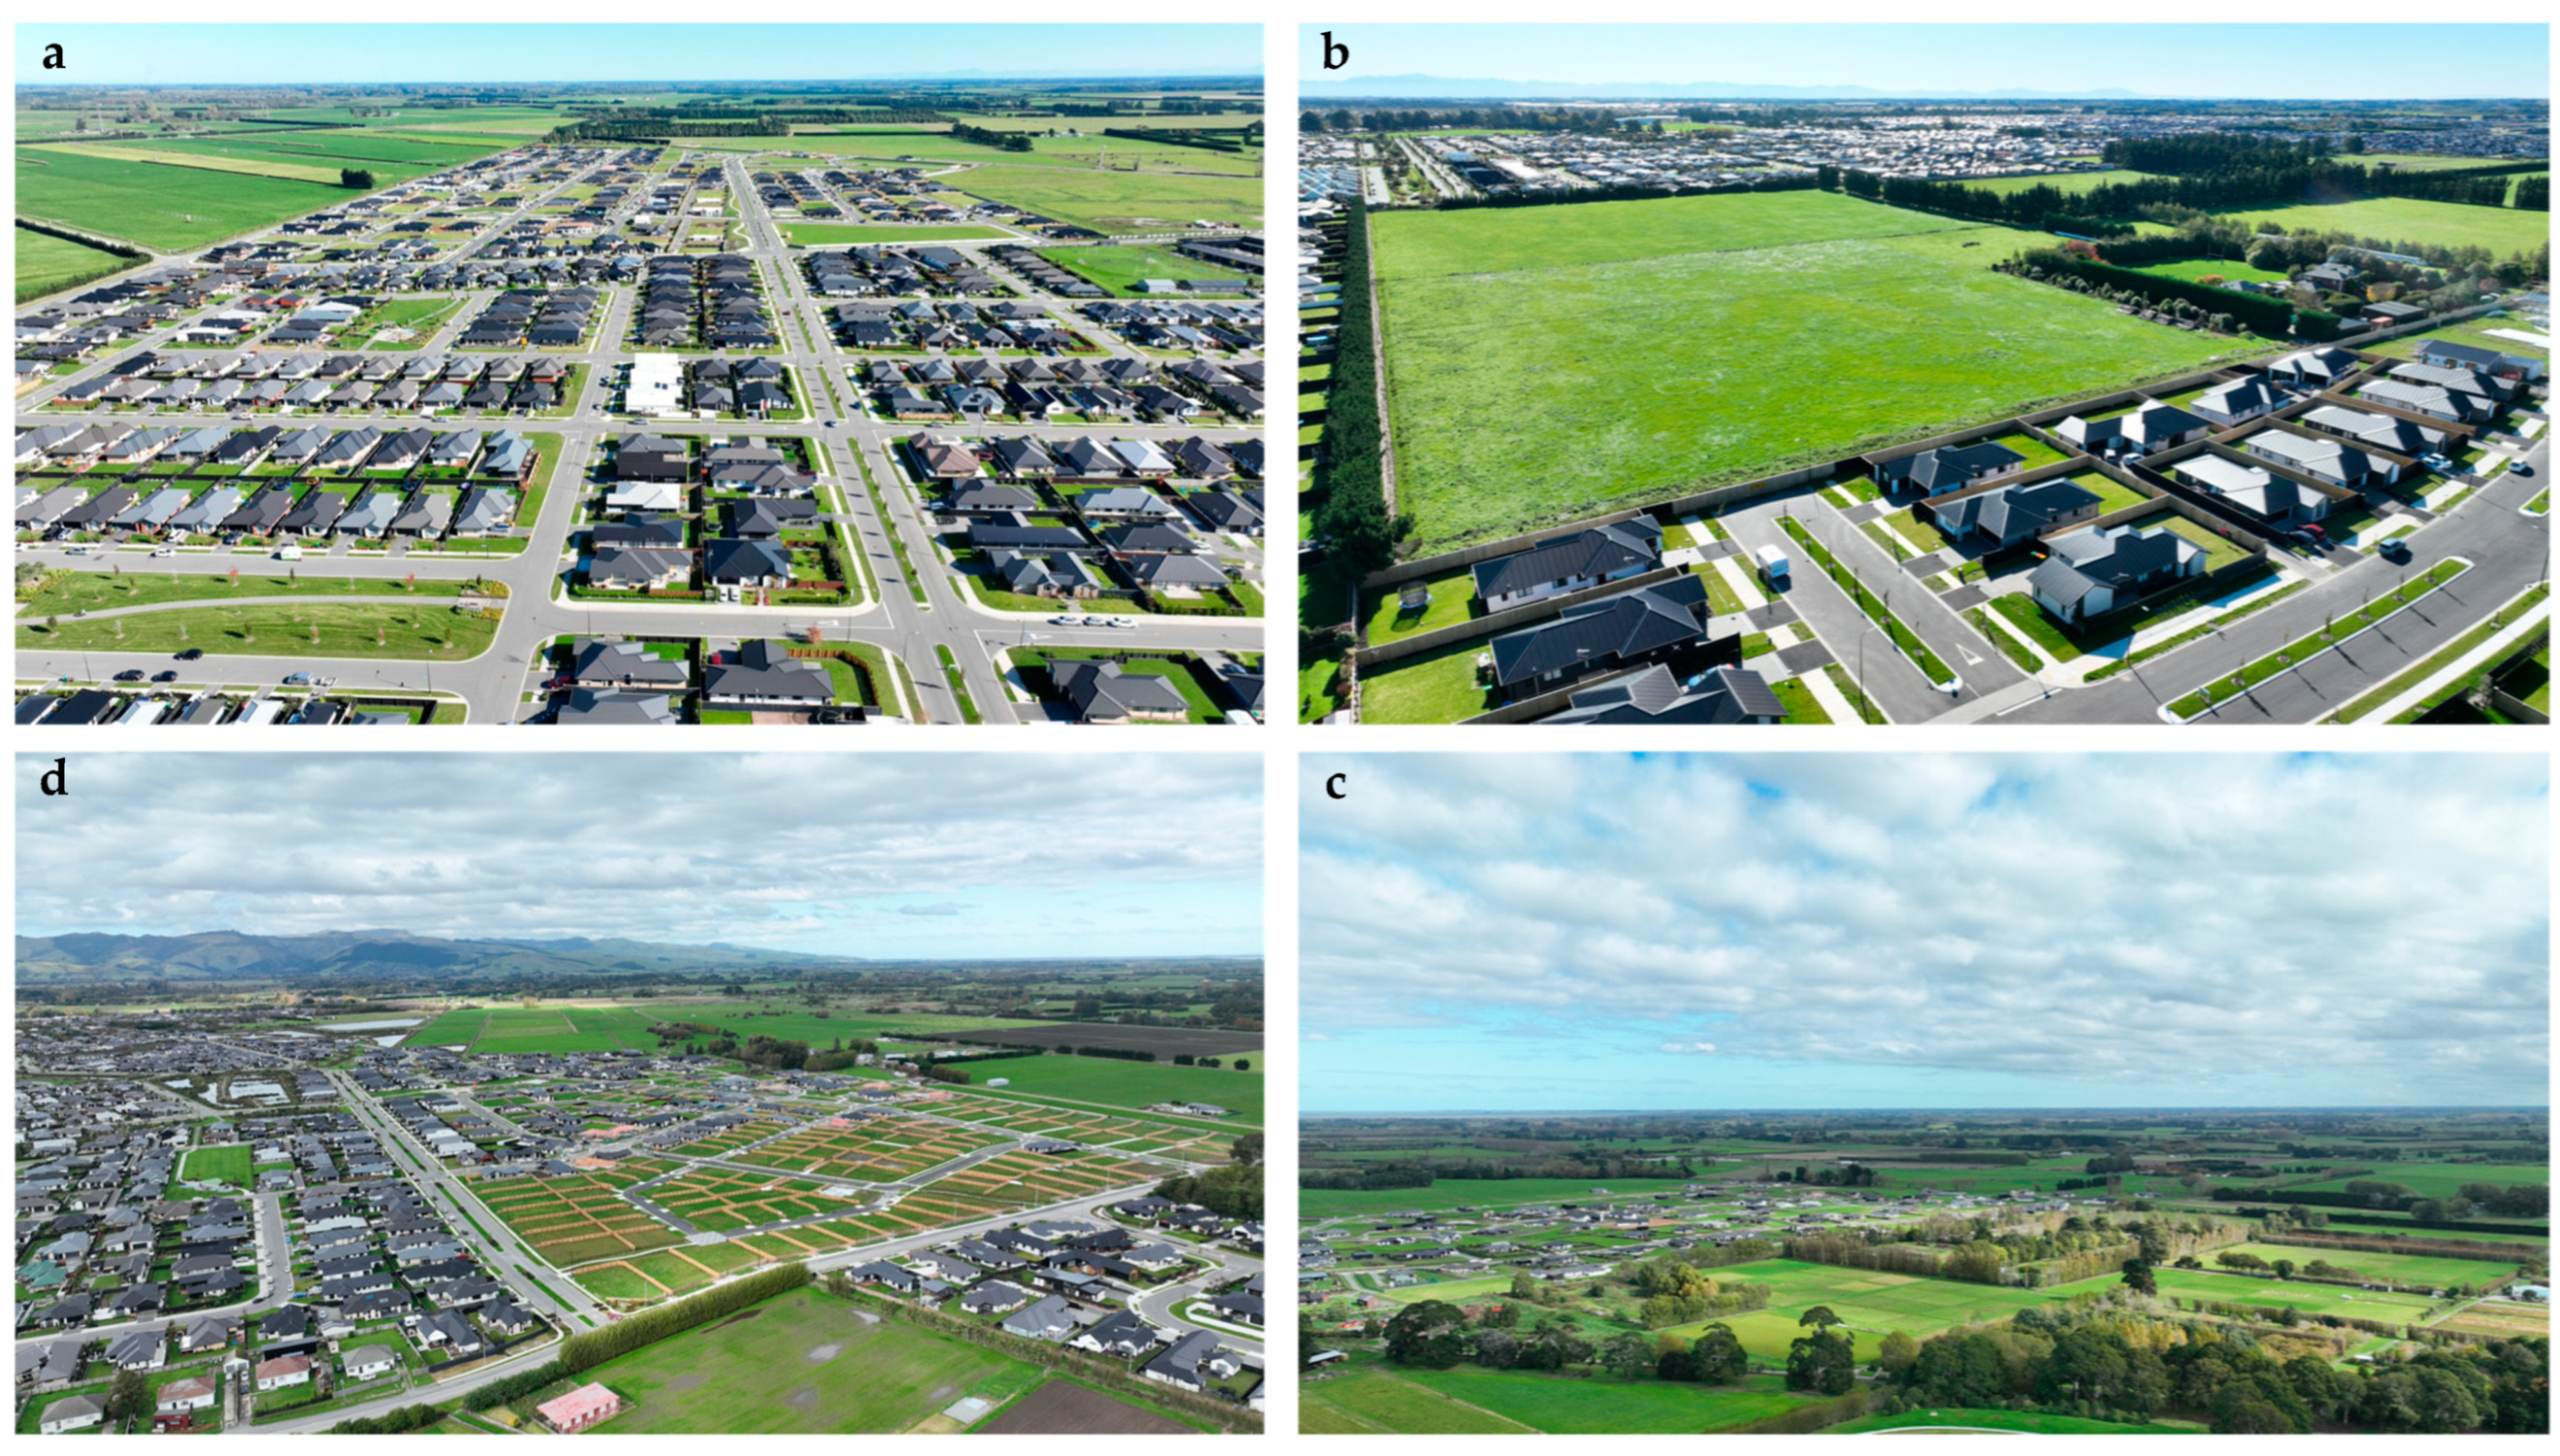
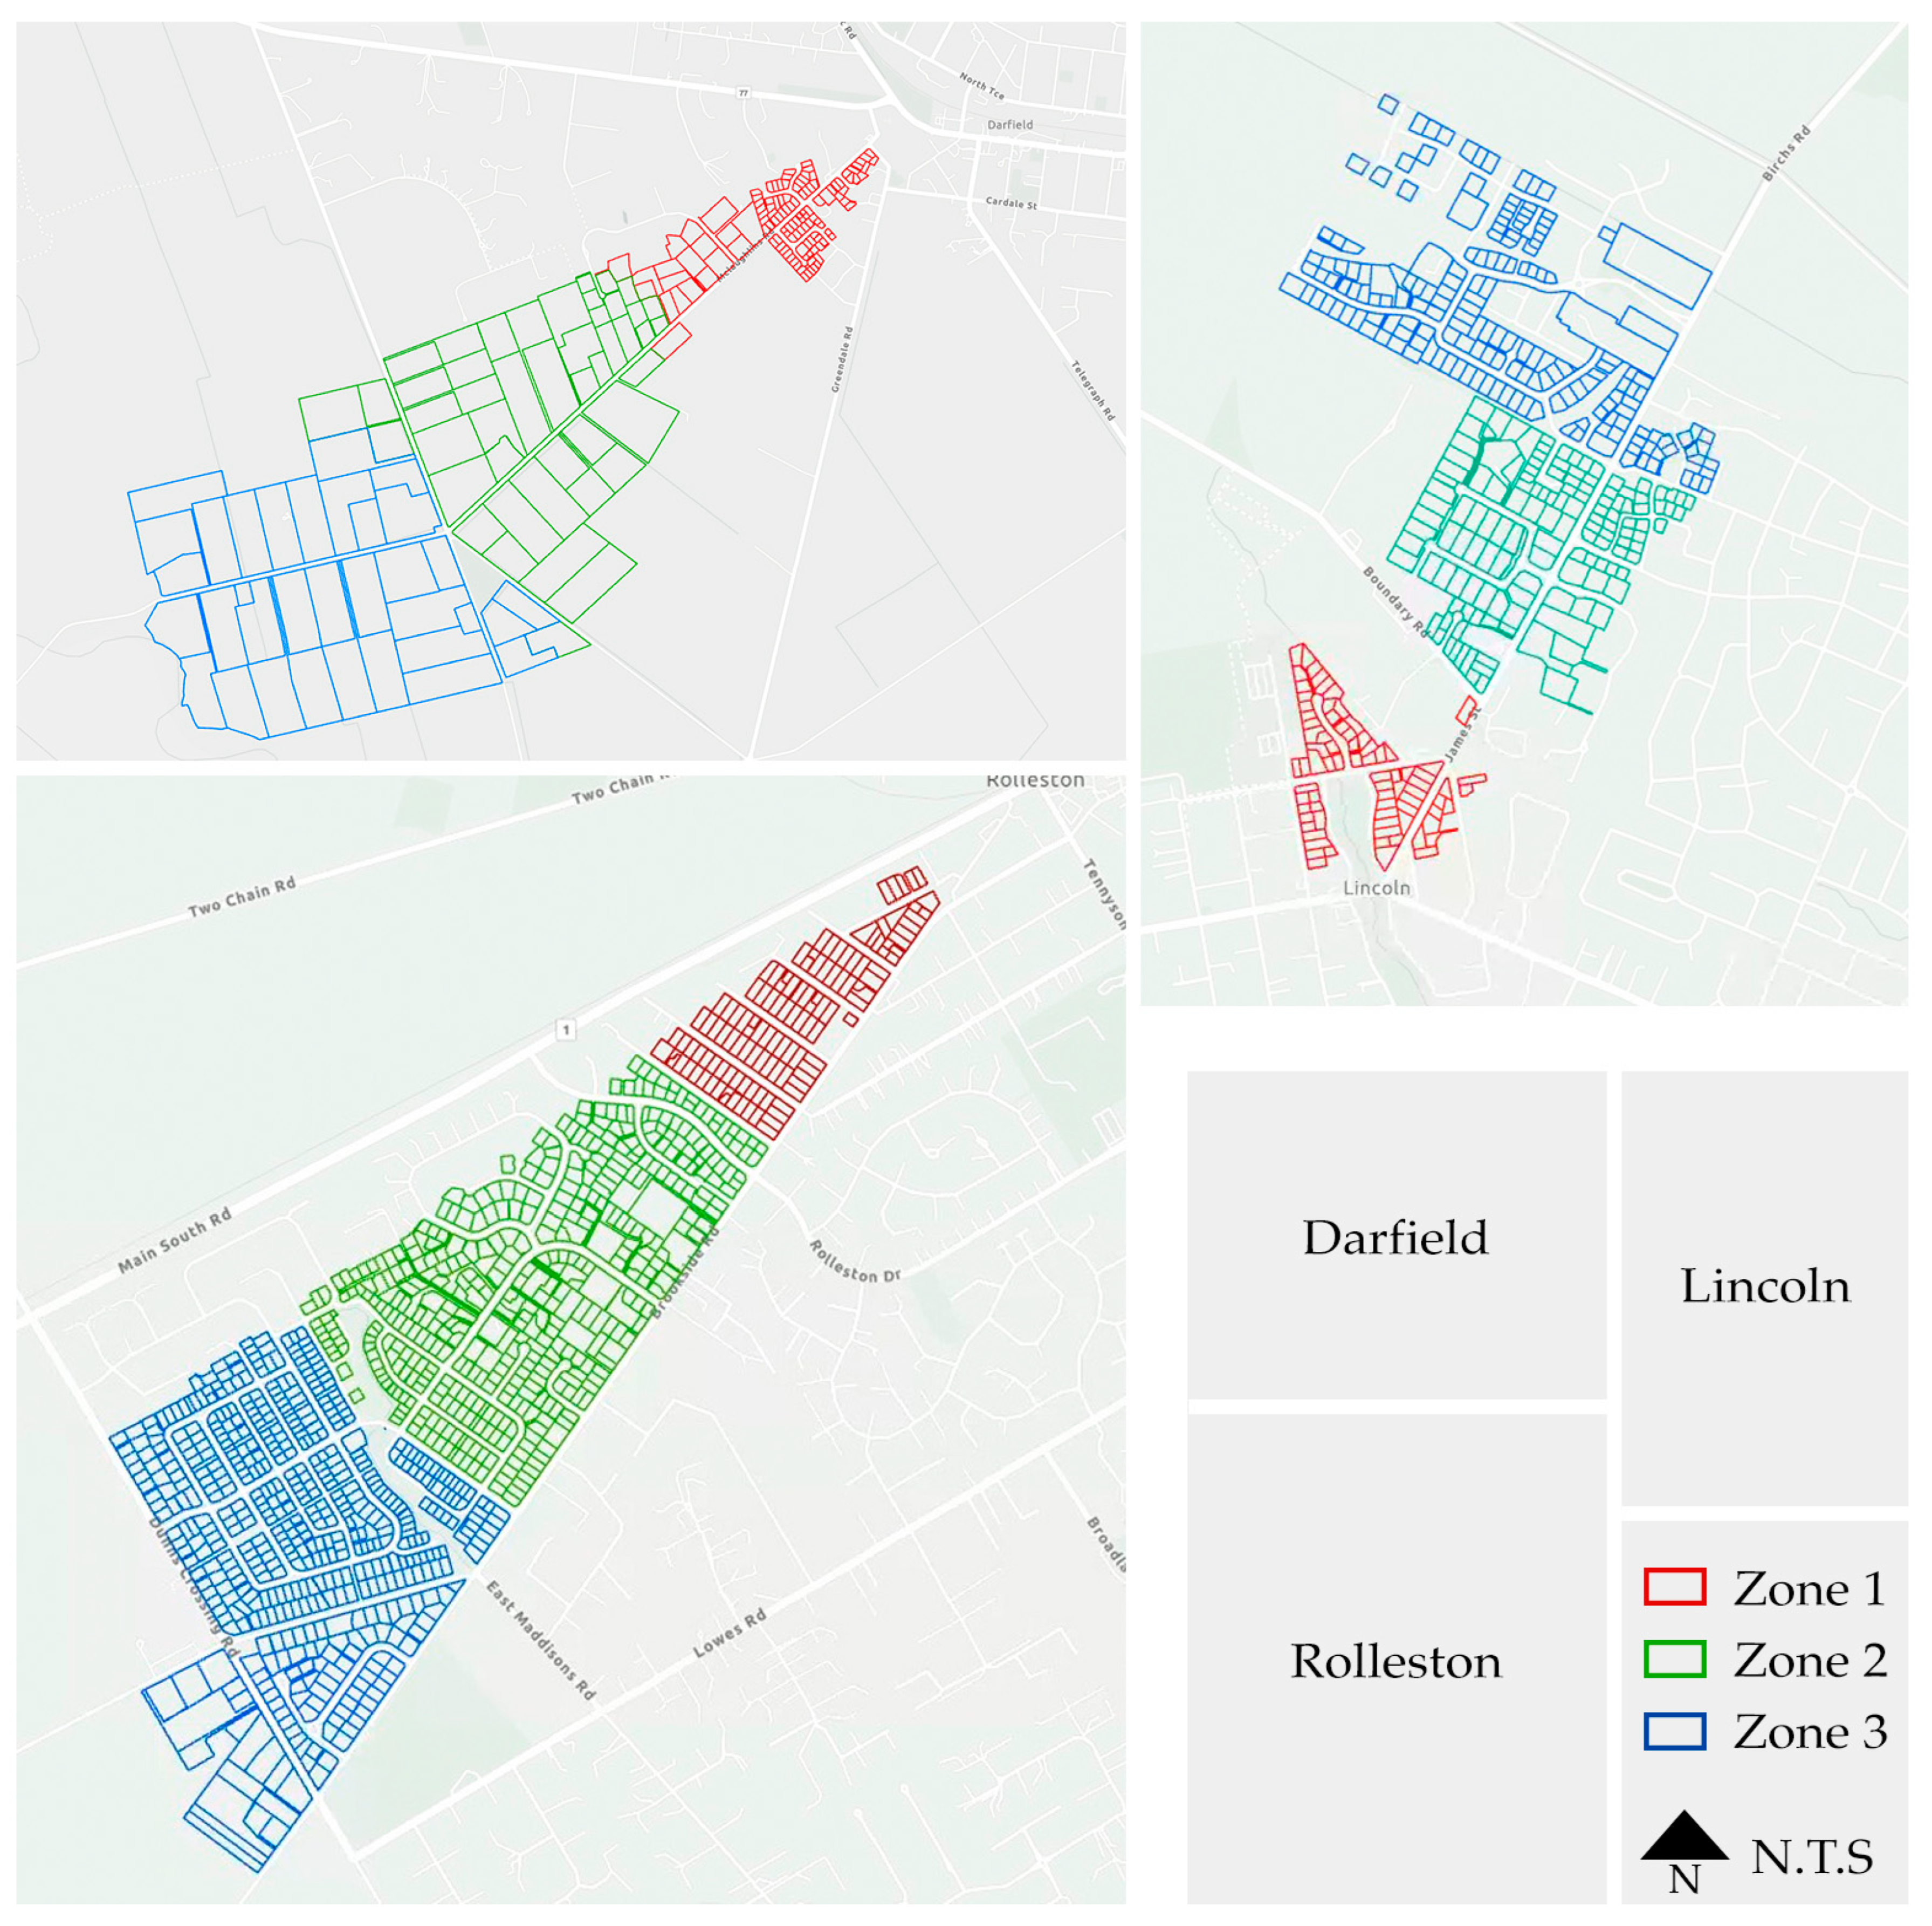
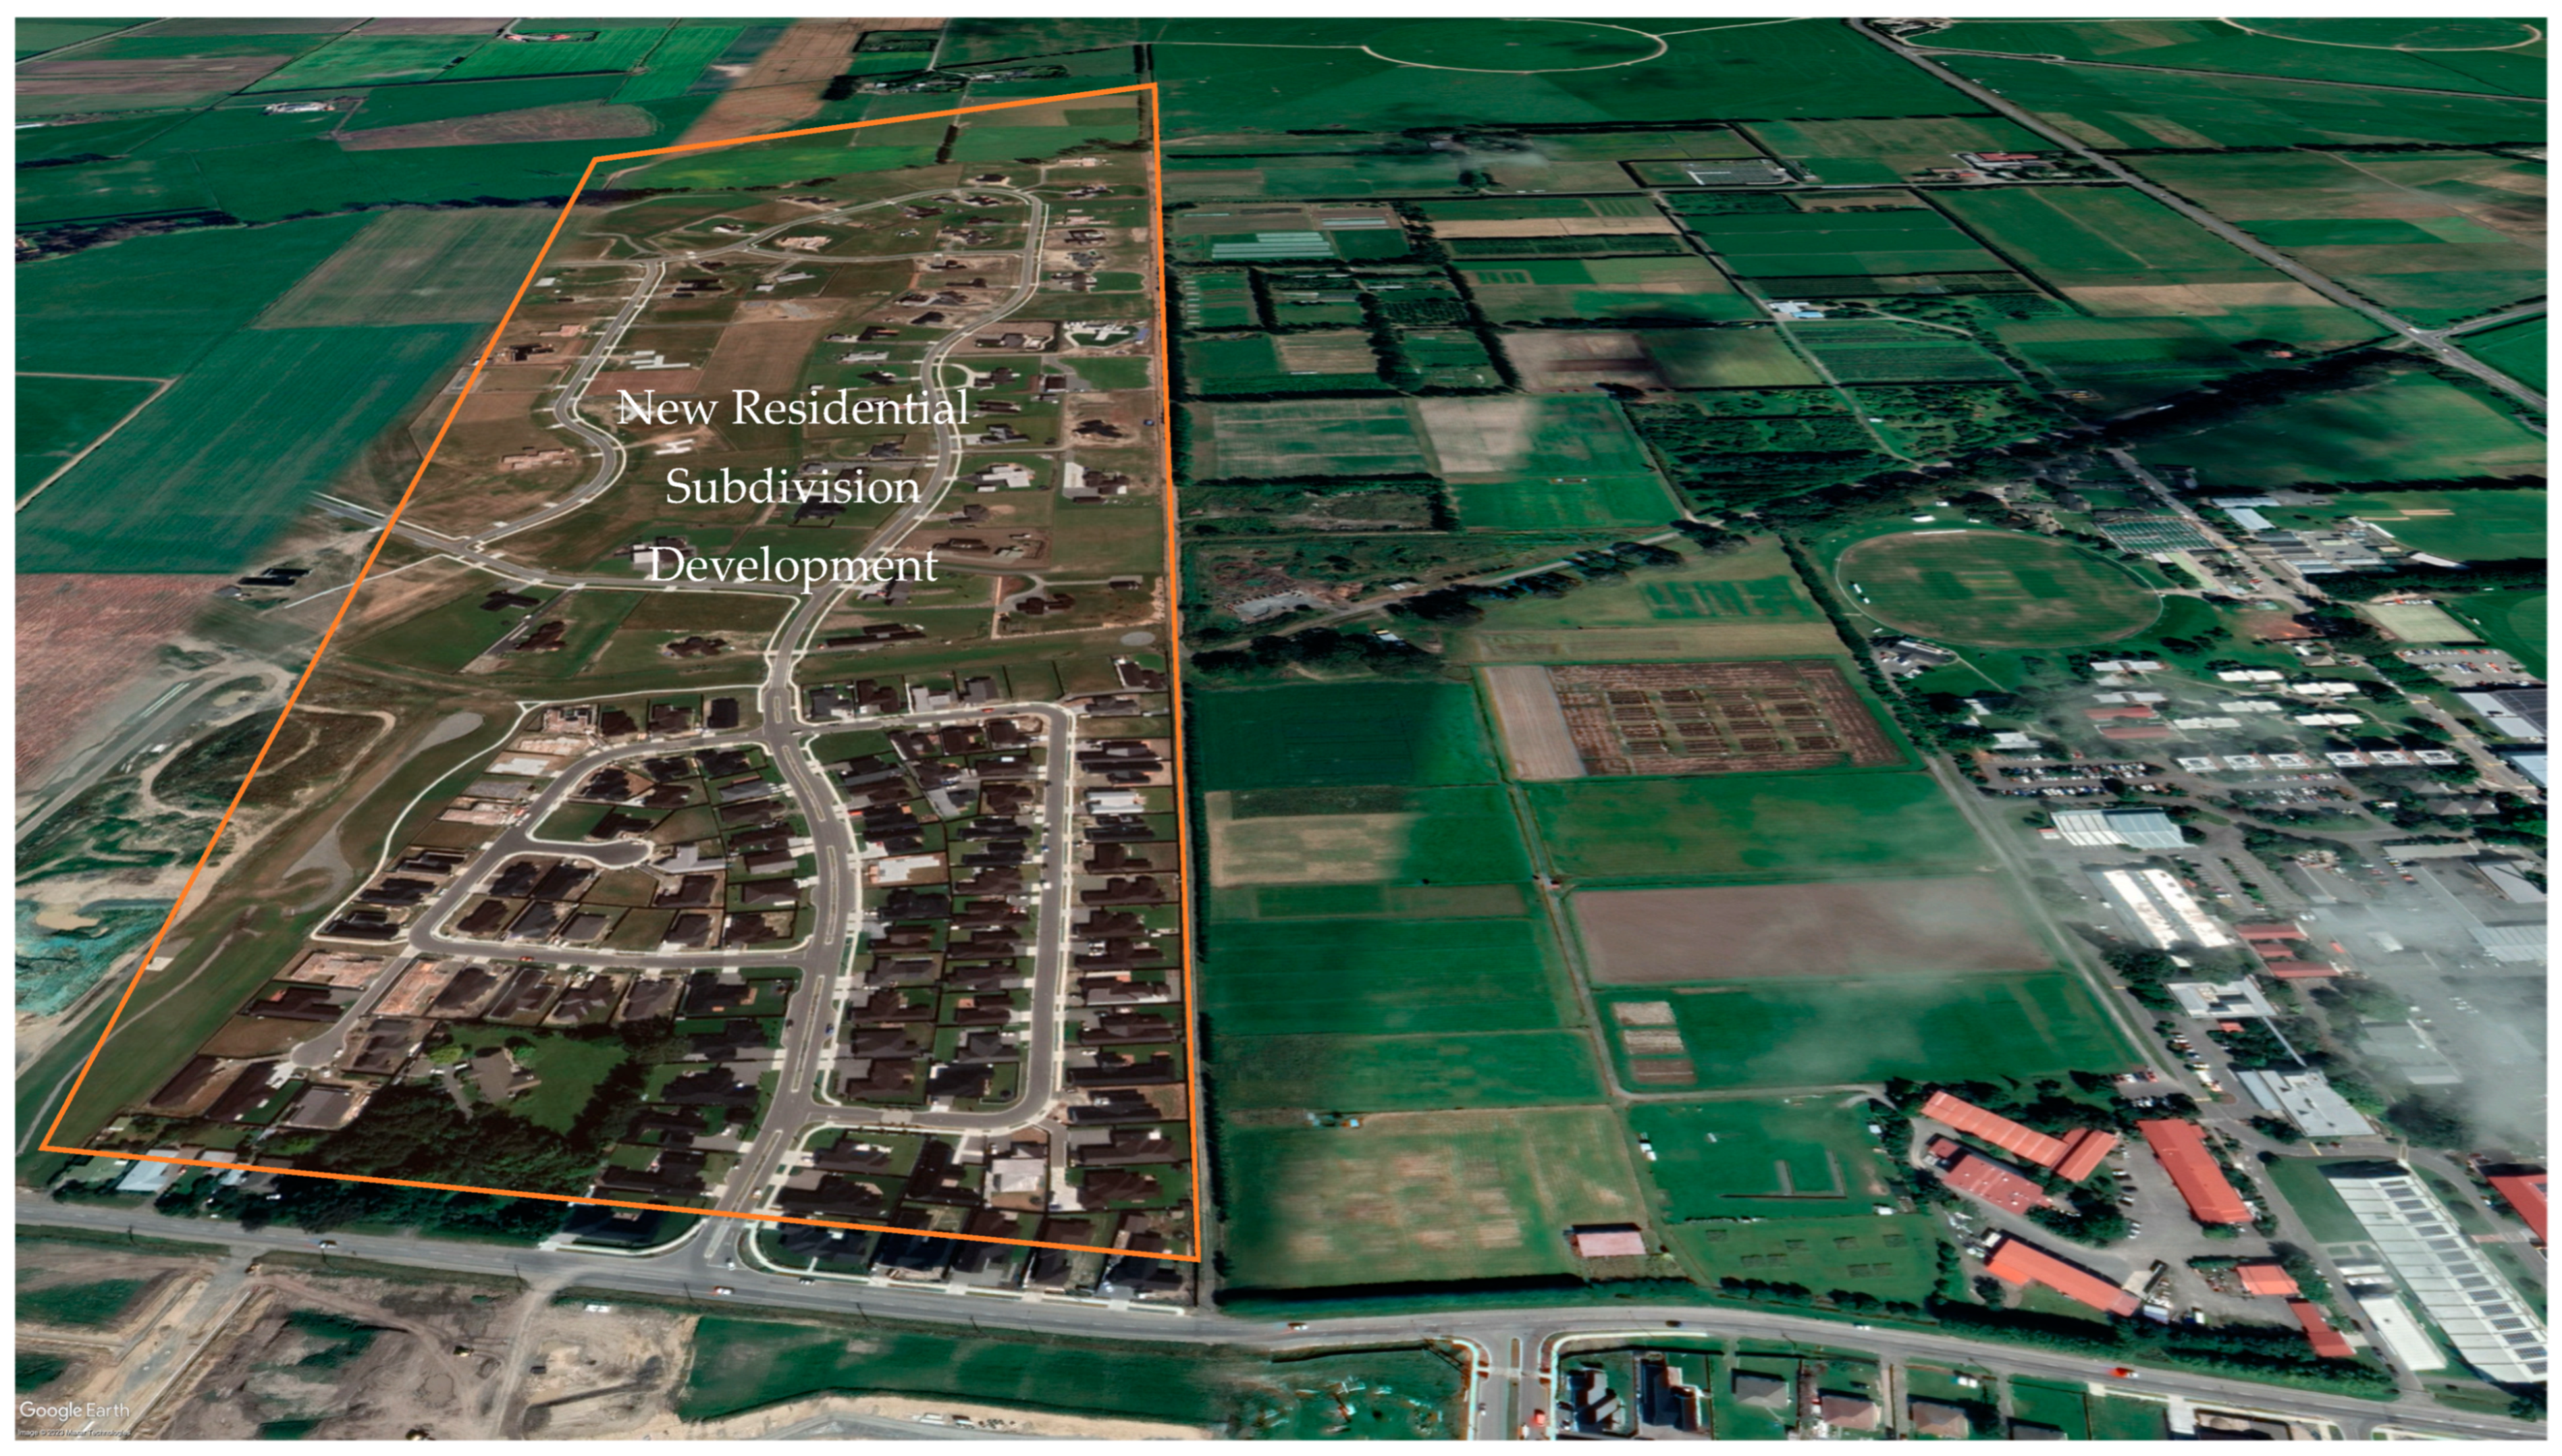
2.1.1. Study Area

2.1.2. Sampling and Surveying Procedure
2.1.3. Questionnaire Design—Resident Survey
2.1.4. Data Analysis
2.2. Food Producer Survey
Questionnaire Design—Food Producer Survey
3. Results
3.1. Resident Survey—Response Rate
3.2. Resident Survey—Demographic Characteristics
3.3. Resident Survey—Property Characteristics
3.4. Resident Survey—Behavioural Characteristics and Awareness
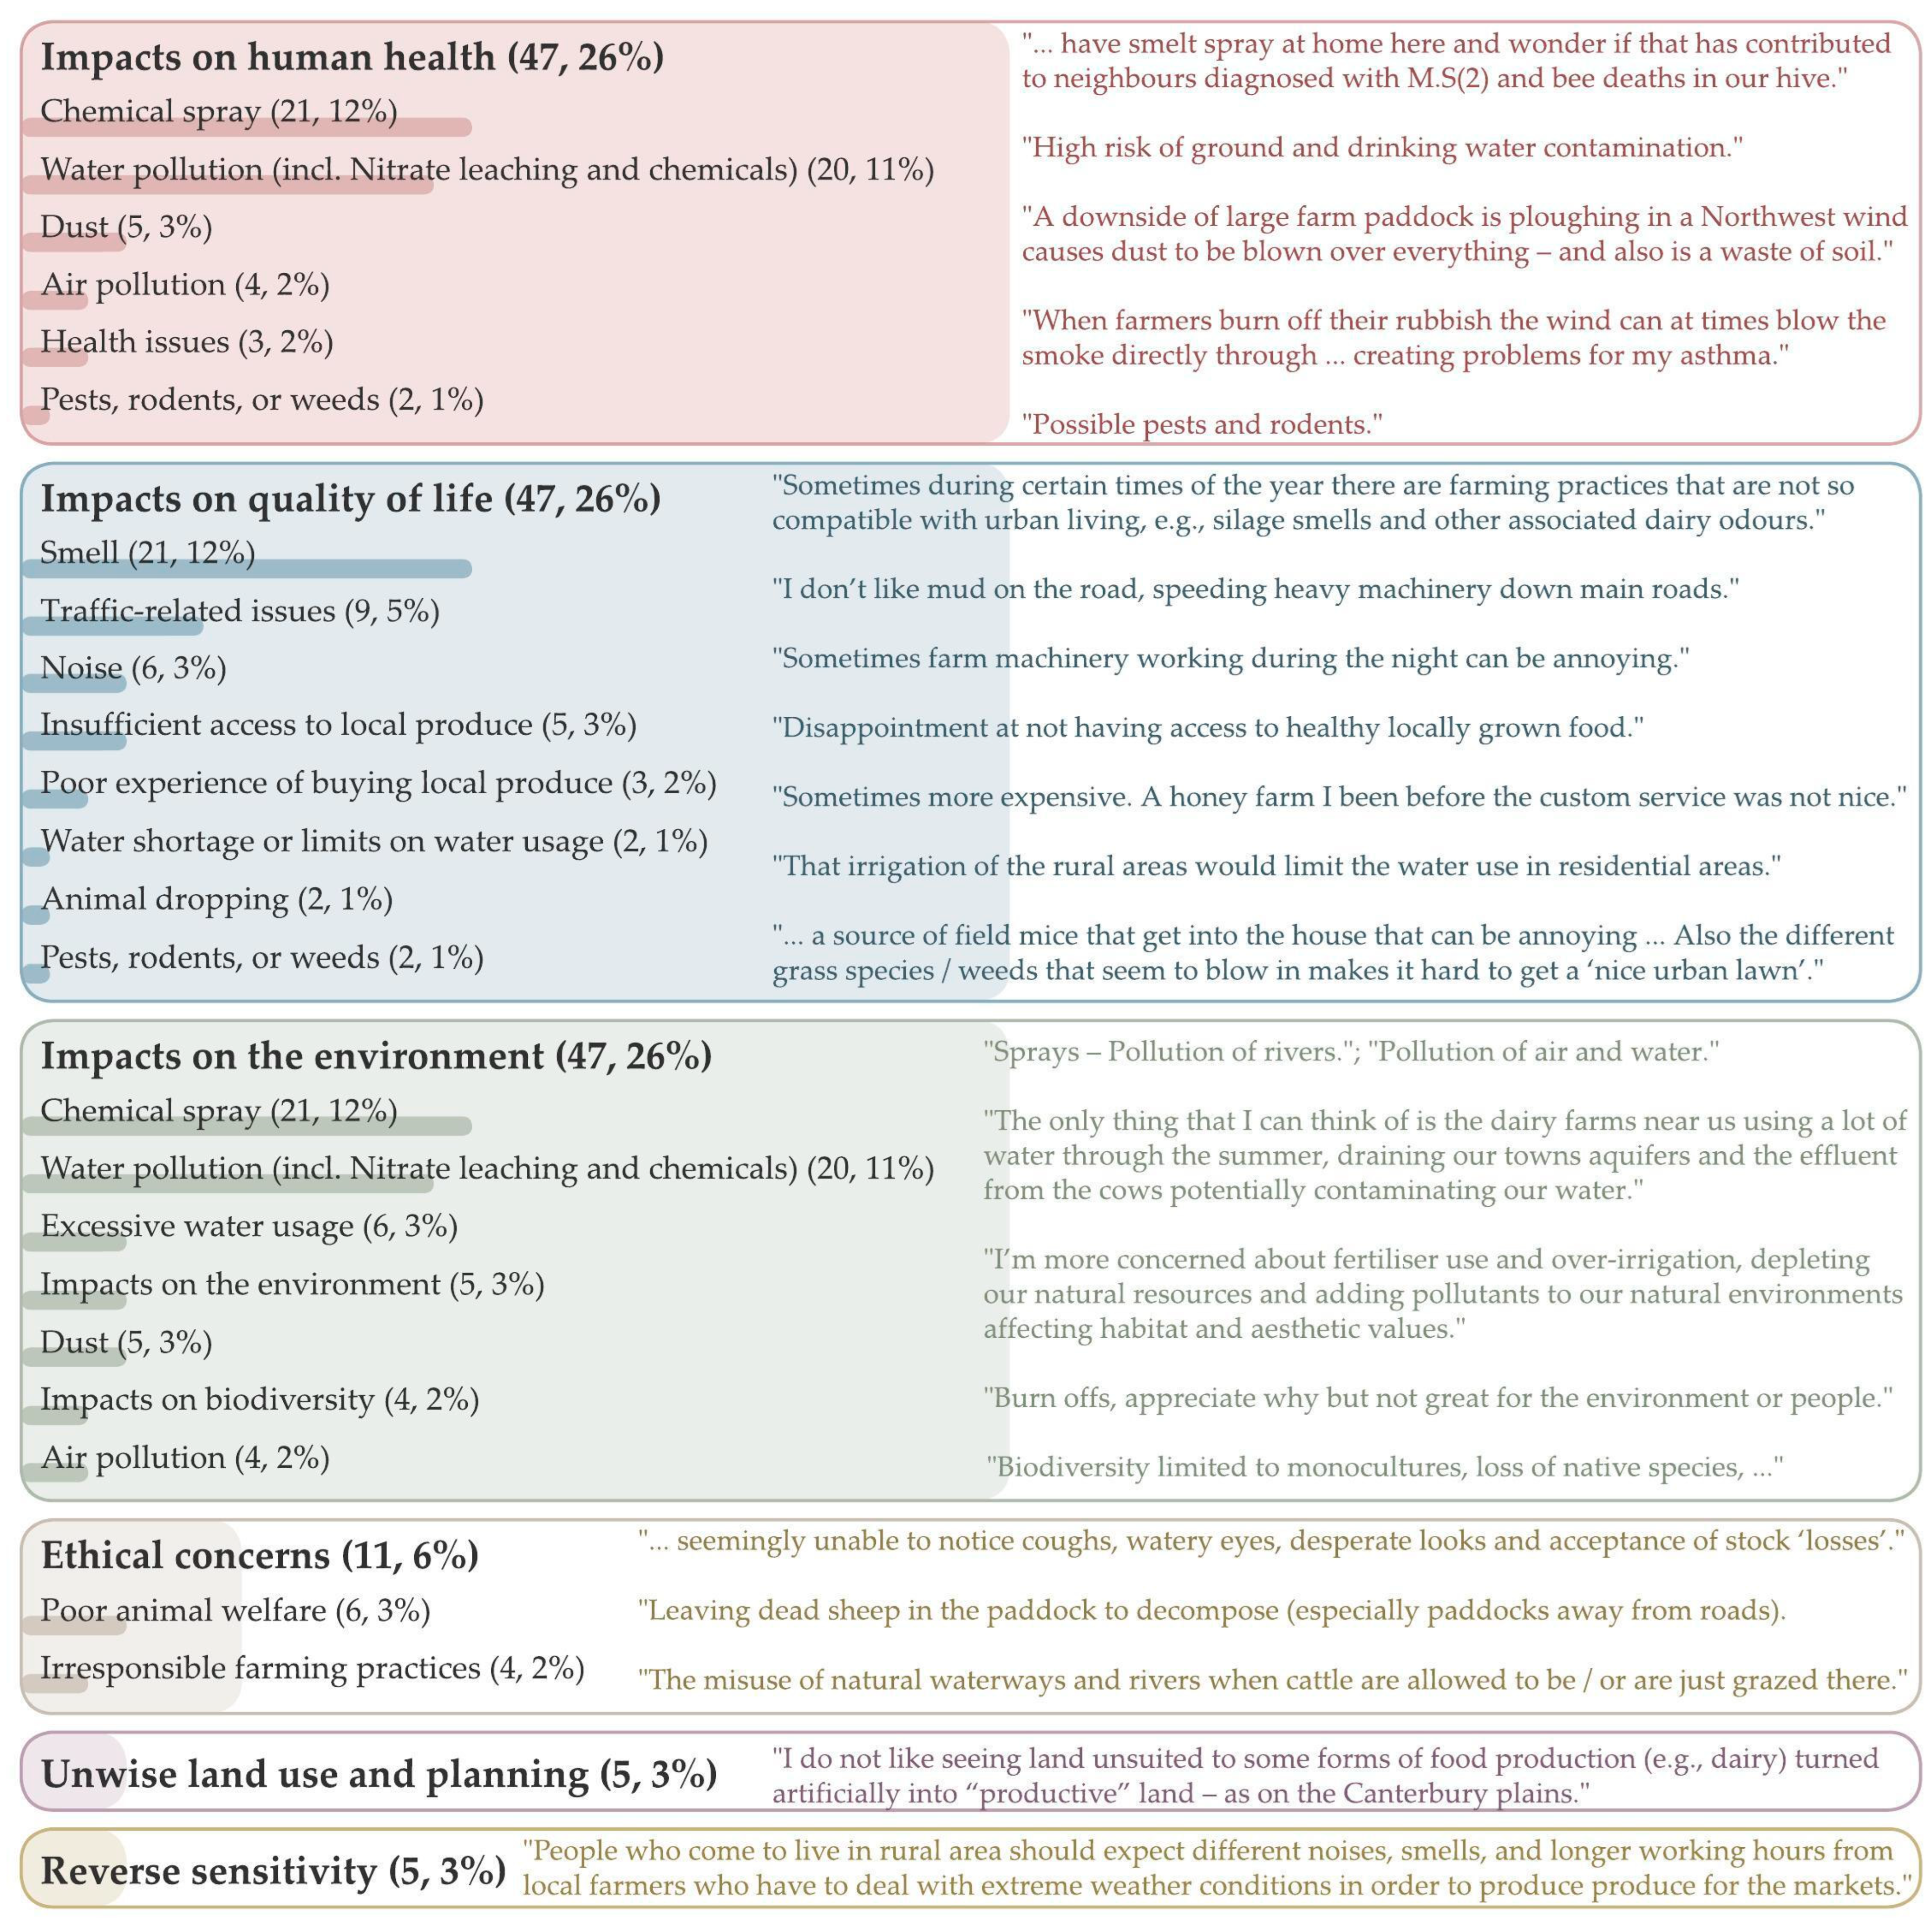
3.5. Resident Survey—Perceptions and Attitude
3.5.1. Overall Perception towards Farming Landscapes
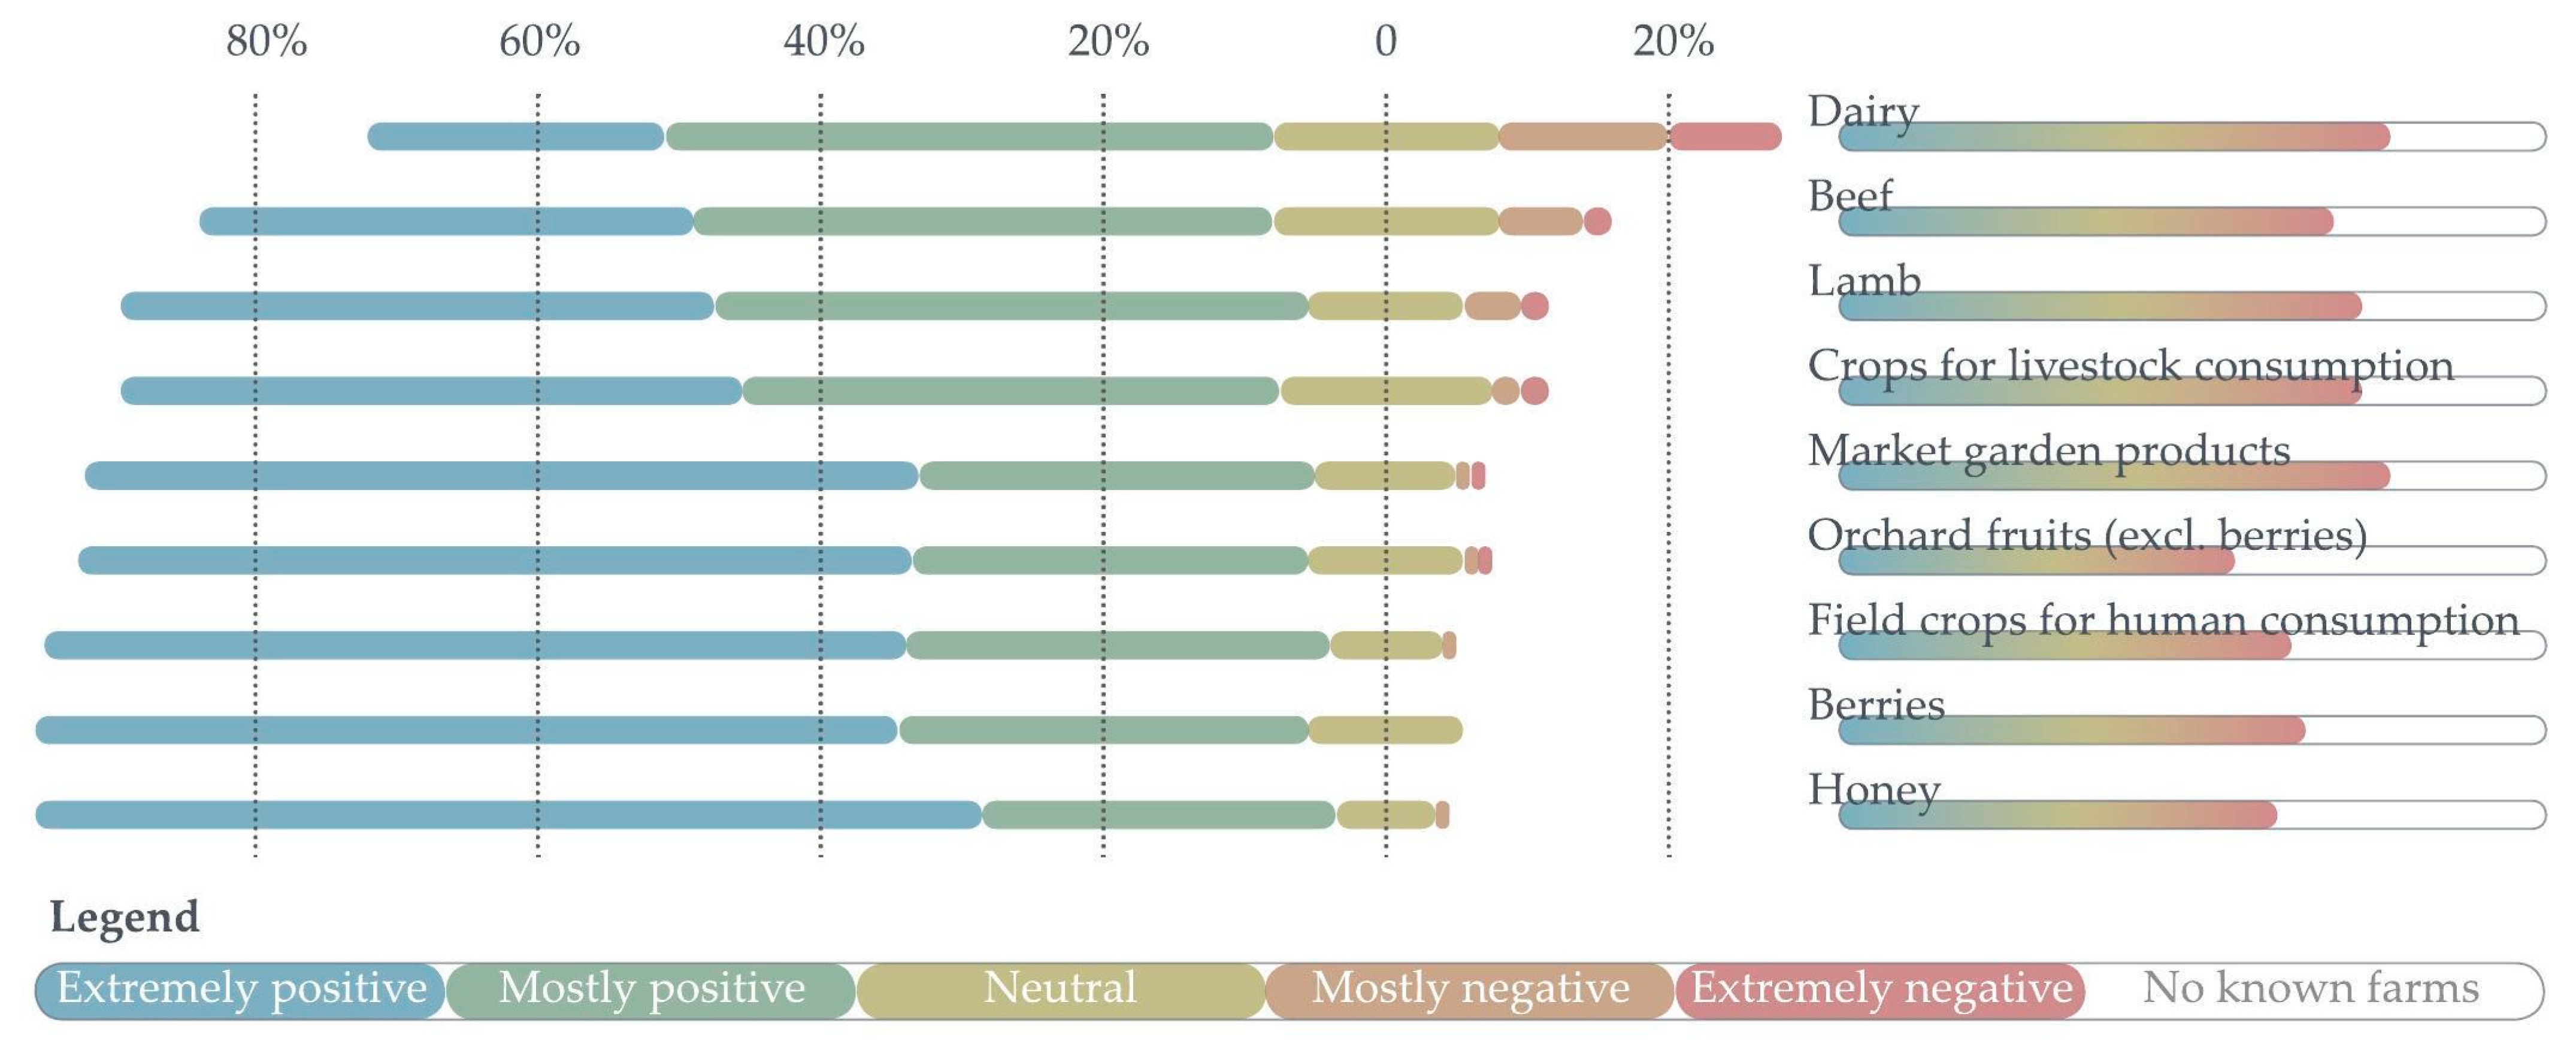
3.5.2. Perception towards Specific Types of Production Practices
3.5.3. Perception towards Specific Production Approaches
3.6. Food Producers’ Survey
4. Discussion
5. Conclusions
Author Contributions
Funding
Data Availability Statement
Acknowledgments
Conflicts of Interest
1 A land holding or small farm run as a hobby, not as a commercial enterprise. | |
2 Statistics New Zealand. Subnational population estimates (RC, SA2), by age and sex, at 30 June 1996–2022 (2022 boundaries). | |
3 Mahika kai/mahinga kai is the indigenous Māori term used for the ccustomary gathering of food and natural materials by Māori | |
4 Māra kai is the indigenous Māori term for gardening for food. |
References
- Morgan, K. Nourishing the city: The rise of the urban food question in the Global North. Urban Stud. 2014, 52, 1379–1394. [Google Scholar] [CrossRef]
- Parham, S. Foof and Urbanism: The Convivial City and a Sustainable Future; Bloomsbury Academic: London, UK, 2015. [Google Scholar]
- Pothukuchi, K.; Kaufman, J. Placing the food system on the urban agenda: The role of municipal institutions in food systems planning. Agric. Hum. Values. 1999, 16, 213–224. [Google Scholar] [CrossRef]
- Steel, C. Hungry City: How Food Shapes Our Lives; Vintage Books: London, UK, 2008. [Google Scholar]
- Steel, C. Sitopia: How Food Can Save the World; Chatto & Windus: London, UK, 2020. [Google Scholar]
- Viljoen, A.; Bohn, K. Continuous Productive Urban Landscaes: Urban Agriculture as an Esssential Infrastructure. Urban Agric. Mag. 2005, 15, 34–36. [Google Scholar]
- Viljoen, A.; Schlesinger, J.; Bohn, K.; Drescher, A. Agriculture in Urban Design and Spatial Planning. Cities Agric. Dev. Resilient Urban Food Syst. 2015, 88–120, 106–138. [Google Scholar]
- Morgan, K.S.; Sonnino, R. The urban foodscape: World cities and the new food equation. Camb. J. Reg. Econ. Soc. 2010, 3, 209–224. [Google Scholar] [CrossRef]
- Opitz, I.; Berges, R.; Piorr, A.; Krikser, T. Contributing to food security in urban areas: Differences between urban agriculture and peri-urban agriculture in the Global North. Agric. Hum. Values 2016, 33, 341–358. [Google Scholar] [CrossRef]
- Viljoen, A. CPULS Continuous Productive Urban Landscapes: Designing Urban Agriculture for Sustainable Cities; Routledge: Oxford, UK, 2005. [Google Scholar]
- Sarker, A.H.; Bornman, J.F.; Marinova, D. A Framework for Integrating Agricultue in urban Sustainability in Australia. Urban Sci. 2019, 3, 50. [Google Scholar] [CrossRef]
- Van der Schans, J.W.; Wiskerke, J.S.C. Urban Agrculture in developed economies. In Sustainable Food Planning; Viljoen, A., Wiskerke, J.S.C., Eds.; Wageningen Academic Publishers: Wageningen, The Netherlands, 2012. [Google Scholar]
- Langemeyer, J.; Madrid-Lopez, C.; Beltran, A.M.; Mendez, G.V. Urban Agriculture—A necessary pathway towards urban resilience and global sustainability? Landsc. Urban Plan. 2021, 210, 104055. [Google Scholar] [CrossRef]
- Brinkley, C. Evaluating the Benefits of Peri-Urban Agriculture. J. Plan. Lit. 2012, 27, 259–269. [Google Scholar] [CrossRef]
- Potteiger, M. Eating Places: Food Systems, Narratives, Netowrks, and Spaces. Landsc. J. 2013, 32, 261–275. [Google Scholar] [CrossRef]
- Potteiger, M. Eating Ecologies: Integrating productive ecologies and foraging at the landscape scale. In Proceedings of the Localizing Urban Food Strategies. Farming Cities and Performing Rurality 7th International Aesop Sustainable Food Planning Conference Proceedings, Torino, Italy, 8–9 October 2015; pp. 131–145. [Google Scholar]
- Ministry for the Environment. National Policy Statement on Highly Productive Land 2022; Ministry for the Environment: Wellington, New Zealand, 2022.
- Amirinejad, G.; Donehue, P.; Baker, D. Ambiguity at the peri-urban interface in Australia. Land Use Policy 2018, 78, 472–480. [Google Scholar] [CrossRef]
- Environment Foundation. Resource Consents. Available online: https://www.environmentguide.org.nz/issues/noise-and-vibration/resource-consents/ (accessed on 20 August 2023).
- Buxton, M.; Butt, A. The Future of the Fringe; CSIRO Publishing: Clayton, Australia, 2020; p. 185. [Google Scholar]
- Swaffield, S.R. Reinventing spatial planning at the urban rural interface: A Christchurch, New Zealand case study. Plan. Pract. Res. 2012, 27, 405–422. [Google Scholar] [CrossRef]
- Selwyn District CouncilSelwyn District ePlan. 2016. Available online: https://eplan.selwyn.govt.nz/eplan/rules/0/3/0/0/0/216 (accessed on 20 August 2023).
- Land Information New Zealand. Basemaps. n.d. Available online: https://basemaps.linz.govt.nz/@-37.8718154,-165.7704692,z3.73 (accessed on 20 August 2023).
- Infometrics. Regional Economic Profile Lincoln 2022. Available online: https://ecoprofile.infometrics.co.nz/Lincoln/Population/Growth (accessed on 5 August 2023).
- Infometrics. Regional Economic Profile Rolleston 2022. Available online: https://ecoprofile.infometrics.co.nz/Rolleston/Population/Growth (accessed on 5 August 2023).
- Infometrics. Regional Economic Profile Darfield 2022. Available online: https://ecoprofile.infometrics.co.nz/Darfield/Population/Growth (accessed on 5 August 2023).
- Our Environment by Manaaki Whenua Landcare Research. Explore NZ Landcover Change. LCDB Version 5.0. n.d. Available online: https://ourenvironment.scinfo.org.nz/maps-and-tools/explore-nz-landcover-change (accessed on 20 August 2023).


| Variables | Measurement Scale | |
|---|---|---|
| Sociodemographic | Age | Ordinal |
| Gender | Binary | |
| Household type | Categorical | |
| Property ownership | Binary | |
| Farming background | Binary | |
| Property characteristics | Town | Categorical |
| Zone | Ordinal | |
| Number of years lived in the surveyed property | Ordinal | |
| Age of the surveyed property | Ordinal | |
| Direct property–commercial farm interface | Binary | |
| Property type | Categorical | |
| Property land size | Ordinal | |
| Behaviour and awareness | Type of home produce | Binary |
| Usage of home produce | Binary | |
| Personal connection to the food producers | Ordinal | |
| Known channels for purchasing local produce | Binary | |
| Perception | Overall perception towards food-producing landscapes | Likert scale |
| Perception towards specific types of production | Likert scale | |
| Perception towards specific food-producing/gathering approach | Likert scale |
| Rolleston | Lincoln | Darfield | Total | |||||||
|---|---|---|---|---|---|---|---|---|---|---|
| Zone 1 | Zone 2 | Zone 3 | Zone 1 | Zone 2 | Zone 3 | Zone 1 | Zone 2 | Zone 3 | Total | |
| Distributed | 180 | 589 | 654 | 79 | 136 | 215 | 126 | 47 | 34 | 2060 |
| Response collected | 15 | 34 | 36 | 21 | 30 | 18 | 19 | 11 | 6 | 190 |
| Response accepted | 15 | 31 | 34 | 20 | 25 | 18 | 19 | 11 | 6 | 179 |
| Response rate | 8.33% | 5.26% | 5.20% | 25.32% | 18.38% | 8.37% | 15.08% | 23.40% | 17.65% | 8.69% |


| Perception towards Food-Producing Landscapes | Age | Zone | Number of Years Lived in this Property | House Age | Land Size | Personal Connection to the Farmers |
|---|---|---|---|---|---|---|
| Correlation Coefficient | −0.04 | 0.02 | −0.09 | −0.08 | 0.05 | 0.05 |
| Sig. (2-tailed) | 0.573 | 0.787 | 0.236 | 0.288 | 0.555 | 0.479 |
| N | 176 | 178 | 175 | 176 | 171 | 174 |
| Group | N | Mean | SD | Mean Rank |
|---|---|---|---|---|
| Darfield | 36 | 4.39 | 0.766 | 82.33 |
| Lincoln | 63 | 4.68 | 0.591 | 101.75 |
| Rolleston | 79 | 4.42 | 0.709 | 83.00 |
| Sample 1-Sampe 2 | Mann-Whitney U | Z | Asymp. Sig. (2-Tailed) |
|---|---|---|---|
| Darfield-Lincoln | 889 | −2.14 | 0.032 |
| Darfield-Rolleston | 1409 | −0.091 | 0.928 |
| Lincoln-Rolleston | 1967 | −2.51 | 0.012 |
| Production Practice | EP | MP | N | MN | EN | N.A. * | N |
|---|---|---|---|---|---|---|---|
| Dairy | 29 | 59 | 22 | 17 | 11 | 40 | 178 |
| Beef | 44 | 52 | 20 | 8 | 2 | 52 | 178 |
| Lamb | 56 | 55 | 14 | 5 | 2 | 46 | 178 |
| Crops for livestock consumption | 57 | 50 | 20 | 2 | 2 | 45 | 176 |
| Market garden products | 81 | 39 | 14 | 2 | 1 | 39 | 176 |
| Orchard fruits (excl. berries) | 58 | 28 | 11 | 1 | 1 | 75 | 174 |
| Field Crops for human consumption | 69 | 34 | 9 | 1 | 0 | 62 | 175 |
| Berries | 69 | 33 | 12 | 0 | 0 | 59 | 173 |
| Honey | 72 | 27 | 8 | 1 | 0 | 65 | 173 |
| Approach | EP | MP | N | MN | EN | N.A. | N |
|---|---|---|---|---|---|---|---|
| Conventional farming | 61 | 75 | 27 | 8 | 2 | 5 | 178 |
| Organic farming | 87 | 62 | 22 | 3 | 0 | 3 | 177 |
| Regenerative farming | 75 | 44 | 19 | 2 | 0 | 33 | 173 |
| Community garden | 98 | 53 | 22 | 1 | 0 | 4 | 178 |
| Mahika kai/Mahinga kai and Māri kai (see note 3) | 49 | 18 | 15 | 0 | 1 | 85 | 168 |
| Attribute | Description | Count | N | Percentage |
|---|---|---|---|---|
| Age bracket | 18–29 years old | 0 | 10 | 0.00% |
| 30–39 years old | 2 | 20.00% | ||
| 40–49 years old | 1 | 10.00% | ||
| 50–64 years old | 3 | 30.00% | ||
| 65+ years old | 4 | 40.00% | ||
| Gender | Female | 4 | 10 | 40.00% |
| Male | 5 | 50.00% | ||
| Non-binary | 1 | 10.00% | ||
| Property ownership | Own | 6 | 10 | 60.00% |
| Lease | 3 | 30.00% | ||
| Mix | 1 | 10.00% | ||
| Number of years farming on their current land | Less than one year | 0 | 10 | 0.00% |
| 1–4 year | 0 | 0.00% | ||
| 4–7 year | 2 | 20.00% | ||
| 7–10 year | 2 | 20.00% | ||
| 10–13 year | 1 | 10.00% | ||
| 13–16 year | 1 | 10.00% | ||
| 16–19 year | 0 | 0.00% | ||
| 19 years or more | 4 | 40.00% | ||
| Size of the farm | Less than 1 ha | 1 | 10 | 10.00% |
| 1–5 ha | 2 | 20.00% | ||
| 5–10 ha | 2 | 20.00% | ||
| 10–20 ha | 3 | 30.00% | ||
| 20–50 ha | 2 | 20.00% | ||
| More than 50 ha | 0 | 0.00% | ||
| Do you live on the land that you produce food on? | Yes | 6 | 10 | 60.00% |
| No | 4 | 40.00% | ||
| Distance to the closest residential property | Residential property borders my farm | 3 | 9 | 33.33% |
| Less than 1 km | 1 | 11.11% | ||
| Less than 5 km | 3 | 33.33% | ||
| Less than 10 km | 2 | 22.22% | ||
| No residential property within 10 km | 0 | 0.00% | ||
| Current land use of the bordering landscapes (some farms border more than one type of land use) | Residential/subdivision lots | 3 | 9 | 33.33% |
| Lifestyle blocks (see note 2) | 7 | 77.78% | ||
| Farms | 6 | 66.67% | ||
| Public reserves or other natural landscapes | 1 | 11.11% |
| Attribute | Description | Count | N | Percentage |
|---|---|---|---|---|
| Type of food produced | Dairy | 0 | 10 | 0.00% |
| Beef | 2 | 20.00% | ||
| Lamb | 1 | 10.00% | ||
| Crops for livestock consumption | 1 | 10.00% | ||
| Market garden products | 5 | 50.00% | ||
| Orchard fruits (excl. berries) | 4 | 40.00% | ||
| Field crops for human consumption | 1 | 10.00% | ||
| Berries | 1 | 10.00% | ||
| Honey | 3 | 30.00% | ||
| Other | 4 | 40.00% | ||
| What market do you produce food for? | International markets | 2 | 9 | 22.22% |
| Domestic supermarket | 1 | 11.11% | ||
| Local supermarket | 2 | 22.22% | ||
| Local independent stores | 3 | 33.33% | ||
| Farm gate | 2 | 22.22% | ||
| Farmers’ market | 7 | 77.78% | ||
| Other | 5 | 55.56% | ||
| Farming approach | Conventional | 4 | 9 | 44.44% |
| Organic | 2 | 22.22% | ||
| Other | 3 | 33.33% | ||
| Do you want to stay farming in your current location? | Yes | 7 | 8 | 87.50% |
| Would like to continue somewhere else | 0 | 0.00% | ||
| No, would like to stop farming | 1 | 12.50% | ||
| Green waste treatment | Green bin | 0 | 9 | 0.00% |
| Composting system | 7 | 77.78% | ||
| Animal feed | 4 | 44.44% | ||
| Other | 1 | 11.11% | ||
| Approximate percentage of income generated from farming | 10% | 2 | 9 | 22.22% |
| 25% | 3 | 33.33% | ||
| 50% | 3 | 33.33% | ||
| 100% | 1 | 11.11% |
| Attribute | Description | Count | N | Percentage |
|---|---|---|---|---|
| Overall perception towards producing food in the peri-urban zone | Extremely positive | 0 | 9 | 0.00% |
| Mostly positive | 3 | 33.33% | ||
| Neutral | 5 | 55.56% | ||
| Mostly negative | 0 | 0.00% | ||
| Extremely negative | 1 | 11.11% |
Disclaimer/Publisher’s Note: The statements, opinions and data contained in all publications are solely those of the individual author(s) and contributor(s) and not of MDPI and/or the editor(s). MDPI and/or the editor(s) disclaim responsibility for any injury to people or property resulting from any ideas, methods, instructions or products referred to in the content. |
© 2023 by the authors. Licensee MDPI, Basel, Switzerland. This article is an open access article distributed under the terms and conditions of the Creative Commons Attribution (CC BY) license (https://creativecommons.org/licenses/by/4.0/).
Share and Cite
Davis, S.; Chen, G.; Darvill, N. Housing and Food Production: Resident and Grower Perceptions of Peri-Urban Food-Production Landscapes. Land 2023, 12, 2091. https://doi.org/10.3390/land12122091
Davis S, Chen G, Darvill N. Housing and Food Production: Resident and Grower Perceptions of Peri-Urban Food-Production Landscapes. Land. 2023; 12(12):2091. https://doi.org/10.3390/land12122091
Chicago/Turabian StyleDavis, Shannon, Guanyu Chen, and Naomi Darvill. 2023. "Housing and Food Production: Resident and Grower Perceptions of Peri-Urban Food-Production Landscapes" Land 12, no. 12: 2091. https://doi.org/10.3390/land12122091