


Associations between Surface Deformation and Groundwater Storage in Different Landscape Areas of the Loess Plateau, China

 ,
,  ,
, 
Abstract
:1. Introduction
2. Date and Methods
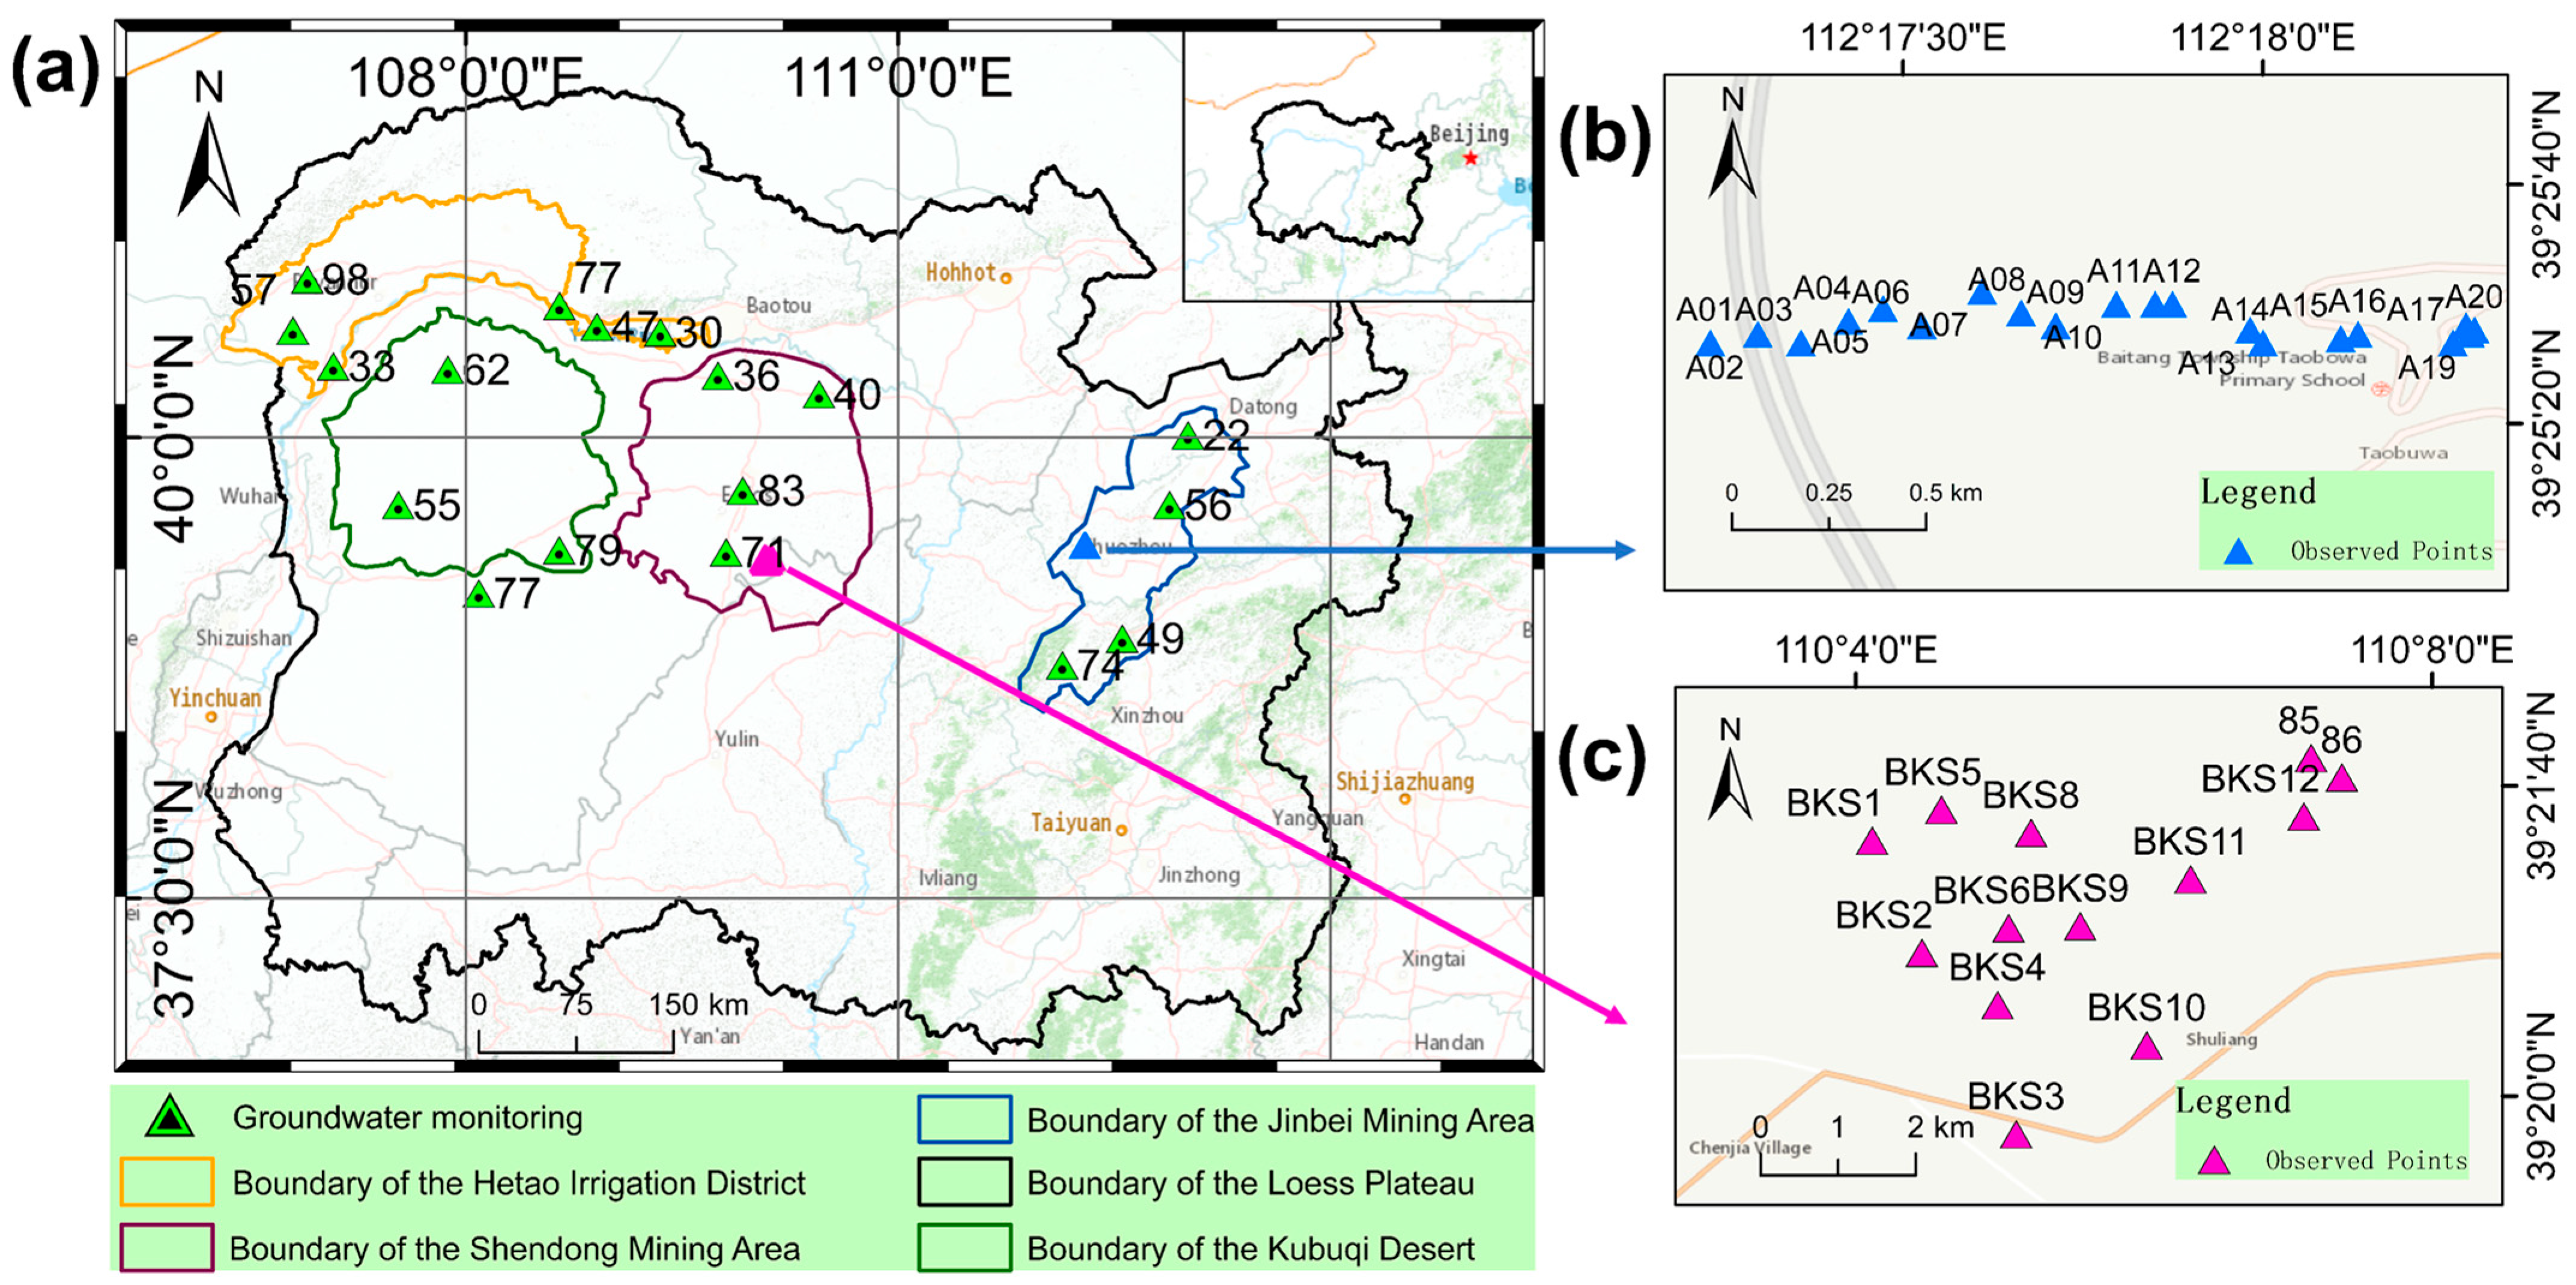
2.1. Study Area
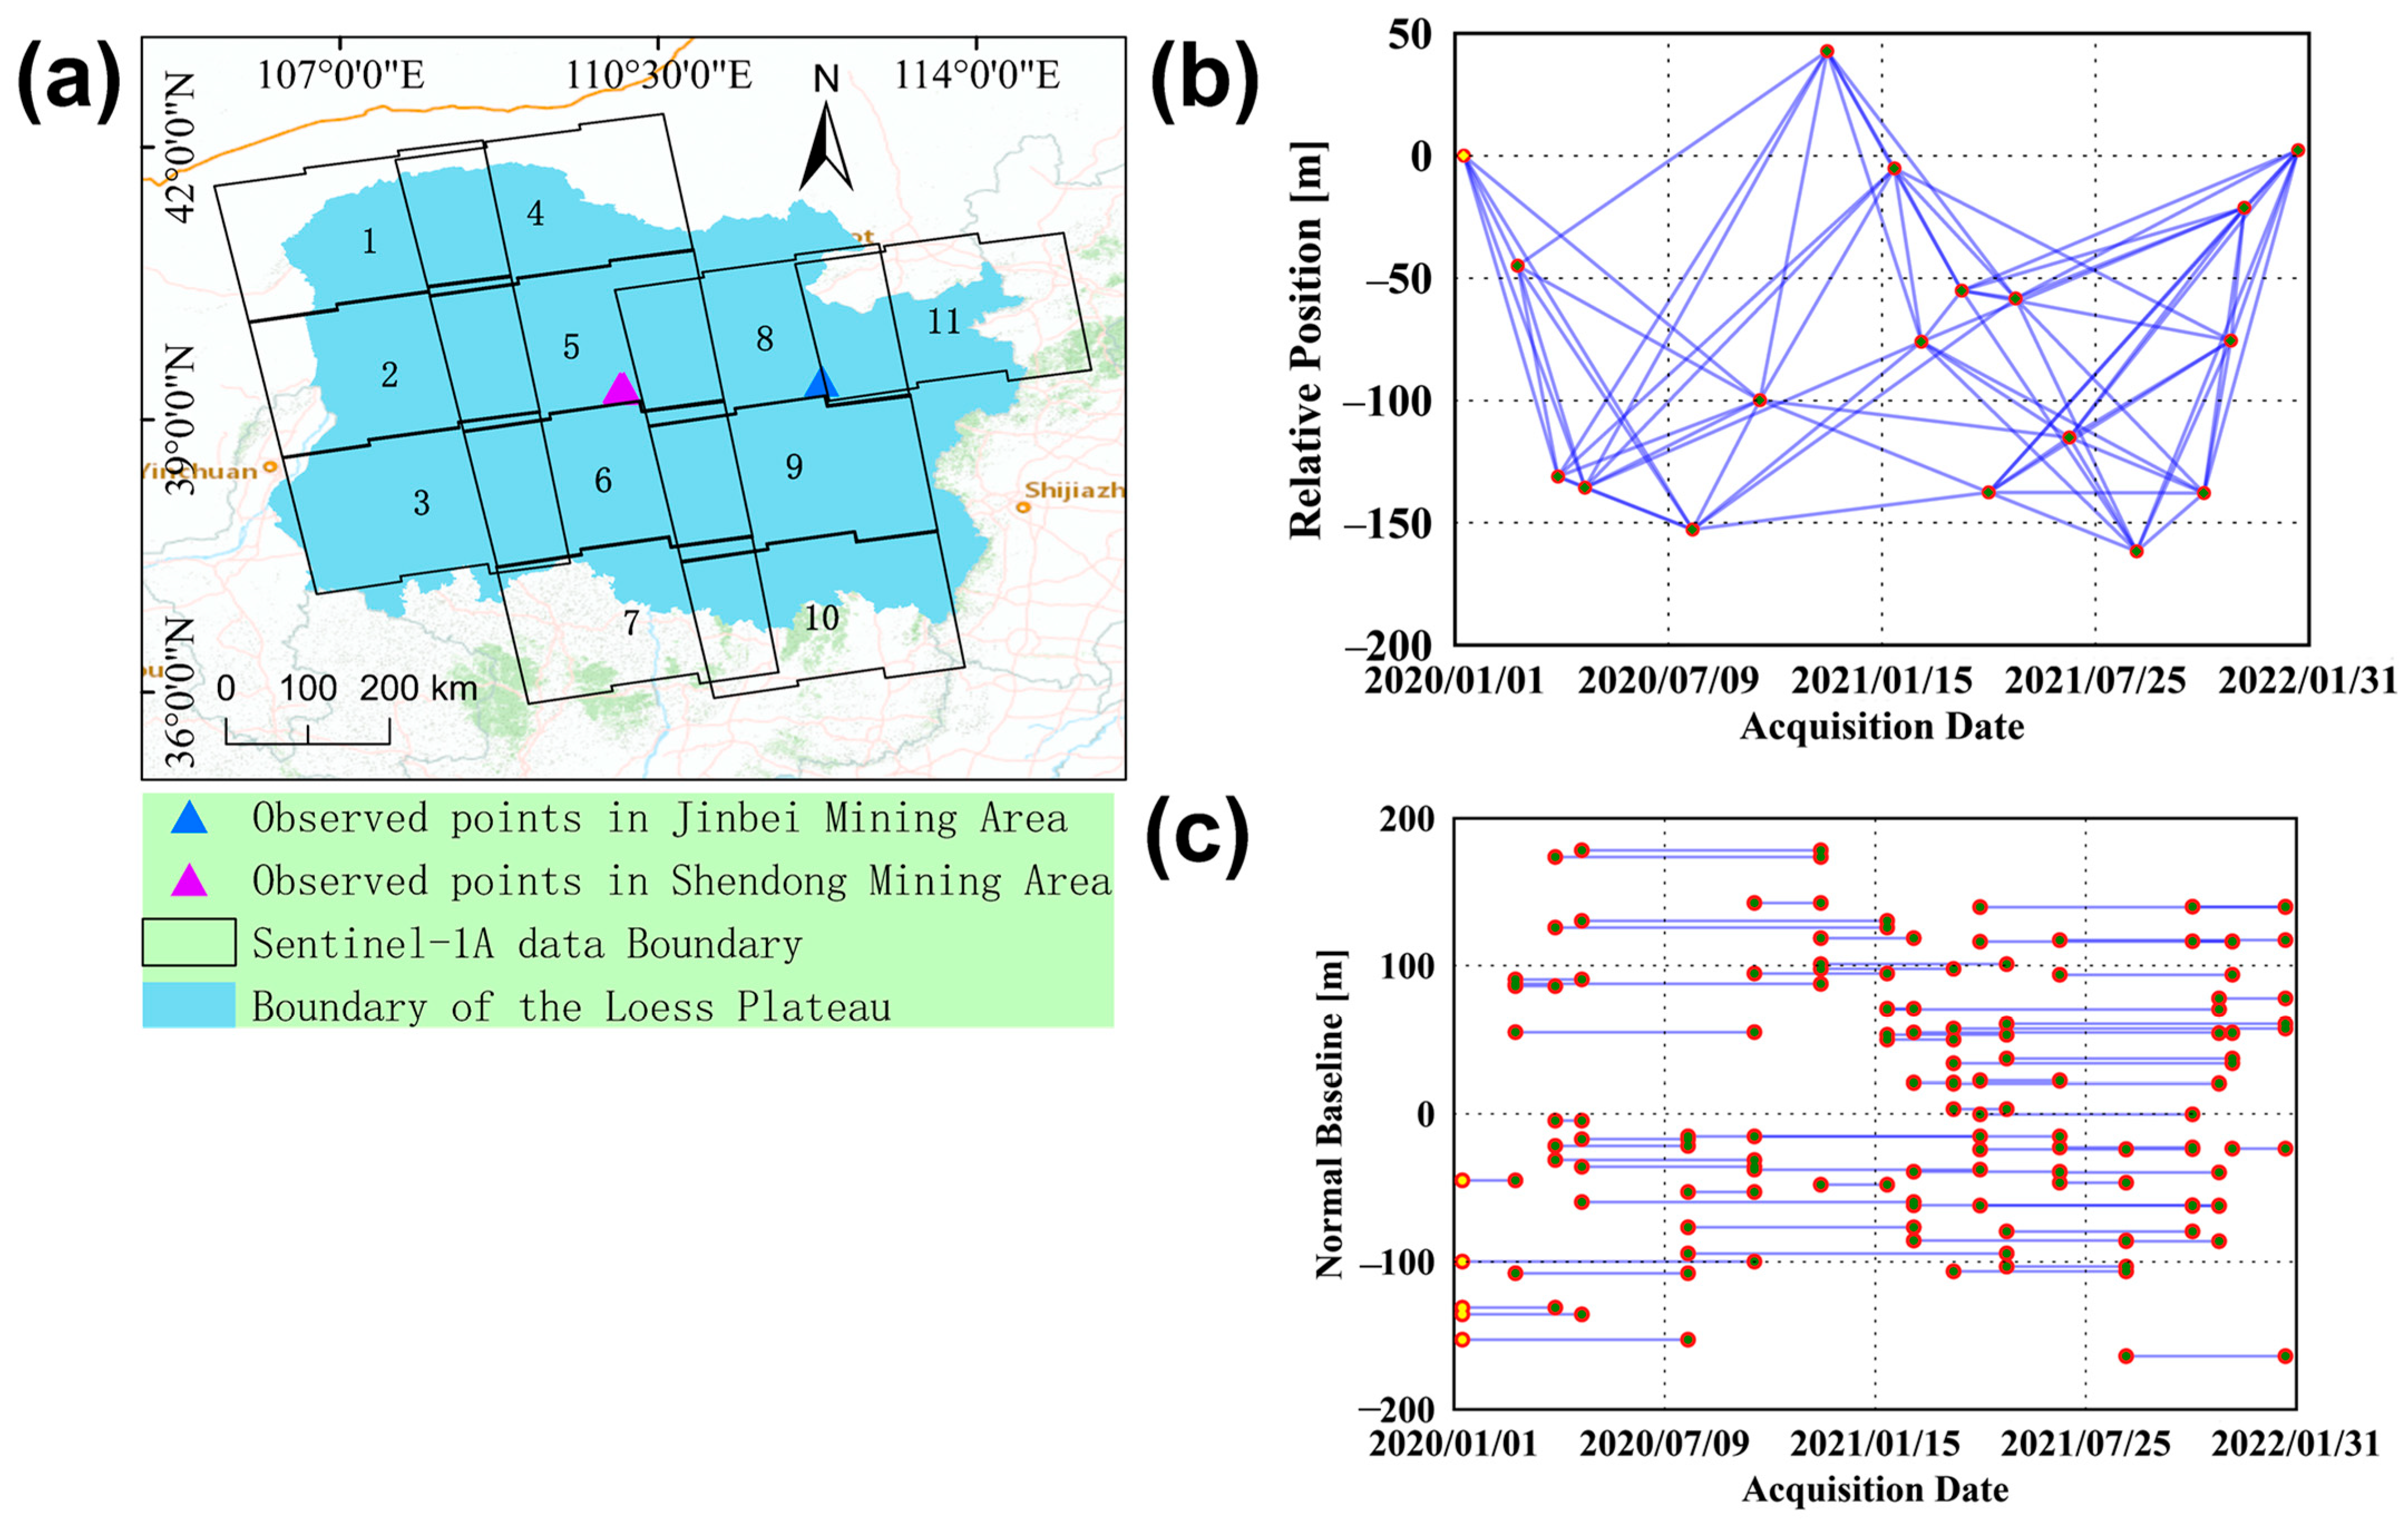
2.2. Data
2.2.1. Experimental Data
2.2.2. Measured Verification Data
2.3. Method
2.3.1. SBAS-InSA Technology
2.3.2. Weighted Downscaling
2.3.3. Changes in Groundwater Reserves
2.3.4. Verification of Groundwater Storage Change
2.3.5. Data Processing of Surface Deformation and Groundwater Storage Change
3. Results and Analysis
3.1. Surface Deformation Verification and Feature Analysis
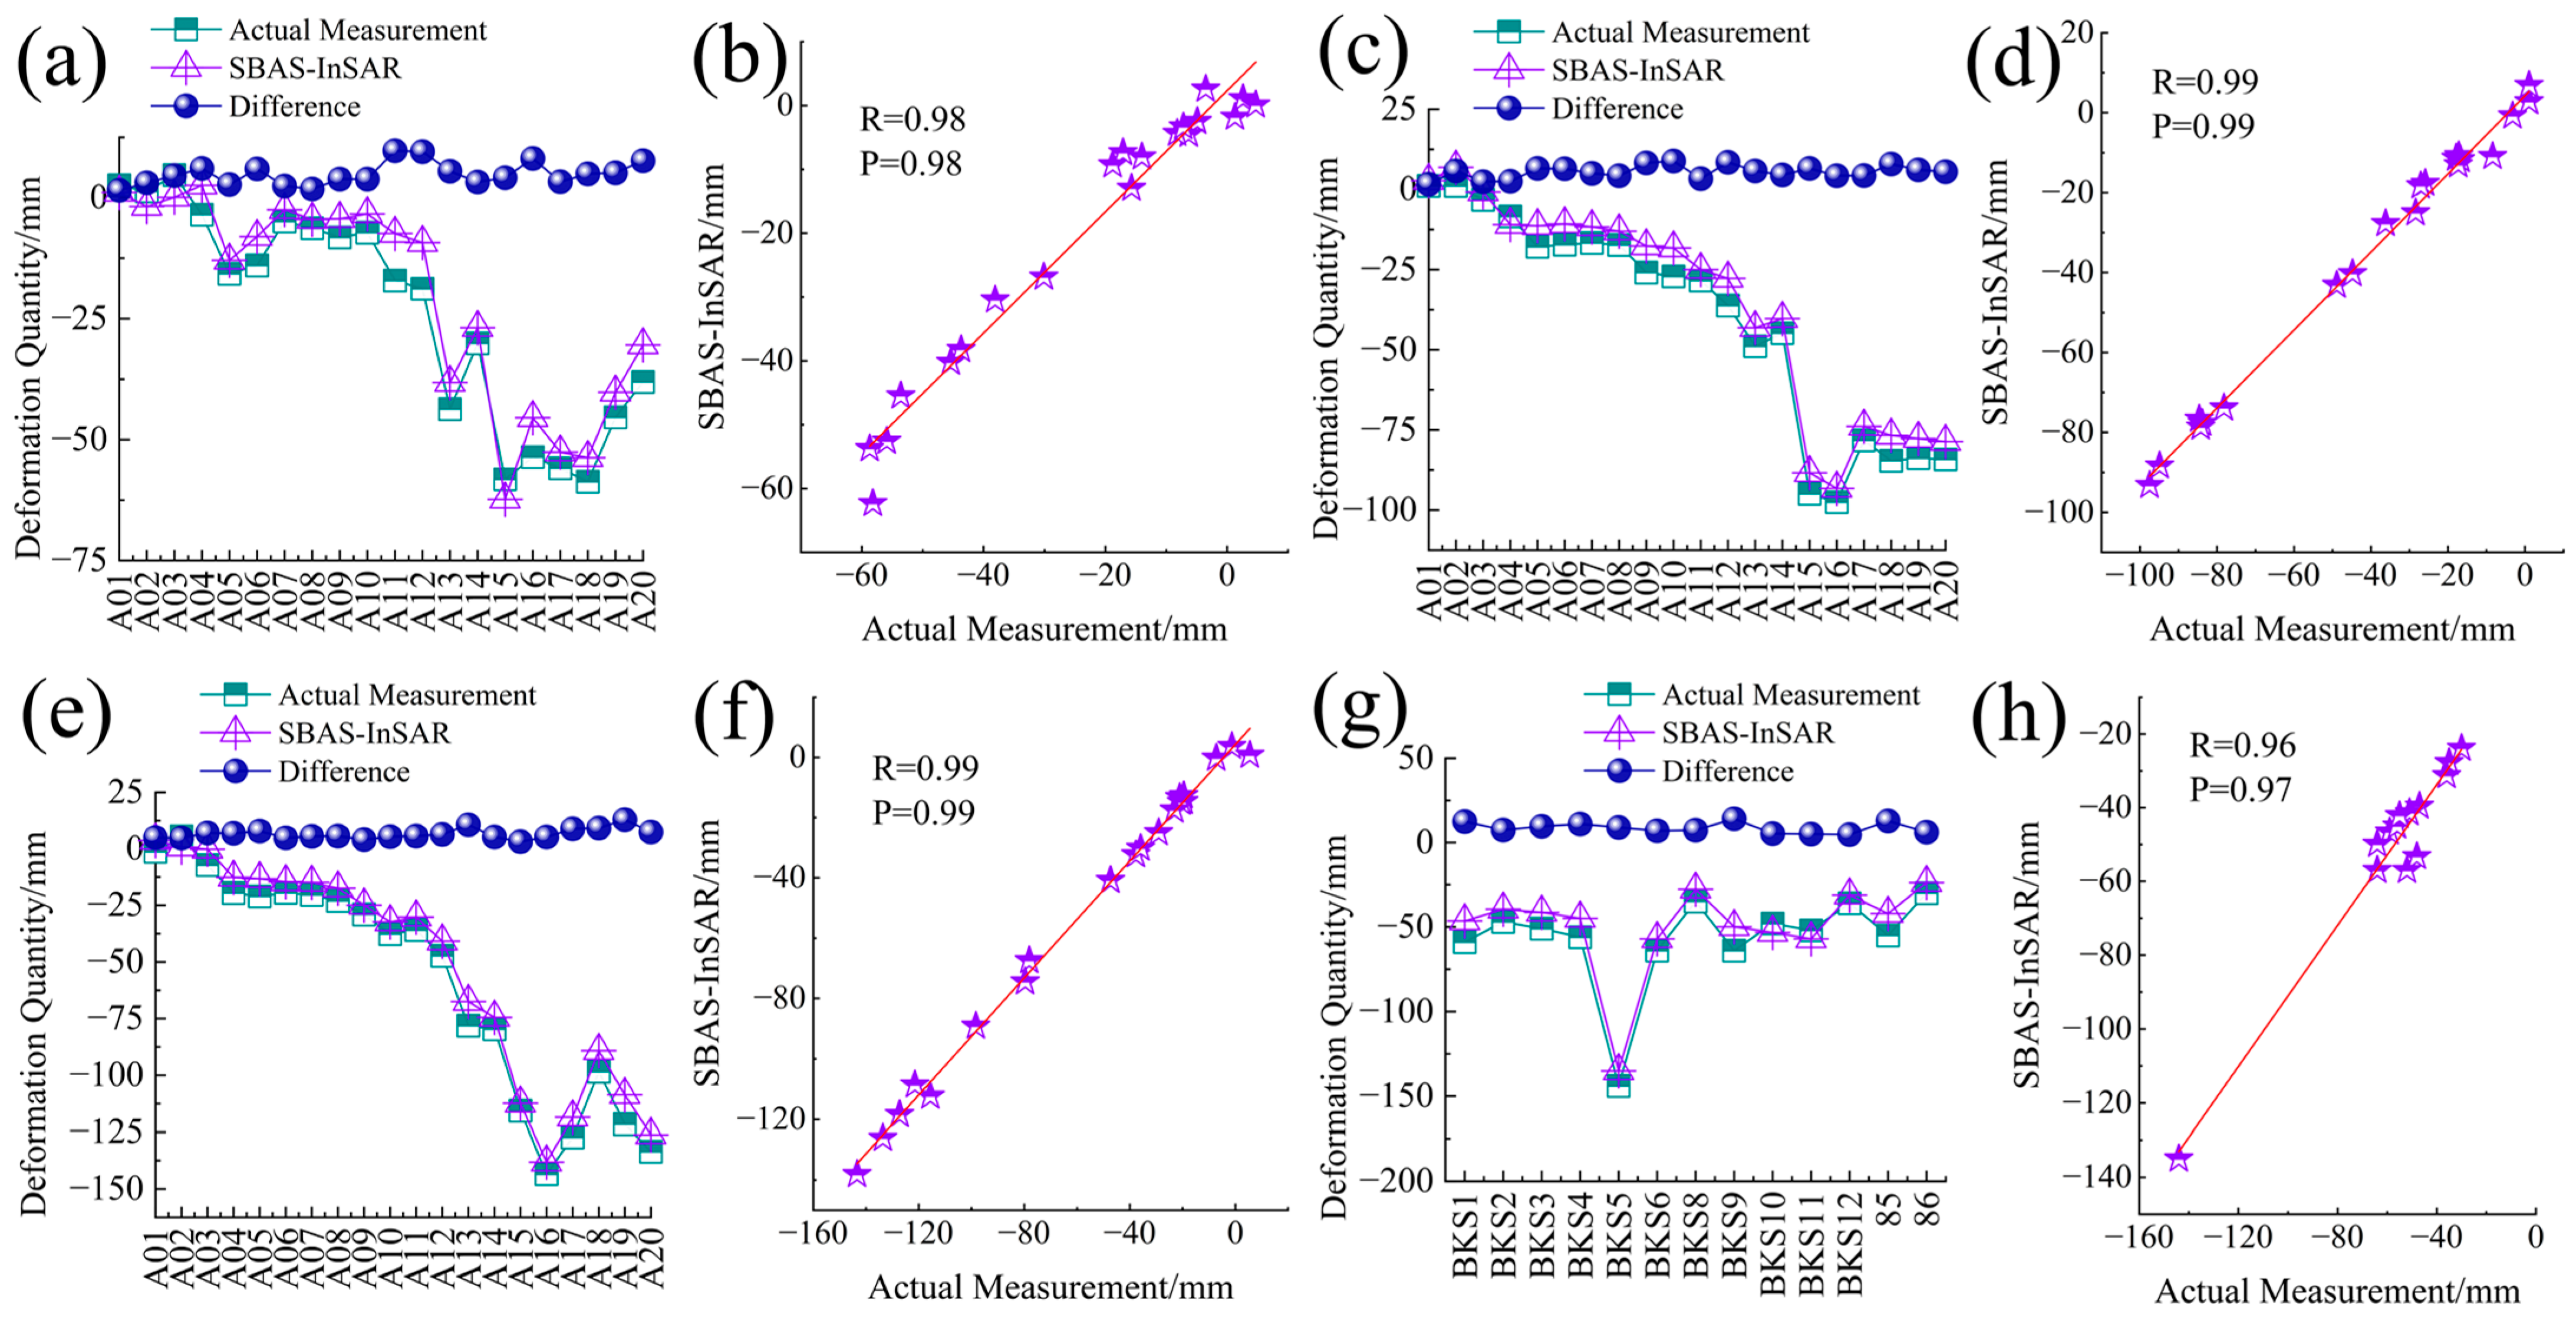
3.1.1. Surface Deformation Verification
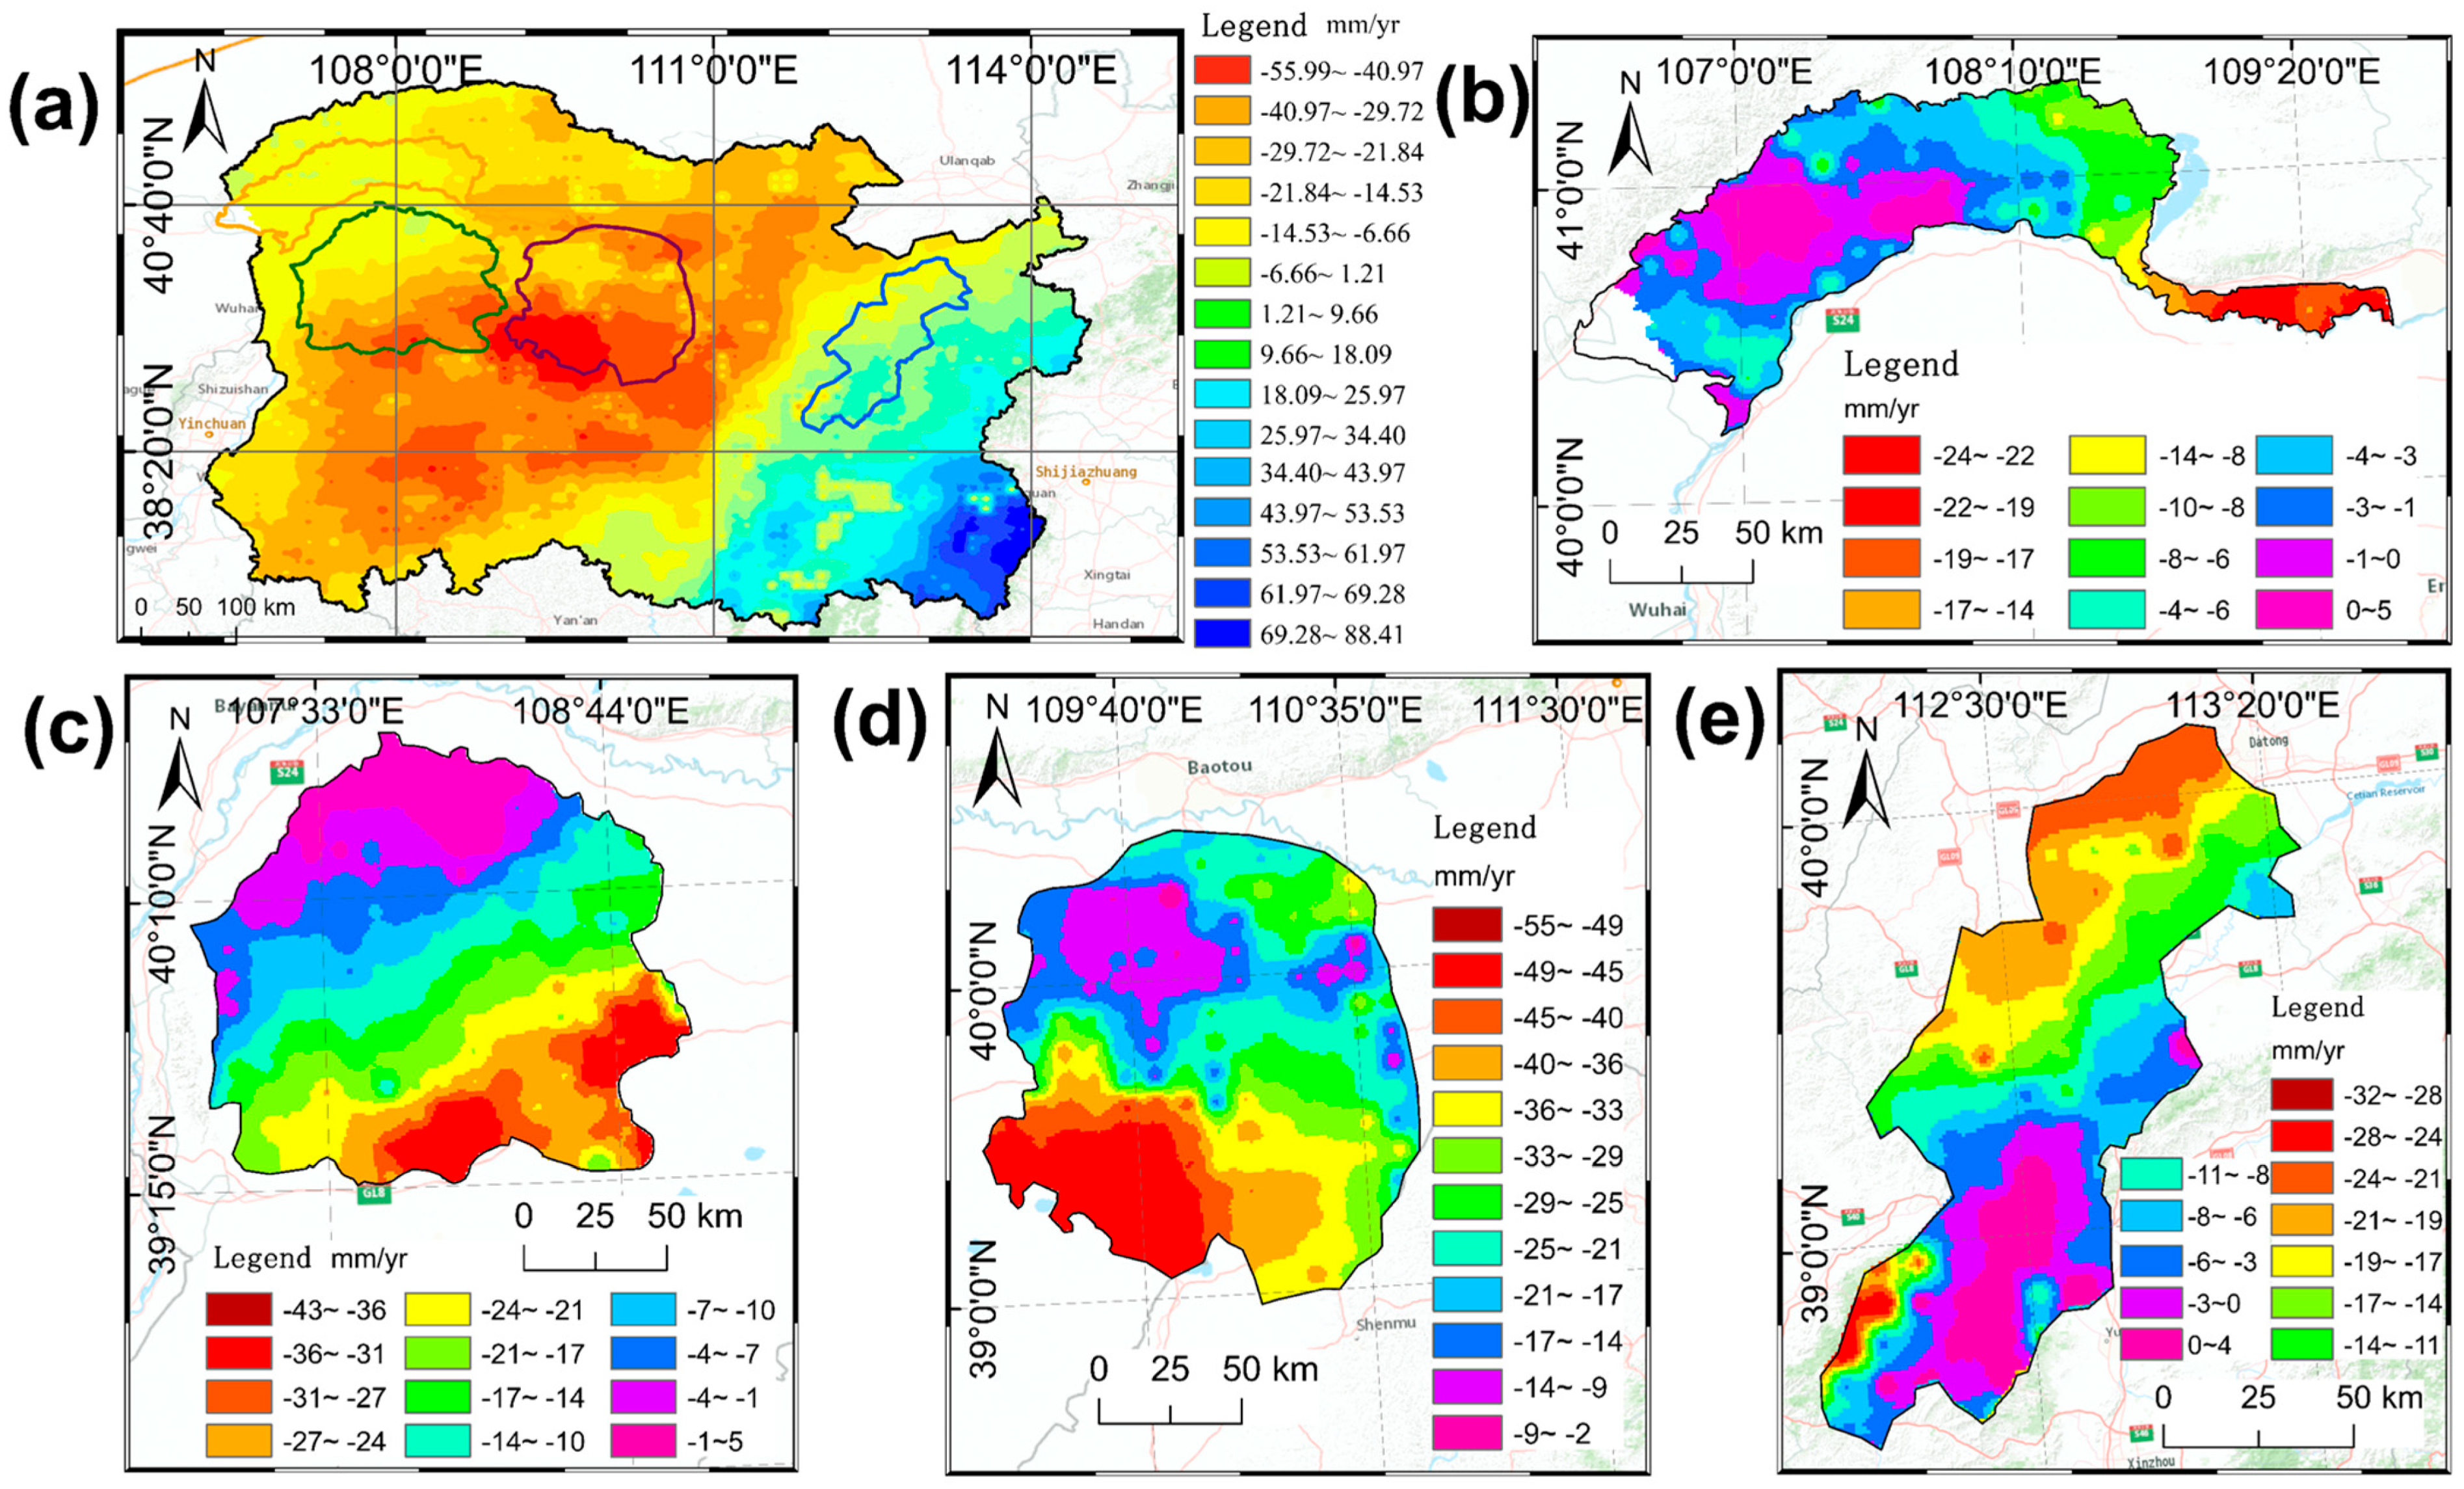
3.1.2. Analysis of Surface Deformation
3.2. Validation and Analysis of Groundwater Storage Change
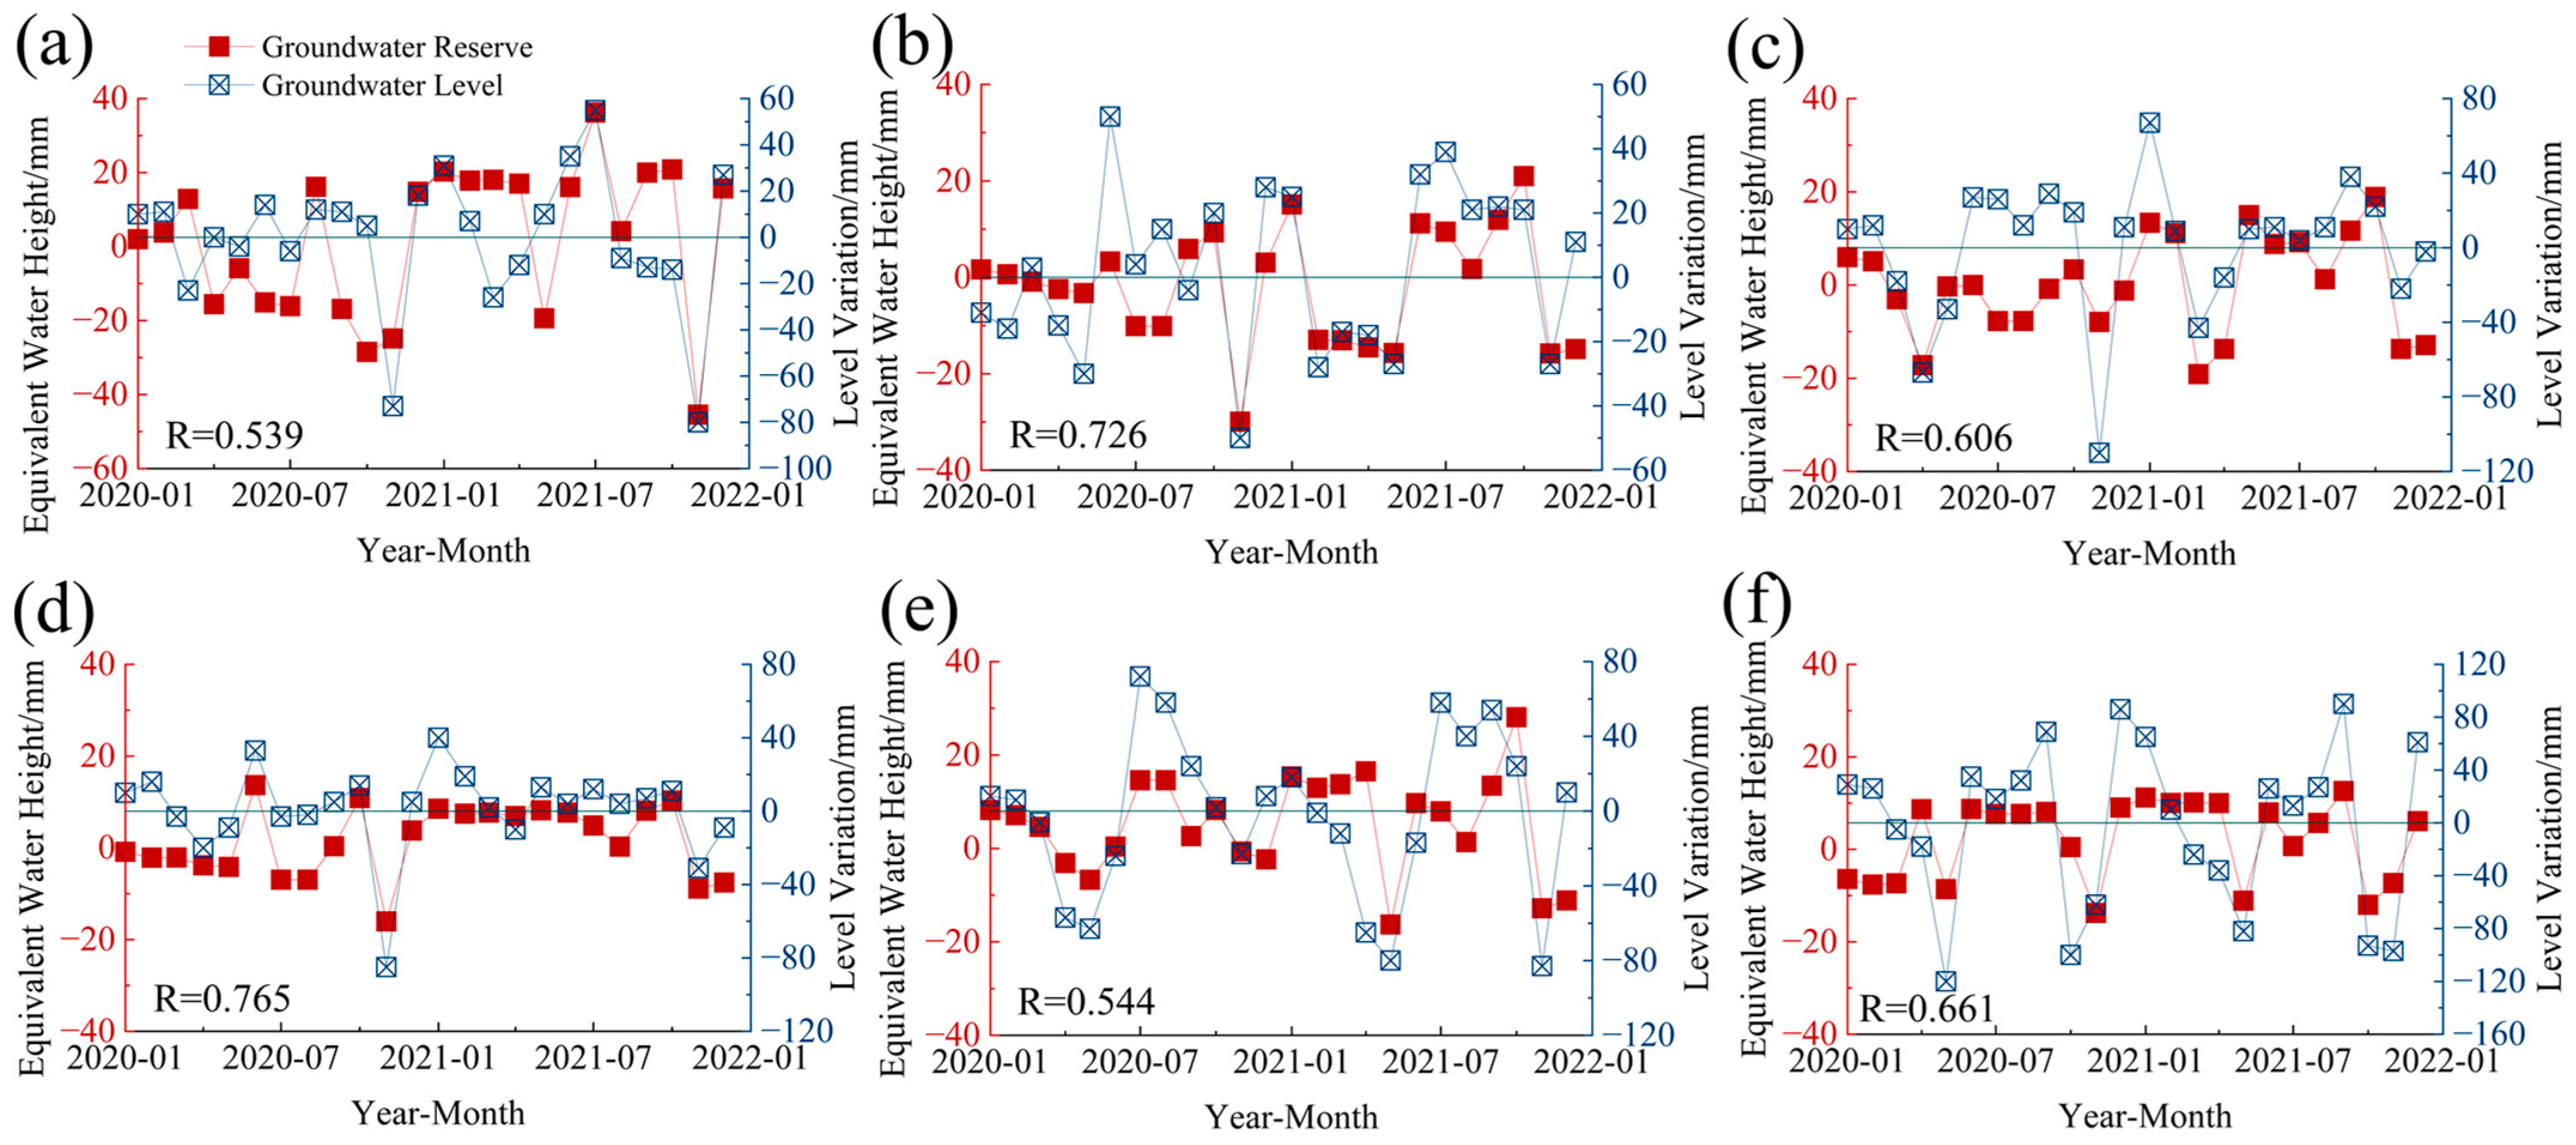
3.2.1. Validation of Groundwater Storage Change
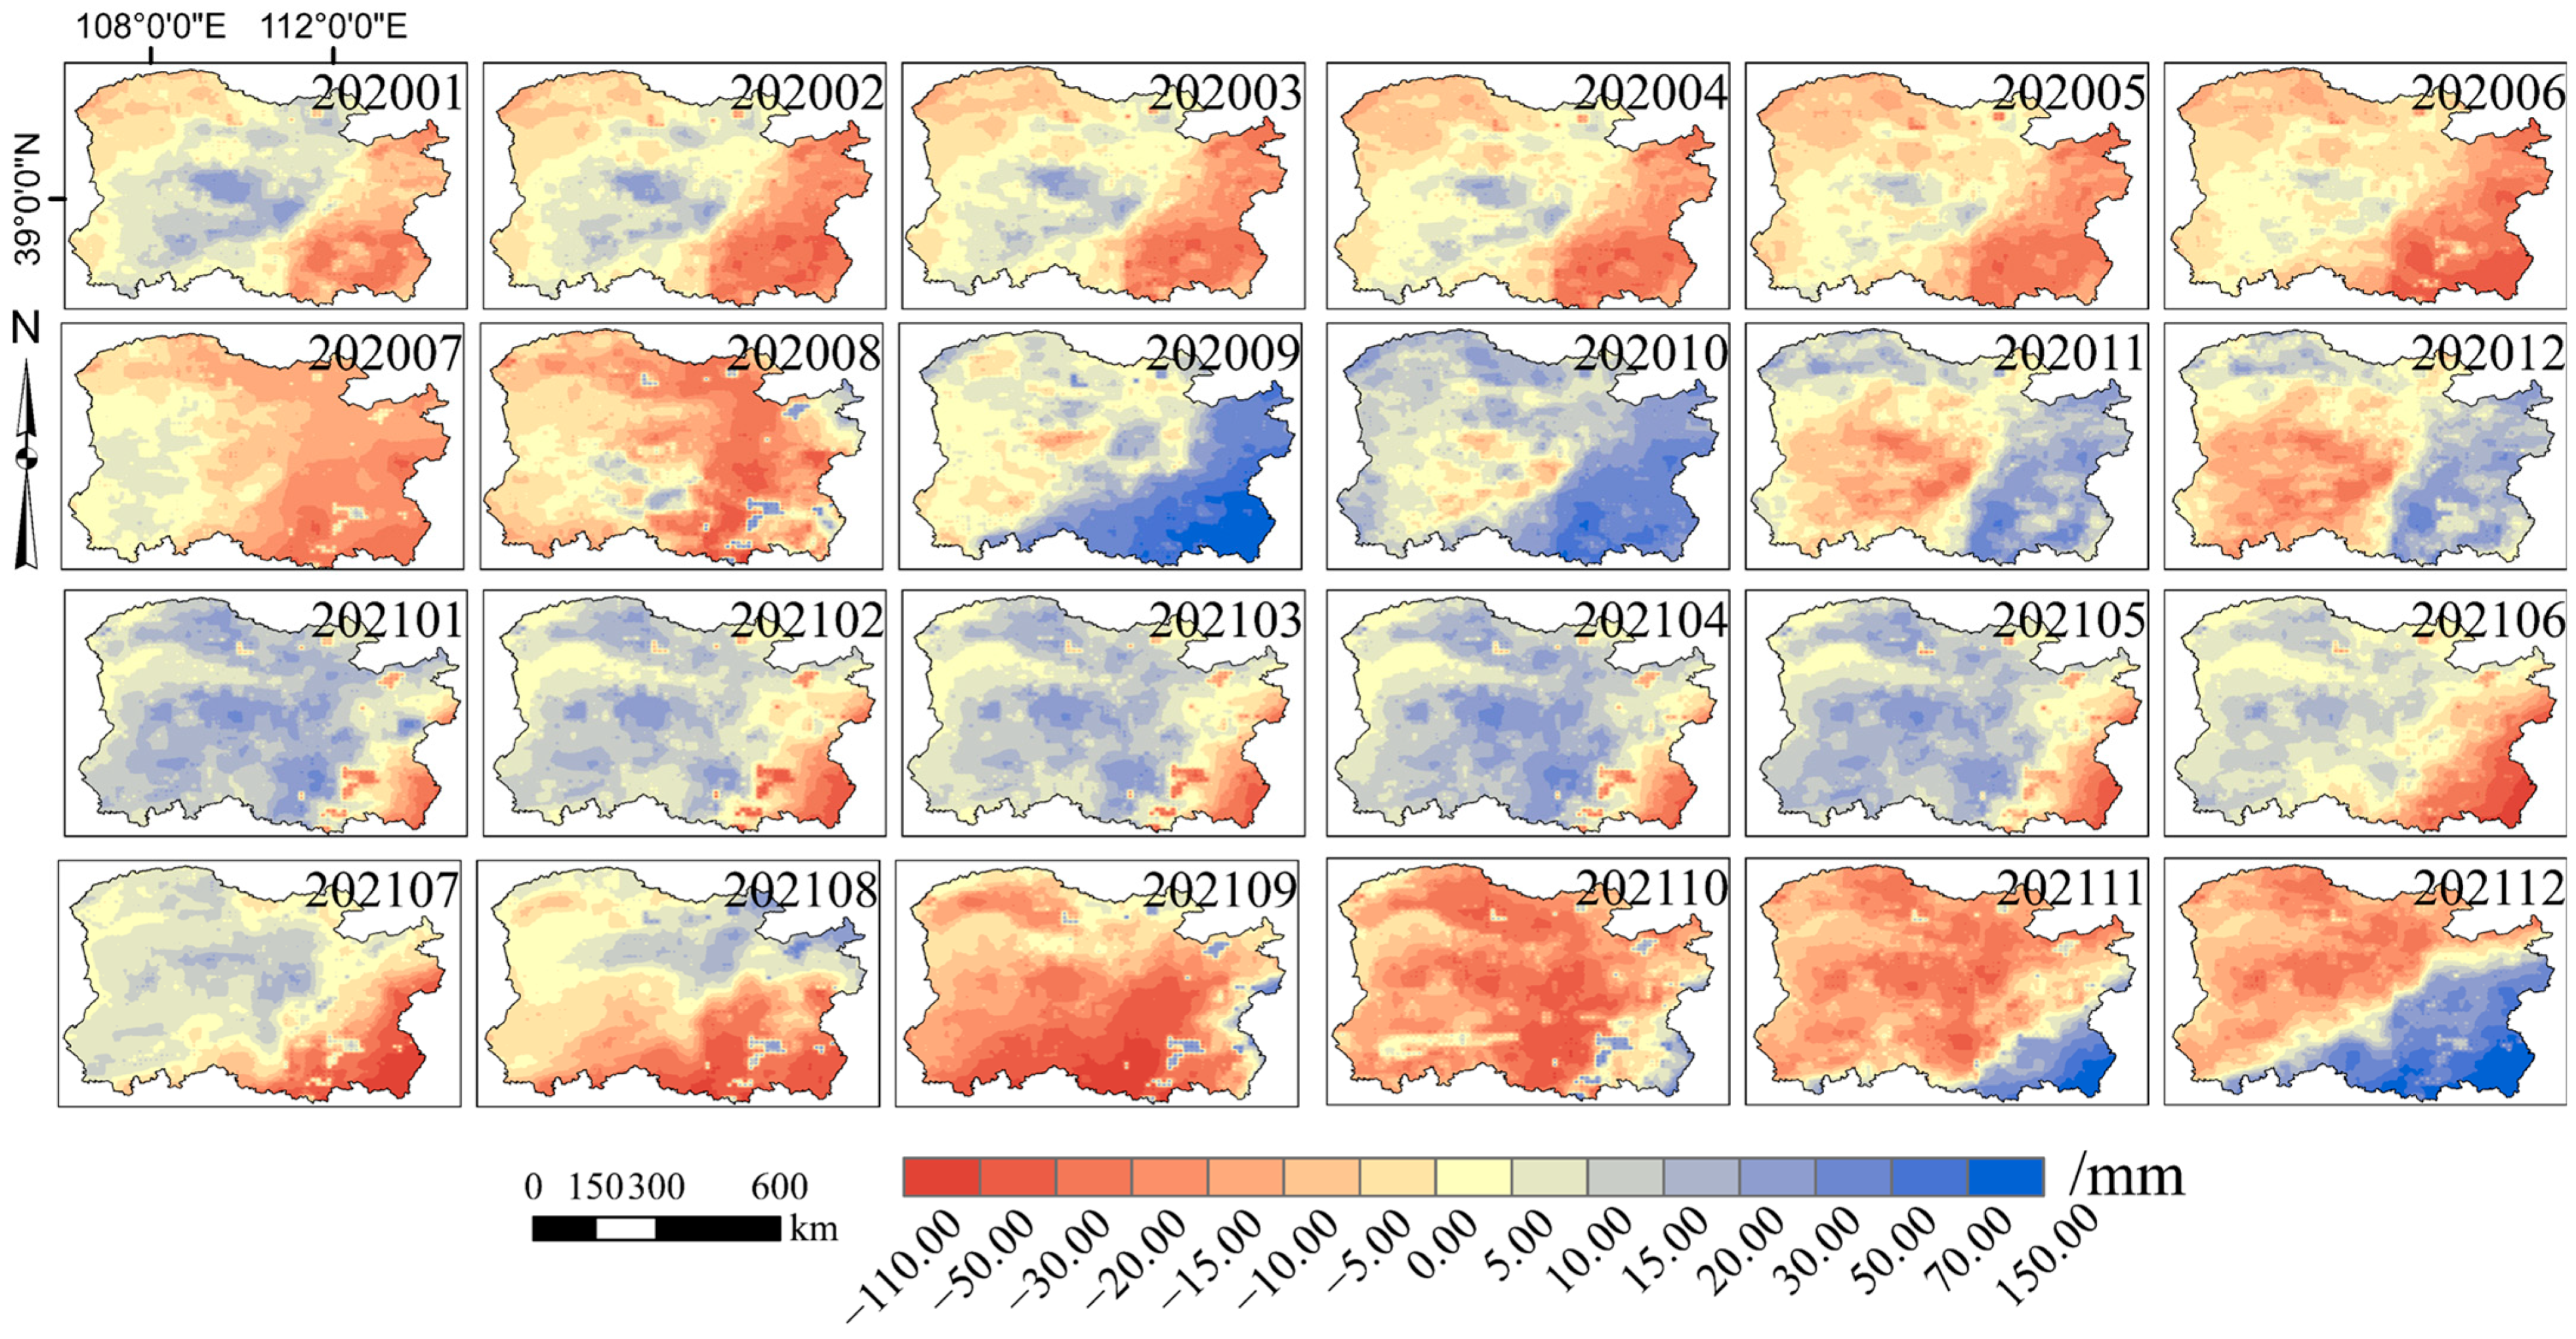
3.2.2. Analysis of Groundwater Storage Variation
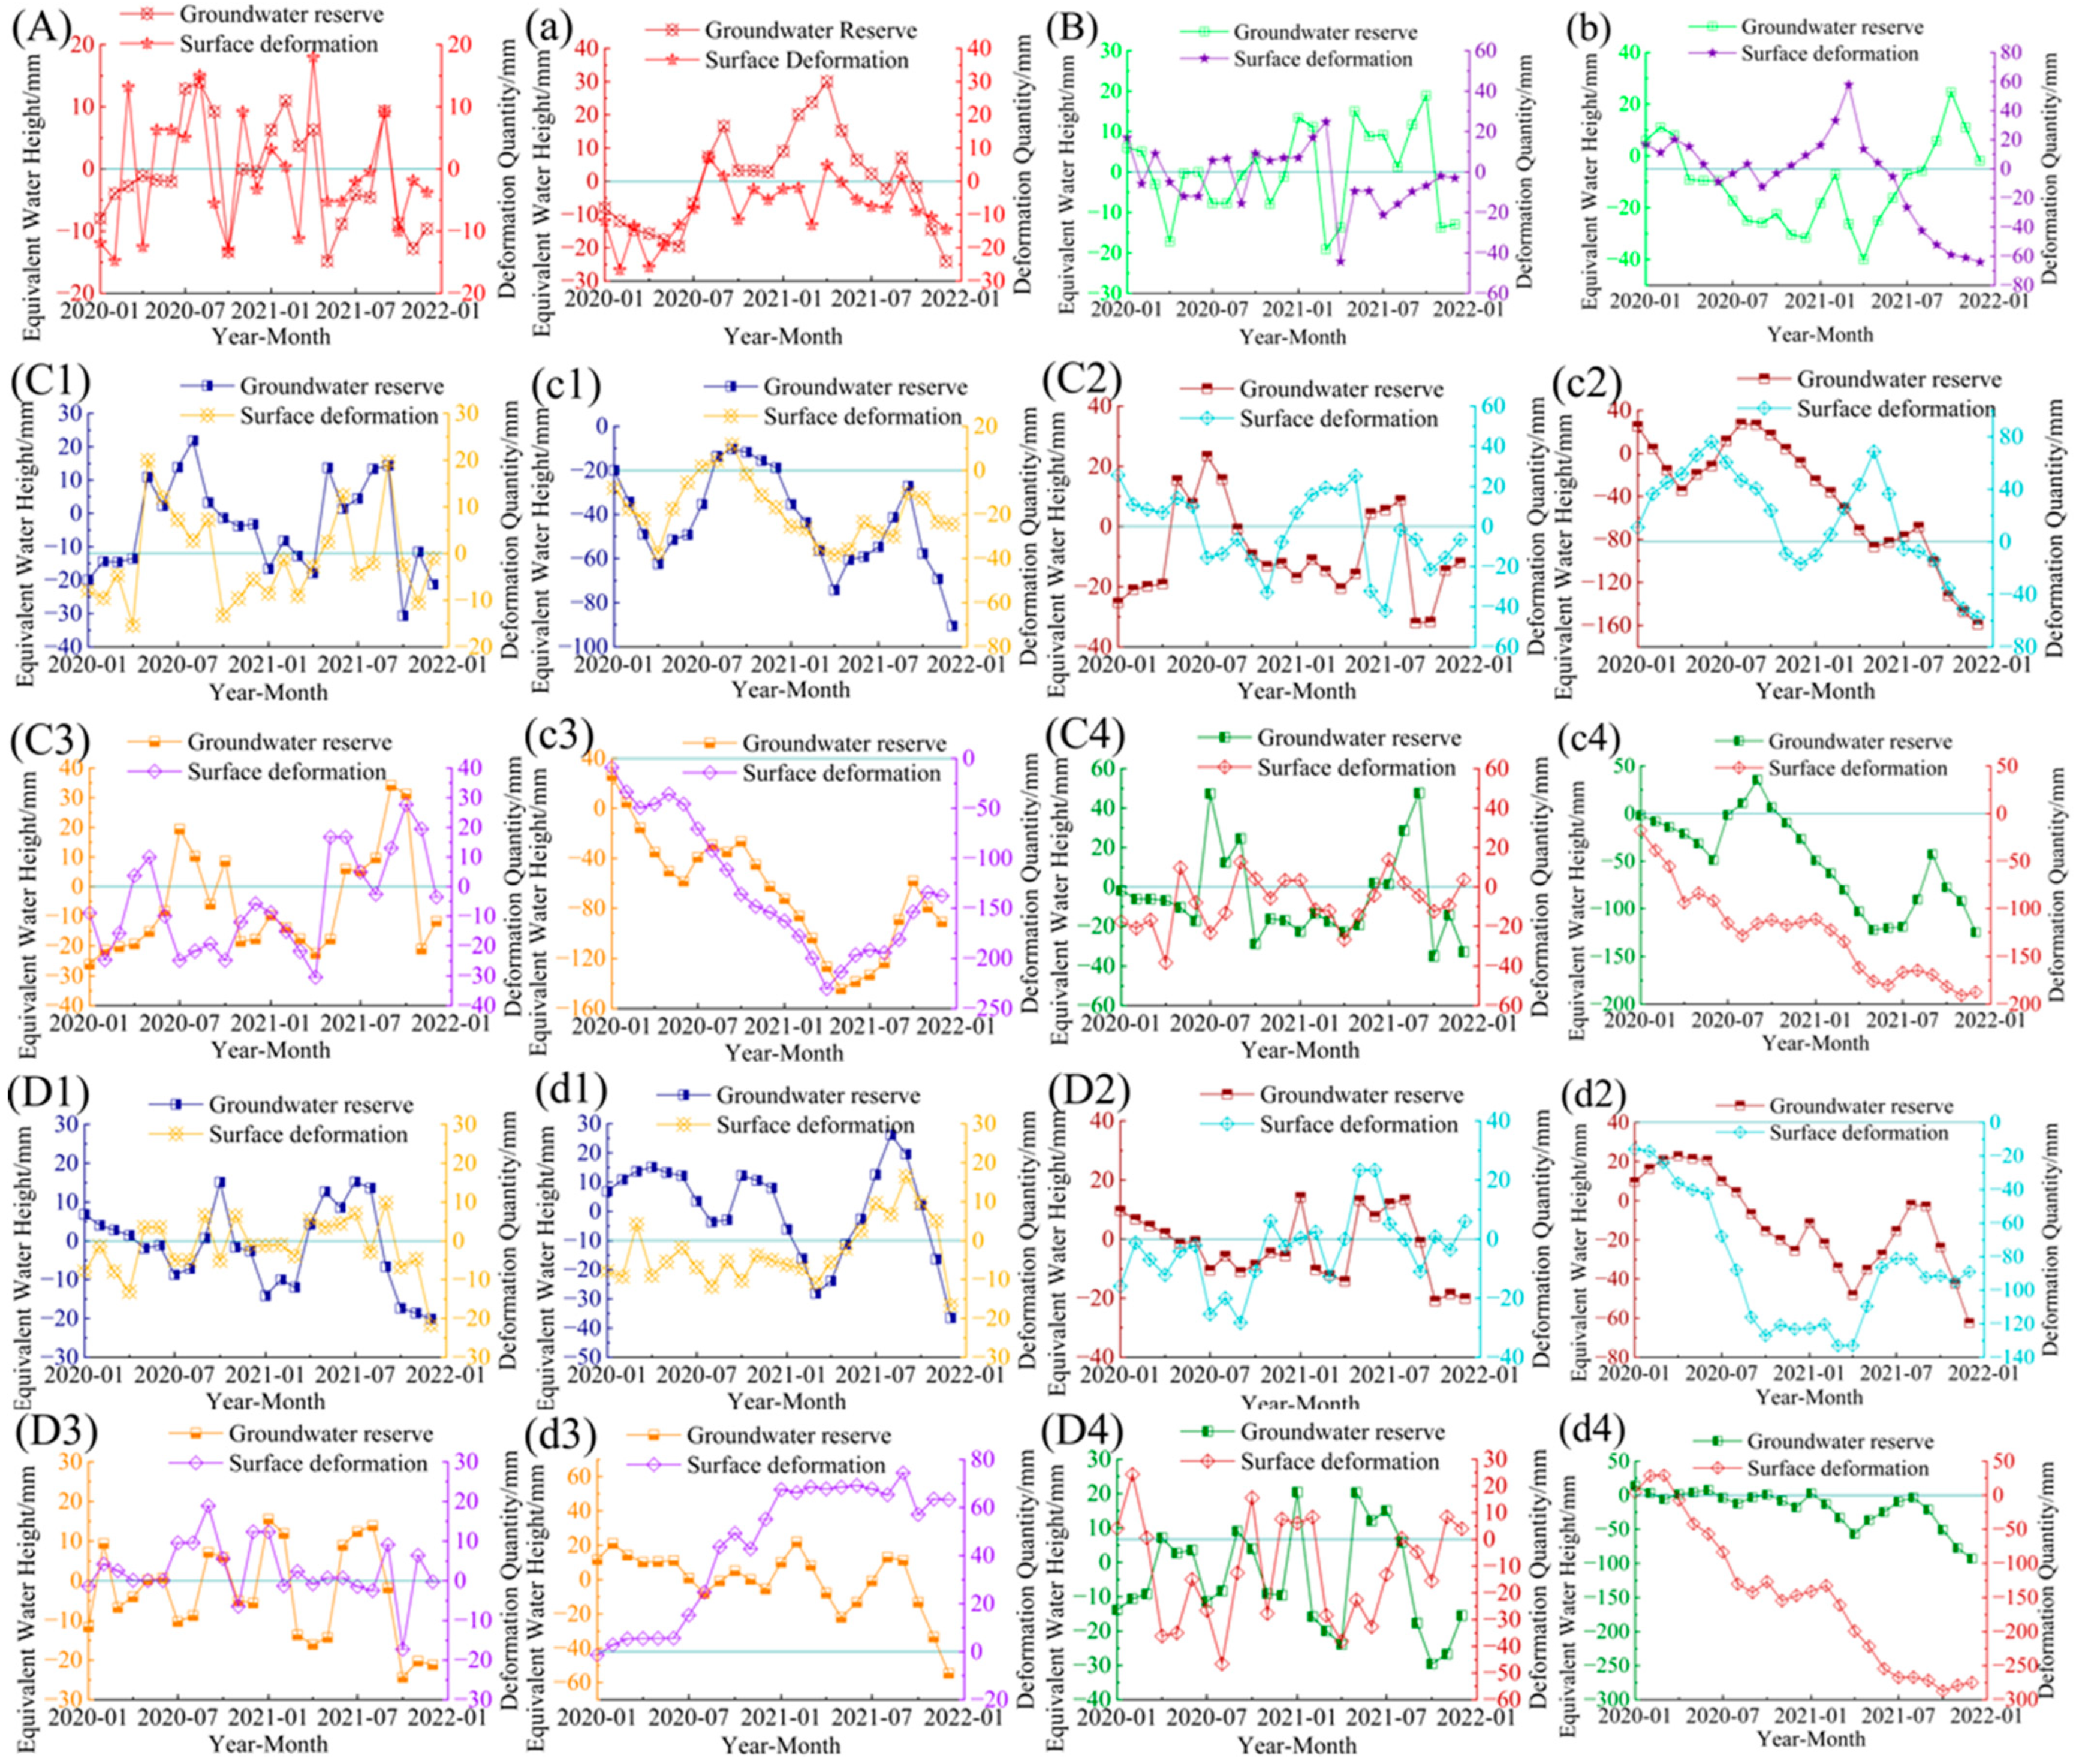
3.3. Analysis of the Associations between Surface Deformation and Groundwater Storage Change
4. Discussion
4.1. Associations between Surface Deformation and Groundwater Storage Change
4.2. Analysis of Influencing Factors in Surface Deformation and Groundwater Storage Change
4.3. Sources and Analysis of Errors in Surface Deformation and Groundwater Storage Changes
5. Conclusions
Author Contributions
Funding
Data Availability Statement
Acknowledgments
Conflicts of Interest
References
- Zhu, Y.; Jia, X.; Qiao, J.; Shao, M. What is the mass of loess in the Loess Plateau of China? Sci. Bull. 2019, 64, 534–539. [Google Scholar] [CrossRef] [PubMed]
- Ye, J.W.; Wu, H.Y.; Fu, M.J.; Zhang, P.; Tian, B. Insights Into the Significance of the Chinense Loess Plateau for Preserving Biodiversity From the Phylogeography of Speranskia tuberculata (Euphorbiaceae). Front. Plant Sci. 2021, 12, 604251. [Google Scholar] [CrossRef]
- Zhang, D.; Yang, Y.; Li, M.; Lu, Y.; Liu, Y.; Jiang, J.; Liu, R.; Liu, J.; Huang, X.; Li, G.; et al. Ecological Barrier Deterioration Driven by Human Activities Poses Fatal Threats to Public Health due to Emerging Infectious Diseases. Engineering 2022, 10, 155–166. [Google Scholar] [CrossRef] [PubMed]
- Hao, K.; Fei, L.; Liu, L.; Jie, F.; Peng, Y.; Liu, X.; Khan, S.A.; Wang, D.; Wang, X. Comprehensive Evaluation on the Yield, Quality, and Water-Nitrogen Use Efficiency of Mountain Apple Under Surge-Root Irrigation in the Loess Plateau Based on the Improved TOPSIS Method. Front. Plant Sci. 2022, 13, 853546. [Google Scholar] [CrossRef]
- Cao, Y.; Zhu, H.; Bi, R.; Jin, Y. Spatial and temporal characteristics of surface soil moisture in a disturbed coal mining area of Chinese Loess Plateau. PLoS ONE 2022, 17, e0265837. [Google Scholar] [CrossRef]
- Zhang, L.; Wang, Q.; Wei, Y.; He, M.; Dong, J.; Tian, H.; Gao, Z. Evaluating soil-water conserving performance of land management strategies for spoil tips on the Chinese Loess Plateau. J. Environ. Manag. 2022, 319, 115701. [Google Scholar] [CrossRef]
- Wang, C.; Wang, S.; Fu, B.; Lü, Y.; Liu, Y.; Wu, X. Integrating vegetation suitability in sustainable revegetation for the Loess Plateau, China. Sci. Total. Environ. 2021, 759, 143572. [Google Scholar] [CrossRef]
- Li, P.; Chen, J.; Zhao, G.; Holden, J.; Liu, B.; Chan, F.K.S.; Hu, J.; Wu, P.; Mu, X. Determining the drivers and rates of soil erosion on the Loess Plateau since 1901. Sci. Total Environ. 2022, 823, 153674. [Google Scholar] [CrossRef]
- Qin, Z.; Liu, X.; Lu, X.; Li, M.; Li, F. Grain Production Space Reconstruction and Its Influencing Factors in the Loess Plateau. Int. J. Environ. Res. Public Health 2022, 19, 5876. [Google Scholar] [CrossRef]
- Zhao, G.; Kong, L.; Li, Y.; Xu, Y.; Li, Z. Investigating Historical Baseflow Characteristics and Variations in the Upper Yellow River Basin, China. Int. J. Environ. Res. Public Health 2022, 19, 9267. [Google Scholar] [CrossRef]
- Luo, Z.; Ma, J.; Chen, F.; Li, X.; Hou, H.; Zhang, S. Cracks Reinforce the Interactions among Soil Bacterial Communities in the Coal Mining Area of Loess Plateau, China. Int. J. Environ. Res. Public Health 2019, 16, 4892. [Google Scholar] [CrossRef]
- Lee, Z.; Churnside, J.; Mao, Z.; Wu, S.; Zibordi, G. Active and passive optical remote sensing of the aquatic environment: Introduction to the feature issue. Appl. Opt. 2020, 59, APS1–APS2. [Google Scholar] [CrossRef] [PubMed]
- Yuan, Y.; Wen, X.; Yuan, B.; Xin, H.; Fang, B.; Yang, S.; Xiong, K. Photoacoustic remote sensing elastography. Opt. Lett. 2023, 48, 2321–2324. [Google Scholar] [CrossRef]
- Zhang, Z.; Hu, C.; Wu, Z.; Zhang, Z.; Yang, S.; Yang, W. Monitoring and analysis of ground subsidence in Shanghai based on PS-InSAR and SBAS-InSAR technologies. Sci. Rep. 2023, 13, 8031. [Google Scholar] [CrossRef] [PubMed]
- Wang, J.; Li, C.; Li, L.; Huang, Z.; Wang, C.; Zhang, H.; Zhang, Z. InSAR time-series deformation forecasting surrounding Salt Lake using deep transformer models. Sci. Total Environ. 2023, 858 Pt 2, 159744. [Google Scholar] [CrossRef] [PubMed]
- Wang, X.; Feng, G.; He, L.; An, Q.; Xiong, Z.; Lu, H.; Wang, W.; Li, N.; Zhao, Y.; Wang, Y.; et al. Evaluating Urban Building Damage of 2023 Kahramanmaras, Turkey Earthquake Sequence Using SAR Change Detection. Sensors 2023, 23, 6342. [Google Scholar] [CrossRef]
- Xiao, B.; Zhao, J.; Li, D.; Zhao, Z.; Zhou, D.; Xi, W.; Li, Y. Combined SBAS-InSAR and PSO-RF Algorithm for Evaluating the Susceptibility Prediction of Landslide in Complex Mountainous Area: A Case Study of Ludian County, China. Sensors 2022, 22, 8041. [Google Scholar] [CrossRef]
- Chen, J.; Cazenave, A.; Dahle, C.; Llovel, W.; Panet, I.; Pfeffer, J.; Moreira, L. Applications and Challenges of GRACE and GRACE Follow-On Satellite Gravimetry. Surv. Geophys. 2022, 43, 305–345. [Google Scholar] [CrossRef]
- Rawat, S.; Ganapathy, A.; Agarwal, A. Drought characterization over Indian sub-continent using GRACE-based indices. Sci. Rep. 2022, 12, 15432. [Google Scholar] [CrossRef]
- Akana, P.R.; Bateman, J.B.; Vitousek, P.M. Water balance affects foliar and soil nutrients differently. Oecologia 2022, 199, 965–977. [Google Scholar] [CrossRef]
- Menne, D.; Hübner, C.; Trebbels, D.; Willenbacher, N. Robust Soil Water Potential Sensor to Optimize Irrigation in Agriculture. Sensors 2022, 22, 4465. [Google Scholar] [CrossRef]
- Maccario, L.; Sanguino, L.; Vogel, T.M.; Larose, C. Snow and ice ecosystems: Not so extreme. Res. Microbiol. 2015, 166, 782–795. [Google Scholar] [CrossRef]
- Li, Y.; Shang, J.; Zhang, C.; Zhang, W.; Niu, L.; Wang, L.; Zhang, H. The role of freshwater eutrophication in greenhouse gas emissions: A review. Sci. Total Environ. 2021, 768, 144582. [Google Scholar] [CrossRef]
- Wang, L.F.; Chen, J.; Shangguan, Z.P. Yield responses of wheat to mulching practices in dryland farming on the Loess Plateau. PLoS ONE 2015, 10, e0127402. [Google Scholar] [CrossRef]
- Neely, W.R.; Borsa, A.A.; Burney, J.A.; Levy, M.C.; Silverii, F.; Sneed, M. Characterization of Groundwater Recharge and Flow in California’s San Joaquin Valley From InSAR-Observed Surface Deformation. Water Resour. Res. 2021, 57, e2020WR028451. [Google Scholar] [CrossRef] [PubMed]
- El Kamali, M.; Saibi, H.; Abuelgasim, A. Land surface deformation monitoring in the Al-Ain arid region (UAE) using microgravity and SAR interferometry surveys. Environ. Res. 2022, 212 Pt D, 113505. [Google Scholar] [CrossRef]
- Yang, J.; Cao, G.; Han, D.; Yuan, H.; Hu, Y.; Shi, P.; Chen, Y. Deformation of the aquifer system under groundwater level fluctuations and its implication for land subsidence control in the Tianjin coastal region. Environ. Monit. Assess. 2019, 191, 162. [Google Scholar] [CrossRef] [PubMed]
- Zheng, M.; Deng, K.; Fan, H.; Du, S. Monitoring and Analysis of Surface Deformation in Mining Area Based on InSAR and GRACE. Remote Sens. 2018, 10, 1392. [Google Scholar] [CrossRef]
- Vishwakarma, B.D.; Zhang, J.; Sneeuw, N. Downscaling GRACE total water storage change using partial least squares regression. Sci. Data 2021, 8, 95. [Google Scholar] [CrossRef] [PubMed]
- Agarwal, V.; Akyilmaz, O.; Shum, C.K.; Feng, W.; Yang, T.Y.; Forootan, E.; Syed, T.H.; Haritashya, U.K.; Uz, M. Machine learning based downscaling of GRACE-estimated groundwater in Central Valley, California. Sci. Total Environ. 2023, 865, 161138. [Google Scholar] [CrossRef] [PubMed]
- Xue, D.; Gui, D.; Ci, M.; Liu, Q.; Wei, G.; Liu, Y. Spatial and temporal downscaling schemes to reconstruct high-resolution GRACE data: A case study in the Tarim River Basin, Northwest China. Sci. Total Environ. 2024, 907, 167908. [Google Scholar] [CrossRef]
- Du, H.; Xue, X.; Wang, T. Estimation of saltation emission in the Kubuqi Desert, North China. Sci. Total Environ. 2014, 479–480, 77–92. [Google Scholar] [CrossRef]
- Liu, J.; Sun, S.; Wu, P.; Wang, Y.; Zhao, X. Evaluation of crop production, trade, and consumption from the perspective of water resources: A case study of the Hetao irrigation district, China, for 1960–2010. Sci. Total Environ. 2015, 505, 1174–1181. [Google Scholar] [CrossRef]
- Shao, J.H.; Li, J.; Yan, X.G.; Ma, T.Y.; Zhang, R. Analysis of Spatiotemporal Variation Characteristics and Driving Forces of NPP in Shanxi Province from 2000 to 2020 Based on Geodetector. Huan Jing Ke Xue 2023, 44, 312–322. (In Chinese) [Google Scholar] [CrossRef]
- Yang, Z.; Shen, Y.; Jiang, H.; Feng, F.; Dong, Q. Assessment of the environmental changes in arid and semiarid mining areas using long time-series Landsat images. Environ. Sci. Pollut. Res. Int. 2021, 28, 52147–52156. [Google Scholar] [CrossRef]
- Guo, X.; Wang, P.; Wang, X.; Li, Y.; Ji, B. Specific Plant Mycorrhizal Responses Are Linked to Mycorrhizal Fungal Species Interactions. Front. Plant Sci. 2022, 13, 930069. [Google Scholar] [CrossRef]
- Chen, Y.; Zhao, N.; Hao, Y.; Li, X.; Fan, M.; Shi, X.; Jia, L. Optimizing nutrient inputs by balancing spring wheat yield and environmental effects in the Hetao Irrigation District of China. Sci. Rep. 2022, 12, 22524. [Google Scholar] [CrossRef] [PubMed]
- Li, L.; Li, T.; Meng, H.; Xie, Y.; Zhang, J.; Hong, J. Effects of Seven-Year Fertilization Reclamation on Bacterial Community in a Coal Mining Subsidence Area in Shanxi, China. Int. J. Environ. Res. Public Health 2021, 18, 12504. [Google Scholar] [CrossRef] [PubMed]
- Ma, L.; Du, X.; Wang, F.; Liang, J. Water-preserved mining technology for shallow buried coal seam in ecologically-vulnerable coal field: A case study in the Shendong Coal field of China. Disaster Adv. 2013, 6, 268–278. [Google Scholar]
- Chen, D.; Nie, W.; Xiu, Z.; Yang, B.; Du, T.; Liu, Q.; Peng, H. Research on environmental dust pollution: Ventilation and dust space-time evolution law of a fully mechanized mining face with 7-m mining height. Environ. Sci. Pollut. Res. Int. 2022, 29, 33627–33644. [Google Scholar] [CrossRef] [PubMed]
- Save, H. CSR GRACE and GRACE-FOR L06 Mascon Solutions v02. 2020. Available online: https://www2.csr.utexas.edu/grace/RL06_mascons.html (accessed on 15 December 2023).
- Fatolazadeh, F.; Goïta, K. Mapping terrestrial water storage changes in Canada using GRACE and GRACE-FO. Sci. Total Environ. 2021, 779, 146435. [Google Scholar] [CrossRef]
- McNally, A.; Arsenault, K.; Kumar, S.; Shukla, S.; Peterson, P.; Wang, S.; Funk, C.; Peters-Lidard, C.D.; Verdin, J.P. A land data assimilation system for sub-Saharan Africa food and water security applications. Sci. Data 2017, 4, 170012. [Google Scholar] [CrossRef]
- Rodell, M.; Houser, P.R.; Jambor, U.; Gottschalck, J.; Mitchell, K.; Meng, C.-J.; Arsenault, K.; Cosgrove, B.; Radakovich, J.; Bosilovich, M.; et al. The global land data as simulation system. Bull. Am. Meteorol. Soc. 2004, 85, 381–394. [Google Scholar] [CrossRef]
- Berardino, P.; Fornaro, G.; Lanari, R.; Sansosti, E. A new algorithm for surface deformation monitoring based on small baseline differential SAR interferograms. IEEE Trans. Geosci. Remote Sens. 2002, 40, 2375–2383. [Google Scholar] [CrossRef]
- Wang, F.; Tao, Q.; Liu, G.; Chen, Y.; Han, Y.; Guo, Z.; Liu, X. Monitoring of surface deformation in mining area integrating SBAS InSAR and Logistic Function. Environ. Monit. Assess. 2023, 195, 1493. [Google Scholar] [CrossRef]
- Peng, S.; Ding, Y.; Liu, W.; Li, Z. 1 km monthly temperature and precipitation dataset for China from 1901 to 2017. Earth Syst. Sci. Data 2019, 11, 1931–1946. [Google Scholar] [CrossRef]
- Sutanudjaja, E.H.; van Beek, R.; Wanders, N.; Wada, Y.; Bosmans, J.H.C.; Drost, N.; van der Ent, R.J.; de Graaf, I.E.M.; Hoch, J.M.; de Jong, K.; et al. PCR-GLOBWB 2: A 5 arcmin global hydrological and water resources model. Geosci. Model Dev. 2018, 11, 2429–2453. [Google Scholar] [CrossRef]
- Liu, H.; Zhang, G.; Zhang, D.; Yin, W.; Meng, X. Using high-resolution hydrological models to improve the spatial resolution of GRACE satellites. Mapp. Bull. 2022, 8, 41–47. [Google Scholar] [CrossRef]
- Zhang, J.; Zheng, S.; Sun, Y.; Yue, H. Landscape ecological risk assessment of an ecological area in the Kubuqi desert based on Landsat remote sensing data. PLoS ONE 2023, 18, e0294584. [Google Scholar] [CrossRef] [PubMed]
- Yang, Y.; Zhu, Y.; Wu, J.; Yu, Y.; Yang, J. Numerical modeling and water balance analysis of groundwater under conjunctive use of groundwater and surface water in Hetao Irrigation District. J. Drain. Irrig. Mach. Eng. (JDIME) 2018, 36, 732–737. (In Chinese) [Google Scholar]
- Hao, Y.; Yeh, T.C.; Wang, Y.; Zhao, Y. Analysis of karst aquifer spring flows with a gray system decomposition model. Groundwater 2007, 45, 46–52. [Google Scholar] [CrossRef] [PubMed]
- Li, W.; Liu, S.; Pei, Y.; He, J.; Wang, Q. Zoning for eco-geological environment before mining in Yushenfu mining area, northern Shaanxi, China. Environ. Monit. Assess. 2018, 190, 619. [Google Scholar] [CrossRef] [PubMed]
- Li, C.; Zhang, H.; Singh, V.P.; Fan, J.; Wei, X.; Yang, J.; Wei, X. Investigating variations of precipitation concentration in the transitional zone between Qinling Mountains and Loess Plateau in China: Implications for regional impacts of AO and WPSH. PLoS ONE 2020, 15, e0238709. [Google Scholar] [CrossRef]
- Zhang, J.; Chen, L.; Hou, X.; Li, J.; Ren, X.; Lin, M.; Zhang, M.; Wang, Y.; Tian, Y. Effects of multi-factors on the spatiotemporal variations of deep confined groundwater in coal mining regions, North China. Sci. Total Environ. 2022, 823, 153741. [Google Scholar] [CrossRef] [PubMed]
- He, H.; Wang, K.; Pan, J.; Wang, X.; Wang, Z. Characteristics of Coal Porosity Changes before and after Triaxial Compression Shear Deformation under Different Confining Pressures. ACS Omega 2022, 7, 16728–16739. [Google Scholar] [CrossRef]
- Duan, H.; Ma, Y.; Wang, J.; Lu, Y.; Xie, W. Coal Structure Characteristics of the 2# Coal Seam in the Jiaozuo Mining Area and Its Geological Dependence. ACS Omega 2023, 8, 39242–39249. [Google Scholar] [CrossRef] [PubMed]
- Liu, X.; Ma, C.; Ling, H.; Yan, W.; Zhang, H.; Jiang, X. Analysis of land subsidence caused by hydrodynamic force in Loess Hilly and gully region based on SBAS-InSAR. PLoS ONE 2023, 18, e0279832. [Google Scholar] [CrossRef]
- Vasco, D.W.; Kim, K.H.; Farr, T.G.; Reager, J.T.; Bekaert, D.; Sangha, S.S.; Rutqvist, J.; Beaudoing, H.K. Using Sentinel-1 and GRACE satellite data to monitor the hydrological variations within the Tulare Basin, California. Sci. Rep. 2022, 12, 3867. [Google Scholar] [CrossRef]
- Zhang, Y.; Kong, J.; Zhu, Y.; Zhu, W.; He, F.; Wang, L.; Li, Z. Influence of Underground Mining Direction Based on Particle Flow on Deformation and Failure of Loess Gully Area. Comput. Intell. Neurosci. 2022, 2022, 1698220. [Google Scholar] [CrossRef]
- Sun, W.B.; Wang, Y.; Qiu, H.F.; Ding, Z.W. Numerical simulation study of strip filling for water-preserved coal mining. Environ. Sci. Pollut. Res. Int. 2020, 27, 12899–12907. [Google Scholar] [CrossRef]
- Huang, Y.; Li, J.; Ma, D.; Gao, H.; Guo, Y.; Ouyang, S. Triaxial compression behaviour of gangue solid wastes under effects of particle size and confining pressure. Sci. Total Environ. 2019, 693, 133607. [Google Scholar] [CrossRef]
- Wu, G.; Fang, X.; Bai, H.; Liang, M.; Hu, X. Optimization of roadway layout in ultra-close coal seams: A case study. PLoS ONE 2018, 13, e0207447. [Google Scholar] [CrossRef]
- Li, X.; Lei, S.; Liu, F.; Wang, W. Analysis of Plant and Soil Restoration Process and Degree of Refuse Dumps in Open-Pit Coal Mining Areas. Int. J. Environ. Res. Public Health 2020, 17, 1975. [Google Scholar] [CrossRef]
- Chang, Y.; Chen, F.; Zhu, Y.; You, Y.; Cheng, Y.; Ma, J. Influence of revegetation on soil microbial community and its assembly process in the open-pit mining area of the Loess Plateau, China. Front. Microbiol. 2022, 13, 992816. [Google Scholar] [CrossRef]
- Ntona, M.M.; Busico, G.; Mastrocicco, M.; Kazakis, N. Modeling groundwater and surface water interaction: An overview of current status and future challenges. Sci. Total Environ. 2022, 846, 157355. [Google Scholar] [CrossRef] [PubMed]
- Lin, M.; Biswas, A.; Bennett, E.M. Spatio-temporal dynamics of groundwater storage changes in the Yellow River Basin. J. Environ. Manag. 2019, 235, 84–95. [Google Scholar] [CrossRef]
- Chen, X.; Jiang, J.; Lei, T.; Yue, C. GRACE satellite monitoring and driving factors analysis of groundwater storage under high-intensity coal mining conditions: A case study of Ordos, northern Shaanxi and Shanxi, China. Hydrogeol. J. 2020, 28, 673–686. [Google Scholar] [CrossRef]
- Rodell, M.; Famiglietti, J.S.; Wiese, D.N.; Reager, J.T.; Beaudoing, H.K.; Landerer, F.W.; Lo, M.H. Emerging trends in global freshwater availability. Nature 2018, 557, 651–659. [Google Scholar] [CrossRef]
- Deshpande, R.S. Disaster management in India: Are we fully equipped? J. Soc. Econ. Dev. 2022, 24 (Suppl. S1), 242–281. [Google Scholar] [CrossRef]
- Xiong, J.; Yin, J.; Guo, S.; Yin, W.; Rao, W.; Chao, N.; Abhishek. Using GRACE to Detect Groundwater Variation in North China Plain after South-North Water Diversion. Groundwater 2023, 61, 402–420. [Google Scholar] [CrossRef] [PubMed]
- Guo, Y.; Gan, F.; Yan, B.; Bai, J.; Xing, N.; Zhuo, Y. Evaluation of Terrestrial Water Storage Changes and Major Driving Factors Analysis in Inner Mongolia, China. Sensors 2022, 22, 9665. [Google Scholar] [CrossRef]
- Dai, L.; Fu, R.; Guo, X.; Du, Y.; Zhang, F.; Cao, G. Soil Moisture Variations in Response to Precipitation Across Different Vegetation Types on the Northeastern Qinghai-Tibet Plateau. Front. Plant Sci. 2022, 13, 854152. [Google Scholar] [CrossRef]
- Yang, H.; Wang, W.L.; Lou, Y.B.; Feng, L.Q.; Zhu, Y.N. Infiltration and shear strength characteristics of gully heads soil of typical vegetation on the gullied Loess Plateau, Northwest China. Ying Yong Sheng Tai Xue Bao 2023, 34, 1862–1870. (In English) [Google Scholar] [CrossRef] [PubMed]
- Li, X.; Ji, D.; Han, P.; Li, Q.; Zhao, H.; He, F. Study of water-conducting fractured zone development law and assessment method in longwall mining of shallow coal seam. Sci. Rep. 2022, 12, 7994. [Google Scholar] [CrossRef]
- Xue, Z.; Ding, G. Evaluation of ecosystem services from 2000 to 2020 and their trade-offs/synergies in a coalfield: A case study in the Pingshuo mining area of the Loess Plateau, China. Environ. Sci. Pollut. Res. Int. 2023, 30, 36680–36691. [Google Scholar] [CrossRef] [PubMed]
- Wu, X.; Wang, Z.; Gao, G.; Guo, J.; Xue, P. Disaster probability, optimal government expenditure for disaster prevention and mitigation, and expected economic growth. Sci. Total Environ. 2020, 709, 135888. [Google Scholar] [CrossRef]
- Salvaggio, M.; Futrell, R.; Batson, D.C.; Brents, G.B. Water scarcity in the desert metropolis: How environmental values, knowledge and concern affect Las Vegas residents’ support for water conservation policy. J. Environ. Plan. Manag. 2014, 57, 588–611. [Google Scholar] [CrossRef]
- Wei, M.; Yan, Z.; Shuang, H.; Xudong, H.; Guanfang, S.; Ming, Y.; Jingzhong, Y. Assessment of spatial and temporal seepage losses in large canal systems under current and future water-saving conditions: A case study in the Hetao Irrigation District, China. Agric. Water Manag. 2024, 291, 108615. [Google Scholar] [CrossRef]
- Hu, M.J.; Jiang, L.C.; Li, S.Z.; Zhou, L.F.; Tong, C. Effects of different mulching and drip irrigation patterns on photosynthetic characteristics of maize leaves in the Hetao Irrigation District, Inner Mongolia, China. Ying Yong Sheng Tai Xue Bao 2017, 28, 3955–3964. (In Chinese) [Google Scholar] [CrossRef]
- Huang, W.; Sui, L.; Wang, Y.; Zhang, C.; Jiang, D.; Cai, X.; Yang, Z. Study of the mining and aquifer interactions in complex geological conditions and its management. Sci. Rep. 2023, 13, 9462. [Google Scholar] [CrossRef]
- Long, T.; Hou, E.; Xie, X.; Fan, Z.; Tan, E. Study on the damage characteristics of overburden of mining roof in deeply buried coal seam. Sci. Rep. 2022, 12, 11141. [Google Scholar] [CrossRef] [PubMed]
- Bovenga, F.; Belmonte, A.; Refice, A.; Pasquariello, G.; Nutricato, R.; Nitti, D.O.; Chiaradia, M.T. Performance Analysis of Satellite Missions for Multi-Temporal SAR Interferometry. Sensors 2018, 18, 1359. [Google Scholar] [CrossRef] [PubMed]
- Umarhadi, D.A.; Widyatmanti, W.; Kumar, P.; Yunus, A.P.; Khedher, K.M.; Kharrazi, A.; Avtar, R. Tropical peat subsidence rates are related to decadal LULC changes: Insights from InSAR analysis. Sci. Total Environ. 2022, 816, 151561. [Google Scholar] [CrossRef] [PubMed]
- Dubrovin, K.; Stepanov, A.; Verkhoturov, A. Cropland Mapping Using Sentinel-1 Data in the Southern Part of the Russian Far East. Sensors 2023, 23, 7902. [Google Scholar] [CrossRef]
- Xiaopeng, J.; Haibing, W.; Yongshan, L. Desert channel erosion, accretion characteristics and their implications for aeolian–fluvial interactions: A case study in a desert watershed in the Ordos Plateau, China. Environ. Earth Sci. 2021, 80, 371. [Google Scholar] [CrossRef]
- Sharifuddin AL, A.; Mohd AA, H.; Hassan AD, M.; Lateef, A.B. Correcting Atmospheric Effects on the InSAR Measurements using GPS Data. IOP Conf. Ser. Earth Environ. Sci. 2022, 1067, 012043. [Google Scholar] [CrossRef]
- Parastoo, A.; Saeed, S.; AmirHossein, N.; AliAshraf, S. Evaluating capabilities of the spline and cubic spline interpolation functions in reference evapotranspiration estimation implementing satellite image data. Earth Sci. Inform. 2023, 16, 3779–3795. [Google Scholar] [CrossRef]
- Shireen, E.; Clement, V.; Joseph, P.; Martin, S.; Guido, G. Compressive Sensing Based Q-Space Resampling for Handling Fast Bulk Motion in Hardi Acquisitions. Proceedings. IEEE Int. Symp. Biomed. Imaging 2016, 2016, 907–910. [Google Scholar] [CrossRef]
- Alghafli, K.; Shi, X.; Sloan, W.; Shamsudduha, M.; Tang, Q.; Sefelnasr, A.; Ebraheem, A.A. Groundwater recharge estimation using in-situ and GRACE observations in the eastern region of the United Arab Emirates. Sci. Total Environ. 2023, 867, 161489. [Google Scholar] [CrossRef]
- Feng, T.; Shen, Y.; Chen, Q.; Wang, F.; Zhang, X. Groundwater storage change and driving factor analysis in north china using independent component decomposition. J. Hydrol. 2022, 609, 127708. [Google Scholar] [CrossRef]
- Monte Blanco, S.P.D.; Módenes, A.N.; Scheufele, F.B.; Marin, P.; Schneider, K.; Espinoza-Quiñones, F.R.; Roberto Paraíso, P.; Bergamasco, R. Groundwater quality monitoring of the Serra Geral aquifer in Toledo, Brazil. J. Environ. Sci. Health Part A 2018, 53, 1243–1252. [Google Scholar] [CrossRef] [PubMed]
- Bhat, S.; Motz, L.H.; Pathak, C.; Kuebler, L. Geostatistics-based groundwater-level monitoring network design and its application to the Upper Floridan aquifer, USA. Environ. Monit. Assess. 2015, 187, 4183. [Google Scholar] [CrossRef] [PubMed]


Disclaimer/Publisher’s Note: The statements, opinions and data contained in all publications are solely those of the individual author(s) and contributor(s) and not of MDPI and/or the editor(s). MDPI and/or the editor(s) disclaim responsibility for any injury to people or property resulting from any ideas, methods, instructions or products referred to in the content. |
© 2024 by the authors. Licensee MDPI, Basel, Switzerland. This article is an open access article distributed under the terms and conditions of the Creative Commons Attribution (CC BY) license (https://creativecommons.org/licenses/by/4.0/).
Share and Cite
Liu, Z.; Zhang, S.; Fan, W.; Huang, L.; Zhang, X.; Luo, M.; Wang, S.; Yang, L. Associations between Surface Deformation and Groundwater Storage in Different Landscape Areas of the Loess Plateau, China. Land 2024, 13, 184. https://doi.org/10.3390/land13020184
Liu Z, Zhang S, Fan W, Huang L, Zhang X, Luo M, Wang S, Yang L. Associations between Surface Deformation and Groundwater Storage in Different Landscape Areas of the Loess Plateau, China. Land. 2024; 13(2):184. https://doi.org/10.3390/land13020184
Chicago/Turabian StyleLiu, Zhiqiang, Shengwei Zhang, Wenjie Fan, Lei Huang, Xiaojing Zhang, Meng Luo, Shuai Wang, and Lin Yang. 2024. "Associations between Surface Deformation and Groundwater Storage in Different Landscape Areas of the Loess Plateau, China" Land 13, no. 2: 184. https://doi.org/10.3390/land13020184