1. Introduction
Floods are natural phenomena that cause major social and environmental impacts throughout the world [
1,
2,
3,
4,
5,
6,
7,
8]. There are several factors that increase the damage generated by floods, such as: deforestation of the catchment basin of the flows, erosion of soils, obstacles to the water flow, breakage or failure of engineering works, occupation of floodplains, urbanisation and inadequate drainage, deficiencies in territorial planning, and limitations in warning the population in case of emergency or climate change [
8,
9]. According to Wadgure and Kamble (2022), the areas most prone to floods are: (a) places affected by historical floods; (b) depressed or sunken areas with very little slope; and (c) areas located downstream from dams [
4].
The
Special Report on Directive 60/2007/EC of 23 October on the assessment and management of natural risks, elaborated by the European Court of Auditors indicates that serious floods are becoming more frequent in Europe. In particular, more than double the number of medium-sized or large
flash floods are being reported than at the end of the 1980s [
8].
For Europe, the Representative Concentration Path 8.5 scenario (RCP 8.5) reveals a substantial increase in the frequency of maximum flow, which will affect the population and will exponentially increase economic losses. In fact, future climate modelling shows an increase in the number of rainfall events associated with 100-year return periods. This means that, in every country in Europe, including Spain, there will be an increase in the frequency of serious floods [
10,
11].
In Spain, the Ministry for Ecological Transition and Demographic Challenge (hereafter, MITERD) indicates that each year an average of 10 serious flood episodes occur in Spain [
12,
13] (MITERD, 2018; MITERD, 2020). According to the CCS and the Directorate General for Civil Protection and Emergencies (DGPCE), floods have caused the deaths of 312 people over the last 20 years (2000–2020). The years 2018 and 2019 particularly stand out as 24 and 20 deaths due to floods were recorded, respectively, together with material damage worth EUR 800 million [
14,
15,
16]
This is due to the increased exposure in floodable areas, which, as indicated by Pérez-Morales et al., (2021), shows that the “property boom” (1996–2006) in Spain gave rise to the increase in the area exposed to floods, particularly on the coast. This situation has translated into a notorious increase in the impact and frequency of floods [
17].
However, the number of deaths caused by floods in Spain is falling considerably, due to the construction of more robust housing (in floodable areas) and flood defence works (structural measures), although there has been an increase in the exposure of the population to flash floods in the urban framework [
16].
According to the Spanish National Cartographic System for Flood Areas (hereafter, SNCZI) of the MITERD, it is estimated that around 3 million Spaniards live in areas that are at a high risk of flooding, identified during the implementation of the Directive 60/2007/ED on the assessment and management of flood risks.
The climate scenarios for Spain indicate a reduction in the average annual precipitation and the number of rainy days per year [
18,
19]. However, a greater volume of precipitation has been observed, together with a greater frequency of intense precipitation. These conditions favour an increase in floods [
19].
Traditionally, the flood-defence measures implemented throughout the 20th century focused on the so-called “old hydraulic policy” based on structural or hard engineering works, generally in response to the occurrence of a catastrophic event. These types of engineering works comprise the construction of reservoirs, dams, retaining walls, pipelines, bypasses, channelling and, in the most extreme cases, the deviation of flows or the construction of artificial flows [
20,
21,
22].
These types of actions are immediate solutions requested by the society affected by a flood episode and which, in general, are welcomed by the population, particularly on a local scale, where town councils fight for the regional authorities to finance these infrastructures [
16,
22]. Although these types of actions usually resolve the problem effectively, it is true that, as well as being very expensive, they divert the problem to other sectors, while generating a “false sense of security” among the population, as it makes people believe that the problem has been resolved and there will be no more flooding [
16].
Currently, adaptation measures include a series of actions that are more efficient when adapting to the negative effects of floods. These measures include: prediction measures (real-time weather forecasting and hydrological information systems); prevention measures (flood directive 60/2007/EC): historical analysis, historical mapping of flooded areas, hazard mapping, flood risk mapping and the elaboration of a flood risk management plan; land-use management and planning in the territory, regulation of land uses in accordance with the Regulation of the Public Water Domain, the Water Law, assurance systems, civil protection plans (emergency plans and flood risk adaptation plans (including evacuation) and raising awareness and education about risk; protection measures (mixed, adaptation, and structural measures; recovery of river spaces or Room of Rivers; and sustainable urban drainage systems (SUDS) and rainwater storage mechanisms (storm tanks and floodable parks), green solutions or Nature-Based Solutions (NBS), green corridors, flood alleviation areas or flood control zones (FCZ), commonly known as sacrifice zones or the adaptation of buildings). We should also include the exploitation or recovery of former water uses and the flood reduction measures of traditional societies.
Directive 60/2007/EC on the assessment and management of flood risk constituted a considerable change in the planning and management of flood risk in the European space, promoting preventive measures based on mapping and territorial planning as basic elements of risk reduction [
9]. Maps are a principal tool for the Directive in identifying, accrediting, and preventing flood risk. In order to elaborate the flood hazard and risk maps, Directive 60/2007/EC indicates the need to conduct a preliminary assessment of the flood risk (Art. 4, point 1) using the available information, such as recorded data and long-term evolution studies. Along these lines, the steps in undertaking this assessment are: (a) maps of the river basin district, at the appropriate scale, showing the boundaries of river basins and sub-basins and, where they exist, coastal areas, and showing the topography and land use of the river basin, topography, and land use; (b) a description of the floods occurring in the past (historical) that have had a significant negative impact; (c) a description of significant past flood events where adverse consequences of similar future events can be foreseen; and (d) an assessment of the potential negative consequences of future floods. These data allow a hazard map to be elaborated in accordance with the probabilities of occurrence or return periods with data such as the expanse, depth, and speed of the water. Subsequently, the risk map should include the potential adverse consequences for the affected inhabitants, the type of economic activity affected, the pollution accidentally caused by flooding or the impact on protected areas and any other information that the State considers useful, such as the indication of floodable zones.
When elaborating risk maps and defining flood management measures, studies that include a historical analysis of extreme natural phenomena, in this case floods, have constituted a fundamental tool for identifying the risk existing in a territory and influencing human behaviour, with the aim of informing about floodable areas and preventing their occupation.
Internationally, there are multiple studies using historical data analysis to analyse past climate characteristics and their behaviour in relation to extreme events (droughts, glaciations, floods) [
19], reconstruction and estimation of historical flood frequency based on existing historical records, analysis to calculate flood trends in different climatic regions of the world, and even the use of historical flood marks.
Kjeldsen et al. (2014) point out that the analysis of historical flood events from academic application to practice has been limited, but that it serves to estimate the frequency of past floods and to understand future trends. He also highlights the great heterogeneity of methodologies applied when carrying out historical analyses, which generally depend on the data series (short or long) available. The conclusions drawn by the authors indicate that there is considerable potential to improve the reliability of current flood risk assessments by collecting valuable information on past extreme events contained in historical datasets [
23].
Mediero et al. (2015) conducted a study based on recorded historical flow data consisting of the longest flow series available in Europe. The methodology applied is interesting since they first chose data from 102 gauging stations from 25 European countries, then identified five major regions (Atlantic, Continental, Scandinavian, Alpine, and Mediterranean) and identified the months with the highest probability of flooding. They also calculated the trend in the magnitude of floods in different periods (every 10 years) throughout the 20th century, obtaining as results a negative trend in the magnitude of floods. This means that there has been a decrease in the number of flood events in the regions analysed [
24].
Szczepanek et al. (2022) emphasise the crucial role of flood marks (“this is how far the water reached in the flood of XXXX…”). These marks are very useful because they function as a warning system for the population that they are living in a flood zone. In addition, these marks are considered cultural heritage in many cities. In this case, 21 elements of flood marks in Krakow (Poland) are analysed, highlighting the oldest mark in the 16th century. The author also points out that nowadays these flood marks can be recorded by using new technologies (photography with any personal mobile phone), which makes it possible to obtain an image of the flood, to know the magnitude of the flood, and to use these data for better flood management [
25].
In Spain, there are numerous studies that analyse the role of historical climatology and its relationship with extreme events (droughts, floods, periods of glaciation in Spain), since the 14th century [
26,
27,
28,
29], as well as the chronology of extreme flood events through documentary sources [
30].
There are also studies of historical analysis of extreme climate episodes, floods, and their consequences [
31,
32]. In these studies there are detailed analyses of the formation of detailed meteorological situations causing the formation of storm nuclei (in most cases, mesoscale convective systems) causing the largest episodes of precipitation and flooding in the Spanish southeast from 1950 until 1990. In addition, it also includes information related to the effects of floods (affected areas and duration of the flood), evaluations of initial economic costs (after the flood), and final economic costs (total losses due to the flood episode), including aid from the Spanish governments and even the approval of some defence work or actions to repair hydraulic infrastructure [
31].
In addition, there are geographical–historical studies that compile historical floods that occurred in different basins. Galván Plaza (2018) analyses the four major historical floods of the Ebro River as it passed through the city of Murcia, from 1643 to 1961, using historical maps and plans of the time. Likewise, he also highlights how man has been occupying and settling in the flood plain of the Ebro River on its left bank, causing greater economic losses with the floods experienced by the Ebro River [
33]. Gil Olcina and Canales (2022) have recently published a monograph on the causes and consequences of the floods that occur in the Segura basin, and especially in its final section corresponding to the Alicante region of Vega Baja del Segura. Likewise, the authors compile the most important flood episodes that occurred in the Segura basin, highlighting: 1879, 1946, 1948, 1972, 1973, 1987, 2016, and 2019. They also compile all the information related to the numerous defence plans to regulate the Segura basin to alleviate the effects of the floods from 1879 to 1987 [
34].
They also highlight: flood risk analysis studies that currently exist in urban environments in the province of Alicante, where some interesting information related to some municipalities in the Vega Baja del Segura can be found [
35]; risk analysis studies that take into account danger (through hydraulic modelling), exposure (identifying areas, land uses, infrastructure, and buildings), and vulnerability studies for different land uses, obtaining flood risk maps in urban environments, as is the case of the Tormes River (Salamanca, Spain) [
36]; and works related to the abandonment of traditional irrigation systems for dryland crops (peat irrigation or diversion irrigation, taking advantage of rainwater and formation of floods) that has increased the magnitude of river floods today. They also use historical maps and sketches to identify the abandoned irrigation network and the affected areas of the Abanilla Rambla, explaining the effects on the flooding episode of September 2019. In addition, they also calculate the volume of flow that would have been reduced if these irrigation systems were currently in operation, calculating an estimated value for different return periods [
37].
Likewise, studies on the reconstruction and magnitude of floods also stand out through the use of geomorphological evidence, combined with one-dimensional hydraulic modelling and supported with records from documentary sources of the localities. An example is the work of Benito et al. (2010) in which they carried out paleoflood studies along a 2.5 km stretch located at the confluence of the Rambla Mayor (162 km
2) and the Carmelo River (210 km
2), in the upper basin of the Guadalentín (basin of the Safe). From this analysis they identified at least 10 floods with flows between 15–580 m
3 (950–1200); seven floods, in which two floods estimated higher flows between 580–680 m
3/s (1648–1672); seven floods with two flood events greater than 250 m
3/s (1769–1802); four flood episodes, where two episodes stood out with estimated flows between 760–1035 m
3/s (1830–1840), and finally, seven floods of which three events exceeded 880 m
3/s (1877–1900). The conclusion obtained from this work is the anomalous increase in the frequency of large-magnitude floods between 1830 and 1900 [
38].
Similarly, studies have also been carried out that are based on other sources, such as old photographs [
39], the historical mapping of river courses [
40], or the elaboration of current flood hazard and risk mapping in accordance with historical cartography [
41,
42,
43], in the Segura basin, and in the cities of Orihuela [
42] and Murcia [
43].
The rivers have evolved with the societies at the headwaters, along their courses and in the floodplains, giving rise to a series of implications related to territorial planning. However, territorial management and planning are policies that have only been implemented in Spain in the last 50 years. Therefore, they constitute a new aspect for regulating land uses in floodable areas after a flood episode.
As indicated by Giménez-Font (2009), rivers have also been a longstanding primary focal point of cartographic activity in surveying, hydrometrics, engineering, and cartography. The abundant Spanish cartography includes many river maps and plans dating back to the 16th century with exquisite quality, particularly those elaborated in the 18th and 19th centuries. The majority of them are accompanied by a wealth of historical documentation which is increasingly accessible and often with correct interpretations on the capacity of erosion and the changing river courses, which has been an age-old matter of interest and concern for river societies [
40].
Historical cartography has been an object of research in itself or has accompanied historical or geographic studies. However, new readings allow us to extract conclusions on a scientific-technical level and also on an environmental level that multiply the possibilities of many old maps which are no longer just a static representation but an element of reference in the study of river morphology and its relationship with the name [
40]. In many physical geography studies, historical cartography has been a decisive element of analysis, although it does have its advantages and disadvantages with respect to the scales used and the purpose of the maps [
40].
This historical cartography improved in terms of quality and detail throughout the 18th century, which enables us to identify the responses of river systems to human impacts and, in turn, the technical responses which, over the course of about two centuries, were implemented for some of the morphological manifestations of the rivers [
40]. In the 19th century, maps of the flooded areas after a flood episode with catastrophic consequences for society (fatalities and economic damage) began to be drawn up. These maps could be considered as the beginning of hazard maps after the event (post-catastrophe).
This study seeks to assess the territorial impacts based on territorial management and planning based on the analysis of the flood episode of 14–15 October 1879 in the Segura basin, located in the south-east of the Spanish peninsula.
The objectives of this study are:
- (a)
To carry out a historical analysis of the flood of 14–15 October 1879 (Santa Teresa flood) in the Guadalentín river valley and in the middle and lower sections of the Segura river.
- (b)
Reconstruct the historical map of the flood to study the current situation.
- (c)
Calculate the total built-up area in the flood zone of the Guadalentín valley and Segura river valley.
- (d)
Identify lessons learned and missed opportunities for risk reduction from territorial planning.
This study seeks to show the importance of the historical study of extreme flooding events and of historical cartography for the territorial planning of areas at risk. The precise analysis of the areas affected and their comparison with the current territorial reality enable the weight of the territorial planning to be assessed when establishing new land uses after the occurrence of a high-impact flood episode.
2. Materials and Methods
2.1. Historical Description of the Effects of the October 1879 Flood
The flood episode of 14 and 15 October 1879, known as the “Santa Teresa flood” as it occurred on the date of the saint’s day with the same name, occurred as a result of intense and torrential rains throughout the whole of the Segura basin, with an even greater intensity recorded in the basin of the Guadalentín, which is the principal tributary of the River Segura. This episode marked a before and after in the history of the basin, particularly in the villages affected [
40]. It has been described as one of the deadliest floods in European hydrological records, in the words of the French potamologist Maurice Pardé—the result of the enormous swelling of the River Guadalentín, one of the largest tributaries of the River Segura, classified as “the wildest river in Europe” [
34].
Very briefly, a cold drop (gota fria) occurs when a pocket of cold air detaches from the main jet stream in the Gulf of Cádiz and the divergent winds and the sea temperature foster the formation of mesoscale convective systems, which generate abundant and torrential rain [
44]. Calvo García-Tornel, Conesa García, and Álvarez Rogel (2001) estimated that the rainfall produced in the headwaters of the River Guadalentín was 600 mm/hour, which, in only one hour, by far exceeded the maximum estimates for 24 h in a 500-year return period [
45]. This rainfall was concentrated in the headwaters of the River Guadalentín, giving rise to the sudden flooding of the Rivers Velez and Luchena, whose waters come together at the beginning of the Guadalentín. This brought about the exponential swelling of the Guadalentín close to La Parroquia between the sites of the Valdeinfierno and Puentes reservoirs, reaching a height of 15.5 m [
34].
With respect to the flows circulating in the River Guadalentín, it is estimated that the maximum height of the swelling was 4000 m
3/s. However, this figure is incorrect, given that the only calculation that is found in the work titled “
El régimen de los ríos peninsulares” by Masachs (1948) only refers to the maximum swelling in the River Guadalentín as it passes through Totana, estimated at 1300 m
3/s, which represents a 10,800-fold increase of its module, for the series of data corresponding to the period 1915 to 1929 [
46,
47]. This is confirmed by Conesa García (1985), who calculated the maximum volume as it passed through the destroyed Puentes II reservoir at 1744 m
3/s, for a river basin level of 971.2 km
2. Furthermore, it was estimated that for Puentes de los Carros, with a basin of 2748 km
2, the maximum volume would have been 1300 m
3/s [
34]. It was also calculated that the River Guadalentín discharged a volume of 58 hm
3 as it passed through Lorca, while downstream at the meeting point of the River Guadalentín with the River Segura, the volume contributed by the former was between 30 and 35 hm
3 [
34].
Such high volumes as these in the River Guadalentín as it passed through Lorca are explained by three reasons: (a) the high amount and intensity of rainfall in the headwaters of the Guadalentín, (b) the siltation of the Valdeinfierno dam and the Puentes II dam, which was destroyed in the 1802 flood, and (c) the insufficient capacity of the Canal del Reguerón (60 m3/s). All of this led the waters of the Guadalentín, when combined with the swelling of the River Segura, to generate floods and catastrophic consequences in the Vega Media and Vega Baja del Segura.
The consequences of the flood in the town and surrounding area of Lorca were very severe. A total of 15.362 ha were flooded by the waters of the River Guadalentín, both in the town and the agricultural lands.
The specific impacts of the flood are listed by González López (2014), who indicates the following: the flooded area in Lorca spanned from the lower part of the San Cristóbal neighbourhood to the door of the parish church, the Calle Mayor (water with a 4–5 m height) and the Charco, Puente de los Carros, and Rambla streets. In the Puerta de San Ginés street, the water covered the roofs. Between the Rueda orchards and the Santa Quiteria bridge, “the avalanche opened a gap in the wall” converting the neighbourhood into a river. The San Diego orchard and the bordering districts were converted into a large lake. In the village beside the river, the water reached the La Merced convent. On the Águilas road, 100 m from the Santa Paula oval and the Tres Puentes promenade “there was a shoreless sea”. At this point, the waters almost touched the streets of the town, reaching the doors of the barracks in Aire street where the parish church of San Matero is located. In the sanctuary of Nuestra Señora de las Huertas, the waters covered the pulpit, and in the San Diego church the waters reached the second floor of the building [
44].
There is little information about the rural areas further away from the urban nuclei, only that “[t]he districts of La Tova, Fontanares, Jarales, Paca, Avilés, Doña Inés and Zarzadilla have been so badly affected that none of their farms will be able to produce anything for some years” [
44].
Meanwhile, the River Segura also experienced severe swelling, although slightly less than the Guadalentín. Except for the convergence point of the Guadalentín with the Segura, the rest of the swellings of the tributaries of the Segura were not synchronised but successive, and the maximum flow as the waters passed through Murcia was 1890 m
3/s. On the morning of 15 October, the flow of the River Segura dropped to 1640 m
3/s and a few hours later it increased again to 1700 m
3/s, as a result of the addition of the flows from the upper sub-basins (Rivers Tus, Taibilla, and Mundo), together with the contributions of the upstream watercourses [
34]. López Bermúdez and other authors (1978) estimated that the River Segura had a maximum flow of 2500 m
3/s in the city of Murcia on 15 October, resulting in the total flooding of the Vega Media and Vega Baja del Segura until the sea [
47].
In the Vega Media, specifically in Murcia, the effects of the flood were devastating for the aforementioned reasons, namely: (a) the reactivation and overflowing of the tributary watercourses of the River Segura on its left side, increasing its flow; (b) the reactivation and overflowing of the watercourses directly falling into the Albatalía and the orchards of Espinardo, Churra, and Monteaguado and the areas of Puente de Tocinos, Arboleja, Urdienca, and Raal, flooding the city of Murcia in the north and east; (c) the increased flow of the River Segura itself as it passed through Murcia estimated at 2500 m
3/s; and (d) the works of the Canal de El Reguerón (known as the trench of the devil or death), located at a height of 4 m above the River Segura and with an insufficient hydraulic capacity of 60 m
3/s, collected the waters of the flood of the bend in the Guadalentín which met with the swelled flow of the River Segura, leading to the overflowing of both of the rivers in Murcia, flooding its western and southern sectors and increasing the flood in the eastern sector. Murcia was practically isolated by a sheet of water with an average height of 1.5 m throughout the whole of the orchard lands [
34].
With respect to the final section of the River Segura or Vega Baja del Segura, Gil Olcina and Canales (2022) highlight that both the town of Orihuela and other municipalities of the Vega Baja (15 in total) were seriously affected by the floods and the overflowing of the River Segura [
34].
It is estimated that the flow of the River Segura as it passed through Orihuela was 2000 m
3/s. Thanks to prior warning through conches and telegraphs, a higher number of deaths due to the flood were prevented. However, the flood destroyed many buildings and the height of the flood water in the Vega Baja reached 7 m at its lowest points. The figure below shows a sketch of the flood episode (
Figure 1).
This flood, the deadliest documented in Spain, aroused widespread solidarity on a national and international level. As indicated by Gil Olcina and Canales (2022), the royal family led the movement of support to the victims: Alfonso XII travelled to the flooded area and visited the most affected areas of the Vega Media and Vega Baja; Queen Isabel, who at that time lived in Paris, sold her jewels to help the victims and support the campaign to collect donations [
34].
Furthermore, the news received unprecedented coverage beyond Spain’s borders: none of the large floods occurring in Spain had been reported in Europe in the same way as the Santa Teresa flood [
34]. The authors add that this was largely due to the intense activity that, supported by Queen Isabel, then living in Paris, was carried out by the Spanish ambassador to that city, who exercised his role rightly and with prestige. His name was Mariano Roca de Togores y Carrasco, the Marquis of Molins, from the eminent lineage from the town of Orihuela of the Counts of Pinohermoso. Among the different initiatives to raise funds in France, which finally amounted to 1,812,000 pesetas, particularly noteworthy due to its originality and size was the launch of 400,000 copies of the
Revue Paris-Murcie, published by the French Press Committee.
As indicated by Gil Olcina and Canales (2022), the death toll was as follows: a total of 761 people lost their lives in the orchard area of Murcia, 13 in Lorca, two in Librilla and one in Cieza. With respect to material damage, a total of 5762 huts and houses were destroyed, and 2949 ruined; there were crop losses, and 22,469 animals drowned. Furthermore, the damage to the hydraulic infrastructures was enormous, as the irrigation network was completely destroyed across the whole of the area affected together with 129 mills. In Lorca, the total losses were calculated at 1,716,000 pesetas, which was much lower than those estimated by the local assessors at 7,247,871; even greater was the value of the damage in Murcia at 9,011,000 pesetas and 1,539,000 in Orihuela [
34] (
Table 1).
2.2. Study Area
The methodology used in this study is based on the compilation of documentation and historical data related to the flood of October 1879 in the Segura basin, in which the Rivers Guadalentín and Segura played a leading role in the catastrophic consequences in several towns in the Region of Murcia, including Lorca and Murcia, and in towns in Alicante located in the valley of the River Segura.
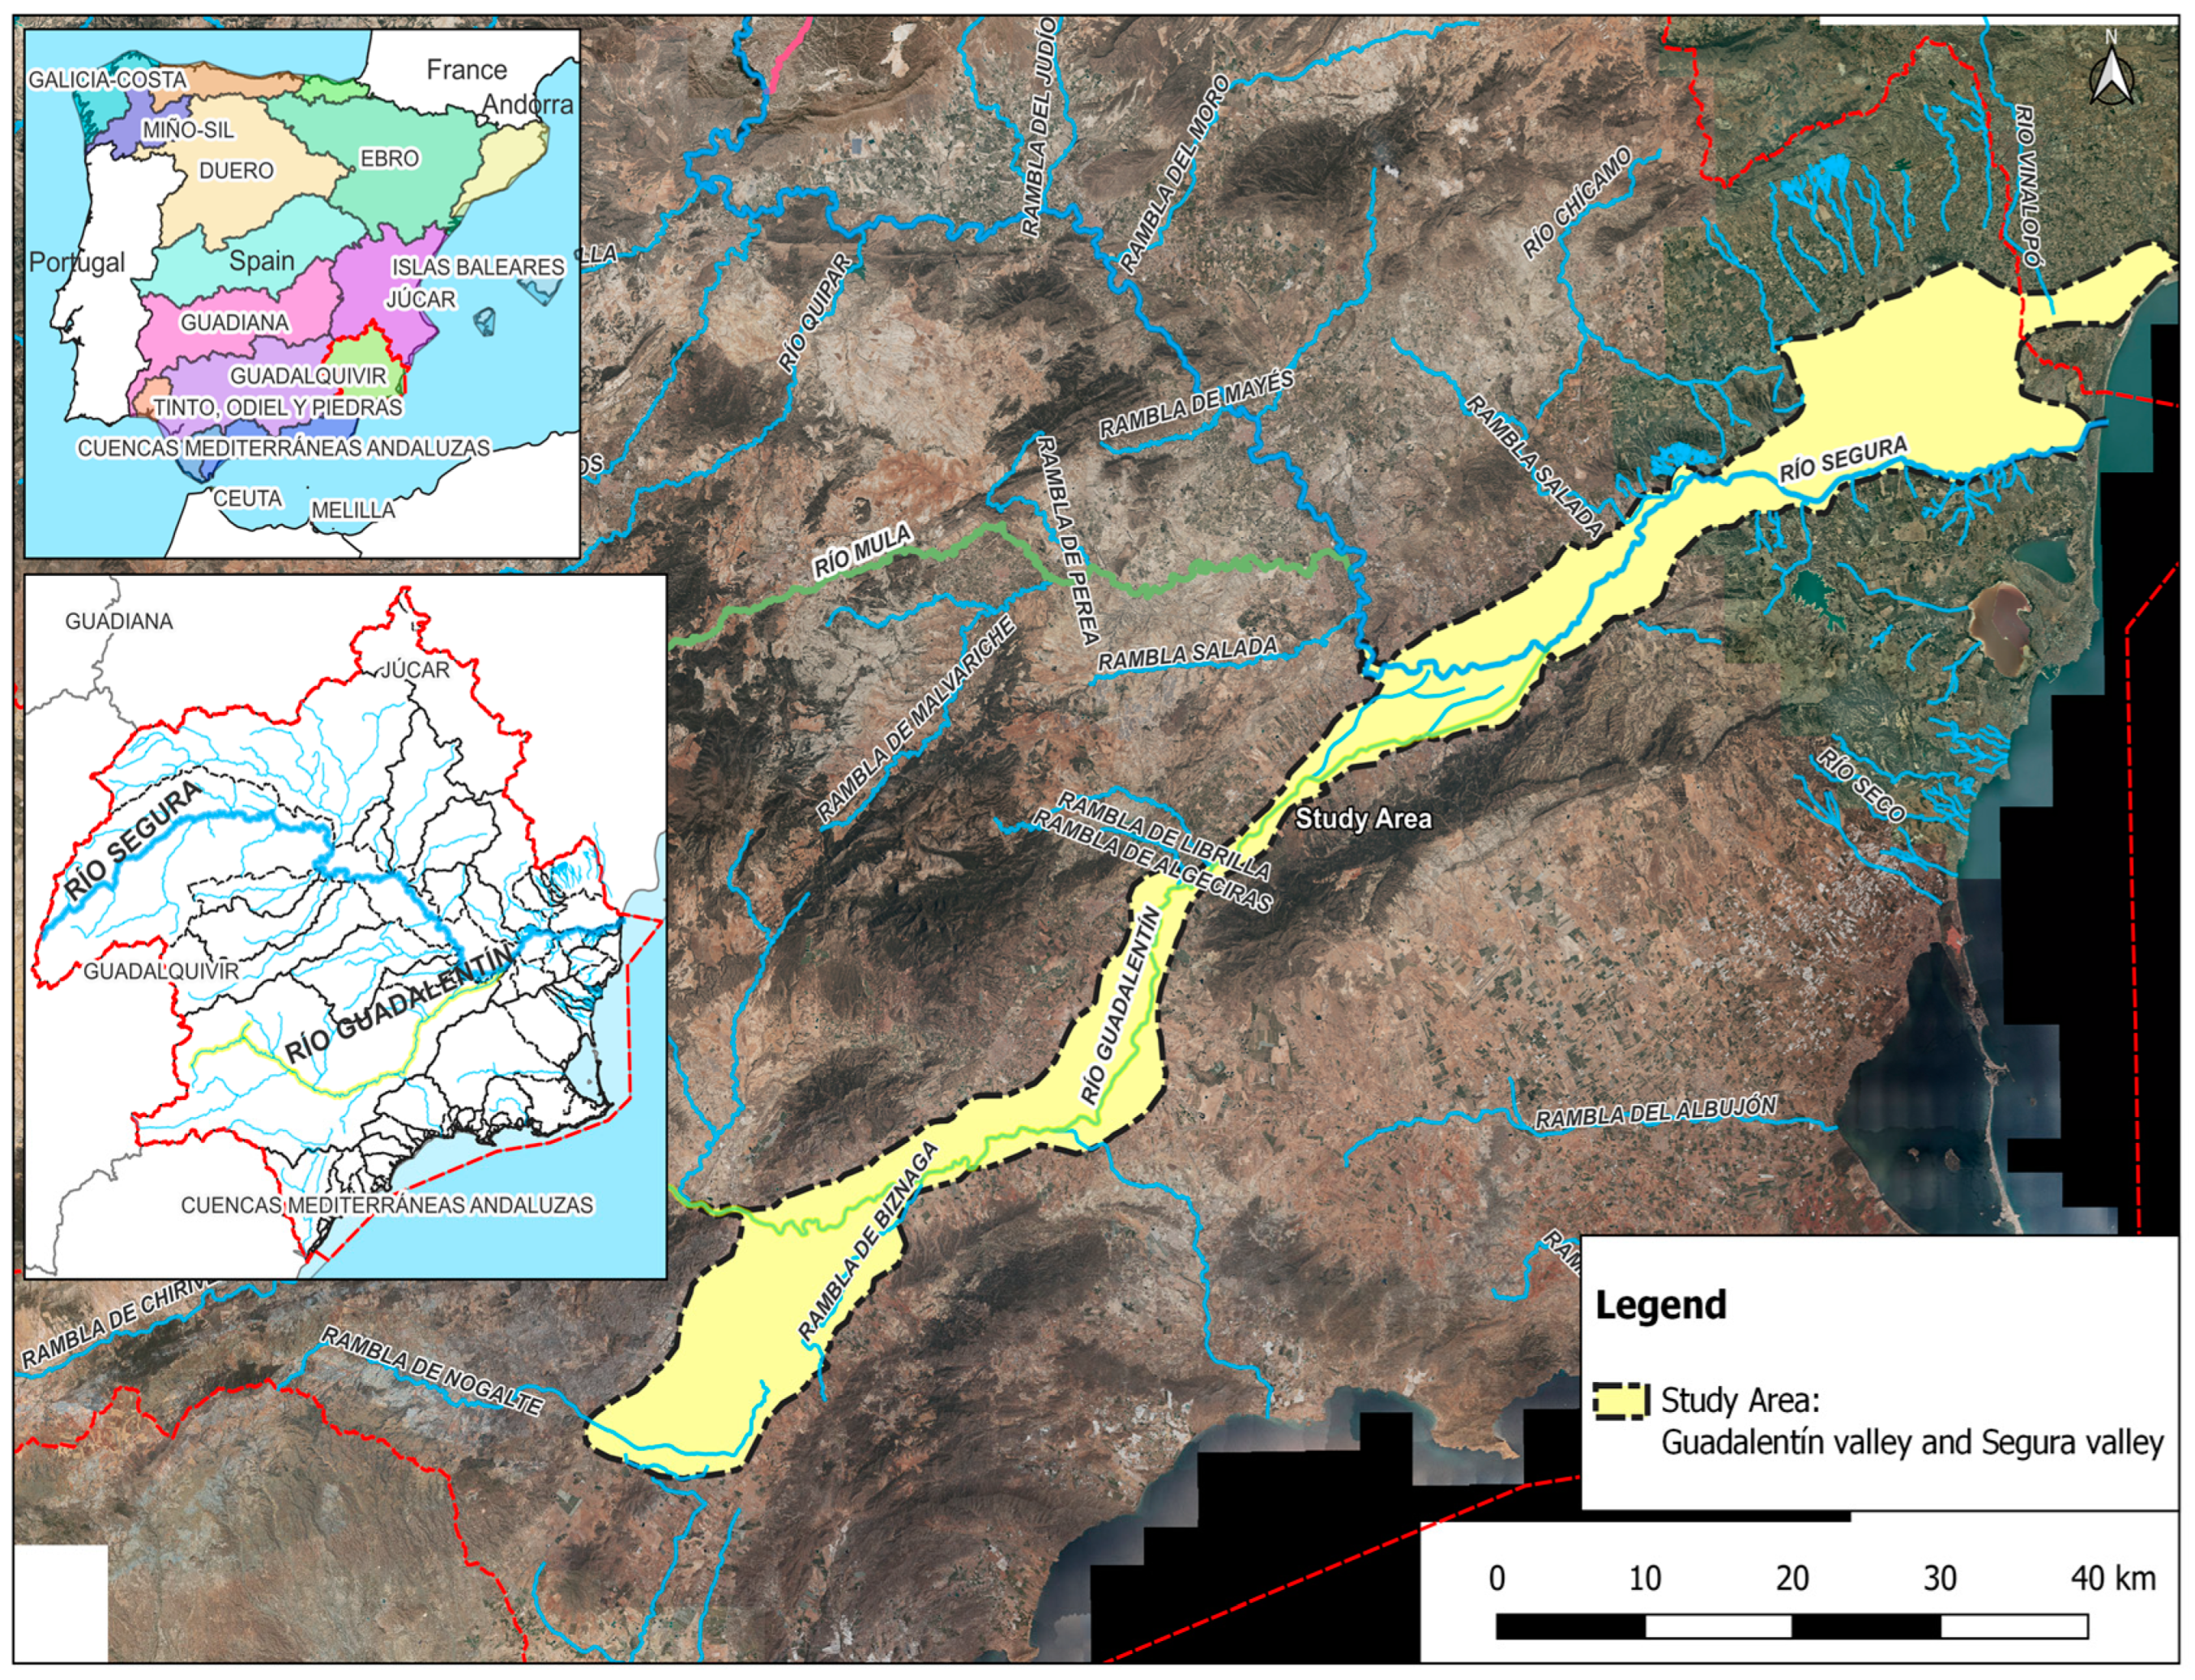
The area of study selected corresponds to the valley of the Rivers Guadalentín and Segura from Contraparada in Murcia to Guardamar del Segura in Alicante where the river meets the Mediterranean Sea. This area has been chosen as it corresponds to the flooded area in the historical flood of October 1879 (the Santa Teresa flood) (
Figure 2).
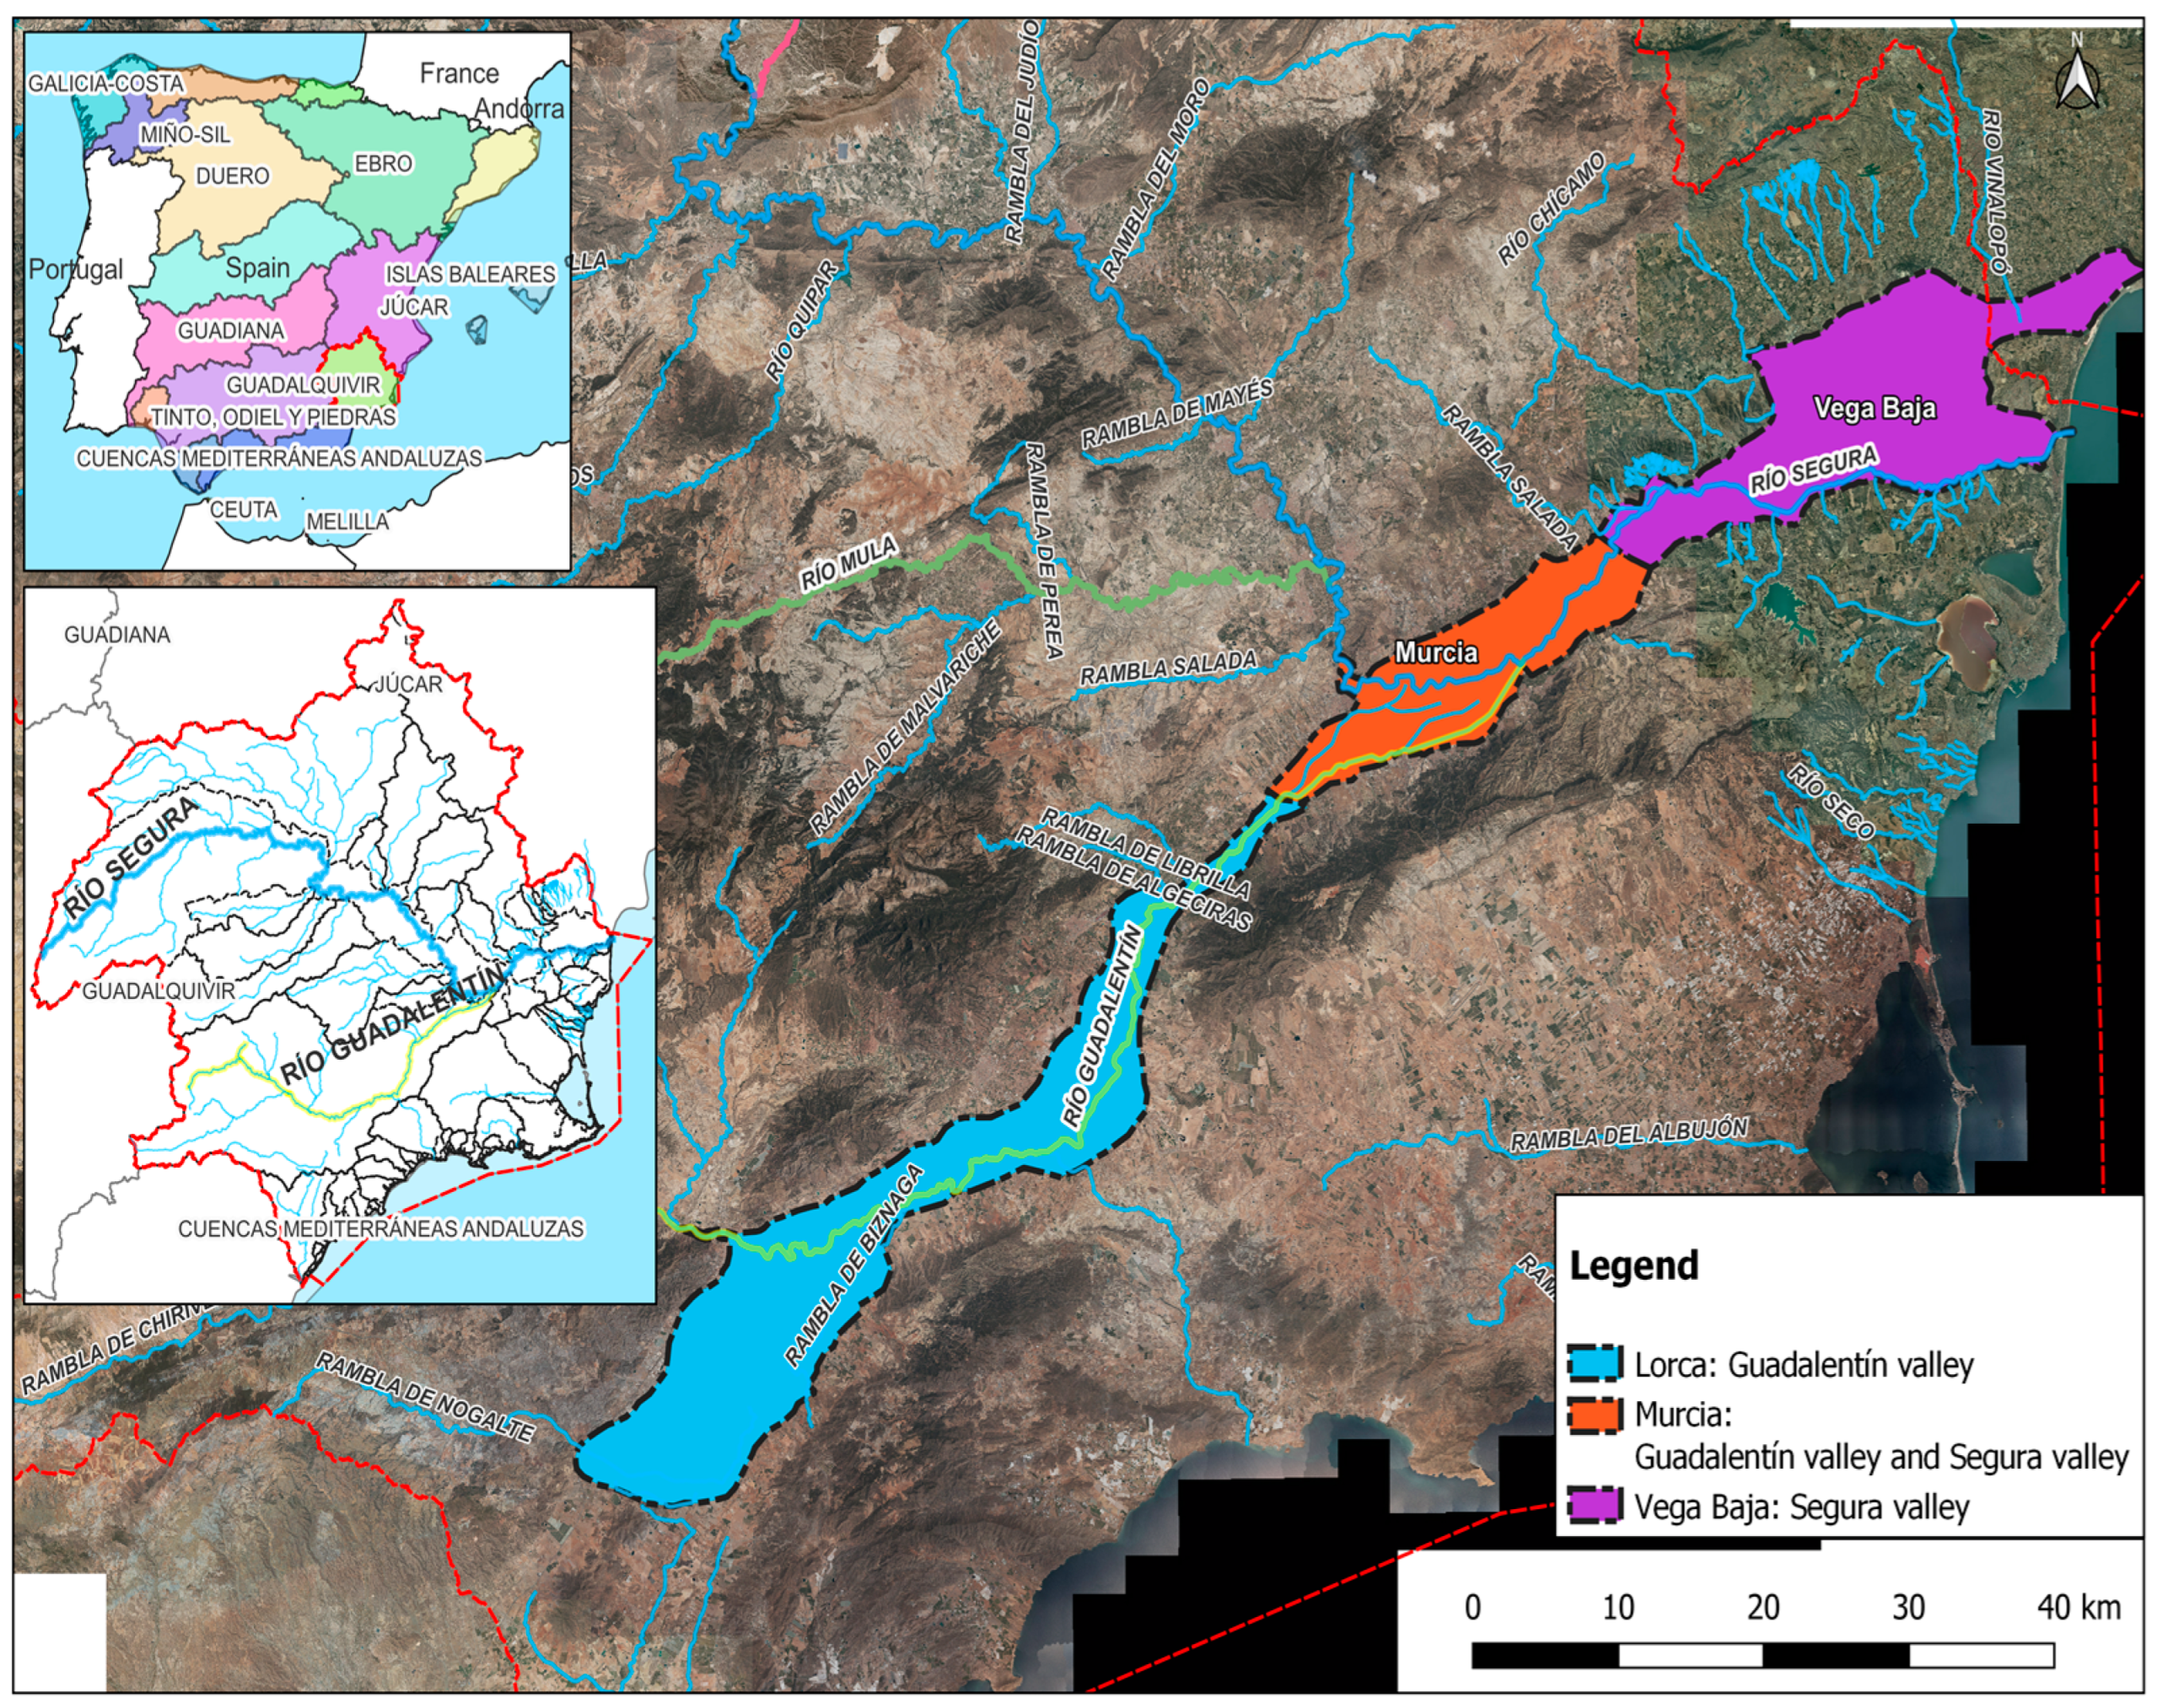
Another map has been prepared to differentiate the three regions that form part of the Guadalentín Valley and the River Segura: Lorca, Murcia, and the region of the Vega Baja del Segura, since throughout the text allusion will be made to these toponymies (
Figure 3).
The Guadalentín and Segura river valleys have experienced numerous floods. The basin organization has counted more than 300 episodes of flooding since the 13th century.
The most catastrophic flood episodes in the Segura basin have coincided with the flooding of the Rivers Guadalentín and Segura, causing numerous deaths and enormous economic damage.
An example of this is the flood of October 1879, an episode of analysis and study in the present research.
It should be pointed out that, from Murcia, the Segura River is incorporated in the so-called Depresión Prelitoral Murciana, characterized by being a valley with little slope, accentuating its flatness from the region of the Vega Baja del Segura. Hence the large number of meanders in the Segura River from Murcia to Orihuela and from Orihuela to Guardamar del Segura.
It should also be noted that, in the Vega Baja del Segura region, the Segura River is higher than its river valley, with a very large flood zone on its left bank. This means that when the Segura River overflows, generally, the greatest catastrophic effects occur on the left bank, and the overflowing waters cannot return to the riverbed. The overflowed waters circulate to the lowest point of the alluvial plain where there is a network of channels that set the stagnant waters in motion. In this way, the waters are transported by this network of channels (azarbes) to the Segura River in its final stretch.
Most floods take between a week and a month and a half to drain, depending on the magnitude of the flood.
2.3. Methodology for the Reconstruction of Historical Maps
The methodology applied in this research consisted of the collection of information and historical maps showing preferential flooding areas, as well as historical maps of floods that have occurred, for example, the flood of October 1879.
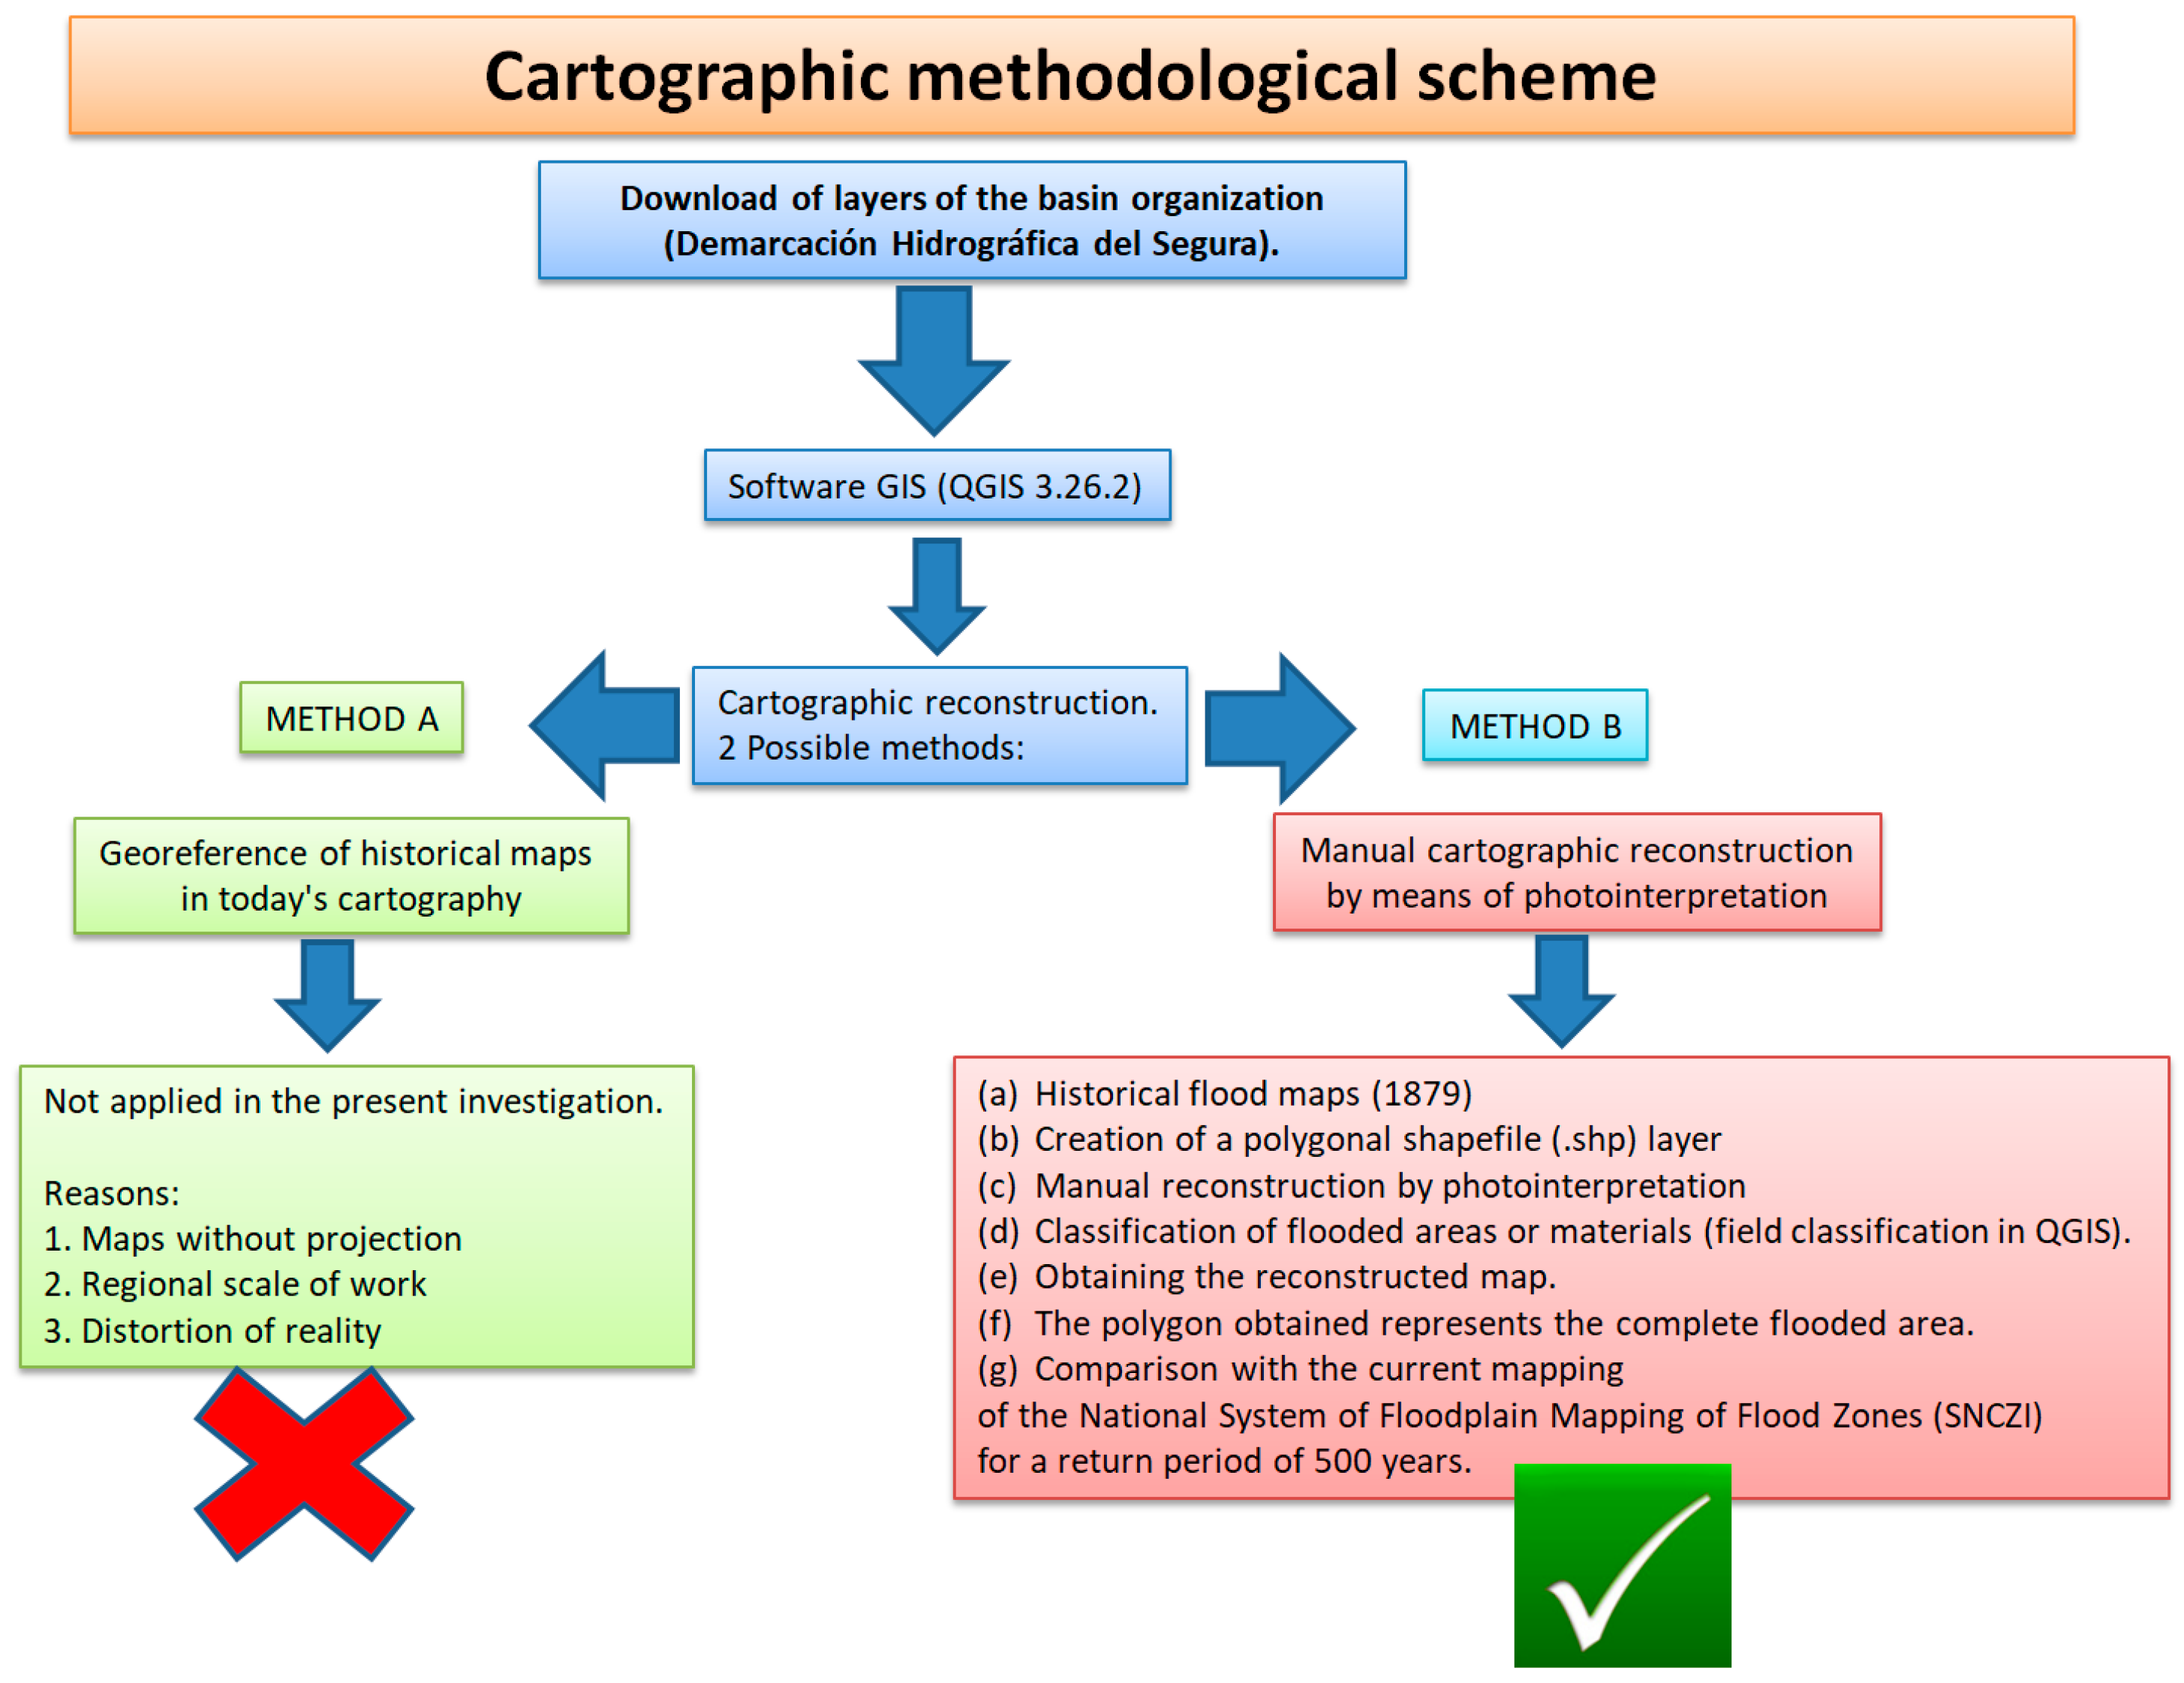
Cartographic reconstructions can be carried out in several ways. Two ways can be distinguished: method A and method B. Method A would consist of georeferencing a historical map by adding common points that allow for fitting the historical cartography or plans with current cartography. However, it must be taken into consideration that many historical maps lack the projection used today; they are plans or sketches drawn of large areas (on a county or regional scale) and the result obtained would distort the historical map and the reality of the facts.
For these reasons it was decided to use a methodological alternative: method B (
Figure 4). Method B consists of reconstructing historical cartography manually by photointerpretation. The application of this method does not necessarily include georeferencing; one simply uses photointerpretation techniques and creates polygonal layers in shapefile (.shp) format, and prepares it manually with the help of historical descriptions and historical maps.
The result of the manually created layer is a polygonal vector layer that covers the entire flood zone. In this layer itself, groups can be divided based on historical information. In this case, the materials are included as shown on the map drawn up in 1881, which refers to the flood of 1879.
Several studies have been highly useful for the construction of the effects of the flood: the study by González López (2013) gives a detailed description of the areas affected in Lorca, the weak points of the course of the River Guadalentín as it passes through the municipality, the burst banks and obstacles encountered by the floodwater of the river course, and the areas affected downstream past Murcia [
44]. It also provides data about personal and economic damage recorded by the municipality after the flood. The recent study by Gil Olcina and Canales (2022) describes in greater detail the causes and consequences experienced in the high and low plains of the River Segura (Murcia, Orihuela, and the floodplains) and provides an inventory of the damage caused by the floods in both towns, the number of mortal victims in the flood episode, and the total material damage [
34]. Other studies, such as the one carried out by Calvo García-Tornel, Conesa García, and Álvarez Rogel (2001) estimate the value of the flooding in the River Guadalentín [
45] or that by López Bermúdez and others (1978), which estimates the value of the overflowing of the River Segura [
46].
Historical map documents have been consulted. Illustrations from the period of the effect of the flood have also been used in order to assess the magnitude of the disaster [
47]. They have been drawn from the special issue of the publication “
La Ilustración Española y Américana”, published on 30 October 1879. This volume contains a graphic report of the effects of the flood in the city of Murcia by Juan Almagro. They are the only images of the catastrophe that were printed in the press at the time [
48]. In this respect, also interesting is the special issue titled “
Paris-Murcie”, in which prestigious French and Spanish writers collaborated: V. Hugo, A. Dumas, O. Feuillet, A. Daudet, E. Littré, E. Zola, G. Mistral, M. Ruiz Zorrilla, M. Roca de Togores (marqués de Molins), E. Castelar, A. Cánovas del Castillo, etc. Also useful is “
Murcia-París”, with articles by renowned Spanish and Murcian authors: J. Echegaray, P. Díaz Cassou, A. Baquero Almansa, R. Serrano Alcázar, J. Martínez Tornel, and Ricardo Gil, among others. Both publications contain very significant illustrations of the effects of the flood in the Segura basin, particularly in the principal urban nuclei, the rural villages, and the hydraulic infrastructures (bridges). All of these written press documents have been consulted in the Digital Newspaper Archive of the Spanish National Library (
http://www.bne.es/es/catalogos/HemerotecaDigital/ accessed on 1 November 2023) [
48,
49] and in the General Archive of the Region of Murcia (
https://archivogeneral.carm.es/archivoGeneral/arg.inicio accessed on 1 November 2023) [
50,
51].
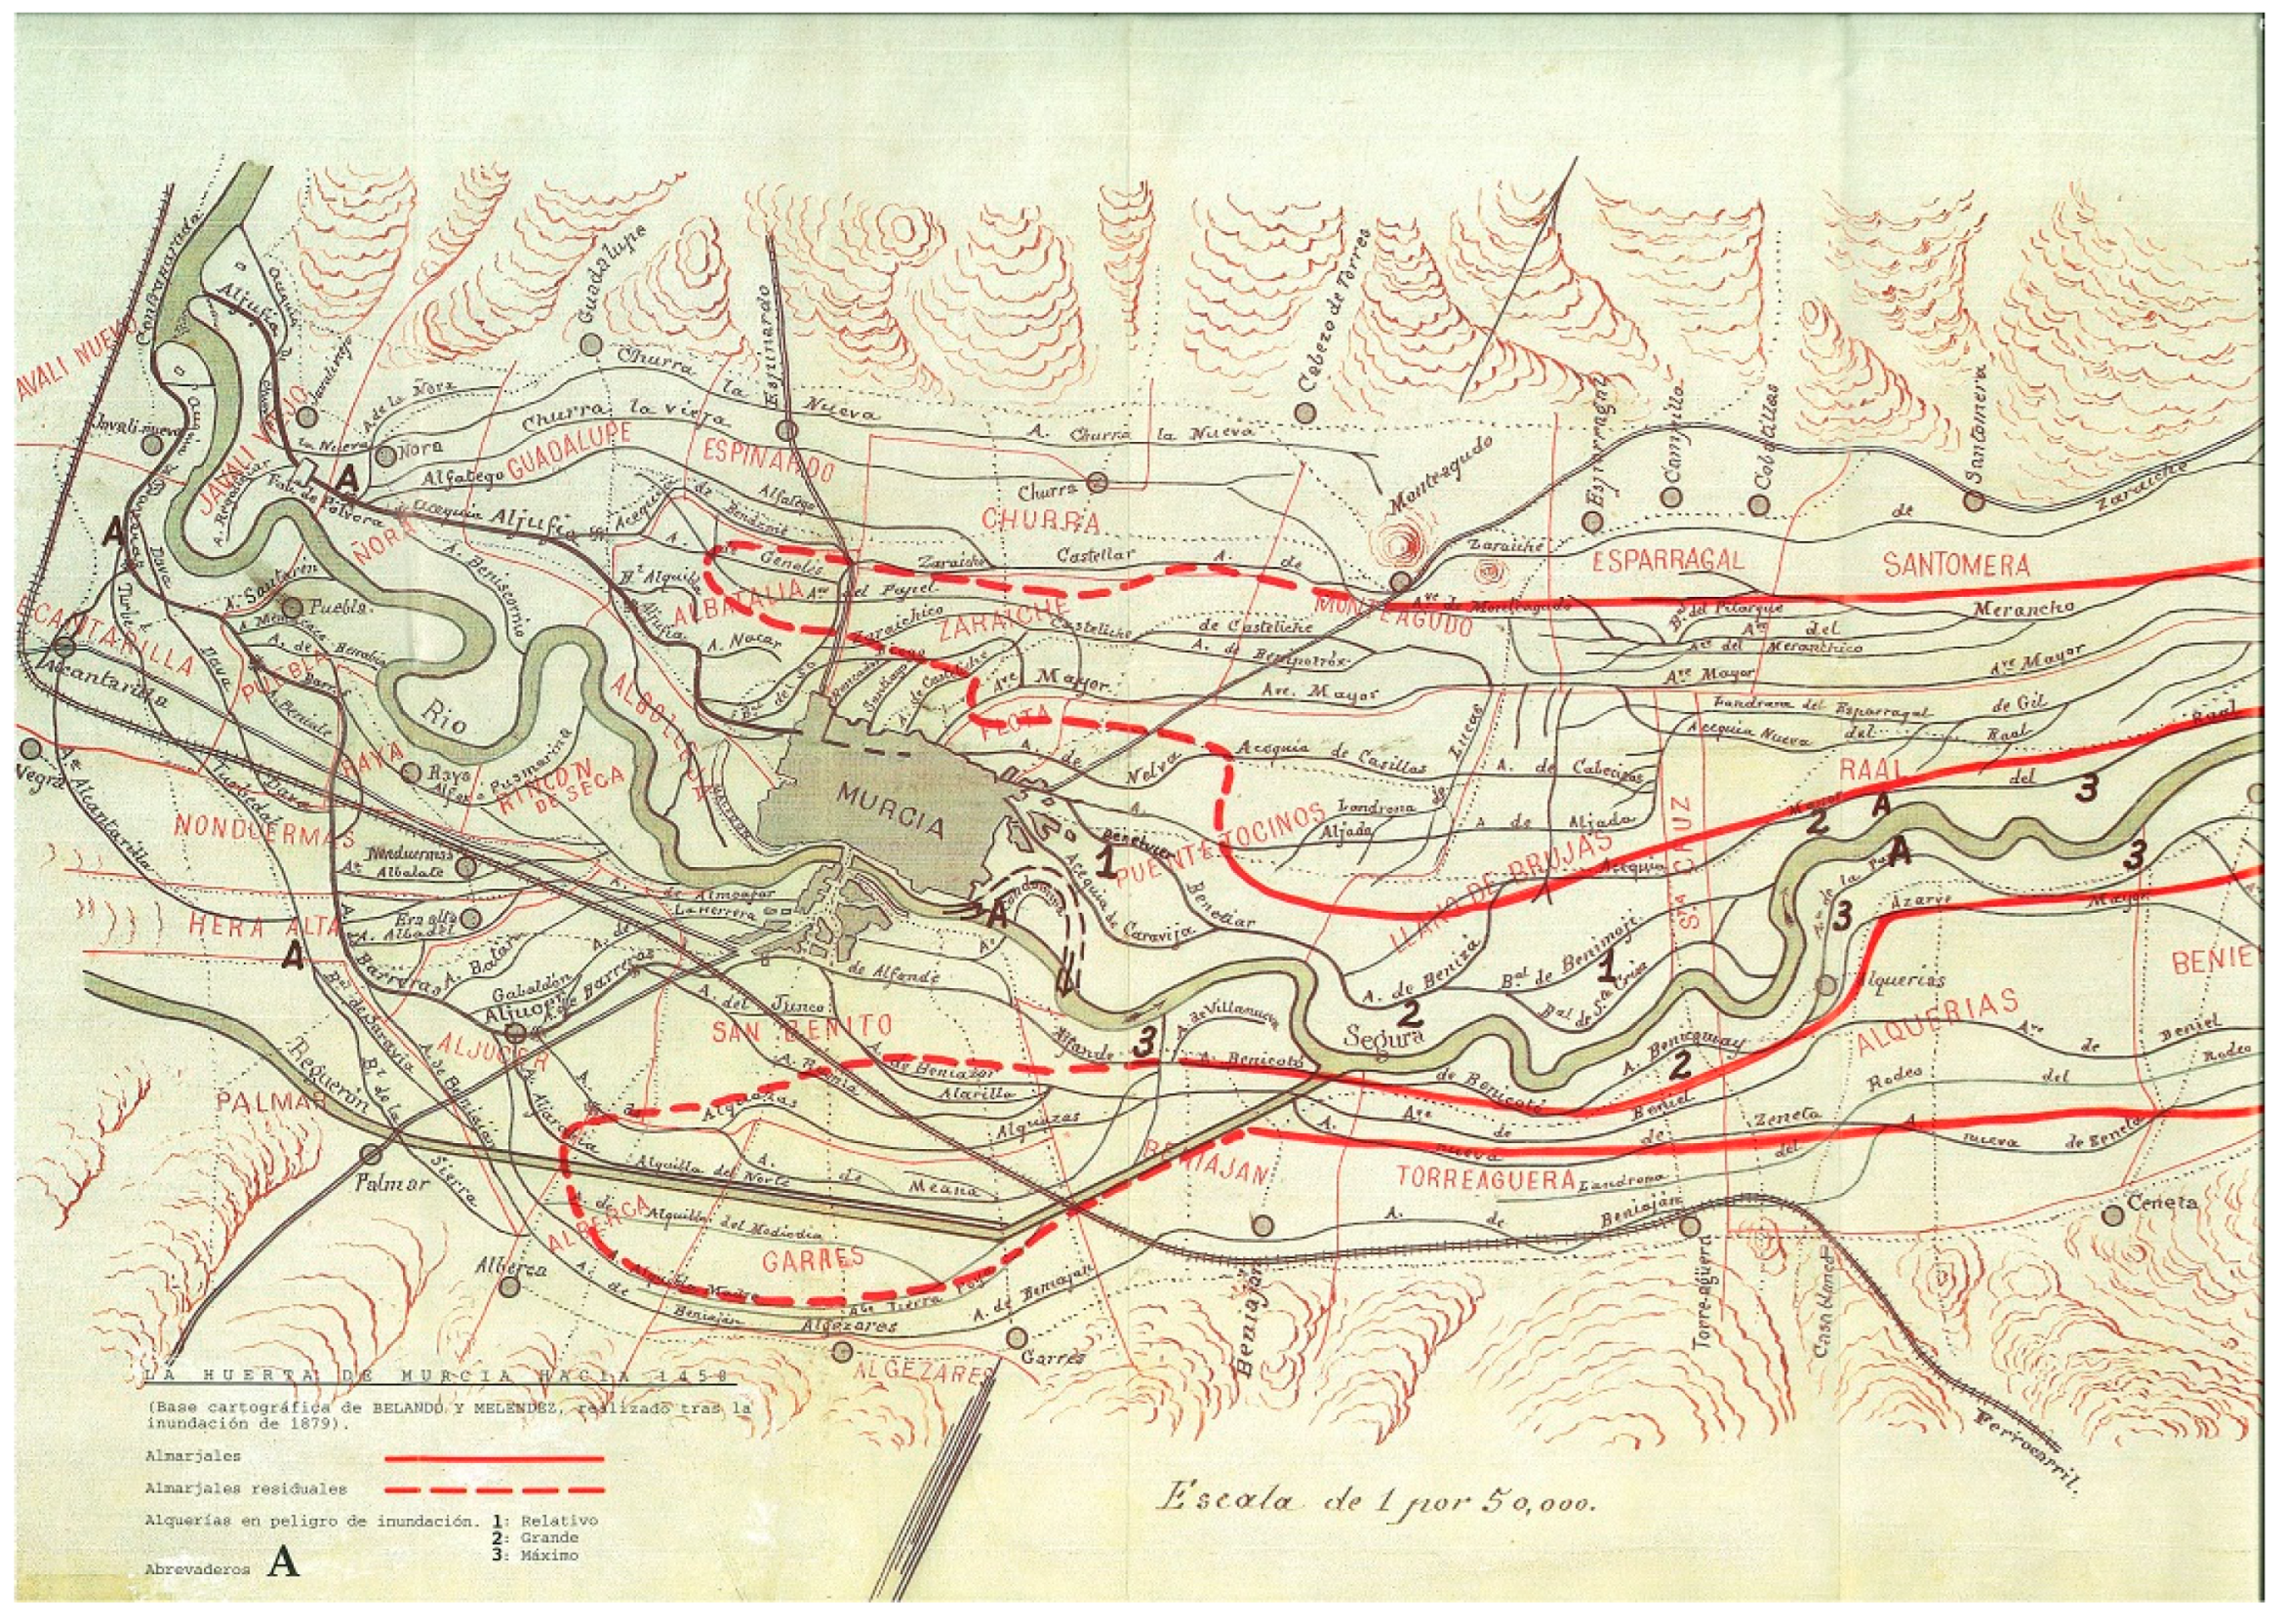
Two historical maps have been compiled and consulted, which can be considered as hazard maps of the time. The first map is a flood hazard map of areas that flood with a certain frequency. After the flood (October 1879), a series of cartographic maps was elaborated that represents the situation of the river and the irrigation network as a disseminator of the flood, with a particular focus on Murcia.
The first historical cartographic map of the flood that is noteworthy is that of Juan Belando (1879), as it constitutes a kind of hazard map, which includes areas of the former marshlands in Murcia. Furthermore, it distinguishes between three levels of flood hazard: 1: Relative, 2: Large, and 3: Maximum (
Figure 5).
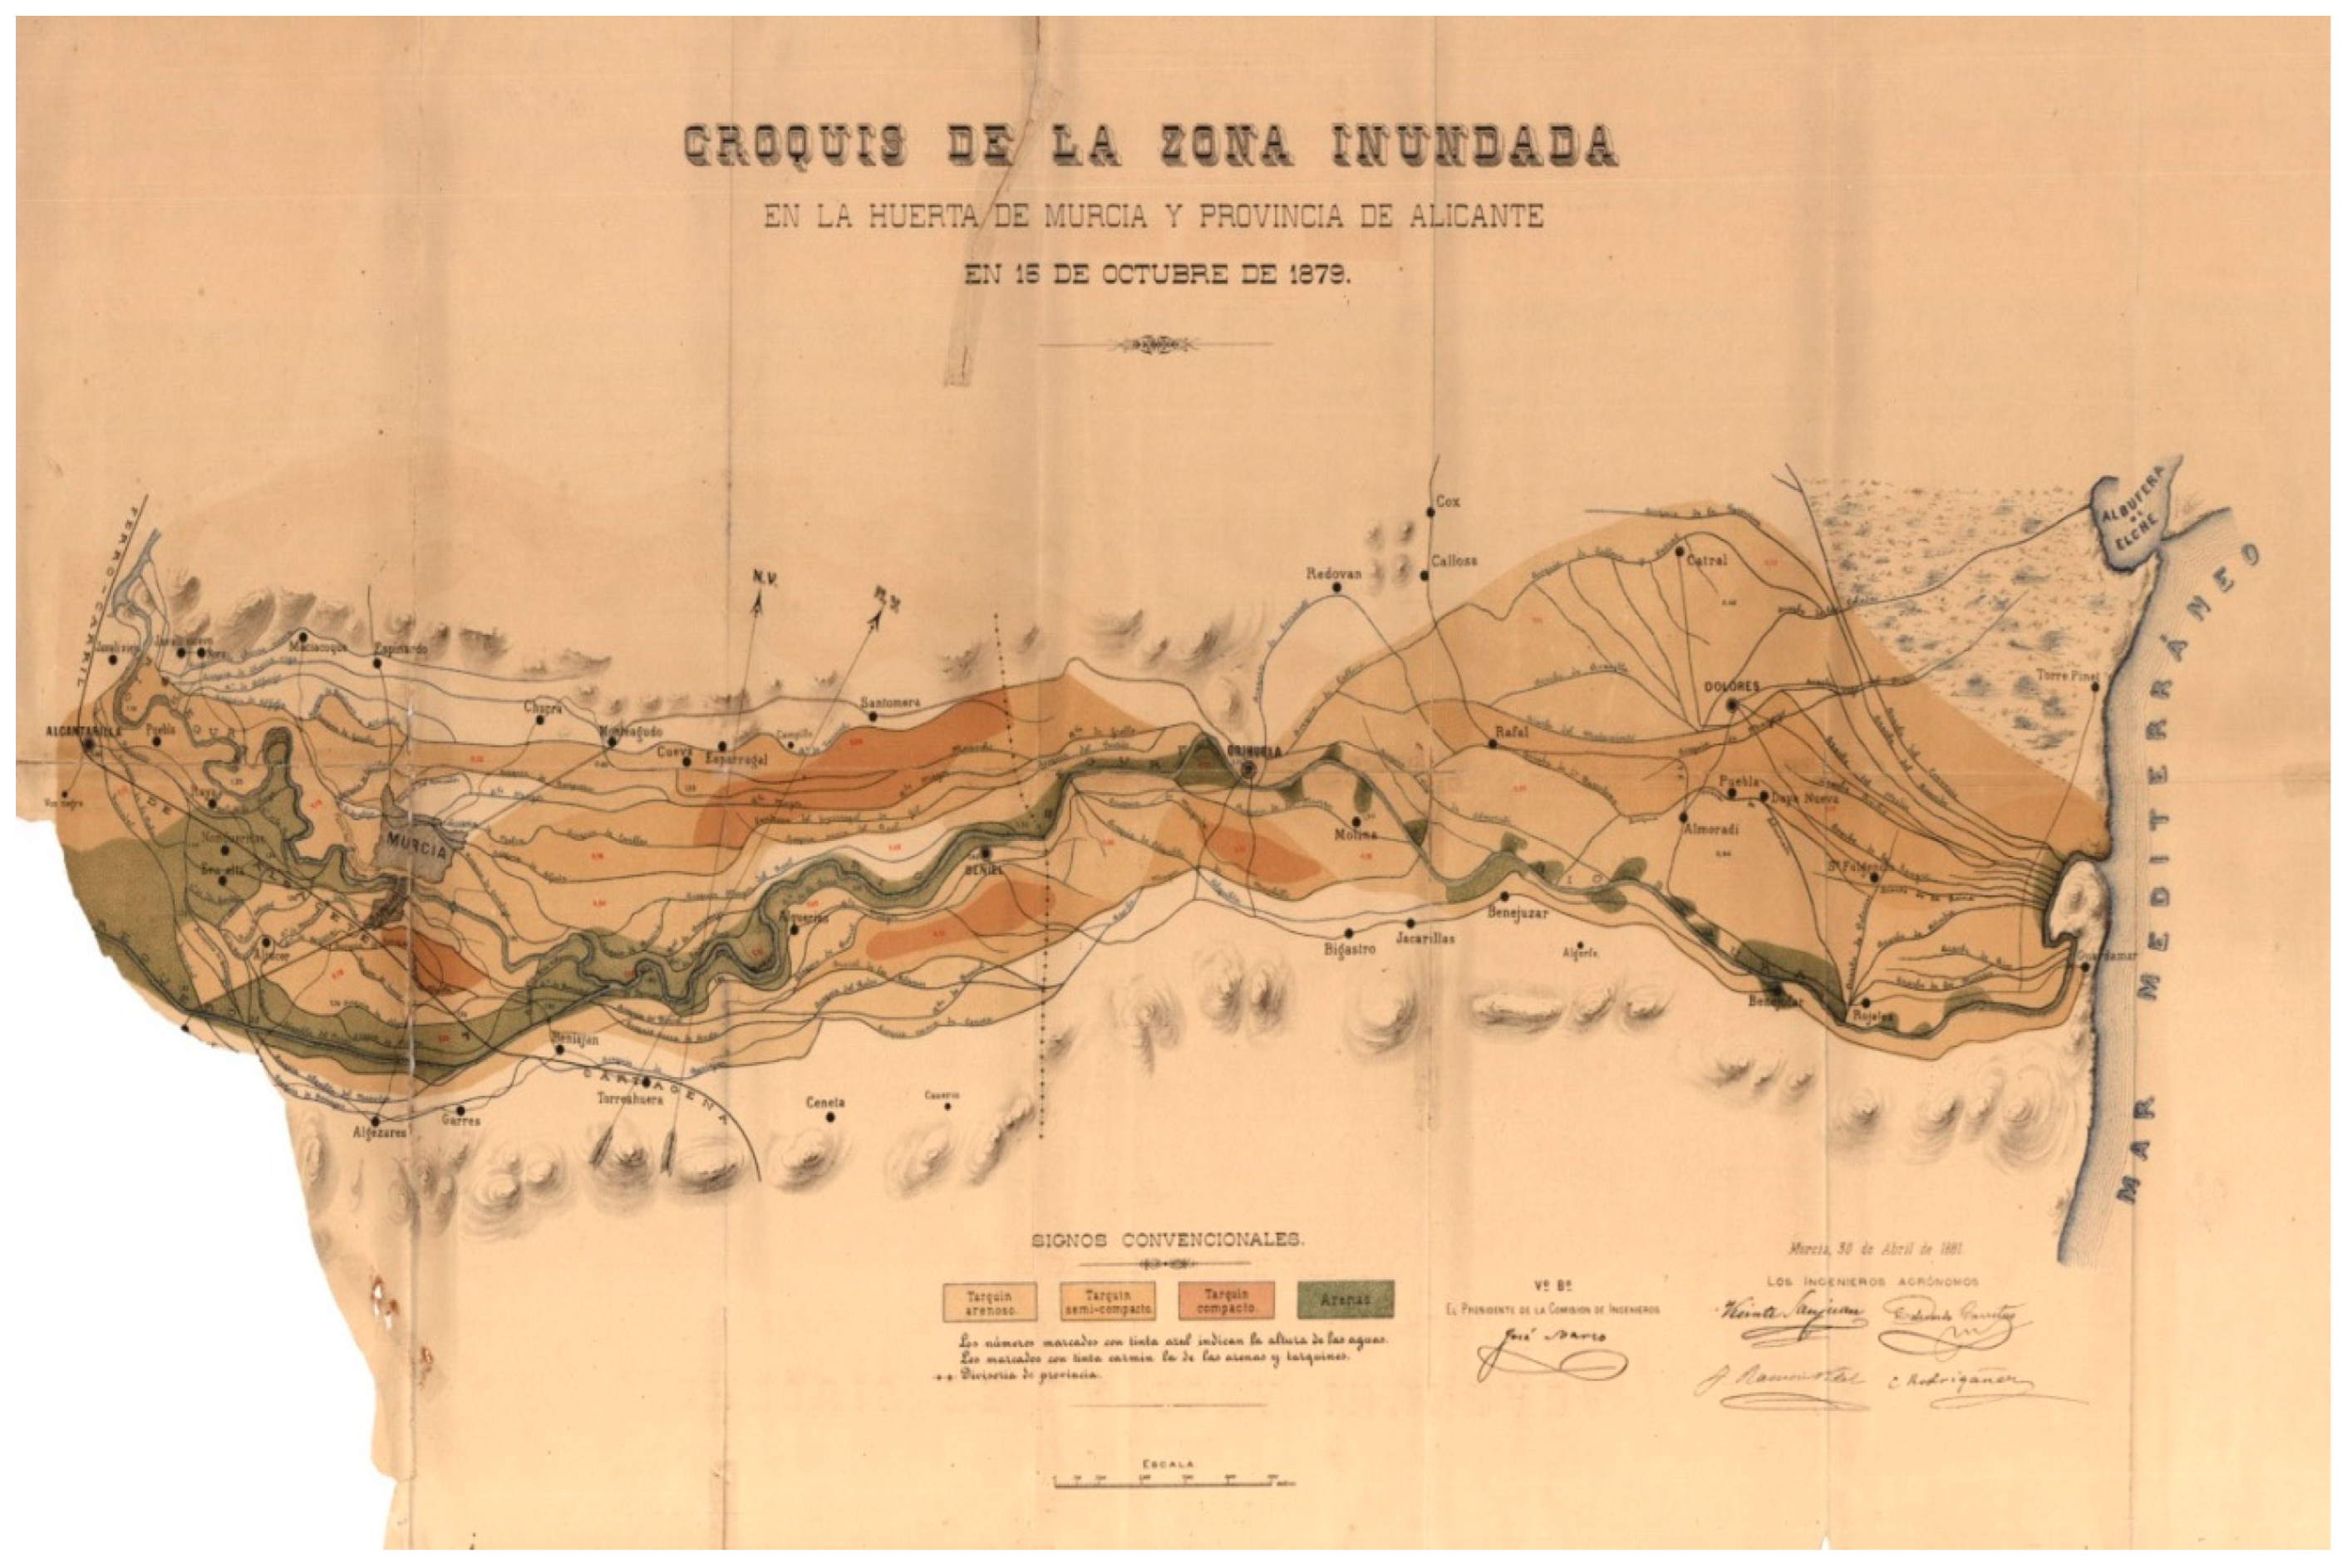
The second map was published on 30 April 1881 (two years after the flood of October 1879) after the study of the floods that occurred. A sketch was published of the flood with very detailed elements and aspects, such as the height or four types of alluvial materials (sand, sandy silt, semi-compact silt, and compact silt), enabling points of burst banks in the river (overflowing), flooded areas and water accumulation points to be identified (
Figure 6).
Although there are studies that include this map as an example of the effects of the Santa Teresa flood, an exhaustive analysis enables us to identify abundant data and details which are fundamental for understanding the flood episode and the possibility of identifying sensitive points.
These points, shown on the historical map of 1881 as “Arenas”, are the most vulnerable points for the overflowing of the Segura River, especially in the sharp bends as it passes through Murcia and at different points of the Vega Baja del Segura.
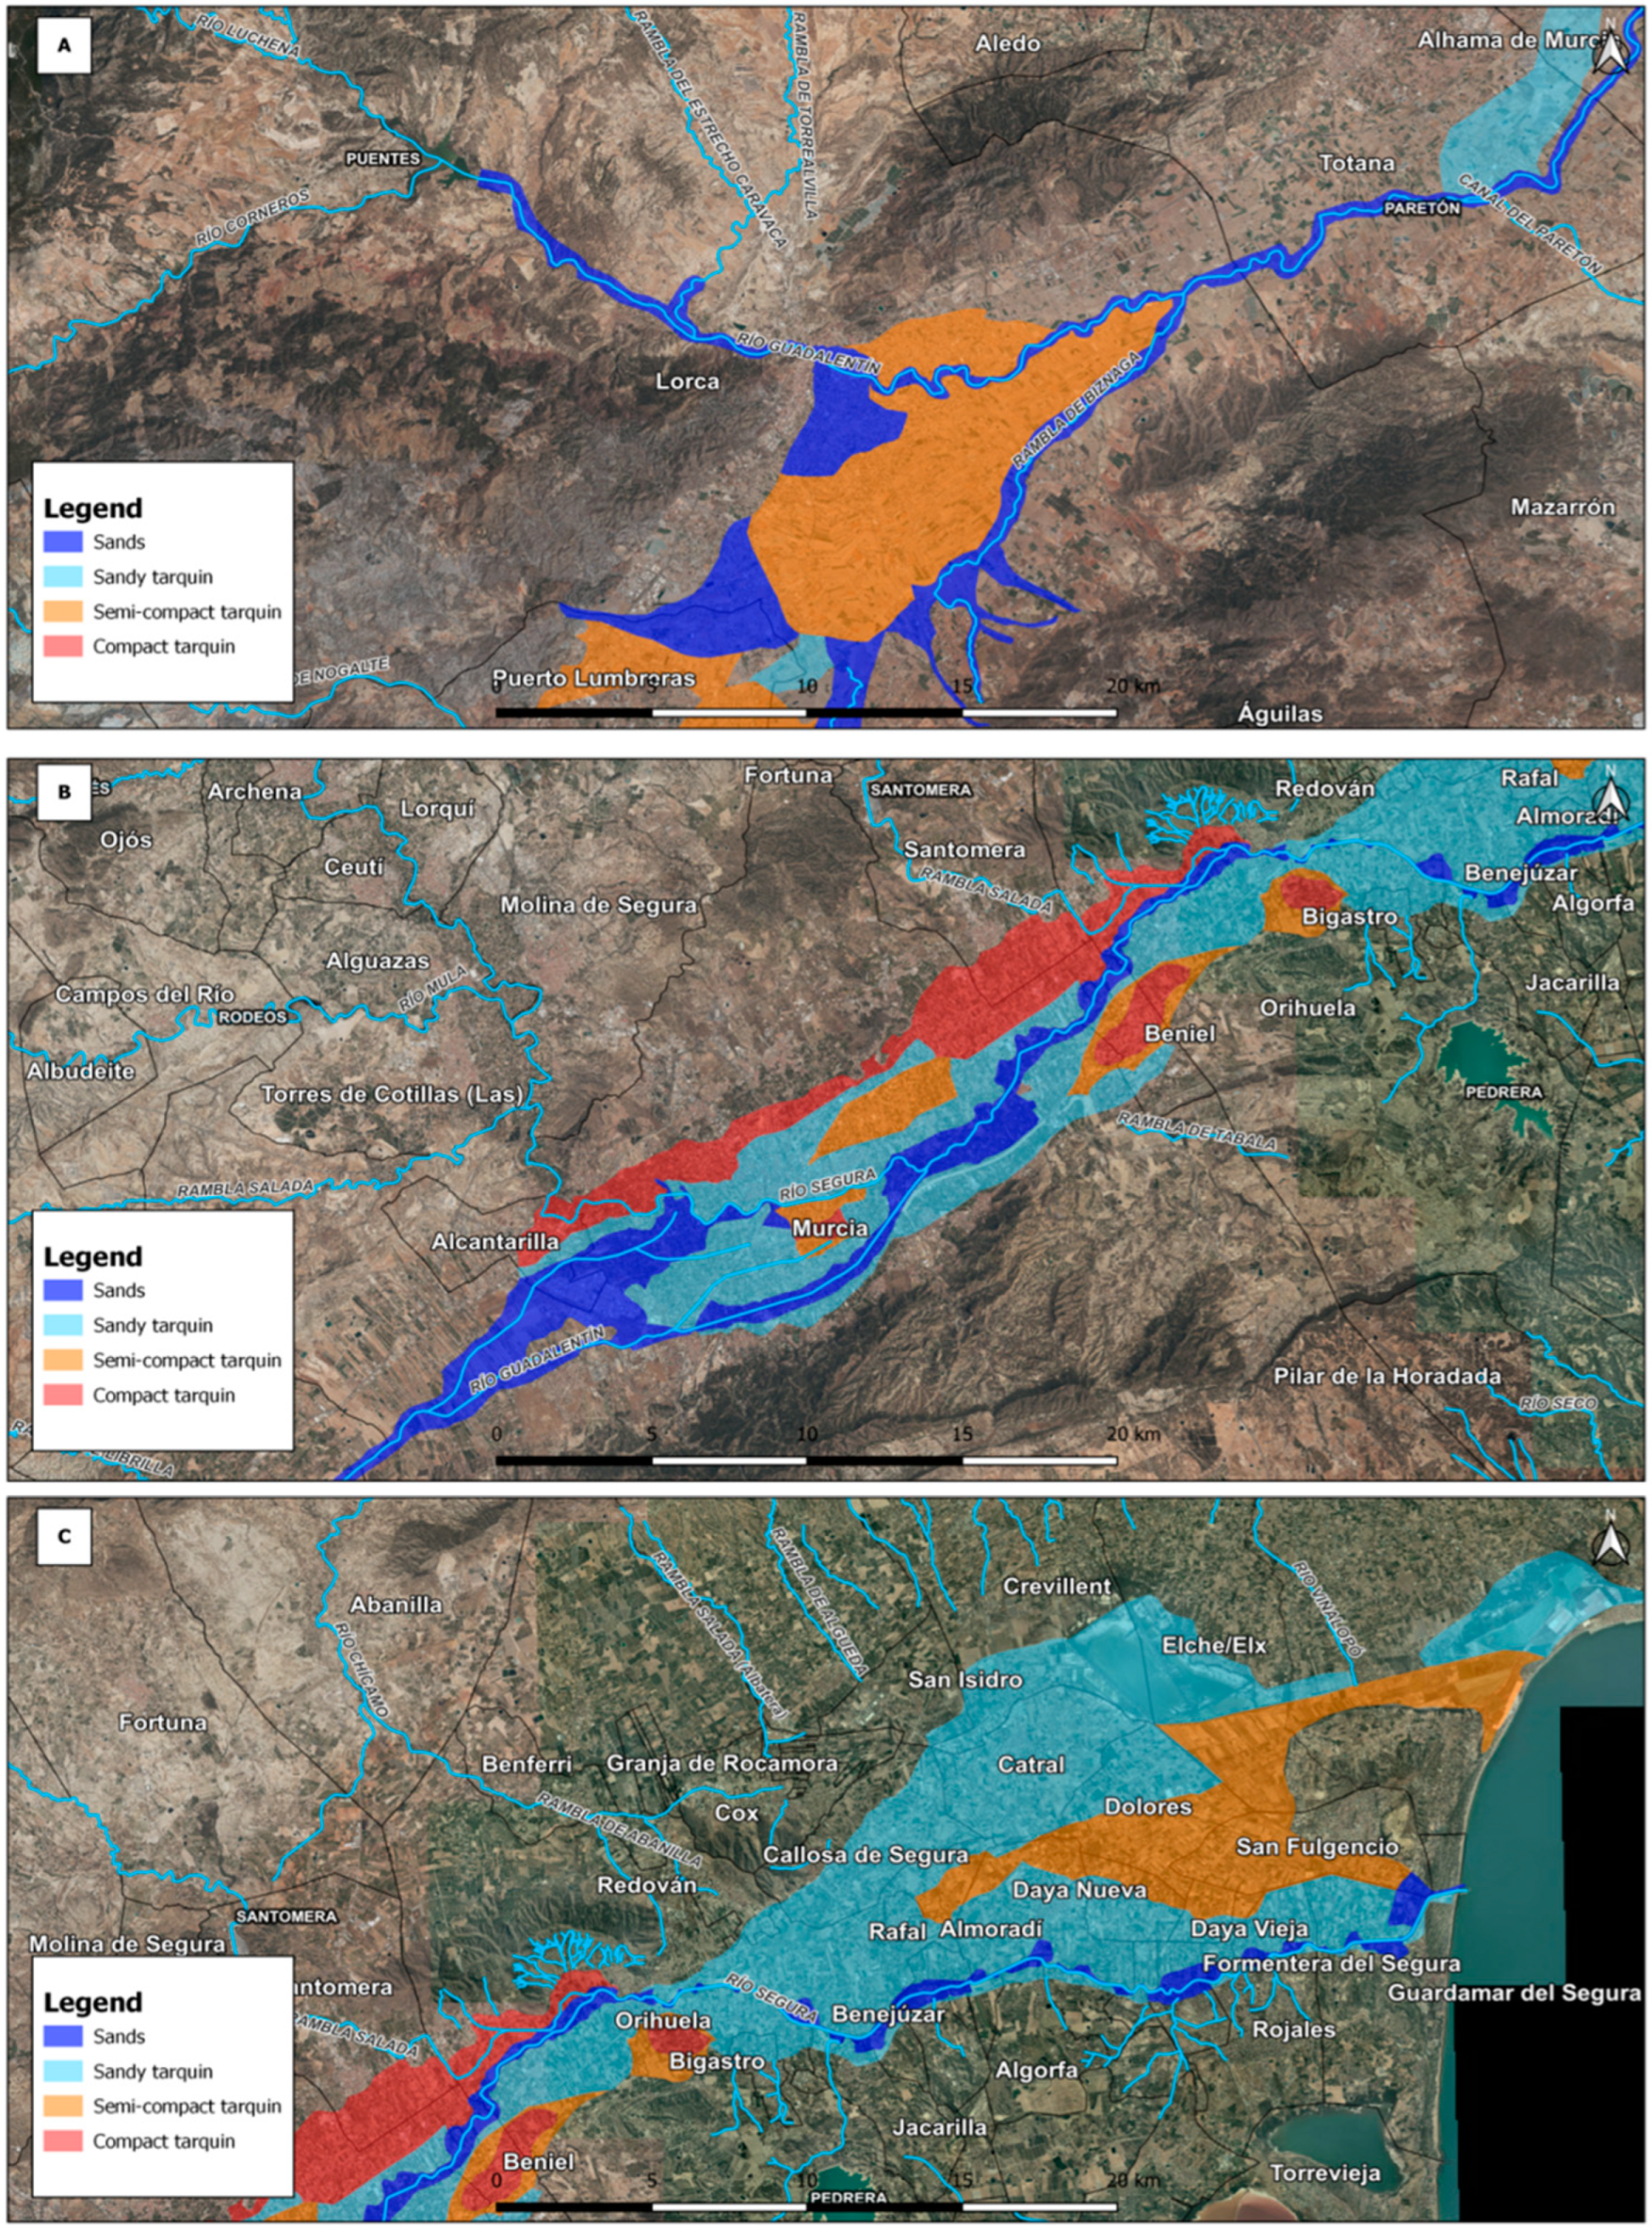
Furthermore, it was considered necessary to reconstruct cartographically the sketch of the Santa Teresa flood of 1881 in a GIS map (Geographic Information System) to adapt it to the current projections. The methodology to carry out the cartography was performed manually by means of photointerpretation. For this purpose, a vector and polygonal layer was created in shapefile (.shp) format.
A database (BB.DD.) was created in this vector layer. For this purpose, four IDs were created according to the type of material used to draw the 1881 map of the 1879 flood. The four classes created were: “Sands”, “Sandy tarquin”, “Semi-compact tarquin”, and “Compact tarquin”.
When the vector layer was created, it appeared as a single polygon and a single colour. In the properties of the vector layer it could be classified according to the selected class “ID” or “Materials”. The class “Materials” was chosen and assigned four different colours in relation to the size of the material and its volume in water. Thus, thinner materials were in dark blue and light blue, and thicker or more compact materials were in orange and red.
However, this map only reflects the situation from Contraparada (Murcia) to Guardamar del Segura (Alicante). Therefore, taking into account the detailed description by González López (2013) [
44] of Lorca, a map of the flooded area in each municipality was produced, according to the legend of the 1881 sketch. In this way, not only has the Santa Teresa flood map been reconstructed for current projections (SCR UTM Zone 30 N, EPSG: 25830), but it has been expanded to include Lorca, as a novel aspect with respect to traditional investigations (
Figure 7).
2.4. Calculating the Total Built-Up Area in the Flood Zone of the Guadalentín Valley and Segura River Valley
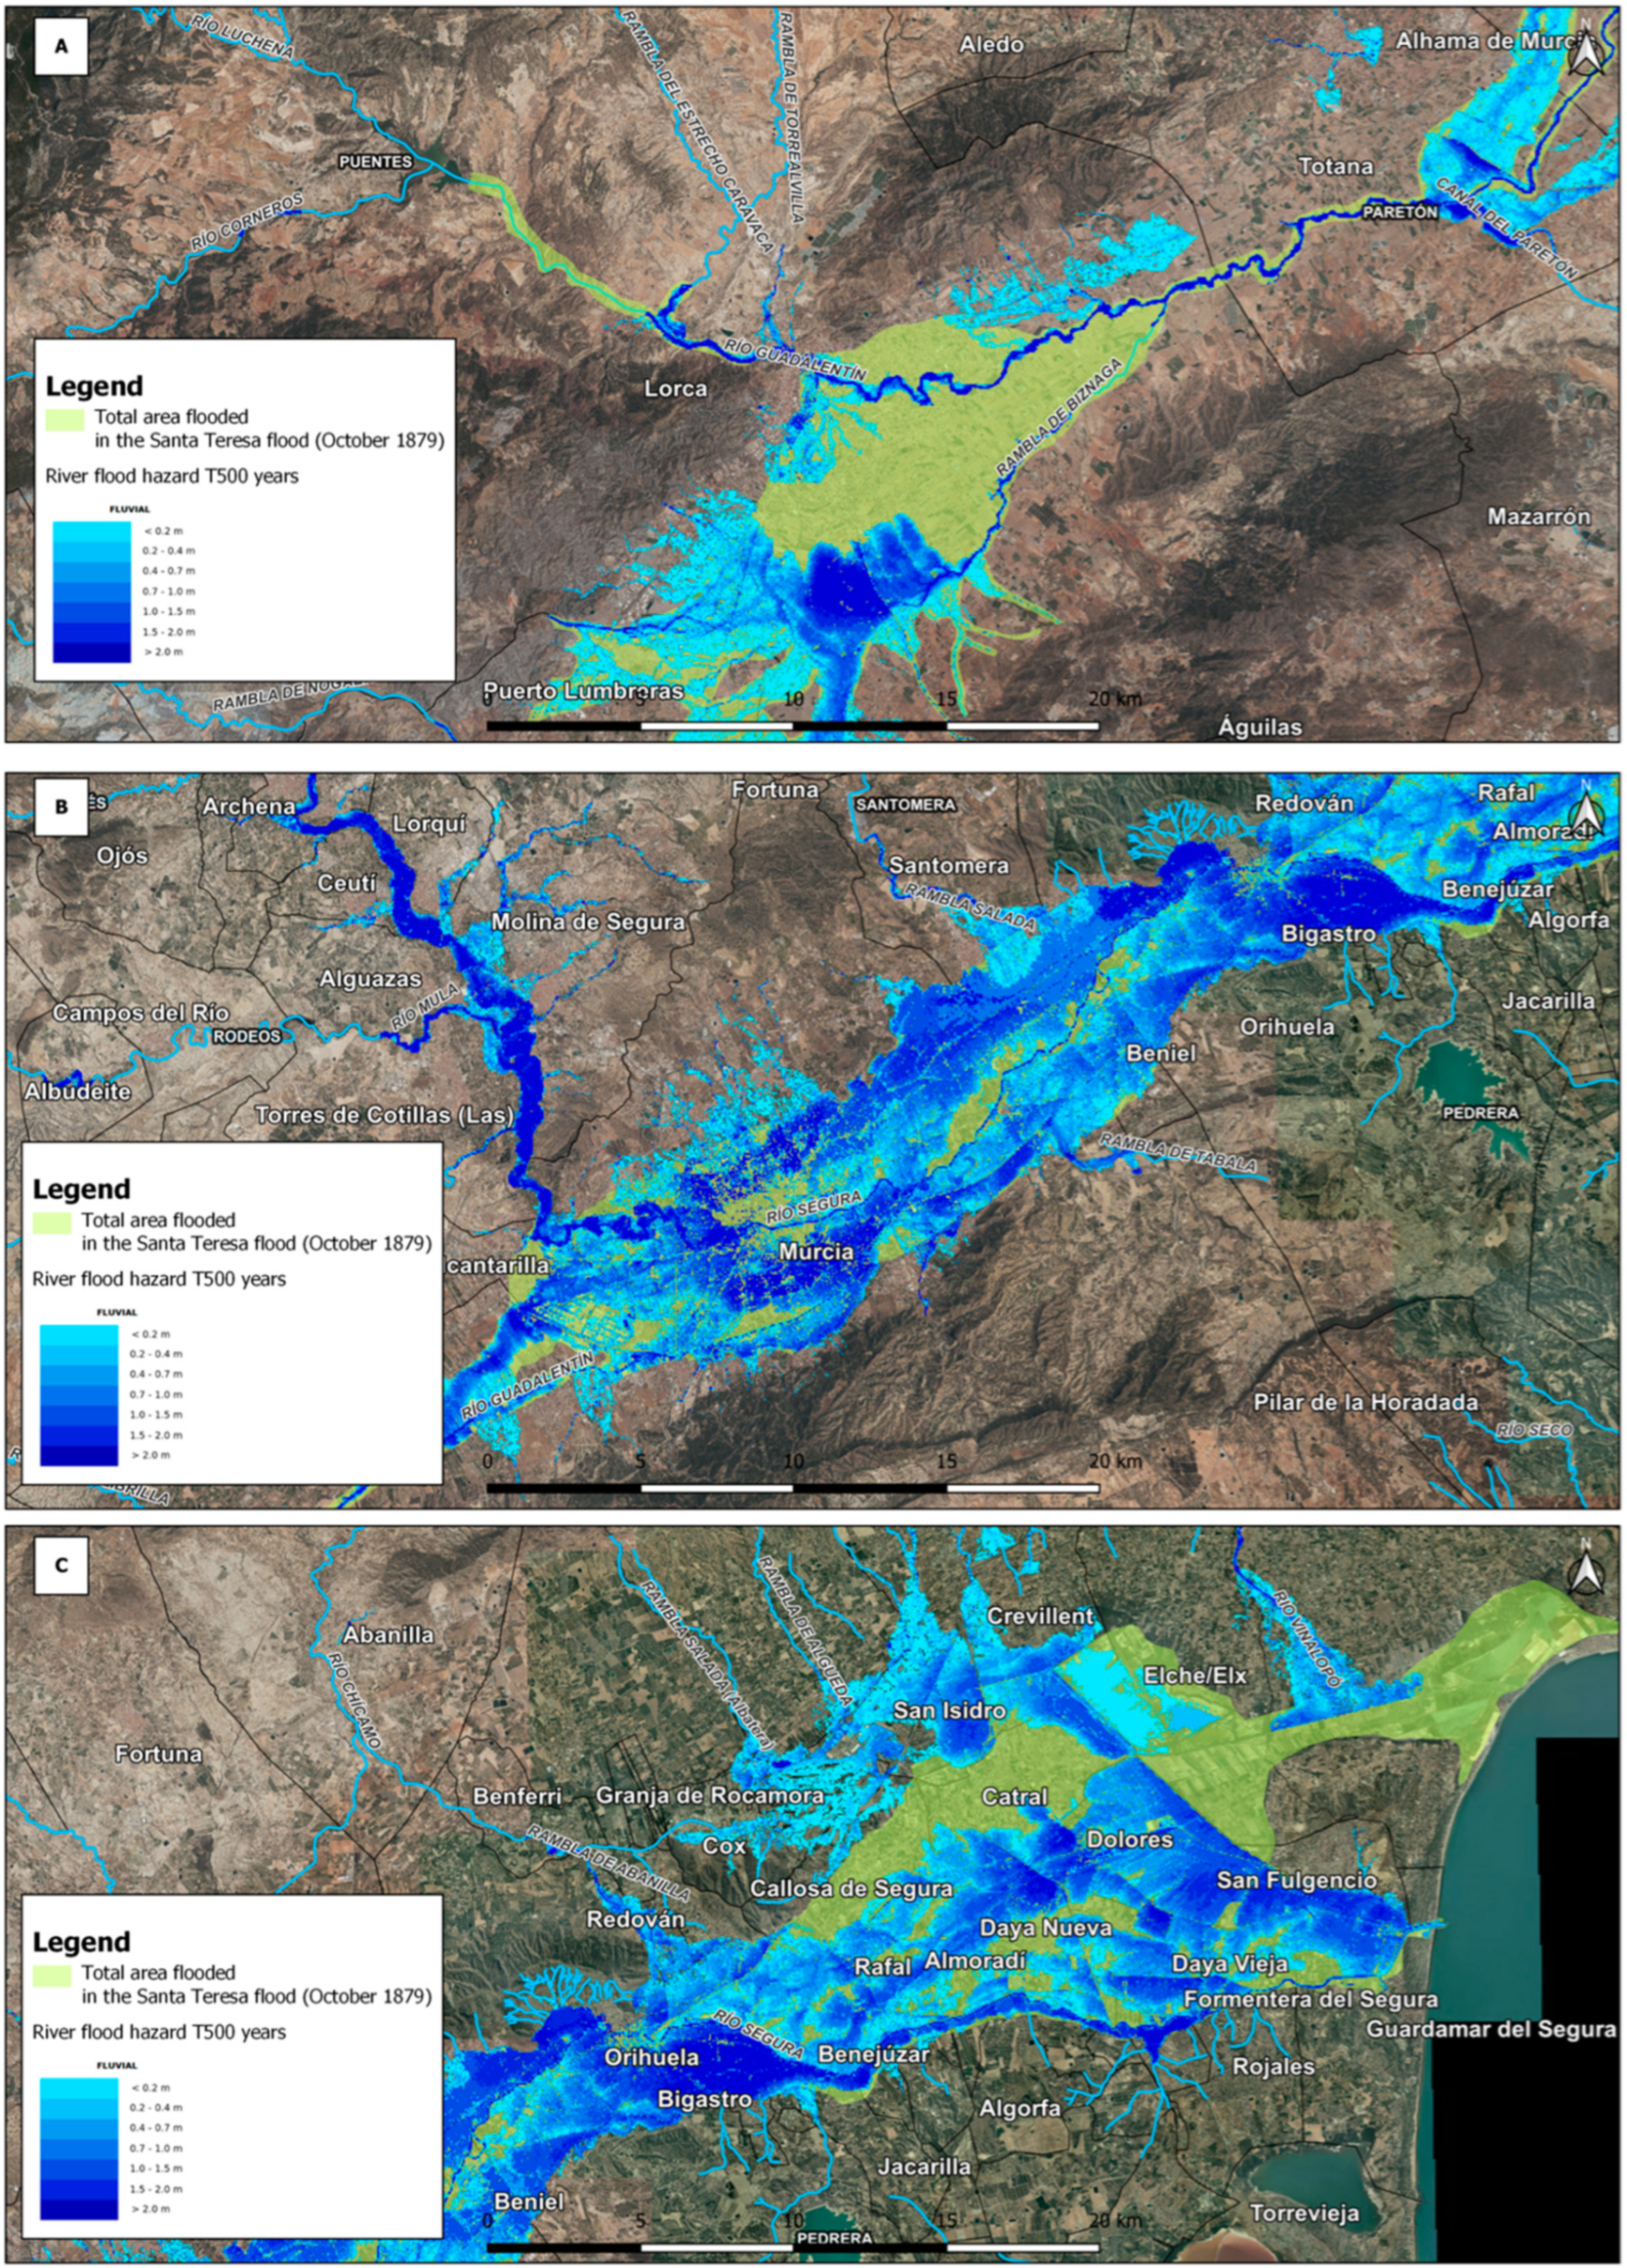
After reconstructing the map of the Santa Teresa flood with its flooded areas in Lorca, Murcia and the Vega Baja del Segura, a comparison between the area of the flood and the very latest modelling and cartography of the Spanish National Cartographic Systems for Flood Areas (SNCZI) was made. To consult this layer, a WMS connection was made, given that the results of the modelling were in raster image format and therefore, it was more suitable for consulting the depths than vector format. The layer used corresponded to the flood hazard associated with a 500-year return period.
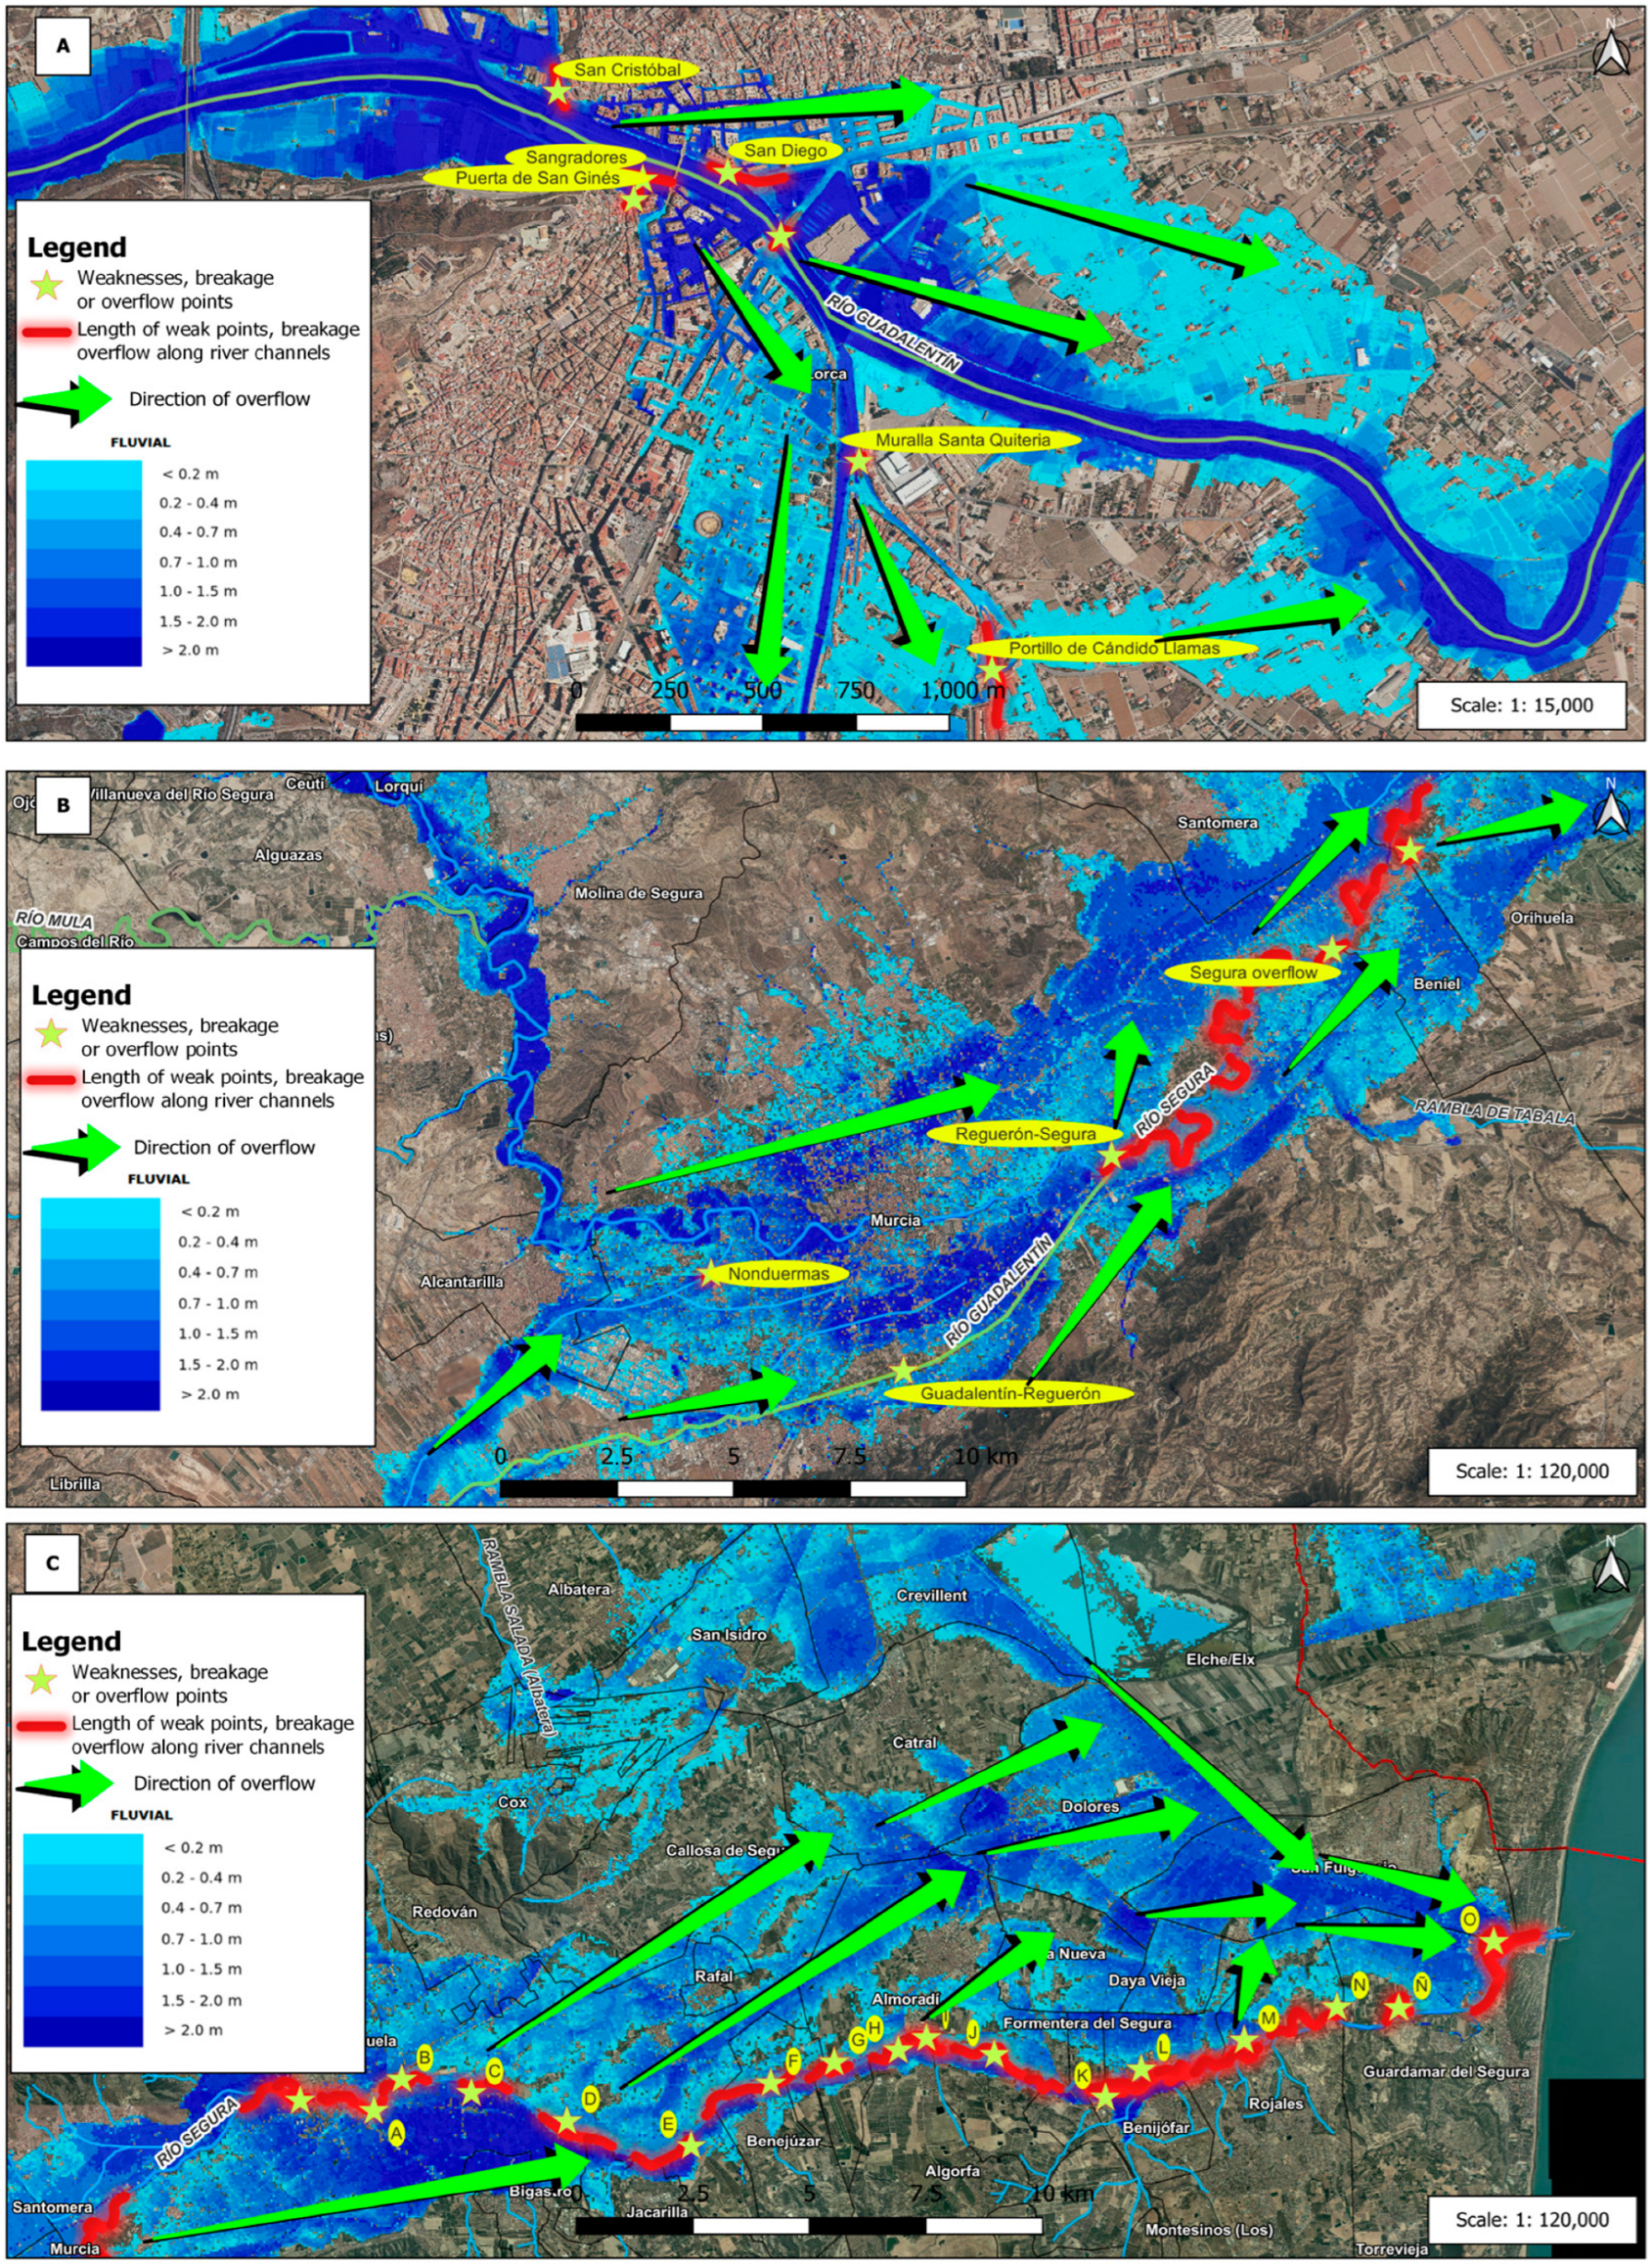
After obtaining the layers, a single colour was assigned to the flooded area of the Santa Teresa flood (1879) and the WMS image of the SNCZI was superimposed. In this way comparative maps of the flooded area were obtained. Given the similarity of the two floods, other maps were elaborated which reflected the points of weakness, burst banks, overflows, or the presence of barriers or walls that hindered the running of the water and caused more damaging floods in certain areas. In turn, the raster image of the river flood hazard (T500 years) was incorporated to simulate the effect of the Santa Teresa flood in the present day.
The results of
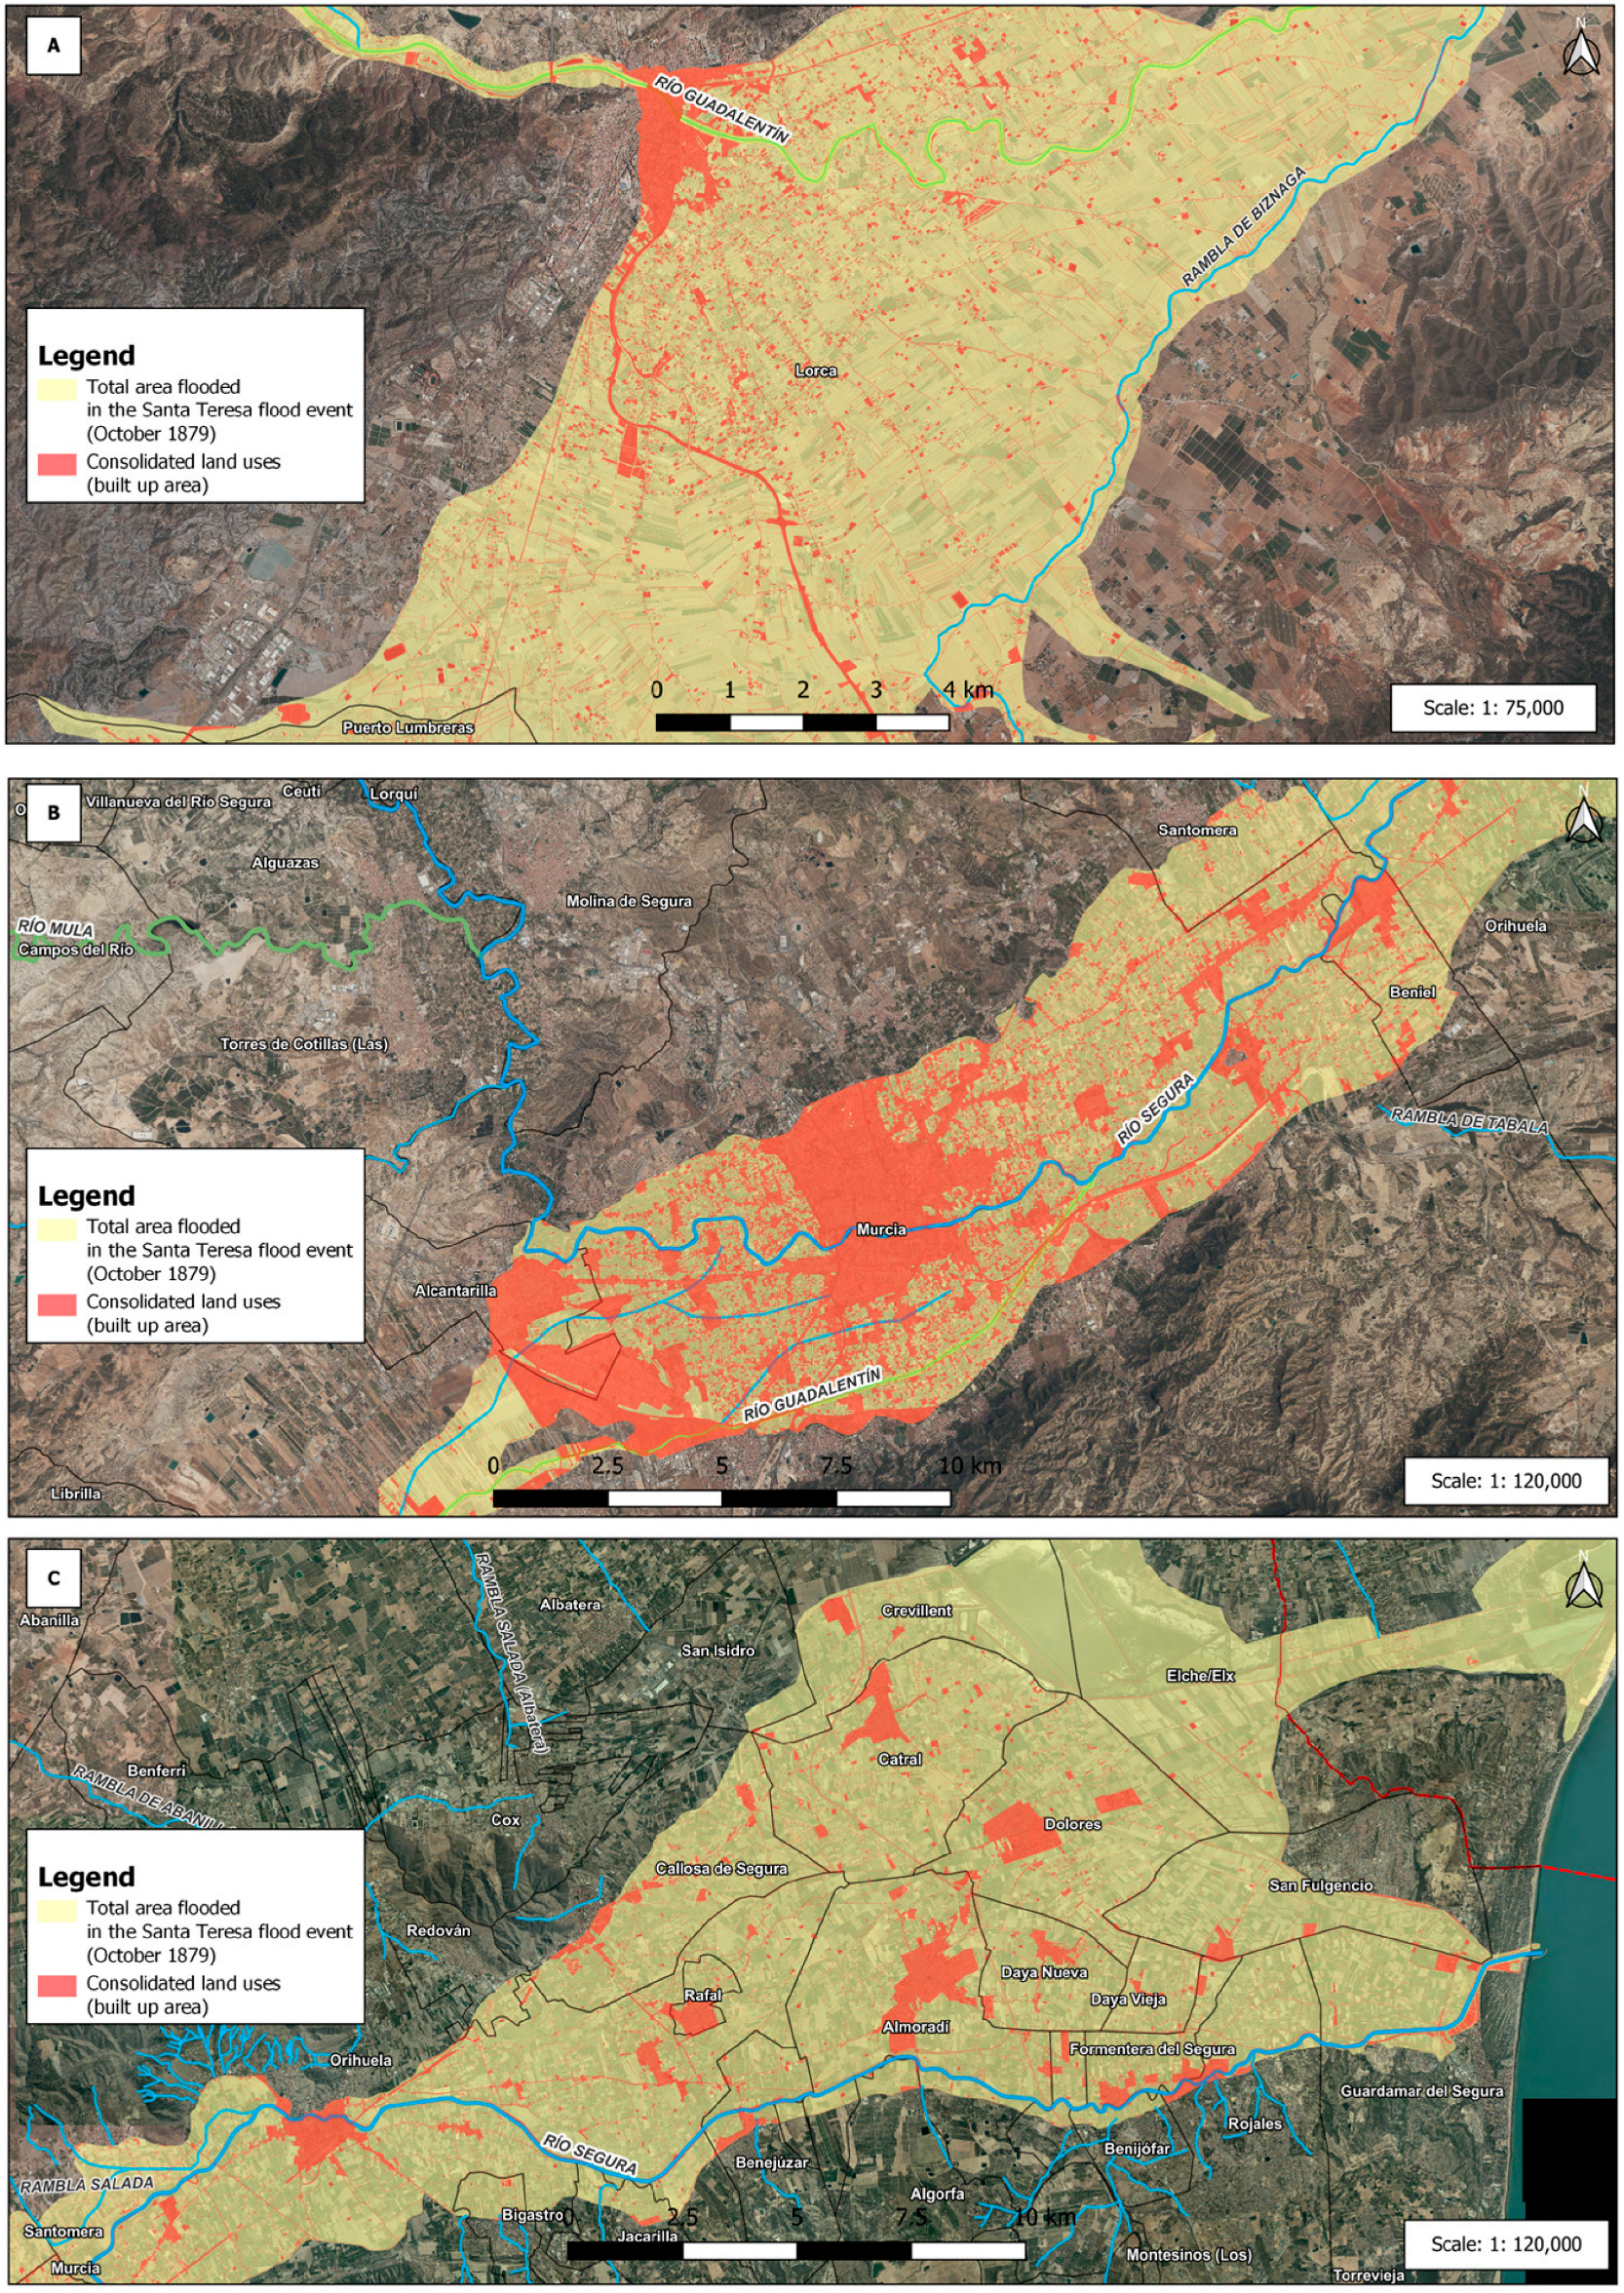
Section 3.2 were obtained through the downloading of data from the Land Cover Information System of Spain (hereafter, SIOSE) in high resolution (SIOSE AR), available in the National Geographic Institute (hereafter, NGI). Clip geoprocessing was applied between the layer of the surface area flooded by the Santa Teresa flood and the land uses of the area of study. After obtaining the resulting layer, a selection of attributes was made based on the coverage code (ID_Cove) corresponding to a type of description, related to built-up or artificially consolidated land (
Table 2).
Subsequently, a sum of all of the polygons of each of the previously mentioned land uses was made, obtaining the total built-up or consolidated area.
The results obtained were reflected in a map of consolidated land uses in the floodable area of the Santa Teresa flood and a table of data with their percentage values.
Finally, in the discussion section, the results obtained are analysed, highlighting the importance of taking into consideration historical information and cartography to understand the effects of flood episodes and their implication with the most important aspects of land use planning and river basin management.
4. Discussion
The methodological process applied in this research can be used by any interested party who wants to reconstruct a historical mapping of a past flood, where georeferencing is not the best tool in order to avoid distortion of the historical map. This was the main problem encountered by the authors.
For this, it is necessary to have the historical description, sketches, plans, or historical maps, and to have a good knowledge of the analysis area to know which areas are prone to be flooded and which are not.
The use of historical maps and documents enabled us to reconstruct the map of the flood zone in the Santa Teresa flood, completing the initial sketch made in 1881. Furthermore, we obtained the maximum area of this flood event, allowing us to compare it with the current map elaborated by the SNCZI. The comparison of the two maps reveals a great similarity with respect to the flood zones, although there are certain differences in some sectors, which the SNCZI map does not currently contemplate as possible affected areas, therefore showing a small difference in very specific sectors. However, the rest of the flood zone (99.38% of the coinciding area) is practically identical, in spite of the regulation works existing in the basin today. It is worth noting that the comparison was made with the river flood hazard map associated with a 500-year return period.
Moreover, using the “sand” layer, the historical map has shown points of weakness, rupture, or overflow throughout the courses of the Rivers Guadalentín and Segura. In particular, there are several rupture points in the Vega Media section of the River Segura that coincide with the confluence of the Canal de El Reguerón (an artificial canal that collects the waters of the Guadalentín) with the River Segura, together with sharp meanders. However, the highest number of “Sand” layers is in the Vega Baja del Segura district, which enables us to identify the most sensitive points and those prone to the overflowing of the River Segura as it passes through the Vega Baja del Segura. In fact, some of these points have been the cause of the subsequent floods in the Vega Baja del Segura district, with many playing a part in the flood of September 2019.
Therefore, superimposing the layer of weak points or points prone to overflowing or bank bursts with the SNCZI map and assuming a great similarity with the flood of October 1879, we are able to identify the current sensitive or affected areas. In fact many overflow areas of the Rivers Guadalentín or Segura shown by the SNCZI modelling for a 500-year return period coincide with the same rupture or overflow points of the Santa Teresa flood.
Furthermore, the results show a progressive mass occupation of the river valley of the Rivers Guadalentín and Segura in the Region of Murcia and in the south of the Region of Valencia, in the Alicante district of Vega Baja del Segura. This mass occupation occurred in parallel along the whole of the Mediterranean coastline, particularly in the period 1990–2007, which, as indicated by certain authors, gave rise to a completely enclosed space [
52], as crop land had been converted into built-up spaces. This represented a greater exposure of the population to the flood risk existing in these two large river valleys.
The flood episode chosen for the study is the largest event in the Segura basin due to its impact on the population as a result of the enormous swelling of the River Guadalentín and the devastation caused with the confluence of this river with the River Segura downstream until its discharge into the sea. However, this major flood episode has not constituted an element to take into consideration in the territorial management and planning of the area, even though it is one of the most effective and cheapest measures for adapting to flood risk.
The flood of October 1879 led to the naming of the Commission responsible for designing a flood-defence plan in the Segura and Almanzora valley and the holding of the Congress against Floods in the Levante Region in Murcia in 1885. The conclusions obtained in the studies presented in this congress and the assessment of the Commission enabled priority flood-defence actions to be established in the Segura basin. They included the urgent need to focus the first actions in the Guadalentín basin and to protect the urban centres of Murcia and Orihuela [
34].
All of this gave rise to the “Segura Valley Flood Defence Project” in the year 1886. In summary, the proposed actions can be divided into three large groups: (a) works that directly combat overflows with longitudinal dikes (walls, channels); (b) works that modify the water regime (dams, reservoirs, lakes, bypass channels, hydrological–forestry corrections); and (c) indirect measures, such as insurance, savings deposits, support, crop selection, and the regulation of floodable zones.
Therefore, the works proposed in the plan were: (1) the heightening and rehabilitation of the Valdeinfierno reservoir, (2) the construction of the Agua Amarga reservoir, which was subsequently replaced with the construction of the Puentes III reservoir, (3) the bypass channel of the River Guadalentín in Totana, diverting the waters to the Moreras watercourse and discharging them into the sea in the municipality of Mazarrón, (4) the widening and dredging of the El Reguerón canal, and (5) the construction of reservoirs at the headwaters of the River Segura and its tributaries on the right side. The only action undertaken was the widening of the El Reguerón canal, as the Puentes III dam (1881) was constructed two years after the Santa Teresa flood before including it in the cited defence plan. The rest of the actions were carried out throughout the 20th century after the approval of different plans.
Even though only one action of those proposed in the Plan was implemented, it is considered as a milestone in Spanish hydraulic history, with the majority of the others being included in subsequent flood-defence plans until the approval of the Segura Basin Flood-Defence Plan in the year 1987, after the floods of November 1987 and after other major historical floods such as the ones in April 1946, October 1948, and October 1973, among others.
However, the Segura Basin Flood-Defence Plan approved in 1987 does not class as a “model” flood the one occurring in October 1879, but uses the flood of 1973 as a model flood. It was smaller even than that of 1987, that of 1946, or that of 1879. The action proposals executed today can be classified into two large blocks: (1) actions in the Guadalentín basin and (2) actions in the Segura basin.
In the case of the former, the construction of the Puentes IV reservoir was proposed, together with the channelling of the River Guadalentín in Lorca, the conditioning of the watercourses, the widening of the Paretón canal of Totana, the construction of the Romeral or Engineer José Bautista Martín dam, and the widening, again, of the El Reguerón canal. For the second group, the construction of six dams was proposed to regulate the Segura tributaries on its left and right sides (Moro, Judío, Cárcabo, Pliego, Rodeos, and José Bautista), together with channelling and the widening of the canal of Paretón de Totana, the conditioning of the El Reguerón canal, the channelling of the River Segura from Contraparada (Murcia) to Guardamar del Segura (Alicante) through meander cut-offs, and a transfer channel from the River Argos to the River Quípar. Also contemplated were defence actions in towns, for example, the channelling of the watercourse of Hondón in Cartagena, the conditioning of the River Guadalentín and the Tiata watercourse in Lorca, or the design of a bypass in Orihuela (which was not executed). In addition to all of these actions was the hydrological–forestry correction based on the forest repopulation of the basins. Finally, we also have a list of the new works studied.
Therefore, the effect of the Santa Teresa flood on the subsequent territorial planning was more negative than positive. Territorial actions based on planning that avoids the occupation of floodable areas were not undertaken. Basically, hydraulic civil works were carried out that were proposed in the Segura Basin Flood-Defence Plan of 1885.
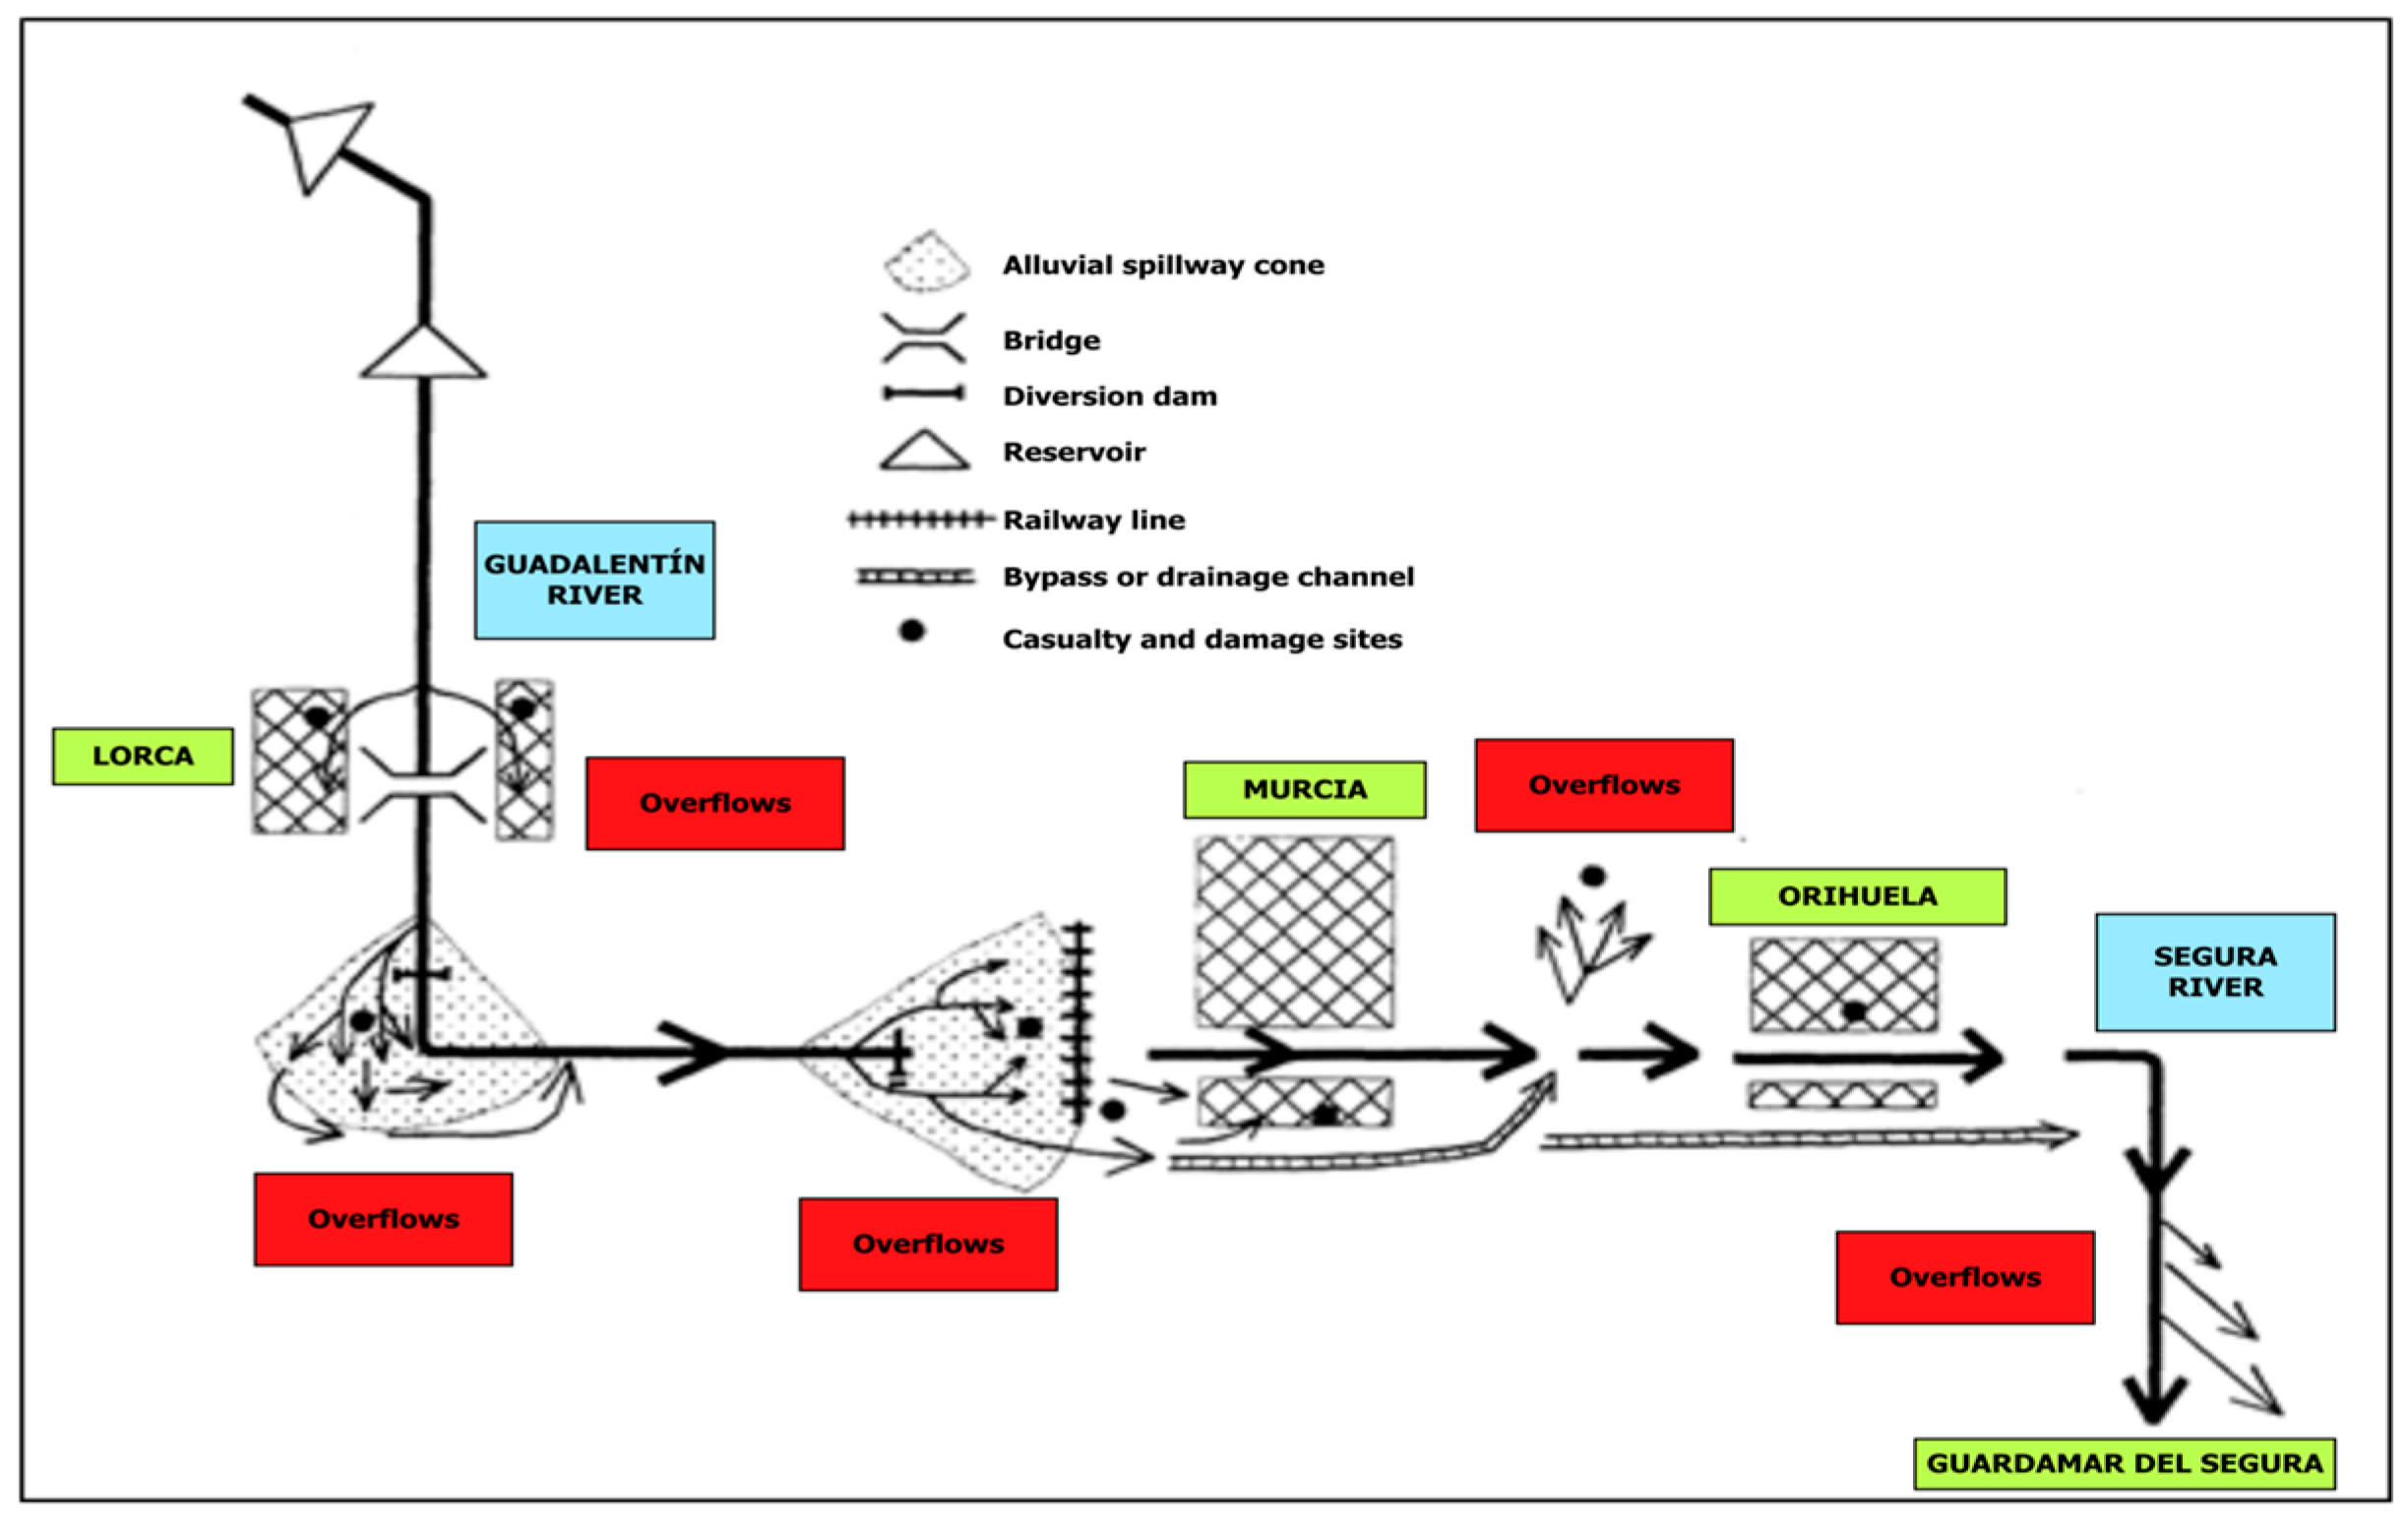
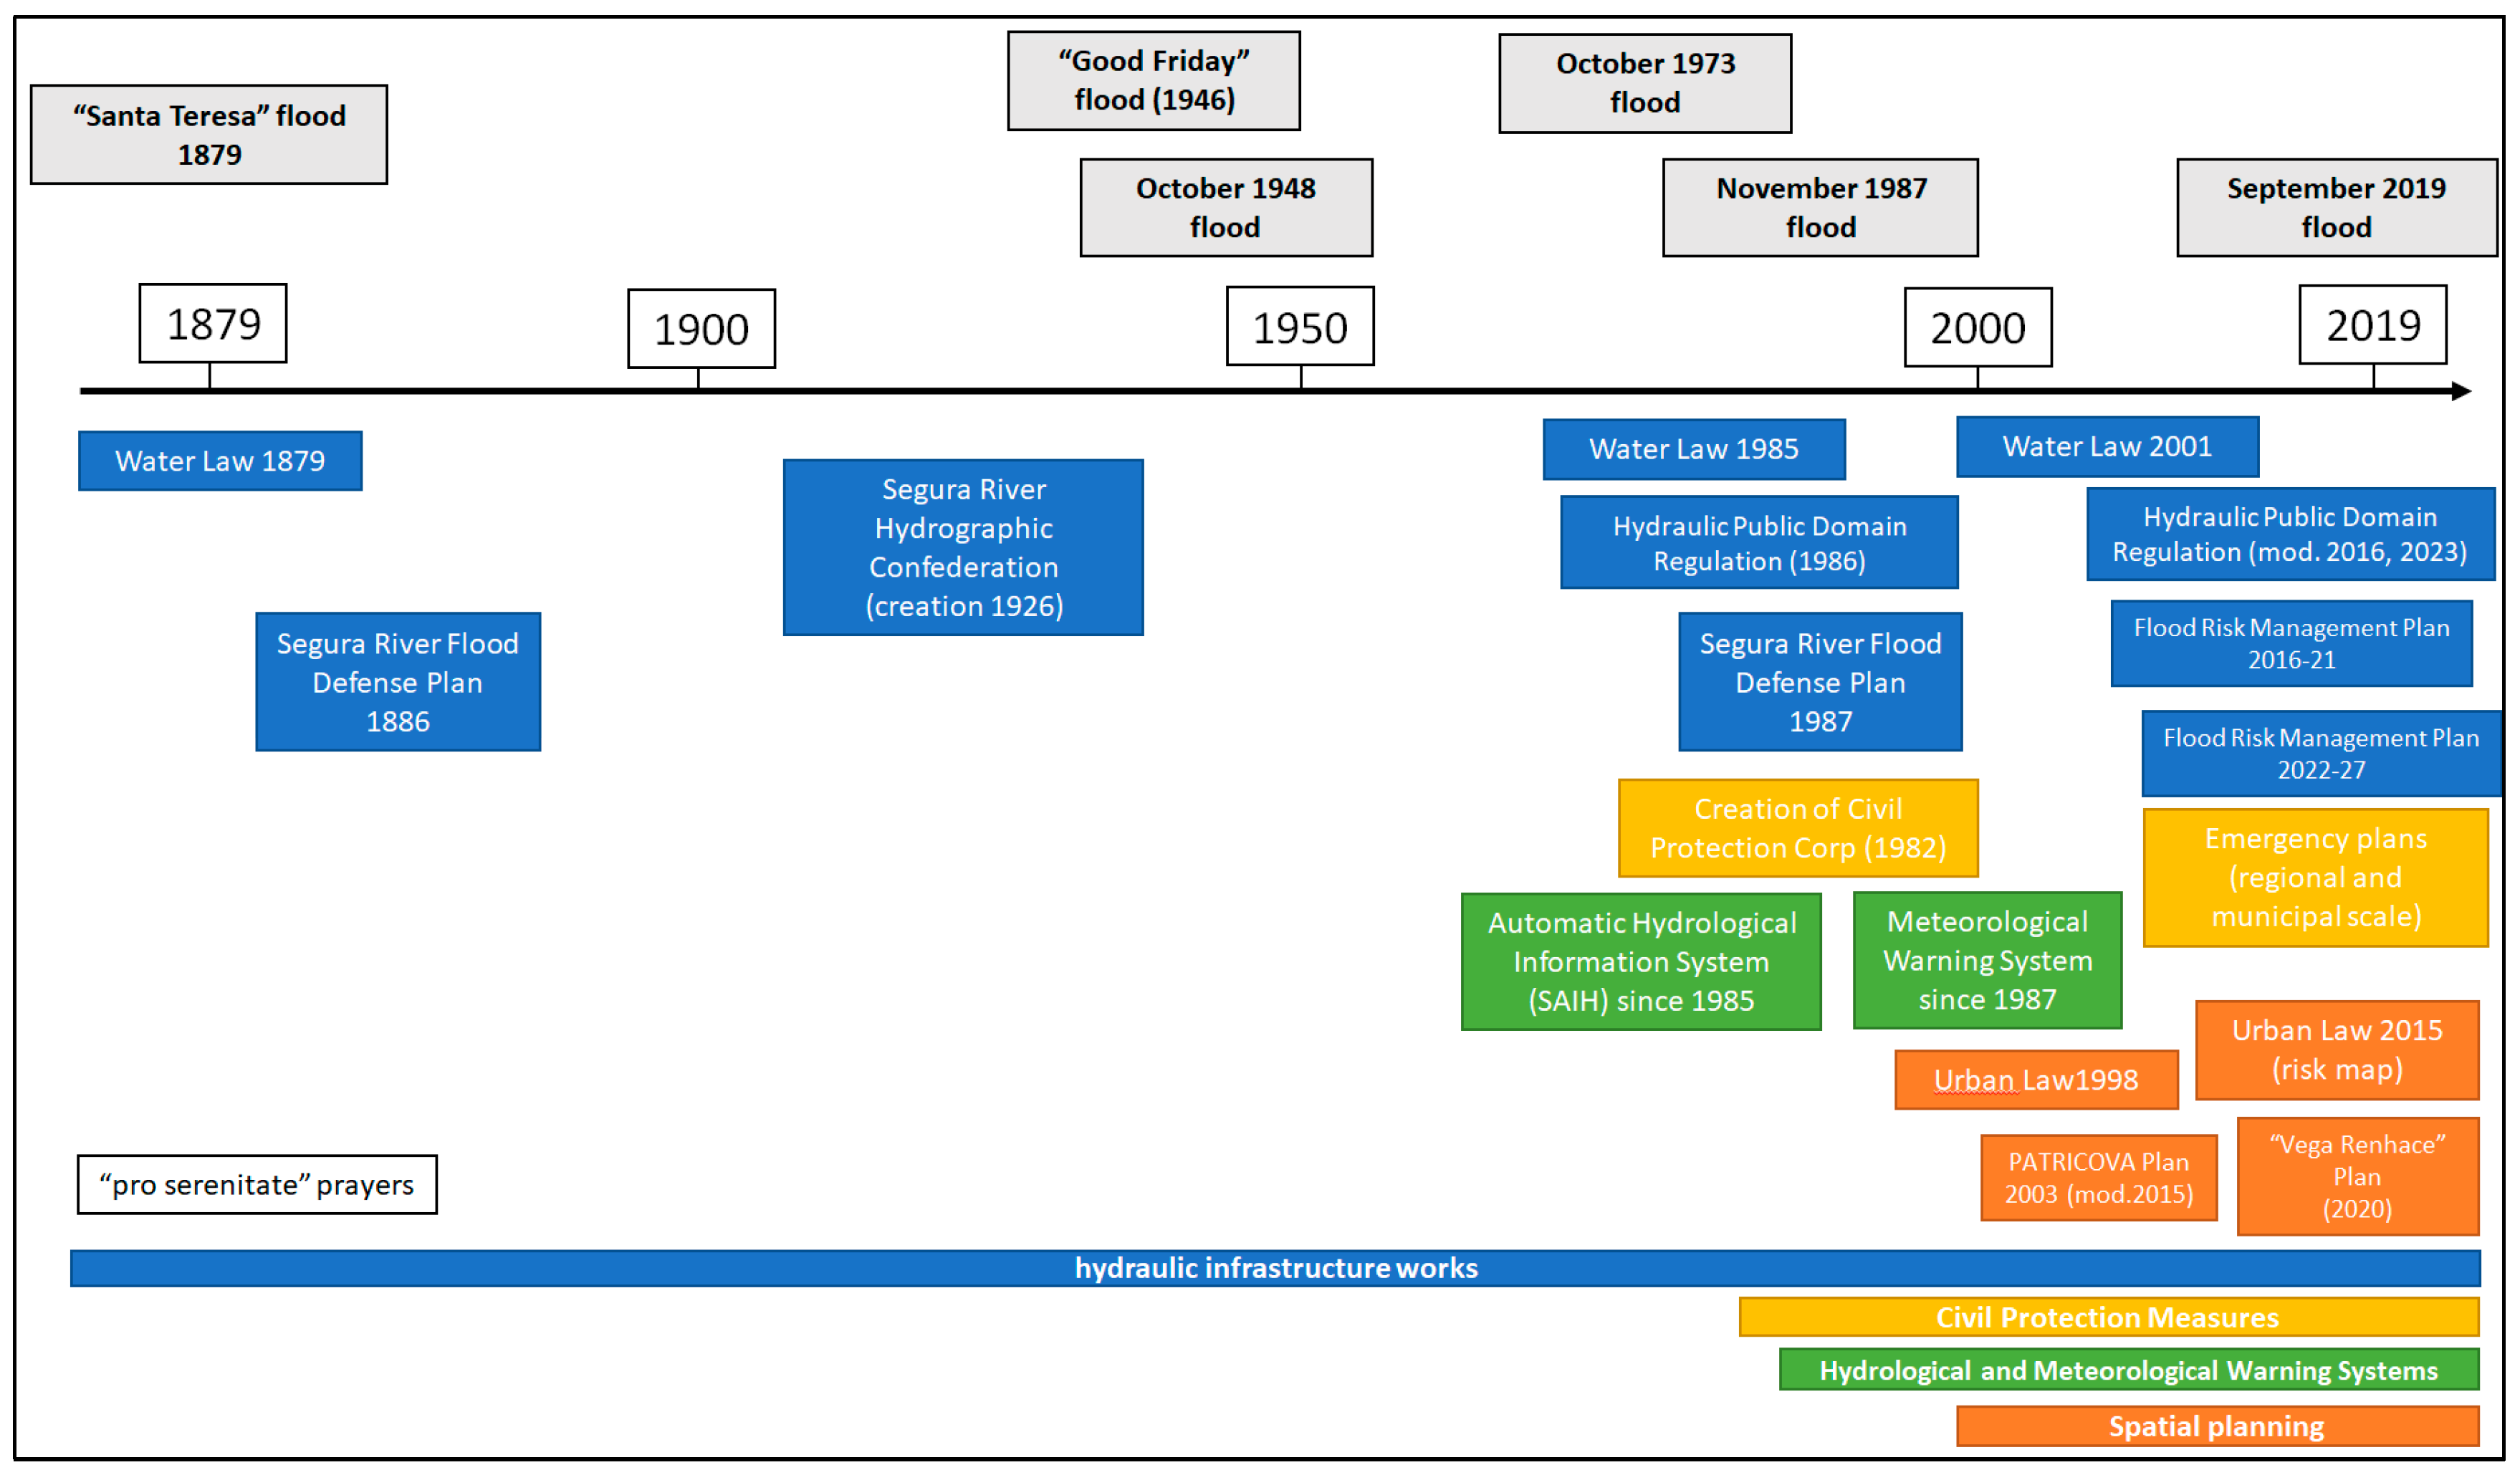
The figure below summarises the most important flood events occurring in the Segura basin between 1879 and 2023, indicating the measures for reducing the hazard and risk and the improvements made in terms of the emergency management and hydrological and meteorological warning carried out during this time period. As we can see, the measures related to hydraulic works were more prominent than those aimed at limiting the occupation of the floodable area through territorial planning (
Figure 11).
As a result, the construction of these works encouraged the occupation of floodable areas, due to the false sense of security generated among the population, who believed that the execution of all of these works would prevent more flood episodes. This coincided with the property boom period (1990–2007), which favoured the occupation of floodable zones.
However, since the construction of the works, the Segura basin has experienced episodes of significant river flooding (without overflow or flooding) (2000, 2001, 2007, 2007, 2009, 2012) and episodes with overflow and minor flooding (2016). After the 1987 flood, the next episode of overflowing of the Segura River occurred in 2016; however, it was a very localized flood. In September 2019, after record torrential rainfall (520 mm in two days; 300 mm on September 12 and 220 mm on September 14), the Segura River overflowed after several motes broke, causing one of the more serious floods in the final stretch of the Segura River. This latter flood also brought to light the fact that ruptures or failures could occur in structural works, which worsened the flood, and that certain overflow points coincided with those indicated in the sketch of the Santa Teresa flood of 1879.
The results are reflected in
Section 3.2. This is where the importance of consulting historical maps, sources, and documents resides, as they teach us about the behaviour of the floods in the territory.
With respect to territorial planning, it should be pointed out that in Spain, the treatment of natural risks in territorial management and planning dates back to 1998, with the passing of Law 6/1998 on the land and valuation regime. In Article 9, it indicates that for land to be classified as “non-buildable land” it is necessary to accredit the natural risk that exists. However, some authors have highlighted that this regulation could not be applied as it does not indicate how the risk is accredited [
53,
54,
55,
56,
57]. This situation prevailed until the passing of Law 8/2007 and, particularly until the subsequent passing of the Legislative Royal Decree 2/2008 approving the revised text of the Land Law in Article 12, indicating that in order to declare land as rural land, among other elements, it is necessary to protect those spaces with natural risks, including floods. In order to accredit the risk, Article 15 indicates that the urban development processes will be subject to sustainability assessment and monitoring. Therefore, it is necessary to elaborate an environmental sustainability report of the planning instruments of urbanisation actions, which should include a map of natural risks (in plural) for the area object of the planning. Furthermore, another report must be elaborated by the hydrological administration on water resources and the protection of the Public Water Domain, among other aspects. Since then, the successive state land regulations have maintained that it is necessary to accredit the natural risk of a territory in an urbanisation process. In summary, the way to accredit the existence of natural risks in Spain, including floods, is through the elaboration of a risk map or cartography.
It should be noted that until the existence of this regulation, the municipalities contemplated natural risks through the General Urban Development Plans (PGOU). Some municipalities, with a population of fewer than 10,000 inhabitants, were governed according to the so-called Subsidiary Regulations (SR), which only referred to urban regulations without contemplating all of the issues of the PGOUs. In both cases, authorisation or green light was required from the basin authority to carry out urban development based on the existence or not of flood risk. The majority of the reports indicated that the areas were flood risk zones and encouraged urbanisation measures that reduced the impact. Only in very specific spaces was the permission to construct refused. The regulations, on the whole, were fairly permissive, particularly in the PGOUs and SRs from the mid-1980s to 2007, when Directive 60/2007/EC was passed. This period coincided with the property boom. Despite the valuations and suggestions of the reports of the basin authority, no monitoring or assessment was made as to whether the municipalities adopted the measures recommended by the basin authority, and the municipalities constructed without implementing adaptation measures in floodable zones.
It should be pointed out that in the Region of Murcia, no importance was given to considering natural risks, specifically floods, in the territorial planning processes on either a regional or municipal level. Therefore, there are no flood risk plans such as the PATRICOVA in the Region of Valencia, although, after the flood in September 2019, an attempt was made to elaborate one, but it was never completed. The only planning documents attempting to prevent the occupation of floodable areas were the PGOUs. As reflected in the results of construction in floodable zones by the SNCZI for a 500-year return period, they were highly permissive, increasing the exposure of human lives to the possible catastrophic effects of flooding. Furthermore, the PGOUs of the area of study were elaborated before the new Land Law of 2015. Therefore, risk maps would never have been used to approve new land uses.
In the Region of Valencia, from 2003, a sectoral territorial planning document has existed for floods called the Territorial Action Plan. It has a sectoral nature and addresses the Flood Risk in the Region of Valencia (PATRICOVA) and is accompanied by regulations for a flood risk plan and how it is related to territorial and urban planning. It is interesting to highlight Article 22, which indicates that on Non-Buildable Land affected by a flood hazard level 2 (T25-100 years and Q > 0.80 m), 3 (T < 25 years and Q < 0.80 m) and 4 (T25-100 years and Q < 0.80 m), the following uses and activities are prohibited: housing; stables, farms, and animal rearing facilities; fuel supply stations; chemical industries or those classified as having chemical hazard; hotel establishments or tourist camps; horse-riding centres and zoos; funeral services and cemeteries; waste storage tanks or landfills; strategic facilities such as emergency centres, fire stations, barracks, schools, and health centres, and covered sport pavilions; and specific strategic infrastructures, such as water treatment plants and energy production, and transformation and storage centres.
Furthermore, it should be noted that Article 27, which refers to the general conditions of adapting the buildings, indicates that: (a) buildings with one storey should have a roof that is accessible from the inside via a staircase; and (b) new buildings will be constructed in such a way that they are oriented in the direction of the overflow. Their transversal orientation should be avoided so as not to cause a barrier effect that would lead to a heightening of the depth of the water in the surrounding area.
Article 28 indicates a series of additional adaptations to those in Article 27, exclusively for areas that have a risk level 2 (T25-100 years and Q > 0.80 m), 3 (T < 25 years and Q < 0.80 m), and 4 (T25-100 years and Q < 0.80 m), which are the following:
Basements and semi-basements are not permitted, except for intensive residential use, provided that they fulfil the following conditions:
The access is watertight.
The drainage system is not connected to the sewage network and has an independent pumping system powered by a generator.
The use of these basements is exclusively for parking vehicles.
The access ramp is at a height that is 10 centimetres (10 cm) above the level of the pavement.
The sanitation pipes that run through or discharge into its interior should be watertight and resistant to the pressure arising in the case of a flood.
All of these elements were maintained in the revised version of the PATRICOVA in 2015, in which the geomorphological hazard layer was incorporated as zones prone to being affected by floods but which had not been taken into account in the elaboration of the flood risk maps. These regulations were applied in the district of Vega Baja del Segura (Alicante) in the area of study.
Despite all of these existing indications and regulations, the reality has been very different, given that there are many homes with basements and semi-basements, and homes that are not adapted to flood risk; furthermore, the number of homes existing in the floodable zone has risen. Along these lines, an important field of research has been opened for future studies related to the presence of basements or semi-basements in floodable areas, which is highly interesting to qualify a greater flood risk in a town or region.
Finally, the Santa Teresa flood of October 1879 represented a good opportunity to carry out correct planning and adaptation to flood risk in terms of management and territorial planning. However, it has not been taken into consideration, so it can be considered as learning and a failed action on the part of those responsible for making territorial decisions, generating a true panorama of flood risk.
In this line, the first failure is found in the basin organization that, despite the works it has been carrying out, has not been forceful in denying the construction of homes in flood-prone areas. It has been very permissive despite being aware of the existing flood risk. The second failure is found in Spanish regulations. In Spain, at the end of the 1990s, land regulations were approved that mentioned for the first time taking into consideration the risk of flooding in any urban planning action, as long as the existence of this risk was proven. However, this regulation did not indicate how to accredit the risk until the approval of a new Land Law (2007) and its Royal Legislative Decree (RDL 2/2008), which states that to accredit the risk it is necessary to carry out a mapping of the risk, leaving this land protected from any urban planning action.
As can be seen, the approved regulations are very recent and are closely related to the approval of Directive 60/2007/EC on the evaluation and management of flood risk. Here lies the importance of researching cartography and historical documents: it allows us to analyse the past and take into consideration possible floods in the future.


