Article

Evaluation of Spatiotemporal Changes in Cropland Quantity and Quality with Multi-Source Remote Sensing

1
Key Laboratory of Land Consolidation and Rehabilitation, Land Consolidation and Rehabilitation Center, Ministry of Natural Resources, Beijing 100035, China
2
Technology Innovation Center for Land Engineering, Ministry of Natural Resources, Beijing 100035, China
3
Key Laboratory of Digital Mapping and Land Information Application, Ministry of Natural Resources, Wuhan 430079, China
4
National Disaster Reduction Center of China, Ministry of Emergency Management, Beijing 100124, China
5
Beijing Municipal Institute of City Planning and Design, Beijing 100045, China
6
College of Land Science and Technology, China Agricultural University, Beijing 100083, China
*
Authors to whom correspondence should be addressed.
These authors contributed equally to this work.
Land 2023, 12(9), 1764; https://doi.org/10.3390/land12091764
Submission received: 26 August 2023 / Revised: 6 September 2023 / Accepted: 7 September 2023 / Published: 12 September 2023

Abstract

:
Timely cropland information is crucial for ensuring food security and promoting sustainable development. Traditional field survey methods are time-consuming and costly, making it difficult to support rapid monitoring of large-scale cropland changes. Furthermore, most existing studies focus on cropland evaluation from a single aspect such as quantity or quality, and thus cannot comprehensively reveal spatiotemporal characteristics of cropland. In this study, a method for evaluating the quantity and quality of cropland using multi-source remote sensing-derived data was proposed and effectively applied in the black soil region in Northeast China. Evaluation results showed that the area of cropland increased significantly in the study area between 2010 and 2018, and the proportion of cropland increased by 1.17%. Simultaneously, cropland patches became larger and landscape connectivity improved. Most of the gained cropland was concentrated in the northeast and west, resulting in a shift in the gravity center of cropland to the northeast direction. Among land converted into cropland, unused land, grassland, and forest were the main sources, accounting for 36.38%, 31.47%, and 16.94% respectively. The quality of cropland in the study area generally improved. The proportion of low-quality cropland decreased by 7.17%, while the proportions of high-quality and medium-quality cropland increased by 5.65% and 5.17%, respectively. Specifically, the quality of cropland improved strongly in the east, improved slightly in the southwest, and declined in the north. Production capacity and soil fertility were key factors impacting cropland quality with obstacle degrees of 36.22% and 15.64%, respectively. Overall, the obtained results were helpful for a comprehensive understanding of spatiotemporal changes in cropland and driving factors and can provide guidance for cropland protection and management. The proposed method demonstrated promising reliability and application potential, which can provide a reference for other cropland evaluation studies.

1. Introduction

Cropland is a crucial agricultural resource and the basis for maintaining human survival and development and ensuring food security [1,2,3]. However, as the economy develops and the population increases, pressure on the production and utilization of cropland is increasing [4,5]. This leads to cropland loss and degradation, which has become an agricultural issue of global concern [6,7]. Monitoring and evaluation of cropland change are urgently needed [8,9,10,11] to provide a basis for formulating cropland protection policies and support for sustainable utilization of cropland resources and sustainable social and economic development.
Recently, the evaluation of spatiotemporal changes in cropland has become a research hotspot. In terms of the quantity of cropland, some studies used survey and monitoring data to assess the spatiotemporal distribution patterns of cropland. Potapov et al. [12] analyzed global cropland area and extent changes in the twenty-first century. Hu et al. [13] identified the global spatiotemporal pattern of cropland expansion and intensification from 2000 to 2010. In addition to quantity, the landscape and fragmentation patterns of cropland were also measured. For instance, Yu et al. [14] characterized cropland fragmentation patterns in China, and Raab et al. [15] detected the degree and timing of cropland fragmentation in Central Asia. The driving forces of cropland change were also further explored. Zaveri et al. [16] identified the impact of rainfall anomalies on global cropland expansion. Ojha et al. [17] reviewed the drivers of abandoned croplands in Nepal. In terms of the quality of cropland, a multi-level indicator system was constructed to evaluate cropland quality. Song et al. [18] proposed a cropland quality evaluation system from the perspective of the ecosystem. Recently, machine learning methods have been gradually incorporated into cropland quality evaluation studies. Ye et al. [19] utilized the K-means algorithm to assess the clustering characteristics of cropland quality indicators. Li et al. [20] leveraged the random forest method to identify cropland quality grades in Shandong Province, China. However, most existing studies on the evaluation of cropland changes focus on a single aspect such as quantity or quality, which cannot be used to comprehensively reflect spatiotemporal characteristics of cropland.
Remote sensing technology provides an efficient data acquisition means for the monitoring of cropland changes. Traditional field survey and measurement methods are time-consuming, laborious, costly, and easily affected by the natural environment, making it difficult to obtain data [21]. Simultaneously, the accuracy and representativeness of field-collected data also face challenges including subjectivity and spatial limitations [22]. In contrast, using remote sensing technology to obtain cropland monitoring data shows advantages. Remote sensing data have wide coverage and can provide large-scale and refined cropland monitoring information. With remote sensing data, Gumma et al. [23] produced multiple cropland maps in South Asia, and Qiu et al. [24] developed a national-scale map of cropped fields and abandoned cropland in China. Moreover, the acquisition of remote sensing data is less restricted and can provide information on areas that are difficult for humans to reach. Hong et al. [25] mapped cropland abandonment in subtropical mountainous areas with remote sensing data. Furthermore, remote sensing data has the characteristics of a short acquisition period and high time frequency, which can support rapid monitoring and long-term analysis of cropland changes. Using remote sensing data, Pancorbo et al. [26] monitored changes in cropland use during a drought in Central Valley, California, and Wang et al. [27] analyzed the long-term influence of reclamation on soil organic carbon in the black soil region of China. Integrating multi-source remote sensing is generally more promising for realizing comprehensive cropland monitoring by providing multi-dimensional information. Duan et al. [28] utilized multi-source remote sensing data to evaluate the spatiotemporal pattern of cropland quality in Guangzhou, China.
The black soil region in Northeast China is one of the four global black soil regions [29]. As an important base of grains such as corn and rice, its annual grain production accounts for about one-fifth of the total produced in China [30]. However, due to unsustainable use and over-cultivation by humans in recent years, cropland has been seriously degraded [31]. Changes in the cropland in the black soil region in Northeast China have a significant impact on national food security. Therefore, it is of vital importance to assess spatiotemporal variations in cropland and the driving factors in the black soil region in Northeast China. However, as described above, traditional field survey methods are time-consuming and costly. To address this challenge, a method for evaluating the quantity and quality of cropland that integrates multi-source remote sensing-derived data was proposed in this study. Compared with traditional methods, it enables large-scale rapid monitoring of cropland changes and helps provide a comprehensive understanding of the spatiotemporal characteristics of cropland. Specifically, land cover monitoring data from China’s National Land Use and Cover Change (CNLUCC) dataset was utilized to analyze quantity characteristics of cropland and the conversion sources and destinations. Combining multi-source remote sensing-derived data such as topography, vegetation index, and productivity, a multi-dimensional indicator system was constructed to evaluate the spatiotemporal pattern of cropland quality and identify major obstacles. The proposed method was validated and applied in the black soil region in Northeast China. The specific aims of this study were: (1) to develop a comprehensive method for cropland change evaluation using multi-source remote sensing and to validate its effectiveness and reliability in large-scale applications and (2) to reveal the spatiotemporal characteristics of cropland quantity and quality in the study area and to explore potential driving and obstacle factors. The proposed method can provide a reference for other studies on large-scale evaluation of cropland changes, and the obtained results can support cropland protection.

2. Materials and Methods
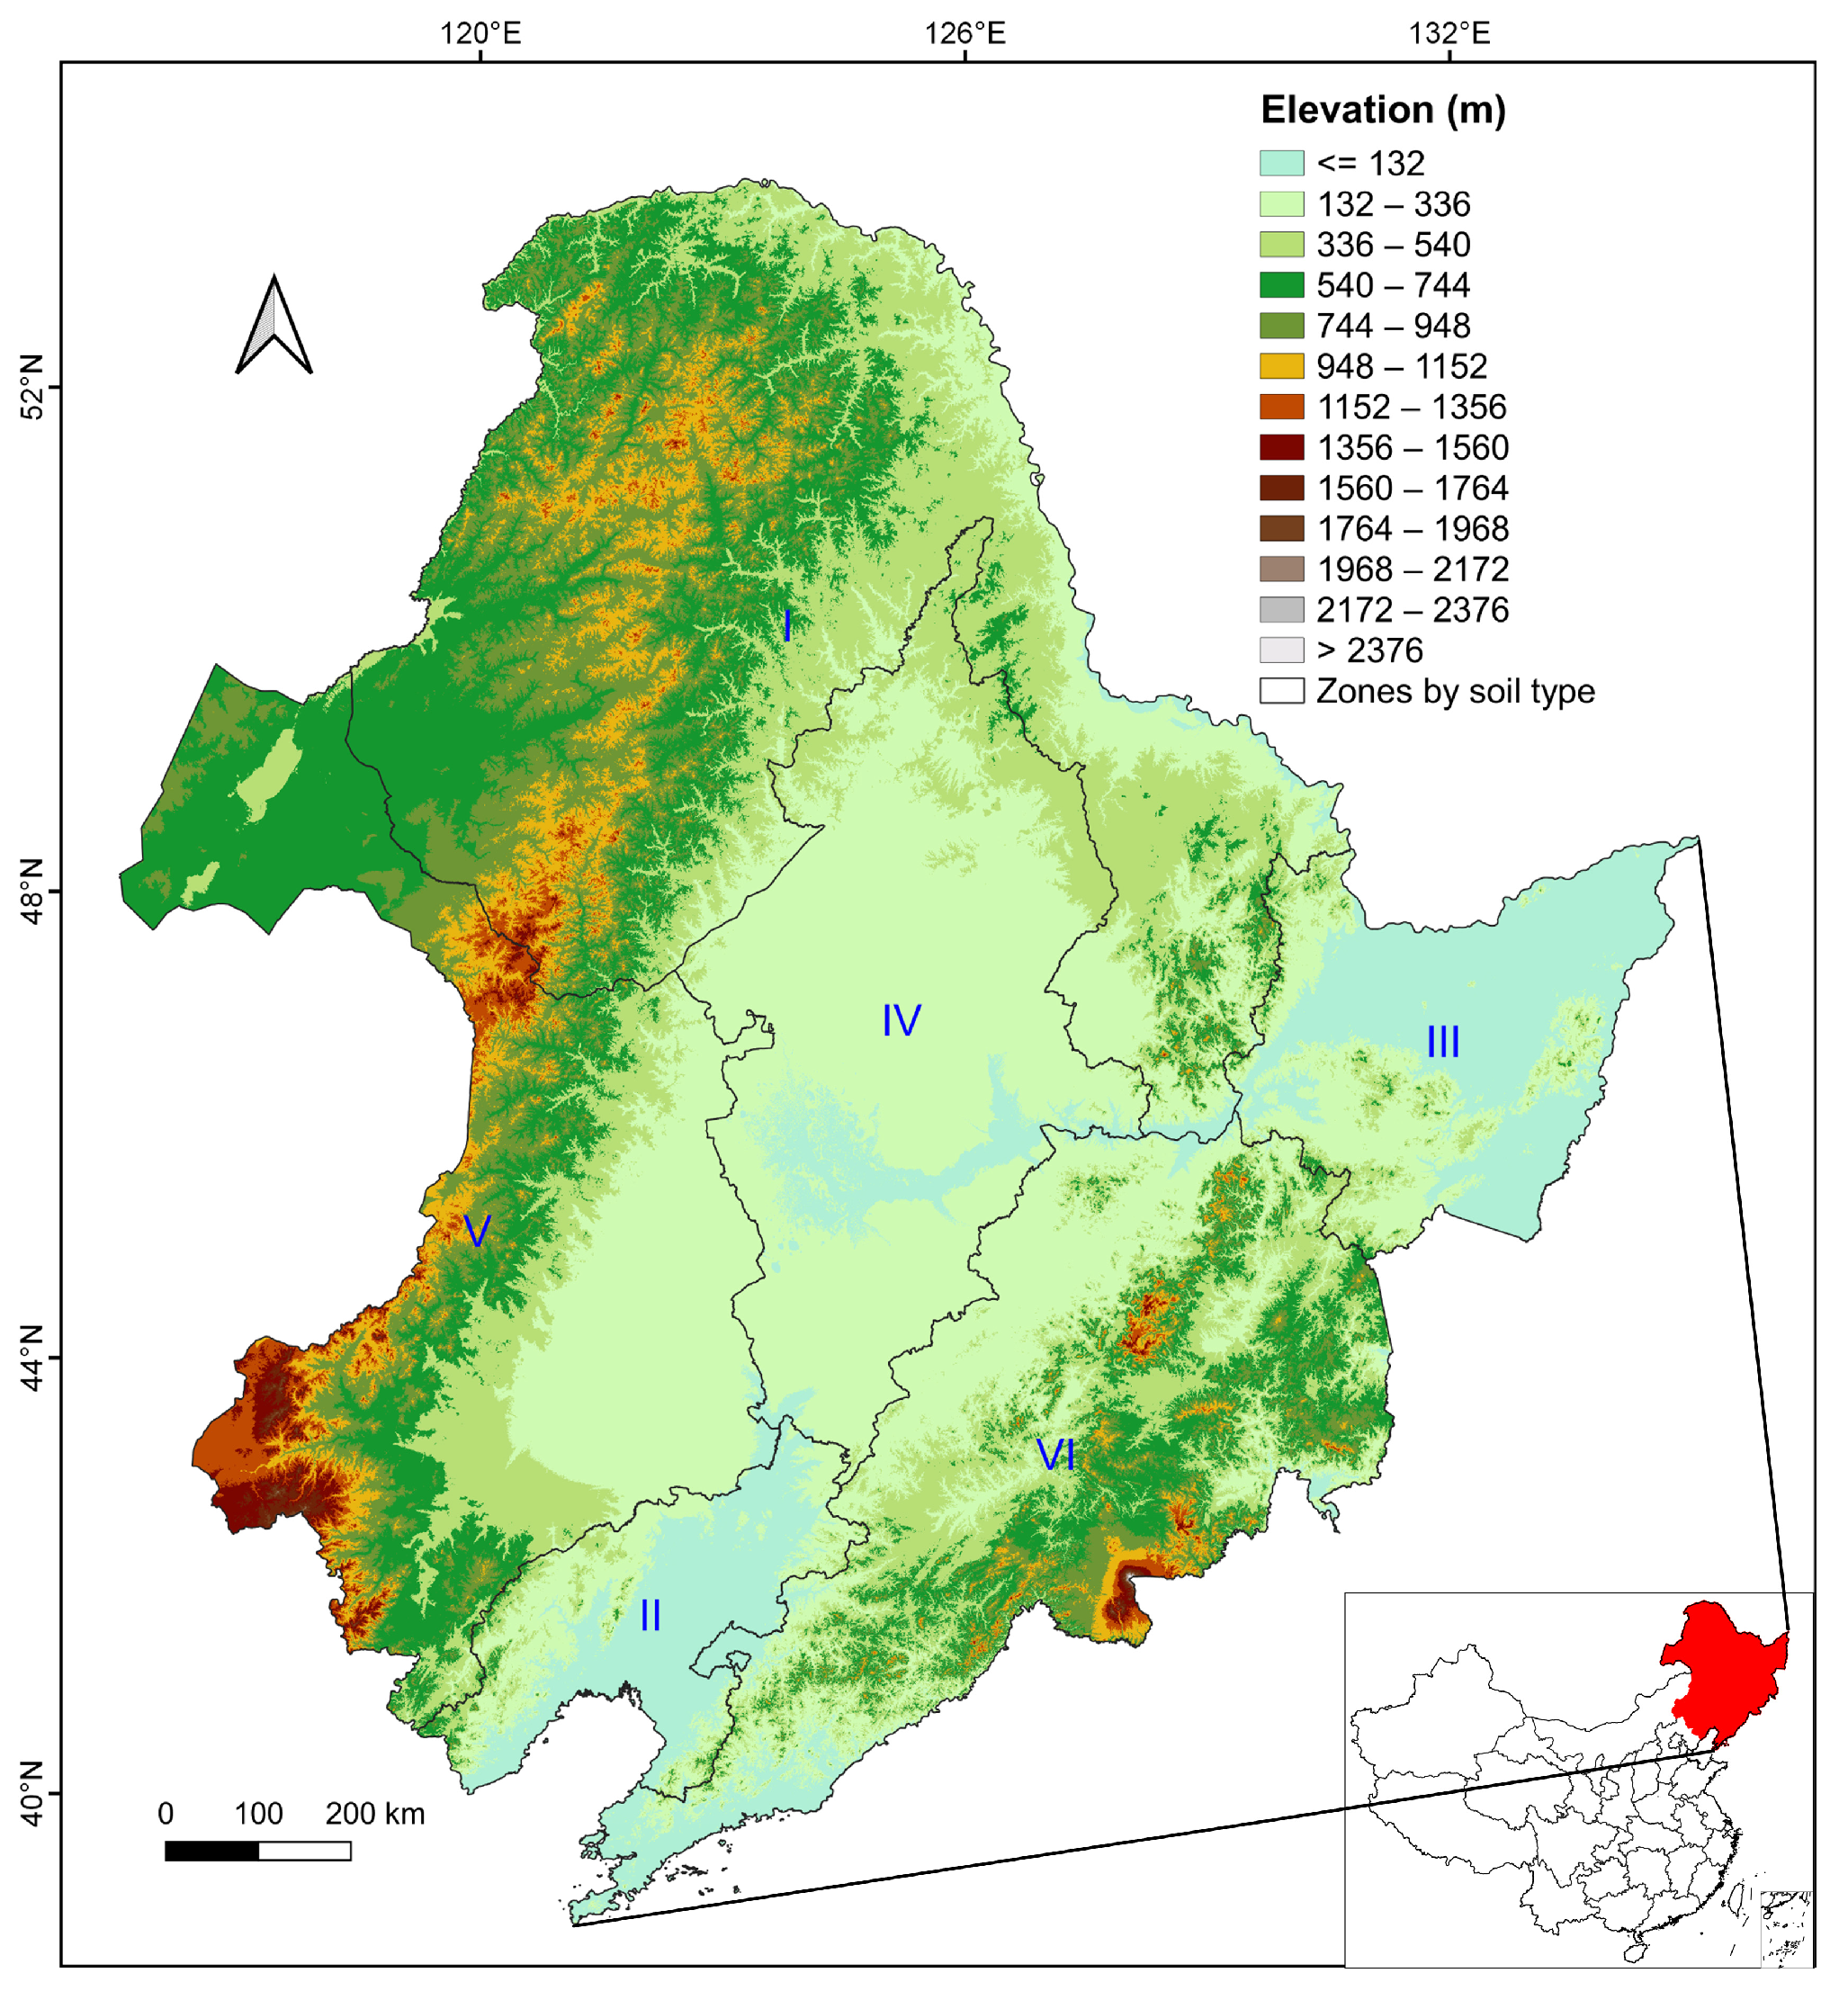
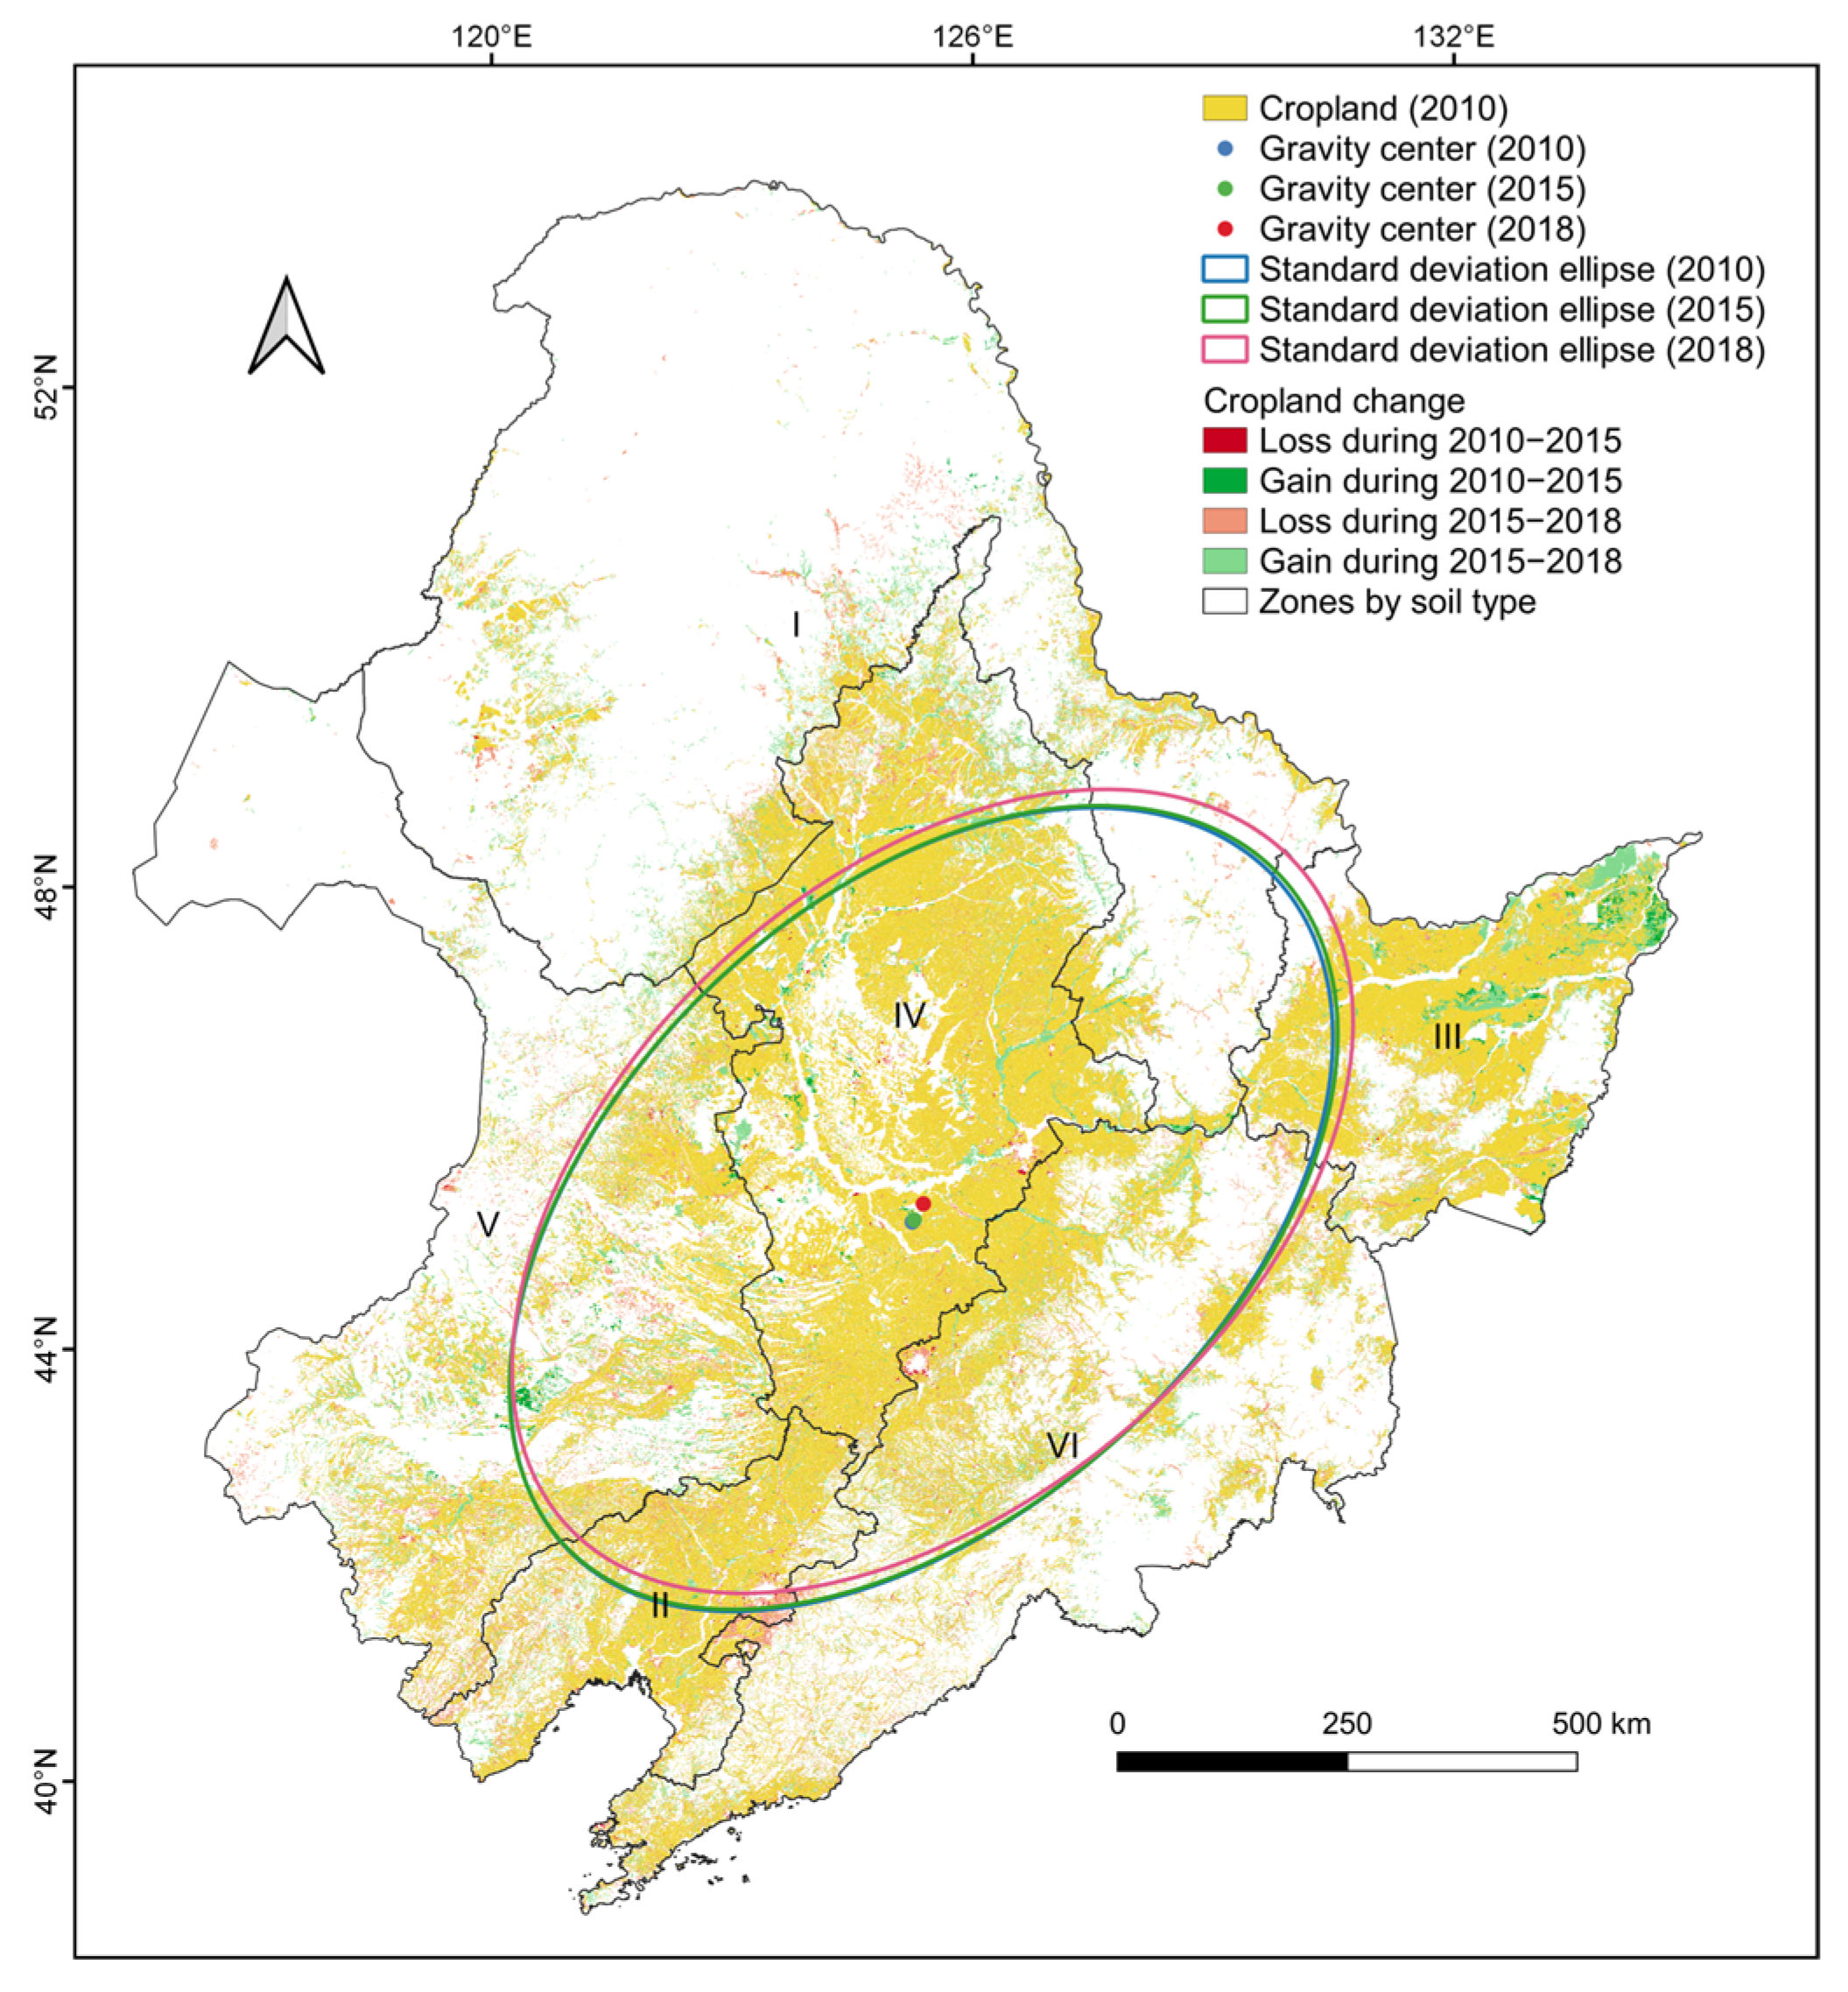
2.1. Study Area

The study area, the black soil region in Northeast China, is located at 115°22′–135°15′ E, 38°32′–53°47′ N, with an area of 1,240,058.30 km2. It has a flat terrain with a mean elevation of 447.07 m. The main soil type of cropland in this region belongs to black soil rich in organic matter. The study area is mostly situated in the temperate zone, with an annual mean temperature (MAT) of 20.34 °C. The mean annual precipitation (MAP) is 536.84 mm, mainly concentrated in July, August, and September. According to the differences in soil types, the study area can be divided into six zones (as shown in Figure 1) including the black and dark brown soil zone in low foothills of the Xiaoxing’an Mountains (Zone I), the brown and black soil zone in Liaohe Plain (Zone II), the white mud soil zone in Sanjiang Plain (Zone III), the black soil calcareous zone in Songnen Plain (Zone IV), the western semi-arid zone (Zone V), and the dark brown soil zone in a low hilly area of Changbai Mountain (Zone VI).

2.2. Data Source

To evaluate spatiotemporal changes in the cropland in the study area, multi-source remote sensing-derived and auxiliary data were integrated. Details of used data are listed in Table 1. All source data were resampled to a 30 m spatial resolution to unify the analysis unit.

2.2.1. Remote Sensing Data

This study used remote sensing-derived data and products including land cover, the normalized difference vegetation index (NDVI), net primary production (NPP), and topography data.
The CNLUCC datasets from 2010, 2015, and 2018 were utilized to obtain information on the area and distribution of each land cover class including cropland in the study area. The dataset was produced by the Resource and Environmental Science Data Center of the Chinese Academy of Sciences. Its classification system (Table 2) contains six level-1 classes including unused land, built-up land, water bodies, grassland, forest, and cropland, among which cropland is classified into two classes including paddy cropland and dry cropland. The dataset was mainly developed based on the visual interpretation of 30 m Landsat data. Its level-1 and level-2 national overall accuracies reached over 94% and 91%, respectively [32].
NDVI data calculated based on Landsat satellite images was used to reflect soil fertility of cropland in the study area. The 30 m Landsat Level-2 surface reflectance data in 2009–2011, 2014–2016, and 2017–2019 from three sensors including Landsat 8 Operational Land Imager, Landsat 7 Enhanced Thematic Mapper Plus, and Landsat 5 Thematic Mapper were used. All available Landsat images were provided by the United States Geological Survey. Each Landsat image was atmospherically corrected using the Landsat Ecosystem Disturbance Adaptive Processing System [33]/Land Surface Reflectance Code algorithm [34] and included mask information calculated using the C Function of Mask algorithm [35]. After masking out clouds and cloud shadows, the NDVI was calculated. To reduce the influence caused by sensor differences, the obtained NDVI data was further corrected according to the transformation parameters in [36]. Specifically, the transformation parameters were derived using ordinary least squares regression. The formula for NDVI is expressed as follows:
N D V I = N I R R e d N I R + R e d
where N I R and R e d refer to near-infrared and red bands, respectively.
The Moderate Resolution Imaging Spectroradiometer (MODIS) NPP product was utilized to characterize cropland productivity. NPP refers to the rate of the accumulation of energy in the form of biomass, which helps reflect the production capacity of cropland [37]. Simultaneously, time-series NPP data are highly available, which makes it advantageous for use in evaluating cropland changes. The MOD17A3 Terra NPP product was provided by the National Aeronautics and Space Administration (NASA) Land Processes Distributed Active Archive Center [38]. It includes annual NPP information in 2009–2011, 2014–2016, and 2017–2019 at a 500 m spatial resolution.
In addition, the data from the 30 m Shuttle Radar Topography Mission (SRTM) digital elevation model (DEM) [39] were utilized to extract topography information on the cropland in the study area. These data were acquired in 2000 by NASA.

2.2.2. Auxiliary Data

The other auxiliary data used in this study include soil, road, and climate data. The Harmonized World Soil Database (HWSD) [40] was used to obtain soil texture information on the cropland in the study area. It was collected by the Food and Agriculture Organization of the United Nations in 2009, with a spatial resolution of 30 arc-seconds (~1 km). Simultaneously, OpenStreetMap (OSM) data from 2010, 2015, and 2018 were used to evaluate road accessibility of the cropland in the study area. These data were generated with a community-based, freely available map service [41]. WorldClim data was utilized to reflect climate conditions in the cropland area. It was developed by spatial interpolation of weather station data based on the thin plate spline method [42]. It provides global average monthly temperature and precipitation data from 1970 to 2000 at a 30-arc-second spatial resolution.

2.3. Evaluation of Changes in Cropland Quantity

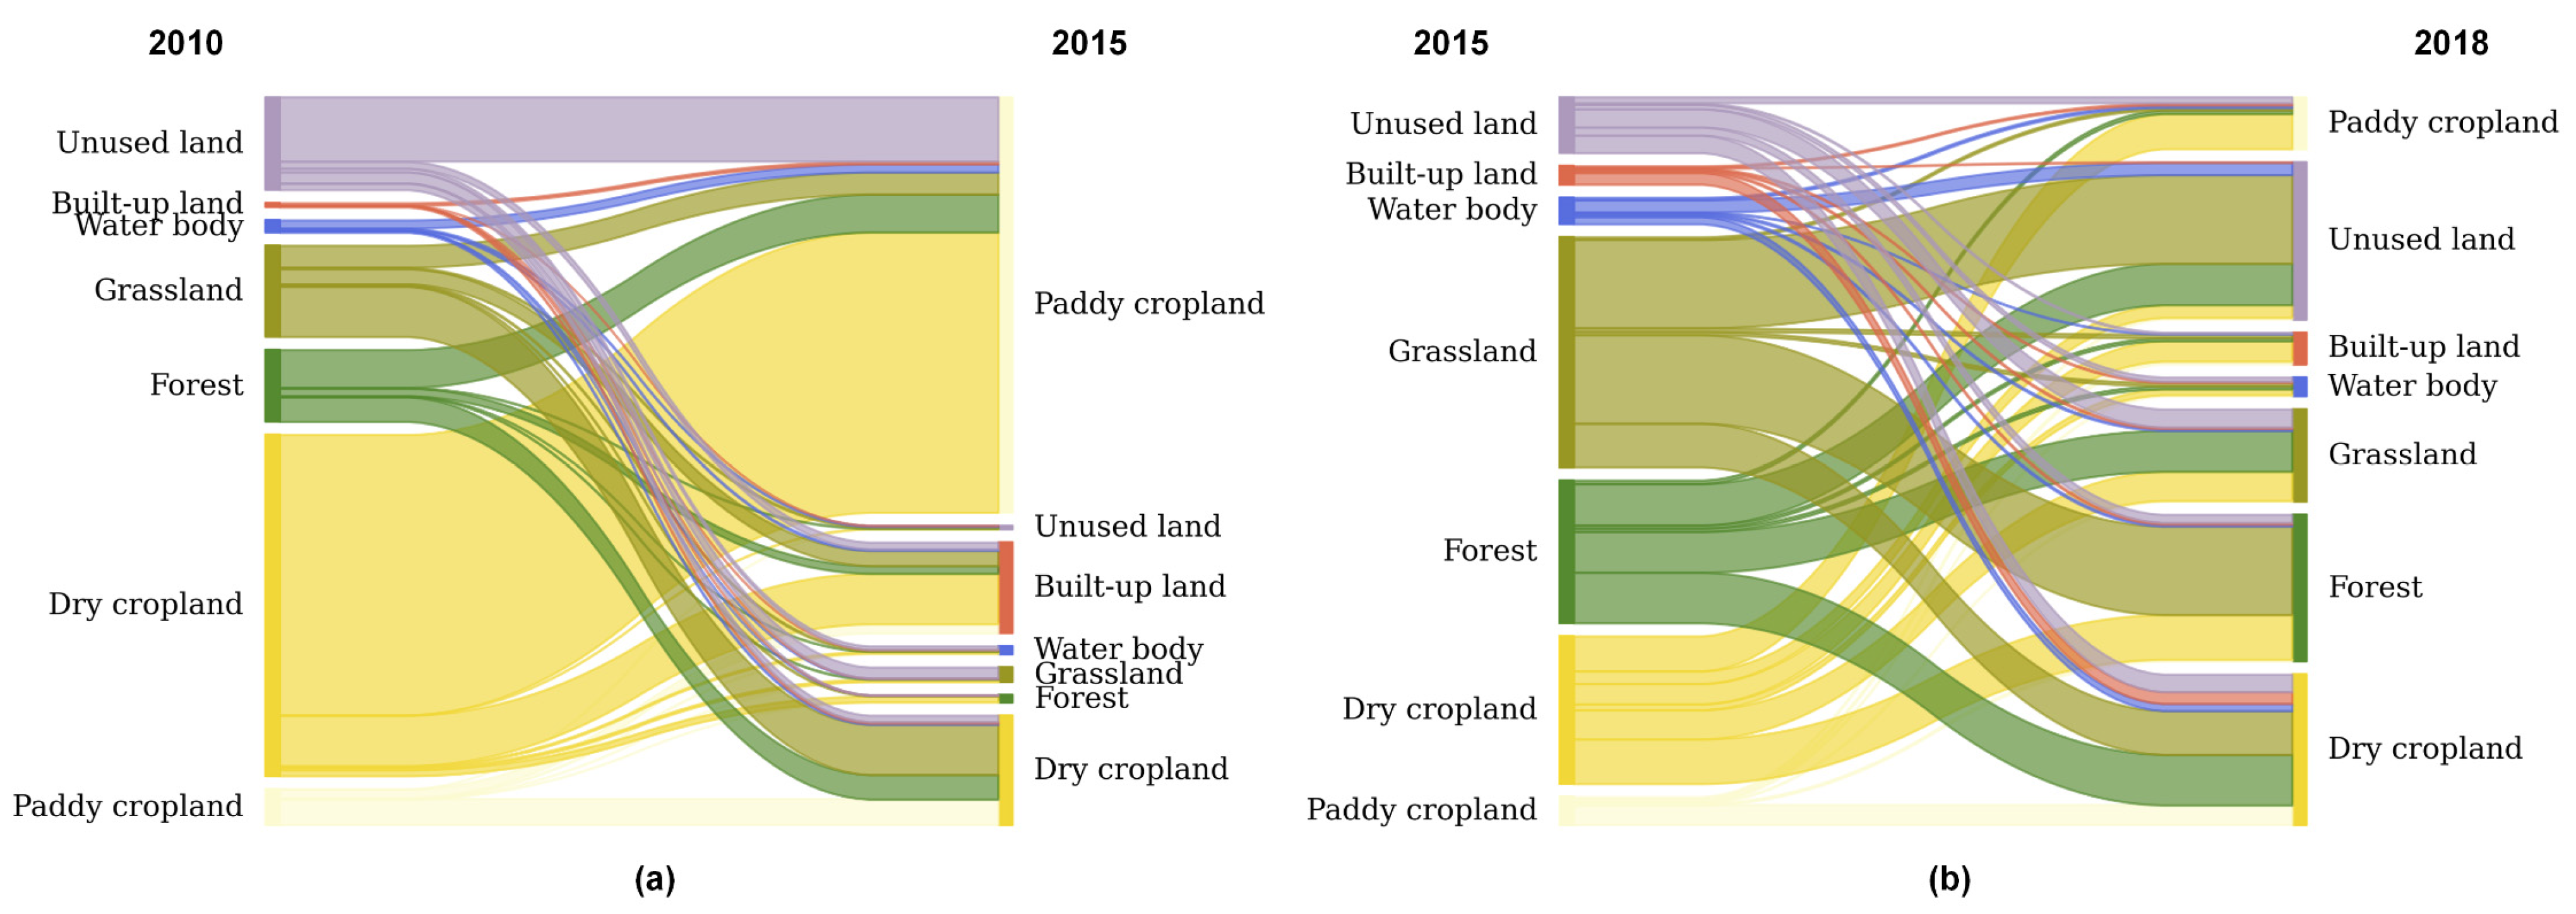
2.3.1. Statistics on Cropland Area and Land Cover Conversion

Using the CNLUCC data, the area and proportion of each land cover class were counted by time (2010, 2015, and 2018) to reveal the overall land cover structure. A land cover conversion matrix for different periods (2010–2015, 2015–2018) was calculated to reflect the transfer between cropland and other land cover classes. Furthermore, for cropland, the loss, gain, and net change in paddy cropland and dry cropland were counted by soil type zone and period.

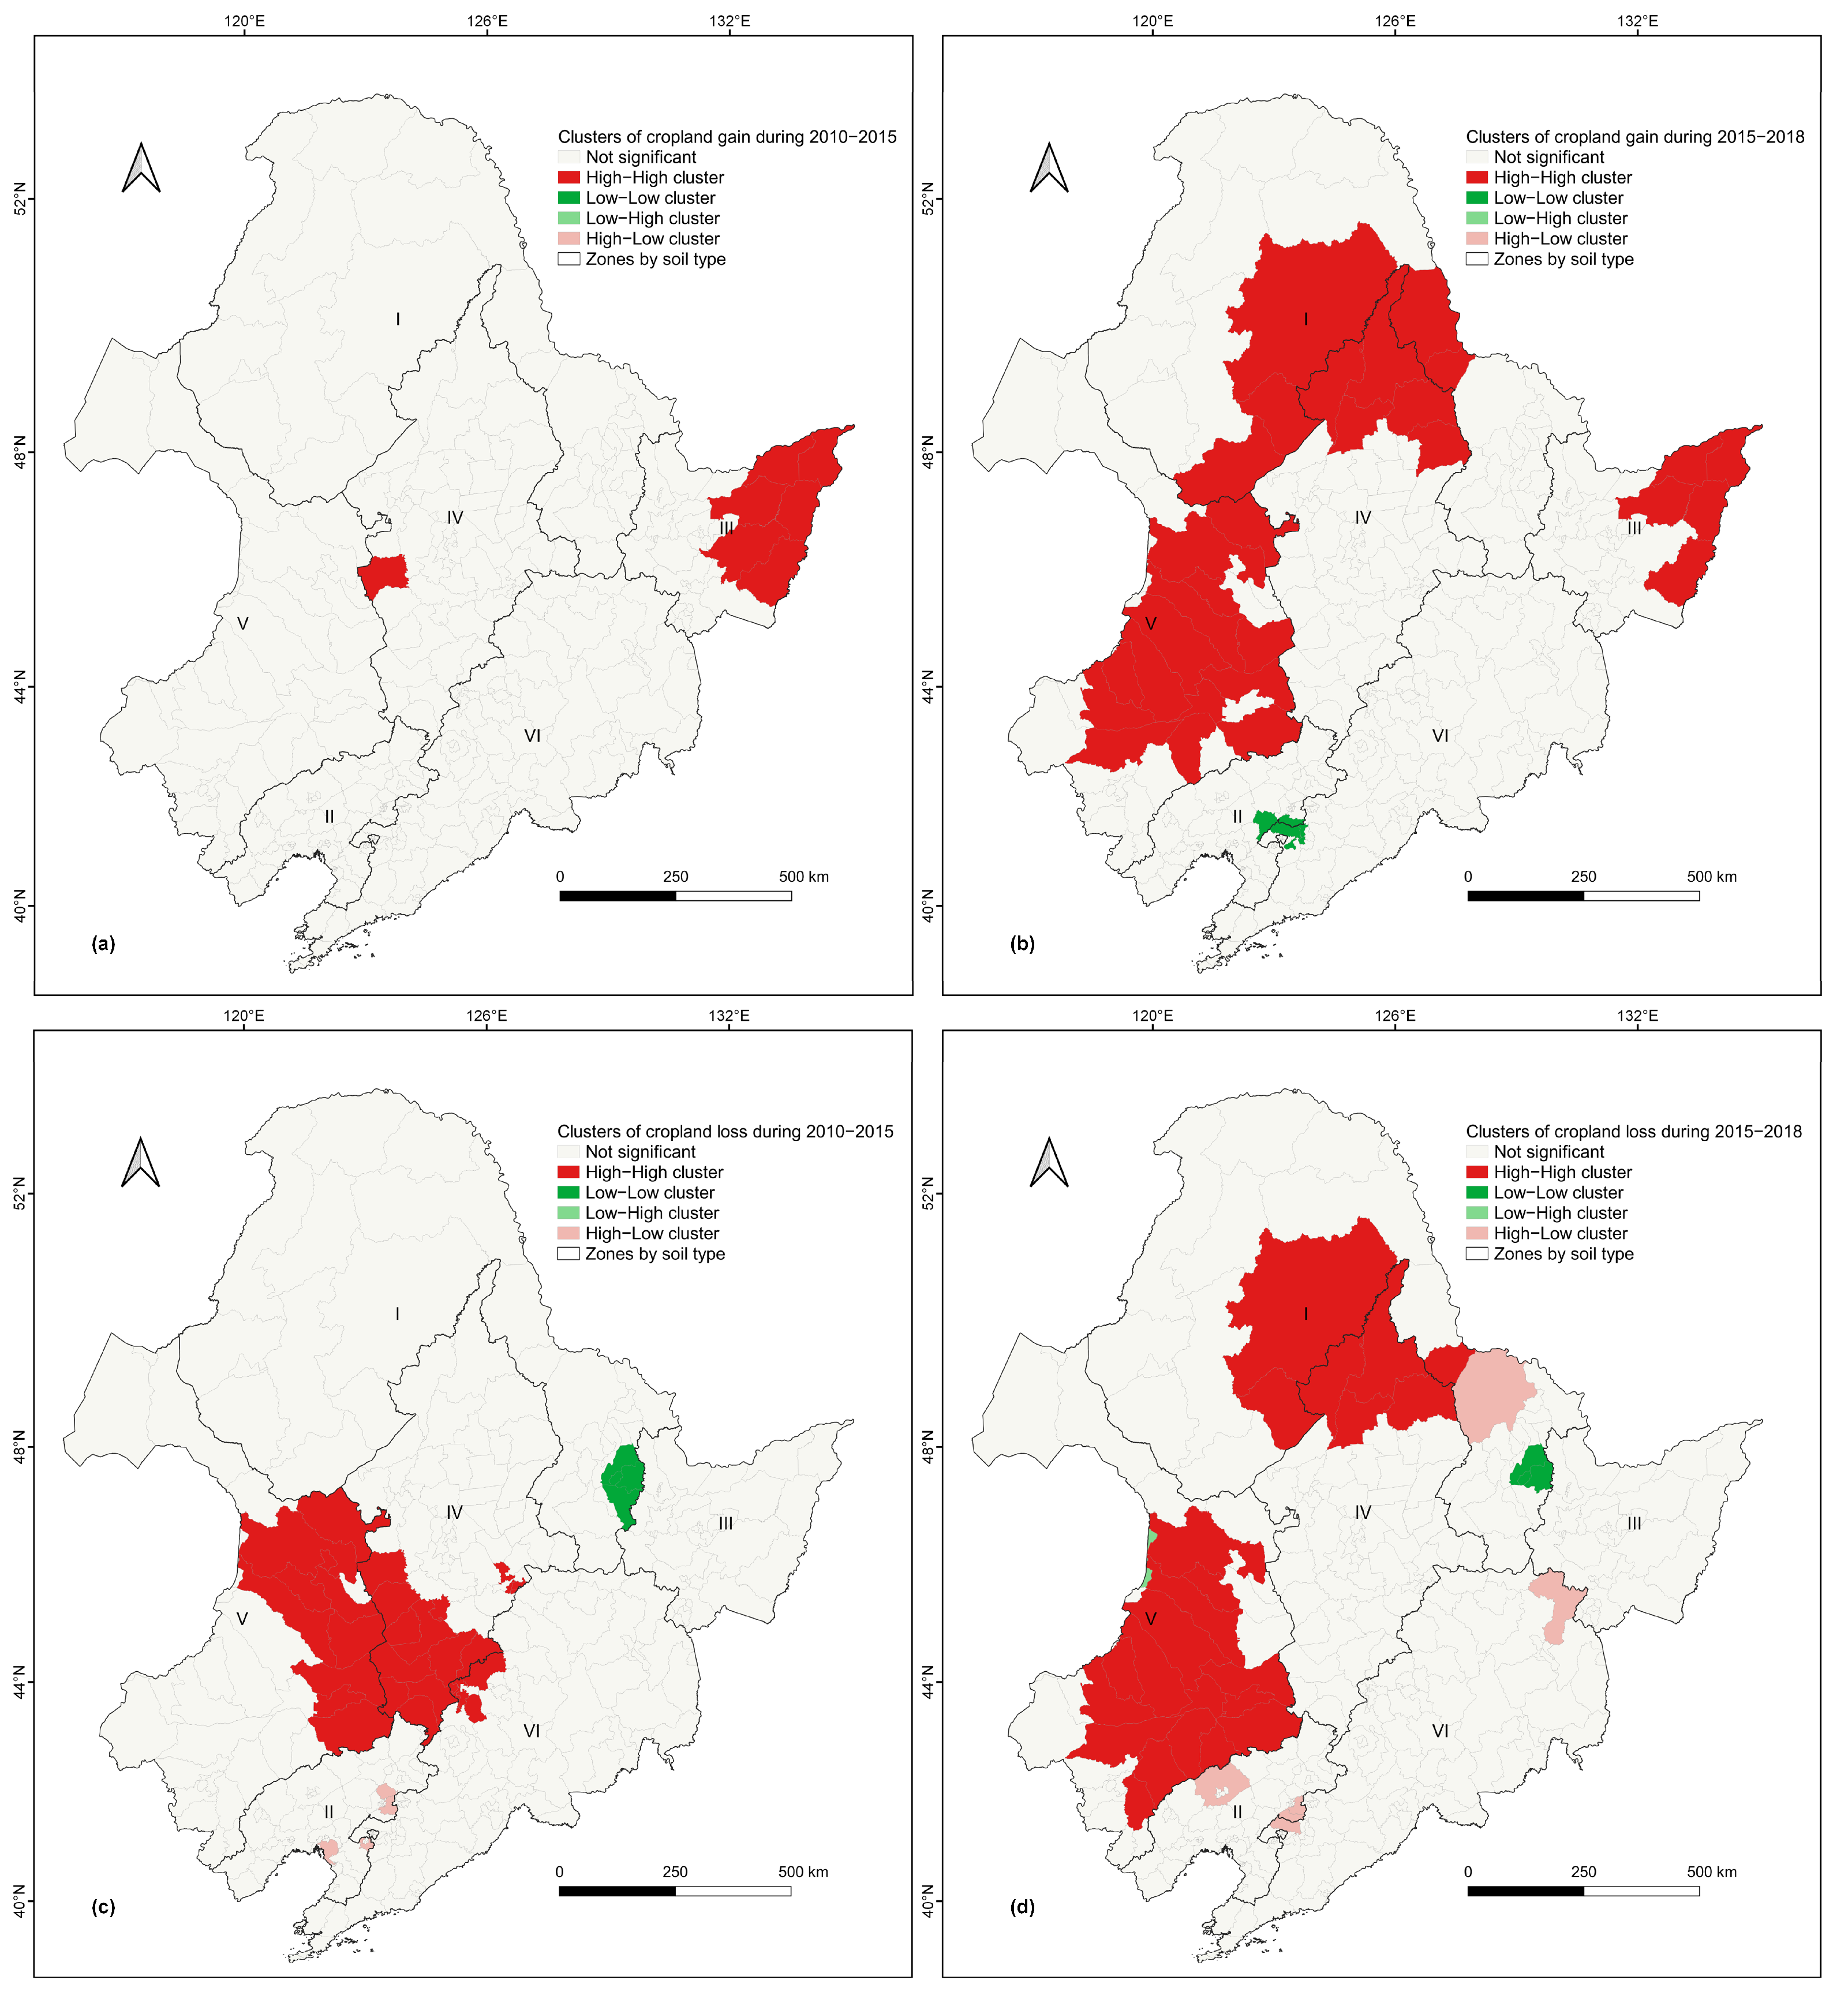
2.3.2. Analysis of Spatiotemporal Patterns of Cropland

With CNLUCC data, a standard deviational ellipse [43] of cropland distribution was created by time. The standard deviational ellipse measured the central tendency, dispersion, and directional trends of geographic features, which helped to describe spatial distribution characteristics of cropland. Specifically, central locations of cropland patches were extracted, and the weighted standard deviational ellipse was calculated with patch area as the weight.
Using the hot spot analysis method, clusters including hotspots and cold spots in cropland change patterns were revealed. First, spatial patterns of cropland changes including gain and loss in the study area were extracted by period. Counties were used as units to summarize and count the area of cropland change. Finally, the Getis–Ord local statistic [44] for each unit was calculated to identify statistically significant clusters of low values (cold spots) and high values (hot spots) of cropland change area.
Based on the landscape index [45], changes in the fragmentation of cropland patches were characterized by soil type zone and time. Three indexes including the mean area (AREA), shape index (SHAPE), and contiguity index (CONTIG) of cropland patches in the study area were calculated. Among them, AREA reflects the size of cropland patches, SHAPE measures the complexity of cropland patches, and CONTIG evaluates the connectivity of cropland patches. The formulas for the three indexes are as follows:
A R E A = i = 1 n a r e a i n
S H A P E = i = 1 n 0.25 p i a r e a i n
C O N T I G = i = 1 n r = 1 z c i r a r e a i * 1 v 1 n
where a r e a i and p i are the area and perimeter of cropland patch i , respectively. n is the number of cropland patches. c i r is the contiguity value for pixel r in cropland patch i , z is the number of pixels in cropland patch i , a r e a i * is the area of cropland patch i in terms of the number of pixels, and v is the sum of surrounding contiguity values.
In addition, with topography and climate data, changes in the environmental characteristics of cropland distribution were analyzed. Specifically, the mean MAP, MAT, and elevation of cropland area were evaluated statistically by soil type zone and time.

2.4. Evaluation of Changes in Cropland Quality

2.4.1. Indicator System for Cropland Quality Evaluation

Referring to relevant cropland quality evaluation standards and previous studies [28,46], and considering data availability in the study area, cropland quality evaluation indicators were selected from aspects such as natural conditions, soil fertility, construction level, and cropland productivity. The constructed indicator system for cropland quality evaluation using multi-source data is listed in Table 3. To evaluate the natural conditions of cropland, the most commonly used indicators including terrain slope and surface soil texture [47] were used. To characterize soil fertility and its variation, the mean and coefficient of variation for the cropland NDVI during the crop growth period were calculated for three consecutive years [20]. According to previous studies from the study area, a Julian date of 150–270 was used as the crop growth period in a year [48]. Distance to roads and patch contiguity were used to reflect the construction level of the cropland [49]. Among them, distance to roads stands for the distance from cropland to the nearest road, which indicates road accessibility. Patch contiguity was measured with the CONTIG landscape index as previously described. The mean and coefficient of variation for NPP were also utilized to describe cropland production capacity and its variation [50].

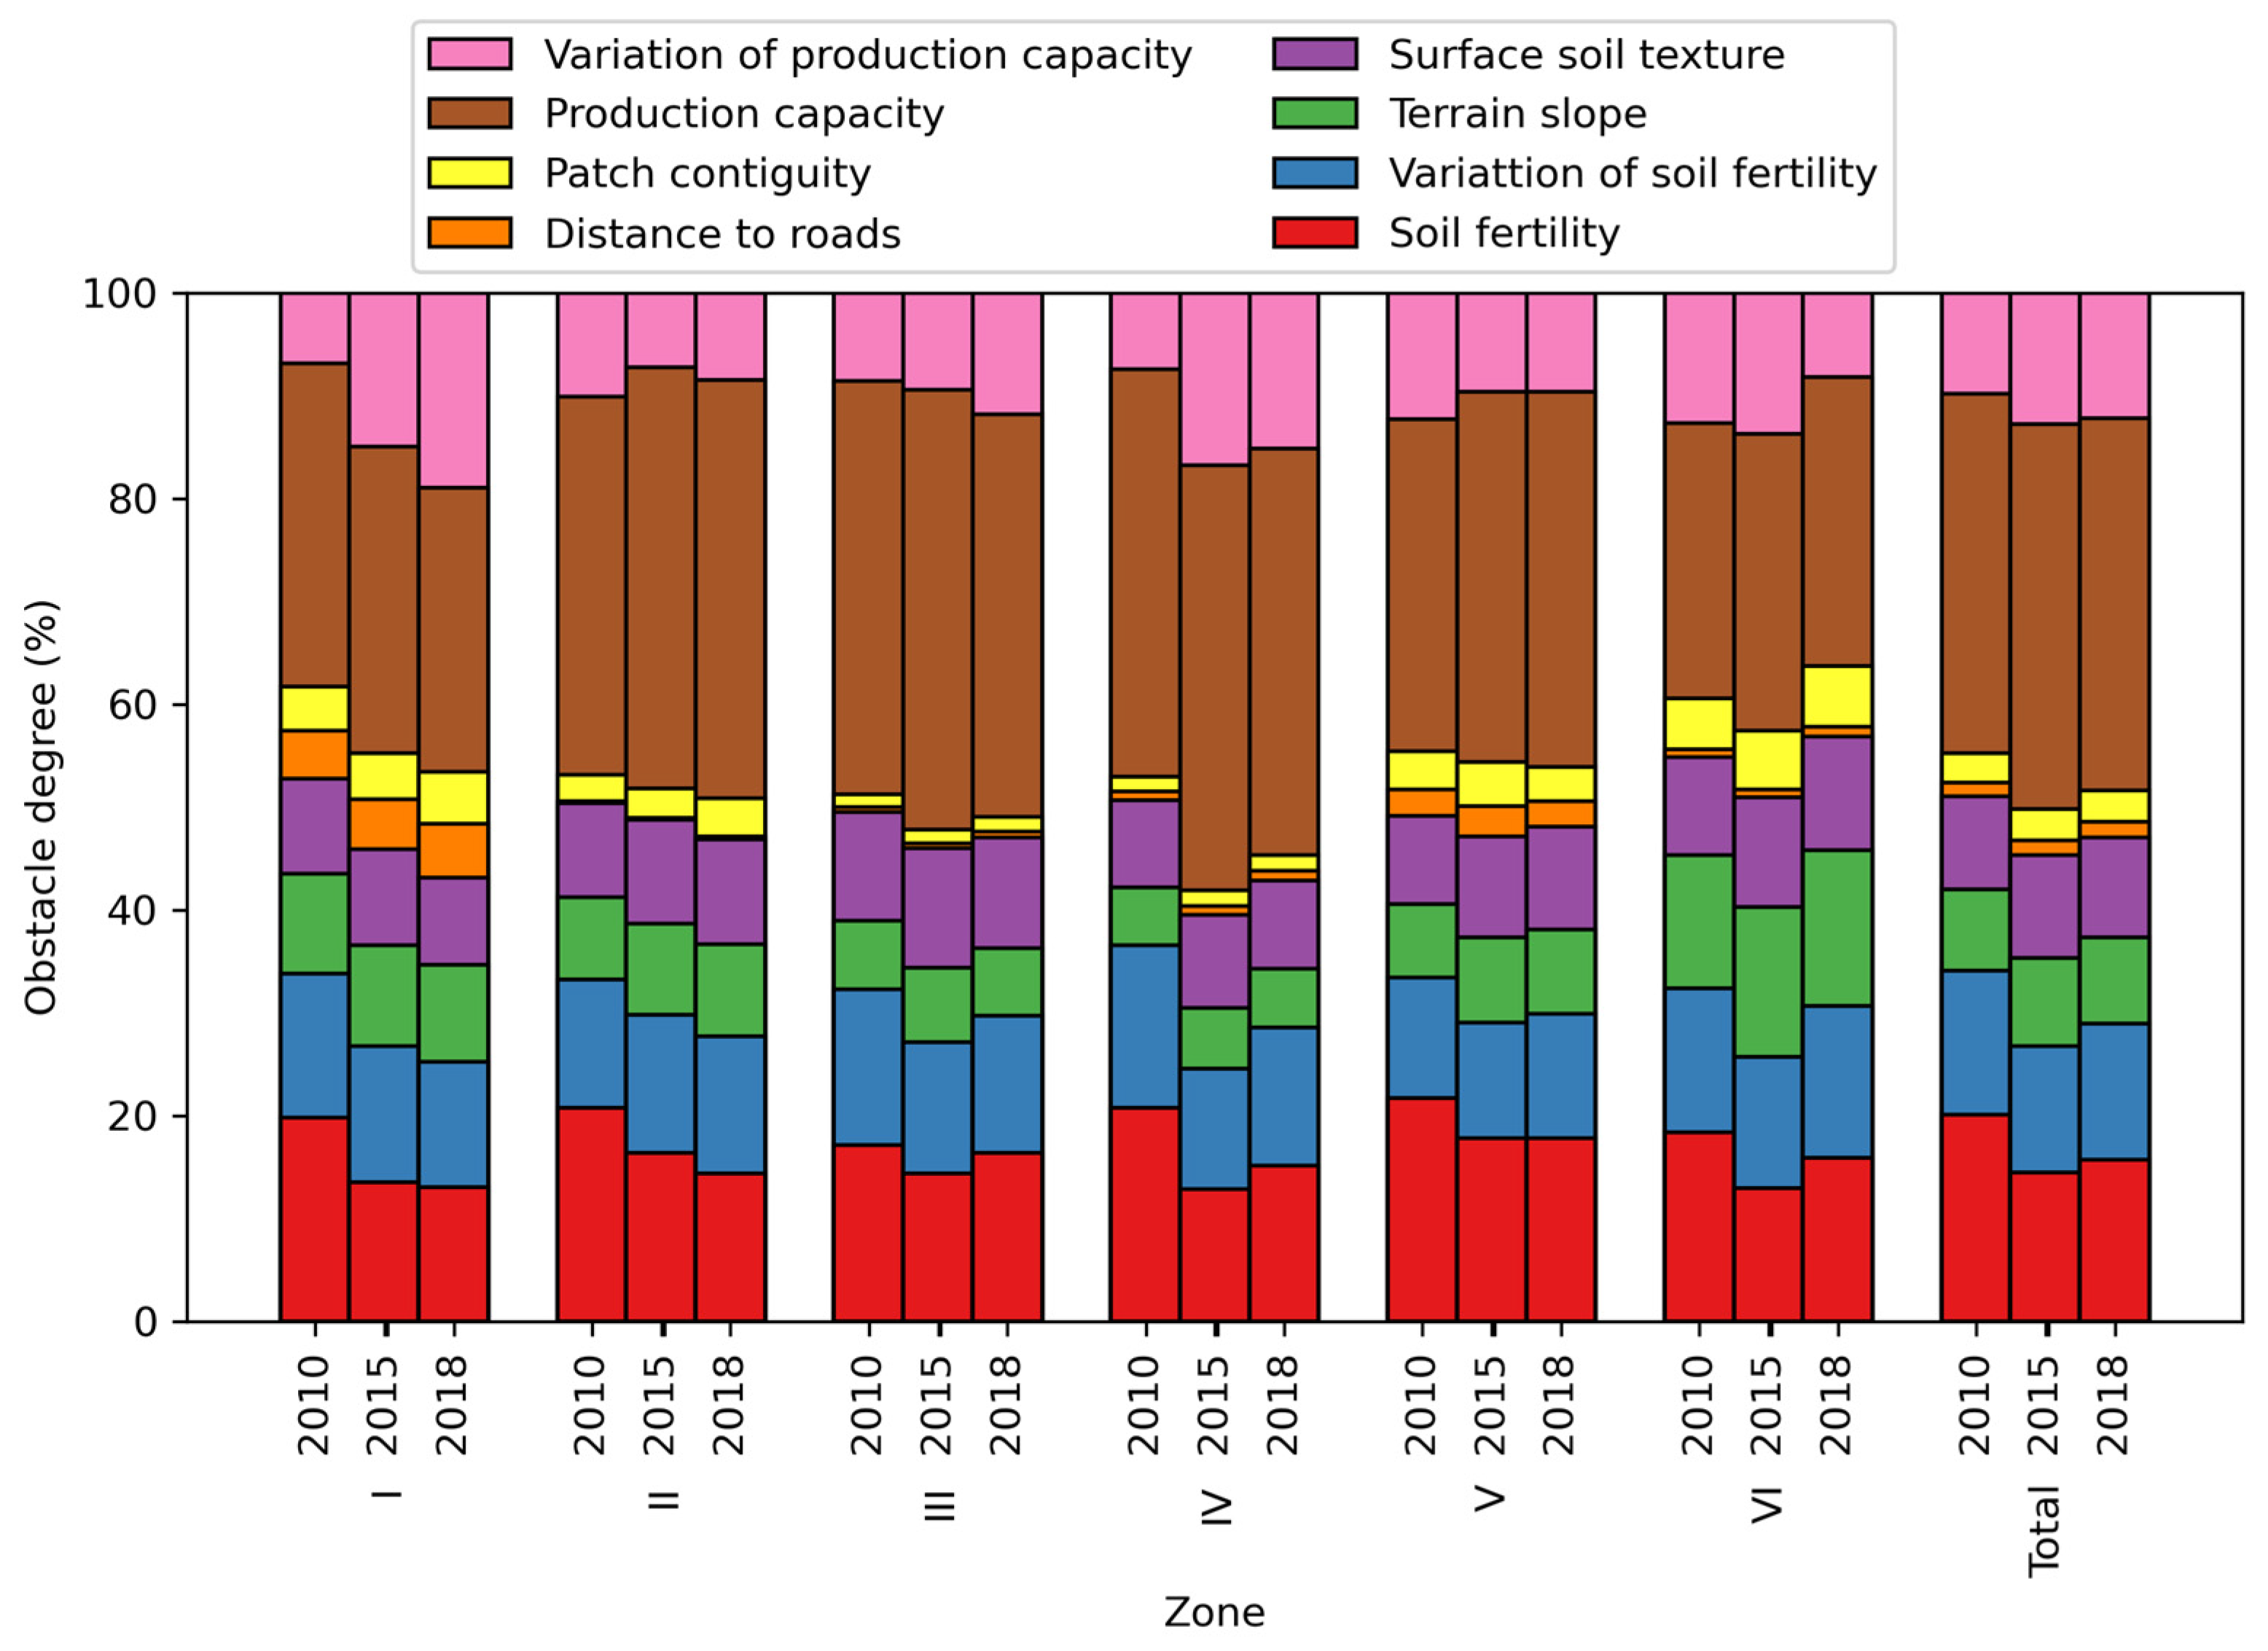
2.4.2. Calculation of Cropland Quality Index and Analysis of Obstacle Factors

Using the constructed indicator system, the cropland quality index was calculated to comprehensively evaluate cropland quality. First, the weight and impact of each evaluation indicator on cropland quality were determined. The analytic hierarchy process was combined with the ranking results indicating the importance of indicators by experts to obtain the weights and then conduct a consistency test on the weights [51]. Then, each evaluation indicator was graded, assigning 1, 2, and 3 to the low, medium, and high grades, respectively (Table 3). Among them, the grading of terrain slope, surface soil texture, and distance to roads referred to the relevant national standards and previous studies [40], while the grading of other indicators was based on the Jenks grading method [52]. Finally, the weights and scores of each evaluation indicator were summarized to calculate the cropland quality index with a range of 1 to 3. Further, the cropland quality index was classified into grades including high, medium, and low. The formulae for cropland quality index and grade are as follows:
Q = i = 1 u W i × I i
Q g r a d e = L o w , 1.0 Q < 2.1 M e d i u m , 2.1 Q < 2.4 H i g h , 2.4 Q 3.0
where Q is cropland quality index, Q g r a d e represents its grade, and u is the number of evaluation indicators. W i and I i are the weight and score of the i -th evaluation indicator, respectively.
With the calculated Q and Q g r a d e results, mean values of the cropland quality index were calculated by soil zone type and time, and the spatial maps of cropland quality grades were created. For the unchanged cropland area (of no conversion to other land cover classes), spatial distribution and statistics for changes in cropland quality grades were calculated. For the changed cropland area (of land cover conversion), the quality grades for gained or lost cropland were depicted and statistics by period were presented.
The obstacle factor diagnosis model was used to analyze factors affecting cropland quality [53]. The obstacle degree of each evaluation indicator was computed based on deviation degree and weight as follows:
O i = W i × D i i = 1 u ( W i × D i ) × 100 %
where O i , W i , and D i are obstacle degree, weight, and deviation degree of the i -th evaluation indicator, respectively. D i = 3 I i , which represents the difference between the highest score and the actual score of the i -th evaluation indicator.
Based on the obtained O i results, the mean values of the obstacle degree of evaluation indicators were summarized by soil type zone and time, and the main obstacle factors were reported.

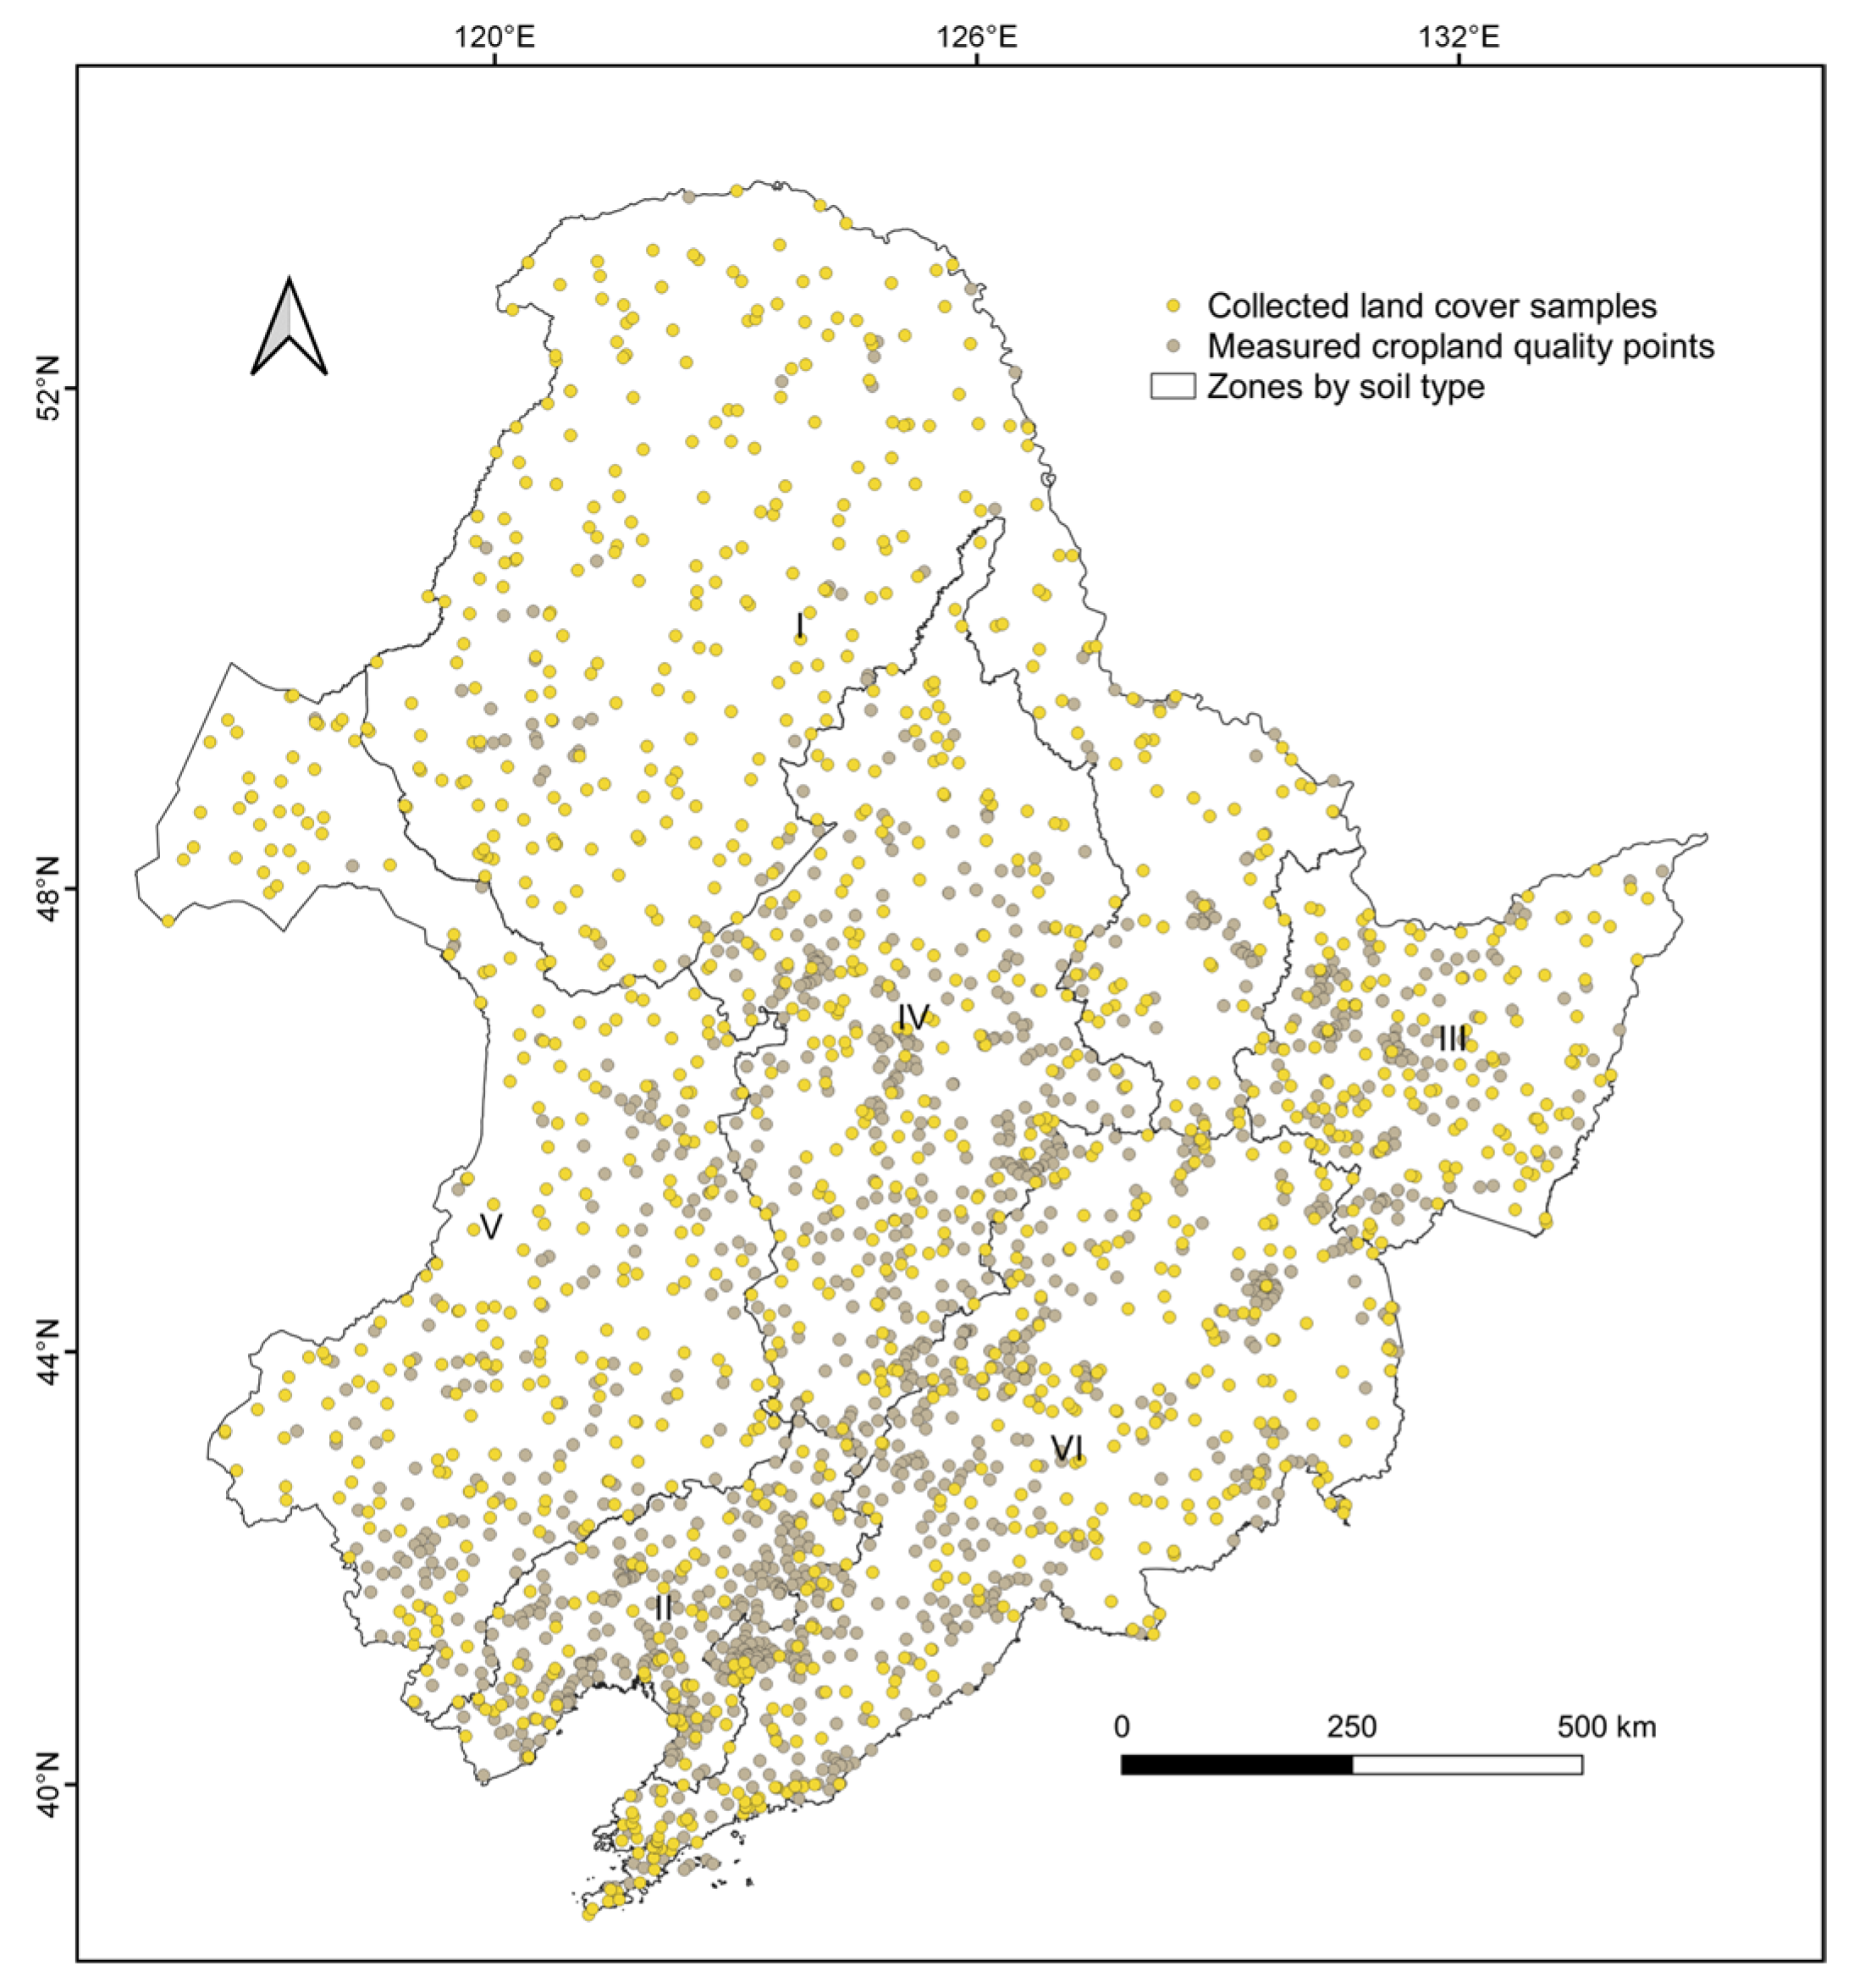
2.5. Accuracy Assessment

To validate the accuracy of used land cover maps, samples were collected. Sample points covering six soil type zones were randomly generated, and their spatial distribution is shown in Figure 2. Referring to imagery from Google Earth, the class of each sample was visually interpreted, and the confidence was recorded [54]. After excluding low-confidence samples, 1212 high-confidence land cover samples were acquired. Among them, the number of unused land, built-up land, water body, grassland, forest, and cropland samples was 42, 136, 176, 184, 330, and 344, respectively. Based on these validation samples, the confusion matrix of the CNLUCC dataset in the study area was calculated, and the weighted F1 score (F1), kappa coefficient, and overall accuracy of land cover maps were assessed [55]. For each land cover class, indicators including F1, user’s accuracy, and producer’s accuracy were reported.
To validate the reliability of evaluated cropland quality results in this study, a comparison with field measurements was performed. The measured data came from the special survey in the Third Land and Resources Survey in China [46]. In the survey, a comprehensive evaluation of cropland quality was conducted considering aspects such as topographical conditions, soil conditions, and ecological environment conditions, based on indicators such as terrain slope, soil pH, surface soil texture, soil organic matter content, soil thickness, and soil heavy metal pollution. A total of 1303 measured points are depicted in Figure 2. Differences between measured and evaluated cropland quality grades at these points were compared to assess the accuracy of evaluation results.

3. Results

3.1. Validation of Cropland Quantity and Quality

Based on the collected land cover samples, the validated accuracy of the CNLUCC dataset is listed in Table 4. Overall, the CNLUCC dataset had high accuracy, with the overall accuracy, kappa, and weighted F1 reaching 90.26%, 87.64%, and 90.30%, respectively. This demonstrates the potential for using the dataset to reflect the land cover status in the study area. Among classes, built-up land, forest, and cropland had higher accuracies, with F1 exceeding 90%. Unused land and grassland had slightly lower accuracies, with an F1 of 78.65% and 83.96%, respectively. Regarding the cropland class, the producer’s accuracy, user’s accuracy, and F1 for cropland were 91.57%, 92.92%, and 92.24%, respectively. In general, these results reflect the strong reliability of using the CNLUCC dataset to analyze changes in the quantity of cropland.
Regarding cropland quality, a comparison between the measured and evaluated results is shown in Figure 3. The differences between the measured and evaluated cropland quality grades at most validation points were small. No difference was observed between the measured and evaluated cropland quality grades for 51.19% of the points. Regarding those with differences, 20.26% and 20.88% of the points had differences of +1 grade and −1 grade between the measured and evaluated results, respectively. Furthermore, the proportions of points with +2 grade and −2 grade differences were 3.76% and 3.91%, respectively. Overall, 92.33% of the validation points showed relatively high consistency between the measured and evaluated results, with absolute values of differences ≤ 1 grade, which indicates the validity of the cropland quality evaluation method utilizing multi-source remote sensing-derived data.

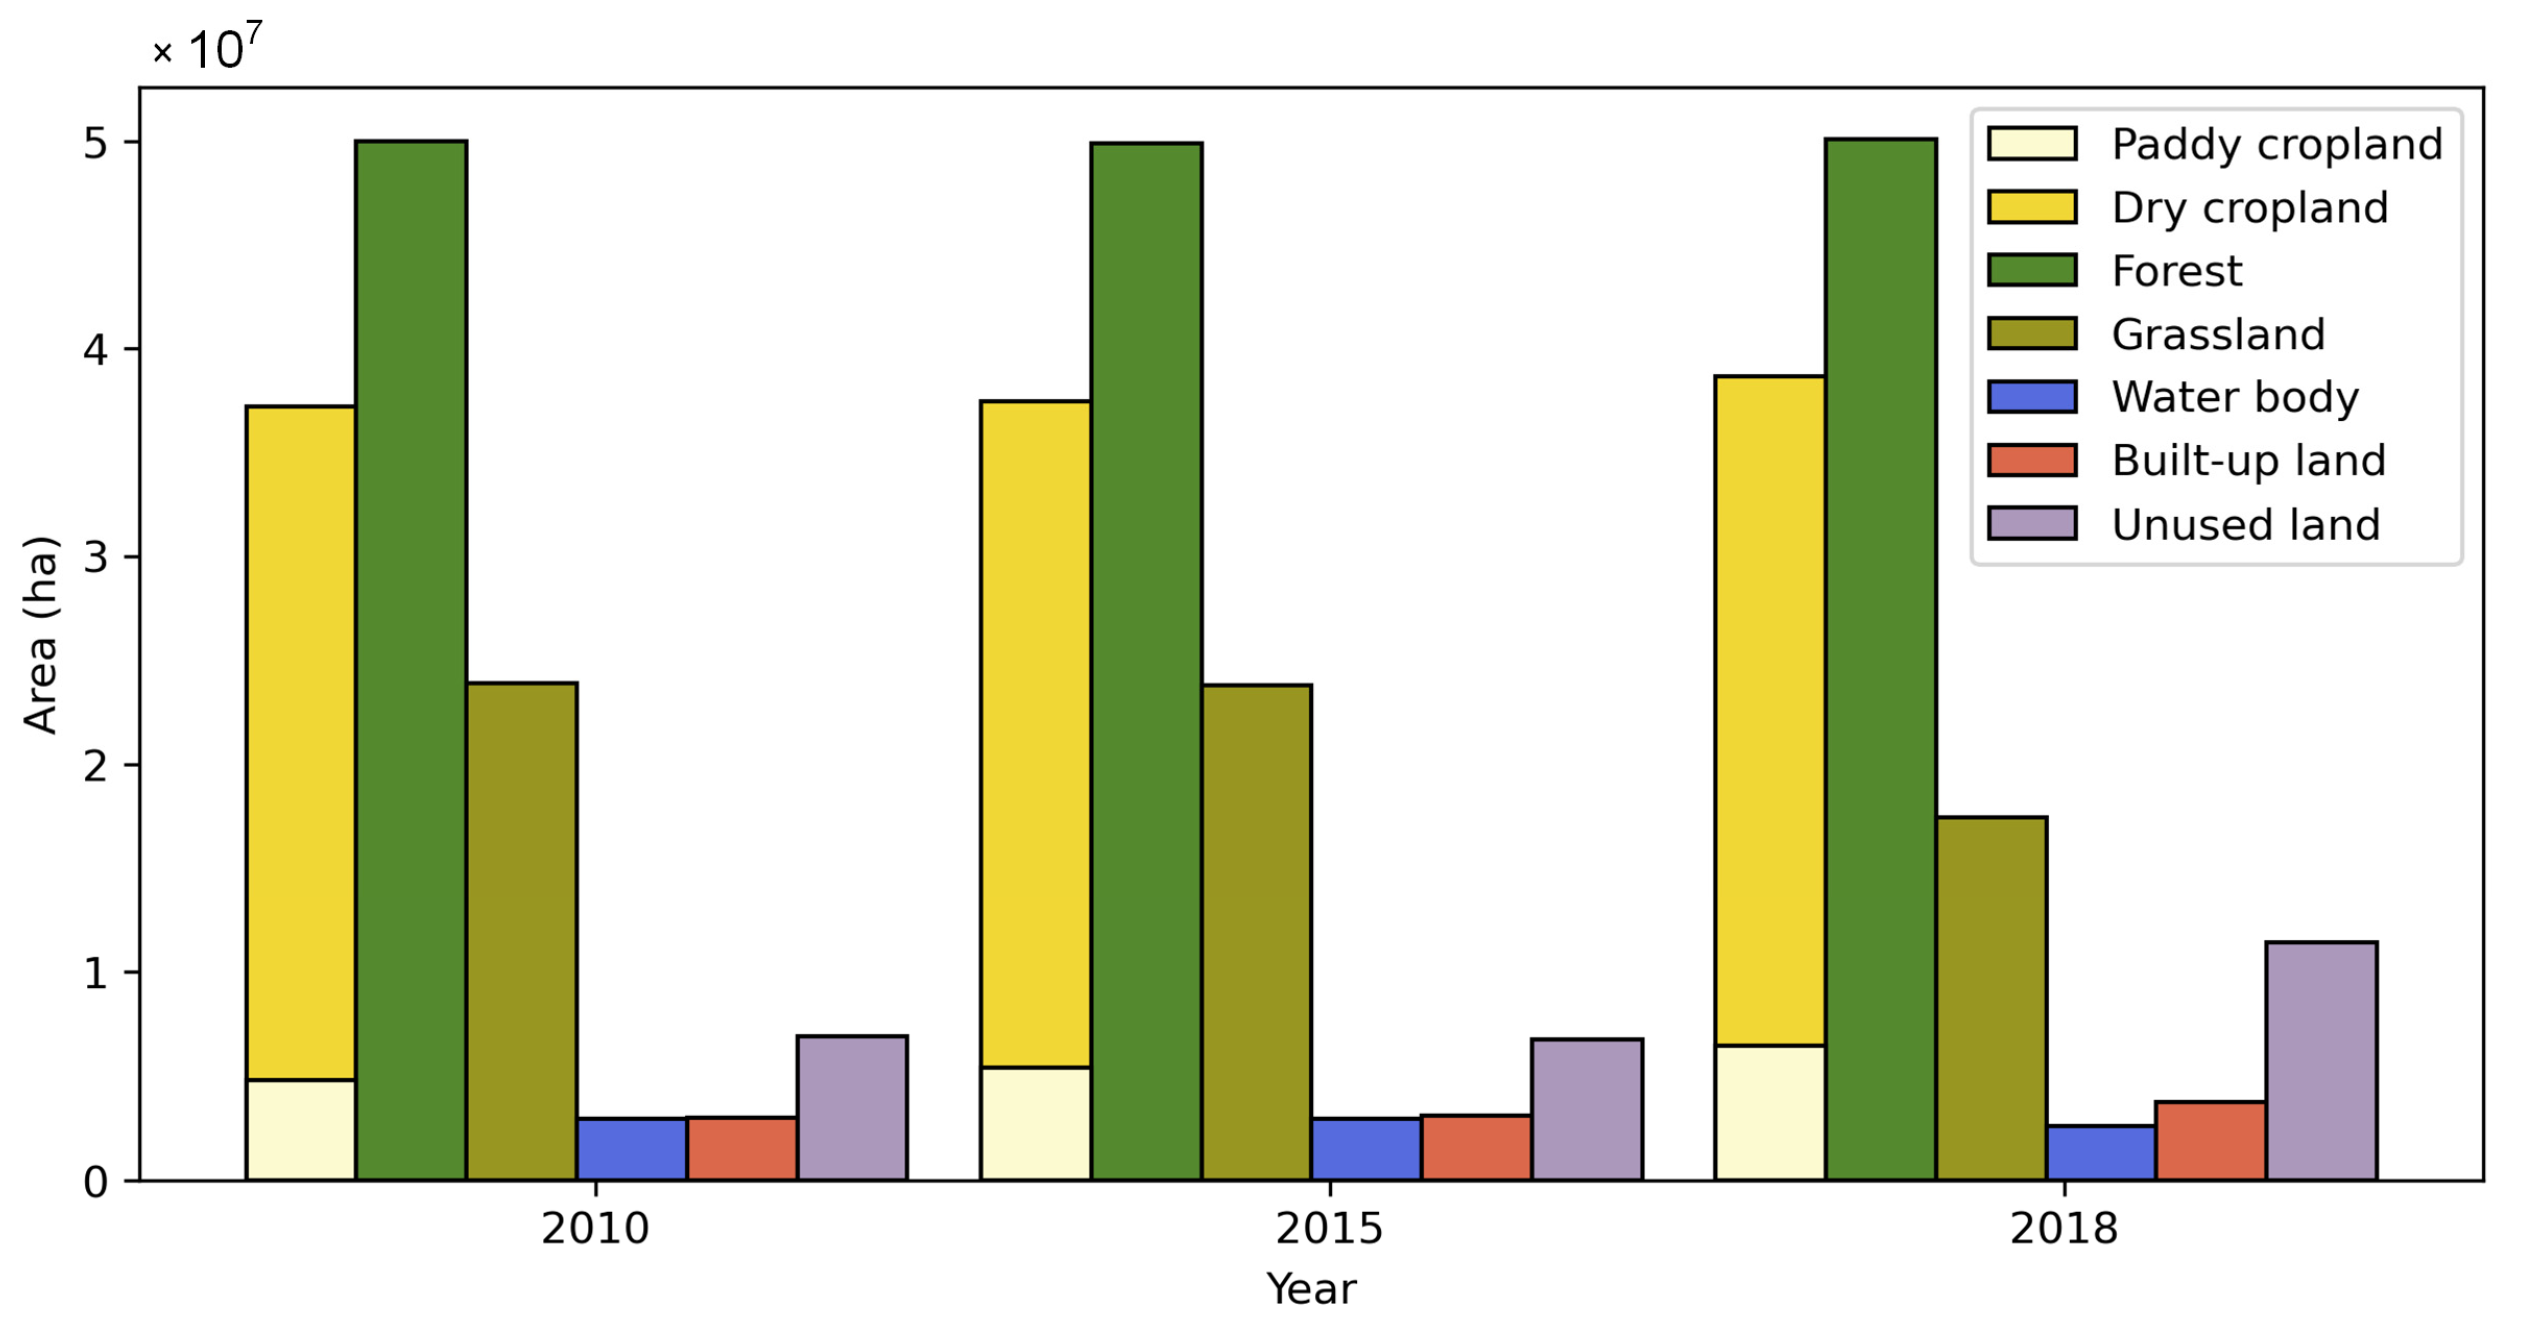
3.2. Spatiotemporal Changes in Cropland Quantity

Cropland was one of the most widely distributed land cover classes (Figure 4). In 2010, 2015, and 2018, the area of cropland reached 37,201,366.17 hectares (30.01%), 37,438,593.39 hectares (30.20%), and 38,654,326.62 hectares (31.18%), respectively. Specifically, the area of dry cropland (32,165,785.98 hectares in 2018) was more than that of paddy cropland (6,488,356.50 hectares in 2018). In terms of soil type zones (Table 5), the area of cropland/dry cropland was greatest in Zone IV (12,050,140.86 hectares/10,762,635.42 hectares in 2018) and the least in Zone I (3,086,010.63 hectares/2,759,792.94 hectares in 2018), while the area of paddy cropland was the greatest in Zone III (2,676,925.35 hectares in 2018) and the least in Zone V (306,008.73 hectares in 2018).
Between 2010 and 2018, the area of cropland increased by 1,452,960.45 hectares, and most changes occurred between 2015 and 2018. The area of dry cropland decreased by 234,014.58 hectares, while the area of paddy cropland increased by 1,687,280.40 hectares. Among them, the loss of dry cropland mainly occurred in Zones II and III, and the gain in paddy cropland was mainly distributed in Zones I and IV. In general, the dynamic changes in cropland in the study area between 2010 and 2018 were significant, with the area of cropland gain and loss reaching 7,132,351.68 hectares and 5,679,085.86 hectares, respectively. In terms of zones, the dynamic changes in cropland in Zones V and VI were relatively large. Between 2010 and 2018, the area of cropland loss reached 1,465,326.09 hectares in Zone V and 1,439,163.09 hectares in Zone VI, and the area of cropland gain reached 1,701,359.46 hectares in Zone V and 1,392,574.95 hectares in Zone VI.
For cropland gain and loss, the land cover conversion sources and destinations of cropland are shown in Figure 5. Between 2010 and 2018, among land converted from cropland, the proportions of forest, grassland, and built-up land were high, reaching 37.88%, 24.40%, and 20.42%, respectively. Among land converted to cropland between 2010and 2018, forest, grassland, and unused land accounted for high proportions, reaching 36.38%, 31.47%, and 16.94%, respectively. In terms of periods, cropland was mostly converted to built-up land (83.58%) between 2010 and 2015, and cropland was mainly converted to forest (38.45%) and grassland (24.82%) between 2015 and 2018. Regarding cropland gain, the main sources between 2010 and 2015 included grassland (32.98%) and unused land (32.39%), while the largest source between 2015 and 2018 was forest (36.77%).
The spatial pattern of cropland and estimated standard deviation ellipses are drawn in Figure 6. Cropland was mostly distributed in the southeast, showing a trend in spatial clustering toward the northeast direction. The gravity center of cropland moved to the northeast by a distance of 20,865.50 km between 2010 and 2018. Specifically, the gravity center of cropland moved slightly eastward (by 2782.39 km) between 2010 and 2015 and moved relatively significantly to the northeast (by 18,160.94 km) between 2015 and 2018.
The spatial distribution and clusters of cropland changes are depicted in Figure 6 and Figure 7. Cropland gain between 2010 and 2018 was widely distributed, mostly situated in the northeast and west. Among them, hot spots of cropland gain were mainly distributed in Zone III between 2010 and 2015, and new hot spots of cropland gain appeared in the west including Zone I and Zone V and in the north of Zone IV between 2015 and 2018. Cropland loss between 2010 and 2018 was mainly distributed in the west. Specifically, hot spots of cropland loss between 2010 and 2015 were mainly distributed in Zone V and the south of Zone IV. Between 2015 and 2018, new hot spots of cropland loss appeared in Zone I and the north of Zone IV.
The measured fragmentation and environmental characteristics of cropland are listed in Table 6. Between 2010 and 2018, cropland patches became larger, as the mean area of cropland patches increased from 602.41 hectares to 649.64 hectares. The regularity in cropland patches decreased slightly, with the mean shape index increasing from 1.82 to 1.92. The mean contiguity index of cropland patches increased from 0.50 in 2010 to 0.54 in 2018, indicating that cropland patches became centrally connected. Regarding the environmental characteristics, cropland in the study area expanded to higher, cooler, and drier areas. During 2010–2018, the mean elevation of the cropland area increased by 1.60 m, the MAT of the cropland area decreased by 0.16 °C, and the MAP of the cropland area decreased by 2.45 mm.

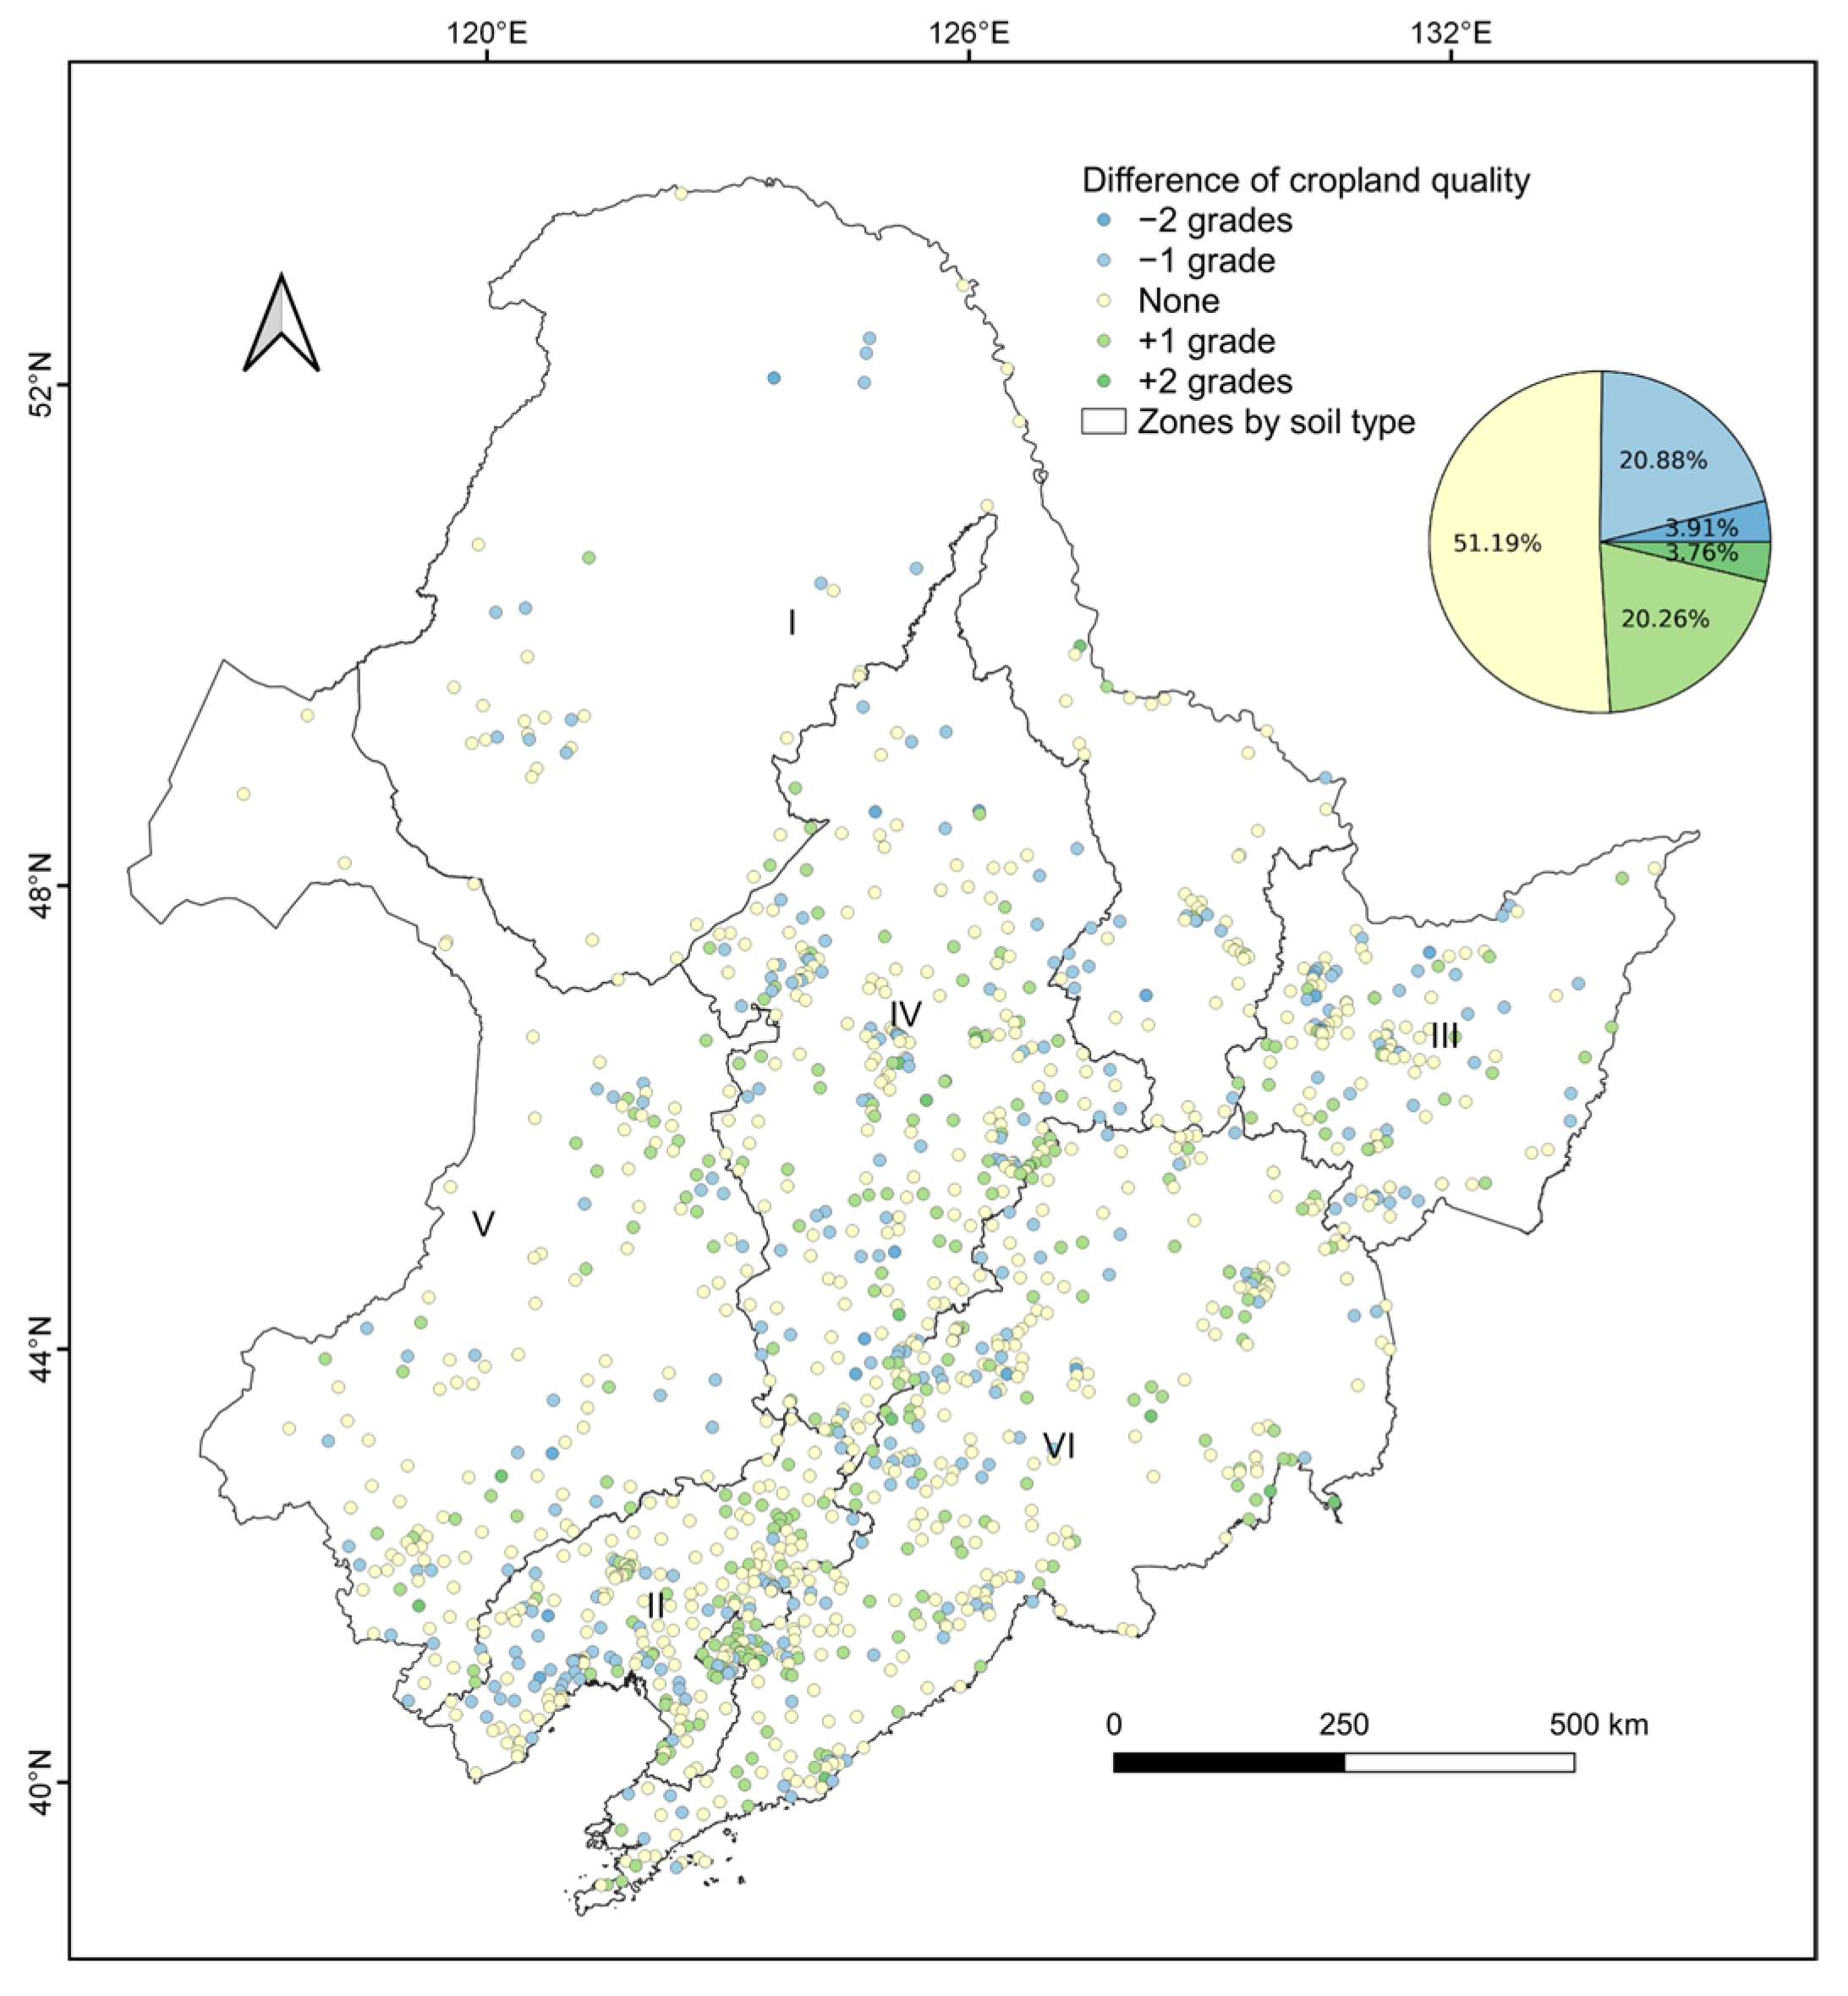
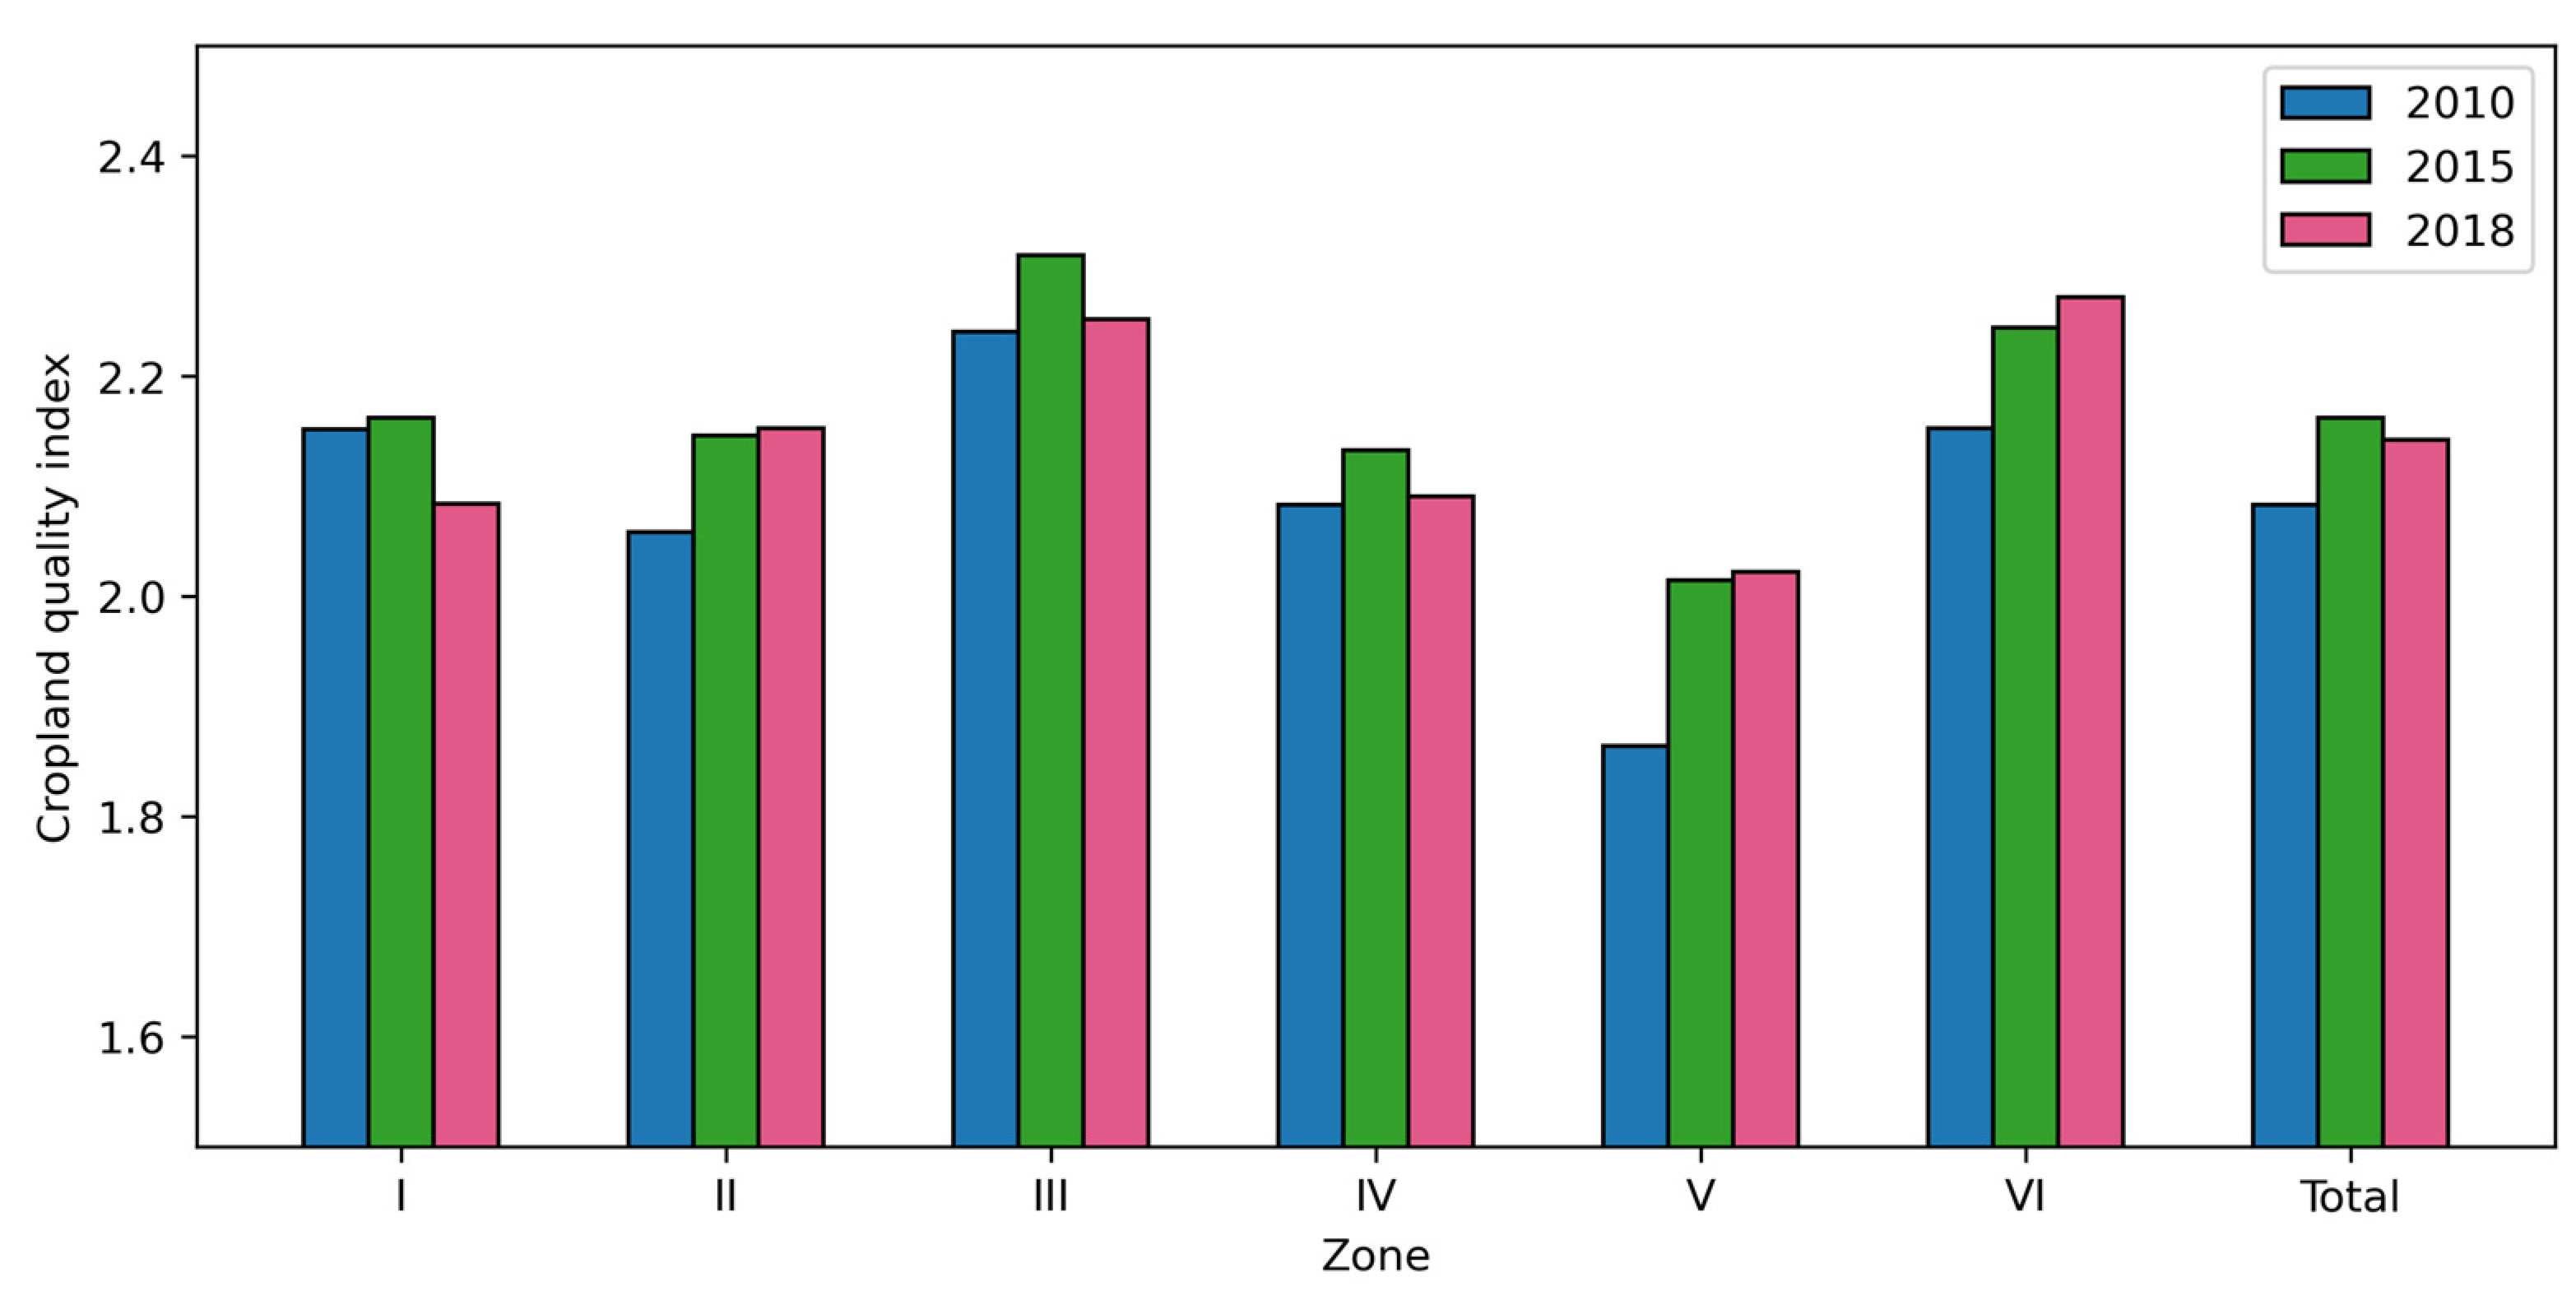
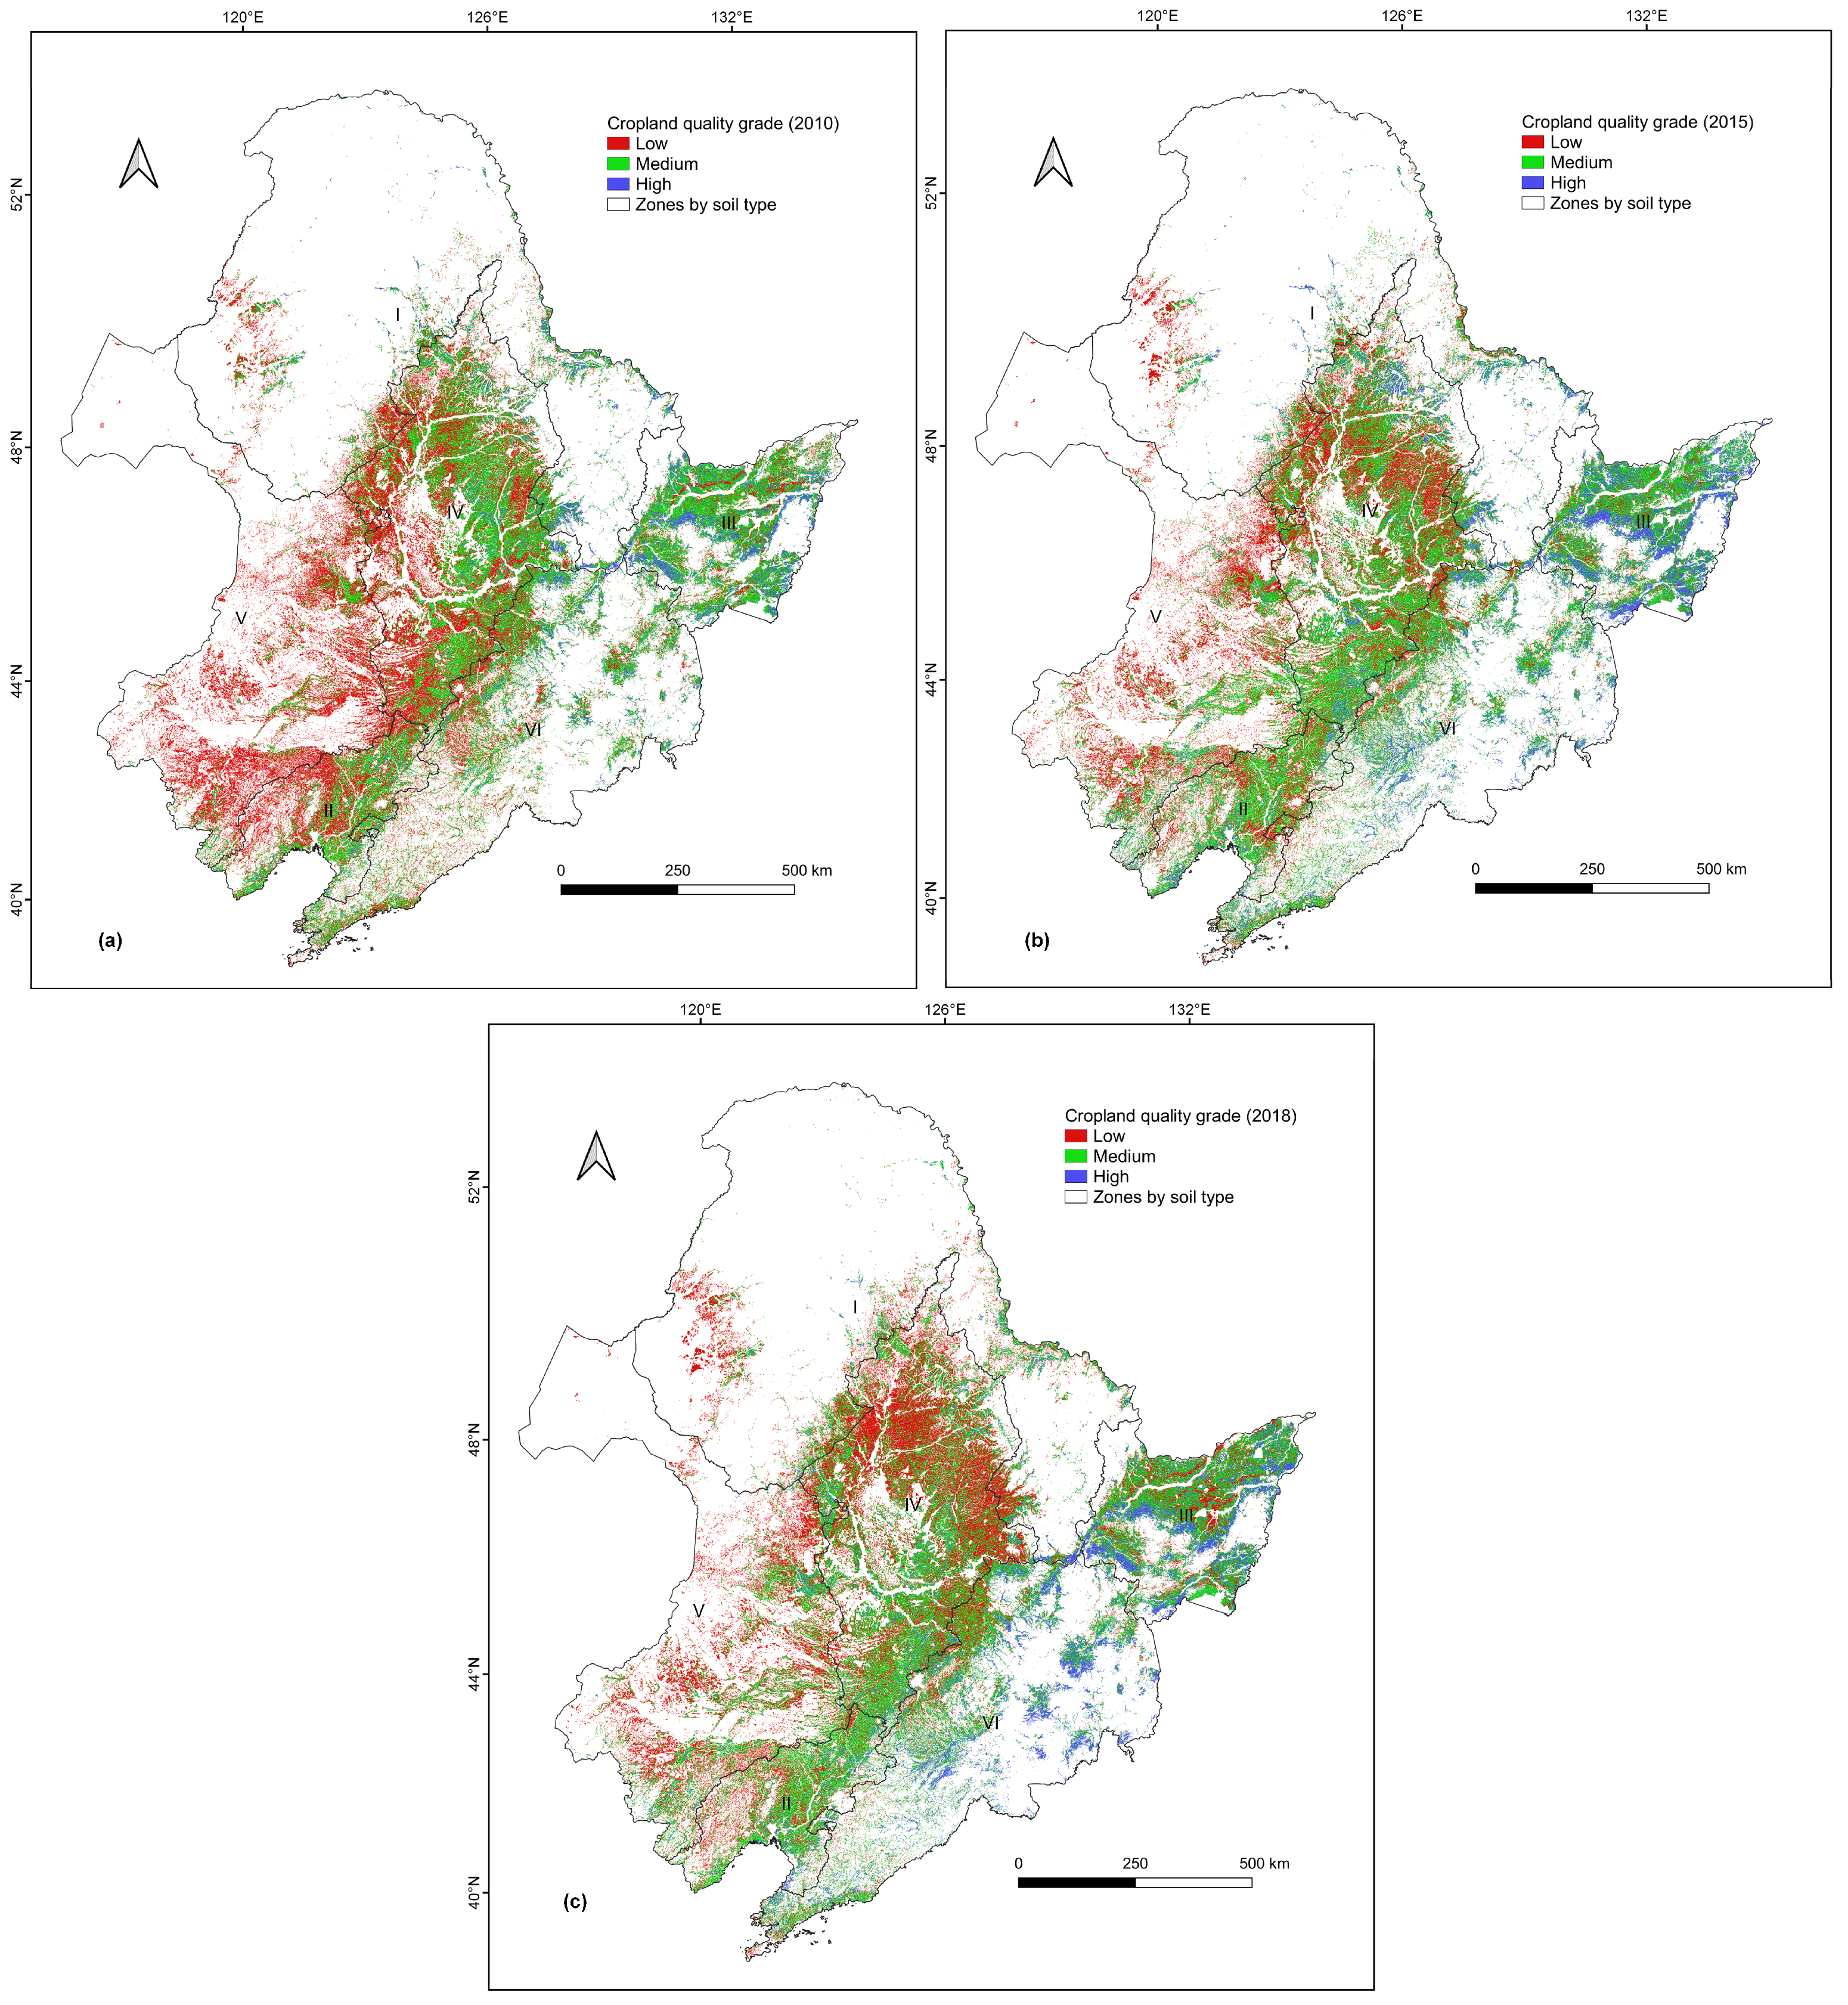
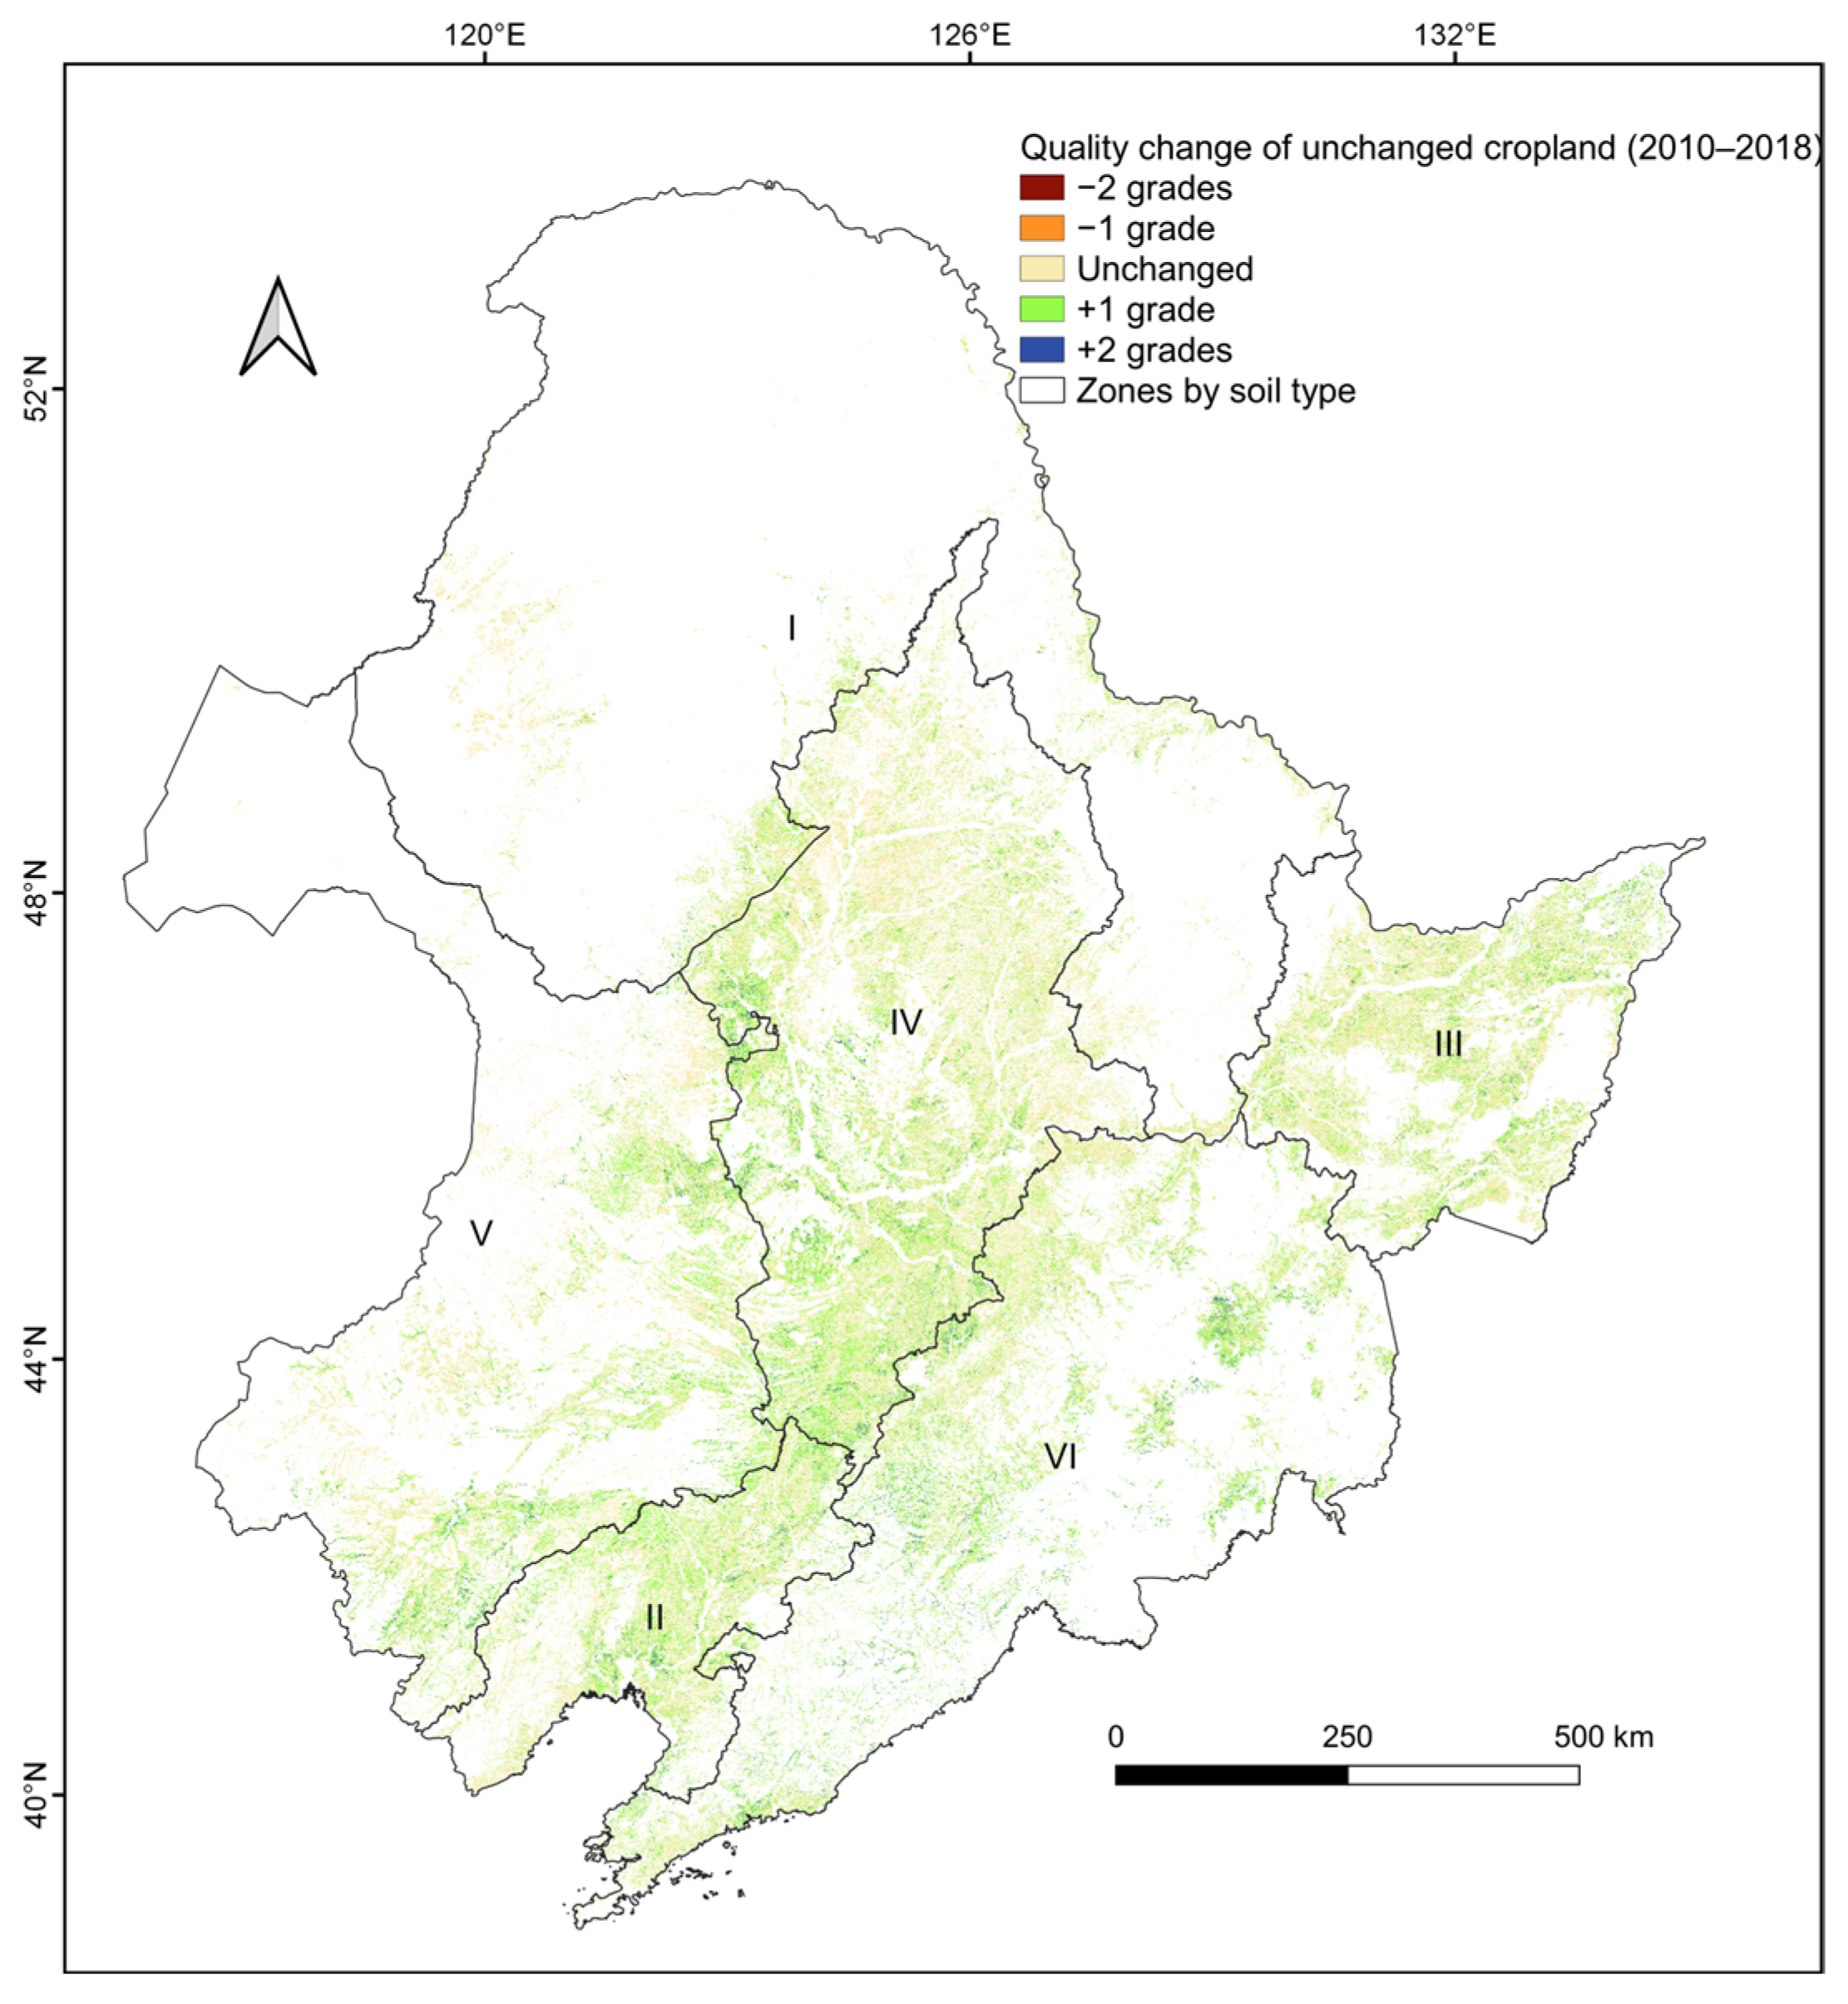
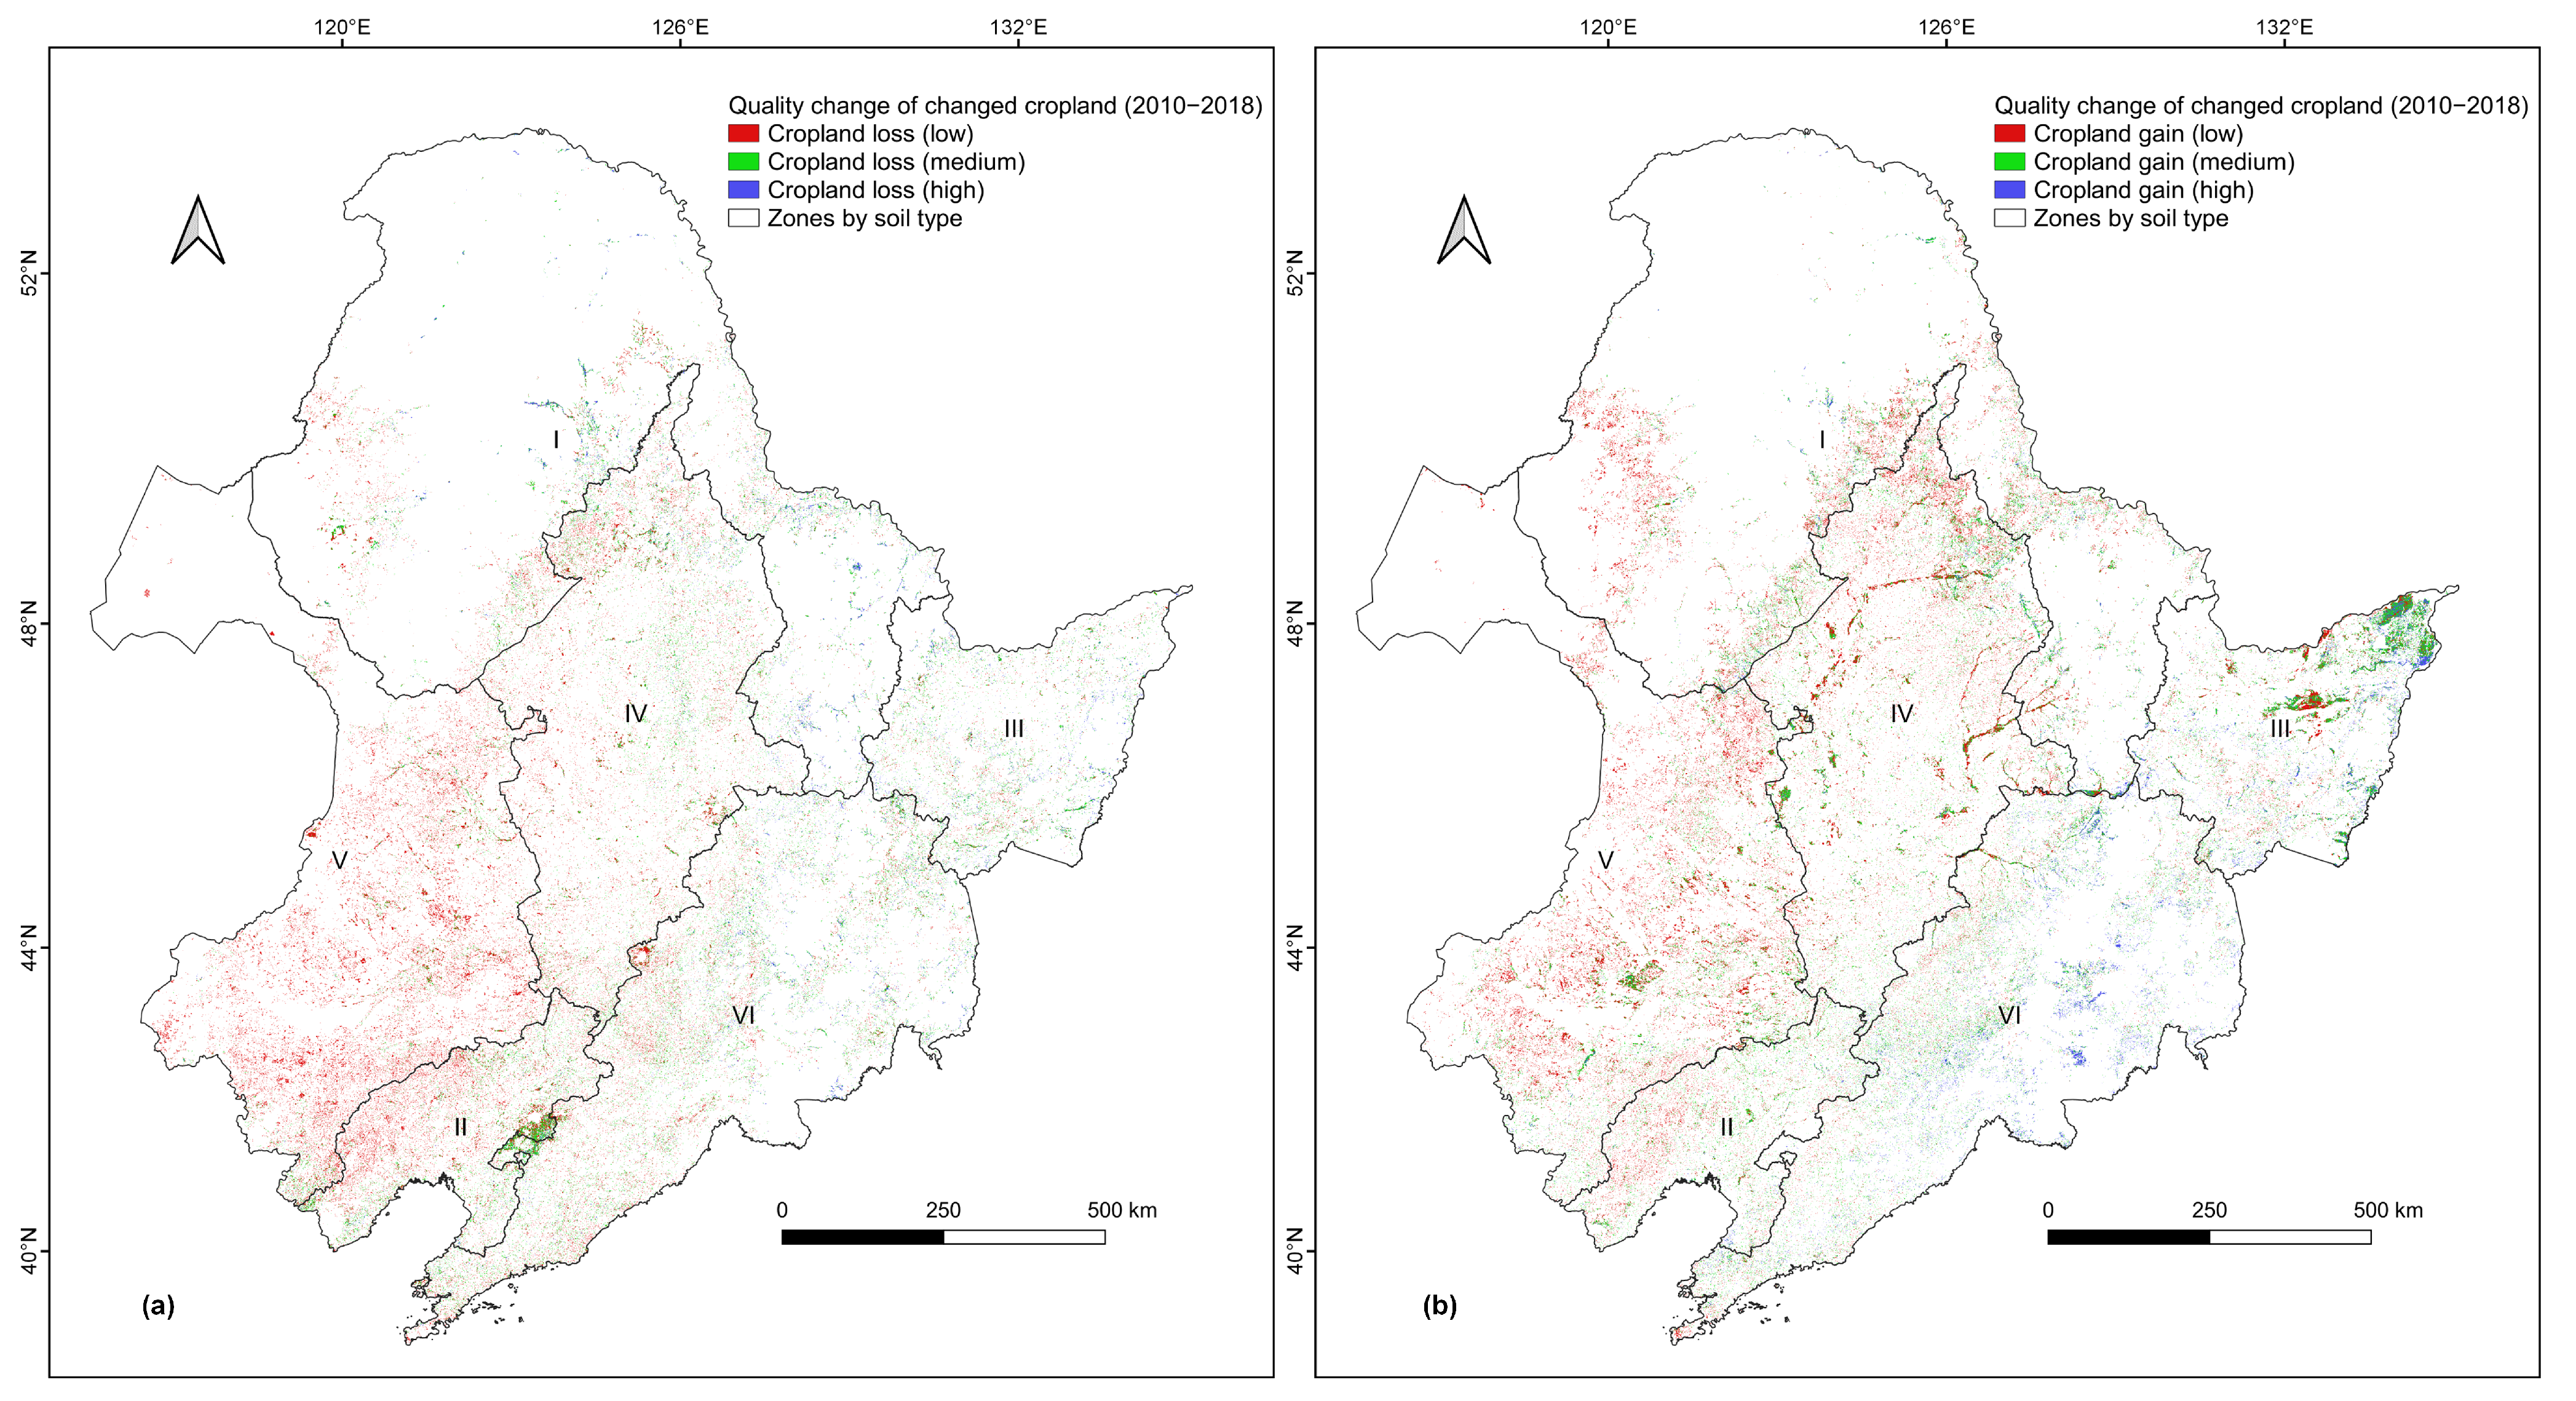
3.3. Spatiotemporal Changes in Cropland Quality

The cropland quality index presented an overall increasing trend (Figure 8), indicating that the cropland quality improved between 2010 and 2018. Specifically, the cropland quality index increased significantly between 2010 and 2015 and decreased slightly between 2015–2018. In terms of soil type zones, between 2010 and 2018, the cropland quality in Zones II, V, and VI improved, but the cropland quality in Zone I declined. According to the evaluation results of cropland quality grades (Table 7), between 2010 and 2018, the area of high-grade and medium-grade cropland increased by 2,183,332.77 hectares and 1,937,219.22 hectares, respectively, and the corresponding proportions increased by 5.65% and 5.17%, respectively. In contrast, the area and proportion of low-grade cropland decreased by 2,667,591.54 hectares and 7.17%.
The spatial pattern of cropland quality grades between 2010 and 2018 is shown in Figure 9. In the east (especially Zone VI), high-grade cropland increased, while low-grade cropland decreased, indicating that cropland quality in this region improved. In the south (especially Zone V), low-grade cropland decreased, while medium-grade cropland increased, implying that cropland quality in this region generally improved. Furthermore, low-grade cropland in the north (especially in Zones I and IV) increased, reflecting a decline in cropland quality.
Regarding the unchanged cropland area, changes in the cropland quality grades are listed in Table 8. Quality grades for over 50% (56.36% between 2010 and 2015, 57.38% between 2015 and 2018, and 53.71% between 2010 and 2018) of the unchanged cropland remained unchanged during the study period. The proportions of unchanged cropland with quality grades increasing by two grades and one grade were 2.58% and 26.92%, respectively. The proportions of unchanged cropland with quality grades decreasing by two grades and one grade were 0.98% and 15.81%, respectively. Overall, the proportion of unchanged cropland with increased quality grades (29.50%) was greater than that with decreased quality grades (16.79%), which indicates that the quality of unchanged cropland area improved during 2010–2018.
The spatial distribution of quality changes in unchanged cropland area is depicted in Figure 10. Overall, unchanged cropland with unchanged quality grades was widely distributed across the whole study area. Unchanged cropland with increased quality grades was mostly distributed in the center and south (such as Zones II, IV, V, and VI). In contrast, the spatial distribution of unchanged cropland with decreased quality grades was not obvious.
Regarding the changed cropland area (including cropland gain and loss), the cropland quality grades are listed in Table 9. Lost cropland was mainly of medium and low grades. For example, between 2010 and 2018, the proportions of lost high-grade, medium-grade, and low-grade cropland were 3.82%, 14.67%, and 25.84%, respectively. Compared with the lost cropland area, the proportion of high-grade cropland in the gained cropland area was higher. For instance, between 2010 and 2018, the area of lost and gained high-grade cropland was 489,957.30 hectares and 985,881.15 hectares, respectively.
The spatial characteristics of quality grade changes in the changed cropland areas are shown in Figure 11. Between 2010 and 2018, high-grade cropland was mainly lost in the north and south (Zones I and VI), and low-grade cropland was mainly lost in the southeast and southwest (Zones V and VI). The gained high-grade cropland was mostly concentrated in the east and southeast (Zones III and VI), while the gained low-grade cropland was mainly concentrated in the center and west (Zones V and VI).
The diagnosed obstacle degree for each evaluation indicator to cropland quality is demonstrated in Figure 12. Overall, production capacity was the biggest obstacle factor to cropland quality. In 2010, 2015, and 2018, the obstacle degree of production capacity was 34.98%, 37.43%, and 36.22%, respectively. In addition, soil fertility, variation in soil fertility, and variation in production capacity were also the main obstacle factors to cropland quality. In 2018, the obstacle degree of the three indicators reached 15.64%, 13.26%, and 12.22%, respectively. Regarding the change in the obstacle degree, between 2010 and 2018, the obstacle degree for production capacity and variation in production capacity increased by 1.24% and 2.37%, respectively, while the obstacle degree for soil fertility decreased by 4.39%.
The obstacle degree for the evaluation indicators was different among soil type zones. The indicators for natural conditions showed the highest obstacle degree in Zone VI. For example, in 2018, the obstacle degree of terrain slope and surface soil texture in Zone VI reached 15.16% and 11.06%, respectively. In terms of indicators for soil fertility, the obstacle degree of soil fertility in Zone V was the highest (17.79% in 2018), and the obstacle degree of variation in soil fertility in Zone VI was the highest (14.75% in 2018). As for indicators for the construction level, the distance to roads in Zone I and patch contiguity in Zone VI presented the highest obstacle degree, reaching 5.22% and 5.88%, respectively, in 2018. Among productivity indicators, production capacity had the highest obstacle degree in Zone II (40.71% in 2018), while the variation in production capacity had the highest obstacle degree in Zone IV (15.18% in 2018).

4. Discussion

4.1. Effectiveness of Cropland Evaluation with Multi-Source Remote Sensing

A method using multi-source remote sensing-derived data was used to assess spatiotemporal changes in cropland. Compared with traditional methods based on limited field measurements, remote sensing is conducive to providing large-scale dynamic monitoring data efficiently and helps to obtain more objective and timely cropland evaluation results [56,57]. The method used in this study with remote sensing data effectively supported a spatiotemporal evaluation of cropland in Northeast China for nearly a 10-year period. At the same time, the integration of multi-source remote sensing can provide richer information, which contributes to a more comprehensive evaluation of cropland [58,59]. In this study, by combining multi-source data including the NDVI, NPP, land cover, and topography, a multi-dimensional evaluation system for cropland that reflects land cover change, natural conditions, soil fertility, construction level, and production capacity was constructed. This system facilitates an in-depth understanding of the characteristics of cropland quantity and quality and the driving and obstacle factors. The comparison between and validation of the interpretation and measurement samples showed that the obtained cropland evaluation results were relatively accurate and consistent with actual situations. This further demonstrates the validity and reliability of the cropland evaluation method with multi-source remote sensing data and its application potential to support cropland management and decision-making.

4.2. Driving Factors of Spatiotemporal Changes in Cropland

The spatiotemporal changes in cropland are affected by natural and human factors [60]. Among them, natural factors such as temperature, precipitation, moisture, etc., usually have small variations and are relatively stable. Human factors such as population, economic development, and policies are more likely to change. The results obtained in this study demonstrated that between 2010 and 2018, the area of cropland increased, and the quality of cropland generally improved in the black soil region in Northeast China. According to statistical data, the population of China increased [61], which likely increased the demand for food. This possibly caused the net increase in cropland area in the study area, which is an important grain production base, and promoted conversion of unused land, forest, grassland, etc., to increase food production and ensure food security. Simultaneously, the demand for economic development promoted the increase in land development and utilization intensity [62], leading to cropland degradation and loss. Recently, national and local governments have strengthened the protection and management of cropland in the black soil region in Northeast China and launched pilot projects to protect black soil [63]. The implementation of policies such as land consolidation and conservation tillage were beneficial to the gain and improvement of cropland. Evaluation results in this study also confirmed the rationality and effectiveness of protection actions in the study area.

4.3. Measures and Suggestions for Cropland Protection

The research on cropland evaluation and obstacle factor diagnosis carried out in this study can provide insight and guidance for cropland protection and management in the black soil region in Northeast China. Although the obtained results presented a generally improving trend in cropland, cropland quality in some areas, such as the north, declined. In the future, it is necessary to focus on these areas and increase investment and governance in cropland. Firstly, to ensure the area of cropland, the cropland requisition–compensation balance policy [64] should be strictly implemented. At the same time, the phenomenon of occupying superior cropland while compensating for inferior cropland should be eliminated. Secondly, to improve the quality of cropland, conservation tillage measures [65], such as the application of organic fertilizers and implementation of crop rotation, should be promoted. Productivity and soil fertility were key factors affecting cropland quality in the study area. In this regard, measures such as the application of organic fertilizers and straw return should be used to improve soil organic matter content and enhance cropland productivity and stability, and the crop rotation mode can be implemented to promote fertilization of cropland. In addition, land consolidation efforts should be strengthened to control the loss of soil, water, and nutrients and curb black soil degradation and fertility decline. The land cover structure and layout need to be optimized according to local conditions. Finally, relevant laws and regulations on cropland protection should be formulated and implemented, so as to fundamentally restrict and guarantee the proper use of black soil resources and promote sustainable and healthy cropland ecosystems in the black soil region in Northeast China.

4.4. Limitations and Future Work

Some limitations and challenges existed in this study, which need to be further explored in future work. First of all, although the combination of multi-source data was advantageous for cropland evaluation, it also showed some uncertainties. For example, classification errors in land cover maps based on remote sensing can cause some interference with the evaluation of cropland resources and land cover conversion processes [66]. Inconsistencies in the spatiotemporal resolution of multi-source data may also affect the reliability of cropland evaluation results to some degree [67]. In the future, it is necessary to develop and utilize datasets and products of higher quality, longer time series, and higher spatial resolution [68] to support cropland evaluation research. Secondly, due to data acquisition limitations, the indicator system for cropland quality evaluation established in this study ignored factors such as ecological security and biodiversity. This may lead to a certain degree of one-sidedness in the evaluation results. Therefore, constructing a more comprehensive evaluation indicator system for cropland quality is also an issue worth exploring in future research. In addition, the expert scoring method was utilized to determine the weights of cropland quality indicators. Although this method utilized expert experience, it may also introduce subjectivity [69,70]. In the future, machine learning algorithms can be further introduced to obtain more accurate and objective cropland evaluation results [71,72,73]. Furthermore, comparisons with related studies in a similar study area [27,74] showed some differences in results. This may be caused by differences in used data sources and study periods. Cropland analysis and evaluation based on more accurate and recent (especially since 2018) data [75] are needed in future.

5. Conclusions

In this study, the spatiotemporal characteristics of cropland quantity and quality in the black soil region in Northeast China between 2010 and 2018 were identified using the proposed evaluation method with multi-source remote sensing data, and the main factors affecting the changes in cropland were discussed. The obtained results indicated that:
(1) The area of cropland increased, cropland patches became larger, and cropland patch connectivity improved. The gained cropland was mostly concentrated in the northeast and west, and the gravity center of cropland moved to the northeast. The sources of cropland gain mainly included forest, grassland, and unused land.
(2) The quality of cropland generally improved. Proportions of high-quality and medium-quality cropland increased, and the proportion of low-quality cropland decreased. The quality of cropland improved significantly in the east, improved relatively in the southwest, and slightly declined in the north. Production capacity, soil fertility, and variation in soil fertility were main factors affecting cropland quality.
Overall, the results proved the effectiveness of the implemented cropland protection policies and projects. Simultaneously, the obtained results can further support protection and management of cropland, and the proposed method can guide cropland analysis studies in other regions.

Author Contributions

Conceptualization, H.L. (Han Liu), Y.W., L.S. and C.Z.; methodology, H.L. (Han Liu) and Y.W.; software, H.L. (Han Liu) and Y.W.; validation, H.L. (Hongtao Liu) and Z.Z.; formal analysis, H.L. (Han Liu) and Y.W.; investigation, H.L. (Hongtao Liu) and Z.Z.; resources, H.L. (Han Liu), Y.W., L.S. and C.Z.; data curation, H.L. (Han Liu), Y.W. and LS.; writing—original draft preparation, H.L. (Han Liu), Y.W., L.S. and S.W.; writing—review and editing, H.L. (Han Liu), Y.W., L.S., C.Z., T.H., H.L. (Hongtao Liu), Z.Z., S.W., S.M. and Z.J.; visualization, H.L. (Han Liu) and Y.W.; supervision, C.Z. and T.H.; project administration, H.L. (Han Liu) and L.S.; funding acquisition, H.L. (Han Liu) and L.S. All authors have read and agreed to the published version of the manuscript.

Funding

This research was funded by the National Key Research and Development Program of China (2021YFD1500204), the National Natural Science Foundation of China (42301461), and Open Research Fund Program of Key Laboratory of Digital Mapping and Land Information Application, Ministry of Natural Resources (ZRZYBWD202210).

Data Availability Statement

Not applicable.

Conflicts of Interest

The authors declare no conflict of interest.

References

  1. Guo, A.; Yue, W.; Yang, J.; Xue, B.; Xiao, W.; Li, M.; He, T.; Zhang, M.; Jin, X.; Zhou, Q. Cropland Abandonment in China: Patterns, Drivers, and Implications for Food Security. J. Clean. Prod. 2023, 418, 138154. [Google Scholar] [CrossRef]
  2. Vijay, V.; Armsworth, P.R. Pervasive Cropland in Protected Areas Highlight Trade-Offs Between Conservation and Food Security. Proc. Natl. Acad. Sci. USA 2021, 118, e2010121118. [Google Scholar] [CrossRef] [PubMed]
  3. Zeng, Z.; Estes, L.; Ziegler, A.D.; Chen, A.; Searchinger, T.; Hua, F.; Guan, K.; Jintrawet, A.; Wood, E.F. Highland Cropland Expansion and Forest Loss in Southeast Asia in the Twenty-First Century. Nat. Geosci. 2018, 11, 556–562. [Google Scholar] [CrossRef]
  4. Smith, P.; Calvin, K.; Nkem, J.; Campbell, D.; Cherubini, F.; Grassi, G.; Korotkov, V.; Le Hoang, A.; Lwasa, S.; McElwee, P.; et al. Which Practices Co-Deliver Food Security, Climate Change Mitigation and Adaptation, and Combat Land Degradation and Desertification? Glob. Chang. Biol. 2020, 26, 1532–1575. [Google Scholar] [CrossRef]
  5. Wang, S.; Bai, X.; Zhang, X.; Reis, S.; Chen, D.; Xu, J.; Gu, B. Urbanization can Benefit Agricultural Production with Large-Scale Farming in China. Nat. Food 2021, 2, 183–191. [Google Scholar] [CrossRef] [PubMed]
  6. Li, C.; Kandel, M.; Anghileri, D.; Oloo, F.; Kambombe, O.; Chibarabada, T.P.; Ngongondo, C.; Sheffield, J.; Dash, J. Recent Changes in Cropland Area and Productivity Indicate Unsustainable Cropland Expansion in Malawi. Environ. Res. Lett. 2021, 16, 084052. [Google Scholar] [CrossRef]
  7. Zuo, C.; Wen, C.; Clarke, G.; Turner, A.; Ke, X.; You, L.; Tang, L. Cropland Displacement Contributed 60% of the Increase in Carbon Emissions of Grain Transport in China over 1990–2015. Nat. Food 2023, 4, 223–235. [Google Scholar] [CrossRef]
  8. Fritz, S.; See, L.; McCallum, I.; You, L.; Bun, A.; Moltchanova, E.; Duerauer, M.; Albrecht, F.; Schill, C.; Perger, C.; et al. Mapping Global Cropland and Field Size. Glob. Chang. Biol. 2015, 21, 1980–1992. [Google Scholar] [CrossRef]
  9. Yin, H.; Brandão, A.; Buchner, J.; Helmers, D.; Iuliano, B.G.; Kimambo, N.E.; Lewińska, K.E.; Razenkova, E.; Rizayeva, A.; Rogova, N.; et al. Monitoring Cropland Abandonment with Landsat Time Series. Remote Sens. Environ. 2020, 246, 111873. [Google Scholar] [CrossRef]
  10. Amin, E.; Verrelst, J.; Rivera-Caicedo, J.P.; Pipia, L.; Ruiz-Verdú, A.; Moreno, J. Prototyping Sentinel-2 Green LAI and Brown LAI Products for Cropland Monitoring. Remote Sens. Environ. 2021, 255, 112168. [Google Scholar] [CrossRef]
  11. Zhuang, Q.; Wu, S.; Huang, X.; Kong, L.; Yan, Y.; Xiao, H.; Li, Y.; Cai, P. Monitoring the Impacts of Cultivated Land Quality on Crop Production Capacity in Arid Regions. CATENA 2022, 214, 106263. [Google Scholar] [CrossRef]
  12. Potapov, P.; Turubanova, S.; Hansen, M.C.; Tyukavina, A.; Zalles, V.; Khan, A.; Song, X.-P.; Pickens, A.; Shen, Q.; Cortez, J. Global Maps of Cropland Extent and Change Show Accelerated Cropland Expansion in the Twenty-First Century. Nat. Food 2022, 3, 19–28. [Google Scholar] [CrossRef]
  13. Hu, Q.; Xiang, M.; Chen, D.; Zhou, J.; Wu, W.; Song, Q. Global Cropland Intensification Surpassed Expansion Between 2000 and 2010: A Spatio-Temporal Analysis Based on GlobeLand30. Sci. Total Environ. 2020, 746, 141035. [Google Scholar] [CrossRef] [PubMed]
  14. Yu, Q.; Hu, Q.; van Vliet, J.; Verburg, P.H.; Wu, W. GlobeLand30 Shows Little Cropland Area Loss but Greater Fragmentation in China. Int. J. Appl. Earth Obs. Geoinf. 2018, 66, 37–45. [Google Scholar] [CrossRef]
  15. Raab, C.; Spies, M. Characterising Cropland Fragmentation in Post-Soviet Central Asia, Using Landsat Remote-Sensing Time Series Data. Appl. Geogr. 2023, 156, 102968. [Google Scholar] [CrossRef]
  16. Zaveri, E.; Russ, J.; Damania, R. Rainfall Anomalies are a Significant Driver of Cropland Expansion. Proc. Natl. Acad. Sci. USA 2020, 117, 10225–10233. [Google Scholar] [CrossRef] [PubMed]
  17. Ojha, R.B.; Atreya, K.; Kristiansen, P.; Devkota, D.; Wilson, B. A Systematic Review and Gap Analysis of Drivers, Impacts, and Restoration Options for Abandoned Croplands in Nepal. Land Use Policy 2022, 120, 106237. [Google Scholar] [CrossRef]
  18. Song, W.; Zhang, H.; Zhao, R.; Wu, K.; Li, X.; Niu, B.; Li, J. Study on Cultivated Land Quality Evaluation from the Perspective of Farmland Ecosystems. Ecol. Indic. 2022, 139, 108959. [Google Scholar] [CrossRef]
  19. Ye, S.; Song, C.; Gao, P.; Liu, C.; Cheng, C. Visualizing Clustering Characteristics of Multidimensional Arable Land Quality Indexes at the County Level in Mainland China. Environ. Plan. A Econ. Space 2022, 54, 222–225. [Google Scholar] [CrossRef]
  20. Li, Y.; Chang, C.; Wang, Z.; Li, T.; Li, J.; Zhao, G. Identification of Cultivated Land Quality Grade Using Fused Multi-Source Data and Multi-Temporal Crop Remote Sensing Information. Remote Sens. 2022, 14, 2109. [Google Scholar] [CrossRef]
  21. Dong, J.; Yun, W.; Wu, K.; Li, S.; Liu, B.; Lu, Q. Spatio-Temporal Analysis of Cultivated Land from 2010 to 2020 in Long’an County, Karst Region, China. Land 2023, 12, 515. [Google Scholar] [CrossRef]
  22. Yan, R.; Li, L.; Gao, J.; Huang, J. Exploring the Influence of Seasonal Cropland Abandonment on Evapotranspiration and Water Resources in the Humid Lowland Region, Southern China. Water Resour. Res. 2022, 58, e2021WR031888. [Google Scholar] [CrossRef]
  23. Gumma, M.K.; Thenkabail, P.S.; Panjala, P.; Teluguntla, P.; Yamano, T.; Mohammed, I. Multiple Agricultural Cropland Products of South Asia Developed Using Landsat-8 30 m and MODIS 250 m Data Using Machine Learning on the Google Earth Engine (GEE) Cloud and Spectral Matching Techniques (SMTs) in Support of Food and Water Security. GIScience Remote Sens. 2022, 59, 1048–1077. [Google Scholar] [CrossRef]
  24. Qiu, B.; Lin, D.; Chen, C.; Yang, P.; Tang, Z.; Jin, Z.; Ye, Z.; Zhu, X.; Duan, M.; Huang, H.; et al. From Cropland to Cropped Field: A Robust Algorithm for National-Scale Mapping by Fusing Time Series of Sentinel-1 and Sentinel-2. Int. J. Appl. Earth Obs. Geoinf. 2022, 113, 103006. [Google Scholar] [CrossRef]
  25. Hong, C.; Prishchepov, A.V.; Jin, X.; Han, B.; Lin, J.; Liu, J.; Ren, J.; Zhou, Y. The Role of Harmonized Landsat Sentinel-2 (HLS) Products to Reveal Multiple Trajectories and Determinants of Cropland Abandonment in Subtropical Mountainous Areas. J. Environ. Manag. 2023, 336, 117621. [Google Scholar] [CrossRef] [PubMed]
  26. Pancorbo, J.L.; Quemada, M.; Roberts, D.A. Drought Impact on Cropland Use Monitored with AVIRIS Imagery in Central Valley, California. Sci. Total Environ. 2023, 859, 160198. [Google Scholar] [CrossRef]
  27. Wang, X.; Li, S.; Wang, L.; Zheng, M.; Wang, Z.; Song, K. Effects of Cropland Reclamation on Soil Organic Carbon in China’s Black Soil Region over the Past 35 Years. Glob. Chang. Biol. 2023, 29, 5460–5477. [Google Scholar] [CrossRef]
  28. Duan, D.; Sun, X.; Liang, S.; Sun, J.; Fan, L.; Chen, H.; Xia, L.; Zhao, F.; Yang, W.; Yang, P. Spatiotemporal Patterns of Cultivated Land Quality Integrated with Multi-Source Remote Sensing: A Case Study of Guangzhou, China. Remote Sens. 2022, 14, 1250. [Google Scholar] [CrossRef]
  29. Li, H.; Yao, Y.; Zhang, X.; Zhu, H.; Wei, X. Changes in Soil Physical and Hydraulic Properties Following the Conversion of Forest to Cropland in the Black Soil Region of Northeast China. CATENA 2021, 198, 104986. [Google Scholar] [CrossRef]
  30. Ha, T.T.V.; Fan, H.; Shuang, L. Climate Change Impact Assessment on Northeast China’s Grain Production. Environ. Sci. Pollut. Res. 2021, 28, 14508–14520. [Google Scholar] [CrossRef] [PubMed]
  31. Li, X.; Shi, Z.; Xing, Z.; Wang, M.; Wang, M. Dynamic Evaluation of Cropland Degradation Risk by Combining Multi-Temporal Remote Sensing and Geographical Data in the Black Soil Region of Jilin Province, China. Appl. Geogr. 2023, 154, 102920. [Google Scholar] [CrossRef]
  32. Liu, J.; Liu, M.; Tian, H.; Zhuang, D.; Zhang, Z.; Zhang, W.; Tang, X.; Deng, X. Spatial and Temporal Patterns of China’s Cropland During 1990–2000: An Analysis Based on Landsat TM Data. Remote Sens. Environ. 2005, 98, 442–456. [Google Scholar] [CrossRef]
  33. Masek, J.G.; Vermote, E.F.; Saleous, N.E.; Wolfe, R.; Hall, F.G.; Huemmrich, K.F.; Gao, F.; Kutler, J.; Lim, T.-K. A Landsat Surface Reflectance Dataset for North America, 1990–2000. IEEE Geosci. Remote Sens. Lett. 2006, 3, 68–72. [Google Scholar] [CrossRef]
  34. Vermote, E.; Justice, C.; Claverie, M.; Franch, B. Preliminary Analysis of the Performance of the Landsat 8/OLI Land Surface Reflectance Product. Remote Sens. Environ. 2016, 185, 46–56. [Google Scholar] [CrossRef] [PubMed]
  35. Foga, S.; Scaramuzza, P.L.; Guo, S.; Zhu, Z.; Dilley, R.D.; Beckmann, T.; Schmidt, G.L.; Dwyer, J.L.; Joseph Hughes, M.; Laue, B. Cloud Detection Algorithm Comparison and Validation for Operational Landsat Data Products. Remote Sens. Environ. 2017, 194, 379–390. [Google Scholar] [CrossRef]
  36. Roy, D.P.; Kovalskyy, V.; Zhang, H.K.; Vermote, E.F.; Yan, L.; Kumar, S.S.; Egorov, A. Characterization of Landsat-7 to Landsat-8 Reflective Wavelength and Normalized Difference Vegetation Index Continuity. Remote Sens. Environ. 2016, 185, 57–70. [Google Scholar] [CrossRef]
  37. He, C.; Liu, Z.; Xu, M.; Ma, Q.; Dou, Y. Urban Expansion Brought Stress to Food Security in China: Evidence from Decreased Cropland Net Primary Productivity. Sci. Total Environ. 2017, 576, 660–670. [Google Scholar] [CrossRef]
  38. Turner, D.P.; Ritts, W.D.; Cohen, W.B.; Gower, S.T.; Running, S.W.; Zhao, M.; Costa, M.H.; Kirschbaum, A.A.; Ham, J.M.; Saleska, S.R.; et al. Evaluation of MODIS NPP and GPP Products across Multiple Biomes. Remote Sens. Environ. 2006, 102, 282–292. [Google Scholar] [CrossRef]
  39. Farr, T.G.; Rosen, P.A.; Caro, E.; Crippen, R.; Duren, R.; Hensley, S.; Kobrick, M.; Paller, M.; Rodriguez, E.; Roth, L.; et al. The Shuttle Radar Topography Mission. Rev. Geophys. 2007, 45, RG2004. [Google Scholar] [CrossRef]
  40. Fischer, G.; Velthuizen, H.; Shah, M.; Nachtergaele, F. Global Agro-Ecological Assessment for Agriculture in the 21st Century: Methodology and Results; IIASA: Laxenburg, Austria; FAO: Laxenburg, Austria, 2002; pp. 1–119. [Google Scholar]
  41. Vargas-Munoz, J.E.; Srivastava, S.; Tuia, D.; Falcão, A.X. OpenStreetMap: Challenges and Opportunities in Machine Learning and Remote Sensing. IEEE Geosci. Remote Sens. Mag. 2021, 9, 184–199. [Google Scholar] [CrossRef]
  42. Fick, S.E.; Hijmans, R.J. WorldClim 2: New 1-km Spatial Resolution Climate Surfaces for Global Land Areas. Int. J. Climatol. 2017, 37, 4302–4315. [Google Scholar] [CrossRef]
  43. Wang, B.; Shi, W.; Miao, Z. Confidence Analysis of Standard Deviational Ellipse and Its Extension into Higher Dimensional Euclidean Space. PLoS ONE 2015, 10, e0118537. [Google Scholar] [CrossRef]
  44. Getis, A.; Ord, J.K. The Analysis of Spatial Association by Use of Distance Statistics. Geogr. Anal. 1992, 24, 189–206. [Google Scholar] [CrossRef]
  45. McGarigal, K. FRAGSTATS: Spatial Pattern Analysis Program for Quantifying Landscape Structure; US Department of Agriculture, Forest Service, Pacific Northwest Research Station: Washington, DC, USA, 1995; Volume 351. [Google Scholar]
  46. Tang, H.; Niu, J.; Niu, Z.; Liu, Q.; Huang, Y.; Yun, W.; Shen, C.; Huo, Z. System Cognition and Analytic Technology of Cultivated Land Quality from a Data Perspective. Land 2023, 12, 237. [Google Scholar] [CrossRef]
  47. Yao, M.; Shao, D.; Lv, C.; An, R.; Gu, W.; Zhou, C. Evaluation of Arable Land Suitability Based on the Suitability Function—A Case Study of the Qinghai-Tibet Plateau. Sci. Total Environ. 2021, 787, 147414. [Google Scholar] [CrossRef]
  48. Yu, L.; Liu, Y.; Liu, T.; Yu, E.; Bu, K.; Jia, Q.; Shen, L.; Zheng, X.; Zhang, S. Coupling Localized Noah-MP-Crop Model with the WRF Model Improved Dynamic Crop Growth Simulation across Northeast China. Comput. Electron. Agric. 2022, 201, 107323. [Google Scholar] [CrossRef]
  49. Lai, Z.; Di, C.; Li, S.; Dan, L. Optimizing Land Use Systems of an Agricultural Watershed in China to Meet Ecological and Economic Requirements for Future Sustainability. Glob. Ecol. Conserv. 2022, 33, e01975. [Google Scholar] [CrossRef]
  50. Yang, S.; Bai, Y.; Alatalo, J.M.; Wang, H.; Tong, J.; Liu, G.; Zhang, F.; Chen, J. Spatial–Temporal Pattern of Cultivated Land Productivity Based on Net Primary Productivity and Analysis of Influencing Factors in the Songhua River basin. Land Degrad. Dev. 2022, 33, 1917–1932. [Google Scholar] [CrossRef]
  51. Talukdar, S.; Naikoo, M.W.; Mallick, J.; Praveen, B.; Shahfahad; Sharma, P.; Islam, A.R.M.T.; Pal, S.; Rahman, A. Coupling Geographic Information System Integrated Fuzzy Logic-Analytical Hierarchy Process with Global and Machine Learning based Sensitivity Analysis for Agricultural Suitability Mapping. Agric. Syst. 2022, 196, 103343. [Google Scholar] [CrossRef]
  52. Crocker, E.; Gurung, K.; Calvert, J.; Nelson, C.D.; Yang, J. Integrating GIS, Remote Sensing, and Citizen Science to Map Oak Decline Risk across the Daniel Boone National Forest. Remote Sens. 2023, 15, 2250. [Google Scholar] [CrossRef]
  53. Chen, Y.; Zhu, M.; Lu, J.; Zhou, Q.; Ma, W. Evaluation of Ecological City and Analysis of Obstacle Factors under the Background of High-Quality Development: Taking Cities in the Yellow River Basin as Examples. Ecol. Indic. 2020, 118, 106771. [Google Scholar] [CrossRef]
  54. Liu, H.; Gong, P.; Wang, J.; Wang, X.; Ning, G.; Xu, B. Production of Global Daily Seamless Data Cubes and Quantification of Global Land Cover Change from 1985 to 2020—iMap World 1.0. Remote Sens. Environ. 2021, 258, 112364. [Google Scholar] [CrossRef]
  55. Wang, Y.; Liu, H.; Sang, L.; Wang, J. Characterizing Forest Cover and Landscape Pattern Using Multi-Source Remote Sensing Data with Ensemble Learning. Remote Sens. 2022, 14, 5470. [Google Scholar] [CrossRef]
  56. Zhao, Z.; Wang, J.; Wang, L.; Rao, X.; Ran, W.; Xu, C. Monitoring and Analysis of Abandoned Cropland in the Karst Plateau of Eastern Yunnan, China Based on Landsat Time Series Images. Ecol. Indic. 2023, 146, 109828. [Google Scholar] [CrossRef]
  57. Liu, H.; Gong, P.; Wang, J.; Clinton, N.; Bai, Y.; Liang, S. Annual Dynamics of Global Land Cover and its Long-Term Changes from 1982 to 2015. Earth Syst. Sci. Data 2020, 12, 1217–1243. [Google Scholar] [CrossRef]
  58. Zhang, M.; Wu, B.; Zeng, H.; He, G.; Liu, C.; Tao, S.; Zhang, Q.; Nabil, M.; Tian, F.; Bofana, J. GCI30: A Global Dataset of 30 m Cropping Intensity Using Multisource Remote Sensing Imagery. Earth Syst. Sci. Data 2021, 13, 4799–4817. [Google Scholar] [CrossRef]
  59. Löw, F.; Biradar, C.; Dubovyk, O.; Fliemann, E.; Akramkhanov, A.; Narvaez Vallejo, A.; Waldner, F. Regional-Scale Monitoring of Cropland Intensity and Productivity with Multi-Source Satellite Image Time Series. GISci. Remote Sens. 2018, 55, 539–567. [Google Scholar] [CrossRef]
  60. Wang, L.; Zhang, S.; Xiong, Q.; Liu, Y.; Liu, Y.; Liu, Y. Spatiotemporal Dynamics of Cropland Expansion and Its Driving Factors in the Yangtze River Economic Belt: A Nuanced Analysis at the County Scale. Land Use Policy 2022, 119, 106168. [Google Scholar] [CrossRef]
  61. Zhang, X.; Brandt, M.; Tong, X.; Ciais, P.; Yue, Y.; Xiao, X.; Zhang, W.; Wang, K.; Fensholt, R. A Large but Transient Carbon Sink from Urbanization and Rural Depopulation in China. Nat. Sustain. 2022, 5, 321–328. [Google Scholar] [CrossRef]
  62. Wang, H.; Zhang, C.; Yao, X.; Yun, W.; Ma, J.; Gao, L.; Li, P. Scenario Simulation of the Tradeoff between Ecological Land and Farmland in Black Soil Region of Northeast China. Land Use Policy 2022, 114, 105991. [Google Scholar] [CrossRef]
  63. Wang, S.; Xu, X.; Huang, L. Spatial and Temporal Variability of Soil Erosion in Northeast China from 2000 to 2020. Remote Sens. 2023, 15, 225. [Google Scholar] [CrossRef]
  64. Liu, C.; Song, C.; Ye, S.; Cheng, F.; Zhang, L.; Li, C. Estimate Provincial-Level Effectiveness of the Arable Land Requisition-Compensation Balance Policy in Mainland China in the Last 20 Years. Land Use Policy 2023, 131, 106733. [Google Scholar] [CrossRef]
  65. Keshavarz Afshar, R.; Dekamin, M. Sustainability Assessment of Corn Production in Conventional and Conservation Tillage Systems. J. Clean. Prod. 2022, 351, 131508. [Google Scholar] [CrossRef]
  66. Gong, P.; Liu, H.; Zhang, M.; Li, C.; Wang, J.; Huang, H.; Clinton, N.; Ji, L.; Li, W.; Bai, Y.; et al. Stable Classification with Limited Sample: Transferring a 30-m resolution Sample Set Collected in 2015 to Mapping 10-m Resolution Global Land Cover in 2017. Sci. Bull. 2019, 64, 370–373. [Google Scholar] [CrossRef] [PubMed]
  67. Sun, W.; Ding, X.; Su, J.; Mu, X.; Zhang, Y.; Gao, P.; Zhao, G. Land Use and Cover Changes on the Loess Plateau: A Comparison of Six Global or National Land Use and Cover Datasets. Land Use Policy 2022, 119, 106165. [Google Scholar] [CrossRef]
  68. Brown, C.F.; Brumby, S.P.; Guzder-Williams, B.; Birch, T.; Hyde, S.B.; Mazzariello, J.; Czerwinski, W.; Pasquarella, V.J.; Haertel, R.; Ilyushchenko, S.; et al. Dynamic World, Near Real-Time Global 10 m Land Use Land Cover Mapping. Sci. Data 2022, 9, 251. [Google Scholar] [CrossRef]
  69. Sinclair, S.J.; Griffioen, P.; Duncan, D.H.; Millett-Riley, J.E.; White, M.D. Quantifying Ecosystem Quality by Modeling Multi-attribute Expert Opinion. Ecol. Appl. 2015, 25, 1463–1477. [Google Scholar] [CrossRef]
  70. Roche, P.K.; Campagne, C.S. Are Expert-based Ecosystem Services Scores Related to Biophysical Quantitative Estimates? Ecol. Indic. 2019, 106, 105421. [Google Scholar] [CrossRef]
  71. Schillerberg, T.; Tian, D. Changes in Crop Failures and Their Predictions with Agroclimatic Conditions: Analysis Based on Earth Observations and Machine Learning over Global Croplands. Agric. For. Meteorol. 2023, 340, 109620. [Google Scholar] [CrossRef]
  72. Tariq, A.; Yan, J.; Gagnon, A.S.; Riaz Khan, M.; Mumtaz, F. Mapping of Cropland, Cropping Patterns and Crop Types by Combining Optical Remote Sensing Images with Decision Tree Classifier and Random Forest. Geo-Spat. Inf. Sci. 2022, 1–19. [Google Scholar] [CrossRef]
  73. Odebiri, O.; Mutanga, O.; Odindi, J.; Naicker, R. Modelling Soil Organic Carbon Stock Distribution across Different Land-Uses in South Africa: A Remote Sensing and Deep Learning Aspproach. ISPRS J. Photogramm. Remote Sens. 2022, 188, 351–362. [Google Scholar] [CrossRef]
  74. Zhang, Y.; Zang, S.; Sun, L.; Yan, B.; Yang, T.; Yan, W.; Meadows, M.E.; Wang, C.; Qi, J. Characterizing the Changing Environment of Cropland in the Songnen Plain, Northeast China, from 1990 to 2015. J. Geogr. Sci. 2019, 29, 658–674. [Google Scholar] [CrossRef]
  75. Yang, J.; Huang, X. The 30m Annual Land Cover Dataset and Its Dynamics in China from 1990 to 2019. Earth Syst. Sci. Data 2021, 13, 3907–3925. [Google Scholar] [CrossRef]
Figure 1. The geographical location of the study area in the black soil region in Northeast China. The elevation in the study area is shown in the background. I to VI refer to zones by soil type.
Land 12 01764 g001
Figure 2. The locations of collected land cover samples and measured cropland quality points. I to VI refer to zones by soil type.
Land 12 01764 g002
Figure 3. Comparison between the evaluated and measured cropland quality grades. The difference (evaluated grade minus measured grade) is depicted. I to VI refer to zones by soil type.
Land 12 01764 g003
Figure 4. The area of each land cover class in 2010, 2015, and 2018.
Land 12 01764 g004
Figure 5. Conversion between cropland and other land cover classes between (a) 2010 and 2015 and (b) 2015 and 2018.
Land 12 01764 g005
Figure 6. The spatial pattern and estimated standard deviation ellipses of cropland. I to VI refer to zones by soil type.
Land 12 01764 g006
Figure 7. The spatial hot spots indicating cropland changes. Clusters where cropland was gained between (a) 2010 and 2015 and (b) 2015 and 2018. Clusters where cropland was lost between (c) 2010 and 2015 and (d) 2015 and 2018. I to VI refer to zones by soil type.
Land 12 01764 g007
Figure 8. Changes in the mean cropland quality index by soil type zone between 2010 and 2018.
Land 12 01764 g008
Figure 9. The spatial pattern of cropland quality grades in (a) 2010, (b) 2015, and (c) 2018. I to VI refer to zones by soil type.
Land 12 01764 g009
Figure 10. The spatial characteristics of quality changes in unchanged cropland area between 2010 and 2018. I to VI refer to zones by soil type.
Land 12 01764 g010
Figure 11. The spatial characteristics of quality changes in changed cropland areas including (a) lost cropland area and (b) gained cropland area between 2010 and 2018. I to VI refer to zones by soil type.
Land 12 01764 g011
Figure 12. The obstacle degree for each evaluation indicator of cropland quality by soil type zone in 2010, 2015, and 2018. I to VI refer to zones by soil type.
Land 12 01764 g012
Table 1. List of data used in this study.
CategoryData SourceSpatial ResolutionTime
Land coverCNLUCC dataset30 m2010, 2015, 2018
NDVILandsat Level-2 surface reflectance data30 m2009–2011, 2014–2016, 2017–2019
NPPMODIS MOD17A3 product500 m2009–2011, 2014–2016, 2017–2019
TopographySRTM DEM data30 m2000
SoilHWSD~1 km2009
RoadOSM data-2010, 2015, 2018
ClimateWorldClim data~1 km1970–2000
Table 2. The land cover classification system used in the CNLUCC dataset.
Land Cover ClassDescriptions
CroplandCultivated lands for crops, including paddy cropland and dry cropland.
Paddy cropland refers to cropland that has enough water supply and irrigation facilities for planting paddy rice, lotus, etc.
Dry cropland refers to cropland for cultivation without water supply and irrigating facilities.
ForestLands growing trees including arbor, shrub, bamboo, and forestry use.
GrasslandLands covered by herbaceous plants with coverage greater than 5%.
Water bodyLands covered by natural water bodies or lands with facilities for irrigation and water reservation.
Built-up landLands used for urban and rural settlements, factories, and transportation facilities.
Unused landLands that are not put into practical use or are difficult to use.
Table 3. The indicator system for cropland quality evaluation.
TargetCategoryIndicatorData SourceImpactRangeScoreWeight
Cropland qualityNatural conditionsTerrain slopeSRTM DEM data>6°10.1179
2–6°2
≤2°3
Surface soil textureHWSD+Coarse10.0778
Medium2
Fine3
Soil fertilitySoil fertilityLandsat NDVI data+<0.410.1523
0.4–0.72
≥0.73
Variation in soil fertility>10%10.0815
5–10%2
≤5%3
Construction levelDistance to roadsOSM road data>2 km10.1201
1–2 km2
≤1 km3
Patch contiguityCNLUCC dataset+<0.810.1102
0.8–0.92
≥0.93
Cropland productivityProduction capacityMODIS NPP product+<0.2 kgC/m210.1966
0.2–0.4 kgC/m22
≥0.45 kgC/m23
Variation in production capacity>10%10.1436
5–10%2
≤5%3
Table 4. The validated accuracies of the land cover dataset used in this study.
ClassCroplandForestGrasslandWater
Body
Built-Up
Land
Unused
Land
Producer’s
Accuracy
User’s
Accuracy
F1
Cropland3157964391.57%92.92%92.24%
Forest103071200193.03%91.64%92.33%
Grassland51315751385.33%82.63%83.96%
Water Body4781522386.36%92.68%89.41%
Built-up Land3120128294.12%93.43%93.77%
Unused Land202123583.33%74.47%78.65%
Overall accuracy = 90.26%Kappa = 87.64%Weighted F1 = 90.30%
Table 5. The area of cropland and its changes between 2010 and 2018 by soil type zone *.
ZonePaddy Cropland (2010)Dry Cropland (2010)Cropland (2010)Paddy Cropland Change (2010–2018)Dry Cropland Change (2010–2018)Cropland Loss (2010–2018)Cropland Gain (2010–2018)Cropland Change (2010–2018)Cropland Change (2015–2018)
I326,217.692,759,792.943,086,010.63118,756.44305,368.11606,181.231,030,305.78424,124.55391,598.19
II604,632.513,385,603.533,990,236.04−77,050.17−201,181.68810,652.95532,421.10−278,231.85−264,509.55
III2,676,925.353,123,137.705,800,063.051,253,796.66−627,835.59413,493.751,039,454.82625,961.07484,150.23
IV1,287,505.4410,762,635.4212,050,140.86419,429.7972,537.03944,268.751,436,235.57491,966.82438,488.64
V306,008.736,292,526.136,598,534.8698,507.34137,526.031,465,326.091,701,359.46236,033.37182,932.92
VI1,287,066.785,842,090.267,129,157.04−126,159.6679,571.521,439,163.091,392,574.95−46,588.14−16,621.83
Total6,488,356.5032,165,785.9838,654,142.481,687,280.40−234,014.585,679,085.867,132,351.681,453,265.821,216,038.60
* Unit of area: ha.
Table 6. The fragmentation and environmental characteristics of cropland between 2010 and 2018.
YearAREA (ha)SHAPECONTIGMAP (mm)MAT (°C)Elevation (m)
2010602.411.820.50544.774.14239.56
2015590.251.800.50544.514.13239.06
2018649.641.920.54542.323.98241.16
Table 7. The evaluation results of cropland quality grades during 2010–2018.
YearLowMediumHigh
Area (ha)Proportion (%)Area (ha)Proportion (%)Area (ha)Proportion (%)
201018,254,947.0549.0715,666,770.8841.853,279,648.248.48
201513,490,353.8936.2618,053,694.6348.225,894,544.8715.25
201815,587,355.5141.9017,603,990.1047.025,462,981.0114.13
Table 8. Changes in the quality grades of unchanged cropland area between 2010 and 2018.
Period−2 Grades−1 GradeUnchanged+1 Grade+2 Grades
Area
(ha)
Proportion (%)Area
(ha)
Proportion (%)Area
(ha)
Proportion (%)Area
(ha)
Proportion (%)Area
(ha)
Proportion (%)
2010–2015198,122.940.534,576,222.1712.3420,902,960.4456.3610,467,263.9728.22942,131.702.54
2015–2018554,137.471.747,056,694.8922.1518,281,586.6957.385,653,715.5817.75312,842.160.98
2010–2018309,822.930.984,983,025.2315.8116,930,763.8353.718,484,503.6726.92812,599.022.58
Table 9. The quality grades of changed cropland area (including cropland gain and loss) between 2010 and 2018.
PeriodCropland LossCropland Gain
LowMediumHighLowMediumHigh
Area
(ha)
Proportion (%)Area (ha)Proportion (%)Area
(ha)
Proportion (%)Area
(ha)
Proportion (%)Area
(ha)
Proportion (%)Area
(ha)
Proportion (%)
2010–201568,915.8814.7739,575.438.486173.641.32131,440.4128.17151,323.1232.4369,128.6414.82
2015–20182,585,881.3520.902,155,361.1317.42838,374.126.773,325,720.5926.872,534,411.4320.48935,217.817.56
2010–20183,310,584.9325.841,880,110.2614.67489,957.303.823,462,615.0927.022,685,116.7020.95985,881.157.69
Disclaimer/Publisher’s Note: The statements, opinions and data contained in all publications are solely those of the individual author(s) and contributor(s) and not of MDPI and/or the editor(s). MDPI and/or the editor(s) disclaim responsibility for any injury to people or property resulting from any ideas, methods, instructions or products referred to in the content.

