Article

Input Flux and the Risk of Heavy Metal(Loid) of Agricultural Soil in China: Based on Spatiotemporal Heterogeneity from 2000 to 2021

1
School of Surveying and Land Information Engineering, Henan Polytechnic University, Jiaozuo 454000, China
2
Research Center of Information Technology, Beijing Academy of Agriculture and Forestry Sciences, Beijing 100097, China
3
Technical Center for Soil, Agriculture and Rural Ecology and Environment, Ministry of Ecology and Environment, Beijing 100012, China
4
Institute of Quality Standard and Testing Technology, Beijing Academy of Agriculture and Forestry Sciences, Beijing 100097, China
*
Authors to whom correspondence should be addressed.
Land 2023, 12(6), 1240; https://doi.org/10.3390/land12061240
Submission received: 23 April 2023 / Revised: 12 June 2023 / Accepted: 14 June 2023 / Published: 16 June 2023

Abstract

:
Identifying the current status of the heavy metal(loid) input of agricultural soils is vital for the soil ecological environment of agricultural-producing areas. Most previous studies have typically carried been out in small regions with limited sampling sites, which is insufficient to reveal the overall status of China. This study reviewed publications from over the past 20 years and calculated the input fluxes of heavy metal(loid)s in agricultural soil via atmospheric deposition, fertilizer, manure, and irrigation in different regions of China based on spatiotemporal heterogeneity using a meta-analysis, providing more accurate and reliable results. It was found that the heavy metal(loid) input flux of atmospheric deposition in China is large, while that of fertilizer and manure is relatively low compared to Europe. The major sources of As, Cd, Cr, Ni, and Pb entering the soil was atmospheric deposition, which accounted for 12% to 92% of the total input. Manure was responsible for 19% to 75% of the Cu and Zn input. Cd is the element presenting the most significant risk to the environment of agricultural soils in China and its safety limit will be reached within 100 years for most regions. The region we need to be concerned about is Huang-Huai-Hai due to its comprehensive pollution.

1. Introduction

With the acceleration of industrialization and urbanization, heavy metal(loid) pollution in agricultural soils has become one of the major environmental challenges for many countries [1,2]. Heavy metal(loid) accumulation in soil might affect crop yield, quality, and ultimately, human health [3,4,5,6,7]. According to the US Geological Survey (USGS), China’s cadmium production is 8000–9000 tons/yr, accounting for about 1/3 of the world’s production, and nine times that of the European Union [8]. The Report on the national soil pollution survey [9] points out that 19.4% of arable land in China is polluted, and heavy metal(loid)s, including arsenic (As), cadmium (Cd), chromium (Cr), copper (Cu), mercury (Hg), lead (Pb), nickel (Ni), and zinc (Zn), are considered to be the main pollutants [10,11]. Which way heavy metal(loid)s enter farmland is a topic worthy of attention.
The factors that affect the accumulation of heavy metal(loid)s in soil are not only caused by the geochemical properties of the elements themselves and the physicochemical properties of the soil, but are also more closely related to the sources of the elements [12,13,14]. Numerous previous studies have shown that, in farmland ecosystems, the variation of heavy metal(loid)s in soil is mainly caused by various anthropogenic activities, including atmospheric deposition (AD), chemical fertilizer (Fert), livestock manure (Man), and irrigation (Irrig) [15,16,17,18]. The accumulation of heavy metal(loid)s in soil is a slow process and will not change significantly in the short term, while multiple soil surveys are costly and insufficient for showing this variation [19] and accurate knowledge on the input of heavy metal in soil is therefore an important aspect of soil management. The UKCEH Countryside Survey collected samples of atmospheric deposition based on a comprehensive survey of the soil environment, proving the importance of studying the input of the accumulation of heavy metal(loid)s in soil [20]. Accordingly, studying the accumulation trend of heavy metal(loid)s in soil from the perspective of external inputs is a feasible method. The sources which contribute the most are different globally. Manure, mineral fertilizer, and pesticide are the predominant sources in France [21], while in China, atmospheric deposition is generally considered to be the main source of heavy metal(loid)s in soil [22]. An accurate assessment of the proportion and risk of various pollution sources plays a crucial role in the precise management and policy making of heavy metal(loid) pollution in regional farmland.
Clarifying the sources of heavy metal(loid) pollutants is essential for preventing and controlling soil heavy metal(loid) pollution. The Report on the national soil pollution survey found the pollution area and distribution of agricultural land across China [9]. This was confirmed by a subsequent detailed investigation of agricultural soil pollution. However, the process and flux of heavy metal(loid) pollution are still unclear due to the migration and transformation processes of heavy metal(loid) in a multi-media environment of atmosphere–soil–water being particularly complex. Receptor models are widely used in the source apportionment of soil heavy metal(loid)s, enabling qualitative identifications of potential pollution sources and quantitative estimations of their contributions. However, these cannot identify the nonpoint pollution source, such as the agricultural input. Currently, monitoring networks for heavy metal(loid) input fluxes in large areas of the soil environment have rarely been established; thus, many studies have preferred to make an inventory to accurately quantify these heavy metal(loid) input fluxes and the contribution of various pollution sources [23,24,25,26]. In China, many studies on soil heavy metal(loid) flux in agricultural soil were developed through regional field investigations, which have covered several areas, including the North China Plain [27], Yangtze River Delta [1,28,29], and Chang-Zhu-Tan urban agglomeration (CZT) [18,30]. Most studies were typically carried out in small regions with limited sampling sites because of the limited capacity for a wide range of sampling and analyses. At the same time, there have also been some review articles to calculate the input flux of China’s agricultural soil, but all of them used the arithmetic mean value to represent the flux and ignored the influence caused by the difference in the survey or sampling methods, which may lead to Simpson’s paradox. Furthermore, sources of pollution usually change over time. For instance, sewage irrigation is no longer the main way in which heavy metal(loid)s enter the soil, since this trend has decreased in China [31]. Therefore, these studies are insufficient for revealing the overall status and spatiotemporal variation characteristics of heavy metal(loid) flux in China’s agricultural soil. It is necessary to carry out new research and update the inventory periodically to improve the robustness of the data and the reliability of the results.
In this study, publications during 2000–2021 were collected and screened. On the basis of detecting the spatiotemporal heterogeneity of regional input flux, a meta-analysis was presented to calculate the weighted input flux, so as to obtain a more accurate average flux and more objective trend of soil environmental quality. The scientific assessment of the soil environmental risk of the agricultural-producing areas provides a reference for regional heavy metal(loid) pollution control.

2. Materials and Methods

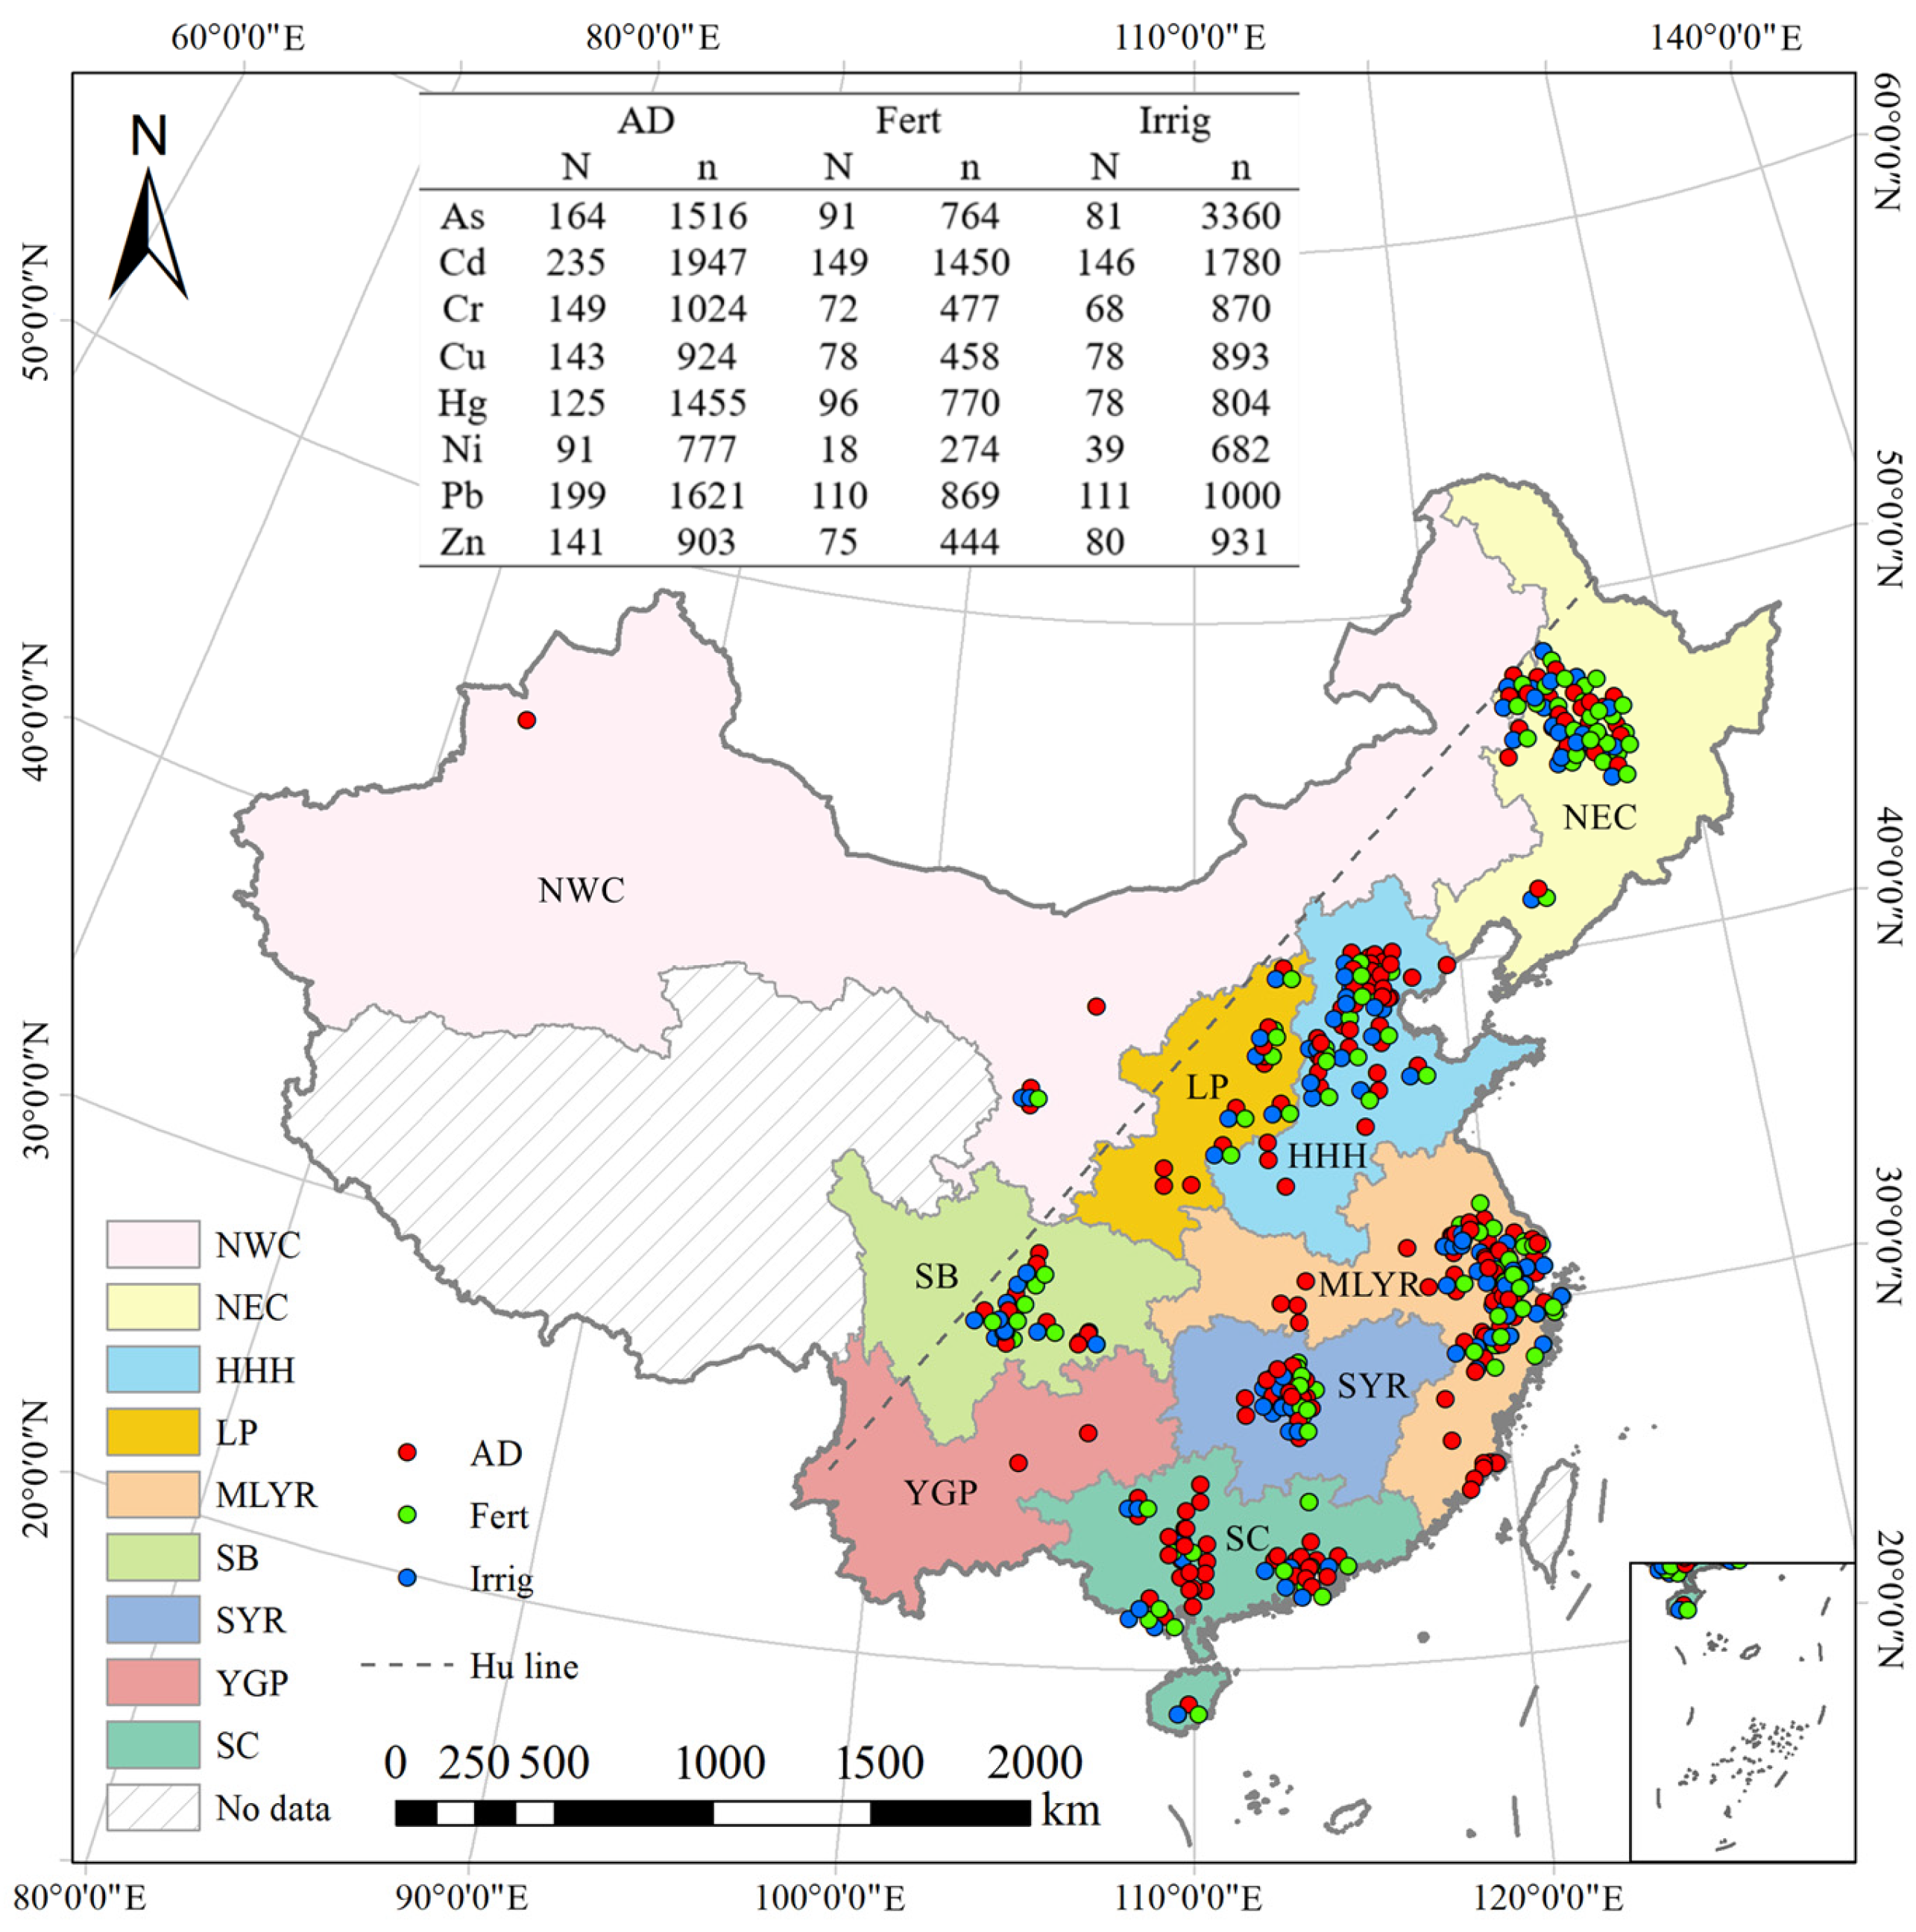
2.1. Creating the Heavy Metal Input Flux Database

The relevant publications were collected from the Web of Science (WOS) and China National Knowledge Infrastructure (CNKI). In addition, we checked the references of each publication for more available data. Due to the reliability of the data in the literature having a strong impact on the results of the meta-analysis, the data should be well evaluated and filtered to control their quality. Finally, a total of 109 publications during 2000–2021 on eight heavy metal(loid) (As, Cd, Cr, Cu, Hg, Ni, Pb, and Zn) fluxes were selected, according to the following criteria: (1) the study area did not include the farmland around industrial and mining areas; (2) the atmospheric deposition samples that were collected included both dry and wet deposition; (3) the monitoring period of the atmospheric deposition was more than one year; (4) the staple types of crops grown in the study area were rice, wheat, and maize; (5) the fertilizers used on the farmland in the study area consisted only of chemical fertilizers; and (6) the data on the heavy metal(loid) fluxes could be obtained directly or indirectly with calculations from the study. The search terms and list of 109 publications can be found in the Supplementary Materials.
As researchers usually pay more attention to crucial polluted areas, this may overestimate the heavy metal(loid) input flux. After tests, the data on heavy metal(loid) fluxes present right-skewed distributions, indicating extreme values at the right end of the data. This is because researchers usually pay more attention to crucial polluted areas, resulting in publication bias. Thus, we used Inter Quartile Range (IQR) to remove outliers. The IQR is the difference between the dataset’s 25th percentile (Q1) and 75th percentile (Q3). The method for declaring an observation to be an outlier is: the value is 1.5 times greater than the IQR or 1.5 times less than the IQR. Finally, the data without outliers were used for the analysis.
The study areas in the collected publications covered all the major grain-producing areas of China. Most of the sampling sites were distributed in the southeast of China, where the economy is developed and industrial activities are frequent (Figure 1) [32,33]. There were 271, 156, and 167 sampling sites for studying soil heavy metal(loid) input via atmospheric deposition, fertilizer, and irrigation, respectively (See Table S1 for more details), while few studies on heavy metal(loid) input flux via manure. Compared to the previous studies (Table S2), the sample size in this study was larger and the sampling time was more recent, which is sufficient to meet the statistical requirements. Consequently, it is more comprehensive and convincing to describe the current status of heavy metal(loid) input fluxes in China’s agricultural soil.
The data from the literature were extracted to establish the following database: (1) the first author, title, and publishing year; (2) the geographical location (longitude and latitude) and administrative region of the study area; (3) the number of sampling sites, size of the study area (if this was not given, the area of the administrative region was taken as the study area), and sampling date (if this was not given, the date of the publication minus 2 years was taken as the sampling date); and (4) data on heavy metal(loid) input fluxes.

2.2. Weighted Average Calculation

This study calculated the mean value based on the idea of a meta-analysis and combined the results of multiple scientific studies by collecting data from a large number of previous individual study cases, which could produce a more reliable and accurate result. However, this is not a classic meta-analysis and randomized controlled trials were not conducted. Additionally, more relevant and valuable indicators were used instead of variance to calculate weights [34,35,36,37,38].
The weighted average flux is calculated according to the data collected above. Due to the heterogeneity in the different studies, we use the random effect model in this study, and the data on heavy metal(loid) fluxes are a continuous variable with a uniform unit. Thus, the weighted mean difference is selected as the effect size to calculate the average fluxes. We generally believe that experiments with larger study areas and larger samples are more representative and reliable. Given this fact, we use the size of the study area and number of monitoring sites instead of the variance to calculate the weights (Wi):
W i = A i × N i
where Ai is the size of the study areas in study i and Ni is the number of monitoring sites in study i. Testing the data on the weights showed a skewed distribution; thus, the logarithmic transformation is applied to the data correction:
W i = l g W i
Then, the weighted average of the heavy metal(loid) flux (F, mg/m2/yr) refers to:
F = i = 1 n ( F i × W i / i = 1 n W i )
where Fi is the heavy metal(loid) flux in each study.
For the fluxes not clearly expressed in the literature, we obtained these indirectly via calculation.
(1)
Atmospheric deposition:
F i = C i × D
where Fi (mg/m2/yr) is the flux of the heavy metal(loid) entering the soil i via atmospheric deposition; Ci (mg/kg, dry weight) is the content of the heavy metal(loid) i in atmospheric deposition; and D (kg/m2/yr) is the amount of atmospheric deposition.
(2)
Manure:
In the process of the literature review, it was found that there were few studies that measured the heavy metal(loid) flux of manure; thus, we referred to the data from the China Agriculture Yearbook as a supplement to calculate the flux of manures:
F i = f j = 1 n N j E j 1 C w j C i j / A
where Fi (mg/m2/yr) is the flux of the heavy metal(loid) entering the soil i via manure; f (%) is the agricultural utilization rate of livestock and poultry excrement (Table S3); Nj is the number of livestock/poultry j raised annually [39]; Ej (kg/head/yr, fresh weight) is the excretion of livestock/poultry j [40] (Table S4); Cwj (%) is the water content in the livestock/poultry j excrement [41] (Table S4); Cij (mg/kg, dry weight) is the content of heavy metal(loid) i in the livestock/poultry j excrement, the data on which were taken from the means of previously published research; and A (m2) is the sown area of grain crops [39].
In brief, we analyzed the publication bias of the literature, the data were extracted and screened, then a database of heavy metal(loid) fluxes was created. A subgroup analysis was carried out according to geographical regionalization; finally, the weighted average flux of each region was calculated.

2.3. Spatiotemporal Heterogeneity Analysis

The spatiotemporal heterogeneity detection can effectively eliminate the regional differences caused by economic development and the pollution degree, avoiding an overestimation or underestimation of the heavy metal(loid) input flux. In this study, GeoDetector is used to detect the spatiotemporal heterogeneity and spatiotemporal interaction of heavy metal(loid) fluxes in China’s agricultural soil. This could verify the accuracy of the zoning and determine whether it is necessary to further explore the accumulation of heavy metal(loid) fluxes in different regions of China.
Geodetector is a spatial statistical method commonly used to detect the differences in geographic factors and their effects on the spatial distribution of study objects. It is based on the idea that, if an independent variable has an important effect on a dependent variable, the spatial distribution of the two should be similar [42]. The principle of GeoDetector is as follows:
q = 1 S S W / S S T = 1 h = 1 L N h σ h 2 / N σ 2
where h = 1, …, L is the stratum count in factor X, and Nh and N are the number of units in stratum h and the whole study area, respectively. σ h 2 and σ 2 are the variance of variable Y in stratum h and the whole study area, respectively. The range of q is [0, 1] and, the larger the q-statistic, the more obvious the spatial heterogeneity of variable Y and the stronger the explanatory power of factor X to variable Y.
The interaction detector evaluates whether the interaction of the driving factors X1 and X2 will enhance or weaken the explanatory power of variable Y. The types of factor interaction can be found in [43].
The same stratification method is adopted for the heavy metal(loid) fluxes via different sources to ensure that the effect of the factors on heavy metal(loid) fluxes is explored under the same spatiotemporal stratification conditions.

2.4. Soil Environment Risk Assessment

The potential risk of soil pollution can be measured via the soil environmental capacity. This environmental capacity assesses the maximum load of the pollutants that can be accommodated in an area without harming the ecological environment; it is a basic method for measuring the soil heavy metal(loid) pollution status [44,45,46,47]. The calculation for the soil environmental capacity is:
P i = Q i / Q b
Q i = 10 6 M C i C p i
Q b = 10 6 M C i C b i
T i = Q b / F t i
where Pi is the environmental capacity index of the heavy metal(loid) i, the assessment standard is shown in Table S5; Qi is the existing environmental capacity of the heavy metal(loid) i in the soil (kg/hm2); Qb is the total environmental capacity of the heavy metal(loid) i in the soil (kg/hm2); M is the mass of the topsoil, and it is supposed that the topsoil in China is uniformly distributed with a soil bulk density of 1.3 g/cm3 [48], meaning that M = 2.6 × 10⁶ kg/hm2; and Ci is the standard limit of the heavy metal(loid) i (mg/kg) (Table S6), with regard to the soil environmental quality risk control standard for the soil contamination of agricultural land [49]. Cpi is the measured content of the heavy metal(loid) i in the soil (mg/kg) [31]; Cbi is the background value of the heavy metal(loid) i (mg/kg) [50,51]; Ti is the time required for the heavy metal(loid) i content to reach the standard limit (yr); and Fti is the total input flux of the heavy metal(loid) (i) (kg/hm2).

3. Results

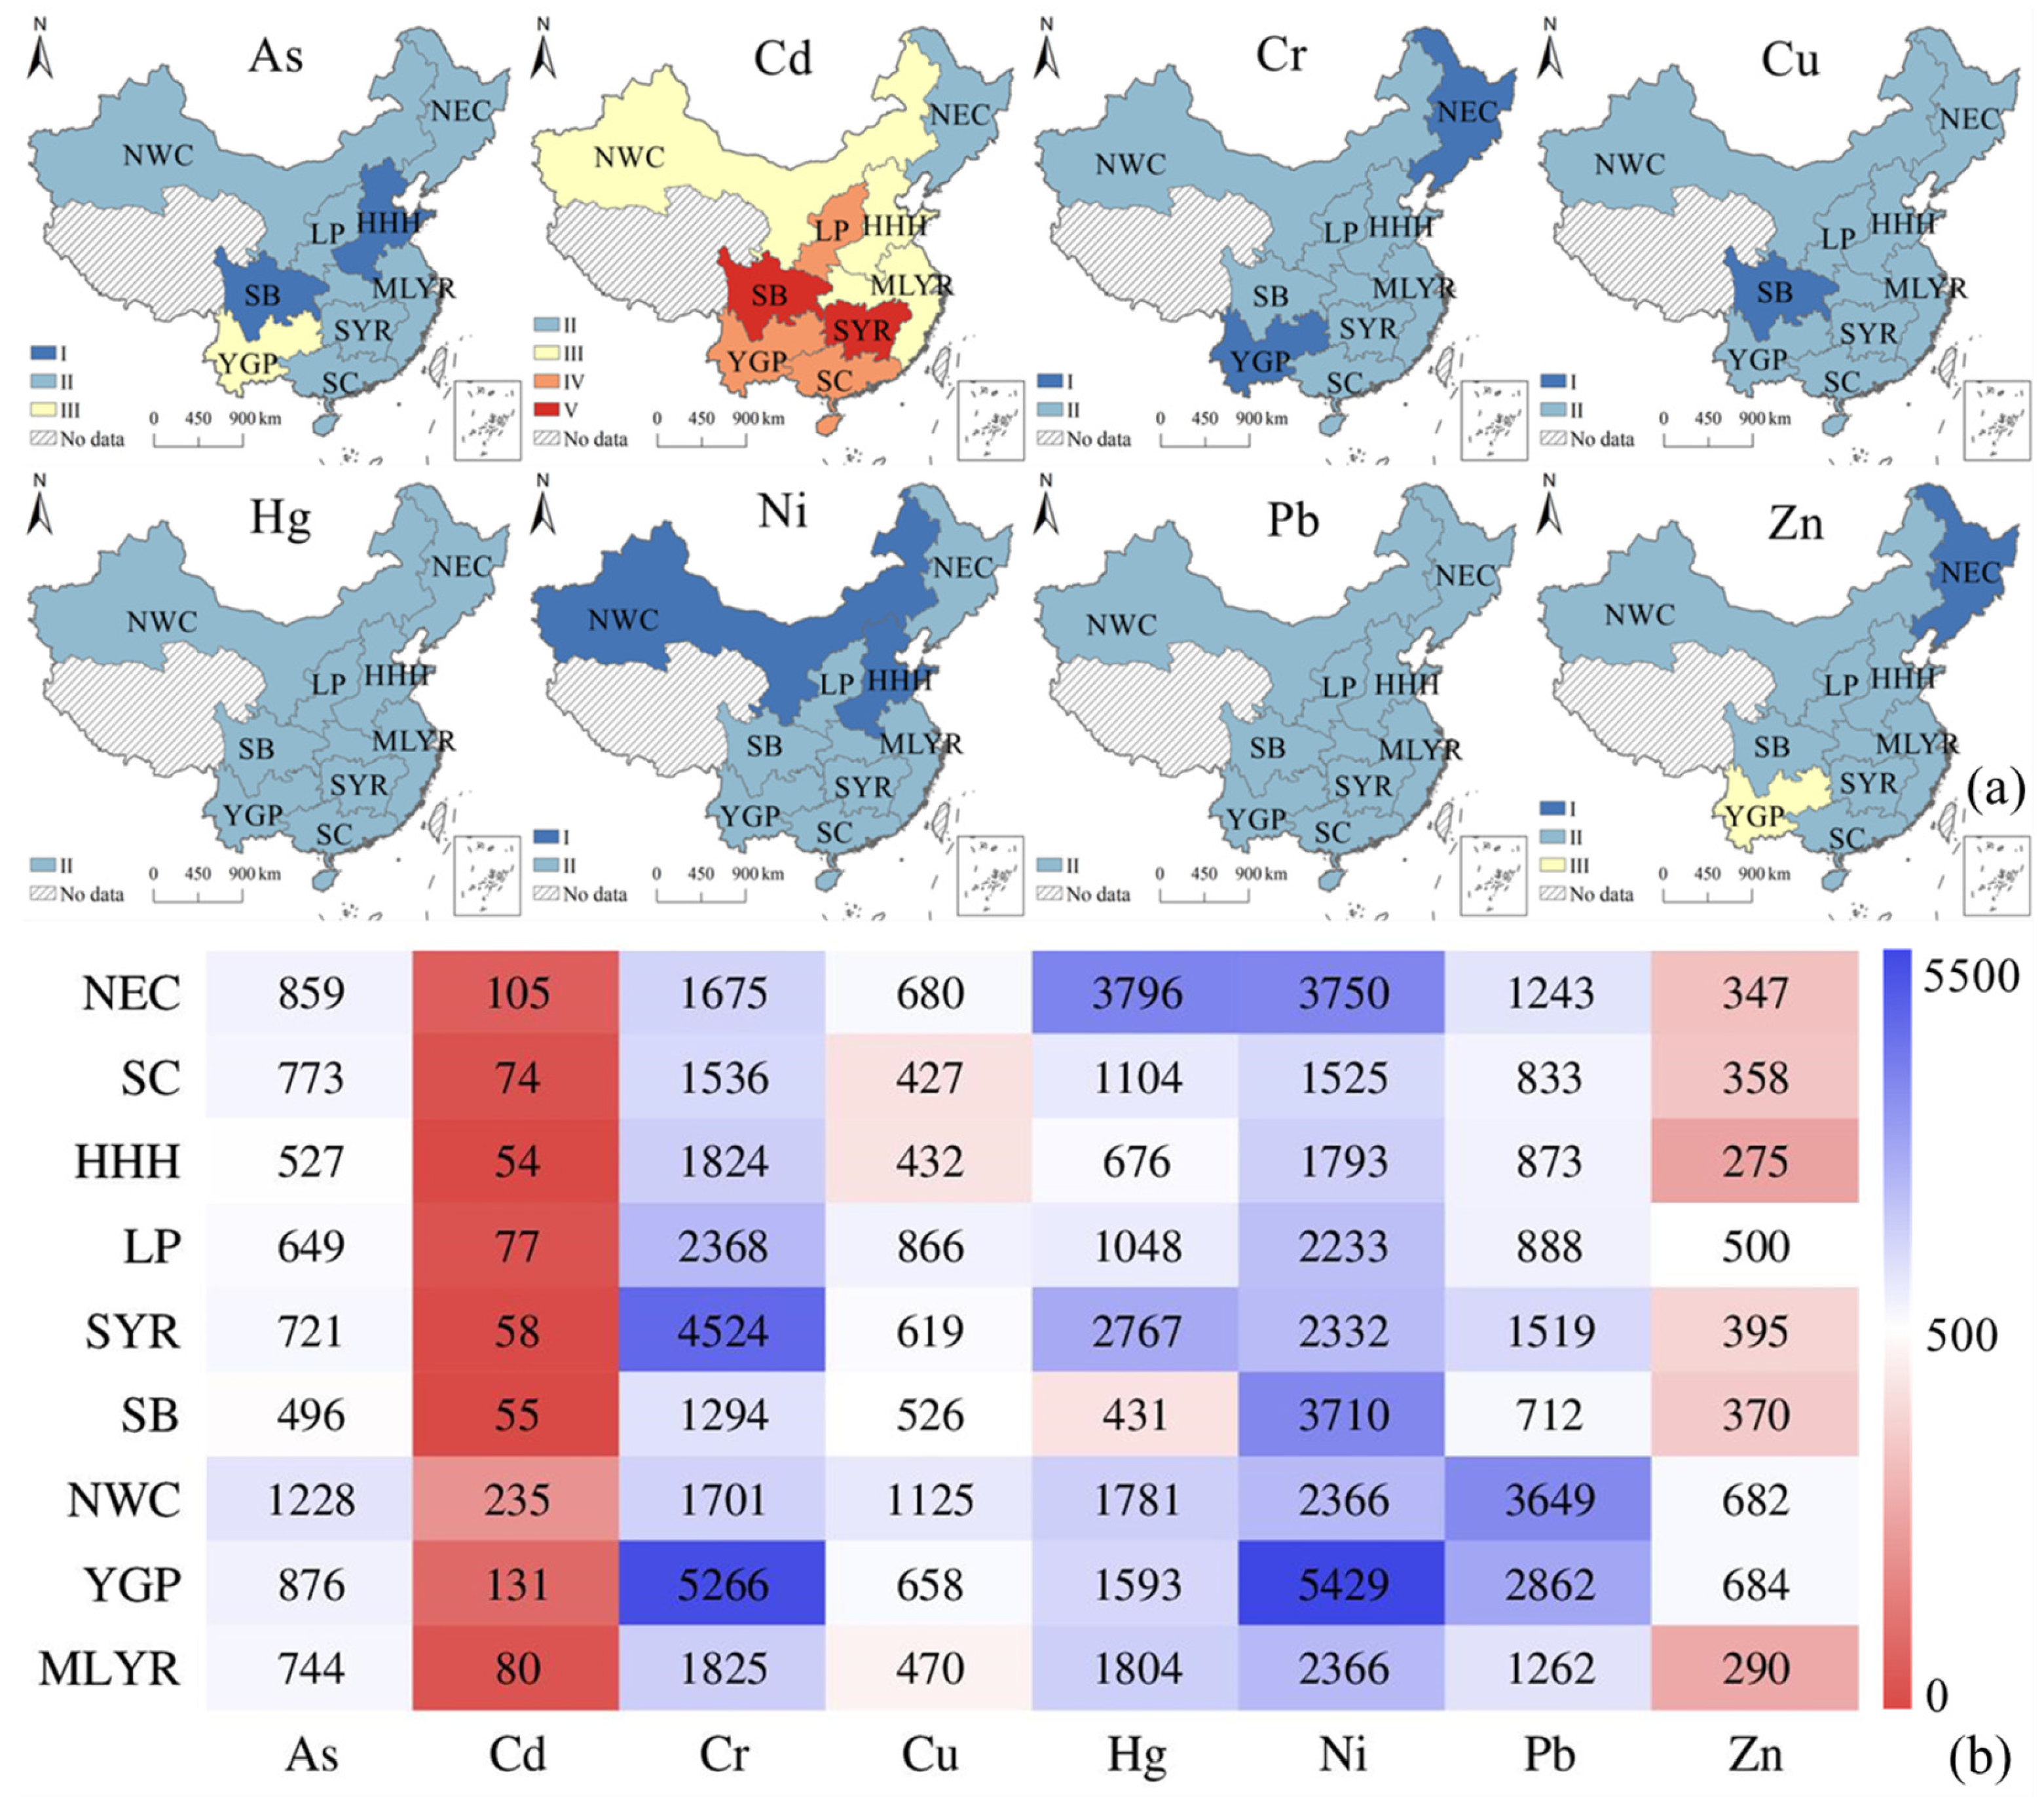
3.1. Zoning of Heavy Metal(Loid) Input Flux

Heavy metal(loid) input flux varies both spatially and temporally, which means that spatiotemporal heterogeneity exists objectively [52]. Thus, the zoning calculation of the heavy metal(loid) flux in China can scientifically represent the status of the heavy metal(loid) pollution in China. Before the zoning, the spatial autocorrelation and heterogeneity of the data were analyzed, using Moran’s I [53,54] to measure the spatial autocorrelation of the heavy metal(loid) input flux. As shown in Table 1, the Moran’s I index of all the trace elements was greater than 0, which indicated that there was a positive spatial autocorrelation. According to the z-score (z > 2.58) and p-value (p < 0.001) of most of the trace elements, the spatial distribution of their input fluxes presented a clustered pattern at a 99% confidence level. Figure S1 presents the local indicator of the spatial association (LISA) and the distribution of the heavy metal(loid) input fluxes via atmospheric deposition shows a pattern of HH in the north and LL in the south, except for Cd. The distribution of the heavy metal(loid) input fluxes via fertilizer and irrigation shows a pattern of LL in the north and HH in the south. Taking the Cd input flux via atmospheric deposition as an example, the LISA in different periods was analyzed, respectively. Figure S2 shows that the spatial pattern of the input flux varied in different periods. These results suggest that it is necessary to calculate the heavy metal(loid) input flux partition.
China has a vast territory with different economic development levels, industry types, climatic conditions, and modes of production and living; thus, there are inevitable differences in the levels and sources of the pollution between these different regions. Based on China’s agricultural regionalization, its economy, pollution, and previous research [55,56,57] were comprehensively considered for zoning. Then, we divided the agricultural land in China into the following nine regions (Figure 1): Northeast China (NEC), South China (SC), Huang-Huai-Hai (HHH), Loess Plateau (LP), South of the Yangtze River (SYR), Sichuan Basin (SB), Northwest China (NWC), Yunnan Guizhou Plateau (YGP), and the Middle and Lower Reaches of Yangtze River (MLYR). In light of the processes of industrialization and urbanization, air pollution control measures, and the introduction of the relevant regulations, the sampling time was divided into three periods: 2000–2006, 2007–2012, and 2013–2021.
To verify the accuracy of the zoning, we used GeoDetector to detect the spatiotemporal heterogeneity of the heavy metal(loid) input fluxes of atmospheric deposition, fertilizer, and irrigation. The input flux of manure was not detected due to a lack of data. The results in Table 2 show that there was heterogeneity between the strata after dividing the samples, the heavy metal(loid) input fluxes were affected both spatially and temporally, and the spatial distribution had a greater impact on them. If the heavy metal(loid) input flux was calculated directly without partitioning, the uncertainty of the average and variance would increase. Therefore, to avoid confusion caused by spatial heterogeneity and make the calculation more scientific, the subsequent calculation of the flux was performed in the homogeneous region.
The explanatory power of the period for the heavy metal(loid) input flux was 0.042–0.369, 0.001–0.249, and 0.006–0.247 for atmospheric deposition, fertilizer, and irrigation, respectively; the explanatory power of the region for the heavy metal(loid) input flux was 0.078–0.271, 0.129–0.468, and 0.138–0.814 for atmospheric deposition, fertilizer, and irrigation, respectively. The temporal heterogeneity of the heavy metal(loid) fluxes of fertilizer and irrigation was not obvious compared to that of atmospheric deposition. For fertilizer, more than half of the elements were NS. Meanwhile, only Pb was significant at the 0.001 level for irrigation.
The driving factors of the heavy metal(loid) input were not independent of each other, but there was a synergistic effect between them. Interaction detection can detect the interaction between these driving factors, that is, to evaluate whether the driving factors enhanced or weakened the explanatory power of the spatial heterogeneity of the heavy metal(loid) input fluxes under the combined action of the driving factors (here, these are period and region). Table 2 shows that, under the interaction, the q-statistics were 0.252–0.592, 0.203–0.595, and 0.418–0.904 for atmospheric deposition, fertilizer, and irrigation, respectively, which are all greater than the q-statistic of a single factor and significant at the 0.001 level. Hg, for example, had a significant increase in its explanatory power after the interaction. This suggested that the heavy metal(loid) input fluxes were affected by the interaction between time and space. A simple arithmetic average of the overall data could not accurately represent the current status of the heavy metal(loid) input in China. Thus, the weighted calculation of the different regions using a meta-analysis and further exploration of the spatiotemporal characteristics of the heavy metal(loid) input fluxes in China’s agricultural soil could more scientifically describe the input flux and risk trend of these heavy metal(loid)s.

3.2. Inventory of Heavy Metal(Loid) Input Fluxes

In this section, the weighted averages of the heavy metal(loid) input fluxes via atmospheric deposition, fertilizer, and irrigation were calculated through a meta-analysis. The input flux via manure was calculated indirectly instead of using a meta-analysis, because there were few previous studies that measured the heavy metal(loid) input flux of manure. Finally, the inventories were established, respectively.

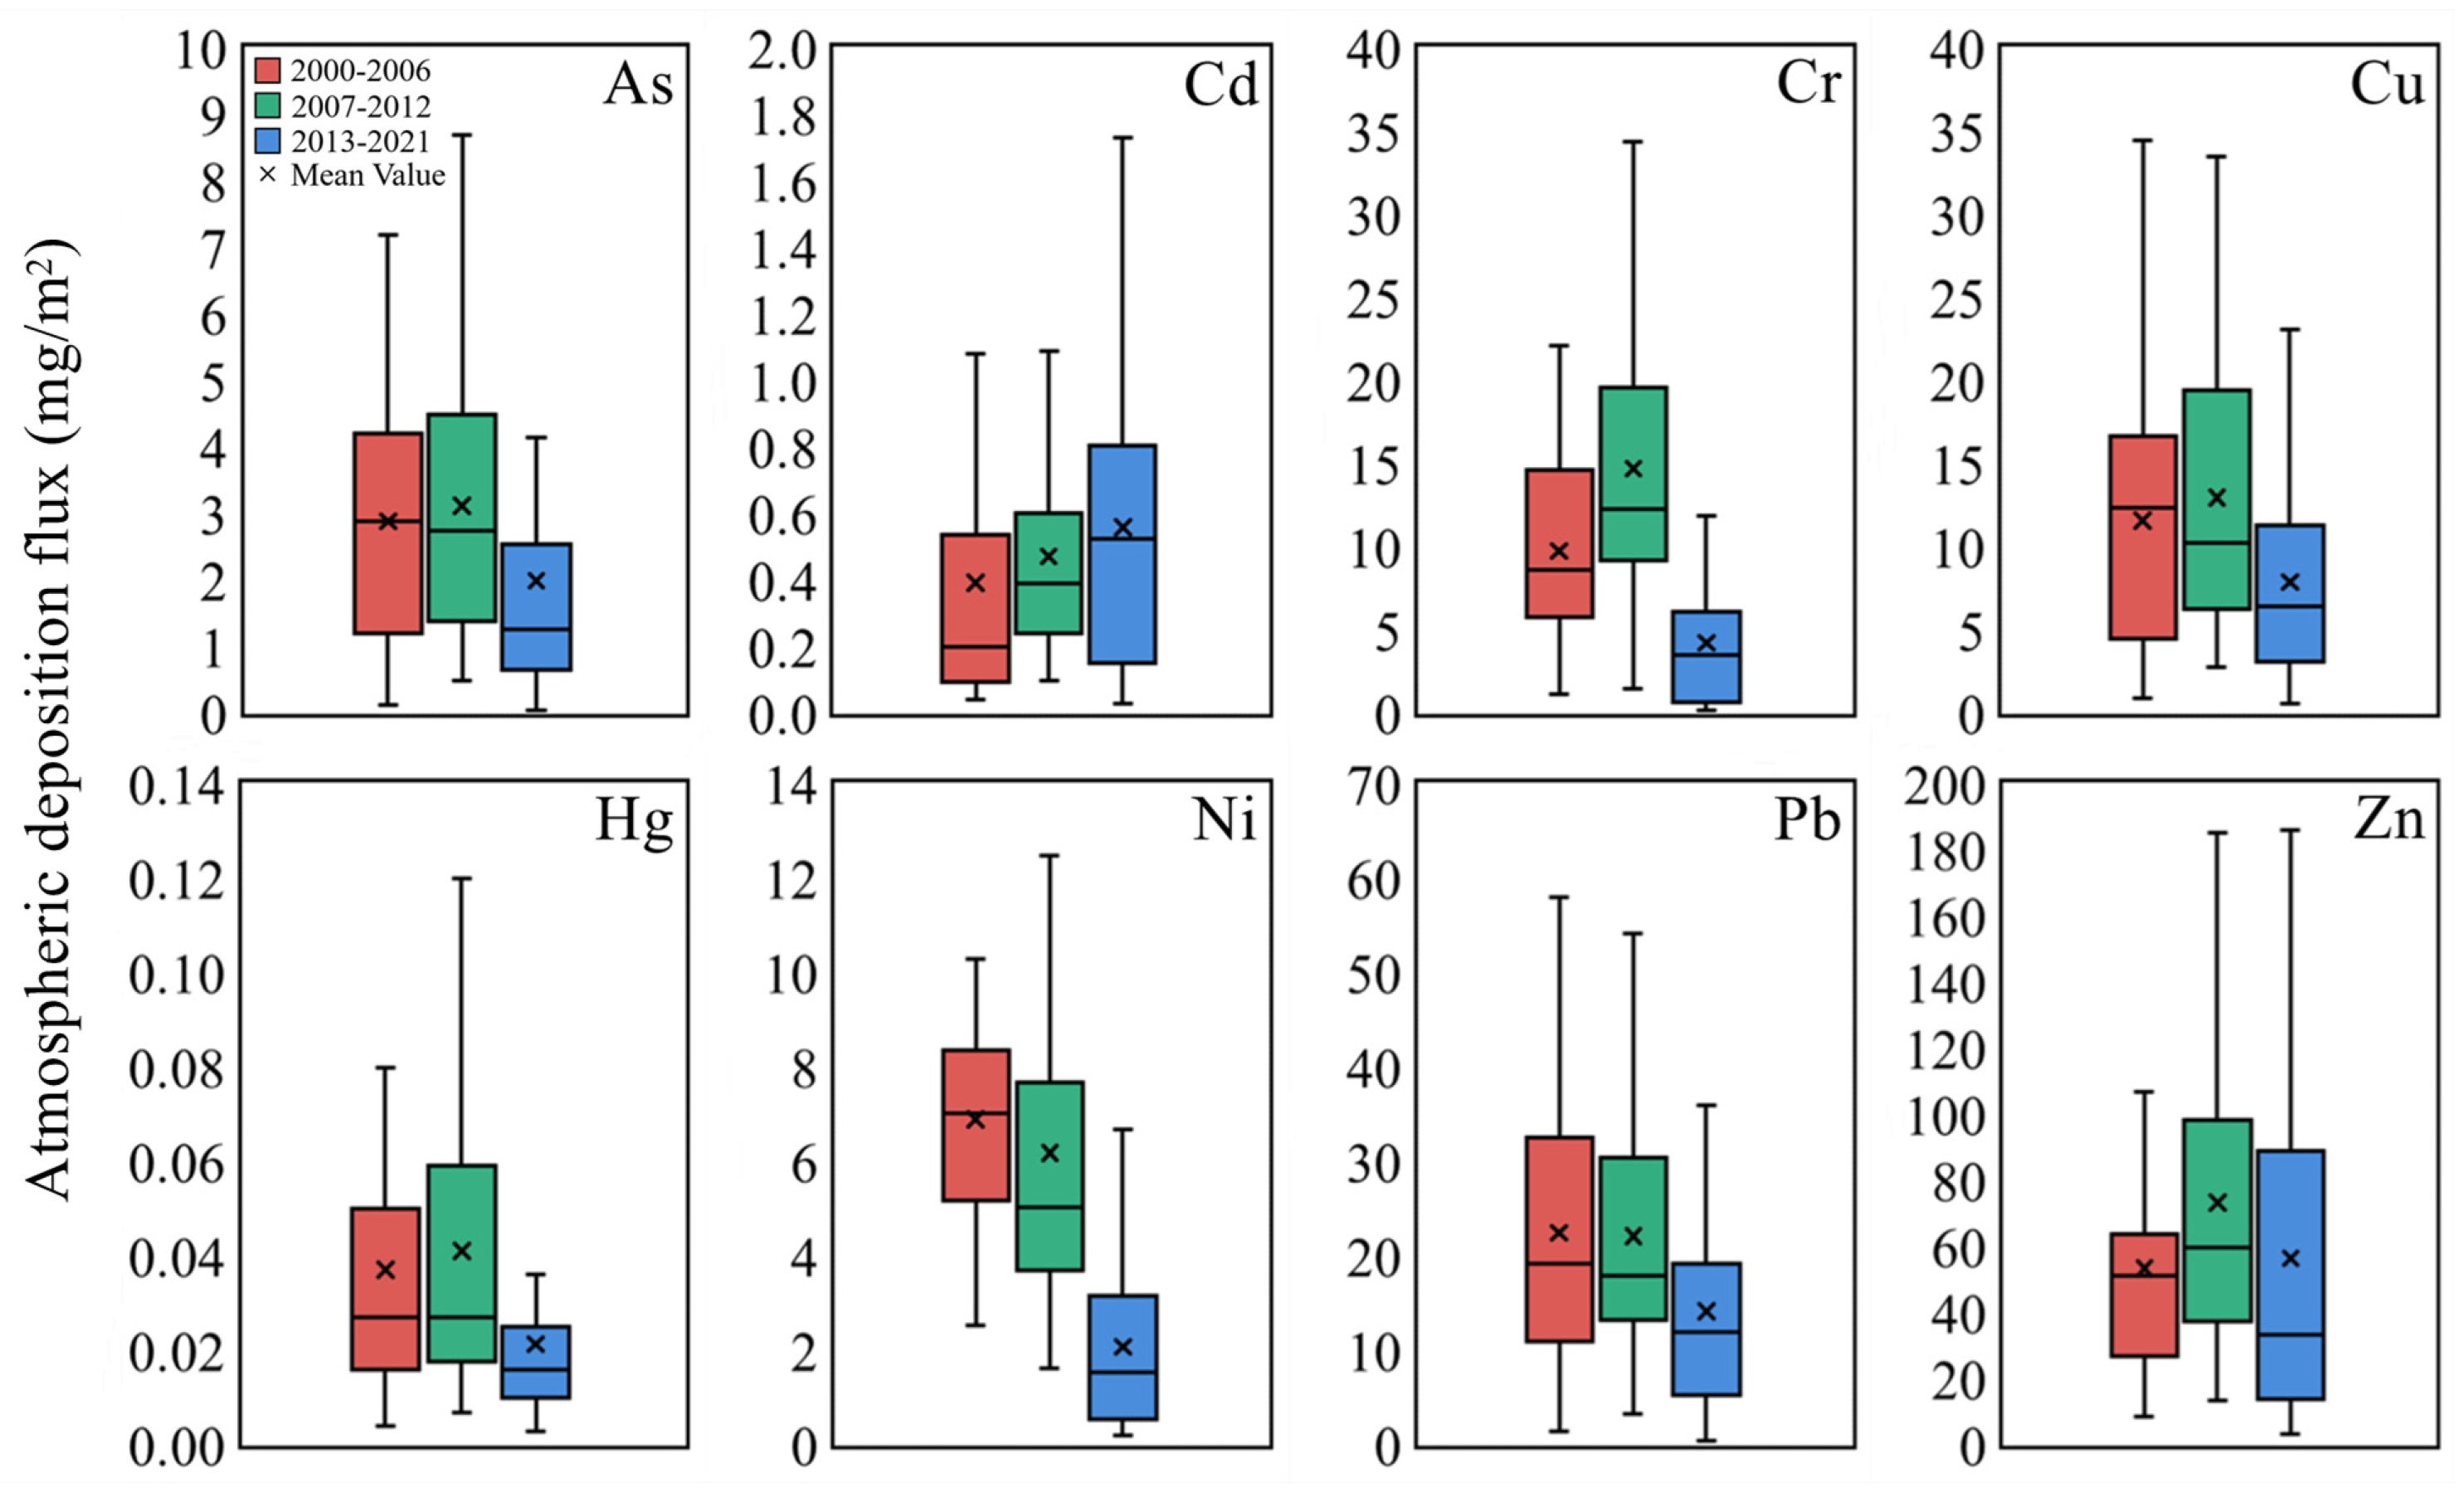
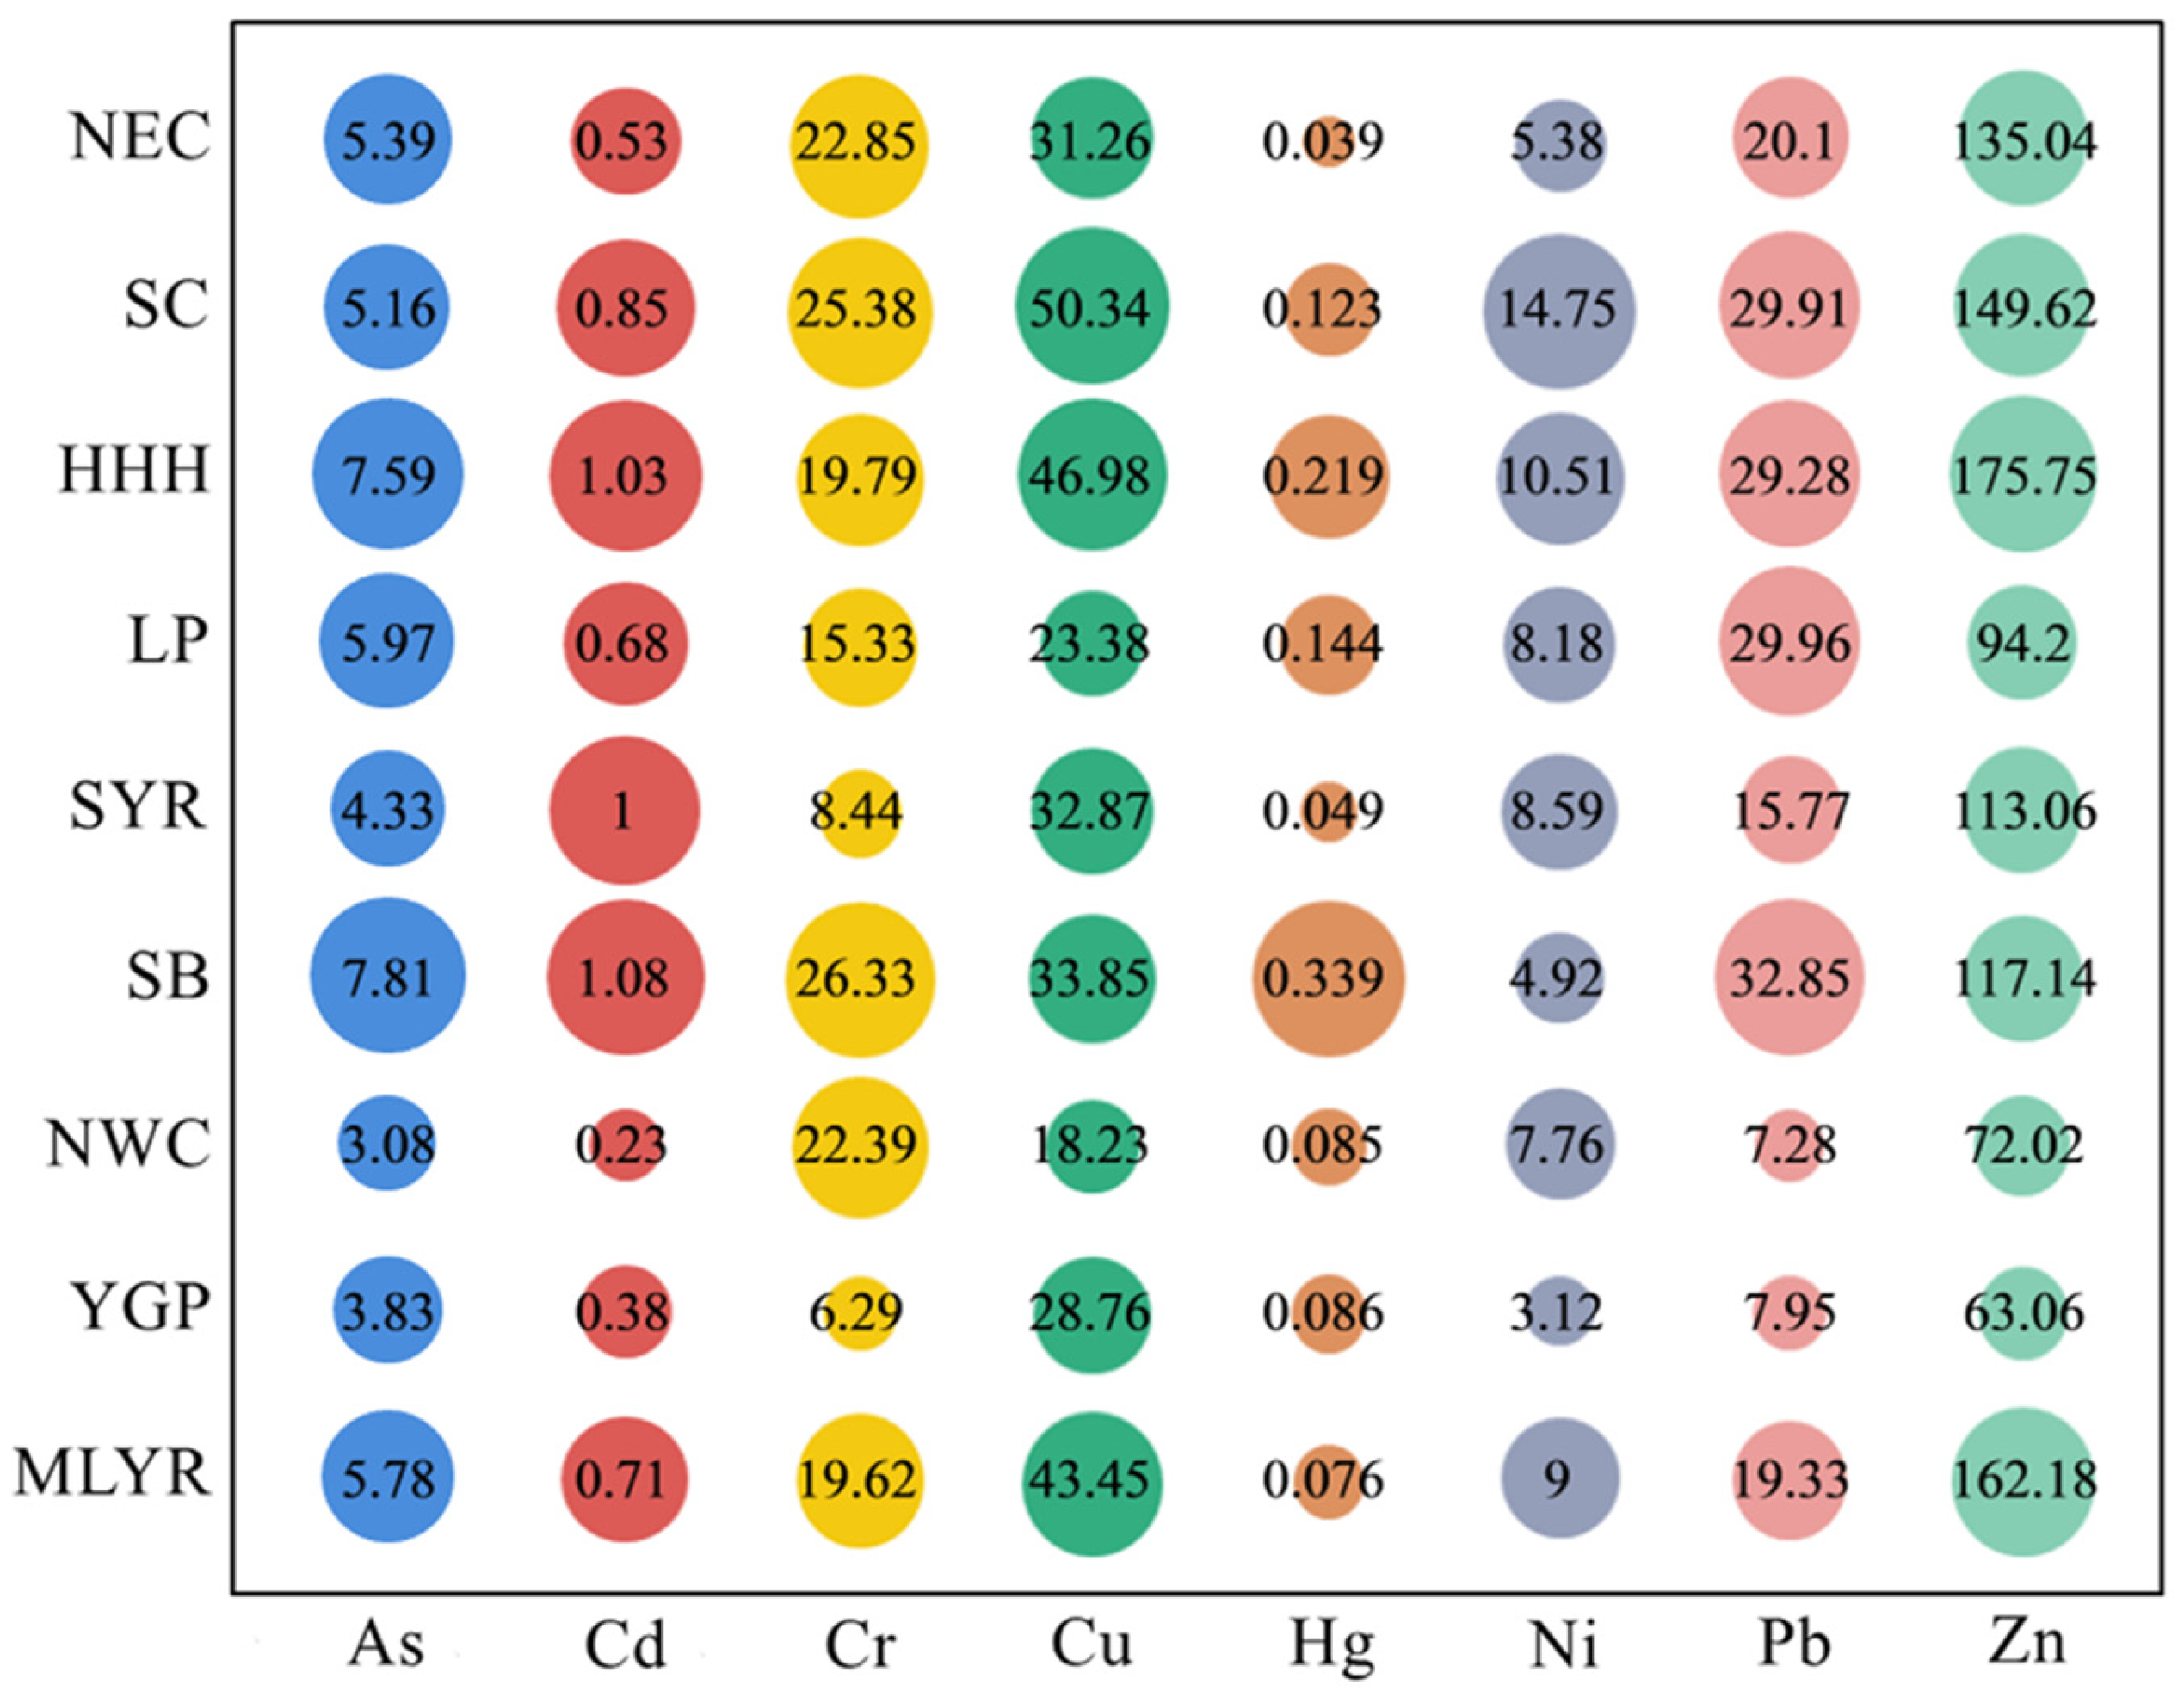
3.2.1. Atmospheric Deposition

The weighted average input fluxes of eight heavy metal(loid)s via atmospheric deposition are shown in Table 3. The fluxes can be roughly ranked as follows: Zn> Pb > Cu > Cr > Ni > As > Cd > Hg, and such a pattern is consistent with previous studies [58,59]. This may be related to the abundance of elements in the Earth’s crust and the components of atmospheric pollutant emissions [60]. The total annual input flux for each heavy metal(loid) was not significantly different from those reported by Luo, Ni, and Wang [31,61,62], but lower than those of Peng [63], probably because Peng collected their data covering all land use types, while Luo, Ni, Wang, and this study only selected sampling sites near farmland and avoided industrial, mining, and traffic-intensive areas. The relative standard deviation of this study was smaller than those of other studies (Table S2), which means that the data were more concentrated and accurate.
Compared to other countries, although the pollution situation is better than that in some developing countries [64,65], there is still a big gap between China and other developed countries (Table 3) [66,67,68,69,70]. The past two decades have been a period of rapid economic development in China, and intensive industrial activities can give rise to the emission of heavy metal(loid)s. It can be observed that the deposition fluxes of all the elements in China were out of the range found in these developed countries.
According to the results in Table 2, we believe that the heavy metal(loid) input flux of atmospheric deposition had spatial heterogeneity (q-statistic: 0.078–0.271). Thus, the input fluxes in the different regions were calculated separately (Table 3). The atmospheric deposition of heavy metal(loid)s was extremely severe in NEC, where the input fluxes of As, Cr, Cu, and Zn were the largest. NEC is a major industrial base in China. Its industrial structure is dominated by traditional heavy industries such as mining and its principal energy consumption is coal, which is the main source of As, Cr, Cu, Ni, and Pb in the atmosphere [71]. Meanwhile, coal-fired heating is an important way of winter heating in NEC and the heating period lasts 5–7 months, resulting in the consumption of about 150 million tons of coal annually; thus, coal is also an essential source of the heavy metal(loid)s in the atmosphere in NEC. For Cd, the most serious depositions were distributed in SB and SYR at 0.84 and 0.74, respectively. The deposition in SB was mainly caused by industrial waste gas emissions from chemical, metal(loid)lurgical, mining, and other industries densely distributed in the area. According to incomplete statistics, there are as many as 74 chemical plants named “Shifang” in Shifang City and most of them are phosphorus chemical enterprises, while phosphate ore is an important source of Cd [72]. SYR includes the Jiangxi Province, CZT, which is rich in nonferrous metal(loid) mineral resources and is an important Pb and Zn smelting, production, and processing base in China [17,26,73].
Table 3. Heavy metal(loid) input fluxes of atmospheric deposition (mg/m2/yr).
Region/CountryPeriodAsCdCrCuHgNiPbZnRef.
NEC2000–20214.280.3617.9515.10.0283.1918.5884.02This
study
SC2000–20212.280.3811.1912.370.0537.0625.5648.51
HHH2000–20212.860.539.7712.770.0525.9224.0667.63
LP2000–20213.040.499.0713.350.0635.7626.9962.07
SYR2000–20213.140.743.734.940.0261.9314.1642.7
SB2000–20212.560.8417.799.440.0662.9230.2462.63
NWC2000–20210.390.0616.236.780.007-4.0531.88
YGP2000–20211.080.161.1310.90.020.85.316.08
MLYR2000–20211.610.3710.068.580.0223.7915.1763.45
China2000–20212.670.4910.7711.540.0395.0620.6464
Kandy, Sri Lanka2015-36.5182.5292-109.52194380[65]
Izmir, Turkey2003–2004-15.338.337.4-55.936.1774.2[64]
Huelva, Spain2008–2011-0.11.670-1.43.4-[66]
Pallas, Finland20070.0150.0120.0430.58-0.0530.180.93[67]
Tokyo Bay, Japan2004–20052.90.396.2160.0356.89.9-[74]
Paris, France2001–2002-0.24-6-0.624.230[69]
England and Wales1995–19980.310.190.755.70.11.65.422.1[11]
Note: - No data.
On the other hand, there was a temporal heterogeneity in the heavy metal(loid) input flux of atmospheric deposition (q-statistic: 0.042–0.369). Figure 2 presents the temporal variation in the atmospheric heavy metal(loid) input fluxes from 2000 to 2021. The peak was around 2012 and then decreased. At the same time, the concentration of PM2.5 and the atmospheric pollutant also conformed to this trend [75,76]. Although fine particulate matter rarely settles, both it and atmospheric deposition represent the quality of the atmospheric environment. China has issued a series of regulations on environmental protection and air pollution prevention and, since this increasing emphasis on air pollution prevention and control [77,78,79], the air quality in China has improved markedly, owing to these regulations. It was found that the atmospheric depositions of Cr, Hg, Pb, and Zn in Tianjin decreased from 0.77, 0.11, 71, and 420 mg/m2/yr in 2006 to 0.21, 0.02, 15.58, and 37.8 mg/m2/yr in 2014, respectively [80,81]. According to the statistics, the proportion of the tertiary industry in China has exceeded that of the secondary industry since 2012, which also explains the decline in heavy metal(loid) deposition flux after 2012 [82]. In short, although China has made some progress in atmospheric environmental protection this year, it still has many deficiencies compared to developed countries.

3.2.2. Fertilizer

To avoid double-counting, the fertilizers counted in this study included only chemical fertilizers and organic fertilizers were not considered. The chemical fertilizers applied in China include nitrogen fertilizers, phosphate fertilizers, potash fertilizers, and compound fertilizers. No data were available for NWC and YGP because of their remoteness and small areas of arable land. According to the results in Table 2, the heavy metal(loid) input flux via fertilizer had spatial heterogeneity (q-statistic: 0.129–0.468), while the temporal heterogeneity was not obvious (q-statistic: 0.001–0.249, no significance). The input fluxes are listed in Table 3, which shows a variation among the different regions. The most likely cause of this was that the fertilizers applied came from different production places and the main raw materials for fertilizer came from ores with their own heavy metal(loid) content in each region. Basically, this is determined by the local soil background value. However, the heavy metal(loid) content in these ores would not change significantly in a short time; thus, the heavy metal(loid) input fluxes via fertilizer are stable for a certain time.
Even though phosphate fertilizers are generally thought to be high in Cd [83], the results did not show a larger flux of Cd from fertilizers. It has previously been observed that the input flux of Cd via fertilizers in England and Wales is 0.17 mg/m2/yr [11], while in China, it is only 0.05. For other elements, there was no obvious difference between China and Europe, except for As, which was about five times higher, and Pb, which was about seven times higher than that in Europe (Table 4) [84]. Compared to atmospheric deposition, the heavy metal(loid) input flux via fertilizer was much lower; consequently, the application of chemical fertilizers is not our major consideration in soil heavy metal(loid) pollution control in China, since it was not the crucial cause of the heavy metal(loid) accumulation in soil. However, it should be warned that the use of imported fertilizers in individual regions may cause local contamination.

3.2.3. Manure

The heavy metal(loid)s entering soil through manure were mainly determined by the number of animals raised, the content of the heavy metal(loid)s in their excrement, the area of arable land, and the utilization rate of the livestock and poultry excrement. Thus, the heavy metal(loid) flux of manure was calculated using Formula (6). Compared to Europe, the heavy metal(loid) input fluxes via manure in China were apparently low (Table 4). Although the heavy metal(loid) input flux via manure was calculated indirectly and a spatial heterogeneity analysis could not be carried out, we concluded that it also had spatiotemporal heterogeneity after judging the factors that affected the input flux.
As shown in Table 5, the high input flux values were mostly concentrated in the densely populated areas of HHH, MLYR, and SC. Due to the constraints of demand, transportation, and cost, specialized livestock and poultry farms are increasingly concentrated in the densely populated eastern developed areas and suburban settlements; more than 70% of livestock and poultry production is distributed in these eastern regions and the suburbs of large cities [85]. In these regions, the pollution pressure of manure is higher because of more livestock production and less arable land. In addition, most livestock raised in the northwest regions are grass-fed animals such as cattle and sheep, while in the eastern regions, these are mainly pigs and chickens with high contents of heavy metal(loid)s in their feed. Therefore, not only intensive livestock and poultry breeding, but also the higher contents of heavy metal(loid)s in the animals’ excrements cause serious pollution in the eastern region.
The time variation in the heavy metal(loid) flux of manure was mainly caused by the heavy metal(loid) content in the animal excrement, which is closely related to animal feed. Cr, Cu, and Zn were the most enriched elements in the feed of chickens and pigs [86,87]. Since the issuance of regulations such as the safety specification for feed additives [88], organic fertilizer [89], the overuse of feed additives has been curbed in some parts of China. According to the data we collected, the Cr and Cu contents in chicken and pig excrements did gradually decrease, while the Zn content kept growing (Figure S3).
The opinions on accelerating the utilization of livestock and poultry waste resources released by the State Council of the PRC state that it is urgent to accelerate the utilization of livestock and poultry waste and the comprehensive utilization rate should reach more than 75% by 2020 [90]. An implication of this is the possibility that, in the future, the trend of heavy metal(loid) pollution from manure is likely to remain increasing because the utilization rate of livestock and poultry excrement is constantly increasing. Therefore, the return of livestock and poultry manure to the field will still exist for a long time in the future, and the soil heavy metal(loid) pollution caused by manure may become more and more serious. Eastern regions will have to be more cautious about the soil pollution caused by the heavy metal(loid)s from manure. As reducing the heavy metal(loid) content in the feed is the most effective measure of reducing the pollution from livestock and poultry manures, it has been recognized that more strict regulations to limit the amount of heavy metal(loid) content in feed additives are urgently required. What is worth mentioning is that the method for estimating the input flux via manure is ideal and will thus cause overestimation in some areas and underestimation in others.

3.2.4. Irrigation

The selection of irrigation water sources tends to be dominated by surface water sources (runoff, lakes, and reservoirs, etc.), supplemented by reclaimed water and sewage [91]. China, especially in the north, is constrained by its lack of water resources and sewage is often used for irrigation. Although the proportion of sewage irrigation areas is not large, they are often the major production areas of agricultural products [92].
Over the last century, sewage irrigation has been one of the main causes of soil heavy metal(loid) pollution due to using raw sewage directly for irrigation. Since the start of the 21st century, China has comprehensively stepped up its efforts to control water pollution [93]. Three-rivers-three-lakes (the Huaihe River, the Haihe River, the Liao River, the Taihu Lake, the Chaohu Lake, and the Dianchi Lake), one-river-one-reservoir (the Yangtze River and the Three Gorges Reservoir), and the water sources of the South-to-North Water Diversion Project have been successively listed as national key water pollution prevention and control areas, and sewage treatment plants have been constructed correspondingly [94]. The amount of sewage produced in China is increasing annually and reached 7.5 × 10¹⁰ m3 in 2019 [95], meanwhile, the 14th five-year plan for urban sewage treatment and resource utilization development issued by the National Development and Reform Commission (NDRC) clearly points out that the sewage treatment rate of counties will reach more than 95% by 2025 [96]. Except for regulations related to sewage treatment, a series of discharge standards for pollutants in industrial water were issued, including the discharge standards of pollutants for municipal wastewater treatment plants [97], emission standards of pollutants for the lead and zinc industries [98], and emission standards of pollutants for the stannum, antimony, and mercury industries [99]. Consequently, the contents of heavy metal(loid)s in sewage have been remarkably reduced, resulting from both the increase in the sewage treatment rate and limits on discharges. The current levels of As, Cd, Cr, Cu, Ni, Pb, and Zn in sewage have dropped by 24.16%, 74.81%, 66.14%, 64.65%, 52.44%, 66.80%, and 61.93% in comparison to their peak values, respectively [93].
The results in Table 2 indicate that the heavy metal(loid) flux via irrigation over the last 20 years had no obvious temporal variation characteristics (q-statistic: 0.006–0.247, no significance). However, the spatial heterogeneity of the heavy metal(loid) input flux via irrigation was obvious (q-statistic: 0.138–0.814, p < 0.001). This was due to the fact that natural water sources are also an important source of irrigation water and the water quality in different regions varies greatly. In southern China, most irrigation water comes from natural sources such as surface water or rainfall, and the pollution of natural irrigation water sources cannot be neglected either. Soil properties can affect water quality. For example, the turbidity of surface water is caused by the contents of sediment, clay, and organic matter [100]. Besides erosion, leaching, and weathering, water quality is even more affected by anthropogenic activities [101]. Dust and particulate matter deposits in water can give rise to an increase in heavy metal content. In agricultural areas, rainwater carries topsoil and deposits it as sediment into water bodies. Sediment is an essential component of the water ecosystem and has a significant impact on water security. After a long period of physical, chemical, and biological interactions, sediment is deposited at the bottom of the water as a sink with a large number of heavy metals and organic pollutants; meanwhile, it also serves as a source of releasing heavy metal(loid)s into the water again when the hydrodynamic conditions change, causing secondary pollution in the water [102,103]. Thus, the transformation of heavy metal(loid)s in water and soil is interactive. Table 6 shows the average input fluxes of each heavy metal(loid) via irrigation.

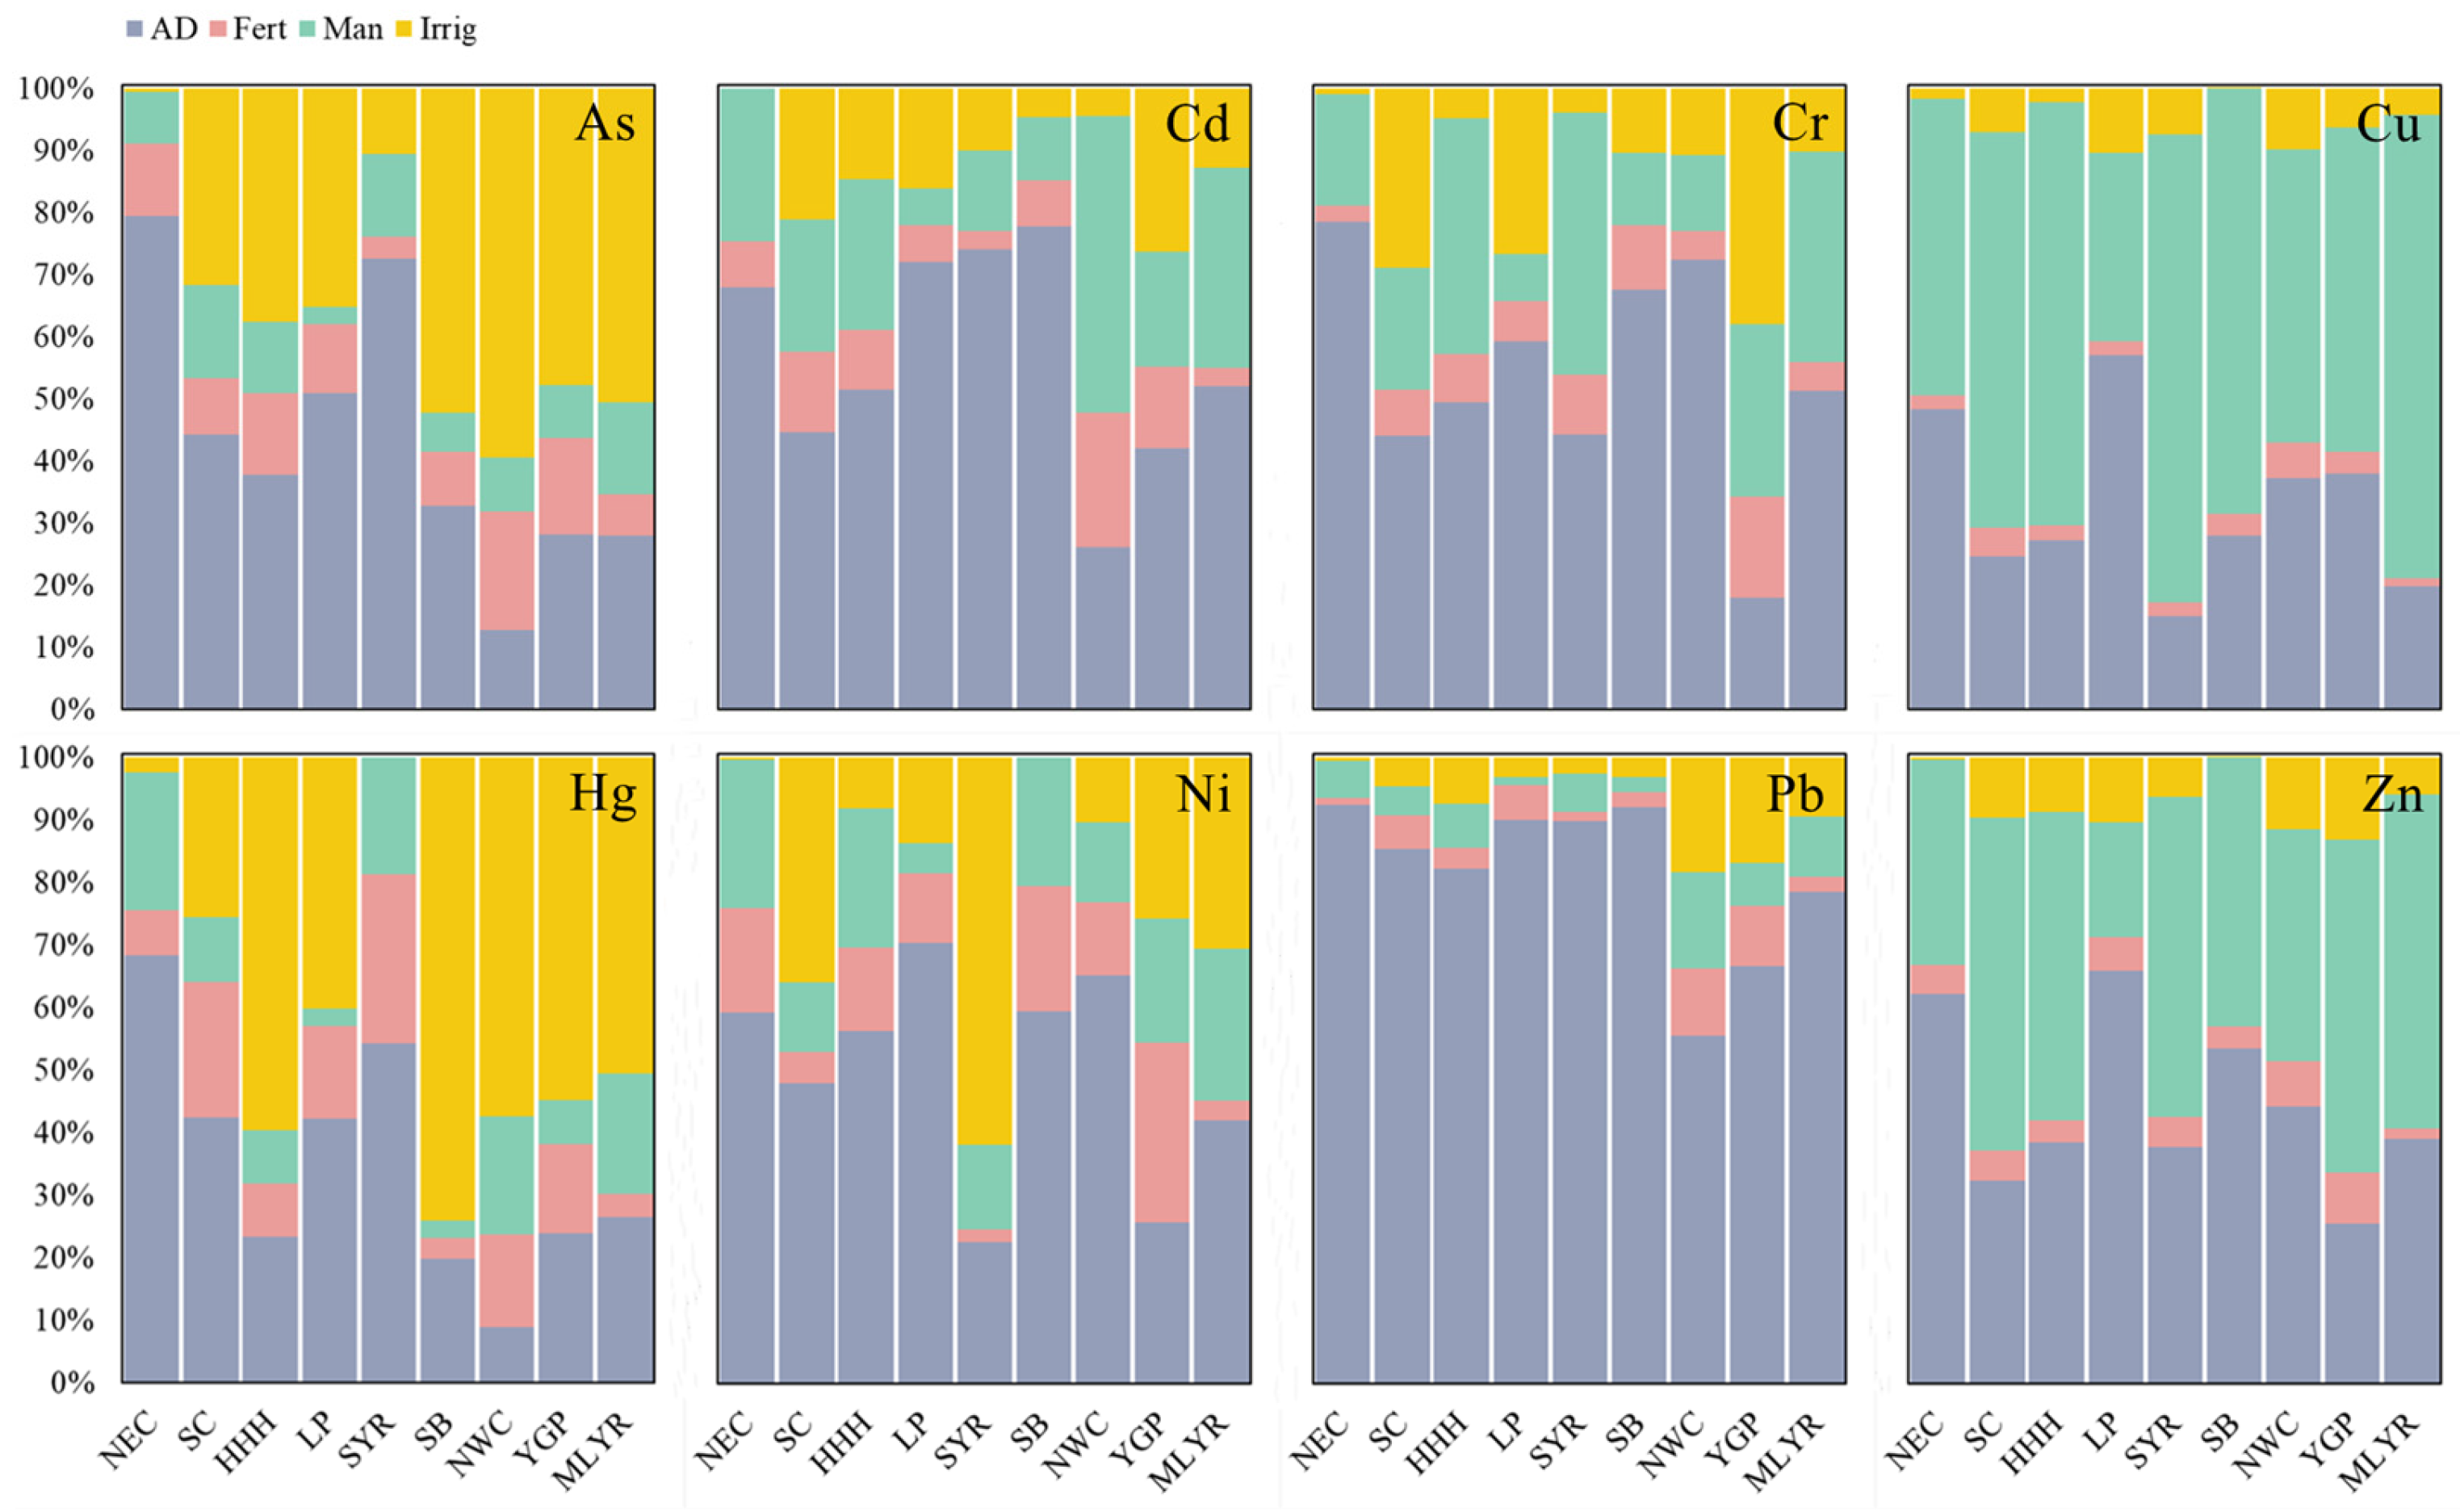
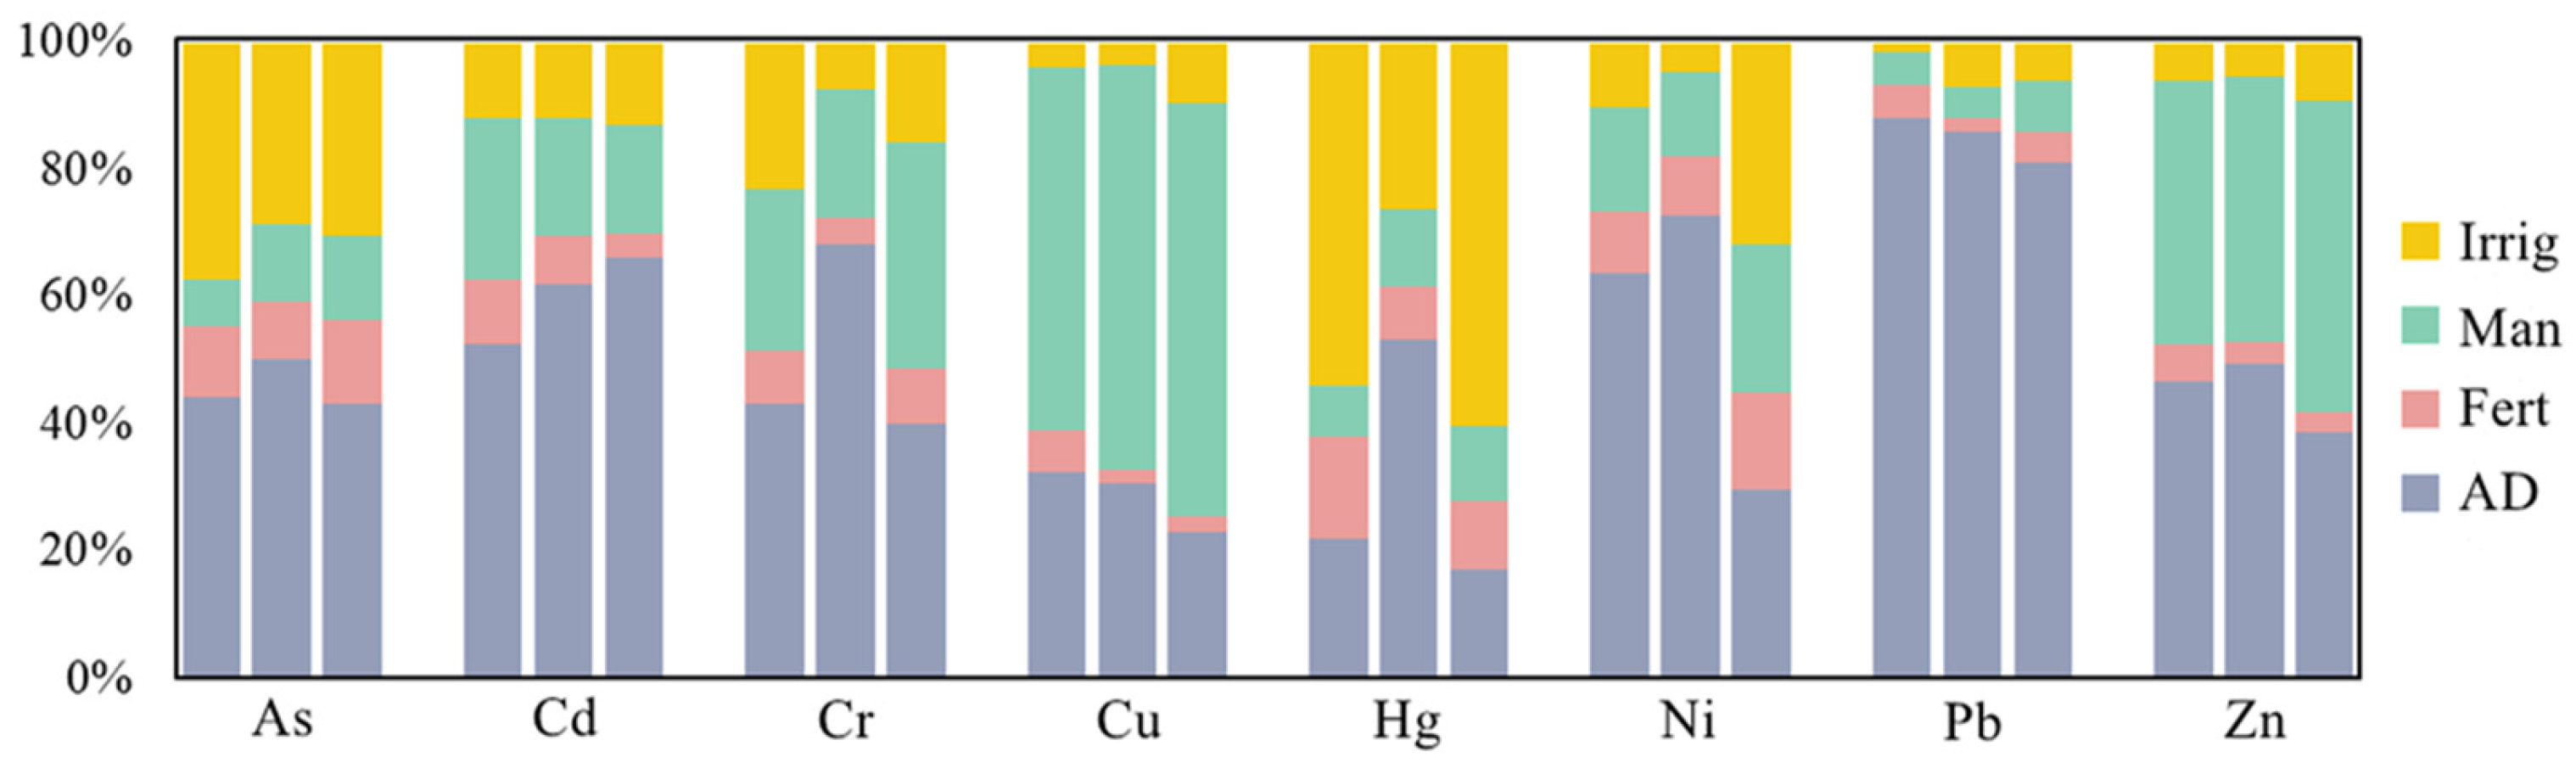
3.2.5. Contribution of Heavy Metal(Loid) Input Fluxes

The sum of the heavy metal(loid) input flux via atmospheric deposition, fertilizer, manure, and irrigation is the total input flux. The total input fluxes of the heavy metal(loid)s in the different regions are shown in Figure 3 (for the few regions without data, the national average was used instead). There was a different degree of accumulation for all the elements. The region we need to be concerned about is SB, which had the highest accumulations of As, Cd, Cr, Hg, and Pb. Then, SC had the highest accumulations of Cu and Ni. HHH had the highest accumulation of Zn.
The contribution of different sources to the heavy metal(loid) inputs is shown in Figure 4. On the whole, the heavy metal(loid) inputs via atmospheric deposition and manures accounted for the larger proportion, while the contributions of fertilizer and irrigation were relatively minor. However, there were significant spatial variations among the regions and elements.
The major source of As, Cd, Cr, Ni, and Pb entering the soil was atmospheric deposition, and the percentages of the total input flux ranged from 12% to 79%, 24% to 78%, 18% to 79%, 22% to 70%, and 56% to 92%, respectively. For PB especially, atmospheric deposition was undoubtedly the most important source. In terms of spatial variation, the northern regions, including NEC and LP, where coal is the main energy consumption and coal-fired heating in winter is required, atmospheric deposition had the highest proportion of As. In the southern regions, such as SB and SYR, with rich mineral resources and developed mining and smelting industries, Cd accounted for more than 70%.
Manure had absolute dominance in terms of Cu and Zn, and the percentages of the total input flux ranged from 30% to 75% and 19% to 53%, respectively. Cu in particular accounted for more than 45% in most regions, except LP. SC, HHH, and MLYR were densely populated, with a high level of urbanization and developed breeding industries; thus, the livestock manure pollution in these areas was more serious. One unanticipated finding was that irrigation played a role in Hg input, whereas irrigation is not usually a mentionable source of heavy metal(loid)s. This was probably because Hg is volatile in the air, so it usually exists in water as various organic compounds.
The variation in the contributions of the three time periods is presented in Figure 5. We maintained our focus on atmospheric deposition and manure, since they were the most important sources. The temporal variation characteristic of the contribution was consistent with the flux. The contribution of atmospheric deposition showed a trend of rising and then falling, or a steady decrease for every element except Cd. The proportion of manure was slightly increased. On the one hand, this was due to the increased manure input flux, but more importantly, the decreased atmospheric deposition flux.

4. Discussions

4.1. Soil Environmental Risk

According to Formula (7) and the assessment standard (Table S5), the distribution of Pi for eight heavy metal(loid)s is presented in Figure 6a. For Cr, Cu, Hg, Ni, and Pb, the Pi of most regions was at level II and a few were at level I, which indicated that the risk of these elements was relatively low and that soil has a certain capacity for heavy metal(loid)s. For As and Zn, the Pi of YGP was at level III and the soil environmental capacity in this region was fairly low. The pollution status of Cd was severe, the Pi of most regions was at levels III and IV, and the worst was in SB and SYR, where the Pi even reached level V, which meant that the soil environmental capacity was overloaded.
The soil environmental capacity can only reflect the current capacity of soil to contain heavy metal(loid)s, and the early warning of soil heavy metal(loid) pollution should also take into account the accumulation rate. The input flux is actually the accumulation rate and it represents the annual growth rate of soil heavy metal(loid)s, which can be used to estimate the time required for the heavy metal(loid)s in the soil to reach the standard limits. It is supposed that the input flux of potential elements entering the soil continues to accumulate at the present rate and all remain at the 0–20 cm depth of the topsoil. The time when the heavy metal(loid) content reaches the limit can be estimated according to Formula (10) (Figure 6b). This reveals that Cd was the element with the greatest risk to the agricultural soil environment for all of China, and the limit will be reached within 235 years, especially in HHH, SYR, and SB, which will take about 50 years. The causes of this serious Cd pollution are different, and in some regions, this is due to high input, while in other regions, this is due to high background. For high-input regions such as SYR, it is essential to identify these pollution sources and the heavy metal(loid) migration and transformation processes in the soil, and to control and reduce heavy metal(loid) emissions in order to prevent the deterioration of soil heavy metal(loid) pollution [104]. For high-background regions such as YGP, it is required that the contaminated soil be repaired while keeping the heavy metal(loid) input from increasing; bioremediation, phytoremediation, and the application of soil amendments are the most commonly used treatment technologies at present [105]. Meanwhile, adjusting the planting structure and selecting low-accumulation varieties to ensure the quality and safety of regional agricultural products are other techniques used [106]. With regard to the elements of Zn, Cu, and As, the limit will be reached in 275–684, 432–1125, and 496–1228 years, respectively. The rest of the elements represent little threat to the soil environment, as the time required to reach their limits is almost over 1000 years. Pb and Hg are also generally considered to be the elements with serious heavy metal(loid) pollution in the soil [107,108]. However, the results of this study show that there is still some time for Pb and Hg to reach their limits, which is because this study was conducted on a large scale, while Pb and Hg pollution is usually caused in individual cases, especially in soil near mining areas. Judging from space, HHH, SC, and MLYR need more attention due to the shorter safety lives of Cd, Zn, Cu, and As compared to other regions.

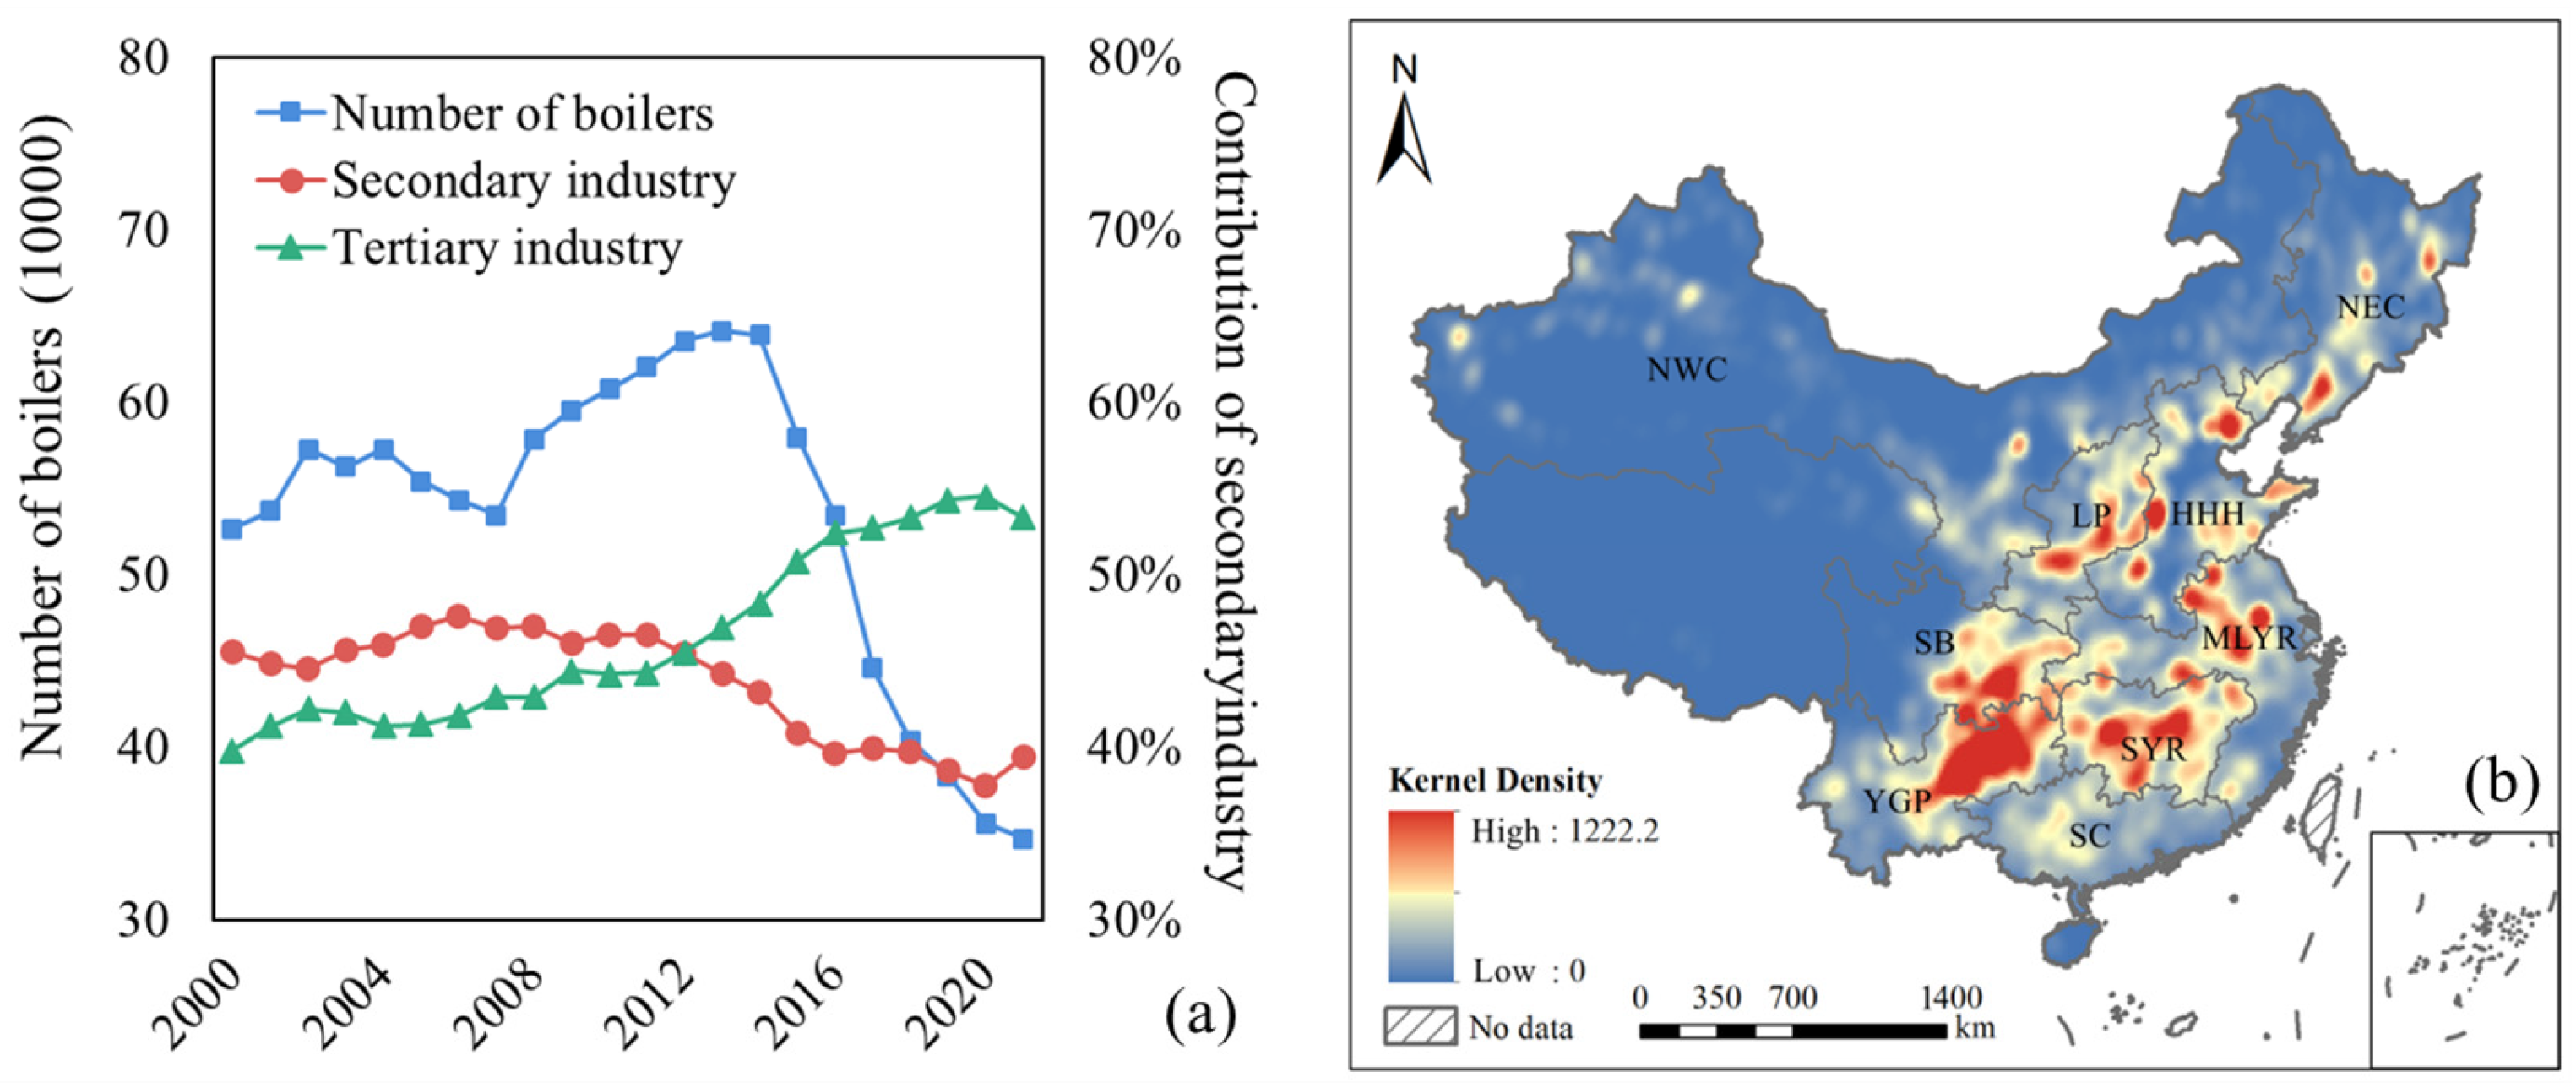
4.2. Boiler Emissions, Mining, and Industrial Structure

It is evident from the results in Section 3.2 that the heavy metal(loid) flux via atmospheric deposition in China has shown a downward trend since 2012, which is related to the emission of atmospheric pollutants, especially the emission of industrial boilers [109]. Figure 7a shows a decrease in the number of industrial boilers in China since 2013, which confirms this trend of atmospheric deposition. This indicates that China has achieved some success in controlling the emissions of air pollutants. However, atmospheric deposition is still the leading source of the heavy metal(loid) pollution in agricultural soil, which is inextricably linked to heavy industry activities, such as mining and smelting.
In general, regions with complex geological structures, such as fault zones and folded zones, find it easy to form nonferrous metal mineral resources; sedimentary areas and karst landforms are also prone to the formation of these mineral resources. Such is the case with the geological structures and natural environments of SB and SYR; this determines that, while they are rich in mineral resources, there are large amounts of long-term mining and smelting activities, and their large regional emissions will inevitably lead to an increase in the input flux of heavy metal(loid)s. As shown in Figure 7b, the mining industry is densely distributed in SYR, SB, and YGP, while its distribution in SC and NWC is sparse. This is consistent with the spatial distribution characteristics of the soil environmental capacity in Figure 6a.
In addition, the relationship between industrial structures and the environment is inseparable. Different from the secondary industry, where most pollutants come from, the agglomeration of the tertiary industry is conducive to reducing environmental pollution; this statistic shows that the proportion of the tertiary industry in China has exceeded that of the secondary industry since 2012 (Figure 7a), and it also explains the decline in heavy metal(loid) deposition fluxes after 2012 [82].

4.3. Effects of Atmospheric Deposition on Crops and Human Health

Although the severity of atmospheric deposition is reflected in the high value of the flux, what is more concerning to us is its strong impact on crops and soil. The fully factorial atmospheric exposure experiment by Liu presented that the heavy metal contents in pak-choi exposed to the deposition area were significantly increased compared to the background area, with 17% to 87% of the heavy metals in pak-choi edible parts being contributed by the new atmospheric deposition and the soil heavy metals from this new atmospheric deposition presenting in high mobile forms compared to those in the original soils [110]. Within a short period, the contents of heavy metals and their weak acid extractable fraction exposed to a high deposition were all increased compared to those exposed in the background area. Over the past 20 years, although the input fluxes of most elements have decreased, Cd has not shown this trend. Judging from the regional distribution characteristics, the Cd input fluxes of SYR and SB are higher than those of other regions, which has a certain effect on the soil environmental quality. As an important rice-producing area, the Cd in some agricultural products from SYR still exceeds the standard, posing a threat to food security. Therefore, it is necessary to avoid the accumulation of atmospheric heavy metals in soil and crop leaves, which can enter the human body through the food chain and cause carcinogenic risk.

4.4. Publication Bias and Uncertainty

In the process of the literature retrieval, some deviations in practice were inevitable. To avoid publication bias, a wide range of relevant research was collected in this study through multiple databases to reduce the impact of an incomplete literature collection in a single database. Although this study collected as much data as possible and screened them for quality control, there are still some uncertainties and limitations. (1) Spatial bias: Figure 1 presents the locations in the collected publications. Compared to other regions, few studies focused on NWC and YGP because they are remote, sparsely populated, and not major grain-producing areas. Currently, the research on the soil heavy metal(loid) pollution in these remote areas only stays at the status of the soil heavy metal(loid) occurrence and there is a lack of research on its input flux; (2) Temporal bias: the lack of long-term monitoring of these heavy metal(loid) input fluxes in an individual study area leads to discontinuous observation data; thus, they cannot accurately describe the characteristics of flux timing changes; and (3) Research object bias: Table S1 indicates that most researchers have been absorbed with the elements of Cd and Pb, since these two elements are generally considered to be higher-risk elements in China’s soils [9]. Finally, 109 publications were collected, with 594 sampling sites covering 26 provinces. Publication bias has been avoided as much as possible and the results are relatively reliable and accurate.
In addition to publication bias, there may also be some uncertainties and limitations in the details. For example, indirect calculations of heavy metal input fluxes via manure may lead to local overestimations or underestimations; the lack of a spatial characteristics analysis of nested structures at different scales may cause different conclusions from the actual state on a small scale [111]. Only the most important sources of heavy metals were discussed and factors that have a low impact, such as agrochemical factors, or are not applied universally, such as industrial waste and sludge, were not counted. However, from a macroscopic view, this study reflects the pathways and variations of soil heavy metal(loid) pollution from the perspective of external inputs, providing insights on both time and space. Its conclusions and rules are universal, which has guiding significance for the zoning control of heavy metal(loid) pollution in agricultural soil. The research methods of heavy metal input and the assessment of the soil environmental risks in this study also have certain references for countries in the same economic development stage and environmental pollution situation.

5. Conclusions

Considering the spatial heterogeneity of the soil heavy metal(loid) input and weight of the sampling areas, the heavy metal(loid) input flux, the contribution of pollution sources, and the risk of major pollutants in agricultural soil over the past two decades were systematically analyzed. The heavy metal(loid) input flux via atmospheric deposition has shown a downward trend since 2012, but its risk remains, as it is still the main pollution source of heavy metal(loid)s in soil. Cd is the element with the greatest risk nationwide and enterprises should strictly implement the emission standards of pollutants to achieve ultra-low emissions. As important grain-producing areas, focus on HHH, SC, and MLYR is required. It is not only necessary to limit the discharge of air pollutants, but also to control the heavy metal(loid) pollution from manure.

Supplementary Materials

The following supporting information can be downloaded at: https://www.mdpi.com/article/10.3390/land12061240/s1, Figure S1: The LISA of heavy metal input flux via atmospheric deposition, fertilizer, irrigation; Figure S2: The LISA of Cd input flux via atmospheric deposition in different periods; Figure S3: Heavy metal content in livestock and poultry excrements (2000–2021); Table S1: Descriptive statistics of heavy metal input fluxes in China; Table S2: Comparison of researches on atmospheric deposition fluxes of heavy metals in China; Table S3: Agricultural utilization rate of livestock and poultry manures in China; Table S4: Parameters of livestock and poultry excrements; Table S5: Assessment standards of soil environmental capacity; Table S6: Risk screening values for soil contamination of agricultural land.

Author Contributions

Validation, X.L.; Writing—original draft, W.M.; Writing—review & editing, C.L.; Visualization, L.X.; Supervision, Y.P. and Z.S.; Project administration, Y.G. All authors have read and agreed to the published version of the manuscript.

Funding

The study is supported by the National Key Research and Development Program of China (2023YFD1700105), the National Natural Science Foundation of China (42077001), and the Science and Technology Innovation Capacity Construction Project of Beijing Academy of Agriculture and Forestry Sciences (KJCX20230309).

Data Availability Statement

Not applicable.

Conflicts of Interest

The authors declare no conflict of interest.

References

  1. Hou, Q.; Yang, Z.; Ji, J.; Yu, T.; Chen, G.; Li, J.; Xia, X.; Zhang, M.; Yuan, X. Annual net input fluxes of heavy metals of the agro-ecosystem in the Yangtze River delta, China. J. Geochem. Explor. 2014, 139, 68–84. [Google Scholar] [CrossRef]
  2. Yang, Y.; Xiao, C.; Wang, F.; Peng, L.; Zeng, Q.; Luo, S. Assessment of the potential for phytoremediation of cadmium polluted soils by various crop rotation patterns based on the annual input and output fluxes. J. Hazard. Mater. 2022, 423, 127–183. [Google Scholar] [CrossRef] [PubMed]
  3. Sall, M.L.; Diaw, A.K.D.; Gningue-Sall, D.; Efremova Aaron, S.; Aaron, J. Toxic heavy metals: Impact on the environment and human health, and treatment with conducting organic polymers, a review. Environ. Sci. Pollut. Res. 2020, 27, 29927–29942. [Google Scholar] [CrossRef] [PubMed]
  4. Lu, J.; Wang, Z.; Chi, F.; Bing, L.; Wang, M. Present Situation, Potential and countermeasures of Livestock Manure Recycling in the Circular Agriculture: A Case in Liaozhong County. Ecol. Econ. 2015, 31, 107–113. [Google Scholar]
  5. Wang, P.; Chen, H.; Kopittke, P.M.; Zhao, F. Cadmium contamination in agricultural soils of China and the impact on food safety. Environ. Pollut. 2019, 249, 1038–1048. [Google Scholar] [CrossRef] [PubMed]
  6. Zhang, X.; Yang, L.; Li, Y.; Li, H.; Wang, W.; Ye, B. Impacts of lead/zinc mining and smelting on the environment and human health in China. Environ. Monit. Assess. 2012, 184, 2261–2273. [Google Scholar] [CrossRef]
  7. Zhou, Z.; Lu, Y.; Pi, H.; Gao, P.; Li, M.; Zhang, L.; Pei, L.; Mei, X.; Liu, L.; Zhao, Q.; et al. Cadmium exposure is associated with the prevalence of dyslipidemia. Cell. Physiol. Biochem. 2016, 40, 633–643. [Google Scholar] [CrossRef]
  8. Cadmium in 2018 (XLSX). 2021. Available online: https://www.usgs.gov/media/files/cadmium-2018-xlsx (accessed on 1 June 2022).
  9. MEP. Report on the National Soil Pollution Survey; Ministry of Environmental Protection of the PRC: Beijing, China, 2014.
  10. Hu, W.; Huang, B.; Shi, X.; Chen, W.; Zhao, Y.; Jiao, W. Accumulation and health risk of heavy metals in a plot-scale vegetable production system in a peri-urban vegetable farm near Nanjing, China. Ecotox. Environ. Safe. 2013, 98, 303–309. [Google Scholar] [CrossRef]
  11. Nicholson, F.A.; Smith, S.R.; Alloway, B.J.; Carlton-Smith, C.; Chambers, B.J. An inventory of heavy metals inputs to agricultural soils in England and Wales. Sci. Total Environ. 2003, 311, 205–219. [Google Scholar] [CrossRef]
  12. Desaules, A. Critical evaluation of soil contamination assessment methods for trace metals. Sci. Total Environ. 2012, 426, 120–131. [Google Scholar] [CrossRef]
  13. Li, X.; Feng, L. Multivariate and geostatistical analyzes of metals in urban soil of Weinan industrial areas, Northwest of China. Atmos. Environ. 2012, 47, 58–65. [Google Scholar] [CrossRef]
  14. Marrugo-Negrete, J.; Pinedo-Hernández, J.; Díez, S. Assessment of heavy metal pollution, spatial distribution and origin in agricultural soils along the Sinú River Basin, Colombia. Environ. Res. 2017, 154, 380–388. [Google Scholar] [CrossRef] [PubMed]
  15. Feng, W.; Guo, Z.; Peng, C.; Xiao, X.; Shi, L.; Han, X.; Ran, H. Modelling mass balance of cadmium in paddy soils under long term control scenarios. Environ. Sci. Process. Impacts 2018, 20, 1158–1166. [Google Scholar] [CrossRef] [PubMed]
  16. Vareda, J.P.; Valente, A.J.M.; Durães, L. Assessment of heavy metal pollution from anthropogenic activities and remediation strategies: A review. J. Environ. Manag. 2019, 246, 101–118. [Google Scholar] [CrossRef] [PubMed]
  17. Yan, X.; Zhao, W.; Yang, X.; Liu, C.; Zhou, Y. Input–output balance of cadmium in typical agriculture soils with historical sewage irrigation in China. J. Environ. Manag. 2020, 276, 111298. [Google Scholar] [CrossRef]
  18. Yi, K.; Fan, W.; Chen, J.; Jiang, S.; Huang, S.; Peng, L.; Zeng, Q.; Luo, S. Annual input and output fluxes of heavy metals to paddy fields in four types of contaminated areas in Hunan Province, China. Sci. Total Environ. 2018, 634, 67–76. [Google Scholar] [CrossRef] [PubMed]
  19. UBA. Länderübergreifende Auswertung von Daten der Boden- und Dauerbeobachtung der Länder. Available online: https://www.umweltbundesamt.de/en/publikationen/laenderuebergreifende-auswertung-von-daten-boden (accessed on 1 June 2022).
  20. UKCEH. Countryside Survey. Available online: https://countrysidesurvey.org.uk/publications/technical-reports (accessed on 1 June 2022).
  21. Belon, E.; Boisson, M.; Deportes, I.Z.; Eglin, T.K.; Feix, I.; Bispo, A.O.; Galsomies, L.; Leblond, S.; Guellier, C.R. An inventory of trace elements inputs to French agricultural soils. Sci. Total Environ. 2012, 439, 87–95. [Google Scholar] [CrossRef]
  22. Shi, T.; Ma, J.; Wu, X.; Ju, T.; Lin, X.; Zhang, Y.; Li, X.; Gong, Y.; Hou, H.; Zhao, L.; et al. Inventories of heavy metal inputs and outputs to and from agricultural soils: A review. Ecotox. Environ. Saf. 2018, 164, 118–124. [Google Scholar] [CrossRef]
  23. Peng, C.; Wang, M.; Chen, W.; Chang, A.C.; Crittenden, J.C. Mass balance-based regression modeling of Cd and Zn accumulation in urban soils of Beijing. J. Environ. Sci. China 2017, 53, 99–106. [Google Scholar] [CrossRef]
  24. Shi, T.; Ma, J.; Wu, F.; Ju, T.; Gong, Y.; Zhang, Y.; Wu, X.; Hou, H.; Zhao, L.; Shi, H. Mass balance-based inventory of heavy metals inputs to and outputs from agricultural soils in Zhejiang Province, China. Sci. Total Environ. 2019, 649, 1269–1280. [Google Scholar] [CrossRef]
  25. Wang, S.; Zhang, Y.; Cheng, J.; Li, Y.; Li, F.; Li, Y.; Shi, Z. Pollution assessment and source apportionment of soil heavy metals in a coastal industrial city, Zhejiang, southeastern China. Int. J. Environ. Res. Public Health 2022, 19, 3335. [Google Scholar] [CrossRef]
  26. Xie, Y.; Zhu, J.; Liu, S.; Pan, S.; Ji, X. Input and output of cadmium (Cd) for paddy soil in central south China: Fluxes, mass balance, and model predictions. Environ. Sci. Pollut. Res. 2020, 27, 21847–21858. [Google Scholar] [CrossRef] [PubMed]
  27. Cai, K.; Li, C. Ecological risk, input flux, and source of heavy metals in the agricultural plain of Hebei Province, China. Int. J. Environ. Res. Public Health 2022, 19, 2288. [Google Scholar] [CrossRef] [PubMed]
  28. Chen, L.; Zhou, S.; Wu, S.; Wang, C.; Li, B.; Li, Y.; Wang, J. Combining emission inventory and isotope ratio analyses for quantitative source apportionment of heavy metals in agricultural soil. Chemosphere 2018, 204, 140–147. [Google Scholar] [CrossRef] [PubMed]
  29. Zhou, Y.; Jia, Z.; Wang, J.; Chen, L.; Zou, M.; Li, Y.; Zhou, S. Heavy metal distribution, relationship and prediction in a wheat-rice rotation system. Geoderma 2019, 354, 113886. [Google Scholar] [CrossRef]
  30. Yang, Y.; Li, Y.; Dai, Y.; Wang, M.; Chen, W.; Wang, T. Historical and future trends of cadmium in rice soils deduced from long-term regional investigation and probabilistic modeling. J. Hazard. Mater. 2021, 415, 125746. [Google Scholar] [CrossRef]
  31. Luo, L.; Ma, Y.; Zhang, S.; Wei, D.; Zhu, Y. An inventory of trace element inputs to agricultural soils in China. J. Environ. Manag. 2009, 90, 2524–2530. [Google Scholar] [CrossRef]
  32. Ye, S.; Song, C.; Shen, S.; Gao, P.; Cheng, C.; Cheng, F.; Wan, C.; Zhu, D. Spatial pattern of arable land-use intensity in China. Land Use Policy 2020, 99, 104845. [Google Scholar] [CrossRef]
  33. Liu, C.; Song, C.; Ye, S.; Cheng, F.; Zhang, L.; Li, C. Estimate provincial-level effectiveness of the arable land requisition-compensation balance policy in mainland China in the last 20 years. Land Use Policy 2023, 131, 106733. [Google Scholar] [CrossRef]
  34. Arabi, Z.; Rinklebe, J.; El-Naggar, A.; Hou, D.; Sarmah, A.K.; Moreno-Jiménez, E. (Im)mobilization of arsenic, chromium, and nickel in soils via biochar: A meta-analysis. Environ. Pollut. 2021, 286, 117199. [Google Scholar] [CrossRef]
  35. Huang, Y.; Wang, L.; Wang, W.; Li, T.; He, Z.; Yang, X. Current status of agricultural soil pollution by heavy metals in China: A meta-analysis. Sci. Total Environ. 2019, 651, 3034–3042. [Google Scholar] [CrossRef] [PubMed]
  36. Shao, D.; Zhan, Y.; Zhou, W.; Zhu, L. Current status and temporal trend of heavy metals in farmland soil of the Yangtze River Delta Region: Field survey and meta-analysis. Environ. Pollut. 2016, 219, 329–336. [Google Scholar] [CrossRef] [PubMed]
  37. Yuan, X.; Xue, N.; Han, Z. A meta-analysis of heavy metals pollution in farmland and urban soils in China over the past 20 years. J. Environ. Sci. China 2021, 101, 217–226. [Google Scholar] [CrossRef]
  38. Ren, S.; Song, C.; Ye, S.; Cheng, C.; Gao, P. The spatiotemporal variation in heavy metals in China’s farmland soil over the past 20 years: A meta-analysis. Sci. Total Environ. 2022, 806, 150322. [Google Scholar] [CrossRef]
  39. MOA. China Agriculture Yearbook; China Agriculture Press: Beijing, China, 2019. [Google Scholar]
  40. Bao, W.; Liu, J.; An, J.; Xie, G. Value-taking of livestock and poultry excreta factor in China. J. China Agric. Univ. 2018, 23, 1–14. [Google Scholar]
  41. Bao, W.; Liu, J.; An, J.; Xie, G. Discussion on value-taking of relative parameters for assessment of livestock and poultry excrement resource in China. Trans. Chin. Soc. Agric. Eng. 2018, 34, 314–322. [Google Scholar]
  42. Wang, J.; Xu, C. Geodetector: Principle and prospective. Acta Geogr. Sin. 2017, 72, 116–134. [Google Scholar]
  43. Wang, J.F.; Li, X.H.; Christakos, G.; Liao, Y.L.; Zhang, T.; Gu, X.; Zheng, X.Y. Geographical Detectors-Based Health Risk Assessment and its Application in the Neural Tube Defects Study of the Heshun Region, China. Int. J. Geogr. Inf. Sci. 2010, 24, 107–127. [Google Scholar] [CrossRef]
  44. Liang, F.; Pan, Y.; Peng, H.; Zeng, M.; Huang, C. Time-space simulation, health risk warning and policy recommendations of environmental capacity for heavy metals in the Pearl River Basin, China. Int. J. Environ. Res. Public Health 2022, 19, 4694. [Google Scholar] [CrossRef]
  45. Lv, Y.; Xie, L.; Zhu, W.; Zhou, Y.; Sun, H. Risk prediction of heavy metals in farmland soil based on environmental capacity: Case study of the county scale in Northern Zhejiang Province. Resour. Environ. Yangtze Basin 2020, 29, 253–264. [Google Scholar]
  46. Pan, Y.; Ding, L.; Xie, S.; Zeng, M.; Zhang, J.; Peng, H. Spatiotemporal simulation, early warning, and policy recommendations of the soil heavy metal environmental capacity of the agricultural land in a typical industrial city in China: Case of Zhongshan City. J. Clean. Prod. 2021, 285, 124849. [Google Scholar] [CrossRef]
  47. Zeng, Y.; Lu, Q.; Zhao, Q.; Ma, Z.; Zhou, P. Assessment of environmental capacity based on arcgis in core area of Changsha-Zhuzhou-Xiangtan urban group. Resour. Environ. Yangtze Basin 2012, 21, 1542–1548. [Google Scholar]
  48. Chai, H.; He, N. Evaluation of soil bulk density in Chinese terrestrial ecosystems for determination of soil carbon storage on a regional scale. Acta Ecol. Sin. 2016, 36, 3903–3910. [Google Scholar]
  49. MEE. GB15618-2018; Soil Environmental Quality Risk Control Standard for Soil Contamination of Agricultural Land. Ministry of Ecology and Environment of the PRC: Beijing, China, 2018.
  50. Chen, T.; Zheng, Y.; Chen, H.; Zheng, G. Background concentrations of soil heavy metals in Beijing. Environ. Sci. 2004, 15, 117–122. [Google Scholar]
  51. MEE; CNEMC. Background Values of Soil Elements in China; China Environmental Science Press: Beijing, China, 1990. [Google Scholar]
  52. Chen, Q.; Gao, Y.; Ni, R.; Pan, Y.; Yan, Y.; Yang, J.; Liu, X.; Gu, X. Temporal and spatial variation characteristics of heavy metal in atmospheric deposition in china from 2000 to 2018. Environ. Sci. 2022, 43, 4413–4424. [Google Scholar]
  53. Cliff, A.D.; Ord, J.K. Spatial Processes: Models and Applications; Pion Ltd: London, UK, 1981. [Google Scholar]
  54. Anselin, L. Local Indicators of Spatial Association—LISA. Geogr. Anal. 1995, 27, 93–115. [Google Scholar] [CrossRef]
  55. Guo, S.; Wu, B.; Li, B.; Zhang, L.; Jing, G. Draft of soil environmental quality regionalization of China. Acta Sci. Circumstantiae 2017, 37, 3127–3138. [Google Scholar]
  56. Liu, B. A research on the economic regionalizing of China. China Soft Sci. 2009, 2, 81–90. [Google Scholar]
  57. Zheng, J.; Ying, Y.; Li, B. A new scheme for climate regionalization in China. Acta Geogr. Sin. 2010, 65, 3–12. [Google Scholar]
  58. Pan, Y.P.; Wang, Y.S. Atmospheric wet and dry deposition of trace elements at 10 sites in Northern China. Atmos. Chem. Phys. 2015, 15, 951–972. [Google Scholar] [CrossRef] [Green Version]
  59. Tang, Y.; Han, G. Characteristics of major elements and heavy metals in atmospheric dust in Beijing, China. J. Geochem. Explor. 2017, 176, 114–119. [Google Scholar] [CrossRef]
  60. Tian, H.Z.; Zhu, C.Y.; Gao, J.J.; Cheng, K.; Hao, J.M.; Wang, K.; Hua, S.B.; Wang, Y.; Zhou, J.R. Quantitative assessment of atmospheric emissions of toxic heavy metals from anthropogenic sources in China: Historical trend, spatial distribution, uncertainties, and control policies. Atmos. Chem. Phys. 2015, 15, 10127–10147. [Google Scholar] [CrossRef] [Green Version]
  61. Ni, R.; Ma, Y. Current inventory and changes of the input/output balance of trace elements in farmland across China. PLoS ONE 2018, 13, e199460. [Google Scholar] [CrossRef] [Green Version]
  62. Wang, M.; Yuan, M.; Su, D. Characteristics and spatial-temporal variation of heavy metals in atmospheric dry and wet deposition of China. China Environ. Sci. 2017, 37, 4085–4096. [Google Scholar]
  63. Peng, H.; Chen, Y.; Weng, L.; Ma, J.; Ma, Y.; Li, Y.; Islam, M.S. Comparisons of heavy metal input inventory in agricultural soils in North and South China: A review. Sci. Total Environ. 2019, 660, 776–786. [Google Scholar] [CrossRef] [PubMed]
  64. Muezzinoglu, A.; Cizmecioglu, S.C. Deposition of heavy metals in a Mediterranean climate area. Atmos. Res. 2006, 81, 1–16. [Google Scholar] [CrossRef]
  65. Weerasundara, L.; Amarasekara, R.W.K.; Magana-Arachchi, D.N.; Ziyath, A.M.; Karunaratne, D.G.G.P.; Goonetilleke, A.; Vithanage, M. Microorganisms and heavy metals associated with atmospheric deposition in a congested urban environment of a developing country: Sri Lanka. Sci. Total Environ. 2017, 584–585, 803–812. [Google Scholar] [CrossRef] [PubMed] [Green Version]
  66. Castillo, S.; de la Rosa, J.D.; Sánchez De La Campa, A.M.; González-Castanedo, Y.; Fernández-Camacho, R. Heavy metal deposition fluxes affecting an Atlantic coastal area in the southwest of Spain. Atmos. Environ. 2013, 77, 509–517. [Google Scholar] [CrossRef]
  67. Kyllönen, K.; Karlsson, V.; Ruoho-Airola, T. Trace element deposition and trends during a ten year period in Finland. Sci. Total Environ. 2009, 407, 2260–2269. [Google Scholar] [CrossRef]
  68. Mijić, Z.; Stojić, A.; Perišić, M.; Rajšić, S.; Tasić, M.; Radenković, M.; Joksić, J. Seasonal variability and source apportionment of metals in the atmospheric deposition in Belgrade. Atmos. Environ. 2010, 44, 3630–3637. [Google Scholar] [CrossRef]
  69. Motelay-Massei, A.; Ollivon, D.; Tiphagne, K.; Garban, B. Atmospheric bulk deposition of trace metals to the Seine river Basin, France: Concentrations, sources and evolution from 1988 to 2001 in Paris. Water Air Soil Pollut. 2005, 164, 119–135. [Google Scholar] [CrossRef]
  70. Six, L.; Smolders, E. Future trends in soil cadmium concentration under current cadmium fluxes to European agricultural soils. Sci. Total Environ. 2014, 485–486, 319–328. [Google Scholar] [CrossRef] [PubMed]
  71. Yang, Z.; Lu, W.; Long, Y. Atmospheric dry and wet deposition of heavy metals in Changchun City, China. Res. Environ. Sci. 2009, 22, 28–34. [Google Scholar]
  72. Tang, Q.; Yang, Z.; Zhang, B.; Feng, H.; Wang, H. A study of elements flux and sources from atmospheric bulk deposition in the Chengdu economic region. Earth Sci. Front. 2007, 14, 213–222. [Google Scholar]
  73. Feng, W.; Guo, Z.; Xiao, X.; Peng, C.; Shi, L.; Ran, H.; Xu, W. Atmospheric deposition as a source of cadmium and lead to soil-rice system and associated risk assessment. Ecotox. Environ. Saf. 2019, 180, 160–167. [Google Scholar] [CrossRef]
  74. Sakata, M.; Tani, Y.; Takagi, T. Wet and dry deposition fluxes of trace elements in Tokyo Bay. Atmos. Environ. 2008, 42, 5913–5922. [Google Scholar] [CrossRef]
  75. Si, Y.D.; Wang, H.M.; Cai, K.; Chen, L.F.; Zhou, Z.C.; Li, S.S. Long-term (2006–2015) variations and relations of multiple atmospheric pollutants based on multi-remote sensing data over the North China Plain. Environ. Pollut. 2019, 255, 113323. [Google Scholar] [CrossRef]
  76. Zhou, L.; Zhou, C.; Yang, F.; Che, L.; Wang, B.; Sun, D. Spatio-temporal evolution and the influencing factors of PM2.5 in China between 2000 and 2015. J. Geogr. Sci. 2019, 29, 253–270. [Google Scholar] [CrossRef] [Green Version]
  77. MEP. GB13223-2011; Emission Standards of Air Pollutants for Thermal Power Plants. Ministry of Environmental Protection of the PRC: Beijing, China, 2011.
  78. MEP. 12th Five-Year Plan for the Prevention and Control of Air Pollution in Crucial Regions; Ministry of Environmental Protection of the PRC: Beijing, China, 2012.
  79. SCPRC. Action Plan of Air Pollution Prevention and Control; State Council of the RPC: Beijing, China, 2013.
  80. Hou, J.; Shen, Y.; Cao, S.; Cheng, X.; Wang, W. Geochemical study of atmospheric dry and wet deposition in Tianjin City. Geol. Surv. Res. 2013, 36, 131–135. [Google Scholar]
  81. Wang, W.; Cao, S.; Li, G.; Zhang, Y. Sedimentation flux and its evaluation of dry and wet atmospheric deposition of heavy metal elements in north Tianjin. Environ. Sci. Manag. 2017, 42, 46–51. [Google Scholar]
  82. NBSC. China Statistical Yearbook 2013; China Statistics Press: Beijing, China, 2013.
  83. Chen, L.; Ni, W.; Li, X.; Sun, J. Investigation of heavy metal concentrations in commercial fertilizers commonly-used. J. Zhejiang Sci. Tech. Univ. 2009, 26, 223–227. [Google Scholar]
  84. Nziguheba, G.; Smolders, E. Inputs of trace elements in agricultural soils via phosphate fertilizers in European countries. Sci. Total Environ. 2008, 390, 53–57. [Google Scholar] [CrossRef] [PubMed]
  85. Qiu, H. Regional differences and development tendency of livestock manure pollution in China. Environ. Sci. 2013, 34, 2766–2774. [Google Scholar]
  86. Mu, H.; Zhuang, Z.; Li, Y.; Qiao, Y.; Chen, Q.; Xiong, J.; Guo, L.; Jiang, R.; Li, H. Heavy metal contents in animal manure in China and the related soil accumulation risks. Environ. Sci. 2020, 41, 986–996. [Google Scholar]
  87. Yuan, K.; Xiong, S.; Liang, J.; Li, Y.; Qiao, Y.; Li, H.; Chen, Q. Status and risk analysis of copper and zinc pollution in livestock manure. J. Agro-Environ. Sci. 2020, 39, 1837–1842. [Google Scholar]
  88. MOA. The Safety Specification for Feed Additives; Ministry of Agriculture of the PRC: Beijing, China, 2009.
  89. MOA. NY525-2012; Organic Fertilizer. Ministry of Agriculture of the PRC: Beijing, China, 2012.
  90. SCPRC. The Opinions on Accelerating the Utilization of Livestock and Poultry Waste Resources; State Council of the PRC: Beijing, China, 2017.
  91. Ren, J. Preliminary Research on Effects and Controls of Irrigation Water on Heavy Metal Pollution of Farmlands. Master’s Thesis, Lanzhou Jiaotong University, Lanzhou, China, April 2020. [Google Scholar]
  92. Li, Q.; Tang, J.; Wang, T.; Wu, D. Impacts of sewage irrigation on soil properties of farmland in China: A review. Solid Earth 2017, 87, 1–24. [Google Scholar] [CrossRef] [Green Version]
  93. Geng, Y.; Zhang, C.; Zhang, Y.; Huang, D.; Yan, S.; Sun, T.; Wang, J.; Mao, Y. Heavy metal(loid)s in sewage sludge in China: Concentrations and spatial-temporal variations. Environ. Sci. Pollut. R. 2021, 28, 29146–29156. [Google Scholar] [CrossRef]
  94. Wang, H. Development history and future prospects of sewage treatment industry in China. Environ. Prot. 2012, 15, 19–22. [Google Scholar]
  95. Wang, H. Wastewater recycling is the fundamental way to break through development. Water Wastewater Eng. 2021, 57, 1–5. [Google Scholar]
  96. NDRC. 14th Five-Year Plan of Urban Sewage Treatment and Resource Utilization Development; National Development and Reform Commission of the PRC: Beijing, China, 2021.
  97. SEPA. GB18918-2002; Discharge Standard of Pollutants for Municipal Wastewater Treatment Plant. State Environmental Protection Administration of the PRC: Beijing, China, 2002.
  98. MEP. GB25466-2010; Emission Standard of Pollutants for Lead and Zinc Industry. Ministry of Environmental Protection of the PRC: Beijing, China, 2010.
  99. MEP. GB30770-2014; Emission Standards of Pollutants for Stannum, Antimony and Mercury Industries. Ministry of Environmental Protection of the PRC: Beijing, China, 2014.
  100. Gong, Z.; Huang, R.; Zhang, G. Soil Geography of China; Science Press: Beijing, China, 2014. [Google Scholar]
  101. Khatri, N.; Tyagi, S. Influences of natural and anthropogenic factors on surface and groundwater quality in rural and urban areas. Front. Life Sci. 2015, 8, 23–39. [Google Scholar] [CrossRef]
  102. Jaskuła, J.; Sojka, M.; Fiedler, M.; Wróżyński, R. Analysis of Spatial Variability of River Bottom Sediment Pollution with Heavy Metals and Assessment of Potential Ecological Hazard for the Warta River, Poland. Minerals 2021, 11, 327. [Google Scholar] [CrossRef]
  103. Zhang, J.; Li, X.; Guo, L.; Deng, Z.; Wang, D.; Liu, L. Assessment of heavy metal pollution and water quality characteristics of the reservoir control reaches in the middle Han River, China. Sci. Total Environ. 2021, 799, 149472. [Google Scholar] [CrossRef] [PubMed]
  104. Yu, B.; Wu, K. Eco-risk regionalization and control of heavy metal in soil with high background value. Acta Agric. Univ. Jiangxiensis 2018, 40, 629–634. [Google Scholar]
  105. Chuan, L.; Zhao, T.; Zheng, H.; Zhao, J.; Zhang, X.; Tan, C.; Li, G. Research advances in remediation of heavy metal contaminated soils. Environ. Sci. Technol. 2014, 37, 213–222. [Google Scholar]
  106. Yao, H.; Yang, T.; He, L.; Wu, J.; Yang, Z.; Wei, H. Assessment of heavy metal pollution and potential ecological risks of the soils in karst farmland with high background levels of cadmium and arsenic in Eastern Yunnan. J. Northwest For. Univ. 2022, 37, 29–36. [Google Scholar]
  107. Liu, F.; Li, L.; Liu, Y.; Wei, J.; Hou, Z.; Chen, R.; Zhang, X. Evaluation and sources of heavy metal pollution in soils of cultivated land around a lead-zinc mine area in Hebei province. J. Arid. Land Resour. Environ. 2023, 37, 136–142. [Google Scholar]
  108. Shi, H.; Wang, P.; Zheng, J.; Xiao, R.; Deng, Y.; Zhuang, C. Spatial distribution of soil heavy metals and regional control strategies in china at province level. Environ. Sci. 2022, 1–17. [Google Scholar]
  109. Yue, T. Study on Temporal-Spatial Characteristics and Abatement Potential of Air Pollutants Emission from Industrial Boilers of China; Zhejiang University: Hangzhou, China, 2019. [Google Scholar]
  110. Liu, H.; Zhou, J.; Li, M.; Xia, R.; Wang, X.; Zhou, J. Dynamic behaviors of newly deposited atmospheric heavy metals in the soil-pak choi system. Environ. Sci. Technol. 2022, 56, 12734–12744. [Google Scholar] [CrossRef]
  111. Qiao, P.; Wang, S.; Lei, M.; Guo, G.; Yang, J.; Wei, Y.; Gou, Y.; Li, P.; Zhang, Z. Influencing factors identification and the nested structure analysis of heavy metals in soils in entire city and surrounding the multiple pollution sources. J. Hazard. Mater. 2023, 449, 130961. [Google Scholar] [CrossRef]
Figure 1. Distribution of sampling sites and sample size. HHH: Huang-Huai-Hai, LP: Loess Plateau, MLYR: Middle and Lower Reaches of Yangtze River, NEC: Northeast China, NWC: Northwest China, SB: Sichuan Basin, SC: South China, SYR: South of the Yangtze River, YGP: Yunnan Guizhou Plateau, AD: Atmospheric Deposition, Fert: Fertilizer, Irrig: Irrigation, N: Sites, and n: Samples.
Land 12 01240 g001
Figure 2. Time variation in heavy metal(loid) deposition in three periods.
Land 12 01240 g002
Figure 3. Total input fluxes of heavy metal(loid)s in different regions (mg/m2/yr).
Land 12 01240 g003
Figure 4. Contributions of different sources of total heavy metal(loid) input in 9 regions.
Land 12 01240 g004
Figure 5. Temporal variation in heavy metal(loid) source contribution in three periods (2000–2006, 2007–2012, and 2013–2021).
Land 12 01240 g005
Figure 6. Spatiotemporal risk of heavy metal(loid)s in agricultural soils: (a) spatial risk: the distribution of soil environmental capacity; and (b) temporal risk: estimated time required for each heavy metal(loid)s to reach the standard limits (yr).
Land 12 01240 g006
Figure 7. The effect of boiler emissions, mining, and industrial structure: (a) number of industrial boilers and contribution of the industry in GDP from 2000 to 2021; and (b) kernel density of the mining distribution.
Land 12 01240 g007
Table 1. The spatial autocorrelation of heavy metal(loid) input flux via atmospheric deposition, fertilizer, and irrigation.
Atmospheric DepositionFertilizerIrrigation
Moran’s IzpMoran’s IzpMoran’s Izp
As0.255.5800.213.9300.375.310
Cd0.397.5300.213.7600.416.020
Cr0.183.7600.324.8200.456.240
Cu0.193.4300.527.3800.324.660
Hg0.215.100.589.3500.538.520
Ni0.091.260.210.091.080.280.657.470
Pb0.142.9700.071.630.10.457.490
Zn0.173.200.081.220.220.334.480
Table 2. Spatiotemporal heterogeneity of heavy metal(loid) input fluxes (q-statistic).
Atmospheric DepositionFertilizerIrrigation
PeriodRegionInteractionPeriodRegionInteractionPeriodRegionInteraction
As0.0560.195 ***0.423 ***0.0470.248 **0.308 ***0.0560.352 ***0.451 ***
Cd0.028 **0.183 **0.460 ***0.081 **0.232 ***0.344 ***0.0060.181 ***0.418 ***
Cr0.305 ***0.271 ***0.443 ***0.1260.468 **0.488 ***0.182 *0.535 ***0.566 ***
Cu0.067 **0.1370.354 ***0.206 **0.415 ***0.553 ***0.125 *0.363 ***0.656 ***
Hg0.0460.237 **0.592 ***0.249 ***0.292 ***0.595 ***0.196 **0.408 **0.904 ***
Ni0.369 ***0.263 **0.513 ***0.0010.3430.548 ***0.247 *0.814* **0.833 ***
Pb0.073 ***0.182 ***0.489 ***0.0590.165 *0.305 ***0.123 ***0.138 *0.493 ***
Zn0.0420.0780.252 ***0.0310.1290.2030.0470.25 *0.469 ***
Note: * p < 0.05; ** p < 0.01; and *** p < 0.001.
Table 4. Heavy metal(loid) input fluxes of fertilizer (mg/m2/yr).
Region/CountryPeriodAsCdCrCuHgNiPbZnRef.
NEC2000–20210.630.040.590.680.003-0.226.33This
study
SC2000–20210.470.111.882.380.0270.761.577.09
HHH2000–20211.010.11.571.130.0191.40.976.07
LP2000–20210.660.04-0.510.022-1.66-
SYR2000–20210.160.030.810.730.0130.180.245.48
SB2000–20210.680.082.761.20.0110.990.84.26
NWC2000–2021--------
YGP2000–2021--------
MLYR2000–20210.390.020.910.60.0030.280.492.5
China2000–20210.590.051.021.040.0120.90.775.14
England and Wales20000.120.171.760.69<0.10.360.143.67[11]
Europe (Phosphate)1999–20000.230.162.07--0.360.14.31[84]
Note: - No data.
Table 5. Heavy metal(loid) input fluxes of livestock and poultry manure (mg/m2/yr).
Region/CountryPeriodAsCdCrCuHgNiPbZnRef.
NEC2000–20210.450.134.1114.980.0091.271.244.19This
study
SC2000–20210.780.184.9732.030.0131.641.479.72
HHH2000–20210.860.257.5132.050.0192.342.1186.94
LP2000–20210.170.041.147.10.0040.40.3617.25
SYR2000–20210.570.133.5724.770.0091.170.9657.84
SB2000–20210.490.113.0423.20.0091.010.7750.23
NWC2000–20210.270.112.758.620.01511.1226.74
YGP2000–20210.330.071.7515.030.0060.620.5433.58
MLYR2000–20210.860.236.6732.410.0162.181.8686.64
China2000–20210.60.164.6523.120.0131.511.3560.38
England and Wales20006.171.8817.9453.40.127.423.71131.2[11]
Table 6. Heavy metal(loid) input fluxes of irrigation (mg/m2/yr).
Region/CountryPeriodAsCdCrCuHgNiPbZnRef.
NEC2000–20210.03nd0.20.50.0010.020.10.5This
study
SC2000–20211.630.187.343.560.0325.291.3814.3
HHH2000–20212.860.150.941.030.1330.852.1415.11
LP2000–20212.10.114.12.420.061.120.959.74
SYR2000–20210.460.10.332.4305.310.417.04
SB2000–20214.080.052.740.010.24701.040.02
NWC2000–2021-0.01------
YGP2000–2021--------
MLYR2000–20212.920.091.981.860.0422.751.819.59
China2000–20211.830.12.391.790.0460.81.348.26
England and Wales20000.120.010.011.6nd0.160.083.9[11]
Note: - No data.
Disclaimer/Publisher’s Note: The statements, opinions and data contained in all publications are solely those of the individual author(s) and contributor(s) and not of MDPI and/or the editor(s). MDPI and/or the editor(s) disclaim responsibility for any injury to people or property resulting from any ideas, methods, instructions or products referred to in the content.

