Article

Distribution Characteristics and Influencing Factors of Soil Biological Indicators in Typical Farmland Soils

1
School of Land Science and Technology, China University of Geosciences, Beijing 100083, China
2
Key Laboratory of Land Consolidation and Rehabilitation, Ministry of Natural Resources, Beijing 100035, China
*
Author to whom correspondence should be addressed.
Land 2023, 12(4), 755; https://doi.org/10.3390/land12040755
Submission received: 1 March 2023 / Revised: 21 March 2023 / Accepted: 26 March 2023 / Published: 27 March 2023

Abstract

:
Soil biodiversity drives soil-based ecosystem services and is an important indicator of soil health. To understand the responses of important soil biological indicators to different farmland use contexts, 72 fields in three agricultural regions of China were used as research objects. The distribution characteristics and the factors influencing six indicators (carbon and nitrogen contents of soil microbial biomass (MBC, MBN, respectively), soil respiration (SR), soil catalase activity (CAT), soil acid phosphomonoesterase activity (APA), and soil earthworms) were investigated using field monitoring and indoor analysis. The MBC, SR, CAT, and APA indicators showed significant differences among the regions (p < 0.05). Correlation and redundancy analyses indicated that the important factors affecting MBC, MBN, and soil respiration were cation exchange capacity, total N, organic matter, hydrolytic N, and soil bulk density, whereas the important factors affecting APA and earthworms were total phosphorus, available phosphorus, and available potassium. None of these factors had a significant effect on CAT. Climatic conditions, soil types, and farmland practices all have complex impacts on soil biodiversity. The results showed that attention should be paid to improving the physical conditions of the soil and to increasing soil fertility levels when establishing sustainable farm management patterns.

1. Introduction

Soils are located at the intersection between certain heterogeneous zones, namely the atmosphere, hydrosphere, and lithosphere, which means that they are part of the Earth’s critical zone [1,2]. Soils also contain the most diverse biomes and are important biological reservoirs [3,4]. Soil biodiversity is regarded as being fundamental to food security and ecosystem services, particularly when facing the major challenges associated with climate change and the sustainable development of human societies [5]. The United Nations Sustainable Development Goals (SDGs) [6] for the period 2015–2030 propose to “Protect, restore, and promote sustainable use of terrestrial ecosystems, sustainably manage forests, combat desertification, and halt and reverse land degradation and halt biodiversity loss”. The European Commission also recognizes the critical role played by soil biodiversity in ecosystem function and considers soil biodiversity to have socio-economic and environmental values [7]. In addition, soil biodiversity decline has been identified as one of the eight soil threats in the Soil Conservation Thematic Strategy [8]. Research, monitoring, and the conservation of soil biodiversity have become key to the sustainable use of soil systems.
Soil biodiversity is usually understood to include all the organisms living in the soil [9]. The Natural Environment Research Council (NERC) in the UK used molecular biotechnology, isotope techniques, and controlled experiments to identify 100 species of bacteria [10], 365 species of protozoa [11], 81 species of fungi [12,13], 143 species of nematodes [14], 12 species of hoppers, 32 species of mites, and five species of earthworms [15] in 0.01 km2 of grassland. This result shows the complexity and diversity of soil organisms. The advancement of experimental techniques and the deepening of human understanding of soil biology have led to the development of various soil biological indicators to characterize soil biodiversity and soil health status, such as soil microbial load, soil protein, soil enzyme activity, and other indicators [16,17,18]. On this basis, Turbé et al. [19] redefined soil biodiversity as “the variability of soil life: from genes to communities and the ecological complexes to which they belong”, and this definition has been widely used by academics. However, the scientific community has not yet formulated a minimum set of data to characterize soil biodiversity [20]. In order to solve this problem, many researchers have conducted studies on the influence mechanisms and distribution characteristics of soil organisms in an attempt to provide a reference basis for evaluating the status of soil biodiversity and to provide directions for soil improvement. For example, Lemanceau et al. [21,22] and Thomson et al. [23] studied the effects of soil type, vegetation type, and climatic conditions on soil organisms in terms of taxonomic richness and relative richness, respectively, and the studies suggested that these soil-forming factors can be regarded as direct determinants of soil biodiversity. Many studies have also quantified the effects of land management and land use on soil biodiversity and function. A study by Tsiafouli et al. demonstrated that an increase in agricultural intensity usually leads to a decrease in soil biodiversity [24]. The promotion of soil enzyme activity in the black soil zone of northeastern China through the use of different crop rotations, such as the introduction of legumes, was explored by Wu et al. [25]. Qiu et al. [26] summarized the positive effects of organic straw return on soil microbial and soil enzyme activities in the black soil region of northeastern China. Through field experiments, Zou et al. [27] also found that tillage and straw return to the field promoted soil physical structure, soil biodiversity, and grain yield. Based on the above drivers, the results from these studies suggest that farm management practices that promote soil biodiversity, including soil tillage reduction, crop rotation, organic mulching, erosion control, pest and soil fertility management, and drainage management, should be encouraged.
In general, the activity, abundance, diversity, and function of soil organisms are controlled by a variety of factors, including climate (temperature, humidity), soil organic matter, soil texture or structure, salt content, and the impact of human practical labor [21,23]. At the whole landscape scale, climate and soil texture often determine the habitat conditions of soil organisms. However, at the ecosystem scale, land use change or management measures are also key variable factors affecting soil biodiversity. Many factors have been identified as determinants of soil biodiversity patterns, but the relative contributions made by these factors are still largely unknown [6]. Furthermore, a great deal of farming practice is based on experience or the results from controlled experiments at the field scale. For example, the “Third National Land Survey” of China used four soil bacterial indexes to directly represent soil biodiversity, but these were obviously inaccurate [28]. Therefore, it is not clear under the current situation of extensive land management and utilization whether soil biodiversity differs depending on conditions or what the key factors affecting soil biodiversity are. Therefore, a basic understanding of these two issues needs to improve.
Soil is a “living” organism, and soil biodiversity is an important engine of soil function and an indicator of soil health [29,30,31]. Capturing the complexity of soil life when undertaking soil quality and health assessments is one of the most important challenges in contemporary soil science [32,33]. The comprehensive evaluation system for soil health developed by Cornell University [34] and the soil health card of India [35] both include various soil biological indicators in their evaluation index systems. Bünemann et al. [16], Li et al. [36], and Zhao [37] conducted literature reviews and statistical analyses of the biological indicators used in soil quality and health assessments and summarized the key biodiversity indicators used by the current soil biological research using highly unified measurement results. Indicators of soil biological status can be divided into those associated with soil microbial biomass, soil enzyme activity, soil respiration, soil microbial richness or diversity, and soil animals. Soil microbial biomass, activity or function, abundance, and diversity are taken as the characteristics of soil biodiversity in this study and soil microbial carbon and nitrogen, soil respiration, soil earthworm number, soil-related enzyme activity, and other indicators were selected as the important soil biological indicators based on the supporting role played by soil biodiversity in promoting soil function and soil health/quality. These indicators are all the top trending words in soil health assessment at present. The study selected three typical agricultural production areas in China, Hailun County, Wen County, and Yixing County, as the study areas for field sampling and data collection. The three study areas were located within three typical agricultural zones as defined by the Ministry of Agriculture and Rural Affairs of China’s “Cultivated Land Quality Grades” (GB 33469-2016). The Ministry of Natural Resources of China has also adopted these three counties as important pilot sites for their “Cultivated Land Health and Productivity Study” [38]. There are differences in climatic conditions, soil types, and use patterns among the three study sites. The selection of these three sites has implications for the study of soil health and soil biodiversity conservation on arable land. The purpose of this paper was to attempt to discover whether soil biodiversity exhibits significant variability in the context of the actual use of arable land as a result of factors such as climate, soil type and use patterns; and what mapping relationships exist between the basic physicochemical properties of soils and soil biological indicators. Therefore, the physical, chemical, and biological soil indicators in the different areas were analyzed in the following way: (1) A one-way ANOVA was conducted to reveal the differences among the characteristics of the soil biological indicators under different cultivated land use conditions; and (2) a correlation analysis and a redundancy analysis (RDA) were conducted to determine the factors that influence the soil biological indicators. By investigating and analyzing the differences among the characteristics and the factors influencing the soil biological indicators in typical agricultural areas, this study attempted to provide a scientific reference for the evaluation and protection of soil biological diversity.

2. Materials and Methods

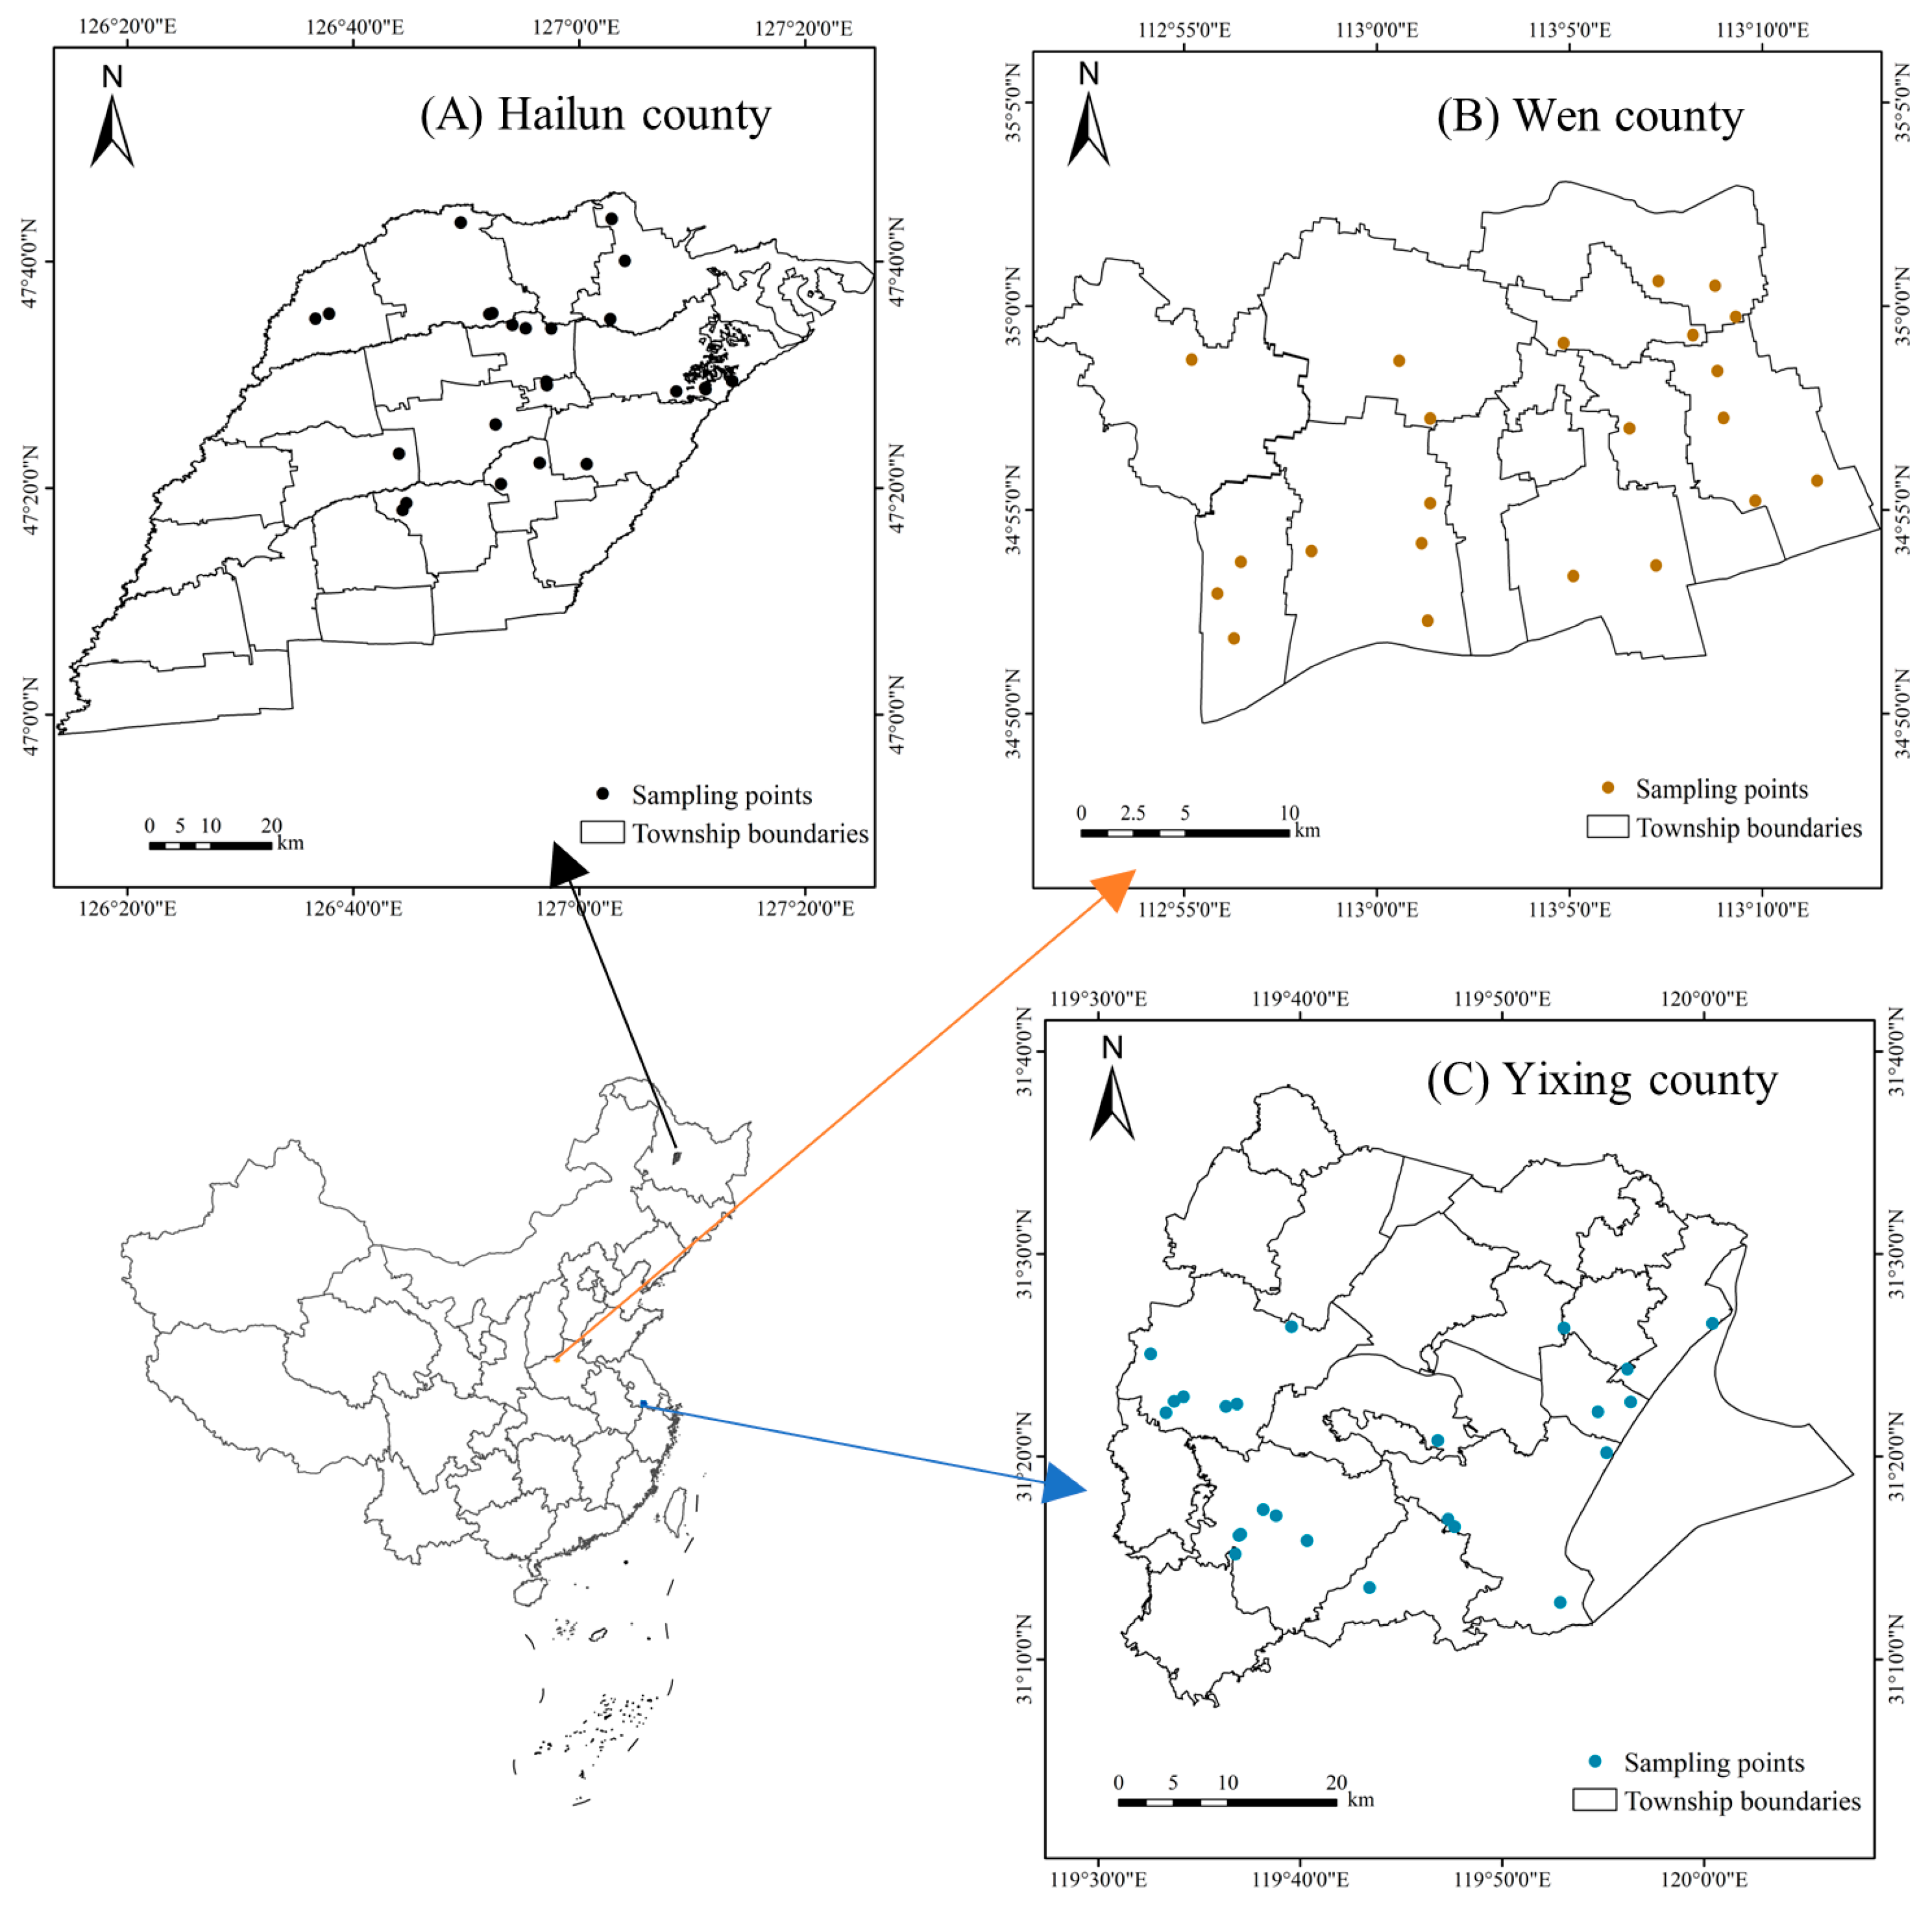
2.1. Study Site and Characteristics

The study sites were located in China (Figure 1). A total of three specific county-level administrative areas were selected, which were in the northeast, Yellow Huaihai, and the Middle and Lower Yangtze River agricultural zones of China. A total of 72 plots were surveyed and these plots covered three types of arable land use (dry land, paddy field, and irrigated land). The three counties differ in their natural environment, geographical location, and soil type. With an average annual precipitation of 550 mm and an average annual temperature of 1.5 °C, Hailun County in Heilongjiang Province is located in the heart of the Black Earth region of northeast China and is an important center of grain production in northeast China. Wen County, Henan Province, with an annual precipitation of 600 mm and an average annual temperature of 14.4 °C, is famous for its 7500 kg ha−1 wheat yield, whereas Yixing County, Jiangsu Province, is a commercial grain base in the Yangtze River Delta. It has an annual precipitation of 1200 mm and an average annual temperature of 15.7 °C. The soil types in Hailun, Wen, and Yixing counties are pheaozems, cambisols, and anthrosols, respectively (according to the World Reference Base for Soil Resources, WRB). There are differences in the way farmland is managed and utilized in the three study areas: farmland in Hailun County is mostly used for organic farming (straw mulching, no-till, etc.), whereas Wen County mainly follows a traditional, intensive production model. However, there is no obvious dominant use of farmland in Yixing County and arable land use intensity should be somewhere between the first two areas. The selection criteria for the study areas included different climatic types, different soil types, and different utilization patterns, and that the area followed a typical and feasible crop management scheme.

2.2. Sample Scheme and Sampling

From July to October 2020 (after crop harvest), two samples were taken from 72 sample plots in the three study areas (Figure 1). There were 25 sample plots in Hailun County (dry land: 15; paddy field: 7; irrigated land: 3), 23 sample plots in Wen County (all irrigated land), and 24 sample plots in Yixing County (dry land: 5; paddy field: 19). The sampling points were mainly based on the size of the farmland and the type of soil. A total of three points were selected diagonally in each sample plot. The samples were taken using a standard soil auger (5 cm diameter) and each point was determined by a plumbline and included in five non-root soil subsamples taken at 0–20 cm depth. These were then mixed well, any debris was removed, and the samples were divided into two portions of approximately 500 g each. One sample was sealed in a polyethylene bag, air-dried under natural conditions, and ground and sieved for the analysis of soil physical and chemical properties and enzymatic activity. The other was stored at 4 °C for soil carbon and nitrogen content and soil microbiological quantities determination. At the same time, a sample box measuring 100 cm × 100 cm was placed at a depth of 30 cm to sample the earthworms at each sampling site. All the soil in the sample box was dug out with a shovel. Then, the earthworms were hand-sorted in situ and placed in sample bags. The sample bag was filled with 1/5 to 1/4 of the soil volume to keep the earthworms active.

2.3. Laboratory Analysis and Indicator Determination

Determination of basic physical and chemical properties of soils was carried out according to the “Methods of Agricultural Chemical Analysis of Soils” [39]. Soil bulk weight (BD) was measured by the ring knife method; soil water content (SWC) was determined by the drying method; pH was determined by the electrode potential method (1:1.25 soil to water leachate ratio); electrical conductivity (EC) was determined by the conductivity method; cation exchange capacity (CEC) was determined by the ammonium acetate exchange method; organic matter (SOM) was determined by the potassium dichromate oxidative spectrophotometric method; total soil nitrogen (TN) was determined by the semi-micro Kjeldahl method; total phosphorus (TP) by the molybdenum antimony colorimetric method; hydrolysable nitrogen (HN) by the alkaline diffusion method; available phosphorus (AP) by the sodium bicarbonate leaching-molybdenum antimony colorimetric method; and available potassium (AK) by inductively coupled plasma emission spectrometry (ICP-OES). Determination of the carbon and nitrogen contents in soil microbial biomass was by chloroform fumigation-extraction [40] and soil respiration was measured using the Li-8100A automatic soil carbon flux measurement system (Li-Cor, Lincoln, NE, USA). Soil catalase activity (CAT) and acid phosphatemonoesterase (APA) were selected as the indicators of enzyme activity and both were measured using the micro-method. The CAT activity was defined as one enzyme activity per day per gram of air-dried soil sample catalyzing the degradation of 1 μmol H2O2 and APA activity was defined as 1 nmol of phenol released per day per gram of soil sample at 37 °C.

2.4. Data Processing and Statistical Methods

The data were analyzed using Excel 2019 (Microsoft, Redmond, WA, USA) and IBM SPSS Statistics 26 (Armonk, NY, USA). One-way ANOVA and Duncan’s multiple comparisons were used to test for significant differences (p < 0.05) among the biological indicators and physicochemical properties of the farmland soils from the different regions. Plotting was carried out using Origin 2018 (San Francisco, CA, USA) software and a correlation analysis of the soil physical, chemical, and biological indicators was undertaken by R 3.6.1. The redundancy analysis (RDA) had soil biological indicators as the response variables and soil physical and chemical indicators as the explanatory variables.

3. Results

3.1. Soil Biological and Physicochemical Index Responses in the Different Regions

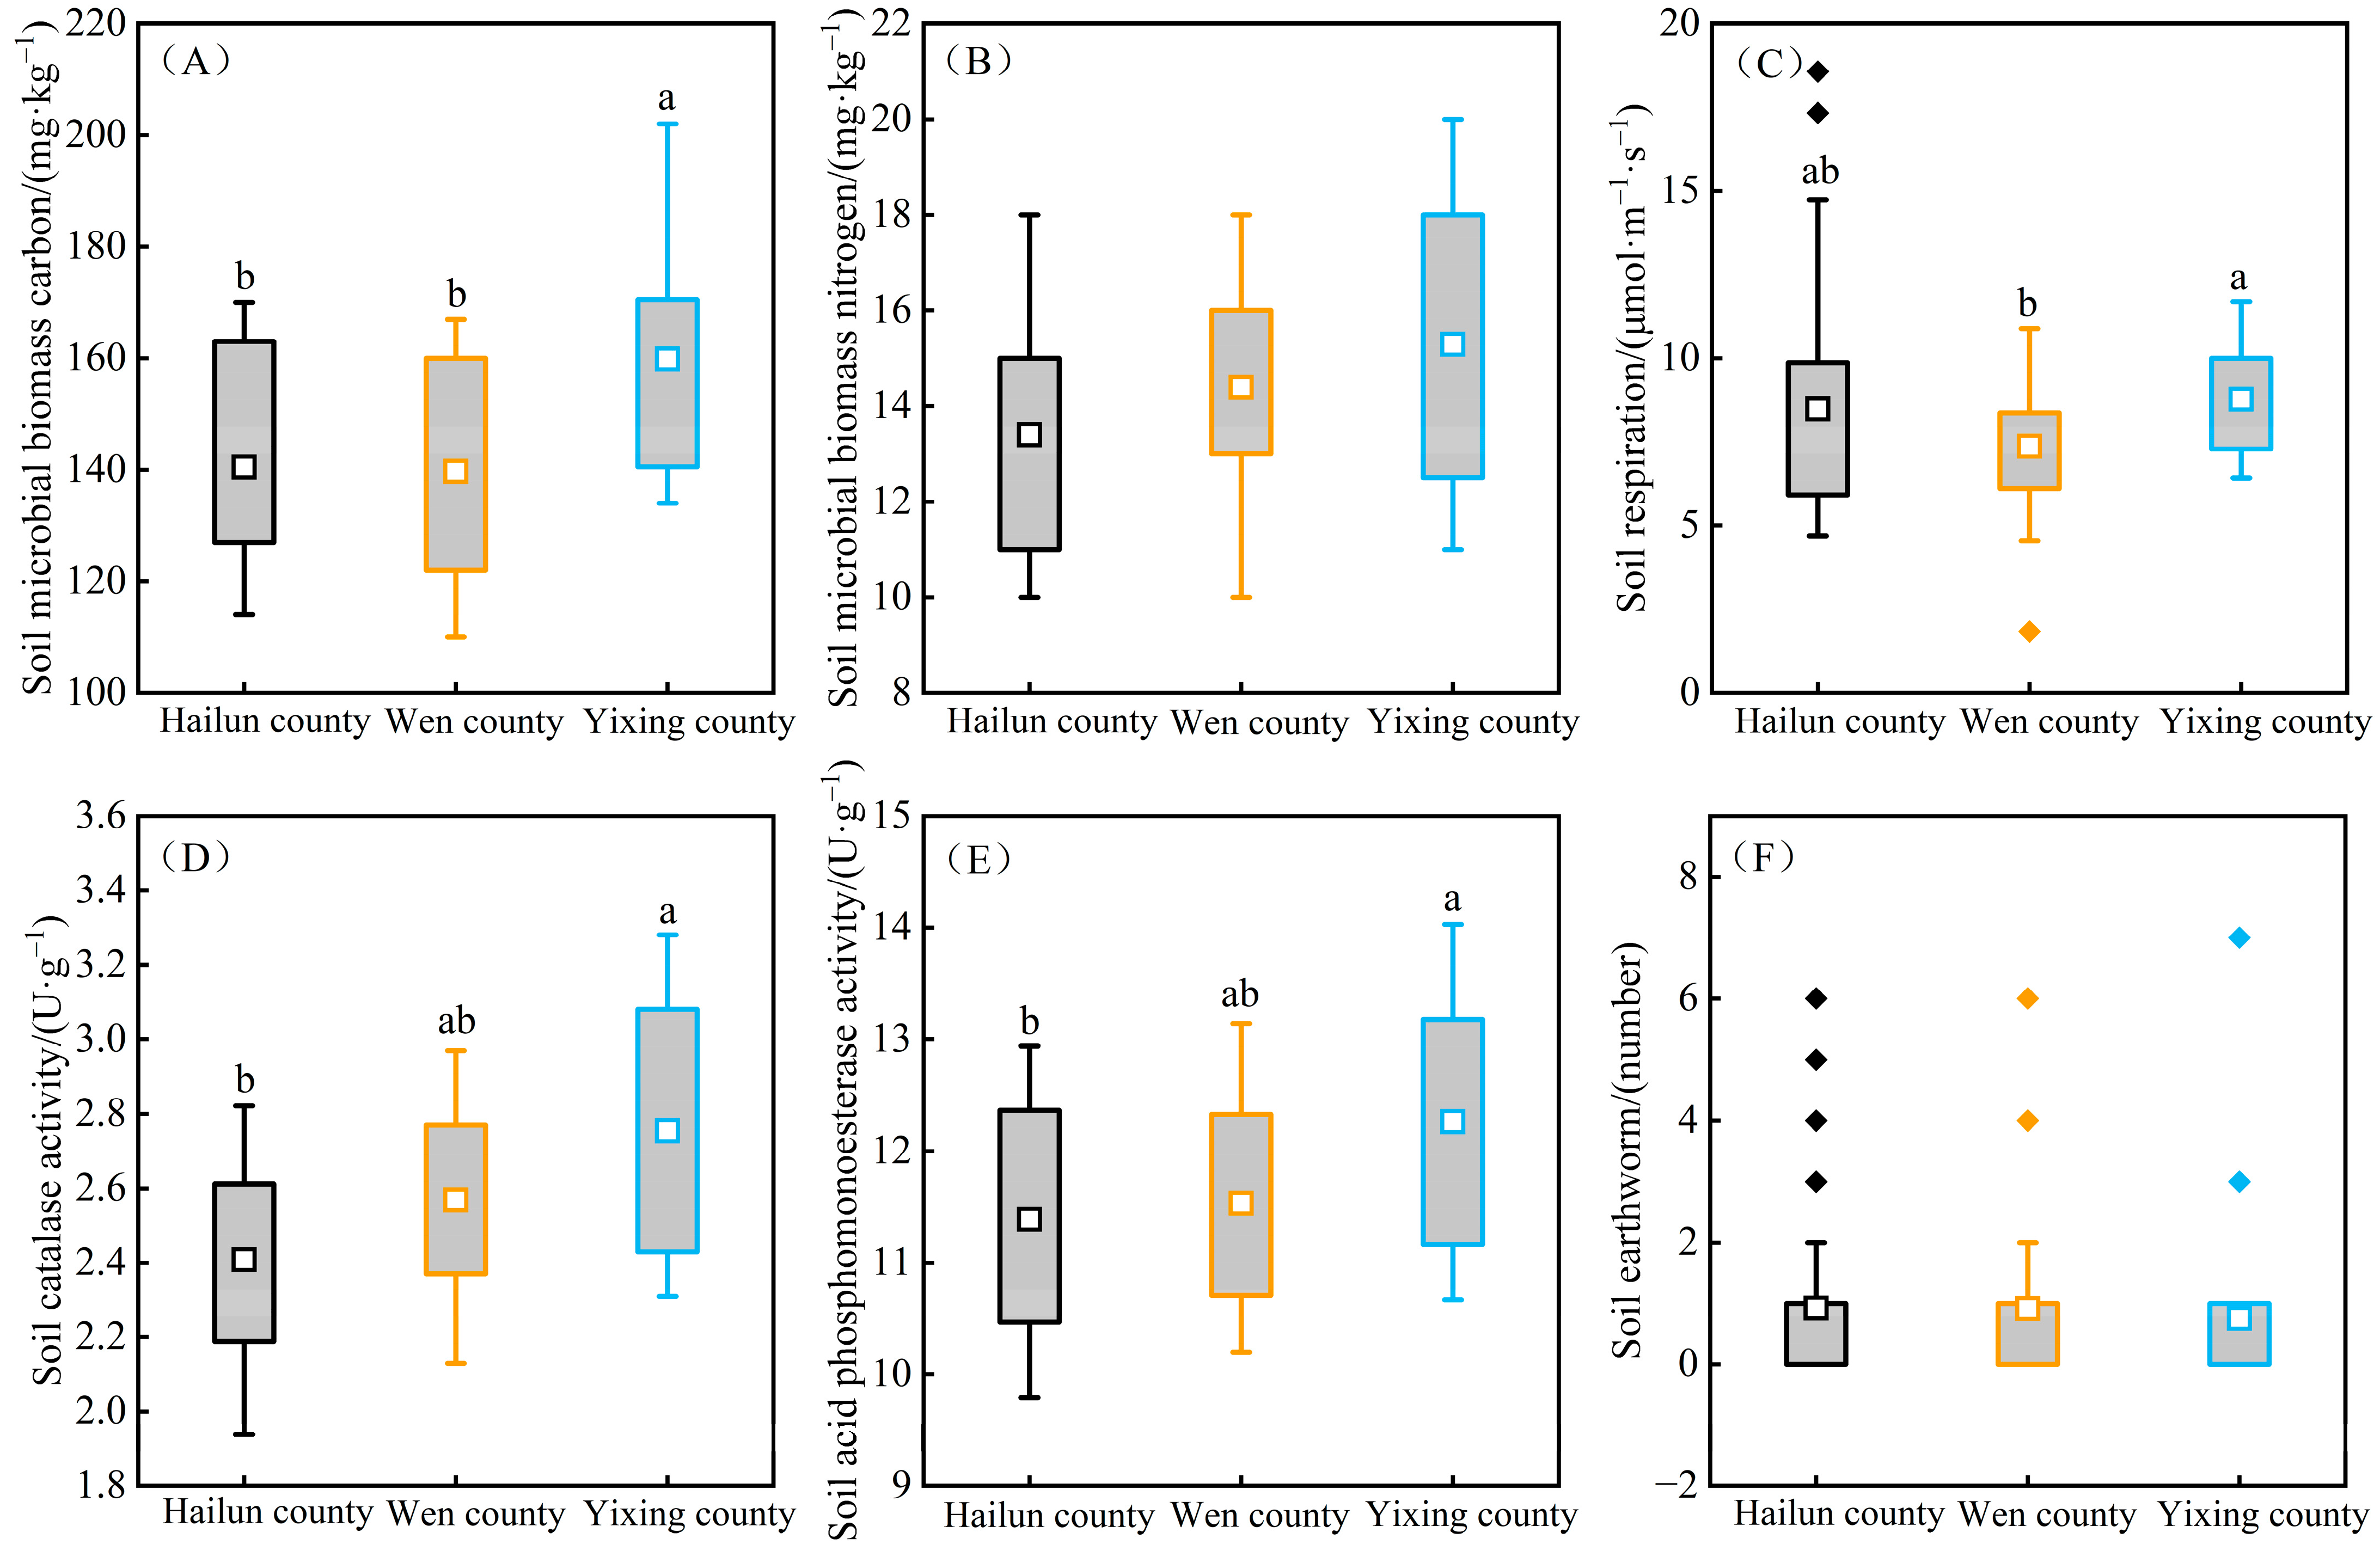
3.1.1. Analysis of the Differences among Soil Biological Indicators

The differences in the soil biological indicators among the three regions are shown in Figure 2. The MBC index value ranges were 114 to 170 mg·kg−1 in Hailun County, 110 to 167 mg·kg−1 in Wen County, and 134 to 202 mg·kg−1 in Yixing County. The distribution characteristics followed the order: Yixing County > Hailun County > Wen County, and Yixing County was significantly higher than Hailun County and Wen County (p < 0.05). There were no statistical differences among the MBN indicators within the different regions (p > 0.05). However, the mean value for all the MBN indicators showed that the order was Yixing County > Wen County > Hailun County, with index values of 15.29 mg·kg−1, 14.39 mg·kg−1 and 13.40 mg·kg−1, respectively. The distribution characteristics for MBN were different from those of MBN. With average values of 8.77 μmol·m−1·s−1, 8.48 μmol·m−1·s−1, and 7.39 μmol·m−1·s−1, the order for soil respiration was Yixing County > Hailun County > Wen County, respectively, which were consistent with MBC. Wen County had a low soil respiration rate, with an index value range of 1.83 to 10.89 μmol·m−1·s−1, whereas Yixing County had relatively high soil respiration, with an index value range of 6.42–11.69 μmol·m−1·s−1. There was a significant difference between the two regions (p < 0.05). In terms of soil enzyme activity, the order for the CAT and APA indexes were Yixing County > Wen County > Hailun County and there was a significant difference between Yixing County and Hailun County (p < 0.05). The mean values for the CAT and APA indicators in Yixing County, Wen County, and Hailun County were 2.75 U·g−1, 2.57 U·g−1, and 2.41 U·g−1, respectively, and 12.26 U·g−1, 11.39 U·g−1, and 11.53 U·g−1, respectively. The results for soil earthworms were not ideal. The number of soil earthworms in the various plots ranged from 0 to 7 and the average number of earthworms in all plots was only 0.74. There were no significant differences in the number of earthworms in farmland soils among the different regions (p > 0.05). More importantly, we were unable to obtain earthworm data from any of the sample plots in the paddy fields. The overall analysis results showed that the soil biological indicators varied depending on the natural conditions and the management and utilization modes that existed among the regions. However, even though the selected typical farmland areas were far away from each other, and the conditions significantly varied, the differences among the regions were relatively small, which showed the complexity and variability among soil biological indicators to a certain extent.

3.1.2. Analysis of the Differences between the Physical and Chemical Properties of the Soils from the Different Regions

Except for the CEC and TP indicators, the other basic physical and chemical indicators for the farmland soils showed different degrees of difference among the three regions (Table 1), indicating that different farmland use conditions had an impact on the basic physical and chemical properties of the soil. The order for the soil bulk density, pH, and EC distribution characteristics were Wen County > Hailun County > Yixing County and the results showed that these indexes for Wen County were significantly higher than for the other two regions (p < 0.05). The mean value of the bulk density index for farmland in Wen County was 1.44 g·cm−3 and the mean values for the pH and EC indexes were 8.46 and 135.34 µs·cm−1, respectively. It is known that the farmland in this area is at risk from soil compaction and salinization. The soil–water content indicator order was Yixing County > Hailun County > Wen County and the order for the soil fertility indexes, such as SOM, TN, HN, and AP, were Hailun County > Yixing County > Wen County. The first three soil fertility indexes showed significant differences among the different regions (p < 0.05), while the AP index results showed that Hailun County was significantly higher than the other two regions (p < 0.05). The AK order was Wen County > Hailun County > Yixing County and there was a significant difference between Yixing County and the other two regions (p < 0.05). Overall, the physical properties of the farmland soil in Wen County were poor compared to Hailun and Yixing Counties. Additionally, the farmland soil in Hailun County was very fertile.

3.2. Analysis of Environmental Factors Affecting Soil Biological Indicators

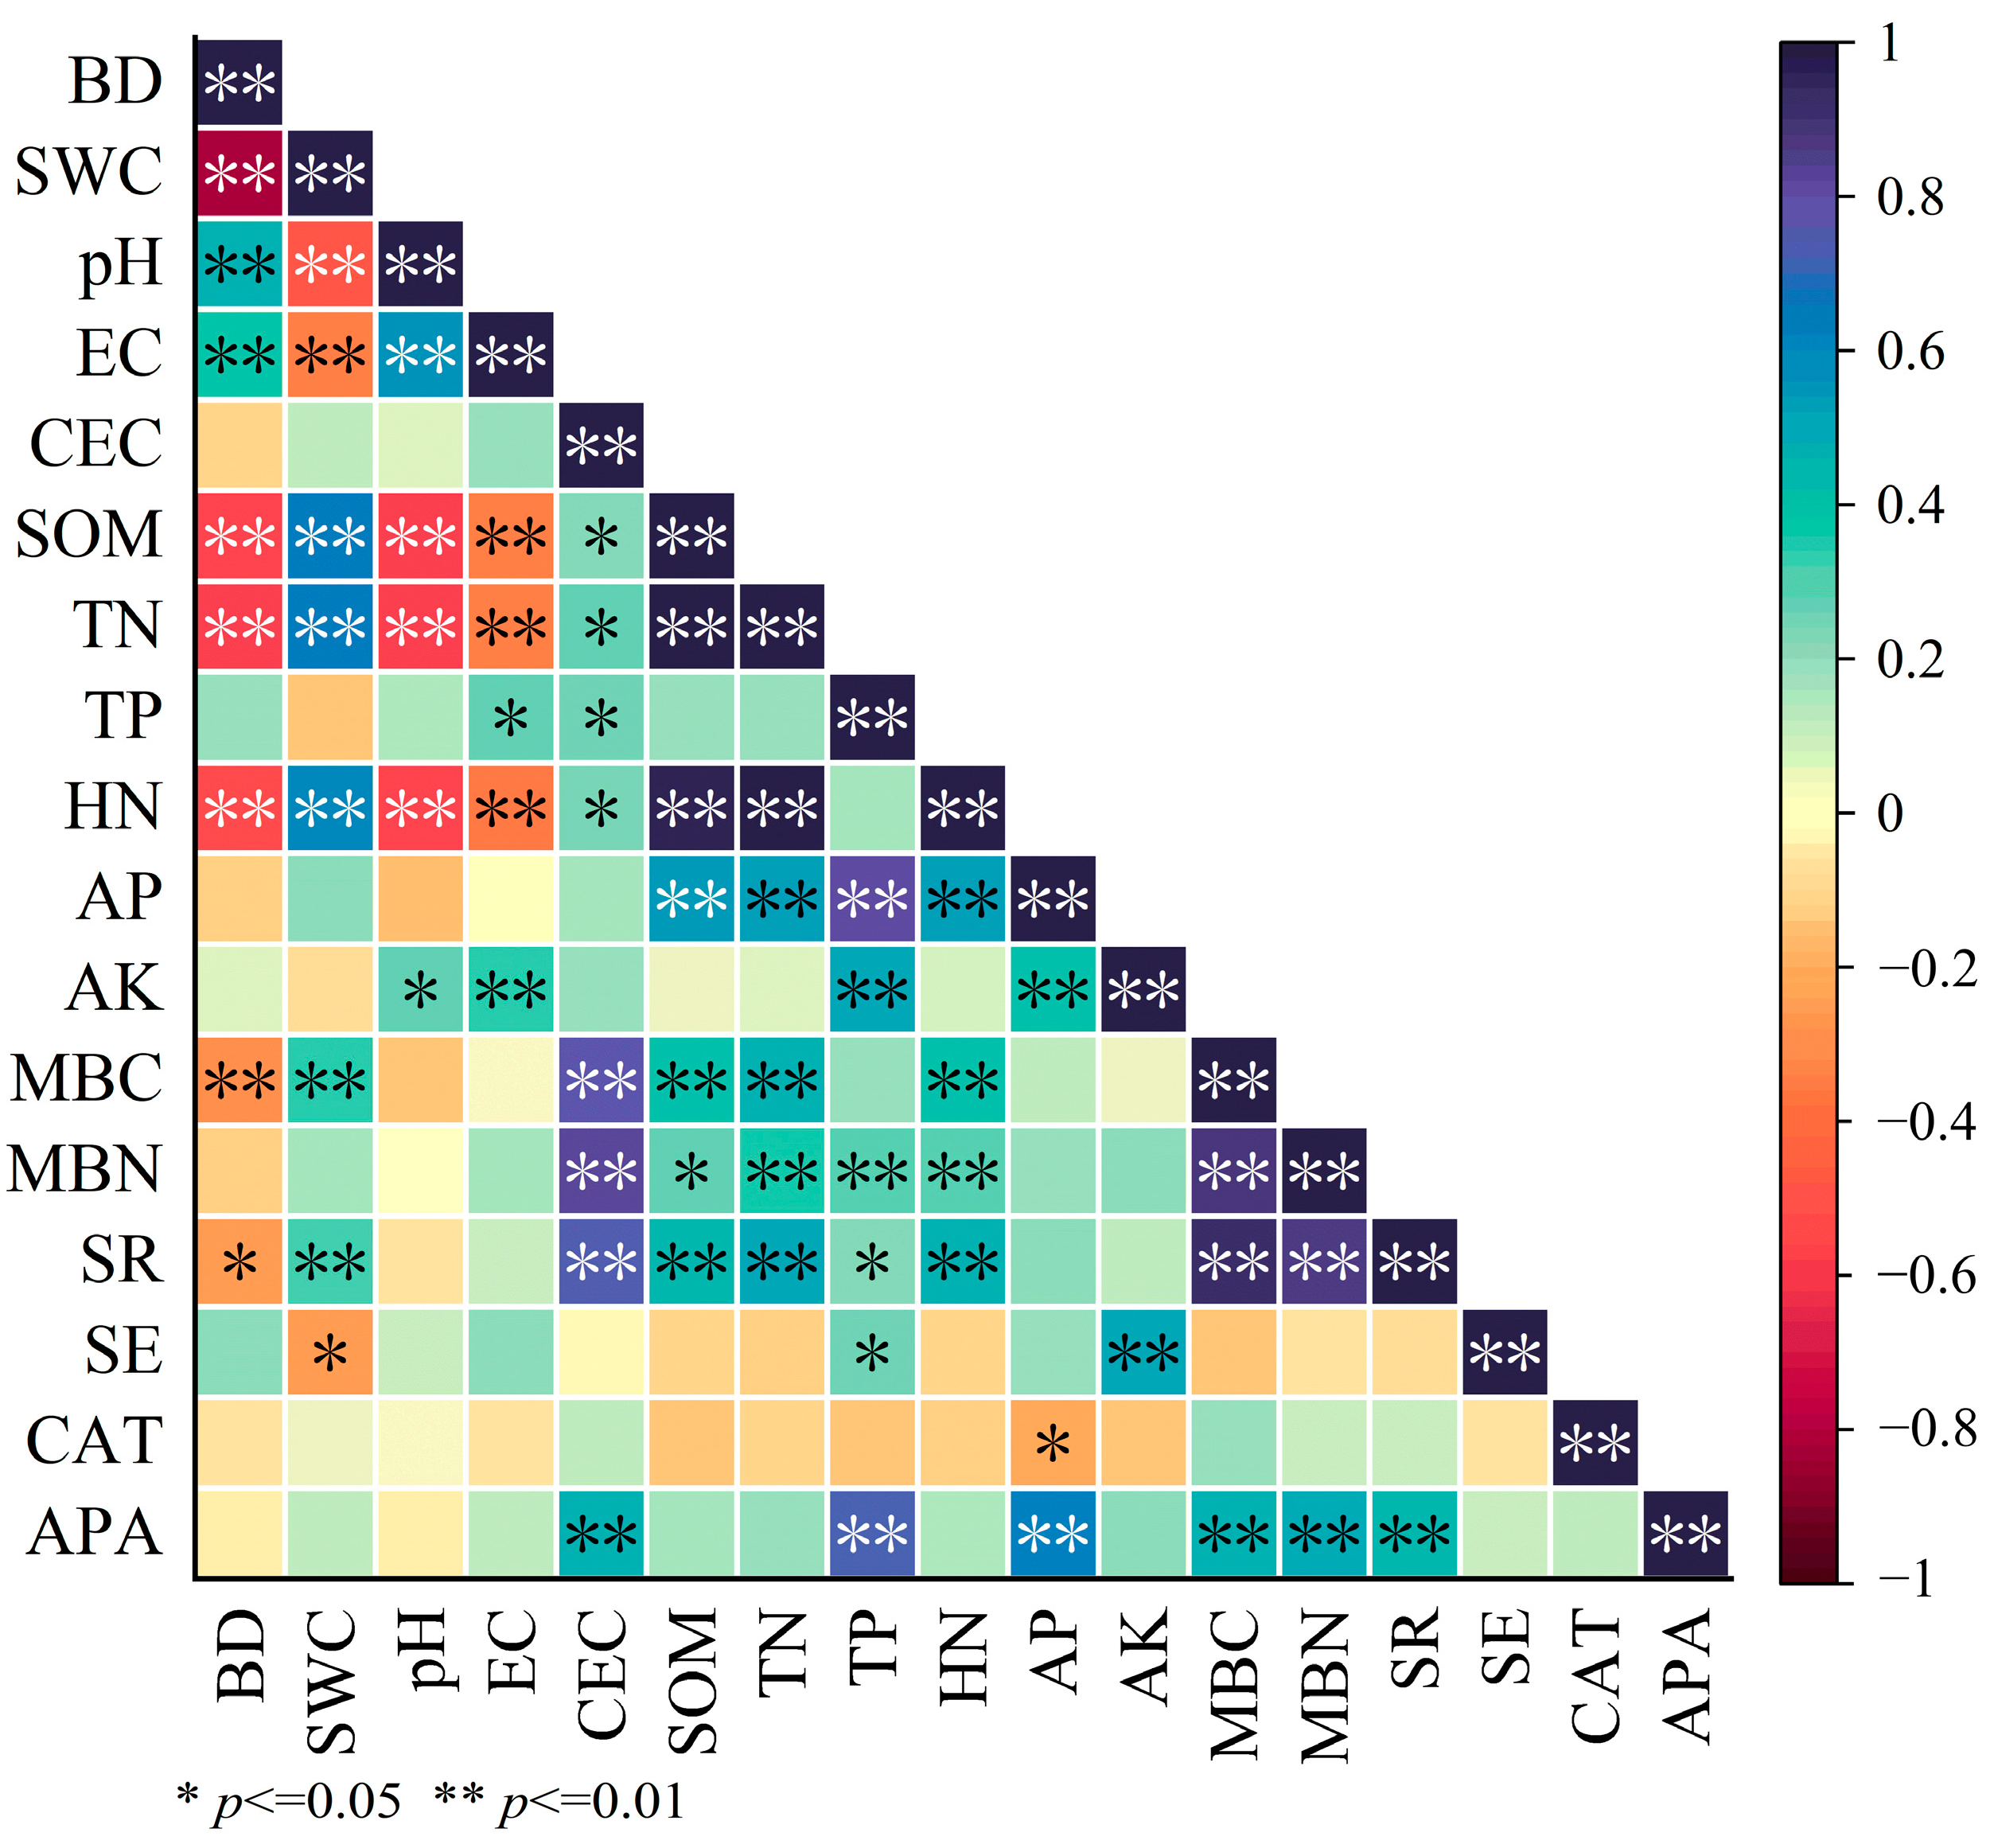
3.2.1. Correlation Analysis of the Factors Influencing the Soil Biological Indicators

The correlation analysis results for the soil-related data obtained from the sampling points are shown in Figure 3. Most soil biological indicators had different degrees of correlation. The MBC, MBN, and soil respiration data were significantly correlated with APA (p < 0.01), which to some extent explained the validity of the test data. There were no correlations among the soil earthworm, CAT, and other soil biological indicators (p > 0.05). Soil biological indicators and soil physical and chemical indicators showed complex correlations. The soil bulk density was negatively correlated with MBC and soil respiration (r = −0.290*; r = −0.245*, respectively). In contrast, soil moisture content had positive correlations with MBC and soil respiration (r = 0.335**; r = 0.287*, respectively); CEC was significantly positively correlated with MBN, MBC, soil respiration, and APA (r = 0.825**; r = 0.746**; r = 0.650**; r = 0.488**, respectively); and pH and EC were not correlated to the six soil biodiversity indicators (p > 0.05). In addition, MBC was significantly positively correlated with TN, HN, and SOM (r = 0.506**; r = 0.458**; r = 0.430**, respectively); MBN was significantly positively correlated with TN, HN, SOM, and TP (r = 0.383**; r = 0.338**; r = 0.311**, r = 0.285 *, respectively); soil respiration was significantly positively correlated with TN, SOM, HN, AP, TP, and AK (r = 0.577**; r = 0.538**; r = 0.525**; r = 0.355**; r = 0.334**, 0.243* respectively); and soil earthworms were significantly positively correlated with AK, TP, and AP (r = 0.529**; r = 0.402**; r = 0.384**, respectively). APA only had a significant positive correlation with TP and AP (r = 0.684**; r = 0.599**, respectively). The results showed that soil physical and chemical properties, especially fertility conditions, had a certain impact on soil biological activity and abundance.

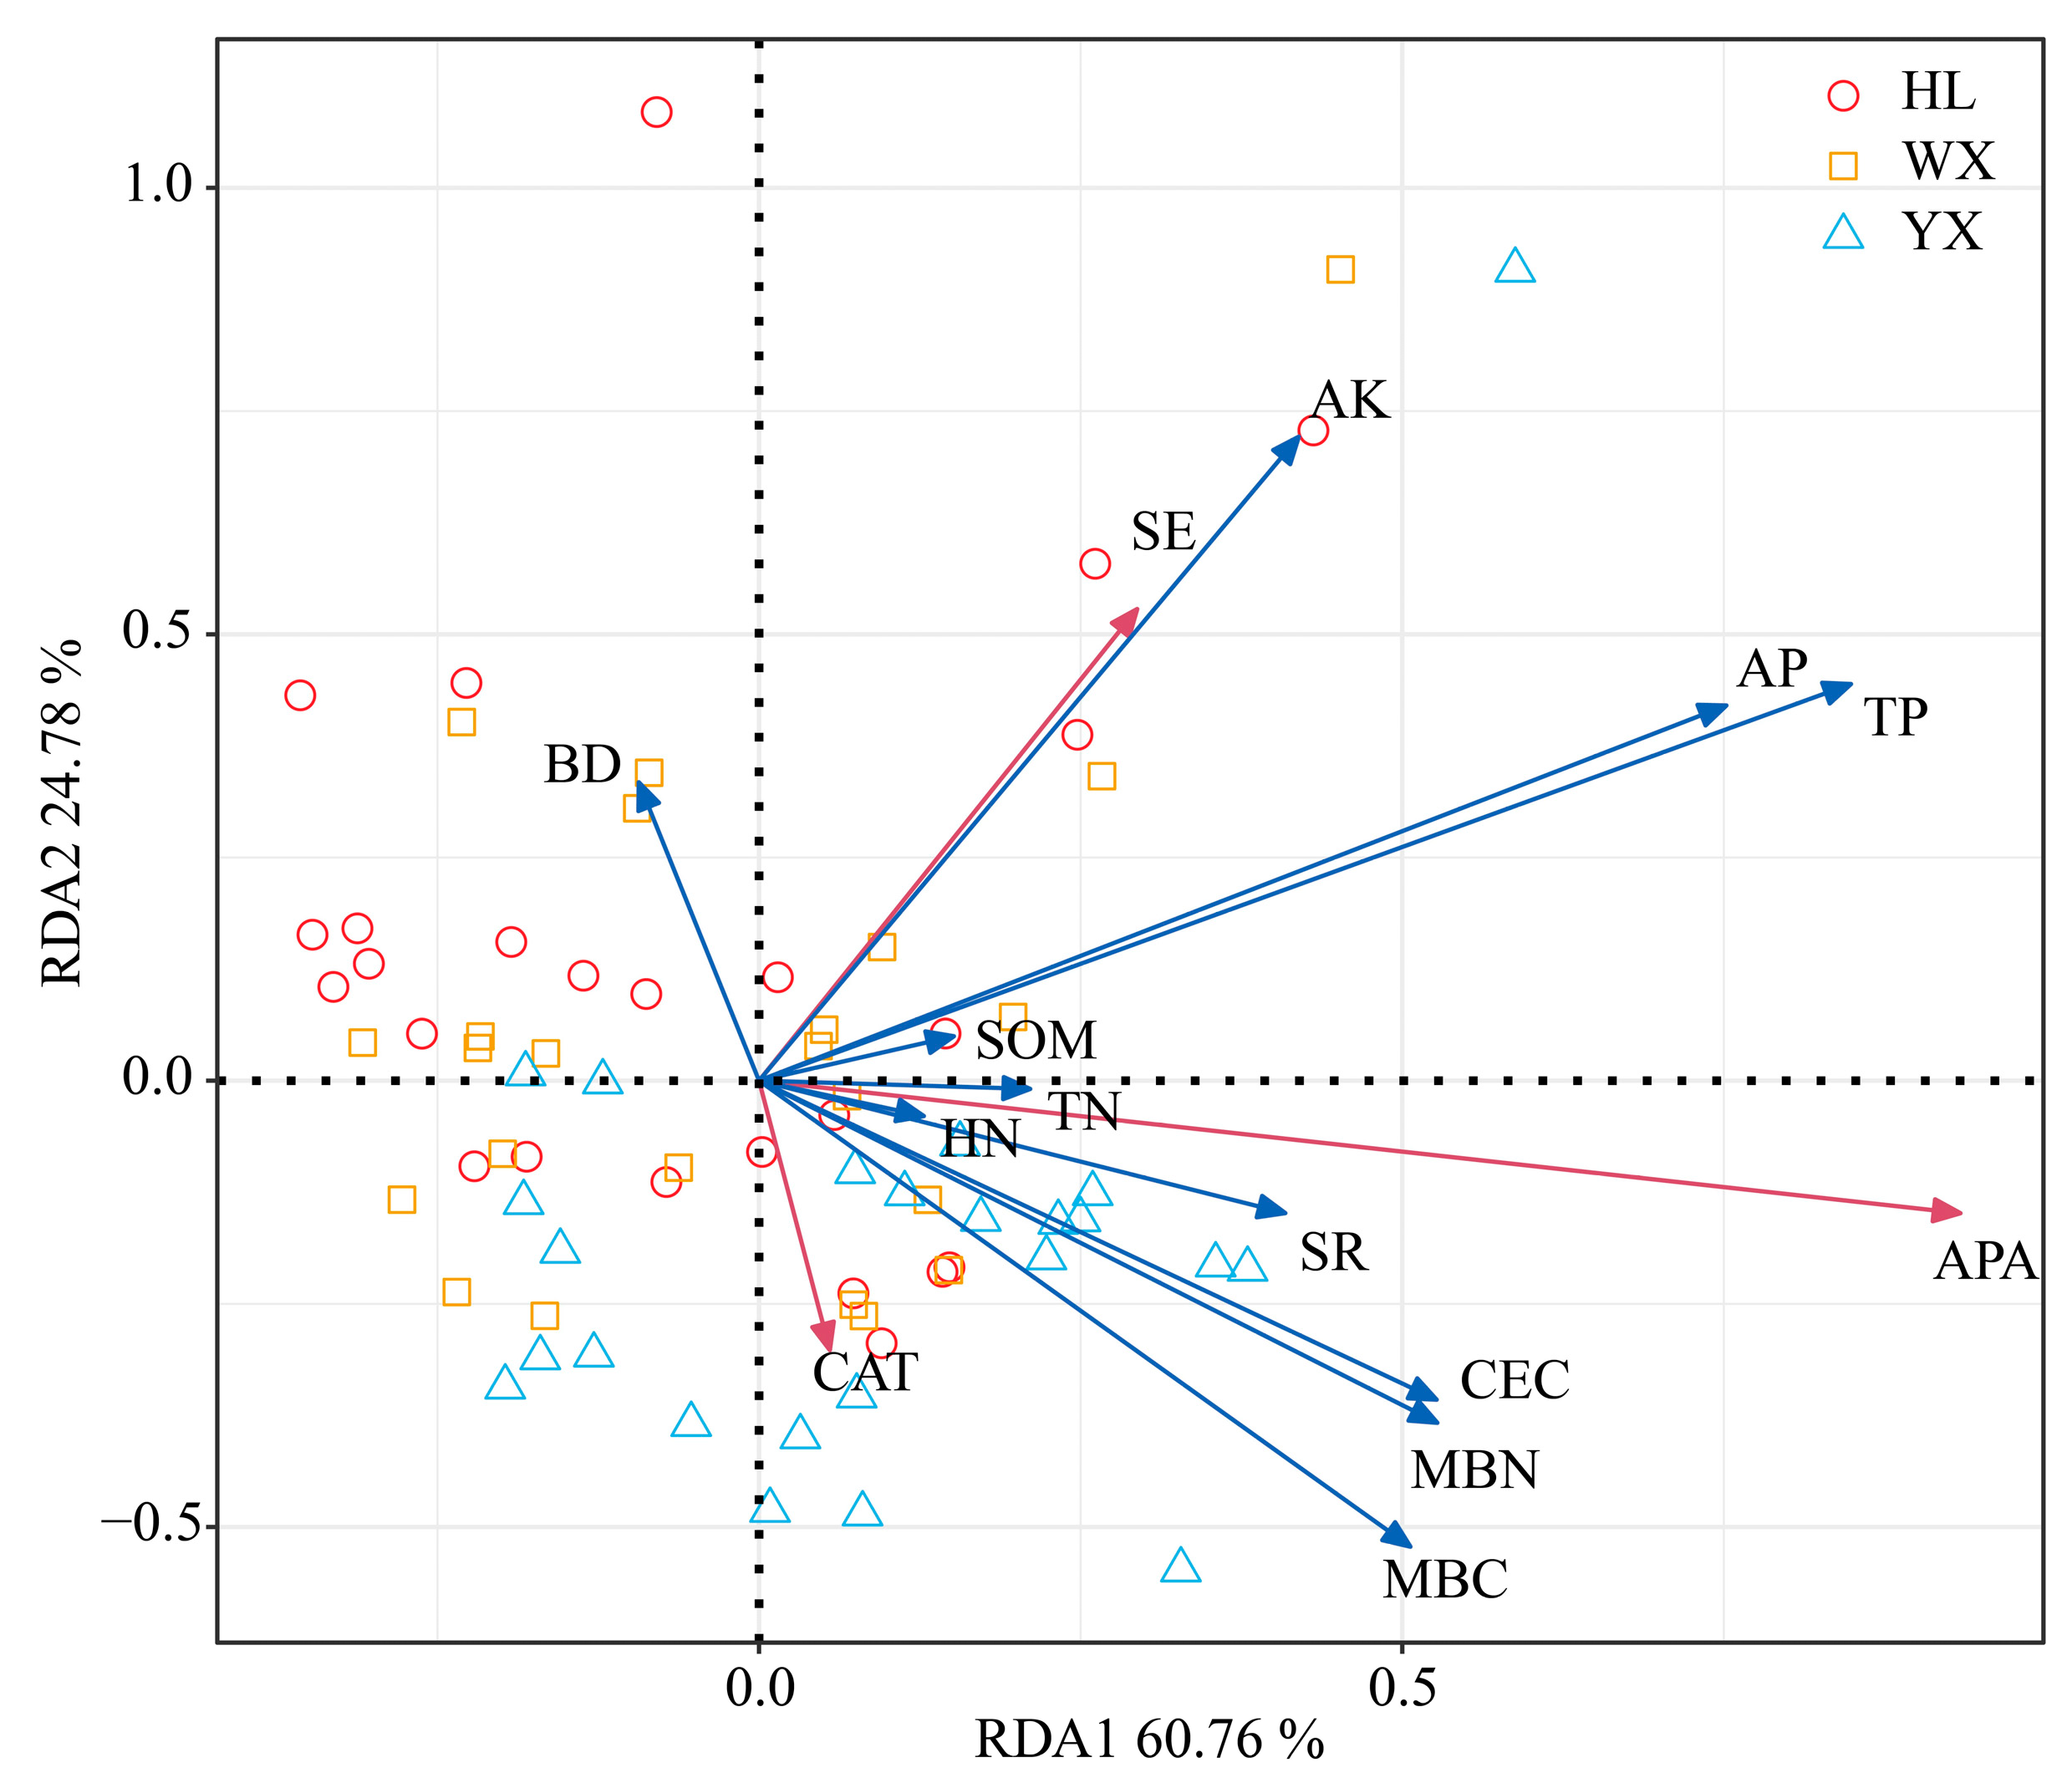
3.2.2. Indicators Redundancy Analysis of Factors Influencing the Soil Biological Indicators

Based on the results of the correlation analysis, an RDA was undertaken where soil bulk density, CEC, SOM, and other farmland soil physical and chemical properties were the explanatory variables and soil biological indicators were response variables. The results showed that the first and second ranking axes of the RDA explained 85.54% of the impact of soil physical and chemical indicators on soil biological indicators (Table 2). It can be seen that the first two ranking axes well reflect the relationship between the two and are mainly determined by the I axis. The RDA ranking of effective impact factors for soil biological indicators is shown in Figure 4. The first axis is mainly dominated by TP, AP, CEC, and AK and its correlation coefficients are 0.722, 0.606, 0.559, and 0.431, respectively, indicating that the first axis mainly reflects the gradient changes in TP, AP, CEC, and AK. In addition, BD, TN, SOM, and HN also have certain correlations with the first axis, with correlation coefficients of −0.397, 0.304, 0.297, and 0.291, respectively. AK, TP, AK, CEC, and BD in the explanatory variables are highly correlated with the second axis, with correlation coefficients of 0.682, 0.613, 0.544, −0.500, and 0.304, respectively. The included angle and ray length between the rays of the six soil biological indicators, such as MBC, MBN, and soil respiration, and the rays of the respective soil physical and chemical test indicators in Figure 4 illustrate the impact of the soil physical and chemical properties on the soil biological indicators. Among them, the important factors affecting MBC and MBN were CEC and soil bulk density. The CEC had a significant positive impact on these two indicators, while soil bulk density had a certain negative impact. In addition, TN, SOM, and HN also had slightly positive impacts on MBC and MBN. The CEC, TN, SOM, and HN had positive impacts on soil respiration, while soil bulk density had a negative impact. In terms of soil enzyme activity, the factors that were expected to influence the CAT index had no significant effects, while the main positive influence factors on the APA index were TP, AP, and CEC. Soil bulk density also had a negative impact on the APA index. The main influencing factors for soil earthworms were AK, AP, and TP. The factors varied in the type and degree of impact they had on the soil biological indicators and the results were different from the correlation analysis, which showed that an RDA can more comprehensively and intuitively reflect the impact of soil physical and chemical indicators on soil biological indicators and the degree of impact.

4. Discussion

The six soil biological indicators within the different regions showed certain differences. The MBC, MBN, soil respiration, CAT, APA, and the other five biological indicators of farmland soil in Yixing County were higher than those in the other two regions (Figure 2). This difference may have been due to climate factors. Yixing County is located in the subtropical monsoon region and has better precipitation and temperature conditions than the other two regions. Climate factors can affect the physiological functions of soil organisms because the activities and growth of soil organisms are dependent on temperature and soil moisture [41,42]. Sanyal et al. [43] found that the abundance and diversity of soil mites had a strong positive correlation with soil moisture and Kergunteuil et al. [44] showed that altitude affects the abundance of soil nematodes through its effect on temperature and precipitation. However, the six biological soil indicators of farmland quality in Hailun County and Wen County varied, but there were no obvious differences due to different climatic conditions. Therefore, these differences may be due to the physical and chemical conditions of the soil itself and the way farmland is managed and utilized. Hailun County is located in the core area of the black soil conservation area in China and has adopted a mature farmland conservation and utilization model after more than ten years of research [45,46]. This field survey showed that most of the sampled fields in Hailun County have implemented farmland protection measures, such as straw-returning, rotation, or no-tillage. There is substantial evidence that the above farmland management methods can increase the living space for soil organisms, improve soil physical structure, and improve soil fertility [47], thus supporting the survival and evolution of soil microorganisms and soil animals [48]. In contrast, Wen County has long followed an agriculturally intensive production model and produced high farmland yields through the widespread use of chemical fertilizers and pesticides. However, this results in the soils having poor physical and fertility levels in Wenxian County compared to the other two regions (Table 2). Unsustainable intensive utilization in agriculture is widespread in many developing countries [49,50,51]. It has a negative impact on soil biological community structure, diversity, food web composition, and community dynamics [24,52]. In addition, no earthworms were found near the paddy fields in the sampling records. This might be due to the fact that there was a lot of water in the farmland at the time when the samples in the paddy field were taken and that harvesting was almost finished in many fields. Earthworms rely on their surface skin for the respiration needed to maintain normal life activities, which means that their life activities in water are severely restricted [53,54]. Therefore, even if the sample box was placed on a ridge near the field, it would still be unlikely that that there would be any earthworms present. These results question whether it is worth considering using earthworms to extensively characterize the status of soil biodiversity.
A correlation analysis and a redundancy analysis on the soil test data were undertaken to identify the key factors affecting the soil biological indicators (Figure 3 and Figure 4). The results showed that many soil biological indicators were driven by soil nutrient indicators to varying degrees. The CEC had a positive effect on MBN, MBC, soil respiration, and APA, whereas TN, SOM, and HN had positive effects on MBN, MBC, APA, soil respiration, and soil earthworms. The enrichment and redistribution of soil nutrients changed with the degree of human interference (fertilization and tillage) because these activities affect soil biological activity and its spatial distribution [55,56,57]. As an important indicator of soil physical conditions, soil bulk density had a certain negative impact on MBC, MBN, soil respiration, and APA. The bulk density of the soil indicates the size of the soil pore spaces [58]. The lower the soil bulk density, the greater the soil porosity [59]. Soil microorganisms live in the pores between soil particles, move freely, or attach to the water film around the soil particles [4]. Therefore, the physical composition of soil provides a basic living environment for soil organisms and serious disturbance, or compaction of the soil, will affect the survival of soil organisms [60]. However, soil suitability or limitation to organisms has a certain range. For example, if the soil porosity is too great, the soil water and fertilizer retention capacity will be poor, and some soil organisms will not survive [61]. Soil organisms also directly change the soil structure and create more habitats in the pores by establishing a solid structural network [62]. In this study, APA had a very close relationship with TP and AP. A highly significant positive correlation between soil phosphatase and HN, AP, and AK was also demonstrated by Zhao et al. [63] in a study on soil enzyme activity in a plantation of northern Chinese larch in the Qinling region of China. The correlation analysis and RDA results did not identify the key factors affecting the CAT indicators, but some studies have found that CAT indicators decreased with the increase in soil AP and HN [64]. Soil earthworms were most closely related to AK and AP, which is probably due to the secretions produced by earthworms, including body surface mucus, and feces, which is rich in available nutrients [65,66,67,68]. However, the randomness of the earthworm sampling meant that the quantity results for soil earthworms were not stable and ideal [69]. Therefore, it was not possible to show the important roles earthworms play in improving soil physical structure and organic matter that were highlighted by other studies [70]. It should also be noted that when looking for factors that influence soil bioindicators, we inputted all the sampled data into the model for processing in an attempt to obtain an overall understanding of the situation. However, if the data from each site is individually examined, different results may be found. Therefore, more nuanced studies that are defined by specific research objectives should be undertaken.
The above research results and analysis show that in-depth research on soil biodiversity faces a number of challenges. The distribution characteristics and factors influencing soil organisms are not highly consistent with the records in the literature. Combining all the above results and analyses shows that favorable climatic conditions, good soil physical structure and high soil fertility are associated with higher levels of soil biodiversity on farmland. However, the joint mechanisms by which climate, soil type and human practices affect soil biodiversity need to be further clarified.

5. Conclusions

The aim of this study was to investigate the variability of important soil biological indicators (climatic conditions, soil types, and management practices) under different farmland use contexts and identify the factors that influence each soil biological indicator. Three typical agricultural areas: Hailun County, Wen County, and Yixing County, were selected for soil sampling and statistical analysis. The three study areas showed varying degrees of heterogeneity among the chosen soil biological indicators for farmland. Four indicators (MBC, soil respiration, CAT, and APA) showed significant variability between areas (p < 0.05), whereas MBN and soil earthworms were not statistically different (p > 0.05). This inconsistent variability suggests that soil biodiversity is not influenced by a single factor and is not dominated by climate or any one factor alone.
In addition, the responses of the farmland soil bioindicators to soil physicochemical properties were not consistent. The important factors affecting MBC, MBN, and soil respiration were CEC, TN, SOM, HN, and soil capacitance and the important factors affecting APA and soil earthworms were TP, AP, and AK. None of the factors had a significant effect on CAT. The overall results indicated that improvements to soil physical structure and soil fertility levels led to an increase in soil biodiversity levels. In order to improve the biodiversity level of agricultural soils and to ensure the sustainable use of farmland, we suggest that appropriate soil bioindicators for specific areas should be selected and their influencing factors should be explored so that targeted conservation measures can be created.

Author Contributions

Conceptualization, L.K. and K.W.; methodology, L.K. and R.Z.; software, L.K. and S.Z.; validation, L.K., R.Z. and K.W.; formal analysis, L.K., H.Z. and Z.F.; investigation, L.K. and R.Z.; resources, K.W.; data curation, L.K. and R.Z.; writing—original draft preparation, L.K.; writing—review and editing, L.K. and K.W.; visualization, L.K.; supervision, K.W.; project administration, K.W.; funding acquisition, K.W. All authors have read and agreed to the published version of the manuscript.

Funding

This work was supported by the National Key R&D Project of the Ministry of Science and Technology of China (No. 2018YFE0107000).

Data Availability Statement

The datasets used and/or analyzed during the current study are available from the corresponding author on reasonable request.

Acknowledgments

The authors sincerely thank all the students and staff who provided their input to this study. Our acknowledgments are also extended to the anonymous reviewers for their constructive reviews of the manuscript.

Conflicts of Interest

The authors declare no conflict of interest.

References

  1. Zhu, Y.; Li, G.; Zhang, G.; Fu, B. Soil security: From Earth’s critical zone to ecosystem services. Acta Geogr. Sin. 2015, 70, 1859–1869. [Google Scholar]
  2. Chen, Q.; Wang, X.; Xia, Y.; Huang, J.; Yin, Y.; Nie, W.; Guo, H. Research on the evaluation method of the ecosystem services of Earth’s critical zone. J. Nanjing Univ. Nat. Sci. 2022, 58, 1070–1086. [Google Scholar] [CrossRef]
  3. Orgiazzi, A.; Panagos, P.; Yigini, Y.; Dunbar, M.B.; Gardi, C.; Montanarella, L.; Ballabio, C. A Knowledge-Based Approach to Estimating the Magnitude and Spatial Patterns of Potential Threats to Soil Biodiversity. Sci. Total Environ. 2016, 545, 11–20. [Google Scholar] [CrossRef]
  4. Aksoy, E.; Louwagie, G.; Gardi, C.; Gregor, M.; Schroeder, C.; Loehnertz, M. Assessing Soil Biodiversity Potentials in Europe. Sci. Total Environ. 2017, 589, 236–249. [Google Scholar] [CrossRef]
  5. Veresoglou, S.D.; Halley, J.M.; Rillig, M.C. Extinction Risk of Soil Biota. Nat. Commun. 2015, 6, 8862. [Google Scholar] [CrossRef] [Green Version]
  6. Keesstra, S.D.; Bouma, J.; Wallinga, J.; Tittonell, P.; Smith, P.; Cerda, A.; Montanarella, L.; Quinton, J.N.; Pachepsky, Y.; van der Putten, W.H.; et al. The Significance of Soils and Soil Science towards Realization of the United Nations Sustainable Development Goals. Soil 2016, 2, 111–128. [Google Scholar] [CrossRef] [Green Version]
  7. Stone, D.; Blomkvist, P.; Hendriksen, N.B.; Bonkowski, M.; Jorgensen, H.B.; Carvalho, F.; Dunbar, M.B.; Gardi, C.; Geisen, S.; Griffiths, R.; et al. A Method of Establishing a Transect for Biodiversity and Ecosystem Function Monitoring across Europe. Appl. Soil Ecol. 2016, 97, 3–11. [Google Scholar] [CrossRef]
  8. Blum, W.E.H.; Busing, J.; Montanarella, L. Research Needs in Support of the European Thematic Strategy for Soil Protection. Trac-Trends Anal. Chem. 2004, 23, 680–685. [Google Scholar] [CrossRef]
  9. Shi, L.; Fu, S. Review of soil biodiversity research:history, current status and future challenges. Chin. Sci. Bull. 2014, 59, 493–509. [Google Scholar]
  10. McCaig, A.E.; Glover, L.A.; Prosser, J.I. Numerical Analysis of Grassland Bacterial Community Structure under Different Land Management Regimens by Using 16S Ribosomal DNA Sequence Data and Denaturing Gradient Gel Electrophoresis Banding Patterns. Appl. Environ. Microbiol. 2001, 67, 4554–4559. [Google Scholar] [CrossRef] [Green Version]
  11. Finlay, B.J.; Esteban, G.F.; Clarke, K.J.; Olmo, J.L. Biodiversity of Terrestrial Protozoa Appears Homogeneous across Local and Global Spatial Scales. Protist 2001, 152, 355–366. [Google Scholar] [CrossRef] [PubMed]
  12. Vandenkoornhuyse, P.; Ridgway, K.P.; Watson, I.J.; Fitter, A.H.; Young, J.P.W. Co-Existing Grass Species Have Distinctive Arbuscular Mycorrhizal Communities. Mol. Ecol. 2003, 12, 3085–3095. [Google Scholar] [CrossRef] [PubMed]
  13. Vandenkoornhuyse, P.; Husband, R.; Daniell, T.J.; Watson, I.J.; Duck, J.M.; Fitter, A.H.; Young, J.P.W. Arbuscular Mycorrhizal Community Composition Associated with Two Plant Species in a Grassland Ecosystem. Mol. Ecol. 2002, 11, 1555–1564. [Google Scholar] [CrossRef] [PubMed] [Green Version]
  14. Floyd, R.; Abebe, E.; Papert, A.; Blaxter, M. Molecular Barcodes for Soil Nematode Identification. Mol. Ecol. 2002, 11, 839–850. [Google Scholar] [CrossRef]
  15. Fitter, A.H.; Gilligan, C.A.; Hollingworth, K.; Kleczkowski, A.; Twyman, R.M.; Pitchford, J.W.; Members of the Nerc Soil Biodiversity Programme. Biodiversity and Ecosystem Function in Soil. Funct. Ecol. 2005, 19, 369–377. [Google Scholar] [CrossRef] [Green Version]
  16. Bünemann, E.K.; Bongiorno, G.; Bai, Z.; Creamer, R.E.; De Deyn, G.; de Goede, R.; Fleskens, L.; Geissen, V.; Kuyper, T.W.; Mäder, P.; et al. Soil Quality—A Critical Review. Soil Biol. Biochem. 2018, 120, 105–125. [Google Scholar] [CrossRef]
  17. Zhao, R.; Wu, K. Soil Health Evaluation of Farmland Based on Functional Soil Management—A Case Study of Yixing City, Jiangsu Province, China. Agriculture 2021, 11, 583. [Google Scholar] [CrossRef]
  18. Liu, Y.; Wu, K.; Zhao, R. Bibliometric Analysis of Research on Soil Health from 1999 to 2018. J. Soils Sediments 2020, 20, 1513–1525. [Google Scholar] [CrossRef]
  19. Turbé, A.; Toni, A.; Benito, P.; Lavelle, P.; Lavelle, P.; Camacho, N.; Putten, W.; Labouze, E.; Mudgal, S. Soil Biodiversity: Functions, Threats and Tools for Policy Makers; Report European Commission: Brussels, Belgium, 2010. [Google Scholar]
  20. Zhu, Y.; Chen, B.; Fu, W. Research frontiers in soil ecology. Sci. Technol. Rev. 2022, 40, 25–31. [Google Scholar]
  21. Lemanceau, P.; Creamer, R.; Griffiths, B.S. Soil Biodiversity and Ecosystem Functions across Europe: A Transect Covering Variations in Bio-Geographical Zones, Land Use and Soil Properties. Appl. Soil Ecol. 2016, 97, 1–2. [Google Scholar] [CrossRef]
  22. Lemanceau, P.; Maron, P.-A.; Mazurier, S.; Mougel, C.; Pivato, B.; Plassart, P.; Ranjard, L.; Revellin, C.; Tardy, V.; Wipf, D. Understanding and Managing Soil Biodiversity: A Major Challenge in Agroecology. Agron. Sustain. Dev. 2015, 35, 67–81. [Google Scholar] [CrossRef] [Green Version]
  23. Thomson, B.C.; Tisserant, E.; Plassart, P.; Uroz, S.; Griffiths, R.I.; Hannula, S.E.; Buee, M.; Mougel, C.; Ranjard, L.; Van Veen, J.A.; et al. Soil Conditions and Land Use Intensification Effects on Soil Microbial Communities across a Range of European Field Sites. Soil Biol. Biochem. 2015, 88, 403–413. [Google Scholar] [CrossRef]
  24. Tsiafouli, M.A.; Thebault, E.; Sgardelis, S.P.; de Ruiter, P.C.; van der Putten, W.H.; Birkhofer, K.; Hemerik, L.; de Vries, F.T.; Bardgett, R.D.; Brady, M.V.; et al. Intensive Agriculture Reduces Soil Biodiversity across Europe. Glob. Chang. Biol. 2015, 21, 973–985. [Google Scholar] [CrossRef] [PubMed] [Green Version]
  25. Wu, E.; Sun, L.; San, Q.; Cao, C.; Tian, X.; He, Q. Effects of different crop rotation patterns on the physicochemical properties and enzymatic activities of black soils in Northeast China. China Agric. Technol. Ext. 2021, 37, 70–75, 80. [Google Scholar]
  26. Qiu, C.; Han, X.; Lu, X.; Yan, J.; Chen, X.; Zhou, W. Effects of maize straw incorporation on soil fertility and crop production in the black soil region of Northeast China. Soils Crop. 2020, 9, 277–286. [Google Scholar]
  27. Zou, W.; Han, X.; Yan, J.; Chen, X.; Lu, X.; Qiu, C.; Hao, X. Effects of incorporation depth of tillage and straw returning on soil physical properties of black soil in Northeast China. Trans. Chin. Soc. Agric. Eng. 2020, 36, 9–18. [Google Scholar]
  28. Tang, H.; Cheng, F.; Zhang, L. Exploration and perspectives on the conservation of soil biodiversity in arable land. China Land 2022, 2, 11–13. [Google Scholar] [CrossRef]
  29. Guerra, C.A.; Heintz-Buschart, A.; Sikorski, J.; Chatzinotas, A.; Guerrero-Ramirez, N.; Cesarz, S.; Beaumelle, L.; Rillig, M.C.; Maestre, F.T.; Delgado-Baquerizo, M.; et al. Blind Spots in Global Soil Biodiversity and Ecosystem Function Research. Nat. Commun. 2020, 11, 3870. [Google Scholar] [CrossRef]
  30. Chen, H.; Wang, Y.; Sun, X.; Peng, Y.; Xiao, L. Mixing Effect of Polylactic Acid Microplastic and Straw Residue on Soil Property and Ecological Function. Chemosphere 2020, 243, 125271. [Google Scholar] [CrossRef]
  31. Lehmann, J.; Bossio, D.A.; Koegel-Knabner, I.; Rillig, M.C. The Concept and Future Prospects of Soil Health. Nat. Rev. Earth Environ. 2020, 1, 544–553. [Google Scholar] [CrossRef]
  32. Li, Y.; Zhang, J.; Jia, J.; Fan, F.; Zhang, F.; Zhang, J. Research Progresses on Farmland Soil Ecosystem Multifunctionality. Acta Pedol. Sin. 2022, 59, 1177–1189. [Google Scholar]
  33. Creamer, R.E.; Barel, J.M.; Bongiorno, G.; Zwetsloot, M.J. The Life of Soils: Integrating the Who and How of Multifunctionality. Soil Biol. Biochem. 2022, 166, 108561. [Google Scholar] [CrossRef]
  34. Fine, A.; van Es, H.; Schindelbeck, R. Statistics, Scoring Functions, and Regional Analysis of a Comprehensive Soil Health Database. Soil Sci. Soc. Am. J. 2017, 81, 589–601. [Google Scholar] [CrossRef] [Green Version]
  35. Singh, J.; Negi, A. Soil Health Card: An Overview. In Current Research in Soil Science; Aiknik Publication: New Delhi, India, 2020; pp. 43–58. ISBN 978-93-90070-37-4. [Google Scholar]
  36. Li, X.; Zhang, J.; Wu, L.; Ren, Y.; Zhang, J.; Xu, M. Advance in Indicator Screening and Methodologies of Soil Quality Evaluation. Sci. Agric. Sin. 2021, 54, 3043–3056. [Google Scholar]
  37. Zhao, J. Biological Monitoring and Assessment of Soil Health. Soils 2006, 38, 136–142. [Google Scholar]
  38. Zhao, R.; Wu, K.; Zhang, X.; Feng, Z. Evaluation on Farmland Health Productivity in Main Grain Production Areas: A Case Study in Wen County of Henan Province. China Land Sci. 2019, 33, 67–75. [Google Scholar]
  39. Lu, R. Methods for Agricultural Chemical Analysis of Soil; China Agricultural Science and Technology Press: Beijing, China, 2000; ISBN 978-7-80119-925-6. [Google Scholar]
  40. Brookes, P.C.; Landman, A.; Pruden, G.; Jenkinson, D.S. Chloroform Fumigation and the Release of Soil Nitrogen: A Rapid Direct Extraction Method to Measure Microbial Biomass Nitrogen in Soil. Soil Biol. Biochem. 1985, 17, 837–842. [Google Scholar] [CrossRef]
  41. Rillig, M.C.; Ryo, M.; Lehmann, A.; Aguilar-Trigueros, C.A.; Buchert, S.; Wulf, A.; Iwasaki, A.; Roy, J.; Yang, G. The Role of Multiple Global Change Factors in Driving Soil Functions and Microbial Biodiversity. Science 2019, 366, 886–890. [Google Scholar] [CrossRef]
  42. Pugnaire, F.I.; Morillo, J.A.; Penuelas, J.; Reich, P.B.; Bardgett, R.D.; Gaxiola, A.; Wardle, D.A.; van der Putten, W.H. Climate Change Effects on Plant-Soil Feedbacks and Consequences for Biodiversity and Functioning of Terrestrial Ecosystems. Sci. Adv. 2019, 5, eaaz1834. [Google Scholar] [CrossRef] [Green Version]
  43. Sanyal, A.; Moitra, M.N.M. Abundance and Group Diversity of Soil Mite Population in Relation to Four Edaphic Factors at Chintamani Abhayaranya, Narendrapur, South 24-Parganas, West Bengal. Proc. Zool. Soc. 2009, 62, 57–65. [Google Scholar] [CrossRef]
  44. Kergunteuil, A.; Campos-Herrera, R.; Sánchez-Moreno, S.; Vittoz, P.; Rasmann, S. The Abundance, Diversity, and Metabolic Footprint of Soil Nematodes Is Highest in High Elevation Alpine Grasslands. Front. Ecol. Evol. 2016, 4, 84. [Google Scholar] [CrossRef] [Green Version]
  45. Han, X.; Zou, W.; Yang, F. Main Achievements, Challenges, and Recommendations of Black Soil Conservation and Utilization in China. Bull. Chin. Acad. Sci. 2021, 36, 1194–1202. [Google Scholar] [CrossRef]
  46. Han, X.; Zou, W.; Yan, J.; Lu, x.; Chen, X.; Ma, Y.; Guo, Y. China’s Heilongjiang Province creates a “Longjiang model” for blackland conservation and utilization. China Rural Sci. Technol. 2021, 4, 25–27. [Google Scholar]
  47. Zhang, S.; Zhao, R.; Wu, K.; Huang, Q.; Kang, L. Effects of the Rapid Construction of a High-Quality Plough Layer Based on Woody Peat in a Newly Reclaimed Cultivated Land Area. Agriculture 2021, 12, 31. [Google Scholar] [CrossRef]
  48. Muhammad, I.; Wang, J.; Sainju, U.M.; Zhang, S.; Zhao, F.; Khan, A. Cover Cropping Enhances Soil Microbial Biomass and Affects Microbial Community Structure: A Meta-Analysis. Geoderma 2021, 381, 114696. [Google Scholar] [CrossRef]
  49. Ye, S.; Ren, S.; Song, C.; Cheng, C.; Shen, S.; Yang, J.; Zhu, D. Spatial Patterns of County-Level Arable Land Productive-Capacity and Its Coordination with Land-Use Intensity in Mainland China. Agric. Ecosyst. Environ. 2022, 326, 107757. [Google Scholar] [CrossRef]
  50. Ye, S.; Song, C.; Gao, P.; Liu, C.; Cheng, C. Visualizing Clustering Characteristics of Multidimensional Arable Land Quality Indexes at the County Level in Mainland China. Environ. Plan.-Econ. Space 2022, 54, 222–225. [Google Scholar] [CrossRef]
  51. Ye, S.; Song, C.; Shen, S.; Gao, P.; Cheng, C.; Cheng, F.; Wan, C.; Zhu, D. Spatial Pattern of Arable Land-Use Intensity in China. Land Use Policy 2020, 99, 104845. [Google Scholar] [CrossRef]
  52. Brevik, E.C.; Cerda, A.; Mataix-Solera, J.; Pereg, L.; Quinton, J.N.; Six, J.; Van Oost, K. The Interdisciplinary Nature of SOIL. Soil 2015, 1, 117–129. [Google Scholar] [CrossRef] [Green Version]
  53. Demetrio, W.C.; Dionísio, J.A.; Maceda, A. Negative Effects of Earthworms on Soil Nematodes Are Dependent on Earthworm Density, Ecological Category and Experimental Conditions. Pedobiologia 2019, 76, 150568. [Google Scholar] [CrossRef]
  54. Ma, L.; Shao, M.; Li, T. Characteristics of Soil Moisture and Evaporation under the Activities of Earthworms in Typical Anthrosols in China. Sustainability 2020, 12, 6603. [Google Scholar] [CrossRef]
  55. Tan, X.; Nie, Y.; Ma, X.; Guo, Z.; Liu, Y.; Tian, H.; Megharaj, M.; Shen, W.; He, W. Soil Chemical Properties Rather than the Abundance of Active and Potentially Active Microorganisms Control Soil Enzyme Kinetics. Sci. Total Environ. 2021, 770, 144500. [Google Scholar] [CrossRef]
  56. Liu, S.; Wang, Y.; Liu, B.; Liu, H.; Liu, J. Effects of different land management practices on soil carbon and nitrogen, enzyme activities, and microbial diversities northwest of Shanxi. Acta Ecol. Sin. 2019, 39, 4376–4389. [Google Scholar]
  57. Saghaï, A.; Wittorf, L.; Philippot, L.; Hallin, S. Loss in Soil Microbial Diversity Constrains Microbiome Selection and Alters the Abundance of N-Cycling Guilds in Barley Rhizosphere. Appl. Soil Ecol. 2022, 169, 104224. [Google Scholar] [CrossRef]
  58. Yang, W.; Lan, H.; Li, M.; Meng, C. Predicting bulk density and porosity of soil using image processing and support vector regression. Trans. Chin. Soc. Agric. Eng. 2021, 37, 144–151. [Google Scholar]
  59. Di, X.; Wu, H.; Jia, H.; Zhang, W.; Gu, H.; Shao, M.; Sheng, J. Construction of Relationship Model between Soil Bulk Density and Soil Organic Carbon Content of Main Grasslands in Xinjiang. Chin. J. Soil Sci. 2021, 52, 1323–1329. [Google Scholar] [CrossRef]
  60. Gardi, C.; Montanarella, L.; Arrouays, D.; Bispo, A.; Lemanceau, P.; Ranjard, L.; Mulder, C.; Rutgers, M.; Menta, C. Soil Biodiversity Monitoring in Europe: Ongoing Activities and Challenges. Eur. J. Soil Sci. 2009, 60, 807–819. [Google Scholar] [CrossRef] [Green Version]
  61. Gould, I.J.; Quinton, J.N.; Weigelt, A.; De Deyn, G.B.; Bardgett, R.D. Plant Diversity and Root Traits Bene-fit Physical Properties Key to Soil Function in Grasslands. Ecol. Lett. 2016, 19, 1140–1149. [Google Scholar] [CrossRef] [PubMed] [Green Version]
  62. Orgiazzi, A.; Panagos, P. Soil Biodiversity and Soil Erosion: It Is Time to Get Married. Glob. Ecol. Biogeogr. 2018, 27, 1155–1167. [Google Scholar] [CrossRef]
  63. Zhao, H.; Xu, F.; Wang, W.; Wang, W.; Chen, Q.; Zhao, Y.; Ma, Y. Soil nutrients and enzyme activities in Larix principis-rupprechtii plantations in the Qinling Mountains, China. Acta Ecol. Sin. 2015, 35, 1086–1094. [Google Scholar]
  64. Luo, L.; Meng, H.; Gu, J.-D. Microbial Extracellular Enzymes in Biogeochemical Cycling of Ecosystems. J. Environ. Manag. 2017, 197, 539–549. [Google Scholar] [CrossRef] [PubMed]
  65. Zhong, L.; Wu, T.; Ding, J.; Xu, W.; Yuan, F.; Liu, B.-F.; Zhao, L.; Li, Y.; Ren, N.-Q.; Yang, S.-S. Co-Composting of Faecal Sludge and Carbon-Rich Wastes in the Earthworm’s Synergistic Cooperation System: Performance, Global Warming Potential and Key Microbiome. Sci. Total Environ. 2023, 857, 159311. [Google Scholar] [CrossRef]
  66. Escudero, H.J.; Domínguez, A.; Bedano, J.C. Large-Scale Ecologically-Based Farming Systems Foster Earthworm Communities and Their Contribution to Ecosystem Processes. Appl. Soil Ecol. 2023, 185, 104800. [Google Scholar] [CrossRef]
  67. Bartz, M.L.C.; Brown, G.G.; da Rosa, M.G.; Filho, O.K.; James, S.W.; Decaëns, T.; Baretta, D. Earthworm Richness in Land-Use Systems in Santa Catarina, Brazil. Appl. Soil Ecol. 2014, 83, 59–70. [Google Scholar] [CrossRef]
  68. Masin, C.; Rodríguez, A.R.; Zalazar, C.; Godoy, J.L. Approach to Assess Agroecosystem Anthropic Disturbance: Statistical Monitoring Based on Earthworm Populations and Edaphic Properties. Ecol. Indic. 2020, 111, 105984. [Google Scholar] [CrossRef]
  69. Ahmed, S.; Marimuthu, N.; Tripathy, B.; Julka, J.M.; Chandra, K. Earthworm Community Structure and Diversity in Different Land-Use Systems along an Elevation Gradient in the Western Himalaya, India. Appl. Soil Ecol. 2022, 176, 104468. [Google Scholar] [CrossRef]
  70. Zhang, X.; Wang, G.; Xu, X. Effects of Earthworms of Different Ecological Types on Organic Carbon Content in Soil Aggregates. J. Northeast For. Univ. 2023, 51, 101–105. [Google Scholar] [CrossRef]
Figure 1. Location of the study areas and distribution of the sampling plots.
Land 12 00755 g001
Figure 2. Distribution of data on soil biological indicators for typical farmland in the different regions. Subplots (AF) represent the range and variability of data distribution for six soil bioindicators from three different regions. Where black boxes indicate Hailun County, yellow boxes indicate Wen County and blue boxes indicate Yixing County; lowercase letters indicate significant differences at the 0.05 level (n = 3).
Land 12 00755 g002
Figure 3. Heat map of the overall correlations between the soil biological indicators and soil physicochemical indicators for typical farmland in the different regions. BD: Bulk density; SWC: Soil water content; EC: Electrical conductivity; CEC: Cation exchange capacity; SOM: Soil organic matter; TN: Total nitrogen; TP: Total phosphorus; HN: Hydrolysable nitrogen; AP: Available phosphorus; AK: Available potassium.
Land 12 00755 g003
Figure 4. Redundancy analysis of soil bioindicators and soil physicochemical indicators. The figure shows only the explanatory factor variables that have a significant effect on the soil biological indicators. HL: Hailun county; WX: Wen county; YX: Yixing county.
Land 12 00755 g004
Table 1. Multiple comparisons of the soil physico-chemical properties of agricultural land in the different regions *.
IndicatorUnitHailun CountyWen CountyYixing County
Bulk density (BD)g·cm−31.18 ± 0.11 b1.43 ± 0.13 a1.12 ± 0.19 b
Soil water content (SWC)%26.73 ± 4.12 a11.65 ± 4.77 b28.21 ± 7.09 a
pH value (pH)6.78 ± 0.67 b8.46 ± 0.28 a6.62 ± 0.51 b
Electrical conductivity (EC)us·cm−171.52 ± 35.65 b135.34 ± 78.43 a66.16 ± 30.74 b
Cation exchange capacity (CEC)cmol+·kg−121.52 ± 2.5522.59 ± 2.3223.13 ± 2.91
Soil organic matter (SOM)g·kg−144.38 ± 7.88 a14.21 ± 4.32 bc29.58 ± 9.67 b
Total nitrogen (TN)g·kg−12.58 ± 0.39 a1.09 ± 0.32 bc1.96 ± 0.53 b
Total phosphorus (TP)g·kg−10.72 ± 0.280.67 ± 0.220.56 ± 0.23
Hydrolysable nitrogen (HN)mg·kg−1186.94 ± 31.18 a75.88 ± 26.67 bc134.92 ± 34.42 b
Available phosphorus (AP)mg·kg−128.64 ± 19.02 a13.30 ± 7.80 b17.24 ± 16.99 b
Available potassium (AK)mg·kg−1141.28 ± 89.02 a145.12 ± 68.68 a81.89 ± 60.18 b
* Data (Mean ± SD, n = 3, p < 0.05), lowercase letters represent significant differences at the 0.05 level.
Table 2. Redundancy analysis of the soil bioindicators values and the amount of explanation.
AxisAxis 1Axis 2Axis 3Axis 4
Soil bioindicators eigenvalues/%60.7624.787.503.47
Soil bioindicators—physicochemical indicators correlations0.8060.6770.3750.208
Cumulative explained amount of soil bioindicators characteristics/%60.7685.5493.0496.51
Cumulative percentage variance of soil bioindicators—physicochemical indicators/%62.0783.0295.23100
Sum of all eigenvalues1.000
Sum of all canonical eigenvalues0.620
Disclaimer/Publisher’s Note: The statements, opinions and data contained in all publications are solely those of the individual author(s) and contributor(s) and not of MDPI and/or the editor(s). MDPI and/or the editor(s) disclaim responsibility for any injury to people or property resulting from any ideas, methods, instructions or products referred to in the content.

