Article

Spatial Differentiation and Influencing Mechanisms of Farmland Transfer Rents in Mountainous Areas: Evidence from Chongqing and Its Surrounding Areas

1
School of Public Administration, Chongqing Technology and Business University, Chongqing 400067, China
2
China Land Surveying and Planning Institute, Beijing 100035, China
*
Author to whom correspondence should be addressed.
These authors contributed equally to this work.
Land 2023, 12(3), 699; https://doi.org/10.3390/land12030699
Submission received: 3 February 2023 / Revised: 7 March 2023 / Accepted: 15 March 2023 / Published: 16 March 2023

Abstract

:
This study used Chongqing, a municipality in mountainous southwest China, and its surrounding areas as a case study to explore the spatial differentiation of farmland transfer rents in mountainous areas, with the aim of serving as a theoretical and practical reference to realize the value of farmland, ensure regional food security, and promote stable and sound development of the farmland transfer market. In doing so, we applied the GIS spatial analysis method to explore the spatial differentiation and influencing mechanisms of farmland transfer rents in mountainous areas. Our results indicate that farmland transfer rents in mountainous areas have a significant high and low clustering tendency. The high-value areas of farmland transfer rents are mainly located in the downtown area and the west of Chongqing, while the low-value areas are mainly distributed in the Daba Mountains and Wuling Mountains, which are two national contiguous areas of dire poverty. Location and terrain factors are the main driving forces for the spatial differentiation of farmland transfer rents in mountainous areas. Specifically, a 1% increase in farmland mean slope and farmland supply-demand ratio in the study area will lead to a 0.13 and 0.15% decrease in farmland transfer rents, respectively, while a 1% increase in GDP will drive up farmland transfer rents by 0.09%. The policy factor is not significant. The influence of terrain and farmland supply and demand on transfer rents increased from west to east, whereas the influence of traffic location on transfer rents decreased in an outward direction from the southwest of the study area. It is concluded that local governments should objectively view the spatial differentiation of farmland transfer rents in mountainous areas and avoid the blind comparison of transfer rents between regions. Mountainous areas with low transfer rents should focus on increasing the intrinsic value of farmland assets by stimulating effective demand for farmland and improving farming conditions, while mountainous areas with high transfer rents in major grain-producing counties should be wary of their impact on grain production to ensure regional food security.

1. Introduction

Transfers of farmland in China have long been considered an important measure for optimizing the allocation of farmland resources, transferring surplus rural labor, and increasing the incomes of farmers [1,2,3]. In 2007, the 17th National Congress of the Communist Party of China stated, “We will improve the market for the compensated, voluntary transfer of land contract and management rights in accordance with the law and allow diverse forms of farming operations to develop to an appropriate scale where conditions permit”. Subsequently, the Chinese government vigorously promoted farmland transfers as a useful method of encouraging appropriately scaled-up agricultural operations and the modernization of the agricultural industry [4,5,6]. Many local governments also issued subsidy policies aimed at encouraging farmland transfers [7,8,9]. Against this backdrop, farmland transfers in China increased rapidly in a short period of time. According to the Ministry of Agriculture and Rural Affairs of the People’s Republic of China, the area of transferred farmland contracted by households in China increased from 4.25 million hectares in 2007 to 35.48 million hectares in 2020, with the proportion of transferred farmland reaching 34.08%. As farmland transfers have continuously expanded, transfer rents have become a prominent issue that has attracted the attention of decision-makers, theorists, and agricultural producers [10,11,12]. Price is a vital element of the market economy, and reasonable transfer rents not only boost enthusiasm for farmland transfers and promote appropriately scaled-up agricultural operations, but they also increase farmers’ property income [13]. When transfer rents are significantly higher or lower than what is reasonable, it has negative effects on agricultural production [14,15]. Too low and they inhibit the enthusiasm of farmers to transfer farmland, leading to inefficient use of land or land being left uncultivated; too high and they reduce profits from agriculture and encourage the use of land for purposes other than food crop cultivation or other agricultural production [16,17]. As a result, conducting research on farmland transfer rents holds great practical significance for realizing the value of farmland, ensuring regional food security, and promoting the stable and sound development of the farmland transfer market.
Although academics in China have started to research farmland transfer rents in recent years, the existing literature is limited in scope. In terms of scale, previous studies have focused on microscale features and influencing factors from the perspective of farmers and plots [18,19], with few studies at the macroscale. In terms of content, studies have mostly considered influences on transfer rents from the perspective of single factors, such as social relations [20,21], government intervention [11,21], and determining rural collective land ownership [22,23], with relatively few studies conducting multifactor analysis of influencing mechanisms. In the few studies involving multifactor analysis, scholars usually construct an index system of influencing factors from farmland, household, and regional characteristics [24,25,26]. Nevertheless, influencing factor index systems are mostly used in microscale research and are not suitable for use in macroscale studies. Furthermore, the existing literature includes few theoretical analyses of influencing factors, so there is no comprehensive framework for theoretical analysis. In terms of methods, scholars have tended to use traditional econometric methods such as OLS [27,28], logistic [19,29], and quantile regression [30,31] to study factors that influence farmland transfer rents, with relatively few studies using GIS spatial analysis to explore spatial differentiation. In terms of study areas, scholars have looked at major grain-producing provinces in the plains of China, such as Jiangsu [17,32], Hebei [29,33], and Heilongjiang [25,34]. Few have studied mountainous areas in non-major grain-producing provinces.
Based on land rent, location, and property rights theory, this paper first constructs an analysis framework by considering in-depth the internal mechanisms between farmland transfer rents and natural, location, and policy factors. Based on this, we analyze and select the key factors that affect transfer rents. Second, this paper considers the case of Chongqing in southwest China and its surrounding areas and uses exploratory spatial data analysis to reveal spatial differentiation of farmland transfer rents in mountainous areas. Finally, we apply spatial coupling analysis, a spatial econometrics model, and geographically weighted regression (GWR) to explore the spatial differentiation mechanisms. This paper seeks to reveal spatial differentiation of farmland transfer rents in mountainous areas and serve as a theoretical and empirical reference for improving the value of farmland assets in poor mountainous areas, ensuring regional food security, and promoting the stable and sound development of the farmland transfer market.

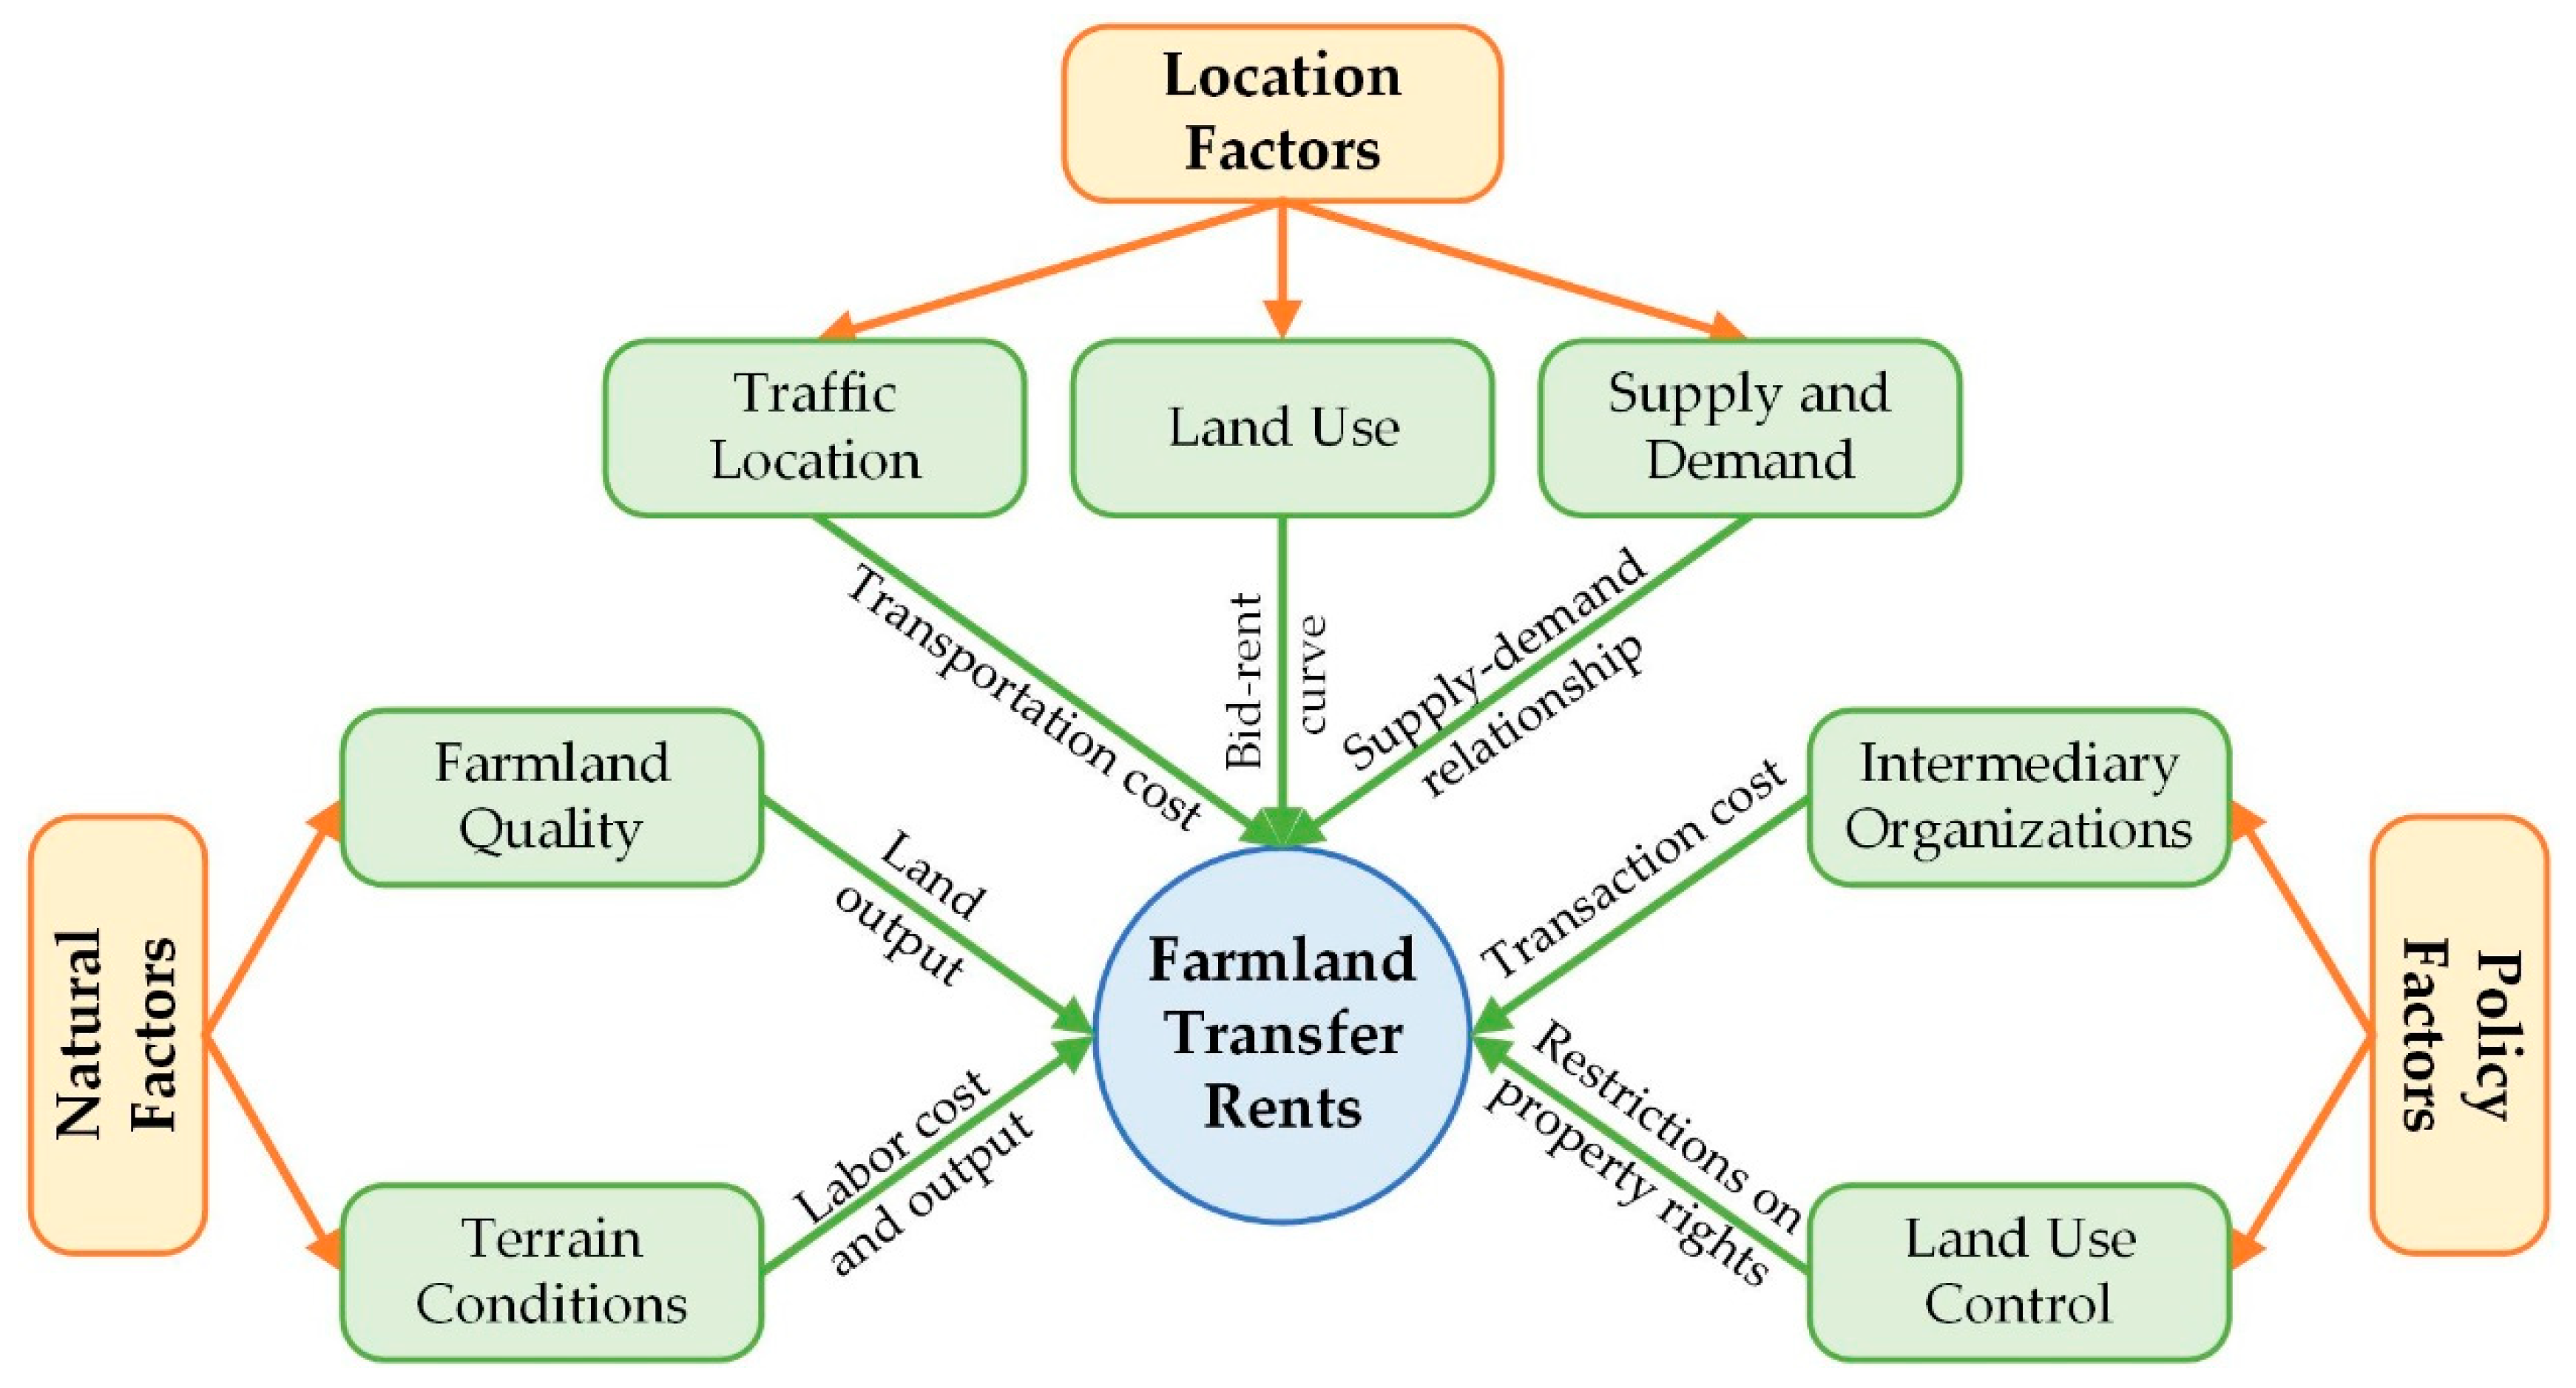
2. Theoretical Framework and Index System

Based on the above summary of the theoretical background and analytical methods of the existing literature, this study uses land rent, location, and property rights theory to construct an analysis framework that includes natural, regional, and policy factors to theoretically analyze mechanisms that affect farmland transfer rents (Figure 1).

2.1. The Influence of Natural Factors on Farmland Transfer Rents

According to land rent theory, farmland rent is compensation for the use of farmland for agricultural production. It is the surplus attributable to land after subtracting production costs from agricultural output value per unit area, which is agricultural excess profit [35]. According to the definition of land rent, the level of land rent is mainly affected by the output and cost of land [36,37,38]. The latter mainly includes materials and labor costs. The costs of materials such as seeds, fertilizers, and pesticides remain relatively stable within certain spatial and temporal ranges, but labor costs vary significantly due to different terrain conditions [39]. This is because terrain conditions directly determine the degree to which manual labor must be used instead of agricultural machinery. A study found that the agricultural mechanization rate in mountainous areas and counties in China is only 46.87%, compared to nearly 90% in plains [40]. Since labor costs account for a large proportion (about 40%) of agricultural production costs in China, and the use of agricultural machinery can significantly reduce labor costs [41,42], the production cost of farmland under different terrain conditions varies significantly. Additionally, terrain may indirectly reduce agricultural income by restricting the area of farmland under management. On flat land, contiguous farmland is easily concentrated and transferred together, which is conducive to large-scale agriculture. In mountainous areas, however, the fragmentation of farmland means it is more difficult to amass and manage contiguous land [43]. Many studies have shown that large-scale agricultural operators are more likely to achieve economies of scale [44,45,46], which may further widen the gap in income under different farmland terrain conditions.

2.2. The Influence of Location Factors on Farmland Transfer Rents

According to location theory, the main location factors that affect farmland transfer rents are traffic location, land use, and supply and demand [47,48]. In terms of traffic location, the 19th century economist von Thünen pointed out that farms located closer to a market will have lower transport cost. All being equal, a farm closer to the market will achieve more excess profits [24,49], and this part of excess profits becomes differential rent Ⅰ. In terms of land use, economic rent decline curves produced by land in different locations vary, and spatial differences in land use inevitably appear under the bid rent curve [50]. Generally speaking, farmland with good location conditions tends to be used to grow fruit and vegetables or other economic crops that can cover high rent. On the other hand, farmland with poor location conditions tends to be used to plant more common cash crops and food crops with low rent capacity [51]. Thus, spatial differences in the crop structure of farmland can lead to spatial differentiation of farmland transfer rents. In addition, we cannot ignore the influence of farmland supply and demand in different locations on farmland transfer rents, as the relationship between supply and demand has a direct impact on land prices [52,53]. Specifically, in economically developed districts and counties, due to high levels of urbanization and industrialization, a large area of land is given over to construction, reducing the area of farmland. Furthermore, the strong population siphon effect of these areas and population density means that demand for farmland is greater. Due to the law of supply and demand, farmland transfer rents are higher. Conversely, in economically backward county-level divisions, due to large outflows of rural residents, the potential supply of farmland is higher and the population base is smaller, so effective demand for farmland is lacking and transfer rents are usually lower.

2.3. The Iinfluence of Policy Factors on Farmland Transfer Rents

The widespread application of institutional economic theory in land economic research has encouraged scholars to look at the impact of intermediary organizations [18,21] and land use control [54,55] on farmland transfer rents. The former primarily affects transfer rents through transaction costs. Some studies have found that in areas lacking an intermediary organization for farmland transfers, high transaction costs encourage farmers to transfer farmland to acquaintances with blood and geographical ties at a lower rate or even zero rent. In areas with effective intermediary services, however, farmers are more inclined to engage in market-based transfers, thereby obtaining higher farmland transfer rents [32,56]. Land use control mainly affects the transfer rents of farmland by restricting land use rights. In practice, land use controls can lead to significant differences in rent for adjoining land due to different potential uses [57]. The Chinese government has for a long time implemented a strict land use system. In the interests of food security, the government has formulated stringent regulations on farmland use [58,59]. In recent years, due to the impact of the coronavirus pandemic and abnormal fluctuations in the international grain market, food security has received unprecedented interest from China’s top leaders. In late 2020, the central government issued a special policy to prohibit the use of farmland for purposes other than food production [60,61]. Due to the above restrictions, farmland in major grain-producing counties can be subject to more controls on usage, which can lead to differences in land rent between major grain-producing counties and non-major grain-producing counties.

2.4. Index System of Influencing Factors

Based on the above theoretical analysis, this study constructed an index system consisting of seven indicators from the three categories of natural, location, and policy factors that have affected farmland transfer rents in mountainous areas (Table 1). For natural factors, we selected the grade of farmland to represent land quality. Farmland quality grade is a comprehensive index that reflects soil fertility and environmental quality within a certain area [62]. There are 15 grades in total, with grade 1 being the best farmland quality and grade 15 the worst [63]. We also selected the farmland mean slope in each county to represent terrain conditions. In terms of location factors, it is difficult to directly quantify traffic location conditions on a macro scale, but studies have shown that traffic location advantages are highly correlated with regional economic development levels [64,65]; therefore, we chose GDP to reflect traffic location conditions of each county. We also chose regional crop structure to represent land use. The regional crop structure is the proportion of sown area used for economic crops, such as fruit and vegetables. The relationship between supply and demand is represented by the supply-demand ratio of farmland (farmland supply-demand ratio = farmland supply/farmland demand). A supply-demand ratio of farmland greater than 1 indicates an oversupply, and a value of less than 1 indicates a shortage of supply. In terms of policy factors, the development status of intermediary organizations is represented by the dummy variable “Is there a county-level farmland transfer platform?” Land use control is represented by the dummy variable “Is it a major grain-producing county in the country?”.

3. Materials and Methods

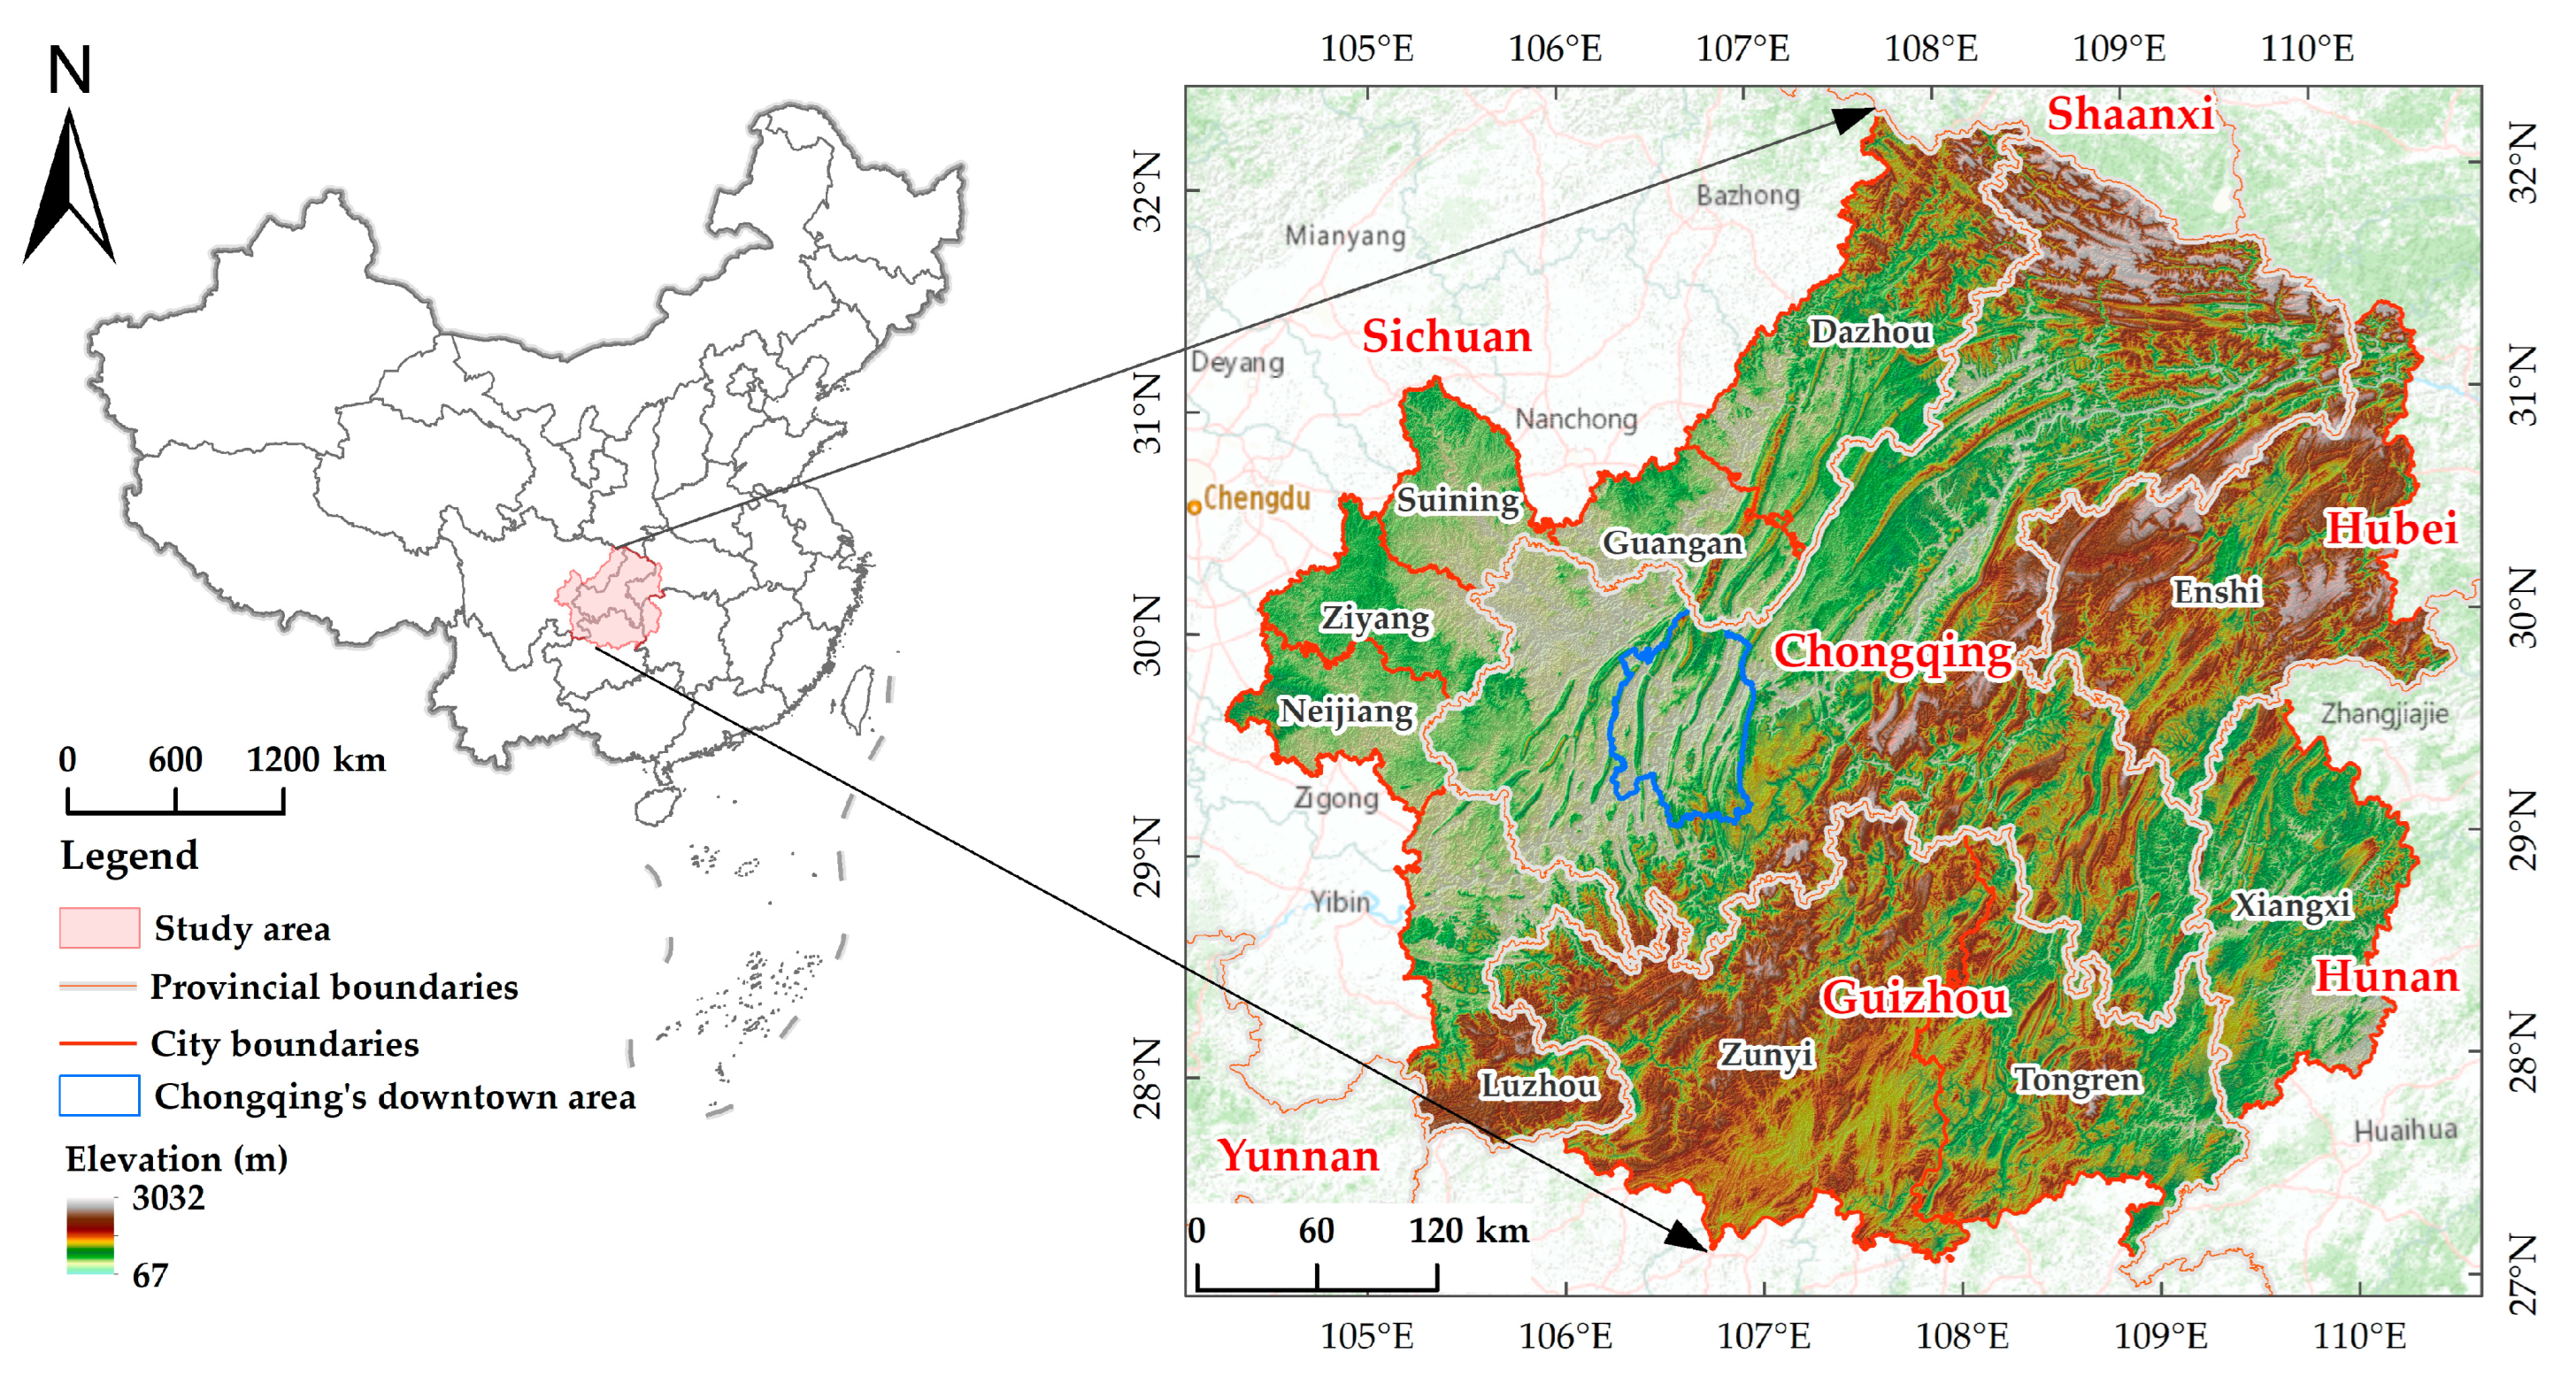
3.1. Study Area Overview

This study used the city of Chongqing and its surrounding areas in mountainous southwest China as the study area (Figure 2). Chongqing is China’s fourth-largest municipality directly under the central government, with 38 counties under its jurisdiction. It is known as the “mountain city”, with mountains accounting for 76% of its land areas, hills for 22%, and flat land for only 2%. The mountains are mainly in the northeast, east, southeast, and south of Chongqing. The many mountain ranges include Daba Mountains, Wu Mountains, Wuling Mountains, and Dalou Mountains. Hilly areas are mainly in the central and northwest parts of Chongqing. The farmland transfer market has developed rapidly in Chongqing in recent years, with the proportion of transferred farmland increasing from 15.88% in 2007 to 43% in 2021. It should be noted that this study expands the scope of the research area to surrounding districts and counties of Chongqing because these areas belong to the southwest mountainous area geographically. It is also for the sake of our model’s robustness. According to statistical principles, in multivariate analysis, the sample size needs to be at least 10 times larger than the explanatory variables for the model to be robust [66,67]. There are seven influencing factors in this study, so the sample size should be at least 70 for the regression analysis to be reliable. Chongqing alone did not meet the robustness requirements of the model. As a result, this study included 10 prefecture-level cities adjacent to Chongqing in the study area. These prefecture-level cities are Dazhou, Guang’an, Suining, Ziyang, Neijiang, and Luzhou in Sichuan Province, Zunyi and Tongren in Guizhou Province, Xiangxi in Hunan Province, and Enshi in Hubei Province.

3.2. Data Sources

The explained variable in this study is mean farmland transfer rents of each county-level division. Data were obtained from 2895 samples of farmland transfers. The samples included 733 samples surveyed by the Ministry of Natural Resources in the study area in 2021 as well as 2162 samples of farmland transfers collected by the research team during the 3-year period from 5 February to 6 March 2022 through rural property rights trading websites for each county-level division, websites of Tuliu (https://www.tuliu.com/), and websites of county-level governments. These data cover a total of 100 counties in the study area. Since the trading time of these sample points was different, in order to ensure data quality, we used 31 December 2020 as the base date and performed date correction on the data according to the land price trend method. Then, taking county-level divisions as the spatial unit, the mean ±2 times the standard deviation was used to eliminate anomalous sample points. Through data preprocessing, a total of 382 sample points were eliminated. This left 2513 valid sample points, giving a sample validity rate of 86.80%. The minimum sample size of a county-level division was 13, the maximum was 68, and the mean was 25. Finally, the arithmetic mean of the remaining sample points in each county-level division was used as the mean farmland transfer rents for that county-level division in 2020.
The data sources for the explanatory variables are as follows. First, farmland quality grade data for the study area came from the Land Consolidation and Rehabilitation Center of the Ministry of Natural Resources. Second, the farmland mean slope was obtained from overlay analysis of the farmland vector layer and 30 m resolution slope data for each county-level division. Specifically, overlay analysis of the farmland vector layer and slope data in each county-level division was performed in ArcGIS 10.4.1 software to obtain the slope data of each map patch. Then, the farmland mean slope in each county-level division was calculated using the zoning statistics tool in ArcGIS 10.4.1. The farmland vector layer was from the land use remote-sensing monitoring data of the Chinese Academy of Sciences in 2020. Slope data were calculated in ArcGIS 10.4.1 based on Terra Advanced Spaceborne Thermal Emission and Reflection Radiometer (ASTER) Global Digital Elevation Model (GDEM) data. Third, GDP data were obtained from the 2021 statistical yearbooks published on the websites of city governments of each county-level division. Fourth, the regional crop structure was the planted area of economic crops such as fruit and vegetables divided by the total planted area of crops. The areas of economic crops and of all agricultural crops were obtained from 2021 statistical yearbooks published on the websites of city governments of county-level divisions. Fifth, the supply of farmland required to calculate the ratio of farmland supply and demand was the farmland area of all county-level divisions in 2020. The data were obtained from the third land and resources survey bulletin published on the website of each county-level government. Data on farmland demand came from the farmland supply and demand model for 2020. For the calculation formula and calculation process of the farmland supply and demand model and area of farmland demand, please refer to Yang et al. [68]. Sixth, the answer to “Is there a county-level farmland transfer platform?” was determined via a web search. Seventh, the answer to “Is it a main grain-producing county of the country?” was determined based on the list of 800 major grain-producing counties issued by the Ministry of Agriculture and Rural Affairs. The basic definitions and descriptions of the variables are shown in Table 2.

3.3. Research Methods

To determine spatial differentiation of farmland transfer rents in mountainous areas and its influencing mechanisms, this study first used descriptive statistical analysis and exploratory spatial data analysis to reveal the global and local spatial differentiation characteristics of farmland transfer rents in mountainous areas. We then used bivariate Moran’s I to measure the spatial coupling relationship between farmland transfer rents and the explanatory variables to screen out explanatory variables that have a significant correlation with farmland transfer rents. In the next step, to avoid multicollinearity impacting the robustness of the model, multicollinearity diagnostics were conducted prior to spatial econometric analysis. Having confirmed the absence of multicollinearity among the explanatory variables, spatial econometrics was used to analyze the spatial differentiation mechanisms of farmland transfer rents. Finally, spatial heterogeneity of explanatory variables was considered using GWR. Since these methods have been introduced in detail in previous studies, the specific principles and equations are not repeated here. Readers may refer to Wang et al. and Lei et al. [69,70] for the exploratory spatial data analysis and spatial coupling analysis, Jiang et al. and Guastella et al. [71,72] for the spatial econometrics model, and Sun et al. and Zhang et al. [73,74] for GWR. It should be noted that due to differences in the magnitude of variables, to reduce the impact of heteroskedasticity on model stability and reveal the elastic relationship between explained and explanatory variables, when conducting spatial coupling, spatial econometrics, and GWR analysis, we used natural logarithm processing for the explanatory variables and the explained variables at the same time. The basic form of the model is as follows:
L n ( Y j ) = α + i = 1 5 β i L n ( X i j ) + k = 1 2 λ k D k j + ε
where Y j is the average farmland transfer rents in the j-th district; X i j is the i-th explanatory variable of the j-th district, i ∈ [1,5], i from 1 to 7 are the farmland quality grade, farmland mean slope, GDP, regional crop structure, farmland supply-demand ratio, respectively; D k j is the k-th dummy variable of the j-th district, k ∈ [1,2], k from 1 to 2 are “Is there a county-level farmland transfer platform?”, and “Is it a major grain-producing county in the country?”, respectively; ε is the random error; α is a constant; β i is the estimated coefficient of the explanatory variable; and λ k is the estimated coefficient of the dummy variable.

4. Results

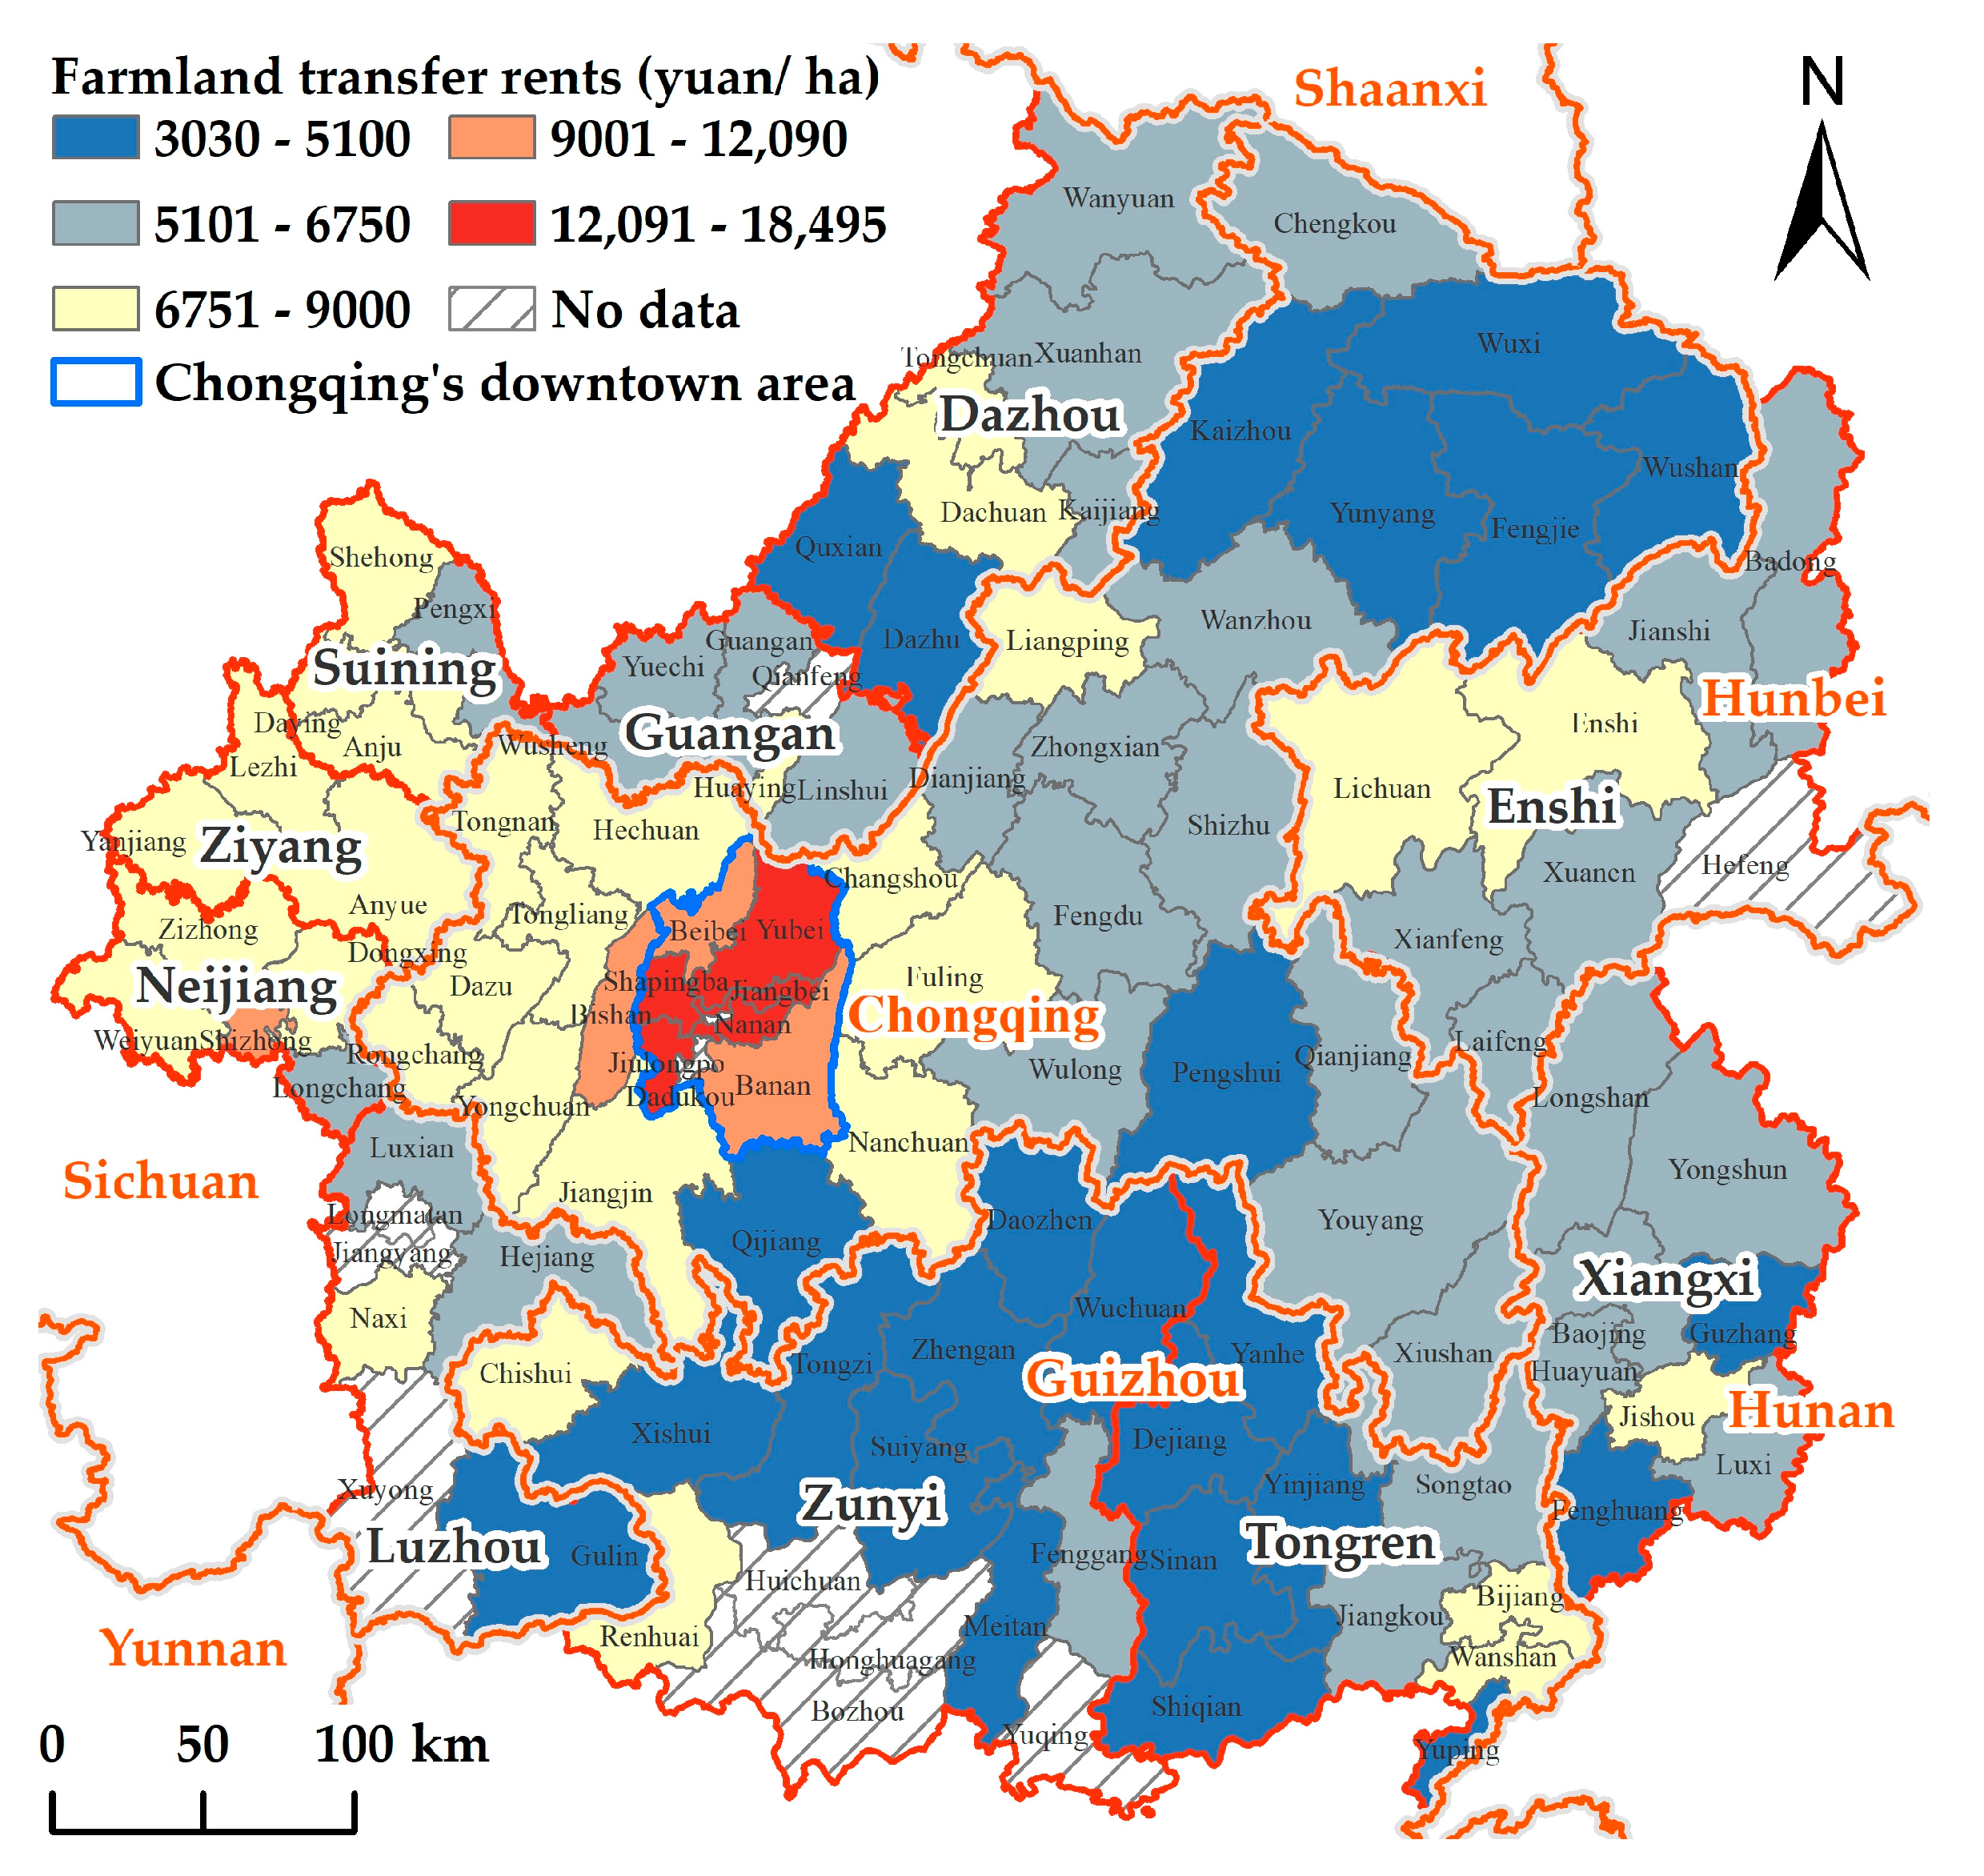
4.1. Analysis of Spatial Features of Farmland Transfer Rents

We used ArcGIS 10.4.1 to depict the spatial distribution of farmland transfer rents in the study area. Figure 3 and our descriptive statistical analysis indicate that the highest farmland transfer rents in the study area was RMB 18,495/ha, which was in the Nan’an district of downtown Chongqing. The lowest value was RMB 3030/ha, in Sinan County in the southeast of the study area. The mean farmland transfer rents in the study area were RMB 6876.45/ha, with a standard deviation of RMB 2979.87/ha. The coefficient of variation of farmland transfer rents was 43.33%, which indicates medium variability. It can be seen from Figure 3 that farmland transfer rents in the region have a concentric-circle structure, with rent gradually decreasing from the center of Chongqing’s downtown area to the periphery. To explore the global spatial clustering characteristics of farmland transfer rents in the study area further, we calculated the global Moran’s I using Stata 15 software, and created a Moran scatter plot. It can be seen from Figure 4 that Moran’s I = 0.67, significant at the 0.01 level, and the scattered points are mainly distributed in the first and third quadrants. This indicates that farmland transfer rents in the study area have a significant “high and low” clustering tendency, i.e., county-level districts with higher farmland transfer rents tend to be clustered together and those with lower rents also tend to be clustered together.
The global spatial autocorrelation only reflects overall features of farmland transfer rents in the study area; it cannot reveal local spatial autocorrelation between adjacent counties. The Local Geary’s C index resolves the generality shortcoming of global Moran’s I, as it can faithfully and specifically reflect local spatial aggregation in farmland transfer rents in the study area. We calculated the Geary’s C index of farmland transfer rents in the study area using Geoda 1.20 software and generated a distribution map (Figure 5). It can be seen from Figure 5 that the statistically significant cluster of high-rent areas is in the downtown area of Chongqing and areas to the west. In terms of physical geography, the area is dominated by hilly landforms but has relatively flat terrain for the region. In terms of economic geography, this area belongs to the main urban area of Chongqing and is an important growth pillar of Chongqing’s economy as well as a core area of the Chengdu-Chongqing economic zone. Thus, the region has good natural endowments and location advantages. The clusters of low-rent areas are distributed in the Daba Mountains in the northeast of Chongqing and the Wuling Mountains in the southeast of Chongqing. In these areas, the terrain is undulating, farmland is severely fragmented, and there are many obstacles to agricultural production. Furthermore, these areas happen to be contiguous poverty-stricken areas of the Daba and Wuling mountains. Thus, the natural and location conditions of this area are relatively poor.

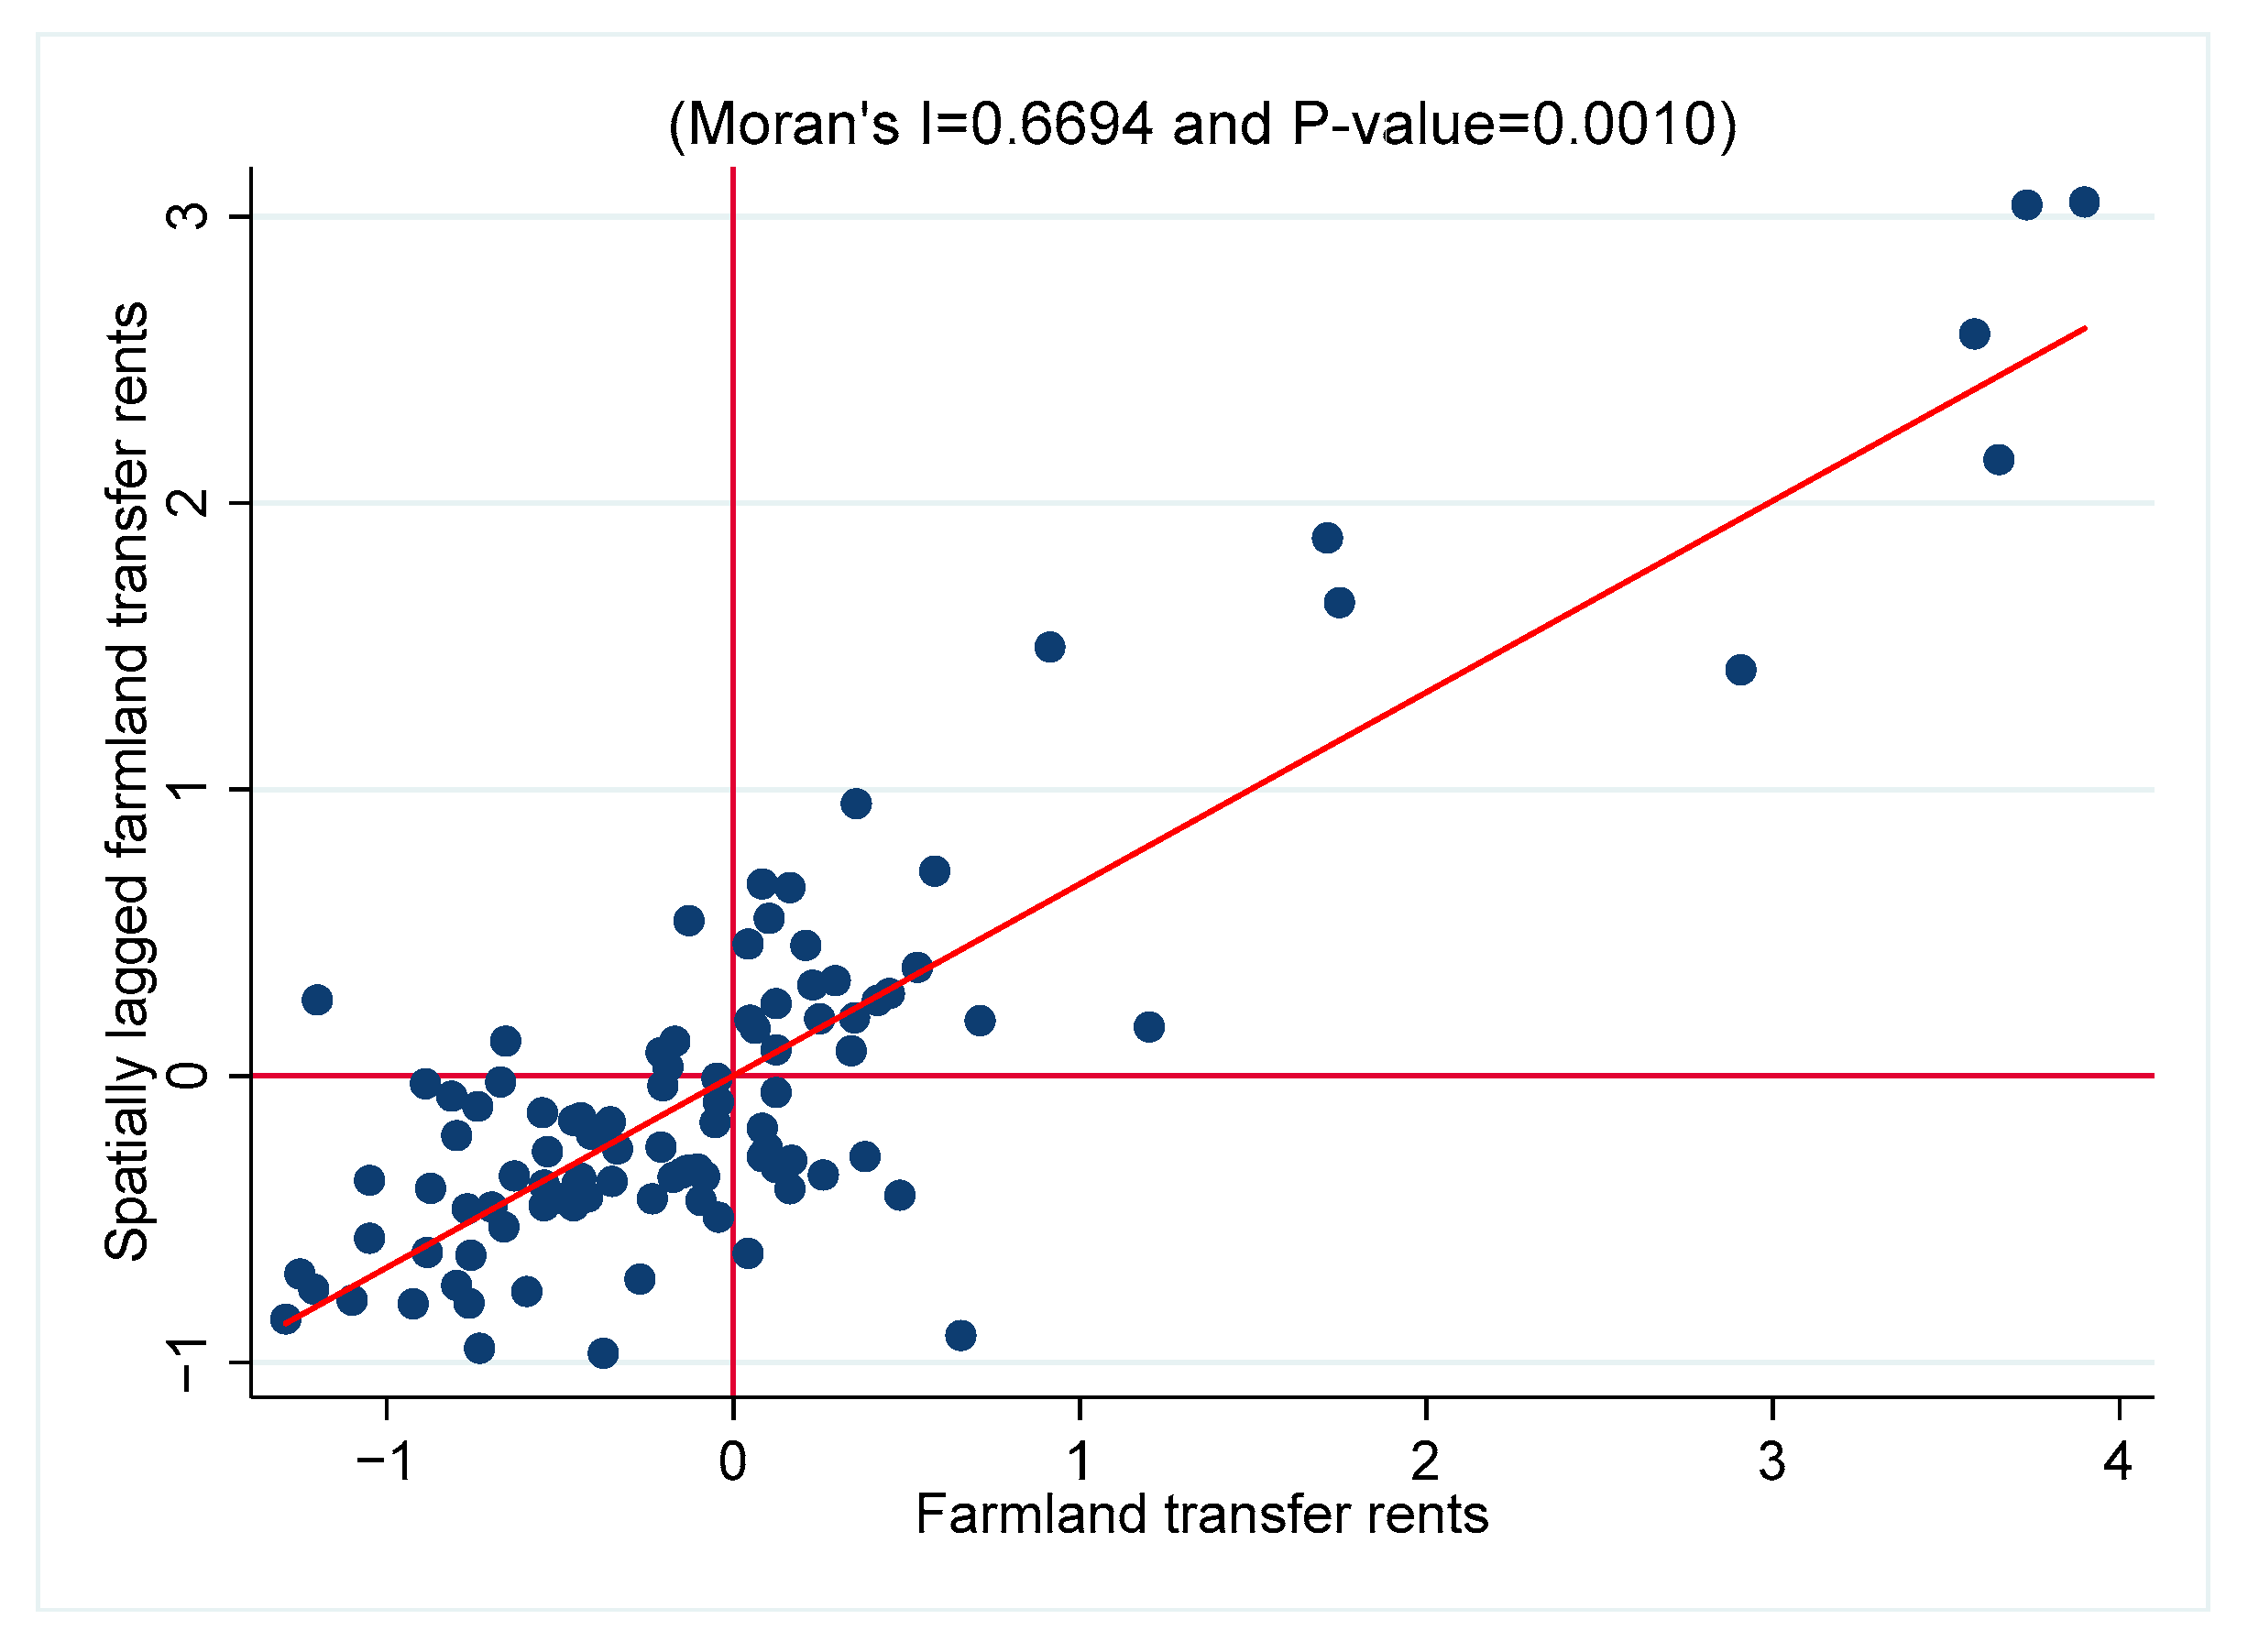
4.2. Spatial Coupling Analysis of Farmland Transfer Rents

To avoid spurious regression, we should ensure that there is a certain statistical correlation between the explained variables and the explained variables before regression analysis. Therefore, we used bivariate Moran’s I to test the spatial coupling between explanatory variables and farmland transfer rent, and screened out key explanatory variables for the following spatial econometric analysis. It can be seen from Table 3 that except for “Is it a main grain-producing county in the country?”, the six other explanatory variables pass the Monte Carlo simulation test at the 0.01 level. In terms of spatial coupling, farmland quality grade, farmland mean slope, and ratio of farmland supply and demand have a significant negative spatial correlation with farmland transfer rents, while GDP, regional crop structure, and “Is there a county-level farmland transfer platform?” have a significant positive spatial correlation with farmland transfer rents. In terms of spatial coupling strength, the order of absolute values of bivariate Moran’s I is as follows: GDP (0.50) > farmland supply-demand ratio (−0.47) > farmland mean slope (−0.40) > farmland quality grade (−0.30) > “Is there is a county-level farmland transfer platform?” (0.25) > regional crop structure (0.16) > “Is it a major grain-producing county in the country?” (−0.01). The ranking of coefficients indicates that the spatial coupling between location factors and farmland transfer rents is slightly stronger than that of natural factors, and the spatial coupling of these two types of factors with transfer rents is obviously greater than that of policy factors. Of the policy factors, there is almost no spatial coupling between land use control and transfer rents, indicating that in this study area, “Is it a major grain-producing county in the country?” has no correlation with farmland transfer rents.

4.3. Spatial Econometric Analysis of Farmland Transfer Rents

To avoid irrelevant explanatory variables interfering with the regression model, this study incorporated six explanatory variables with significant spatial coupling into the regression model. Given that multicollinearity among explanatory variables can severely affect the model’s robustness, before performing spatial econometric analysis, variables were included in the ordinary least-squares (OLS) model for multicollinearity diagnostics. Table 4 shows that the maximum variance inflation factor (VIF) of each variable is only 2.04 (VIF < 5), indicating that there is no multicollinearity problem, and the variables can be used in the model. Commonly used spatial econometric models include the spatial lag model (SLM) and spatial error model (SEM). The two models have their own scope of application, so it is necessary to optimize the models before performing spatial econometric analysis. With the exception of R2, the preferred parameters mainly focus on the results of the Lagrange multiplier (LM) test. It can be seen from Table 4 that the R2 (0.70) of the SLM model is greater than that of the SEM model (0.67). Furthermore, the LM value of the SLM model is significant at the 0.05 level, but the LM value of the SEM model does not pass the significance test, indicating that the SLM model is superior to the SEM model. Next, we selected the regression coefficients of the SLM model to analyze the spatial differentiation mechanisms of farmland transfer rents in mountainous areas. It can be seen from Table 4 that the parameter estimates and significance of the OLS model, SLM model, and SEM model are very similar, indicating that the models are robust. Additionally, as the explanatory and explained variables have been logarithmized in the data preprocessing stage, the model’s regression coefficient indicates the elasticity of farmland transfer rents to the explanatory variables.
With regard to the SLM model, of the natural factors, the farmland quality grade does not pass the significance test, but the farmland mean slope passes the significance test at the 0.01 level, indicating that in mountainous areas, terrain has a greater impact on farmland transfer rents than the quality of farmland. Of the location factors, the coefficient of GDP is 0.09, and it passes the significance test at the 0.01 level, indicating that traffic location conditions have a significant positive impact on farmland transfer rents in county-level divisions. The coefficient of the farmland supply-demand ratio is −0.15, and it passes the significance test at the 0.01 level, indicating that the relationship between supply and demand of farmland in different locations has a significant negative impact on farmland transfer rents. Regional crop structure does not pass the significance test, indicating that differences do not have a significant impact on transfer rents. Among the policy factors, “Is there a county-level farmland transfer platform?” does not pass the significance test, indicating that the development status of intermediary organizations for farmland transfers does not have a significant impact on rents.
The coefficients of significant factors are ranked as follows: farmland supply-demand ratio (−0.15) > farmland mean slope (−0.13) > GDP (0.09). This indicates that the relationship between supply and demand of farmland has the greatest impact on transfer rents in mountainous areas, followed by terrain conditions, and finally traffic location conditions. The coefficient of farmland mean slope is −0.13, indicating that as farmland mean slope in county-level divisions increases by 1%, farmland transfer rents decrease by 0.13%. The coefficient of GDP is 0.09, indicating that as the GDP of each county-level division increases by 1%, farmland transfer rents increase by 0.09%. The coefficient of the farmland supply-demand ratio is −0.15, indicating that for every 1% increase in the farmland supply-demand ratio in a county-level division, farmland transfer rents decrease by 0.15%. Evidently, location is the dominant factor of spatial differentiation of farmland transfer rents in mountainous areas.

4.4. GWR Analysis of Farmland Transfer Rents

Both the OLS model and the SLM model are essentially mean regressions, which only reflects the central tendency of the conditional distribution y|x and does not reveal the spatial heterogeneity of the influence of explanatory variables on farmland transfer rents. To this end, we incorporated the above three explanatory variables with significant effects into the GWR model. The parameter estimation of the GWR model shows that R2 = 0.74, indicating good model fitting accuracy. Furthermore, the standardized residuals of the GWR model show that the distribution interval of standardized residuals in the study area is [−3.64, 2.74], and the distribution interval of 98 counties (98%) is within [−2.50, 2.50]. This indicates that the standardized residual values of the geographically weighted regression model are randomly distributed at a significance level of 0.05. The global spatial autocorrelation test was carried out on the standardized residual values, giving Moran’s I = −0.01 and a p value of 0.99, indicating that the standardized residual values of the model were randomly distributed in space, and suggesting that the overall model fit was ideal.
The mean values of the regression coefficients (Table 5) of farmland mean slope, GDP, and farmland supply-demand ratio are −0.19, 0.11, and −0.19, respectively, which are consistent with the estimated results of the SLM model. The estimated values of the parameters are also relatively close, further illustrating that the results of spatial econometric analysis are more robust. The coefficient range of mean slope is [−0.29, −0.01], and the absolute value of the coefficient of variation is 23.82%, indicating moderate variability. The coefficient range of GDP is [0.00, 0.19], and the coefficient of variation is 42.30%, indicating strong variability. The coefficient range of the farmland supply-demand ratio is [−0.24, −0.16], and the absolute value of the coefficient of variation is only 11.02%, indicating moderate variability. The spatial heterogeneity of explanatory variables can be ranked as follows: GDP > farmland mean slope > farmland supply-demand ratio.
We further visualized the regression coefficient of the GWR model, and the results are shown in Figure 6. It can be seen from Figure 6a that the absolute values of the regression coefficient of farmland mean slope trends upward in a west-to-east direction. The areas with high absolute values are mainly in the Daba Mountains in the northeast, Wuling Mountains in the southeast, and Dalou Mountains in the south of the study area. Due to the significant undulations and fragmentation of farmland in this area, it is not suitable for agricultural machinery use and intensive farming. As a result, terrain has a significant negative impact on local farmland transfer rents. Areas with low absolute values are mainly in western Chongqing, where the terrain is largely hills and low mountains and intensive farming practices and the use of agricultural machinery are less difficult. Thus, terrain has less impact on transfer rents in those areas.
Figure 6b shows that the regression coefficient of GDP decreases from the southwest of the study area to the periphery. Areas with high values are mainly distributed in the main urban area of Chongqing and in Zunyi City, Guizhou in the south. The former is located in the core area of the Chengdu-Chongqing economic zone. Its GDP accounts for 76.90% of Chongqing, and its urbanization level is 76.60%. It accounts for nearly two-thirds of the population of Chongqing, with notable location advantages for agriculture. The latter is a subcenter of Guizhou Province. The city is adjacent to the provincial capital Guiyang to the south and the main urban area of Chongqing to the north, giving it strong location advantages. Areas with low coefficient values are mainly in the northeast and east of the study area. These areas are part of the officially recognized contiguous poverty-stricken areas of the Daba Mountains and Wuling Mountains, and they are far from regional hub cities. Thus, they have no notable traffic location advantage.
Figure 6c shows that absolute values of the farmland supply-demand ratio regression coefficient trend upward from west to east. The areas with high absolute values are concentrated in the northeast, east, and southeast of Chongqing. They are located in severely poverty-stricken areas of the country, where many travel to cities for work, so the potential supply of farmland is large. Moreover, due to their small permanent populations and distance from a regional hub city, effective demand for farmland is lacking. As a result, the area suffers from a notable oversupply of farmland. Areas with low absolute values are mainly in the central and western regions of Chongqing, which are core areas of the Chengdu-Chongqing economic zone and have high industrial agglomeration and population density. These areas also have relatively balanced supply and demand of farmland. Thus, the negative effect of the farmland supply-demand ratio on transfer rents is greater in the eastern region of Chongqing than that in the western region. Stimulating demand for farmland in the mountainous area of east Chongqing is the key to increasing the value of farmland assets in this region.

5. Discussion

5.1. Innovations and Applicability

First, compared with the existing literature on farmland transfer rents, this study developed a theoretical framework for spatial analysis of farmland transfer rents that incorporates natural factors, location factors, and policy factors based on land rent theory, location theory, and property rights theory. The framework avoids the cognitive limitations imposed by single factor analysis and the randomness of index selection, and it can serve as a theoretical reference for future scholars to carry out similar research. Second, by revealing spatial differentiation of farmland transfer rents in mountainous areas, this study serves as an empirical reference for district and county governments to formulate guide prices for farmland transfers. Finally, by revealing the mechanisms of spatial differentiation of farmland transfer rents in mountainous areas and the spatial heterogeneity of influencing factors, this paper serves as a reference for the government to regulate the farmland transfer market in mountainous areas and increase the value of farmland assets in poor mountainous areas. Establishing an index system and determining index weights also provide a theoretical basis for grading and valuing farmland.

5.2. Key Mechanism of Spatial Differentiation of Farmland Transfer Rents in Mountainous Areas

The spatial coupling analysis found that coupling of farmland transfer rents with location factors was higher than with natural factors and policy factors. The results of our spatial econometric analysis and GWR analysis also found that the regression coefficient of location factors was slightly higher than that of natural factors, while the regression coefficient of policy factors was not significant. This shows that location factors are the dominant factors in spatial differences of farmland transfer rents in mountainous areas. In terms of location factors, GDP and farmland supply-demand ratio passed the significance test, indicating that traffic location conditions and the relationship between supply and demand of farmland had a significant impact on spatial differentiation of farmland transfer rents in mountainous areas. Furthermore, the regression coefficient of the farmland supply-demand ratio was significantly greater than that of GDP, indicating that on a macro scale, the relationship between regional farmland supply and demand has a greater impact on transfer rents than traffic location conditions. In addition, the farmland mean slope passed the significance test, but the farmland quality grade did not pass the significance test, indicating that of the natural factors, terrain was the main factor causing spatial differentiation of farmland transfer rents in mountainous areas.

5.3. Several Key Variables

In previous studies, farmland quality has been shown to have a significant impact on transfer rents [26,27], but it did not pass the significance test in this study. This may be due to differences in scale and the study area. First, previous studies have mostly been at the farm scale, and differences in farmland quality are more notable at the micro scale than at the macro scale. The data in Table 2 revealed that the coefficient of variation of farmland quality grade in the study area was only 12.28%, indicating that at the macro scale, the difference in the farmland quality among mountainous county-level divisions was not significant. Second, previous studies have tended to focus on major grain-producing areas, but this study does not, and there are notable differences in the use of farmland between the two. According to the ”Statistical Annual Report on China’s Rural Policies and Reforms” in 2020, the proportion of transferred farmland in major grain-producing areas that is planted with grain is 66.59%, while that in non-major grain-producing areas is only 35.34% [75]. Since grain production is more dependent on farmland quality [76] (grain yield increases approximately 1500 kg/ha for each increase in the quality grade of farmland), the impact of the farmland quality grade on major grain-producing areas is more significant than for non-major grain-producing areas.
Theoretically, land use is an important factor affecting land prices, but regional crop structure did not pass the significance test in this study. This conclusion, which seems to be contrary to theoretical analysis, is simply a reflection of the characteristics of farmland use in mountainous areas. Both von Thünen’s agricultural location theory and Alonso’s bid rent model are based on homogeneous flat land, and mountainous areas do not conform to this assumption. Grain yields in mountainous areas are significantly lower than on flat land, so the proportion of cash crops planted in mountainous areas is generally higher [77]. In addition, since China launched targeted poverty alleviation in 2013, farmers in poverty-stricken mountainous areas have generally been lifted out of poverty by planting cash crops. This policy has further narrowed differences in crop structures between county-level districts [78]. As a result, regional crop structure does not have a significant impact on farmland transfer rents in mountainous areas.
None of the policy variables passed the significance test, indicating that policy factors are not guiding factors in the spatial differentiation of farmland transfer rents in mountainous areas. Although some scholars have found that the establishment of a farmland transfer platform has a significant positive impact on farmland transfer rents [18,21], this conclusion is not verified in this study. We think this is due to the different focuses and stages of research. First, this paper explored the impact of transfer platforms on transfer rents from the perspective of space, while previous literature focused on analyzing the relationship between the two from the perspective of time. Second, in the initial stage of development of the farmland transfer market, the establishment of a farmland transfer platform helped reduce transaction costs and promote price discovery. In the current study area, however, in which the proportion of transferred farmland is close to 40%, most county-level divisions have established platforms, so farmland transfer rents are generally priced according to market principles [79]. As a result, the impact of farmland transfer platforms on transfer rents is significantly reduced.
Our analysis of bivariate Moran’s I showed that there was no spatial coupling relationship between “Is it a major grain-producing county in the country?” and farmland transfer rents. This may be due to China’s land use controls. For a long time, China’s land use controls focused on restricting the conversion of farmland to construction land, but there were no specific rules about growing non-food crops on farmland [54]. Weaknesses in farmland protection reduced the impact of land use control on farmland transfer rents.

5.4. Limitations of This Study

Due to a lack of historical data on farmland transfer rents, this study only used cross-sectional data to analyze the characteristics and influencing mechanisms of farmland transfer rents in mountainous areas. As a result, we were unable to reveal the spatiotemporal evolution trends in the study area. Specifically, the impact of policy factors on farmland transfer rents often presents a phased feature, while the cross-sectional data analysis cannot reveal the changes in farmland transfer rents before and after the implementation of the policy. This deficiency could be addressed by conducting panel data analysis. In addition, due to our inability to obtain data of farmland transfers areas in each county, this study does not consider the impact of the maturity of the farmland transfer market in each county (a policy factor) on farmland transfer rents, which also needs to be explored in future research. Finally, the authors of this study endeavored to maximize its sample data on farmland transfers, but due to the market’s uneven development among counties in the study area, farmland transfer samples collected in a few counties were relatively small, so this study inevitably has certain shortcomings.

6. Conclusions and Policy Implications

The conclusions are as follows: First, farmland transfer rents in mountainous areas have obvious spatial clustering characteristics. In this study area, the high-value areas are mainly located in the downtown area of Chongqing and the hilly areas to the west, while the low-value areas are mainly distributed in the Daba Mountains and Wuling Mountains, two national contiguous areas of dire poverty. Second, location and terrain factors are the main driving forces for the spatial differentiation of farmland transfer rents in mountainous areas. Specifically, a 1% increase in farmland mean slope and farmland supply-demand ratio in the study area will lead to a 0.13 and 0.15% decrease in farmland transfer rents respectively, while a 1% increase in GDP will drive up farmland transfer rents by 0.09%. These conclusions are consistent with the analysis of spatial differentiation characteristics mentioned above. Third, the influence of policy factors on the spatial differentiation of farmland transfer rents in mountainous areas is not significant. On the one hand, with the popularization of the farmland transfer information platform in the study area, the disparities of farmland transfer rents in different regions caused by the difference in transaction costs have been greatly alleviated. On the other hand, the conclusion also reflects that the current land use control in China has no impact on farmland transfer rents.
The policy implications of this paper are as follows: First, we should recognize the objective differences of farmland transfer rents in different regions of mountainous areas, and avoid the blind comparisons of farmland transfer rents between regions. In recent years, in order to promote the large-scale operation of farmland, many local governments blindly set excessively high reference rents for farmland transfers, regardless of the poor location and natural conditions. This will not only aggravate the risk of agricultural operation, but also make it difficult for farmers to obtain sustainable farmland transfer rents. Second, as the traffic location conditions are difficult to improve in the short term, and the influence of farmland supply and demand relationship and terrain factors on farmland transfer rents in this study area generally increases from west to east, these low-value areas (mainly in the northeast, southeast and east of Chongqing) should focus on increasing the intrinsic value of farmland assets by stimulating effective demand for farmland and improving farming conditions. The former can stimulate the local farmland demand by cultivating new agricultural management subjects, while the latter can improve farming conditions mainly by land consolidation, thus promoting the realization of large-scale cultivated land management. In addition, we should be alert to the high farmland transfer rents in major grain-producing counties, and make up the loopholes of land use control in the use of farmland as soon as possible, so as to prevent “non-grain production” of farmland. In this study, there is no spatial coupling relationship between the variable “Is it a major grain-producing county in the county?” and farmland transfer rents, indicating that the current land use control has no impact on cultivated land transfer rent. This phenomenon requires special vigilance because there are some major grain-producing counties in the study area, which are distributed in the high-value or sub-high-value areas of farmland transfer rents. The high transfer rents will undoubtedly squeeze the profit of grain production, aggravate the “non-grain production” of regional farmland, and then threaten regional food security.

Author Contributions

Conceptualization, all authors; methodology, T.D. and C.L.; data collection, C.L. and T.D.; formal analysis, Z.W.; writing—original draft preparation, T.D.; writing—review and editing, T.D. and C.L.; supervision, Z.W. and C.L.; funding acquisition, T.D. All authors have read and agreed to the published version of the manuscript.

Funding

This study was supported by Chongqing Social Science Planning Project (Grant No. 2021NDYB071), Humanities-Society Scientific Research Program of Chongqing Municipal Education Commission (Grant No. 22SKGH214), and the research fund of Chongqing Technology and Business University (Grant No.2155029).

Institutional Review Board Statement

Not applicable.

Informed Consent Statement

Not applicable.

Data Availability Statement

Farmland transfer rents data were obtained from field research data of the Ministry of Natural Resources and our research group. Survey data of the Ministry of Natural Resources can be obtained by submitting an application to the Ministry of Natural Resources. The survey data of our research group were collected from the rural property rights trading website, Tuliu website (www.tuliu.com/) and government website of each county from 5 February to 6 March 2022.These are available through official public websites. Farmland quality grade data can be obtained by submitting an application to the Ministry of Natural Resources.

Acknowledgments

Thanks to the Land Consolidation and Rehabilitation Center of the Ministry of Natural Resources for the data support.

Conflicts of Interest

The authors declare no conflict of interest.

References

  1. Zhang, J.; Mishra, A.K.; Zhu, P.; Li, X. Land rental market and agricultural labor productivity in rural China: A mediation analysis. World Dev. 2020, 135, 105089. [Google Scholar] [CrossRef]
  2. Liu, Y.; Yan, B.; Wang, Y.; Zhou, Y. Will land transfer always increase technical efficiency in China?—A land cost perspective. Land Use Policy 2019, 82, 414–421. [Google Scholar] [CrossRef]
  3. Wang, Z.; Yang, M.; Zhang, Z.; Li, Y.; Wen, C. The Impact of Land Transfer on Vulnerability as Expected Poverty in the Perspective of Farm Household Heterogeneity: An Empirical Study Based on 4608 Farm Households in China. Land 2022, 11, 1995. [Google Scholar] [CrossRef]
  4. Zhang, J.; Feng, S.; Zhu, P. Does Government Intervention on Farmland Rental Market Lead to Rural Income Inequality? J. Public Manag. 2017, 14, 104–116+158–159. [Google Scholar]
  5. Huang, Z.; Qiu, J. Government Intervention in Land Circulation and Concentration: Conditions, Strategy and Risks—A Research based on Land Circulation and Concentration. China Rural. Surv. 2016, 2, 34–44+95. [Google Scholar]
  6. Zhao, X.; Zheng, Y.; Huang, X.; Kwan, M.; Zhao, Y. The Effect of Urbanization and Farmland Transfer on the Spatial Patterns of Non-Grain Farmland in China. Sustainability 2017, 9, 1438. [Google Scholar] [CrossRef] [Green Version]
  7. Wu, X.; Shang, X.; He, P. Paid or Free: Government Subsidy, Farmer Differentiation and Land Transfer Rent. Econ. Probl. 2021, 12, 59–66. [Google Scholar]
  8. Zhang, Y.; Yihan, W.; Bai, Y. Knowing and Doing: The Perception of Subsidy Policy and Farmland Transfer. Sustainability 2019, 11, 2393. [Google Scholar] [CrossRef] [Green Version]
  9. Ye, Q.; An, F.; Zhang, Z.; Xiao, N. Present Situation, Problems and Countermeasures of Land transfer in the Process of Agricultural Industrialization in the Qinling-Daba Mountains (Shiyan). Asian Agric. Res. 2018, 10, 35–38+41. [Google Scholar]
  10. Qiu, T.; Boris Choy, S.T.; Li, S.; He, Q.; Luo, B. Does land renting-in reduce grain production? Evidence from rural China. Land Use Policy 2020, 90, 104311. [Google Scholar] [CrossRef]
  11. Xing, Q.; Wang, J.; Yuan, S.; Chen, H. Effect of Government Intervention in the Price Distortion of the Transfer of Farmland Management Rights: Empirical Analysis Based on Marginal Price Theory. China Land Sci. 2022, 36, 40–50. [Google Scholar]
  12. Yang, A.; Wang, Y. Spatiotemporal Variations in Farmland Rents and Its Drivers in Rural China: Evidence from Plot-Level Transactions. Land 2022, 11, 229. [Google Scholar] [CrossRef]
  13. Geng, N.; Gao, Z.; Sun, C.; Wang, M. How do farmland rental markets affect farmers’ income? Evidence from a matched renting-in and renting-out household survey in Northeast China. PLoS ONE 2021, 16, e0256590. [Google Scholar] [CrossRef] [PubMed]
  14. Qi, Y.; Li, Y.; Zhu, D. Study on the Non-grain Utilization of Cultivated Land from the Perspective of Cultivated Land Capitalization. China Land Sci. 2021, 35, 47–56. [Google Scholar]
  15. Quan, S.; Hu, L.; Zeng, Y.; Zhu, Y. The Overcapitalization of Land Resources in Rural China. Chin. Rural. Econ. 2018, 7, 2–18. [Google Scholar]
  16. Meng, F.; Tan, Y.; Chen, H.; Xiong, W. Spatial-temporal Evolution Patterns and Influencing Factors of “Non-grain” Utilization of Cultivated Land in China. China Land Sci. 2022, 36, 97–106. [Google Scholar]
  17. Wang, S.; Lei, H. The Research on the Impact of Land Transference Costs Rising on Grain Production—Based on the Adjustment of Planting Structure, Adjustment of Crops and Substitution of Production Factors. Chin. J. Agric. Resour. Reg. Plan. 2019, 40, 58–65. [Google Scholar]
  18. Chen, J.; Xu, J.; Zhang, H. Explanation of the Phenomenon “Different Prices on the Same Land” in the Farmland Transfer Market—Evidence from China’s Farmland Transfer Market. Agriculture 2022, 12, 2087. [Google Scholar] [CrossRef]
  19. Shen, Y.; Zhu, S.; Deng, Y.; Teng, L.; Zhao, R. An Analysis of the Factors of the Price of Farmland Use Rights’ Circulation—The Experience from Farmers and Regional Level. China Rural Surv. 2012, 3, 2–17+25+95. [Google Scholar]
  20. Li, C.; Shi, D.; Wen, H. The Effect of Relationship Network on Farmers’ Land Transfer Behavior and Rent—An Analysis Based on Network Perspective of Strong and Weak Ties. J. Agrotech. Econ. 2020, 7, 106–116. [Google Scholar]
  21. Chen, J.; Xu, J.; Zhang, H. Impact of Relationship Governance and Third-Party Intervention on Farmland Transfer Rents—Empirical Evidence from Rural China. Land 2022, 11, 745. [Google Scholar] [CrossRef]
  22. Zhang, L.; Cao, Y.; Bai, Y. The impact of the land certificated program on the farmland rental market in rural China. J. Rural Stud. 2022, 93, 165–175. [Google Scholar] [CrossRef]
  23. Zhou, N.; Cheng, W.; Zhang, L. Land rights and investment incentives: Evidence from China’s Latest Rural Land Titling Program. Land Use Policy 2022, 117, 106126. [Google Scholar] [CrossRef]
  24. Leimer, K.; Levers, C.; Sun, Z.; Müller, D. Market proximity and irrigation infrastructure determine farmland rentals in Sichuan Province, China. J. Rural Stud. 2022, 94, 375–384. [Google Scholar] [CrossRef]
  25. Lin, T.; Song, G.; Qiao, Y. Influence factors on price of farmland transfer organized by farmers in main grain-producing region of northeast China. Trans. Chin. Soc. Agric. Eng. 2017, 33, 260–266. [Google Scholar]
  26. Xu, Y.; Li, X.; Xin, L. Differentiation of scale-farmland transfer rent and its influencing factors in China. Acta Geogr. Sin. 2021, 76, 753–763. [Google Scholar]
  27. Ji, Y.; Gu, T.; Chen, Y.; Xu, Z.; Zhong, F. Agricultural scale management from the perspective of land parcels: Discussion on the relationship between circulation rent and land size. Manag. World 2017, 8, 65–73. [Google Scholar]
  28. Song, K.; Liu, W.; Wei, X.; Zhong, S. Influence of Agricultural Outsourcing Operation on Land Transfer Rent: An Empirical Analysis Based on Farmer Survey Data in 3 Provinces (Municipality). Econ. Geogr. 2022, 42, 133–140. [Google Scholar]
  29. Du, T.; Zhu, D.; Wang, Z.; Li, C. Research on Structure Differentiation of Farmland Transfer Price: Based on the Survey Data of Five Provinces in the Huang-Huai-Hai Region. J. Agrotech. Econ. 2022, 7, 96–108. [Google Scholar]
  30. Zhang, J.; Mishra, A.K.; Hirsch, S.; Li, X. Factors affecting farmland rental in rural China: Evidence of capitalization of grain subsidy payments. Land Use Policy 2020, 90, 104275. [Google Scholar] [CrossRef]
  31. Mishra, A.K.; Moss, C.B. Modeling the effect of off-farm income on farmland values: A quantile regression approach. Econ. Model. 2013, 32, 361–368. [Google Scholar] [CrossRef]
  32. Xu, J.; Chen, J.; Zhao, S. The impact of free farmland transfer on the adoption of conservation tillage technology—empirical evidence from rural China. Heliyon 2022, 8, e11578. [Google Scholar] [CrossRef]
  33. Liu, Y.; Heerink, N.; Li, F.; Shi, X. Do agricultural machinery services promote village farmland rental markets? Theory and evidence from a case study in the North China plain. Land Use Policy 2022, 122, 106388. [Google Scholar] [CrossRef]
  34. Qi, Y.; Hou, Y.; Li, Y.; Li, L.; Zhang, J.; Chang, Y.; Zhu, D. The price gap between state-owned and collective farmlands: Evidence from Xinjiang and Heilongjiang, China. Land Use Policy 2023, 124, 106460. [Google Scholar] [CrossRef]
  35. Zhu, J. Marx’s Theory of Ground Rent and Nationalization of Land in China. Asian Agric. Res. 2017, 10, 37–38. [Google Scholar]
  36. Ye, S.; Song, C.; Gao, P.; Liu, C.; Cheng, C. Visualizing clustering characteristics of multidimensional arable land quality indexes at the county level in mainland China. Environ. Plan. A 2022, 54, 222–225. [Google Scholar] [CrossRef]
  37. Song, W.; Zhang, H.; Zhao, R.; Wu, K.; Li, X.; Niu, B.; Li, J. Study on cultivated land quality evaluation from the perspective of farmland ecosystems. Ecol. Indic. 2022, 139, 108959. [Google Scholar] [CrossRef]
  38. Zhu, X.; Xiao, G.; Wang, S. Suitability evaluation of potential arable land in the Mediterranean region. J. Env. Manag. 2022, 313, 115011. [Google Scholar] [CrossRef]
  39. Du, T. Study on Price Differentiation of Farmland Transfer in China; China Agricultural University Press: Beijing, China, 2021. [Google Scholar]
  40. Zhang, Z. Some Important Problems and Measures of Farmland Construction Suitable for Mechanization in Hilly and Mountainous Areas During the 14th Five-year Plan Period. Chin. Rural Econ. 2020, 11, 13–28. [Google Scholar]
  41. Parvin, N.; Coucheney, E.; Gren, I.; Andersson, H.; Elofsson, K.; Jarvis, N.; Keller, T. On the relationships between the size of agricultural machinery, soil quality and net revenues for farmers and society. Soil Secur. 2022, 6, 100044. [Google Scholar] [CrossRef]
  42. Van den Berg, M.M.; Hengsdijk, H.; Wolf, J.; Van Ittersum, M.K.; Guanghuo, W.; Roetter, R.P. The impact of increasing farm size and mechanization on rural income and rice production in Zhejiang province, China. Agric. Syst. 2007, 94, 841–850. [Google Scholar] [CrossRef]
  43. Sklenicka, P. Classification of farmland ownership fragmentation as a cause of land degradation: A review on typology, consequences, and remedies. Land Use Policy 2016, 57, 694–701. [Google Scholar] [CrossRef] [Green Version]
  44. Gorgan, M.; Hartvigsen, M. Development of agricultural land markets in countries in Eastern Europe and Central Asia. Land Use Policy 2022, 120, 106257. [Google Scholar] [CrossRef]
  45. Stokstad, G.; Krøgli, S.O. Owned or rented—Does it matter? Agricultural land use change within farm properties, case studies from Norway. Land Use Policy 2015, 48, 505–514. [Google Scholar] [CrossRef]
  46. Britos, B.; Hernandez, M.A.; Robles, M.; Trupkin, D.R. Land market distortions and aggregate agricultural productivity: Evidence from Guatemala. J. Dev. Econ. 2022, 155, 102787. [Google Scholar] [CrossRef]
  47. Jäger, J. Land Rent Theory. In International Encyclopedia of Human Geography, 2nd ed.; Elsevier: Amsterdam, The Netherlands, 2020; Volume 8, pp. 93–98. [Google Scholar]
  48. Plogmann, J.; Mußhoff, O.; Odening, M.; Ritter, M. Farmland sales under returns and price uncertainty. Econ. Model. 2022, 117, 106044. [Google Scholar] [CrossRef]
  49. Fujita, M. The Evolution of Spatial Economics: From Thünen to the New Economic Geography. Jpn. Econ. Rev. 2010, 61, 1–32. [Google Scholar] [CrossRef]
  50. Alonso, W. Location and Land Use; Harvard University Press: Cambridge, MA, USA, 1964. [Google Scholar]
  51. Dong, X.; Huang, J.; Scott, R.; Wang, H. A Study of the Relationship between the geographical position, the traffic infrastructure and the Structural Adjustment of Plant Production. Manag. World 2006, 9, 59–63+79. [Google Scholar]
  52. Gao, J.; Chen, J.; Su, X. Influencing factors of land price in Nanjing Proper during 2001–2010. Prog. Geogr. 2014, 33, 211–221. [Google Scholar]
  53. Fan, J.; Zhang, Y. A Preliminary Analysis of Land Resource Constraints on Urban Expansion of Beijing Based on Land Supply and Demand. J. Resour. Ecol. 2012, 3, 253–261. [Google Scholar]
  54. Léger-Bosch, C.; Houdart, M.; Loudiyi, S.; Le Bel, P. Changes in property-use relationships on French farmland: A social innovation perspective. Land Use Policy 2020, 94, 104545. [Google Scholar] [CrossRef]
  55. Dawson, P.J. Market Failure and Japanese Farmland Rents. J. Agric. Econ. 2014, 65, 406–419. [Google Scholar] [CrossRef] [Green Version]
  56. Wang, Y.; Li, X.; Xin, L. Rent-free land transfer in mountainous areas and its explanation. Resour. Sci. 2019, 41, 1339–1349. [Google Scholar]
  57. Abelairas-Etxebarria, P.; Astorkiza, I. Farmland prices and land-use changes in periurban protected natural areas. Land Use Policy 2012, 29, 674–683. [Google Scholar] [CrossRef]
  58. Zhu, Y.; Wang, Z.; Zhu, X. New reflections on food security and land use strategies based on the evolution of Chinese dietary patterns. Land Use Policy 2023, 126, 106520. [Google Scholar] [CrossRef]
  59. Liu, Y.; Zhou, Y. Reflections on China’s food security and land use policy under rapid urbanization. Land Use Policy 2021, 109, 105699. [Google Scholar] [CrossRef]
  60. WANG, Z.; YANG, Z. Research Progress, Problems and Prospects of “Non-grain” of Cultivated Land in China. Asian Agric. Res. 2022, 14, 26–31. [Google Scholar]
  61. Cao, Y.; Li, G.; Wang, J.; Fang, X.; Sun, K. Systematic Review and Research Framework of “Non-grain” Utilization of Cultivated Land: From a Perspective of Food Security to Multi-dimensional Security. China Land Sci. 2022, 36, 1–12. [Google Scholar]
  62. Ye, S.; Ren, S.; Song, C.; Cheng, C.; Shen, S.; Yang, J.; Zhu, D. Spatial patterns of county-level arable land productive-capacity and its coordination with land-use intensity in mainland China. Agric. Ecosyst. Environ. 2022, 326, 107757. [Google Scholar] [CrossRef]
  63. Chen, F.; Wang, H.; Yun, W. Study on Investigation and Assessment of Cultivated Land Quality Grade in China. China Land Sci. 2014, 28, 75–82+97. [Google Scholar]
  64. Liu, P.; Li, J.; Liu, L.; Yin, S. Coupling Evaluation of Transportation Advantage and Economic Development in Liaoning Province from 2000 to 2018. Geogr. Geo-Inf. Sci. 2021, 37, 57–63. [Google Scholar]
  65. Liu, L.; Zhang, Y.; Li, Y. Study on the Theory of Relationship Between Transportation Geography and Regional Economic Spatial Patterns. J. Northeast. Norm. Univ. Philos. Soc. Sci. 2022, 1, 100–107. [Google Scholar]
  66. Vittinghoff, E.; McCulloch, C.E. Relaxing the rule of ten events per variable in logistic and Cox regression. Am. J. Epidemiol. 2007, 165, 710–718. [Google Scholar] [CrossRef] [PubMed] [Green Version]
  67. Bettiga, D.; Lamberti, L. Future-Oriented Happiness: Its Nature and Role in Consumer Decision-Making for New Products. Front. Psychol. 2020, 11, 929. [Google Scholar] [CrossRef]
  68. Yang, M.; Pei, Y.; Li, X. Study on grain self-sufficiency rate in China: An analysis of grain, cereal grain and edible grain. J. Nat. Resour. 2019, 34, 881–889. [Google Scholar] [CrossRef]
  69. Wang, Y.; Liu, G.; Zhang, B.; Liu, Z.; Liu, X. Coordinated Development of Farmland Transfer and Labor Migration in China: Spatio-Temporal Evolution and Driving Factors. Land 2022, 11, 2327. [Google Scholar] [CrossRef]
  70. Hezaveh, A.M.; Cherry, C.R.; Nordfjærn, T. A home-based approach to understanding the effect of spatial autocorrelation on seat belt non-use. Transp. Res. Part F Traffic Psychol. Behav. 2021, 77, 156–167. [Google Scholar] [CrossRef]
  71. Jiang, L.; Chen, Y.; Zha, H.; Zhang, B.; Cui, Y. Quantifying the Impact of Urban Sprawl on Green Total Factor Productivity in China: Based on Satellite Observation Data and Spatial Econometric Models. Land 2022, 11, 2120. [Google Scholar] [CrossRef]
  72. Guastella, G.; Pareglio, S.; Sckokai, P. A spatial econometric analysis of land use efficiency in large and small municipalities. Land Use Policy 2017, 63, 288–297. [Google Scholar] [CrossRef] [Green Version]
  73. Sun, Y.; Jia, J.; Ju, M.; Chen, C. Spatiotemporal Dynamics of Direct Carbon Emission and Policy Implication of Energy Transition for China’s Residential Consumption Sector by the Methods of Social Network Analysis and Geographically Weighted Regression. Land 2022, 11, 1039. [Google Scholar] [CrossRef]
  74. Nazarpour, A.; Rostami Paydar, G.; Mehregan, F.; Hejazi, S.J.; Jafari, M.A. Application of geographically weighted regression (GWR) and singularity analysis to identify stream sediment geochemical anomalies, case study, Takab Area, NW Iran. J. Geochem. Explor. 2022, 235, 106953. [Google Scholar] [CrossRef]
  75. Department of Policy and Reform of the Ministry of Agriculture and Rural Affairs. China’s Rural Policy and Reform Statistical Annual Report (2020); China Agriculture Press: Beijing, China, 2021. [Google Scholar]
  76. Ye, S.; Song, C.; Shen, S.; Gao, P.; Cheng, C.; Cheng, F.; Wan, C.; Zhu, D. Spatial pattern of arable land-use intensity in China. Land Use Policy 2020, 99, 104845. [Google Scholar] [CrossRef]
  77. Xie, H.; Ouyang, Z.; Chen, Q. Does Cultivated Land Fragmentation Promote “Non-grain” Utilization of Cultivated Land: Based on a Micro Survey of Farmers in the Hilly and Mountainous Areas of Fujian. China Land Sci. 2022, 36, 47–56. [Google Scholar]
  78. Zhang, D.; Yang, W.; Kang, D.; Zhang, H. Spatial-temporal characteristics and policy implication for non-grain production of cultivated land in Guanzhong Region. Land Use Policy 2023, 125, 106466. [Google Scholar] [CrossRef]
  79. Zhu, G.; Guo, L.; Li, X. Premium on Large-Scale Transfer of Farmland’s Economic Right: Objective Facts, Structural Structure and Policy Orientation. Reform 2021, 1, 125–133. [Google Scholar]
Figure 1. Theoretical framework of factors affecting farmland transfer rents.
Land 12 00699 g001
Figure 2. Location of the study area.
Land 12 00699 g002
Figure 3. Farmland transfer rents distribution.
Land 12 00699 g003
Figure 4. Moran scatter plot of farmland transfer rents.
Land 12 00699 g004
Figure 5. Geary cluster map of farmland transfer rents.
Land 12 00699 g005
Figure 6. Spatial distribution of estimated parameters of the GWR model. (a) Regression coefficient of farmland mean slope; (b) regression coefficient of GDP; (c) regression coefficient of farmland supply-demand ratio.
Land 12 00699 g006
Table 1. Index system of factors affecting farmland transfer rents.
Factor TypeInfluencing FactorVariable
NaturalFarmland qualityFarmland quality grade
Terrain conditionsFarmland mean slope
LocationTraffic location conditionsGDP
Land useRegional crop structure
Farmland supply and demandFarmland supply-demand ratio
PolicyIntermediary organization
development status
Is there a county-level farmland transfer platform?
Land use controlsIs it a major grain-producing county in the country?
Table 2. Definitions and descriptive statistics of variables.
VariablesDefinition and ExplanationSample SizeMeanStandard
Deviation
Farmland transfer rentsAverage transfer rents of farmland in each county-level division (yuan/hectare)1006876.452979.87
Farmland quality gradeQuality of farmland (from 1 (best) to 15 (worst))10010.101.24
Farmland mean slopeMean slope (in degrees) of farmland in each county-level division1009.154.09
GDPGDP of each county-level division (unit: RMB 100 million)100368.82363.11
Regional crop structureProportion of total planted area planted with economic crops, such as fruit and vegetables (%)10020.499.79
Farmland supply-demand ratioArea of farmland supply/area of farmland demand (%)100124.0053.86
Is there a county-level farmland transfer platform?1 = Yes; 0 = No1000.580.50
Is it a major grain-producing county in the country?1 = Yes; 0 = No1000.320.47
Table 3. Analysis results of bivariate Moran’s I.
VariableBivariate Moran’s Ip-ValueE[I]MeanS.D.Z-Value
Farmland quality grade−0.300.01−0.010.010.05−5.99
Farmland mean slope−0.400.01−0.010.010.05−8.00
GDP0.500.01−0.01−0.010.068.96
Regional crop structure0.160.01−0.01−0.010.053.55
Farmland supply-
demand ratio
−0.470.01−0.010.010.05−9.03
Is there a county-level farmland transfer
platform?
0.250.01−0.0100.055.31
Is it a major grain-producing county in the country?−0.010.39−0.0100.05−0.29
Table 4. Analysis results of the spatial econometric model.
VariableOLSSLMSEMToleranceVIF
Constant10.30 ***7.40 ***10.22 ***
Farmland quality grade−0.26−0.20−0.300.701.43
Farmland mean slope−0.19 ***−0.13 ***−0.17 ***0.791.26
GDP0.10 ***0.09 ***0.11 ***0.492.04
Regional crop structure−0.06−0.05−0.040.711.42
Farmland supply-demand ratio−0.20 ***−0.15 ***−0.19 ***0.621.61
Is there a county-level farmland transfer platform?0.020.000.000.741.34
ρ 0.28 **
λ 0.17
R20.680.700.68
LM test 5.070.68
Note: ***, and ** denote significance at the 0.01, and 0.05 levels, respectively.
Table 5. Descriptive statistics of GWR model regression coefficients.
VariablesMeanMinQ25Q50Q75MaxCV
Farmland mean slope−0.19−0.29−0.22−0.20−0.17−0.01−23.82%
GDP0.110.000.080.110.150.1942.30%
Farmland supply-
demand ratio
−0.19−0.24−0.21−0.18−0.17−0.16−11.02%
Disclaimer/Publisher’s Note: The statements, opinions and data contained in all publications are solely those of the individual author(s) and contributor(s) and not of MDPI and/or the editor(s). MDPI and/or the editor(s) disclaim responsibility for any injury to people or property resulting from any ideas, methods, instructions or products referred to in the content.

