Article

A Big Data Grided Organization and Management Method for Cropland Quality Evaluation

1
College of Land Science and Technology, China Agricultural University, Beijing 100083, China
2
Key Laboratory of Remote Sensing for Agri-Hazards, Ministry of Agriculture and Rural Affairs, Beijing 100083, China
3
Key Laboratory of Land Consolidation and Rehabilitation, Land Consolidation and Rehabilitation Center, Ministry of Natural Resources, Beijing 100035, China
4
Technology Innovation Center for Land Engineering, Ministry of Natural Resources, Beijing 100035, China
5
Key Laboratory of Digital Mapping and Land Information Application, Ministry of Natural Resources, Wuhan 430079, China
6
Faculty of Geosciences and Environmental Engineering, Southwest Jiaotong University, Chengdu 611756, China
7
Qilu Aerospace Information Research Institute, Jinan 250100, China
8
Department of Natural Resources, No. 263 Hongqi Street, Harbin 150030, China
*
Authors to whom correspondence should be addressed.
These authors contributed equally to this work.
Land 2023, 12(10), 1916; https://doi.org/10.3390/land12101916
Submission received: 15 September 2023 / Revised: 7 October 2023 / Accepted: 11 October 2023 / Published: 13 October 2023

Abstract

:
A new gridded spatio-temporal big data fusion method is proposed for the organization and management of cropland big data, which could serve the analysis application of cropland quality evaluation and other analyses of geographic big data. Compared with traditional big data fusion methods, this method maps the spatio-temporal and attribute features of multi-source data to grid cells in order to achieve the structural unity and orderly organization of spatio-temporal big data with format differences, semantic ambiguities, and different coordinate projections. Firstly, this paper constructs a dissected cropland big data fusion model and completes the design of a conceptual model and logic model, constructs a cropland data organization model based on DGGS (discrete global grid system) and Hash coding, and realizes the unified management of vector data, raster data and text data by using multilevel grids. Secondly, this paper researches the evaluation methods of grid-scale adaptability, and generates distributed multilevel grid datasets to meet the needs of cropland area quality evaluation. Finally, typical data such as soil organic matter data, road network data, cropland area data, and statistic data in Da’an County, China, were selected to carry out the experiment. The experiment verifies that the method could not only realize the unified organization and efficient management of cultivated land big data with multimodal characteristics, but also support the evaluation of cropland quality.

1. Introduction

Cropland big data, including vector, raster, and text data related to cropland stand conditions, profile traits, and soil health, have typical spatio-temporal big data characteristics such as multi-dimensionality, diverse sources, different semantics and spatio-temporal dynamic changes [1,2,3]. These features seriously limit data mining and the deep application of cropland big data; how to efficiently manage and organize multi-source heterogeneous cropland big data is the basis for improving the value of comprehensive big data applications.
The Geographical Grid Systems is a widely adopted approach used to unify data across various spatial, source, and scale dimensions [4]. It finds extensive applications in geographic information systems, database management, and computer graphics [5,6,7]. The Geographical Grid Systems significantly enhance data organization, retrieval, and computational efficiency [8]. Researchers have investigated various methods for managing big data in croplands, including multilevel data management and grid mapping [9]. Chen constructed a multiscale cropland quality evaluation system, and proposed a multilevel cropland quality evaluation method by selecting a suitable grid size [10]. Shen et al. [11] took the 1′ × 1′ latitude/longitude grid as the basic evaluation unit, and carried out the priority assessment for farmland remediation to achieve farmland multilevel hierarchical management. Chen et al. [12] defined a kilometer-scale grid and employed text encoding techniques to achieve the spatially consistent aggregation of cropland data. Li et al. [13] used a 10 km grid cell to collect the cropland area data and statistical data to construct the Chinese farmland coverage dataset, and verified that the cropland area differences were small. He et al. [14] established a dataset of cultivated land area in China over the millennia by constructing an allocation model based on a cropland grid with a grid size of 10 km, and analyzed the spatial and temporal changes of cropland area on this basis. The above research completes multi-source data aggregation and data reconstruction based on grid idea. However, the lack of unified multi-source data organization and management modes in data organization and management cannot meet the needs of the efficient application of multi-source heterogeneous cropland big data.
Cropland quality is a comprehensive result of natural conditions and human activities under dynamic changes in time [15,16]. Therefore, the evaluation of cropland quality relies on multi-indicators and multi-dimensions in order to comprehensively understand the soil quality. Conventional methods for assessing cropland quality rely on the utilization of GIS software to perform multilayer overlay analyses. Li et al. [17] analyzed cropland quality in the northeastern Corn Belt, selecting seven key indicators, including PH, organic matter content, and barrier layer thickness. The researchers employed the soil quality index alongside GIS technology for this assessment. Similarly, Kazemi et al. [18] utilized a multi-criteria decision analysis approach, implementing ArcGIS’s weighted overlay analysis to superimpose digital layers for the evaluation of soil quality classes in northeastern Iran. However, as the number of indicators and the volume of data increase, the performance of data-processing capacity of traditional evaluation techniques experiences a significant decline [19,20].
Big data processing technology provides a new technical means for the sustainable development of cropland [21]. Yao et al. [22] developed a cropland quality big data processing system using MapReduce. Comparative experiments have demonstrated its high performance and scalability, offering an alternative solution to the storage and management challenges associated with cropland big data as compared to traditional GIS technology. Chen et al. [23] employed Remote Sensing (RS) and Geographic Information System (GIS) technology to formulate a series of assessment models for the sustainable utilization of land resources. They leveraged big data technology to analyze the sustainability of land use in a county from 2009 to 2018, and identified the promising prospects of utilizing big data in addressing challenges related to land resource management and sustainable usage. The above studies have demonstrated the excellent processing and analyzing capabilities of big data processing technology, which support the processing and mining of land resource data. However, the organization and management of cropland big data are neglected in existing studies. Therefore, it is necessary to integrate traditional GIS technology with big data technology to harness the strengths of these distinct technologies and offer robust support for the organization and management of cropland big data.
In order to solve the above limitations, such as the lack of a unified organizational framework for the cropland big data and the poor computational performance of cropland quality evaluation, the study aims to present a new approach for organizing and managing multi-source heterogeneous cropland big data. The specific objectives of this paper are (1) to innovatively propose a cropland big data fusion model with grid as the data organization unit, to form a unified and efficient data organization framework, and to solve the problem of the management and fusion of cropland big data, which are multi-source, multi-dimensional and dynamically changing. (2) We take Da’an County, an important grain production base in the black soil region, as an example to verify the feasibility and effectiveness of this data organization and management method in the application of actual arable land quality evaluation.

2. Materials and Methods
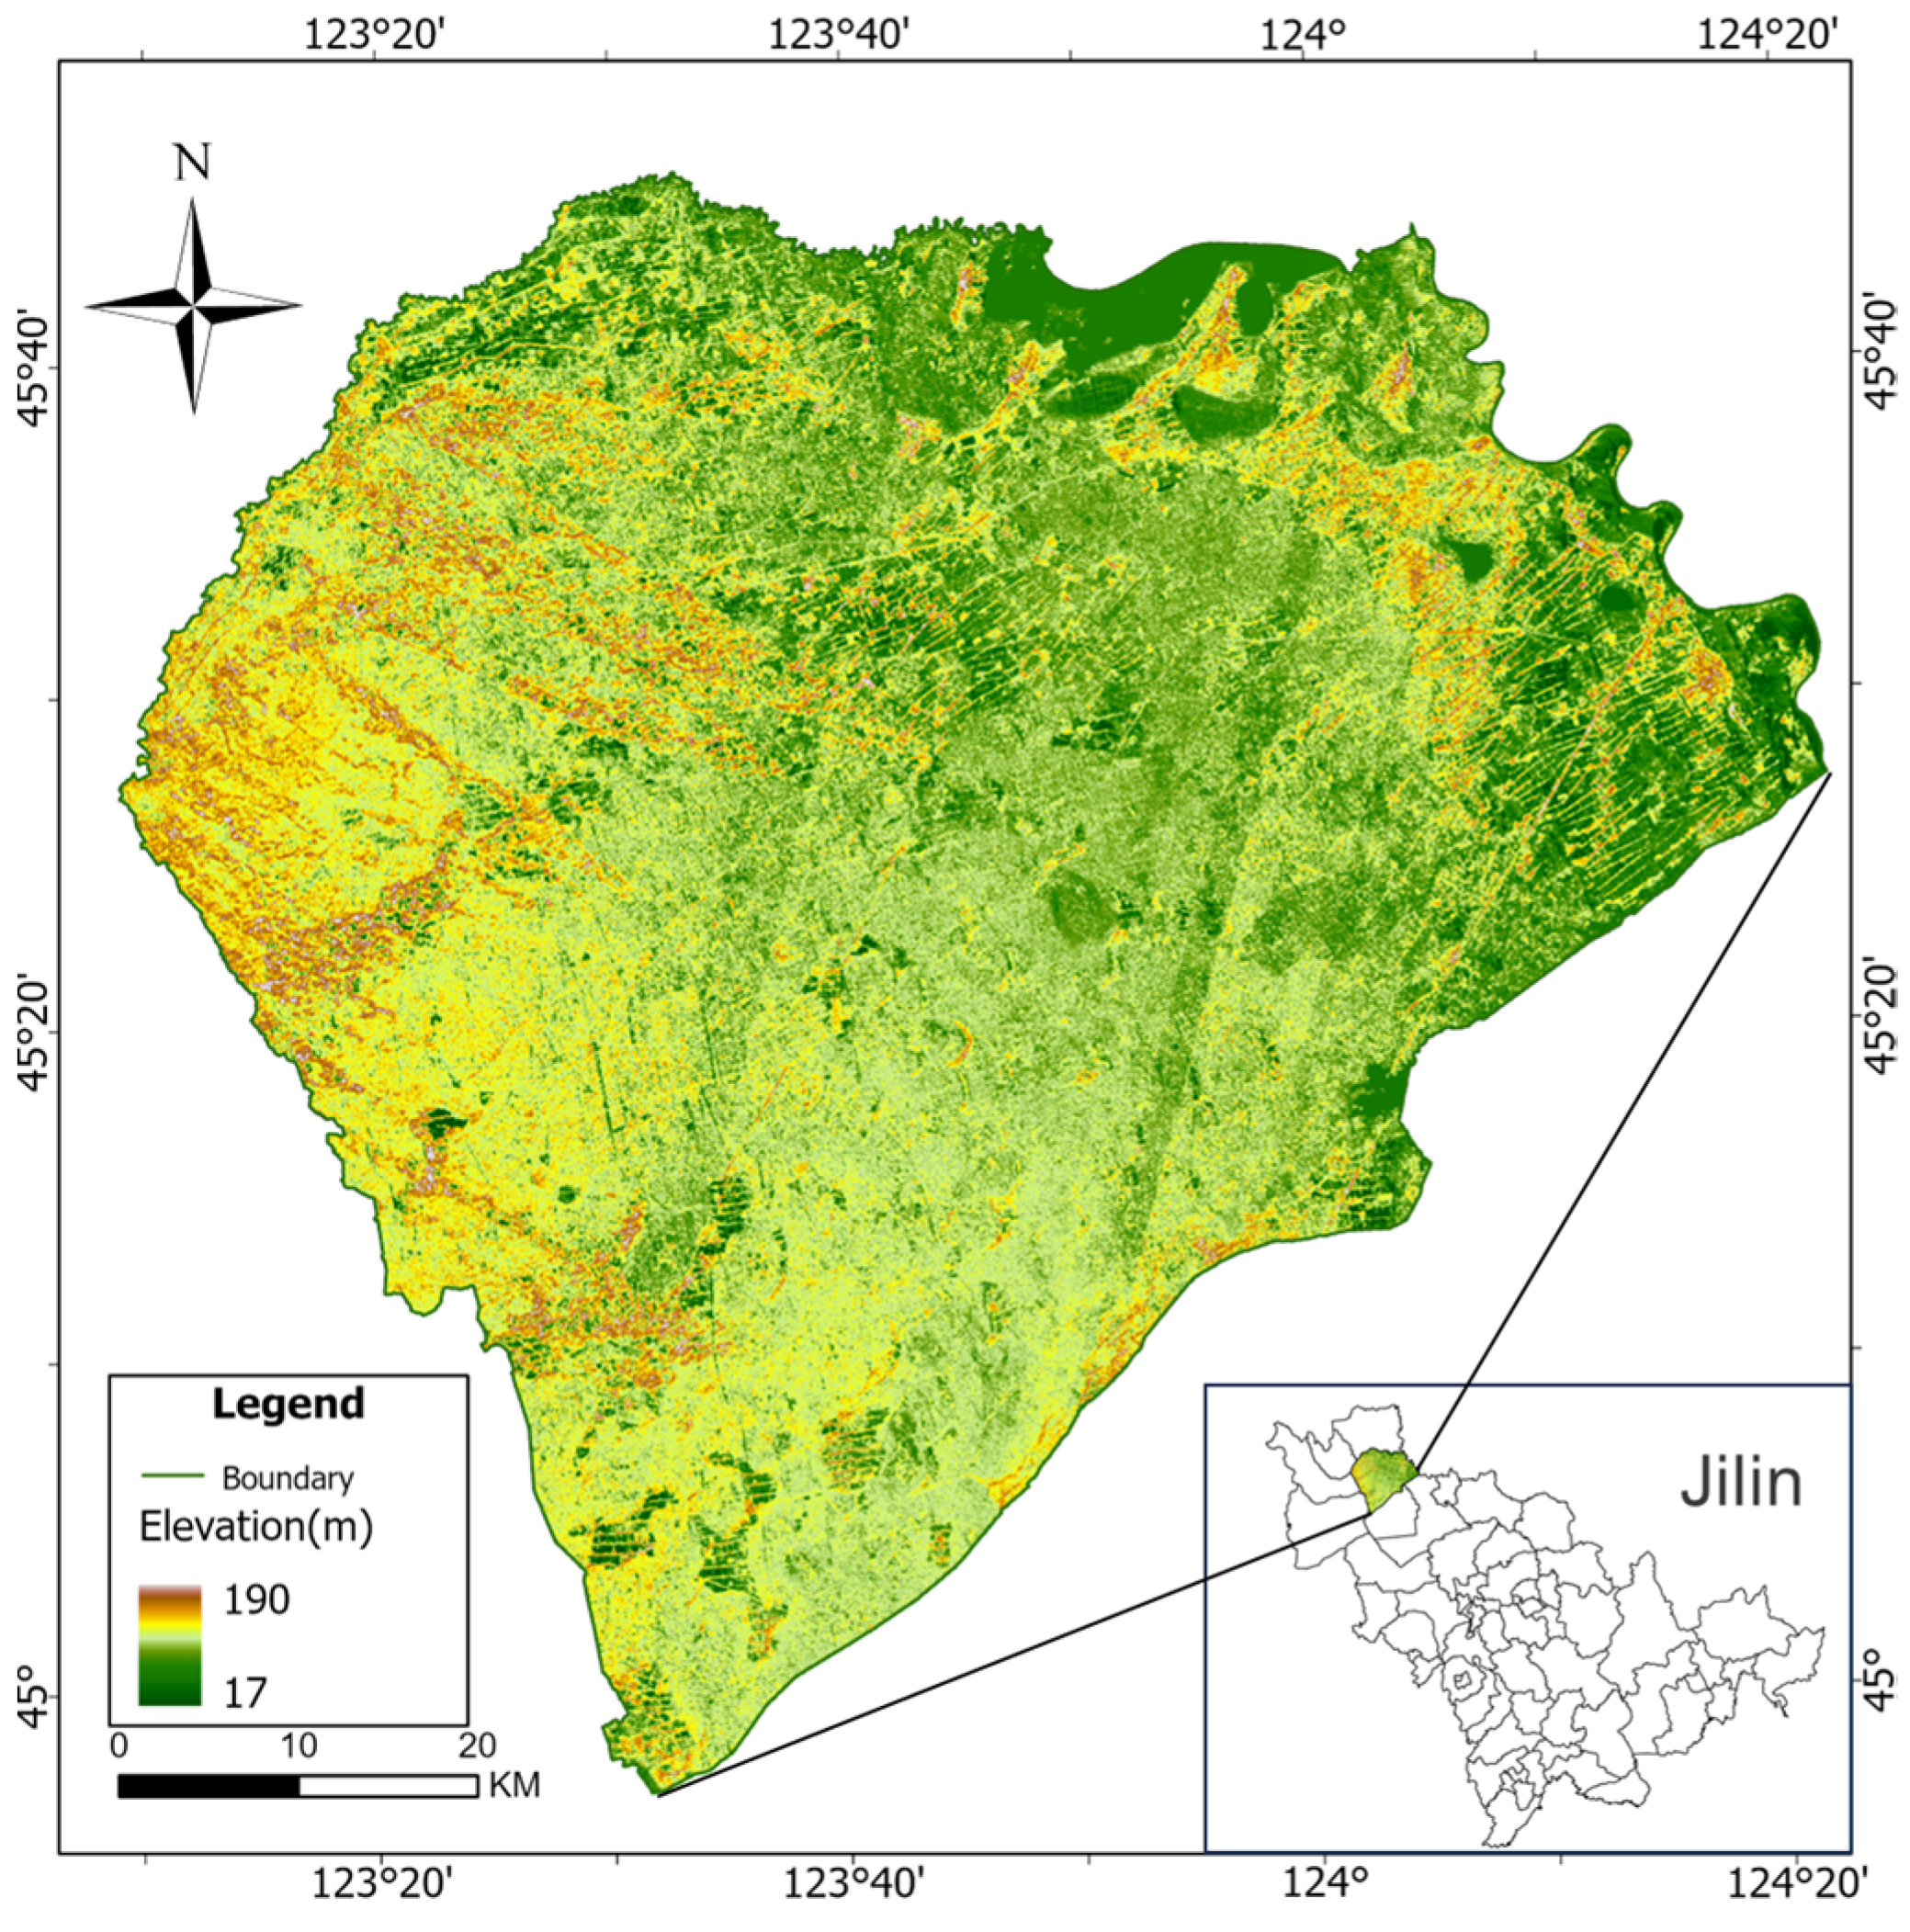
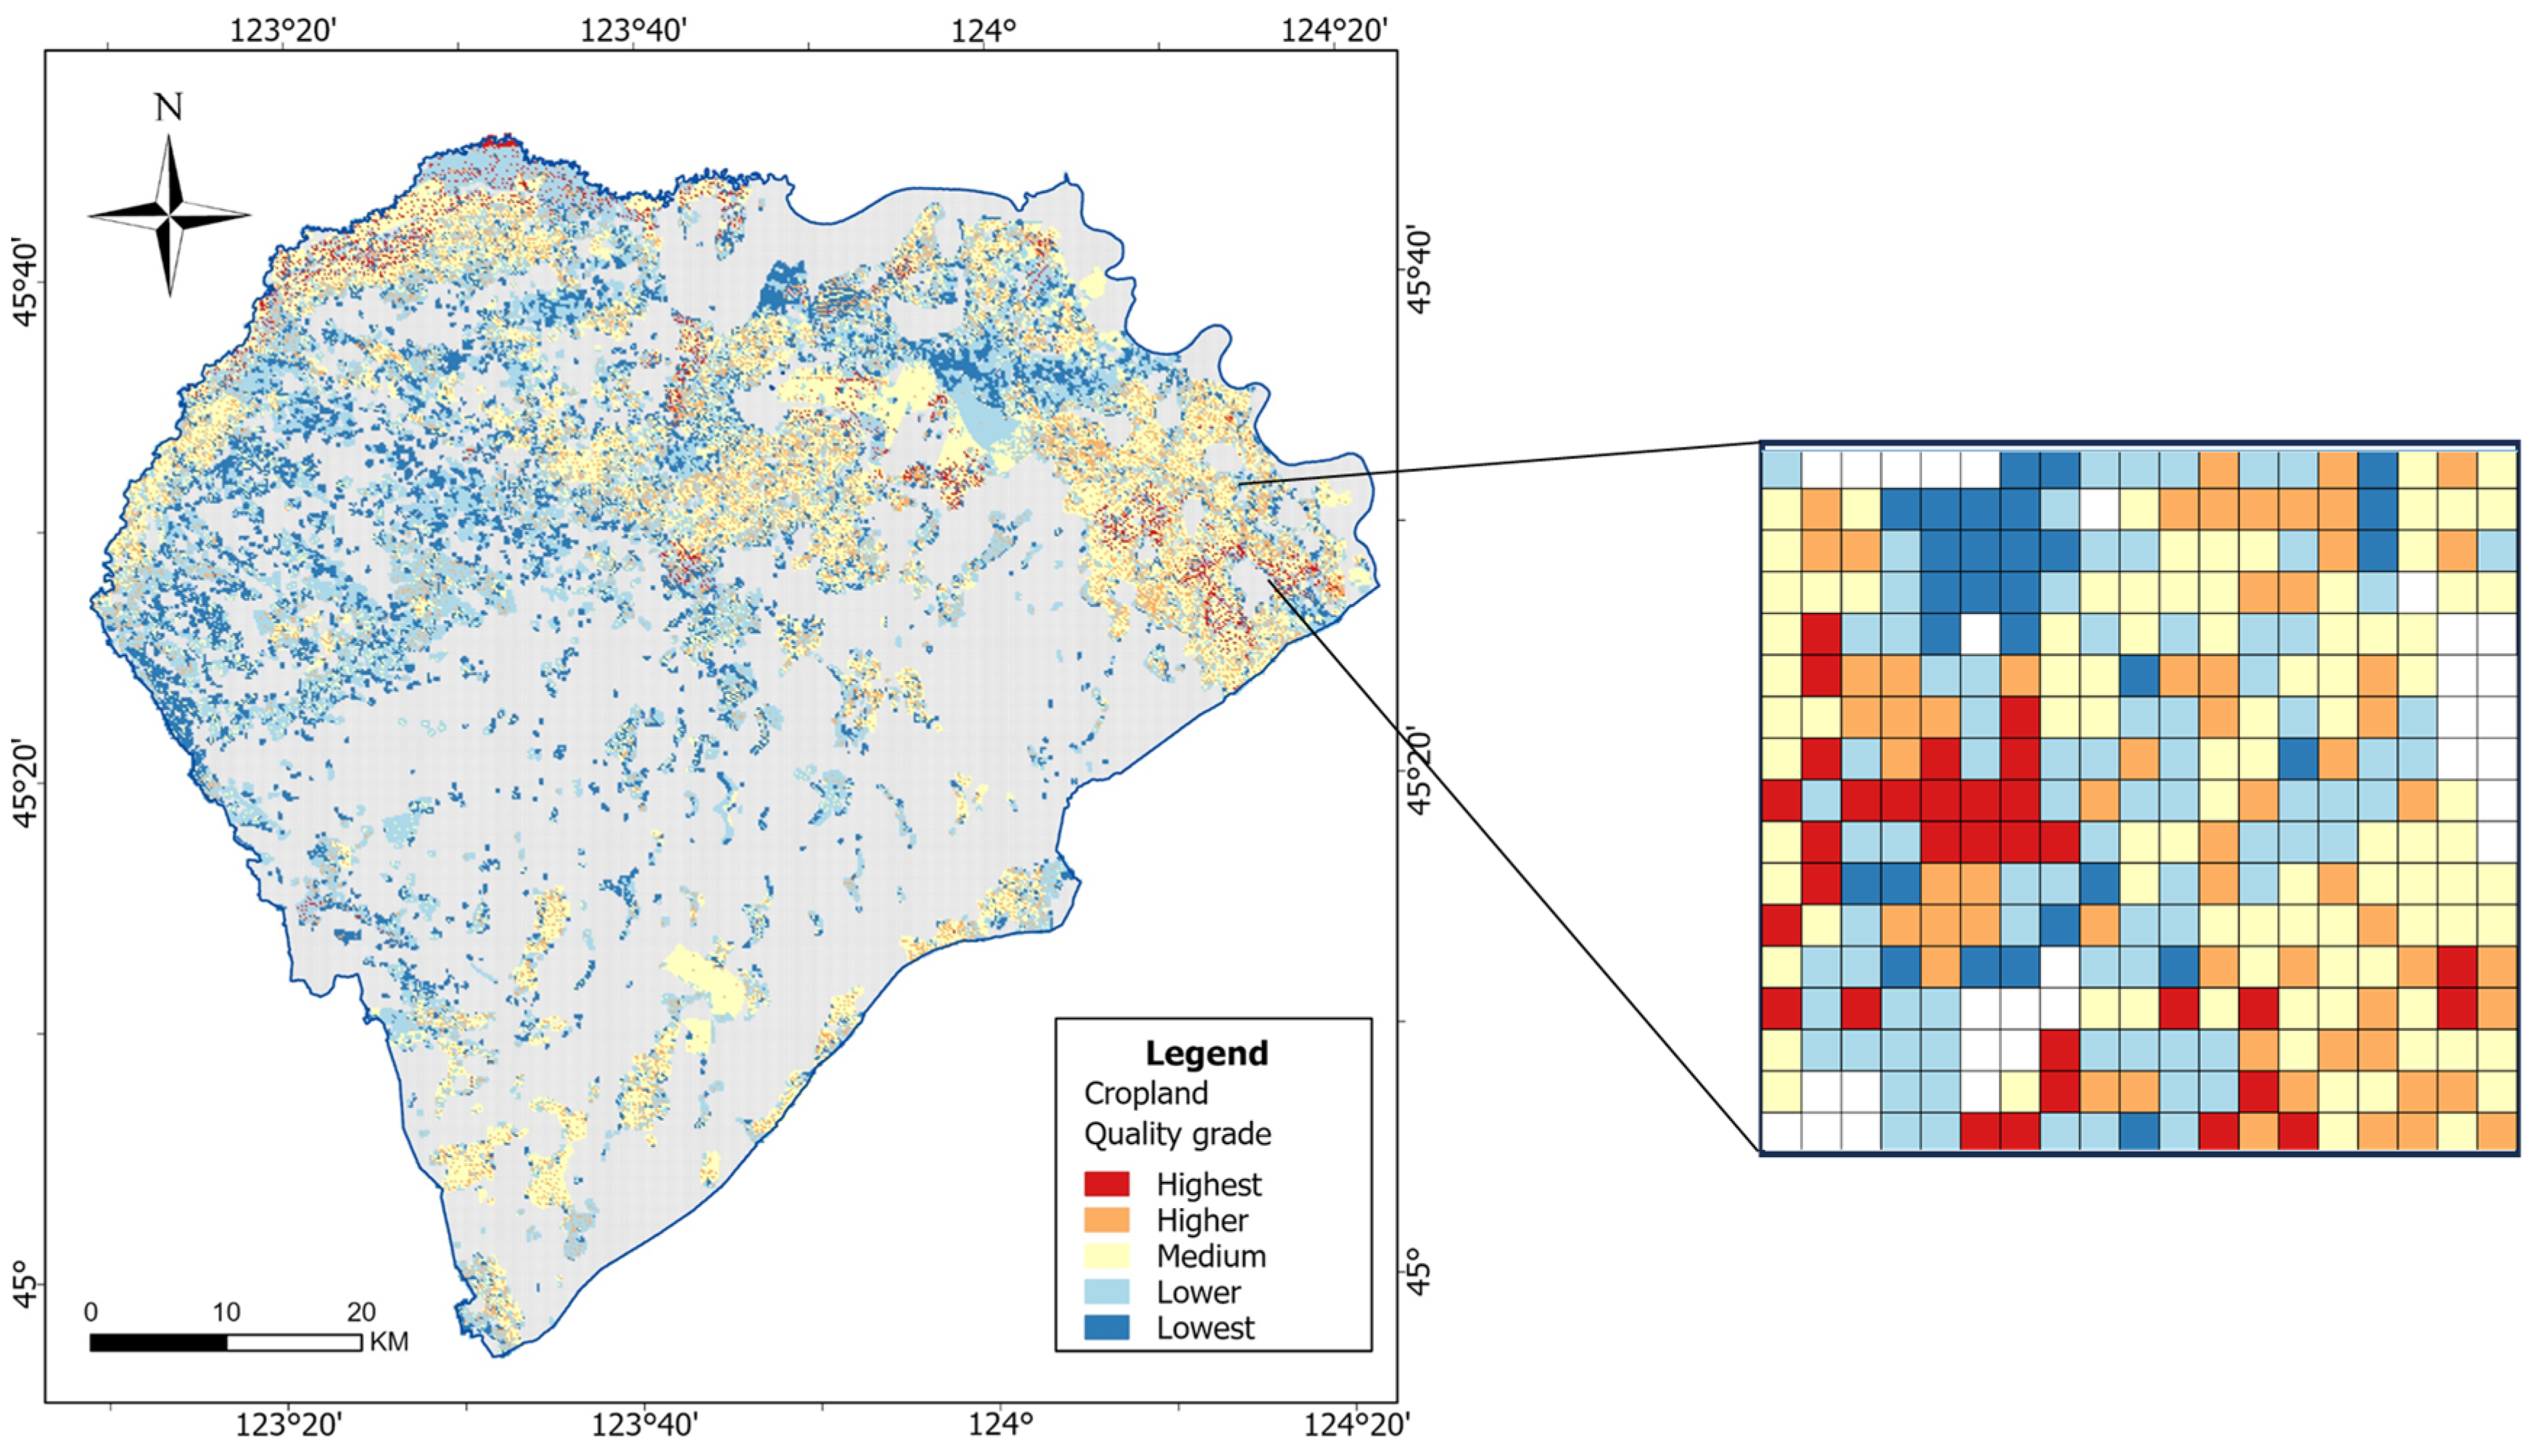
In this paper, we establish a multilevel grid system through the construction of a cropland big data fusion model. This model maps vector data, raster data, and text data into the grid. Considering the specific requirements of cropland quality evaluation, our approach involves selecting appropriate grid layers based on the quantitative and spatial characteristics of cropland patches. We also verify the spatial consistency between cropland grid data and cropland patch data. Lastly, we select a representative test area to conduct a multi-source, heterogeneous cropland big data fusion experiment to evaluate cropland quality and assess the effectiveness of our model within the study area. Figure 1 shows the research framework.

2.1. Study Area

Da’an County is located in the northwestern part of Jilin Province, China, at latitude 45°52′ north and longitude 124°27′ east (as shown in Figure 2). The county is located in the hinterland of the Songnen Plain, with relatively flat terrain. The administrative area of Da’an County includes 10 towns, 5 streets and 8 townships, with a total area of about 487,859 hectares. The region has a temperate continental monsoon climate with four distinct seasons, cold and dry winters and hot and rainy summers. Meanwhile, Da’an County is one of the most important agricultural production areas in Jilin Province, and the main crops include wheat, corn, soybean and rice. The total area of cropland is about 145,750 hectares, specifically including dry cropland, paddy cropland and irrigated cropland. Among them, the type of cropland is mainly dry cropland with an area of 102,441 hectares, paddy cropland with an area of 13,457 hectares and irrigated cropland with an area of 29,852 hectares. Da’an County has rich and high-quality black soil resources, with soil rich in organic matter and nutrients and high soil quality, providing a good production base for agriculture.

2.2. Data Source

Based on data acquisition feasibility and the purposes of the study, this paper mainly collected vector data, raster data and text data to verify the effectiveness of the cropland big data fusion model. Among them, land use data were used to extract cropland patches, road networks and water surfaces in the study area, which were obtained from the data of the Second National Land Survey. DEM data were obtained from Geospatial Data Cloud (https://www.gscloud.cn/ (accessed on 6 June 2023)), and slope values were extracted from DEM data. Soil type data and organic matter value data were obtained from the Ministry of Natural Resources of the People’s Republic of China. Agricultural statistics data were obtained from the 2019 Statistical Yearbook from the government of Da’an County, Jilin Province. Combined with the purpose of the study and data availability, crop production data, agricultural modernization data and agricultural mechanization data were used in this paper. The experimental data and types are shown in Table 1.

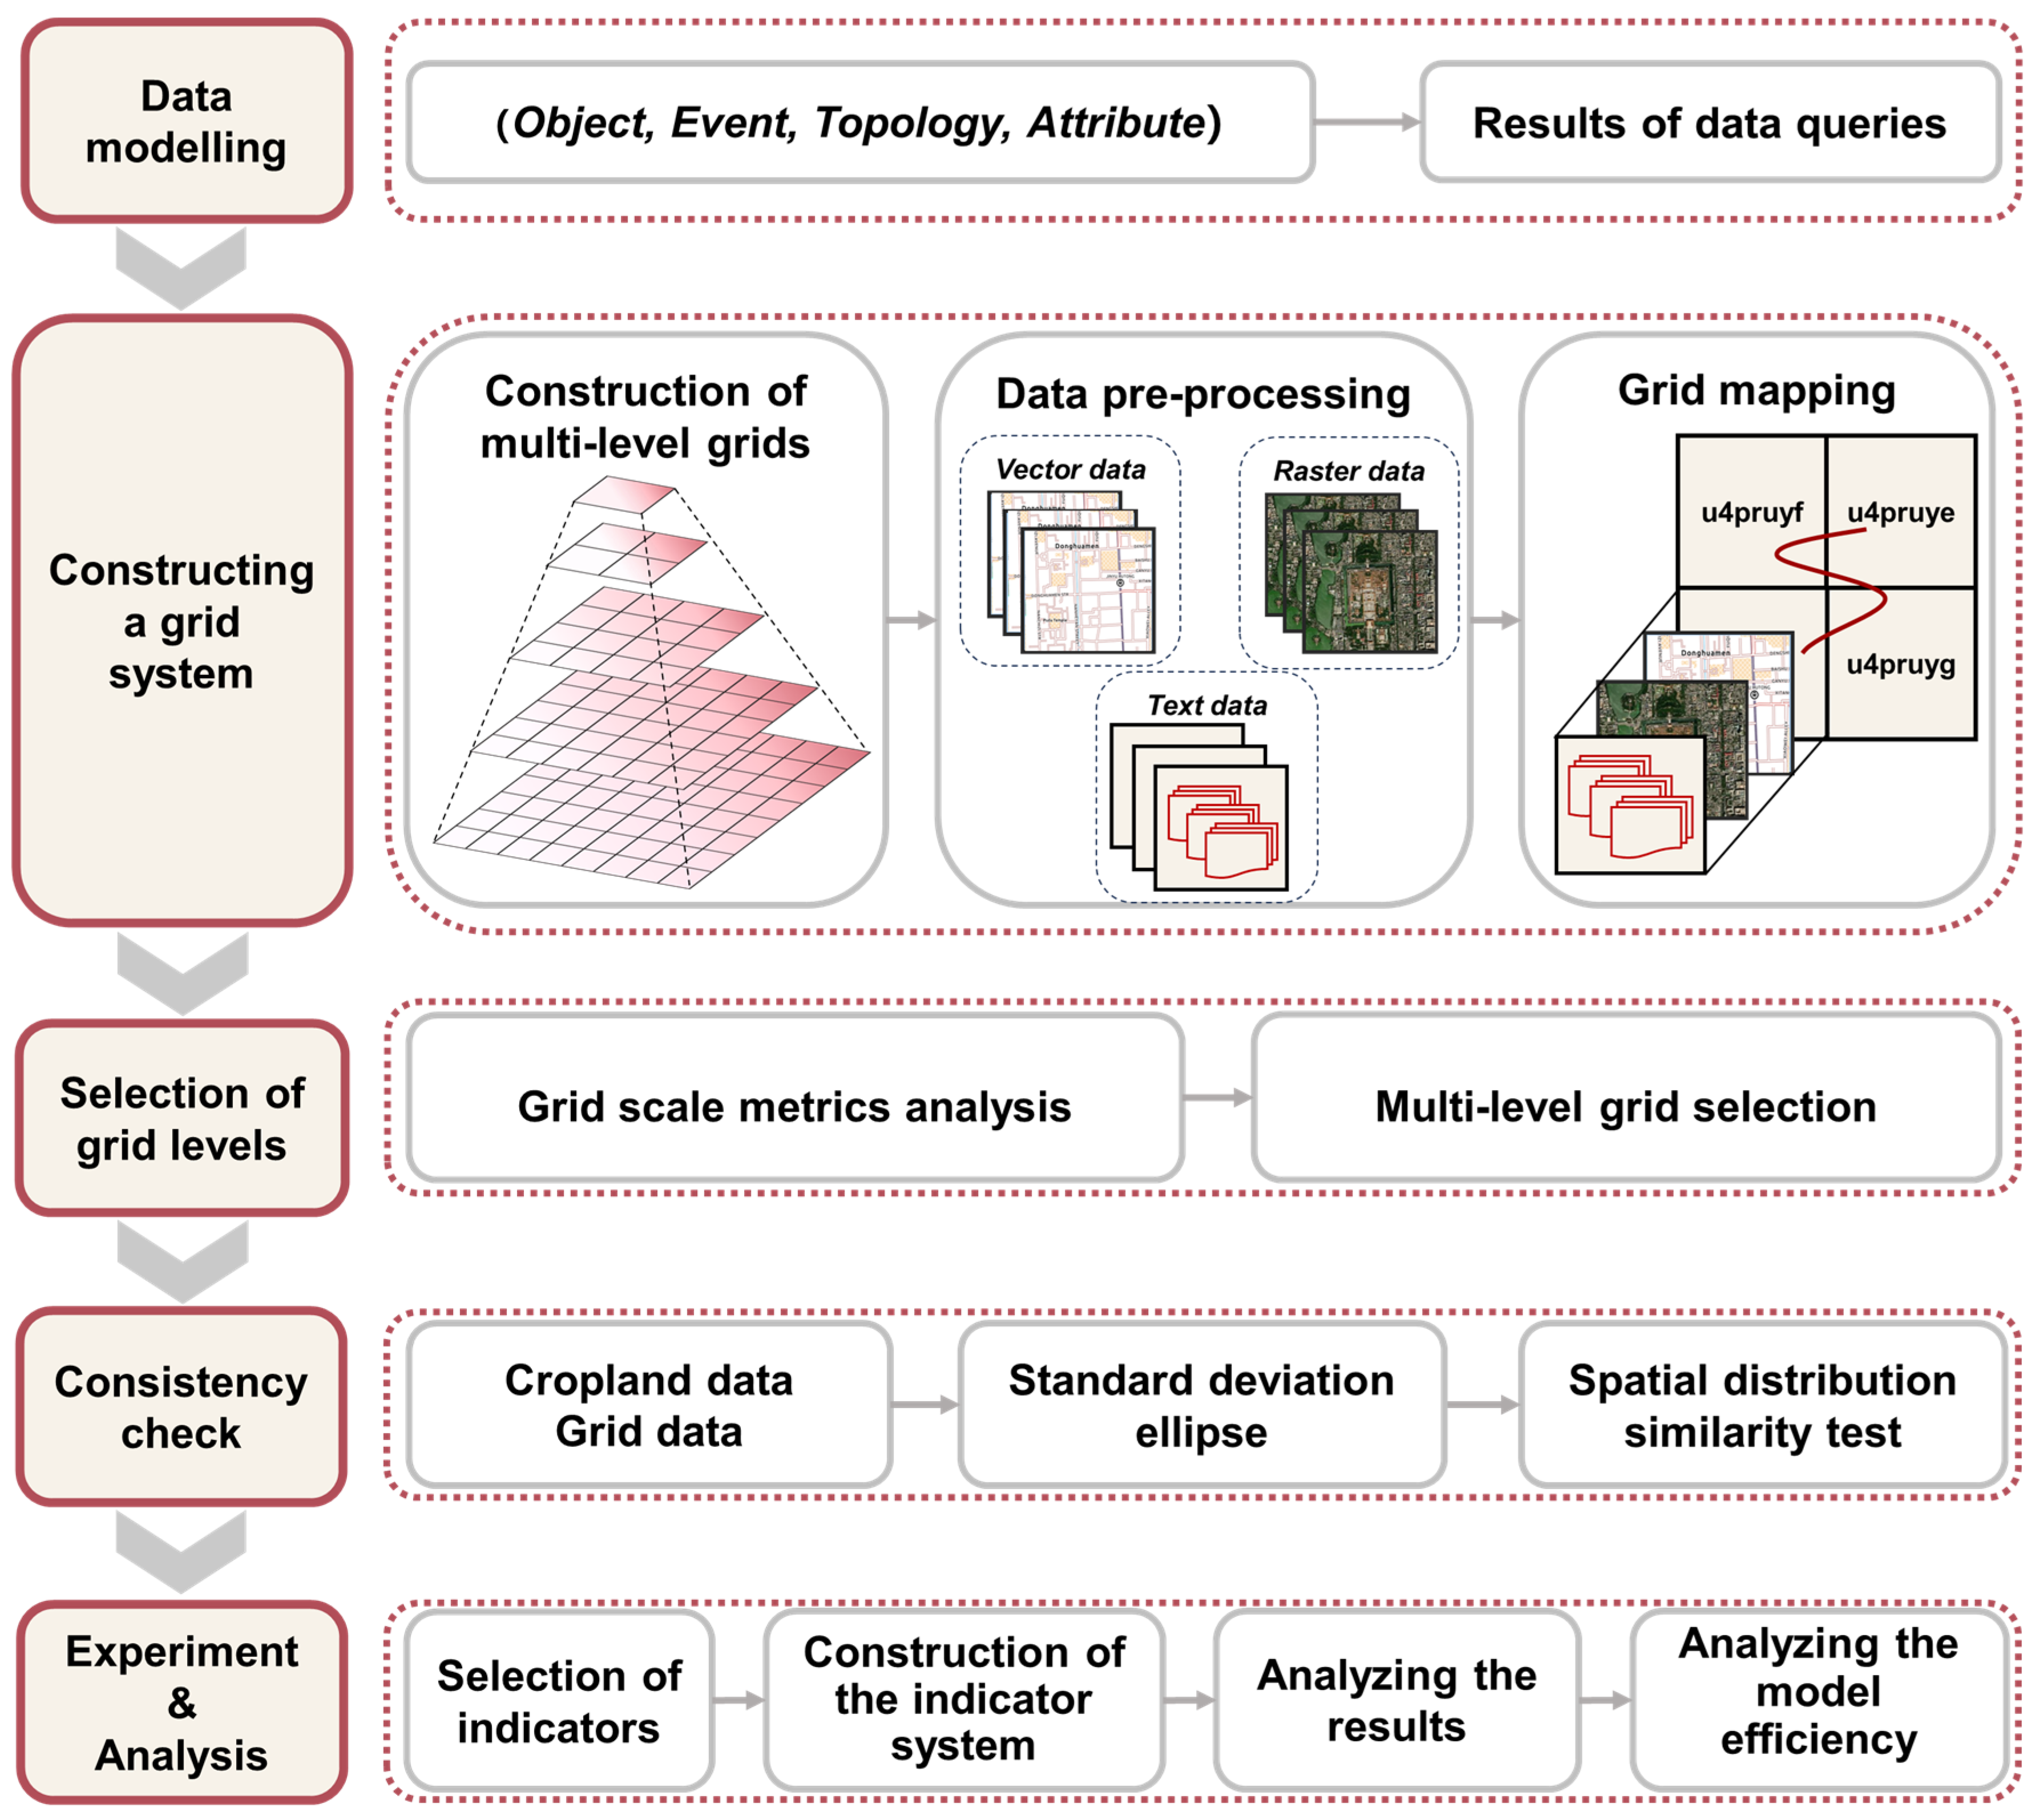
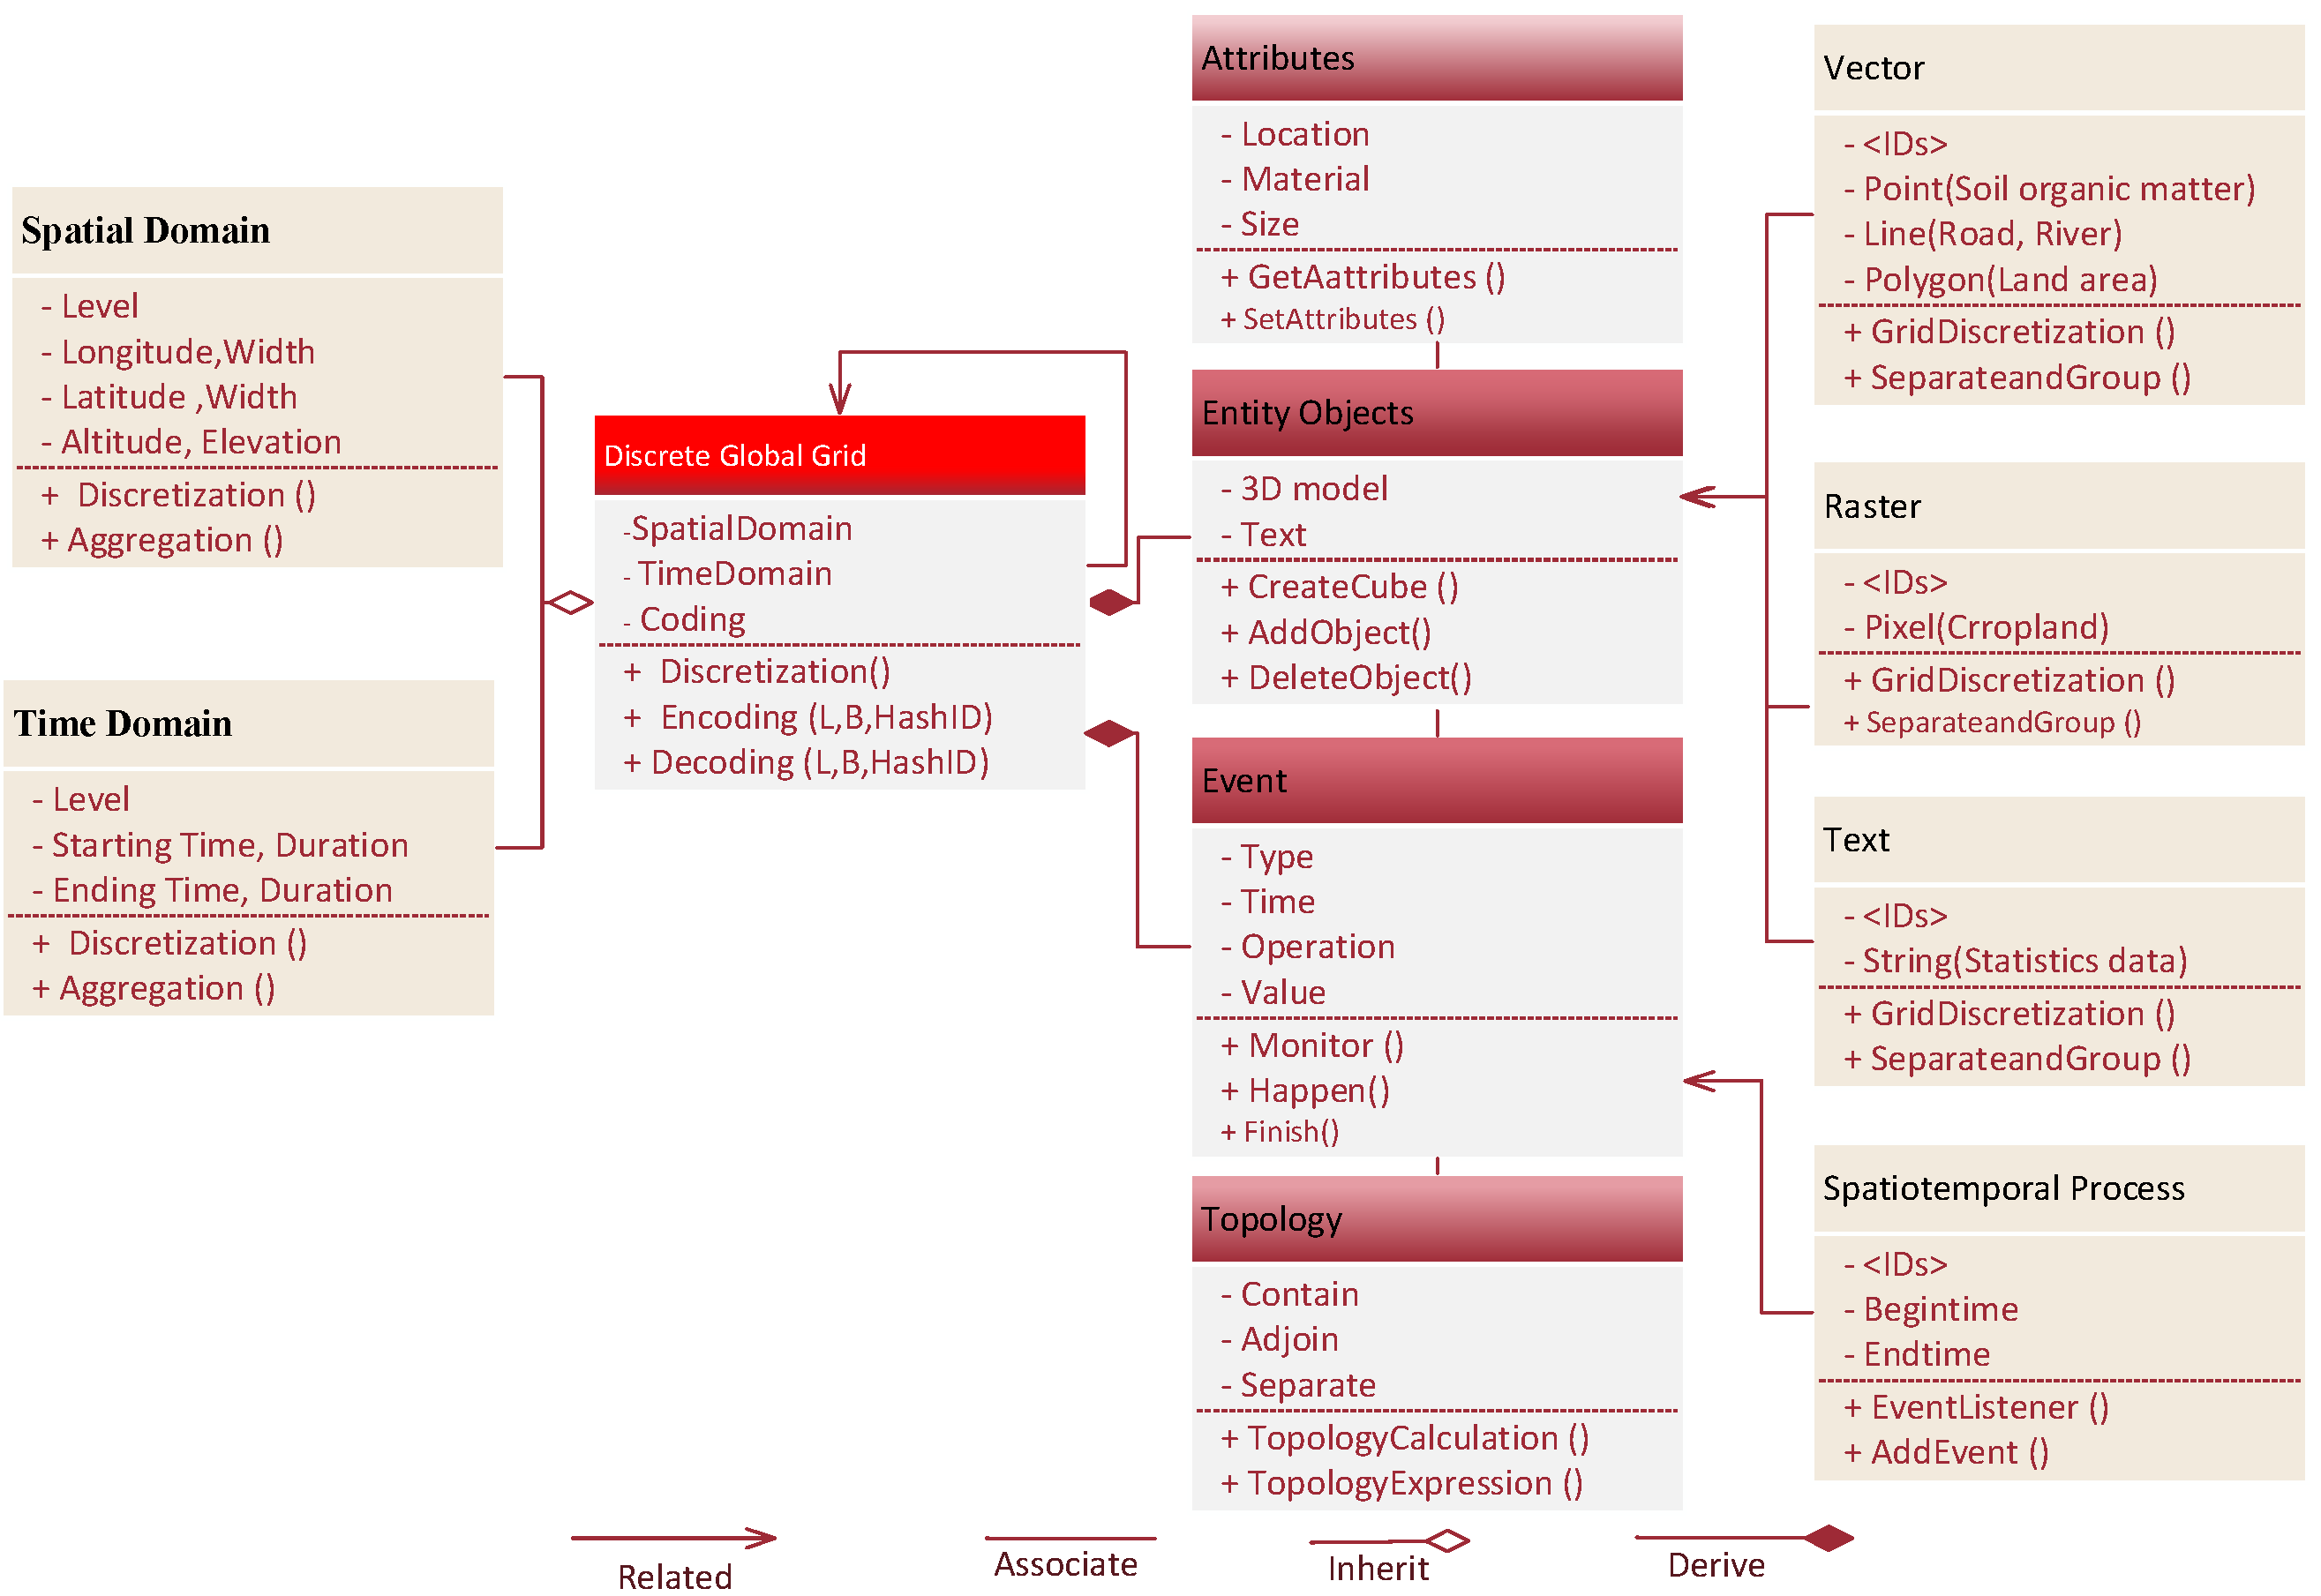
2.3. Establish Cropland Big Data Fusion Model

Facing the demand for the unified organization and efficient management of cropland quality big data, this paper establishes a cropland big data fusion model based on a dissected grid, which can accurately portray the development and change of objective cropland quality data in the temporal, spatial and attribute domains.
The proposed model is based on the data model of the Global Subdivision Grid [24]. It is an extension of the big data fusion model used in the application of cropland. The traditional data model, including vector data models, raster data models, and object-oriented models, realizes data management through the management of a single layer or object, whereas the cropland big data fusion model realizes data management through the management of a single layer or object. The cropland big data fusion mode realizes big data management by mapping the spatial and attribute features of cropland into a dissected grid.
The UML graph (as shown in Figure 3) of the cropland big data fusion model is designed as follows. The discrete grid class inherits the spatial subdivision and encoding methods from the space domain class and time domain class; the entity, object attribute, event and simple topological relationship classes are derived from the discrete grid class, and inherit all the members and methods of the discrete grid; the entity, object, event and simple topological relationship classes are associated with the attribute table through the unique primary key of the data table (the grid code). Finally, the encoded collection realizes the representation of the vector-based point, polyline and polygon objects, raster-based remote sensing image data, time-based geographic processes and semantic-based socio-statistical text data. The model not only describes the spatial and temporal changes of physical objects, but also determines the topological relationship between objects through coding.
The conceptual model of big data fusion model of cropland quality is designed as follows:
C o d e G r i d = {   o b j , e v e n , t o p o , a t t r |   f C o d e G r i d }
The process includes encoding and feature mapping of discrete cells, and also includes a query process to obtain grid cell attributes based on the encoding. C o d e G r i d stand for the code of discrete grid of cropland. o b j , e v e n , t o p o and a t t r stand for objects, event collections, topological geometries and attribute collections belonging to the matching discrete grid. The function f returns the results of a query that retrieves all the attributes from current C o d e G r i d .
We build distributed grid datasets by encoding discrete cells via Geohash [25] and using them as index table primary keys for distributed grid datasets. The multilevel feature of grids provides a natural advantage for searching object and describing the boundaries of arable land. In the query and retrieval of arable land objects, if there is no such object in the parent grid, there is no need to query the child grid, which improves the efficiency of the data query. When describing the boundaries of the arable land polygon, the four child grids can be automatically synthesized into the parent grid, which reduces the number of grids and improves the accuracy of description for cropland boundaries.

2.4. Establish a Multilevel Grid System for Cropland Big Data

2.4.1. Creation of Multilevel Grid

This study establishes a multilevel grid based on Geohash coding. Geohash is a geocoding system that maps geographic coordinate points into short strings for the efficient storage and transmission of geolocation information in computer systems, and it also represents geographic area’s extent. The method meets the need for data aggregation, which means that the spatial extent of its representation will be reduced with each additional bit of the encoding. Therefore, the Geohash algorithm is used as a basis for constructing multilevel grids based on the range of coding accuracy, and the grids are coded and the uniqueness of the grid code is verified.

2.4.2. Preprocessing of Heterogeneous Cropland Big Data from Multiple Sources

Given the multitude of data types and intricate structures inherent in cropland big data, it is imperative to engage in pre-processing to ensure the reliability and consistency of the data. Cropland big data are classified according to data types and processed as vector data, raster data, and text data individually. Vector data represent geographic objects through geometric ensembles of points, polylines, and polygons [26]. Therefore, the data need to be processed according to different geometric types, through the normalization of attribute tables, the definition of projections and coordinates based on multilevel grid systems, and the integration of data based on geometric types. Raster data are based on image element arrays to represent geographic information [27], and the specific processing steps are: clipping the data in the range of administrative divisions, resampling the data based on the grid scale, defining projections, and converting coordinates based on the multilevel grid system. In addition, geospatial data are interpolated using interpolation techniques such as inverse distance weighted interpolation [28] to fill in missing values to ensure data integrity. Compared with geospatial data, the data structure of text data is relatively simple, and the specific content of data processing is data cleaning and data standardization.

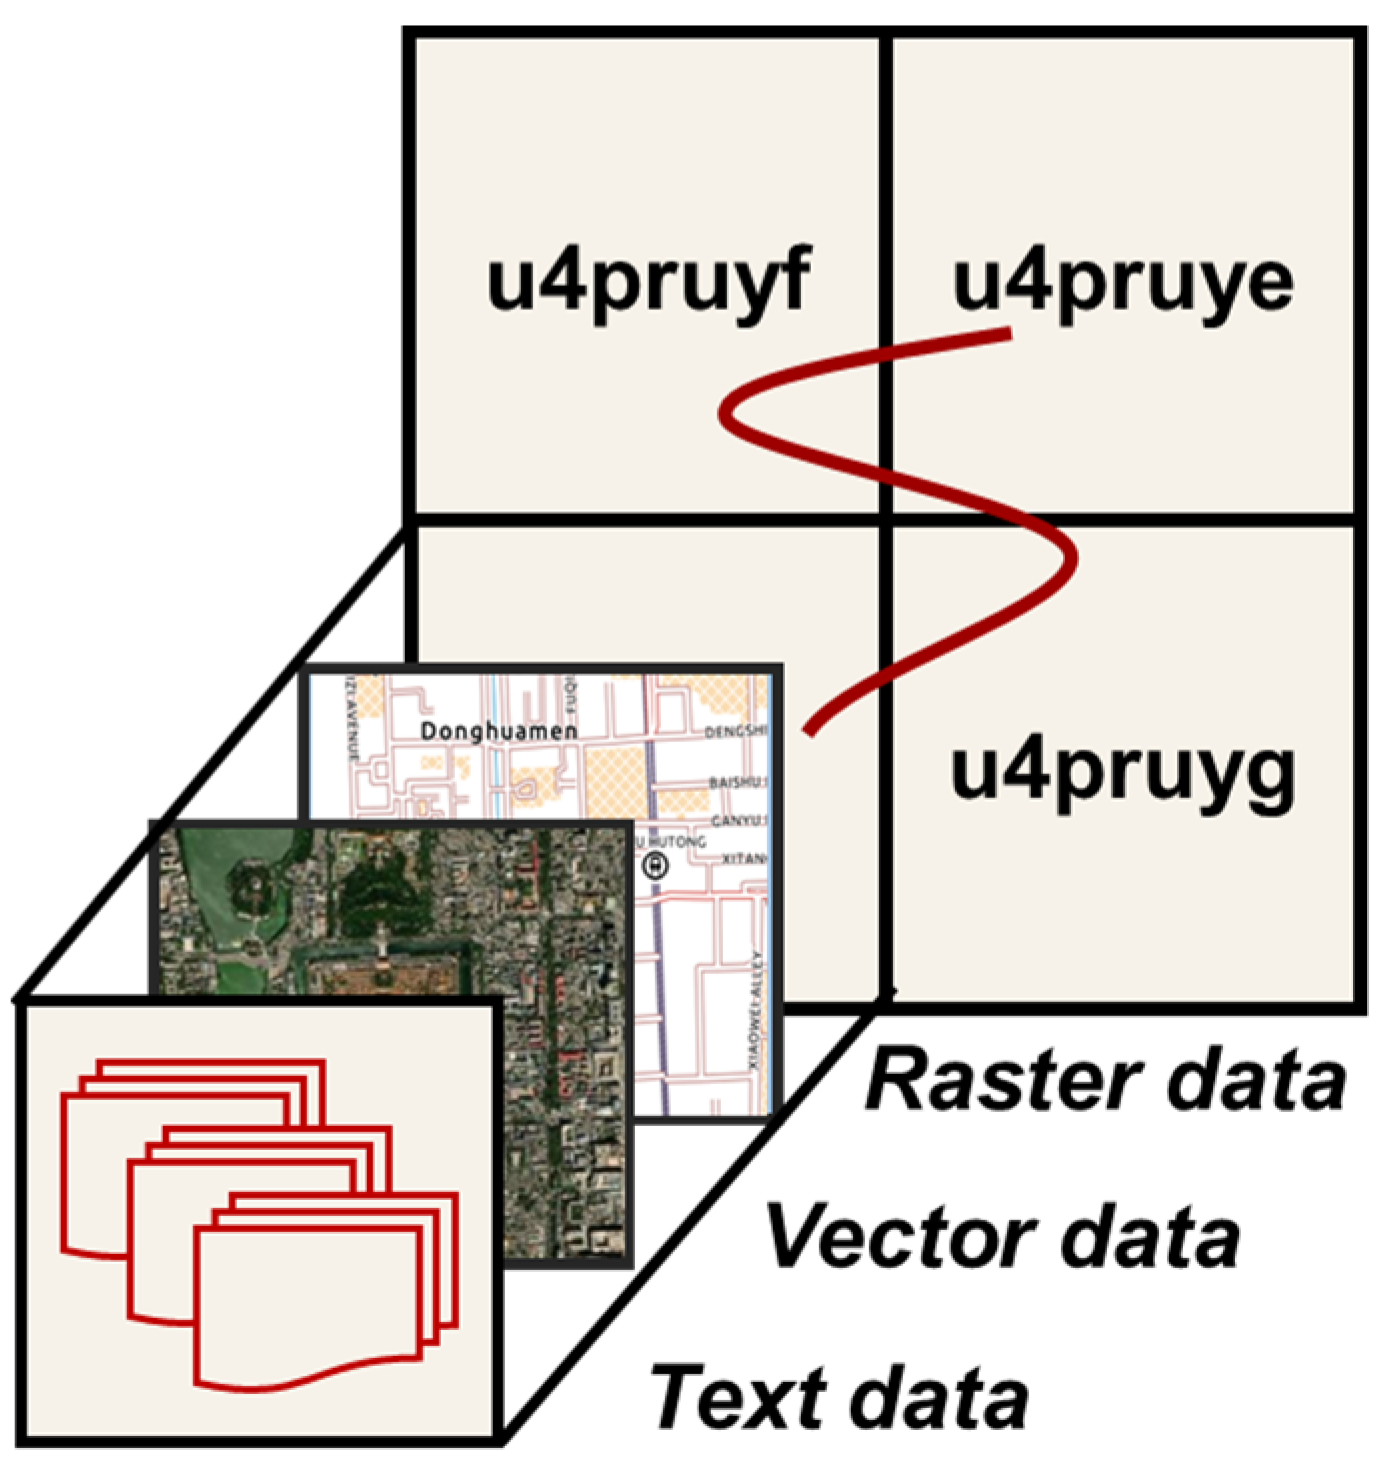
2.4.3. Grid Mapping of Heterogeneous Cropland Big Data from Multi-Sources

In terms of vector data, cropland patch data are considered the basis of cropland big data. Therefore, cropland patch data could be used as a grid mapping standard for other cropland big data. However, due to the variability of the spatial pattern and area of cropland patches, the grid mapping of cropland patch data requires the development of grid mapping rules to improve the grid processing efficiency of cropland patches data. Building upon this foundation, the presence of multiple cropland patches within a grid cell is managed by prioritizing area occupancy. In such cases, when the grid intersects with multiple cropland patches, we allocate land to the grid based on the cropland patch with the largest area coverage within that grid.
In the case of raster data, the accurate mapping of the values of the image elements into the grid is a key component. Therefore, the grid mapping of raster data should evaluate the suitability of image elements to the grid scale in order to obtain accurate grid data.
In addition, with respect to text data, firstly, an attribute table for text grid data is established. Secondly, determine the names and data types of each field of the attribute table. Finally, the text message is allocated to the grid.
Based on the above steps, the vector data, the raster data, and the text data will be mapped into the grid system according to the grid scale of each level (as shown in Figure 4).

2.5. Selection of Cropland Quality Big Data Grid Levels

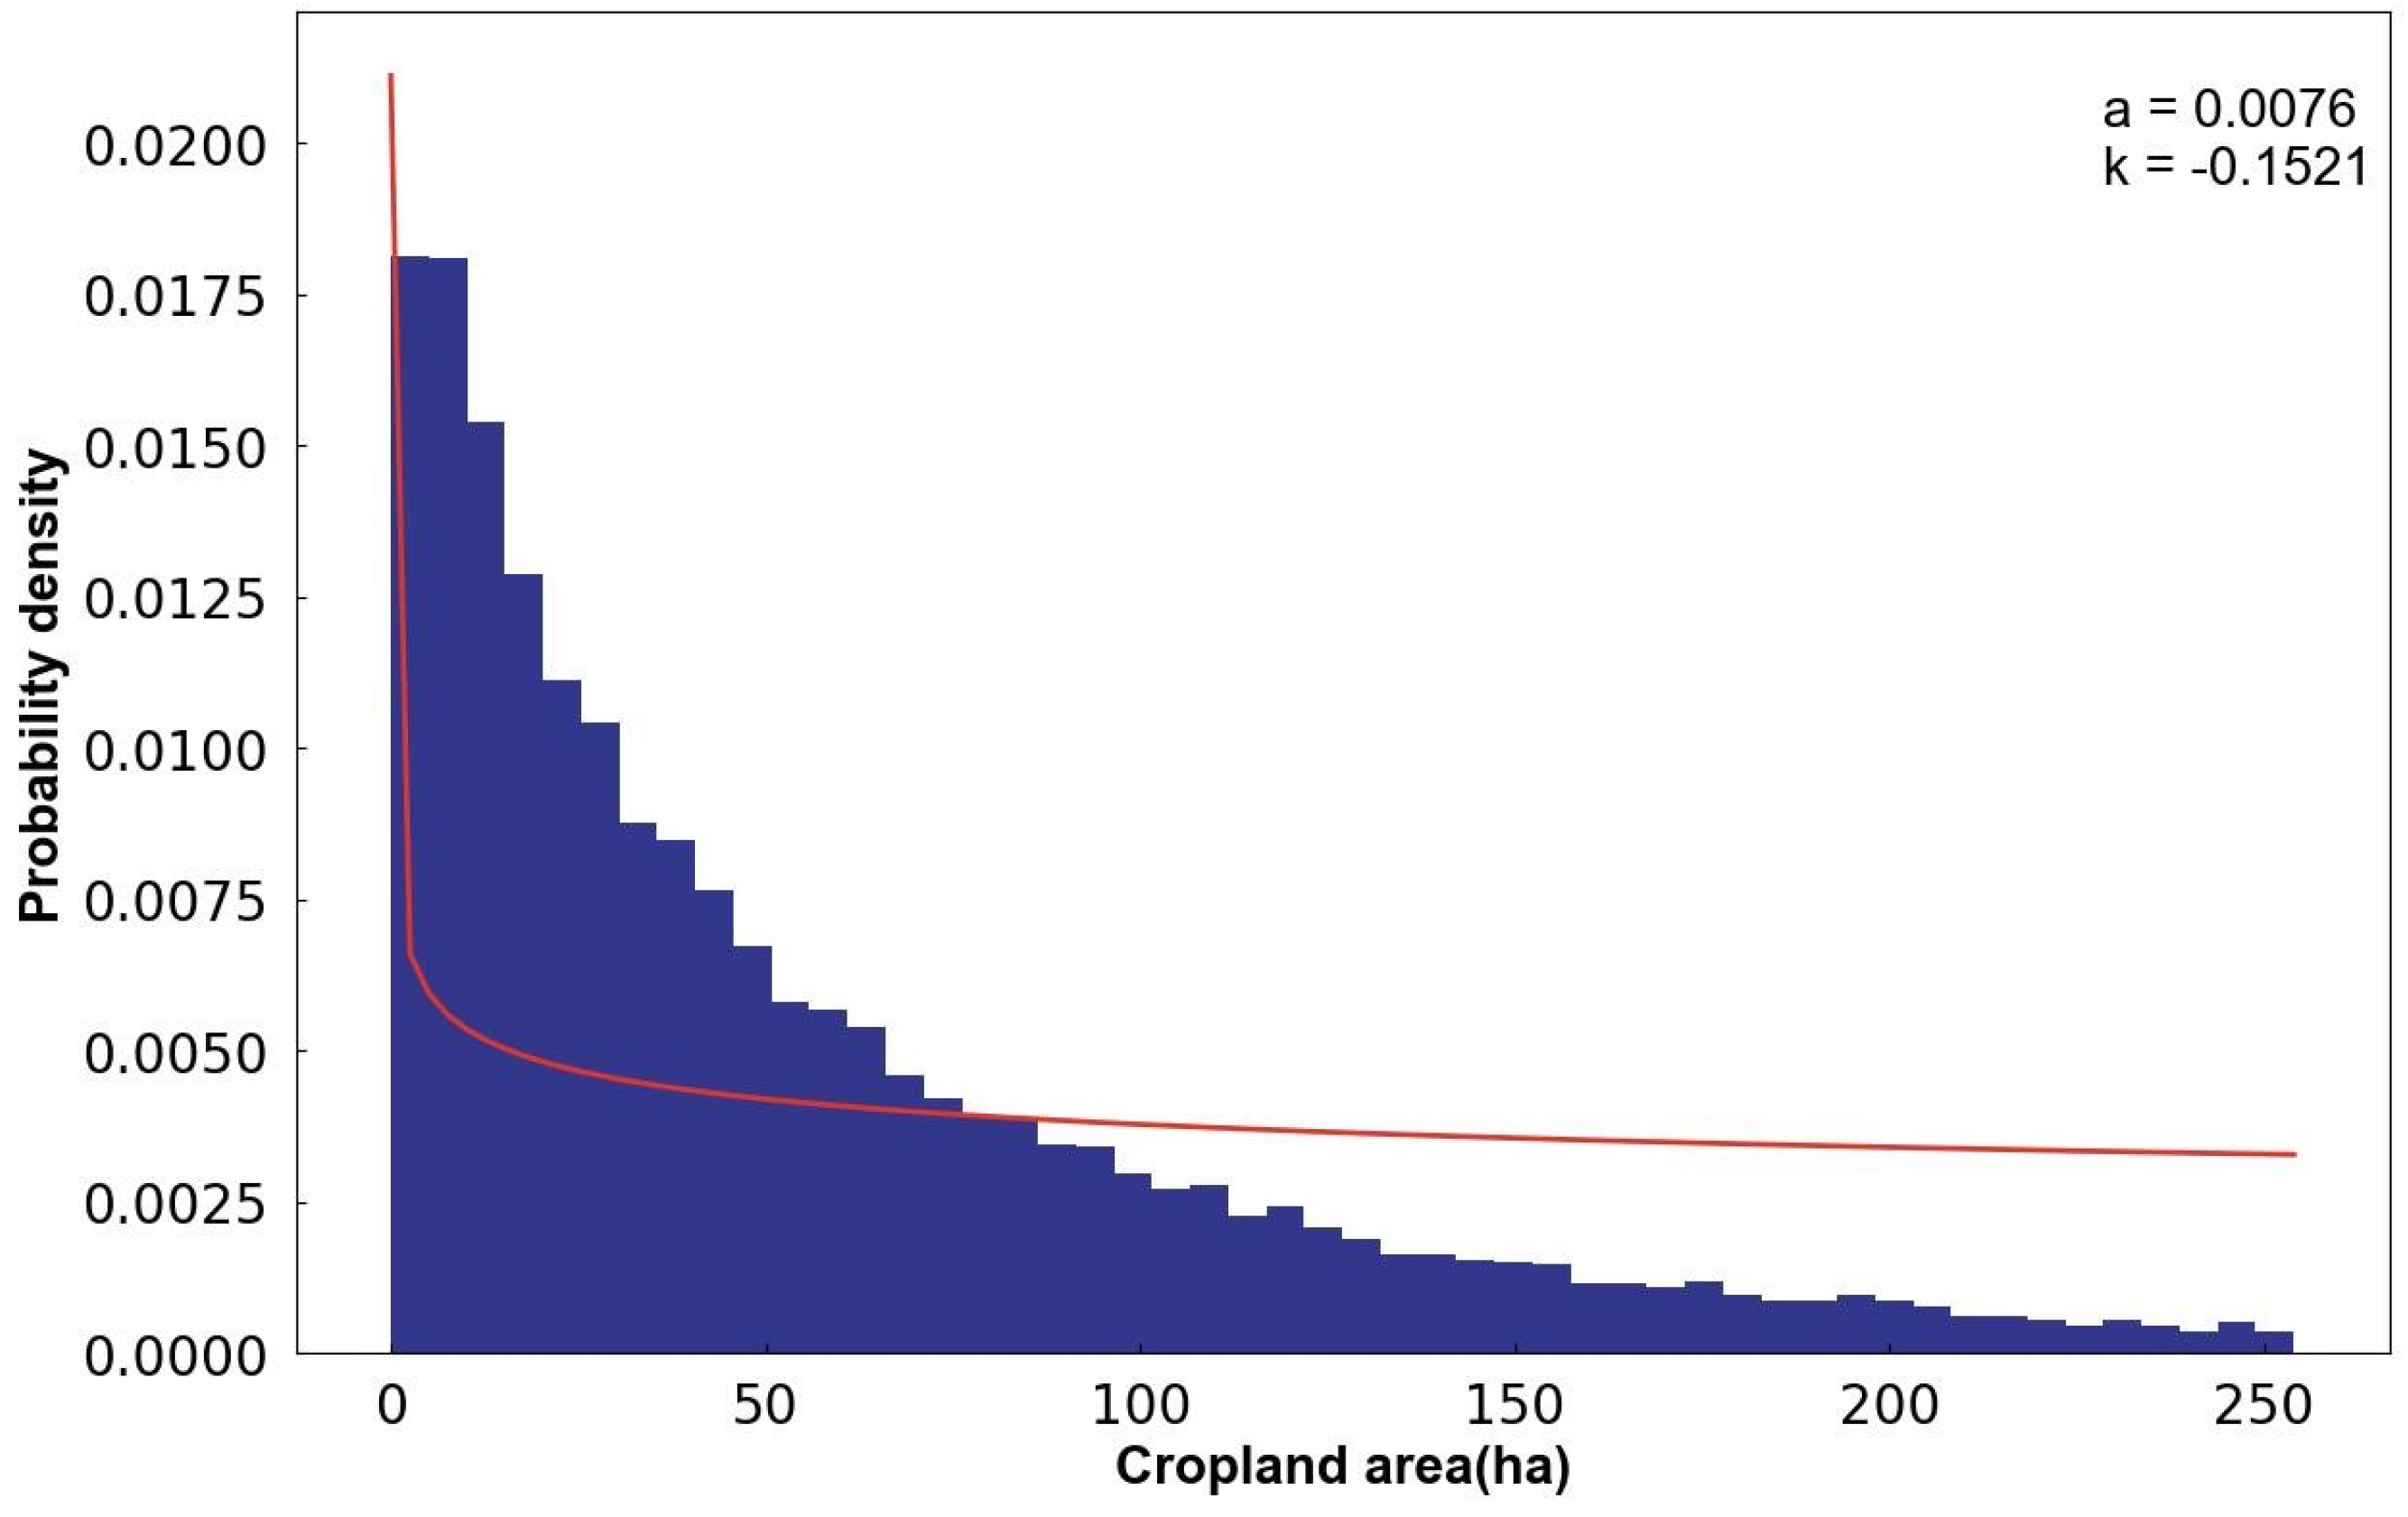
2.5.1. Adaptive Grid-Scale Indicator Analysis for Cropland Quality Evaluation

This study constructs a big data fusion model for cropland that satisfies multilevel management. Cropland patches have regional variability and need to be analyzed according to evaluation indicators to select the optimal scale of the grid. Therefore, this study examined the area of cropland patches and the spatial relationship between the grid scale and cropland patches in terms of both quantitative and spatial characteristics, and the results could be used as a basis for selecting the grid level.

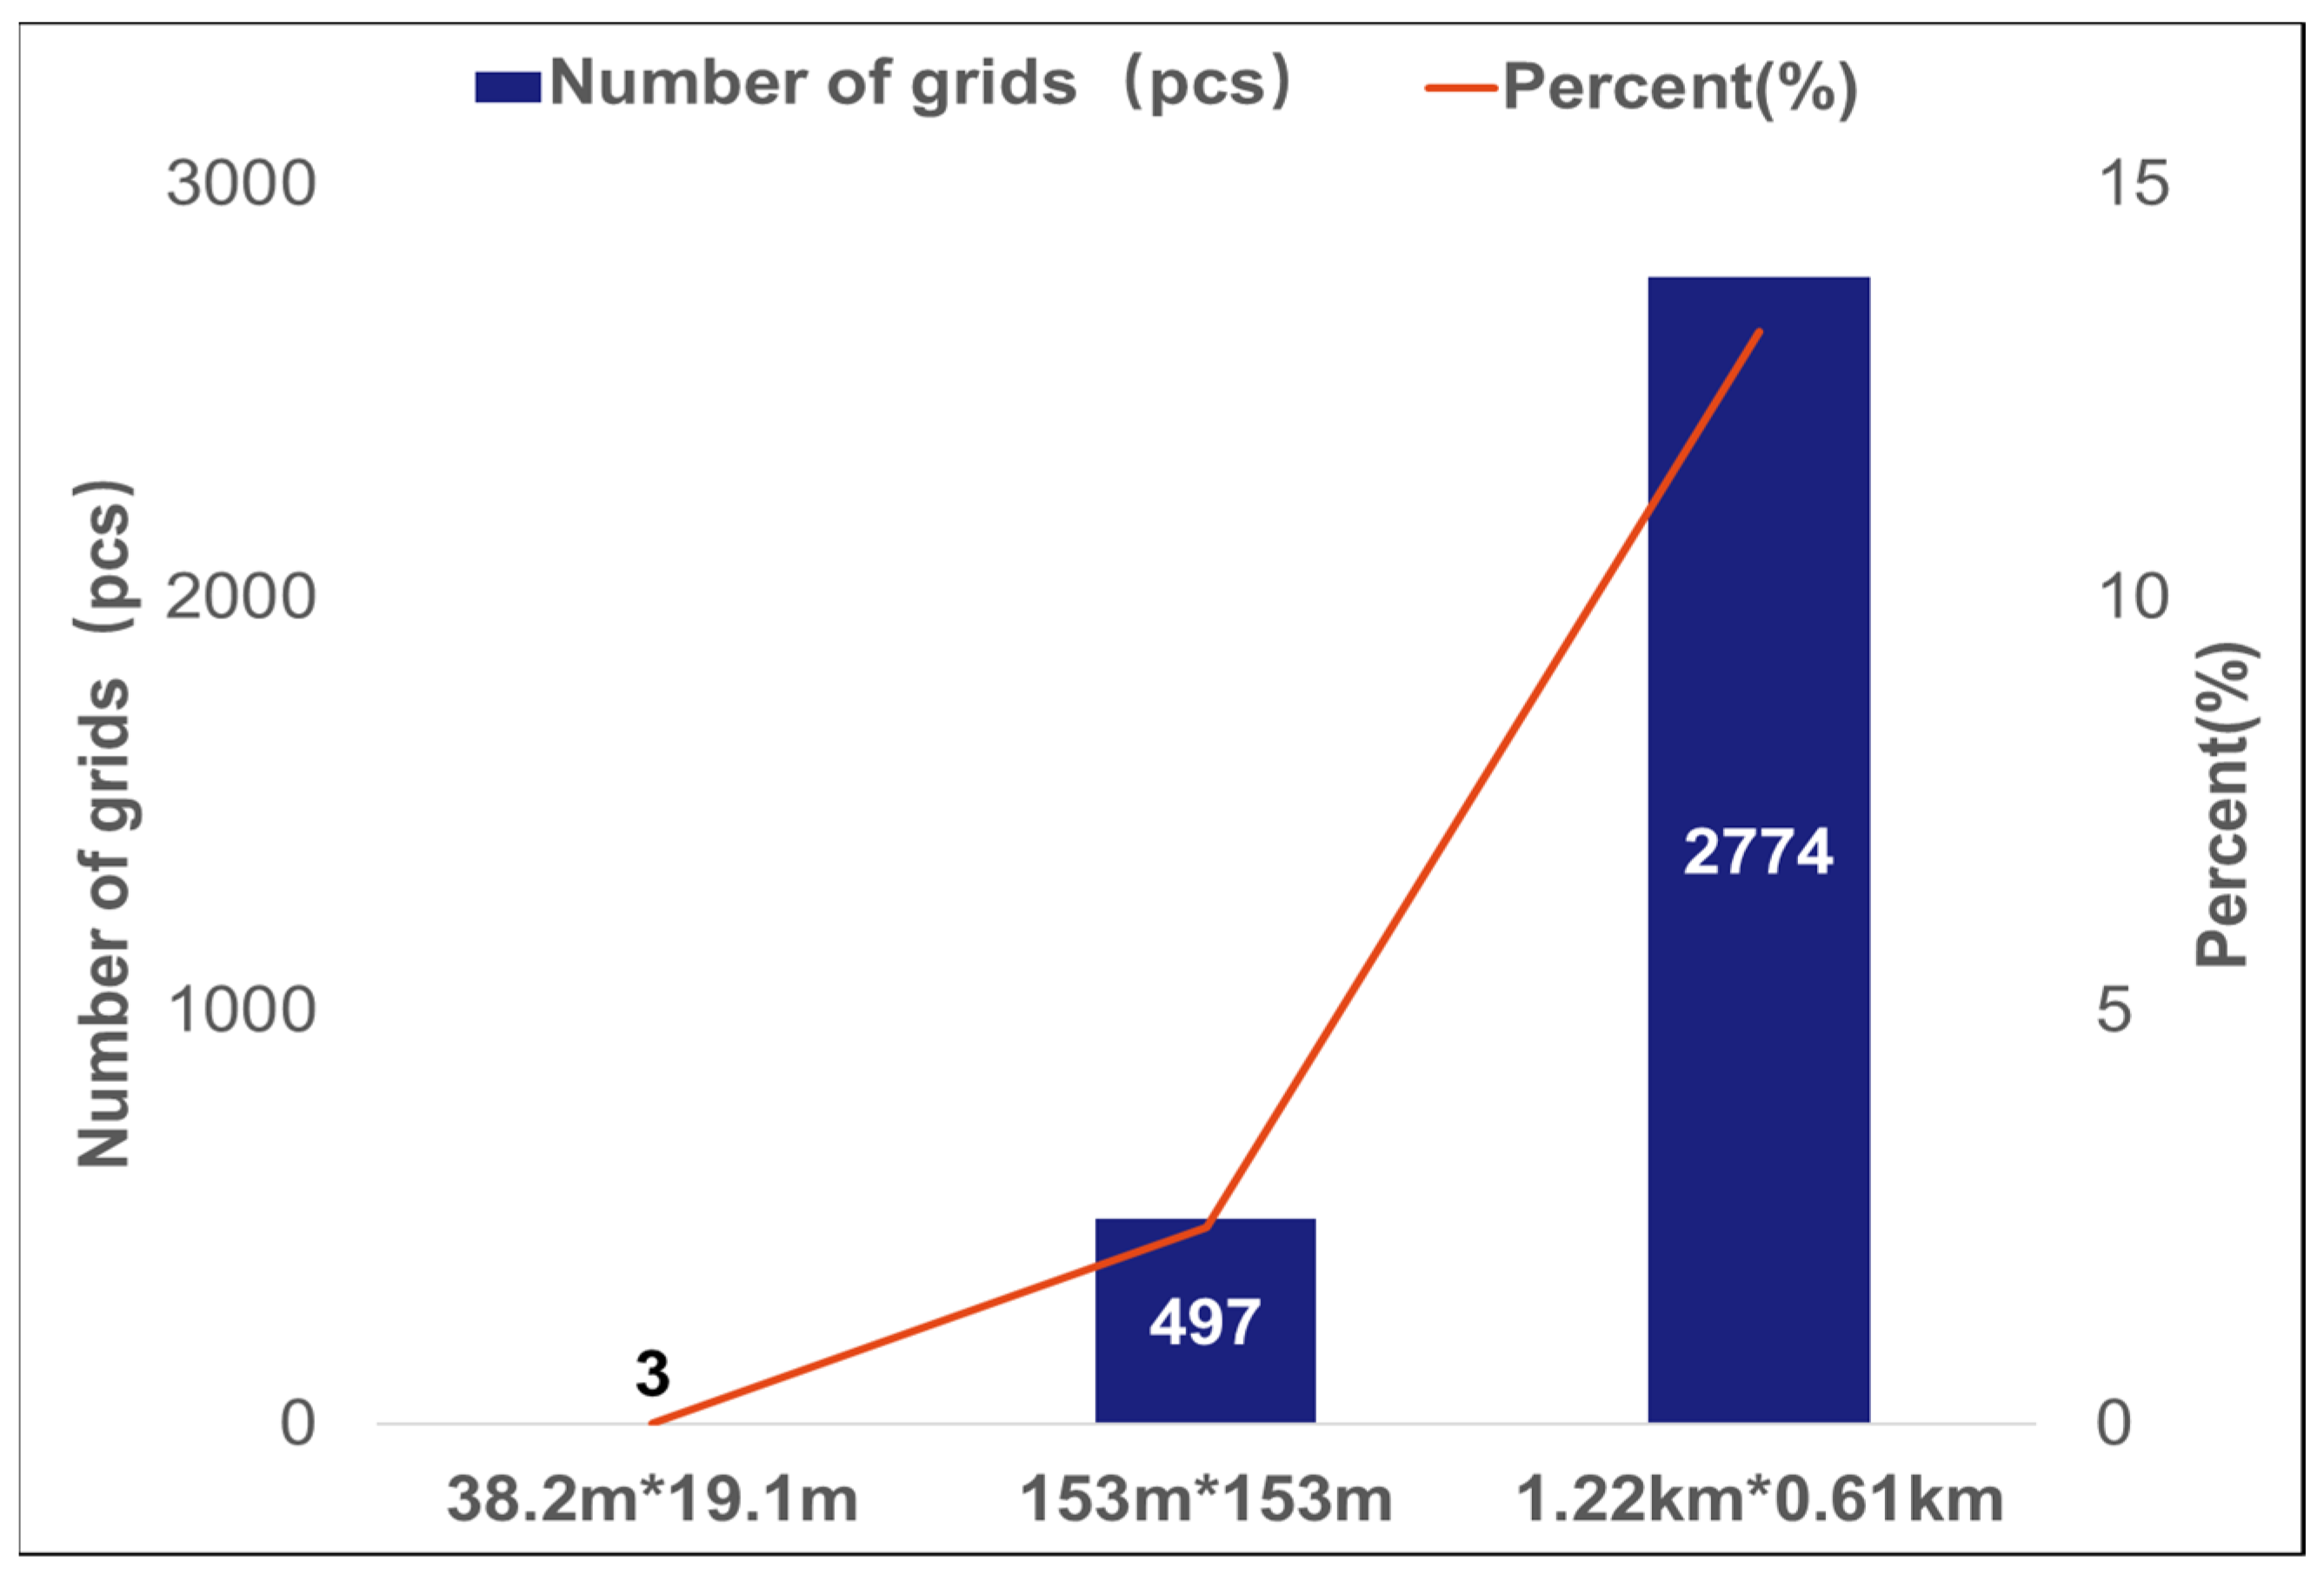
2.5.2. A Multilevel Grid Selection Method for Cropland Quality Evaluation

The grid scale is usually selected by considering the problems and objectives of the study area. Power law curves are used to characterize the distribution of data, especially in large-scale datasets, and could help to understand the distribution pattern of data [29]. In this study, a power rate curve was used to determine the grid scale, using the cropland patch areas as an indicator, fitted to a power law distribution to form a power law curve, and the scale range was determined based on the significant points of the curve.
y = a x k
where a and k are constant parameters. k is often referred to as the “power rate”.

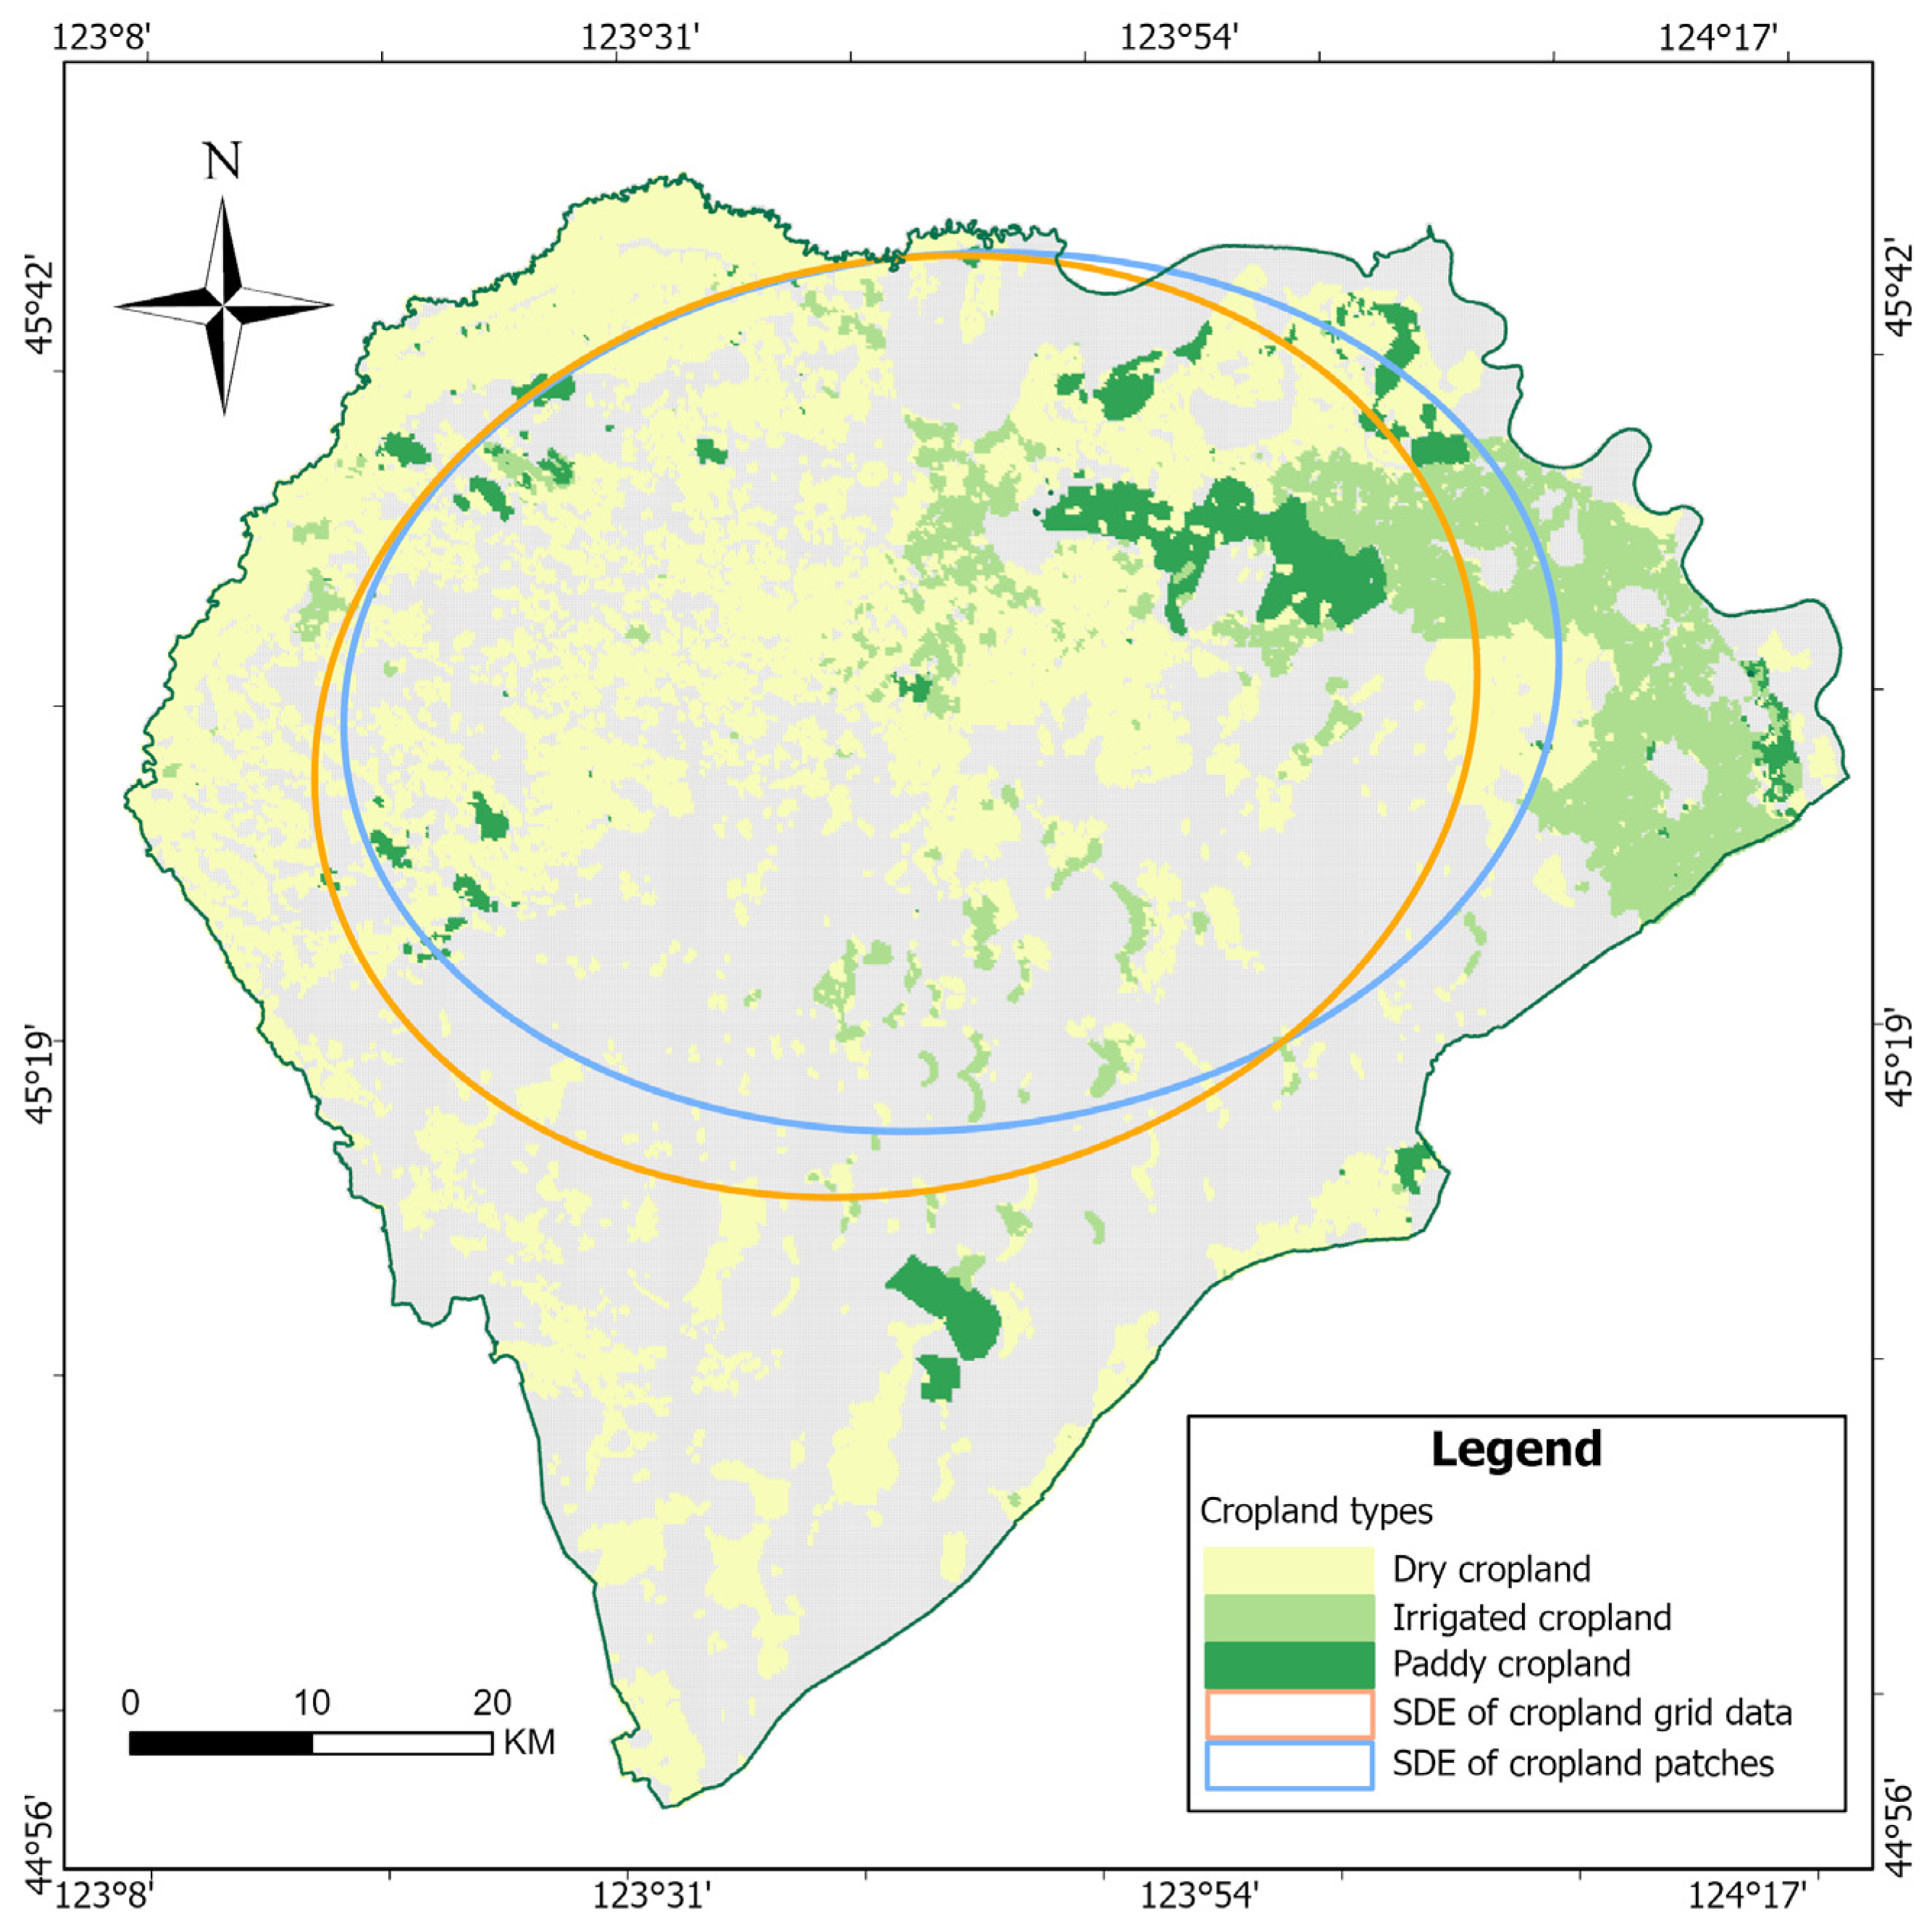
2.6. Evaluation of Grid Datasets Based on Similarity of Spatial Distribution

In Section 2.3, the suitability of the area of cropland patches with respect to the grid scale has been analyzed. Therefore, in this section, the consistency of gridded data for cropland patch data is assessed in terms of the spatial pattern of cropsland patches. Standard deviation ellipse (SDE) is one of the spatial statistical methods that could be used to accurately reveal the characteristics of the spatial distribution of various geographic elements [30,31,32]. By weighting the center and rotation angle, the degree of deviation of the center point and the rotation angle could help us to accurately assess the differences in spatial distribution. Its calculation method is as follows:
S D E x = i   x i x ¯ 2 n
S D E y = i   y i y ¯ 2 n
where S D E x is the length of the short semi-axis of the standard deviation ellipse; S D E y is the length of the long semi-axis of the standard deviation ellipse; n is the number of elements. The rotation angle θ is calculated as follows:
tan θ = A + B C
A = x ˜ 2 y ˜ 2 , B =   x ˜ 2 y ˜ 2 2 + 4   x ˜ y ˜ 2 ,   C = 2 x ˜ y ˜
where x , ˜ y   ˜   is the difference between the x , y coordinates and the mean center.
According to the above formula, the distribution direction of cropland patches and grid cropland is calculated using the perimeter of the cropland patches as weights. Specifically, the smaller the rotation angle and the closer the distance between the center points, the more similar the spatial distribution direction is.

3. Results

3.1. Results of Selecting the Level of Cropland Big Data Grid

Based on the scope of the study area, this paper constructs a multi-layer cropland big data grid system using Geohash coding, and the total number of grids in each level is studied and calculated, as shown in Table 2.
Taking into account not only the suitability of cropland patch area and grid scale but also the spatial relationship between each arable patch and the corresponding grid, we establish a basis for selecting grid cell accuracy. In our study area, there are a total of 20,983 cropland patches, with varying sizes ranging from a minimum of 1.22 × 10⁻⁴ hectares to a maximum of 812 hectares. The median patch area stands at 3.96 hectares, with an average of 6.94 hectares. In addition, the probability distribution of cropland patch areas indicates that most of them are concentrated in smaller area ranges. However, there are also some larger area values, which constitute the long-tailed part of the cropland area distribution curve shown in Figure 5.
As presented in Figure 5 and Table 2, Geohash coding accuracies ranging from 6 to 8 prove to be optimal for grid dimensions of 1.22 km × 0.61 km, 153 m × 153 m, and 38.2 m × 19.1 m, respectively. Within this range, we calculate the number of grids that entirely contain a cropland patch for each grid accuracy level. This step aids in assessing the data processing complexity associated with each precision. Figure 6 illustrates the outcomes, revealing that the highest percentage of grids fully containing a cropland patch is achieved with a Geohash precision of 6 bits. However, this coarser precision leads to larger grid ranges and reduced accuracy in cropland quality evaluation. With a precision of 7 bits, the number of grids completely containing cropland patches drops significantly. Meanwhile, at 8-bit precision, only three grids fully contain cropland patches, creating a substantial amount of data redundancy and diminishing data processing efficiency. Considering these factors comprehensively, opting for a 7-bit Geohash accuracy level (153 m × 153 m) appears to be the most reasonable choice.

3.2. Spatial Distribution Similarity Test

The degree of mean center offset and the difference in rotation angle of the standard deviation ellipse method could be used to determine the consistency of the spatial pattern between the cropland patch data and the cropland grid data. According to the grid level selection results in the previous section, the distribution patterns of the cropland patch data and the seventh-level cropland grid data are calculated separately. The results are shown in Figure 7. The average center coordinates of the distribution of cropland patch data are (557,346, 5,039,286), and the average center coordinates of the distribution of grid data are (554,280, 5,037,376). The difference between the horizontal coordinates of the two is 3066 m, the difference between the vertical coordinates is 1910 m, and the distance between the centers is about 3612 m. The difference between the horizontal and vertical coordinates of the grid data distribution is (557,346, 5,039,286). In addition, the rotation angle of the standard deviation ellipse of the cropland patch is 83.613845°, and the rotation angle of the standard deviation ellipse of the grid data is 76.281426°, with a difference of 7.33°. According to the above results, there is a deviation between the cropland patch data and the cropland grid data. This is mainly due to our method’s principle of mapping based on the predominant cropland patches within the grid, which can lead to area loss or redundancy. In general, although there are discrepancies in the assessment results, the grid data can still reflect the distribution of cropland, indicating that the cropland patch data and the grid data are consistent in terms of spatial distribution.

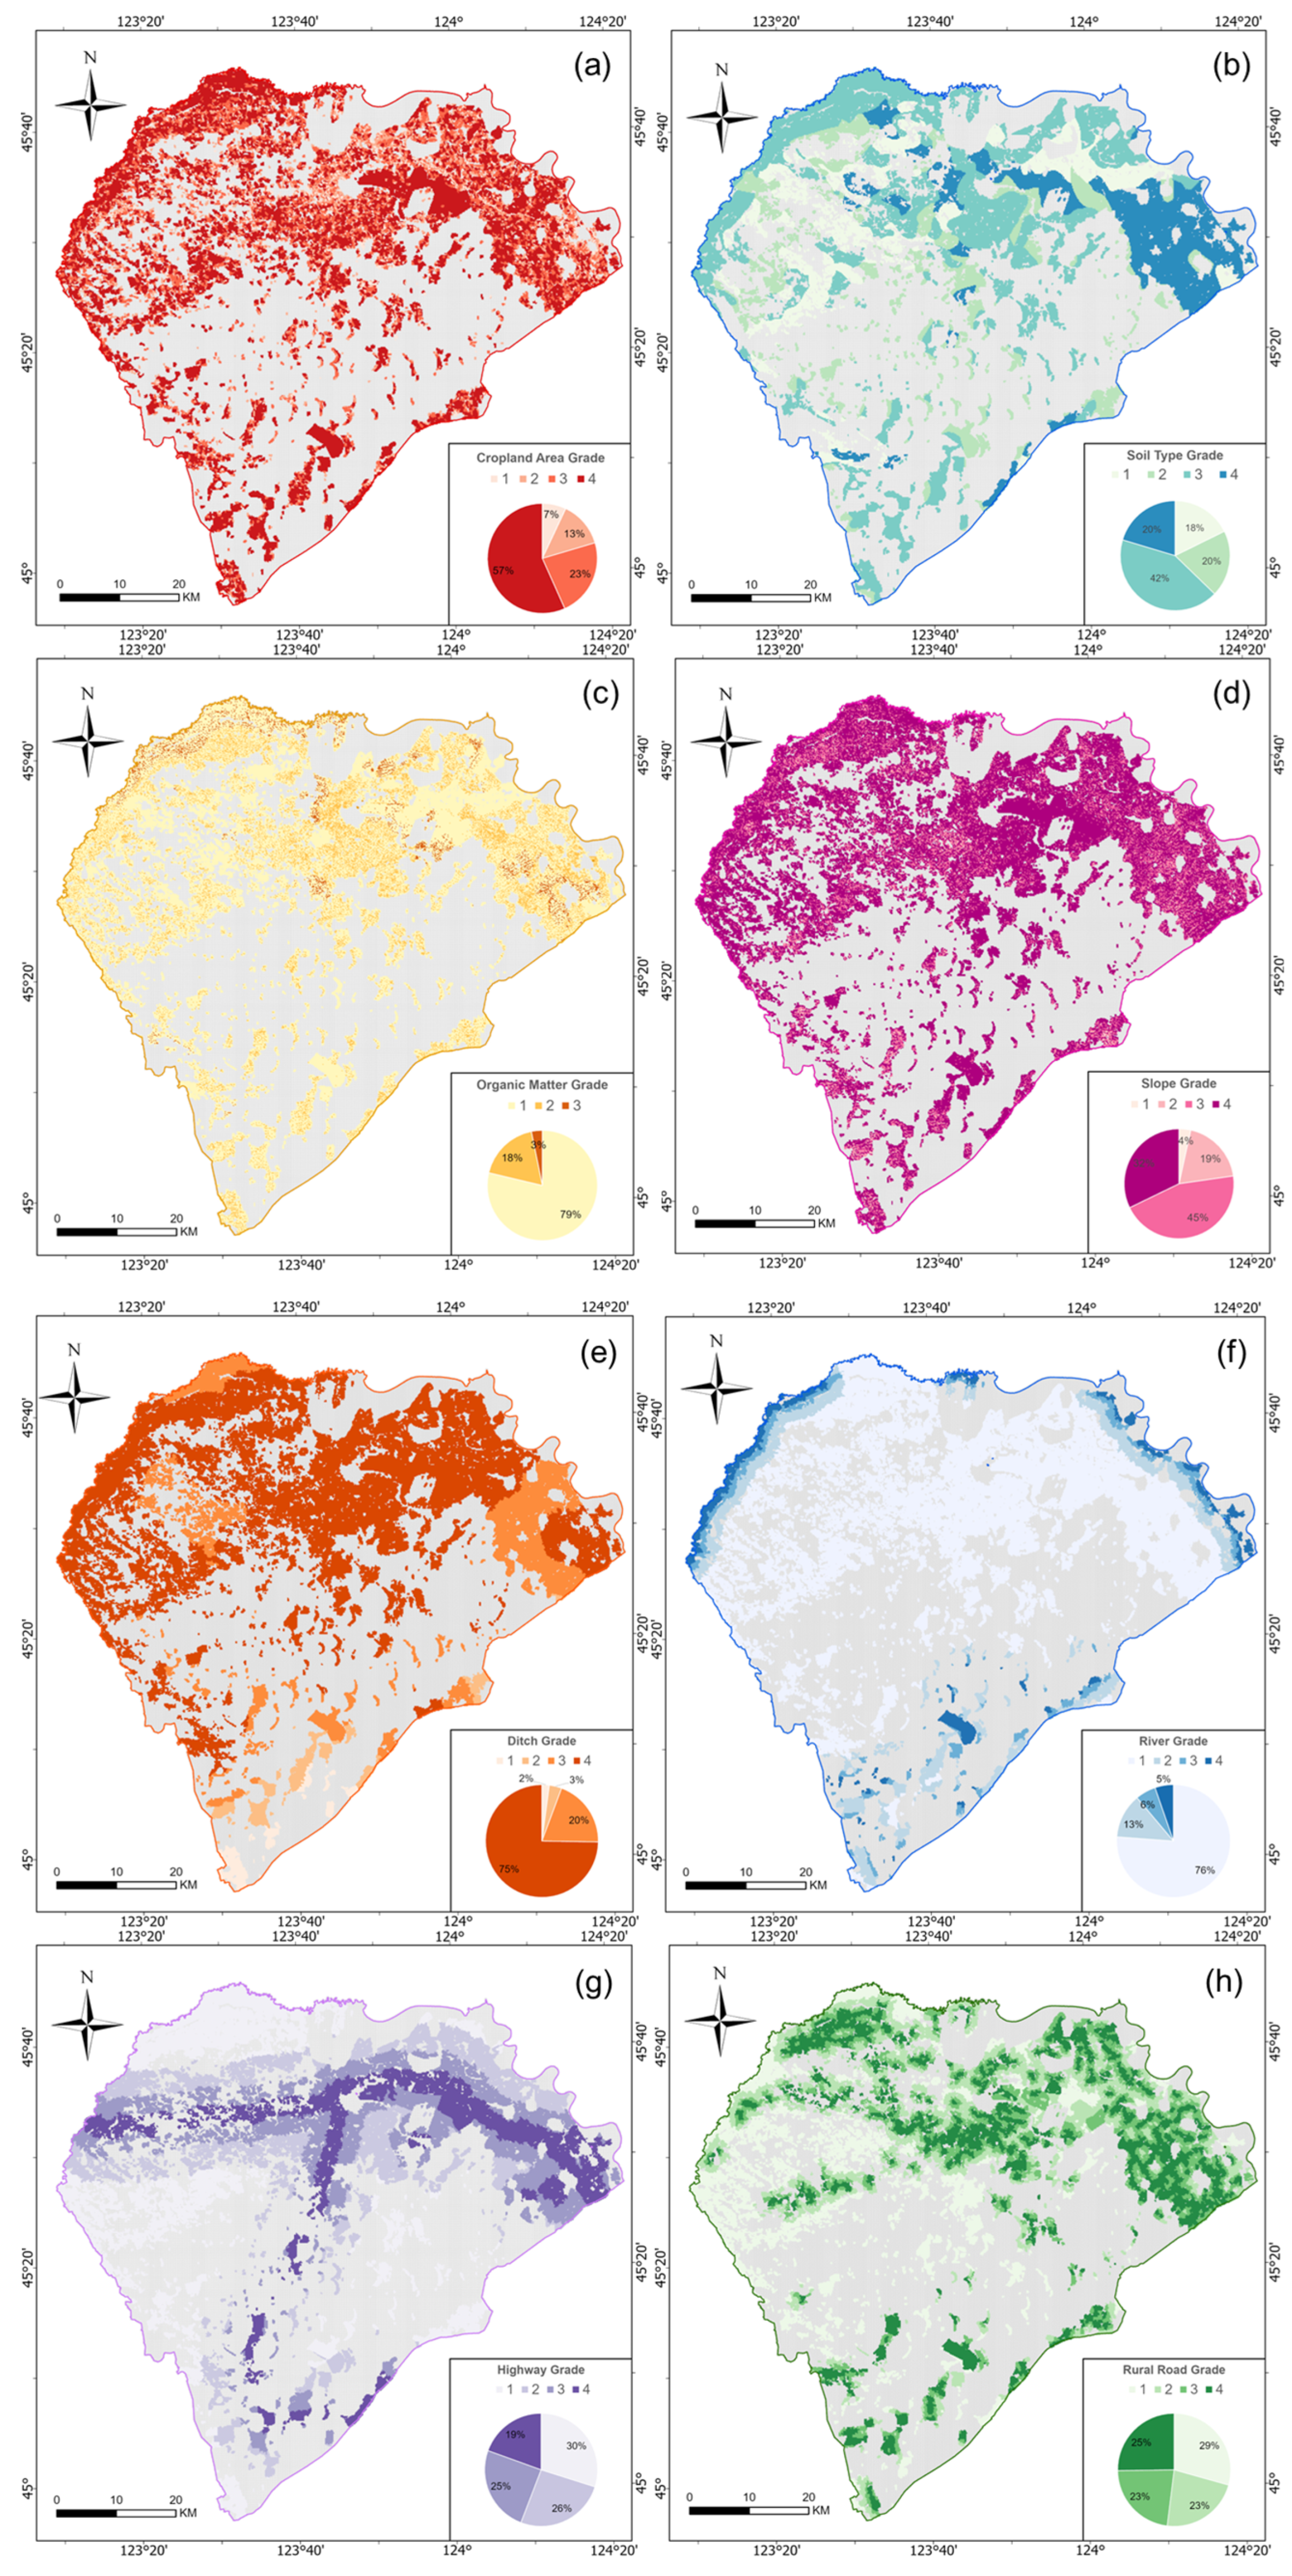
3.3. Cropland Quality Evaluation and Result Analysis

Indicators used to assess cropland quality include natural features, as well as aspects related to socio-economics, prioritized outcomes, and the farming processes used in a region. Based on the data accessibility and purpose of the study, this paper selects 11 evaluation indicators from the five indicator layers of farming conditions, farming convenience, soil fertility, cropland production capacity level and agricultural construction level. The normalization of the data of each indicator was completed separately. Then, expert scoring and hierarchical analysis [33,34] were used to calculate the weights of each indicator, and they passed the consistency test. Finally, the grading of each indicator was completed based on the knowledge constraints and the statistical characteristics of the data of each indicator (e.g., Table 3).
Wheat, maize, soybean, and rice are the predominant crops within the study area. Consequently, the dimensions of cropland quality evaluation are geared towards assessing their suitability for mechanized tillage. In terms of farming conditions, this study selected cropland patch areas and the slope of the terrain to complete the assessment. Specifically, the larger the cropland patch area and the smaller the slope, the more suitable it is for mechanized cultivation. In terms of soil fertility, soil type and organic matter content are effective assessment dimensions. This could effectively reflect soil structure and nutrient content. In terms of ease of farming convenience, it depends on the distance of the road network and water sources; the closer the distance, the higher the productivity. In terms of cropland production capacity level, the crop output value is chosen as the assessment indicator, with a higher output value indicating more productive cropland. In terms of the agricultural construction level, the level of agricultural modernization, and the level of agricultural mechanization are used as assessment indicators. Regarding relevant studies and statistical characteristics, these indicators are classified into three to four grades. Among them, a higher value of the grade represents a greater positive effect of the indicator on the quality of cropland. The system of indicators used for evaluating the quality of cropland is shown in Table 4.
Then, the scores of each indicator layer were calculated using the results of grading and the weighting of each indicator, and the quality of cropland was calculated. Using the Fisher–Jenks algorithm [35], the cropland quality score was divided into five levels to ensure that the variance between groups was maximized. The formula for calculating the quality of cropland was as follows:
C Q = i = 1 n W i × S i
where C Q is the quality of cropland, n is the number of indicator layers, W i is the weight of each indicator layer, and S i is the score of each indicator layer.
In terms of the spatial distribution pattern of cropland, cropland is more concentrated in the northwestern, central and eastern parts of the area, and more dispersed in the southern part. The evaluation results of the indicators are shown in Figure 8, with a high proportion of Grade 3 and 4 in the area of cropland, soil type, slope and ditch; the grades of highways and rural roads are evenly distributed in each layer; the data on organic matter and rivers are mainly of Grade 1 and 2, and show lower grades.
The quantitative characteristics of the quality of cropland in the study area are shown in Table 5. In general, the quantity of each type of cropland in the study area varies considerably. Dry cropland, paddy cropland and irrigated cropland accounted for 75 percent, 18 percent and 7 percent, respectively. Among them, dry cropland is the most abundant and paddy cropland is the least. In terms of quality grades, dry cropland is dominated by “medium” and “lower” grades, paddy cropland is concentrated in “medium” grades, while irrigated cropland is biased towards “medium” and “lower” grades. It is worth mentioning that the number of grids with “higher” grades in dry cropland is as high as 6700, indicating superior soil conditions. Dry and irrigated cropland is dominated by “lower” and “lowest” grades, indicating poor soil quality and the need for land management authorities to improve soil quality by adopting land improvement and management measures tailored to local conditions. The spatial distribution patterns of cropland quality evaluation shown in Figure 9, high-quality cropland was mainly distributed in the eastern, central and northwestern parts of the study area, while the southern part of the study area was dominated by “medium” quality. Low-quality cropland is mainly concentrated in the western part of the area, and this distribution pattern is to some extent influenced by topographic factors.

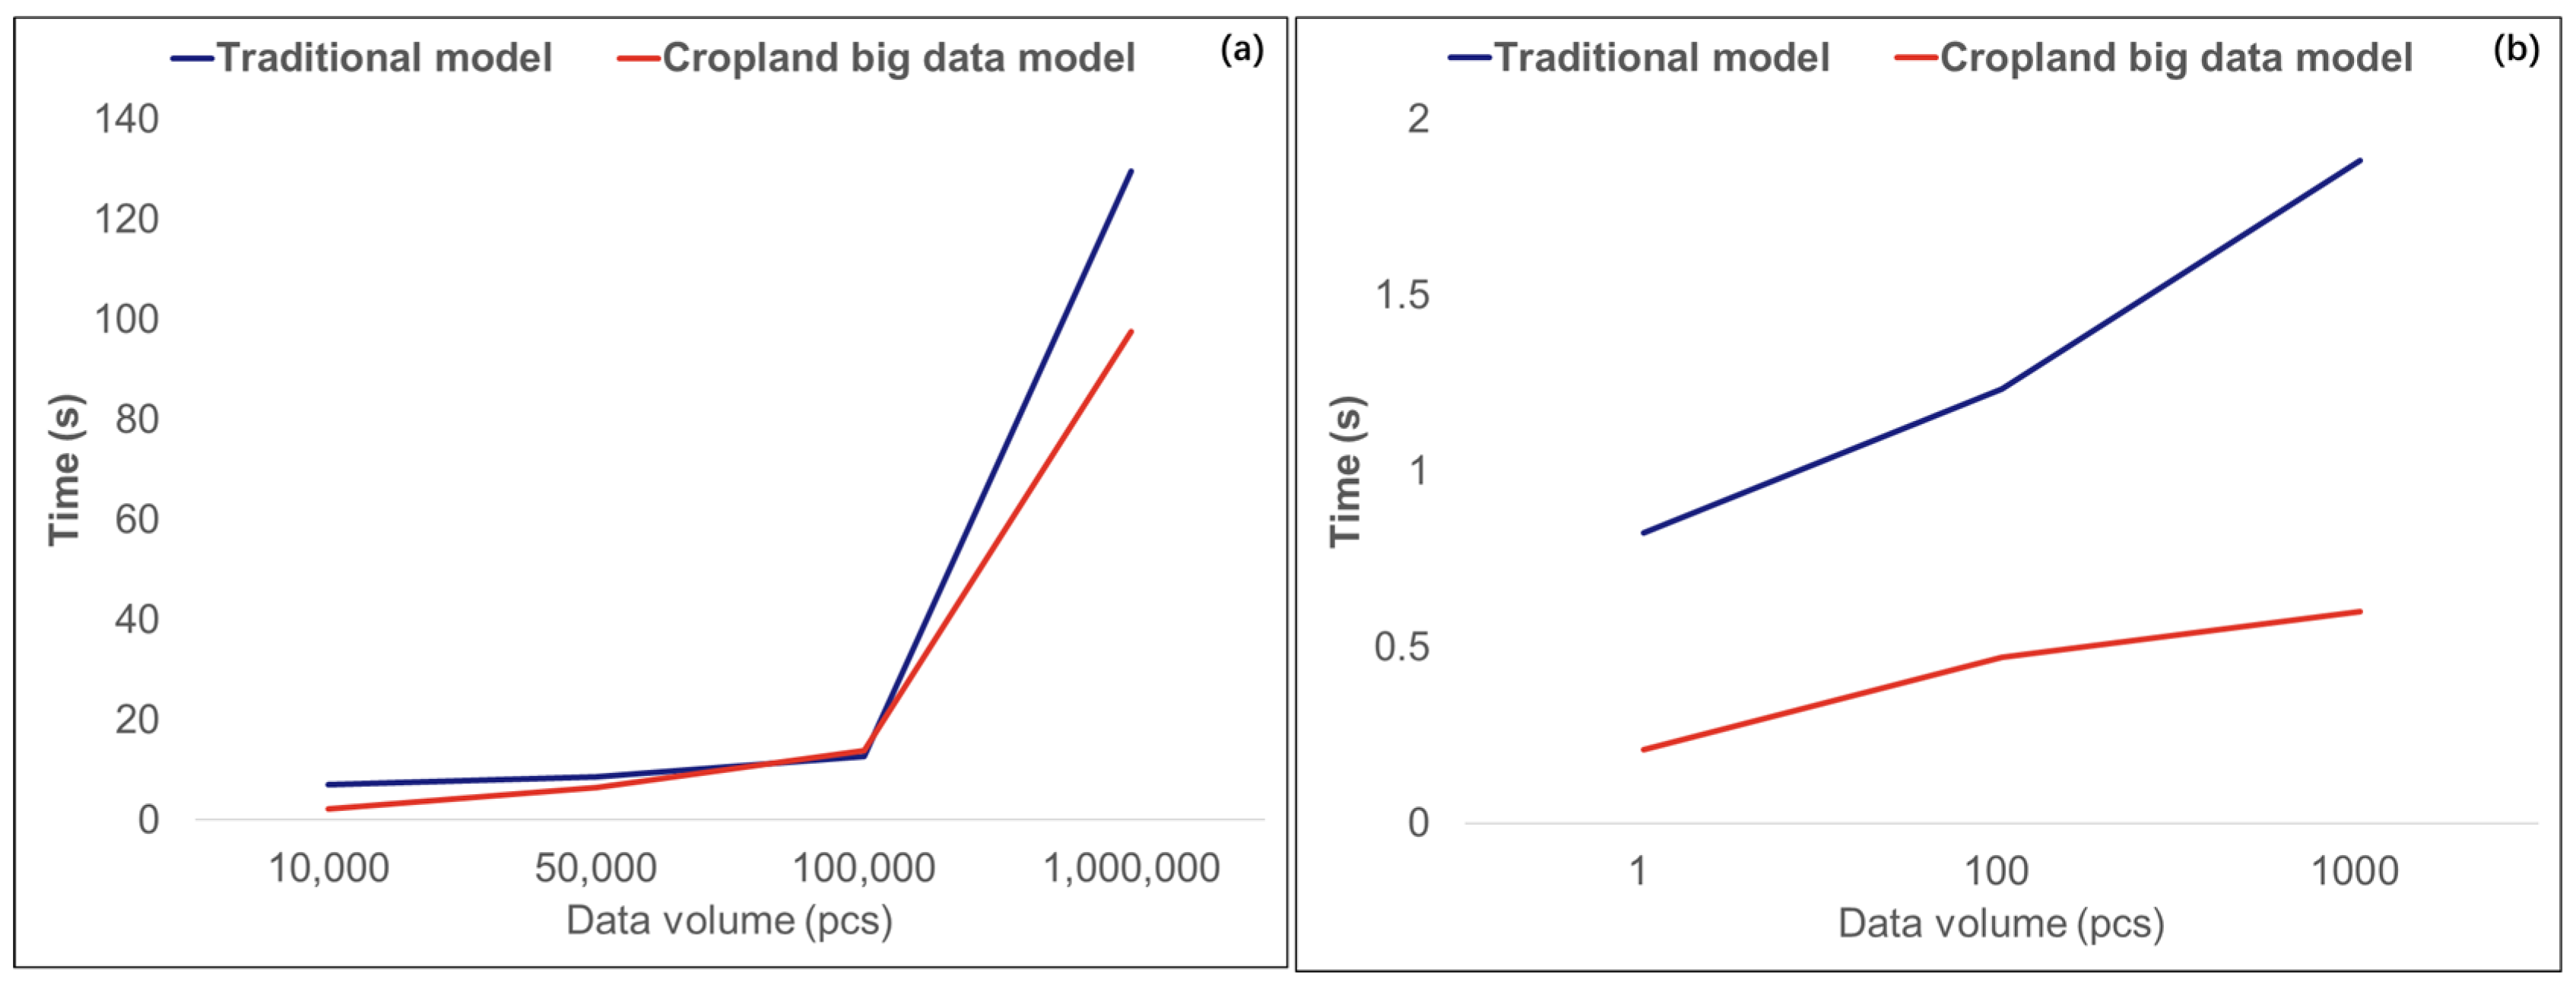
3.4. Effectiveness Analysis of Cropland Big Data Fusion Model

A total of about 200,000 datasets were analyzed in this study, and the grid data import efficiency was tested according to the data volume of 50,000, 100,000, 150,000 and 200,000, respectively. As could be seen from Figure 10, the time to import data increases by about one second for every 10,000 increases in data volume, which means that data volume and time consumption have a strong linear correlation. Based on this, time predictions could be made based on the amount of data to be imported. However, the efficiency of data import could also be affected by factors such as hardware configuration, the primary key design of storage tables, the frequency of data updates [36], etc. This result is for reference only.
The total number of grids in the study area is 209,805. Among them, there are 91,312 grids containing cropland, accounting for 43.5% of the whole. In order to verify the management efficiency of the cropland big database, cropland quality grade and land type were used as data filtering conditions for 20 random searching trials, respectively.
In terms of cropland quality grade inquiries, there is significant variation in the distribution of grid numbers across each grade. Specifically, the distribution is as follows: 20% fall into the “Lowest” grade, 37% in the “Lower” grade, 30% in the “Medium” grade, 11% in the “Higher” grade, and 2% in the “Highest” grade. “Low” and “Lower” account for a high proportion of the overall data, over 50%. “Medium”, “Higher”, and “Highest” are about 43%. The efficiency of data retrieval is shown in Figure 11. It is found that there is a significant positive correlation between the query time and the number of grids. Meanwhile, the average response time for each grade was within 3 s. Cropland in the study area contains dry cropland, paddy cropland and irrigated cropland. The percentage of dry cropland is 75%, that of irrigated cropland is 18%, and paddy cropland is only 7%. Further, the cropland class is used as a filter condition for data query, and it takes about 3.5 s on average to query the information of each class. Dry cropland has the longest average retrieval time due to its dominant number of grids. However, the number of grids in dry cropland is 10 times that of paddy cropland and 4 times that of irrigated cropland, but the retrieval time is 2.19 times and 1.66 times that of dry cropland, respectively. This indicates that there is no significant linear relationship between data volume and retrieval time without considering other factors. In addition, there are fluctuations in the results of data retrieval time, and the query time shows some randomness, which may be related to database performance and hardware configuration. After verification, the query efficiency of this method meets the needs of the basic query of cropland quality.
Furthermore, a comparative study was conducted between a traditional data model and the cropland big data model (as shown in Figure 12). Ten separate experiments were executed for data import and data query tasks, and the average processing time was calculated. The results demonstrate the superior data organization and management performance of the cropland big data model.

4. Discussion

4.1. Effectiveness of Cropland Big Data Fusion Model

Diverging from conventional data models, the cropland big data fusion model introduces a fresh concept for organizing and managing heterogeneous data from various sources. It also offers a novel approach to evaluating cropland quality. Based on the results of grid mapping multi-source cropland data, it is evident that in the tested scenario, the cropland grid data and cropland patch data exhibit substantial similarities, demonstrating their suitability for the intended application. These findings confirm the effectiveness of our grid mapping approach and suggest its adequacy for similar applications in contexts that closely resemble our test case. Multi-source heterogeneous cropland quality evaluation data include soil sample data, soil testing data, topographic data, agricultural management data [37,38], etc. In this paper, land use data, topographic slope data, soil organic matter value data and agricultural statistics data are combined in the model test to construct a multi-dimensional cropland quality evaluation system, which is conducive to the integration of multi-source heterogeneous data and obtains the comprehensive evaluation results of cropland quality. Furthermore, we compared our results with those of other scholars who used big data processing techniques for data management [39,40]. The differences between our method and those of other scholars are minimal. Despite various factors affecting data organization and management efficiency, this further demonstrates that our method meets fundamental application requirements, benefiting the organization and management of cropland big data. Also, the land management department is able to estimate the processing time and retrieval efficiency of the cropland quality big data based on the area of the test area, the type of cropland big data and the amount of data, and the results could provide a certain reference for the construction of land management information.

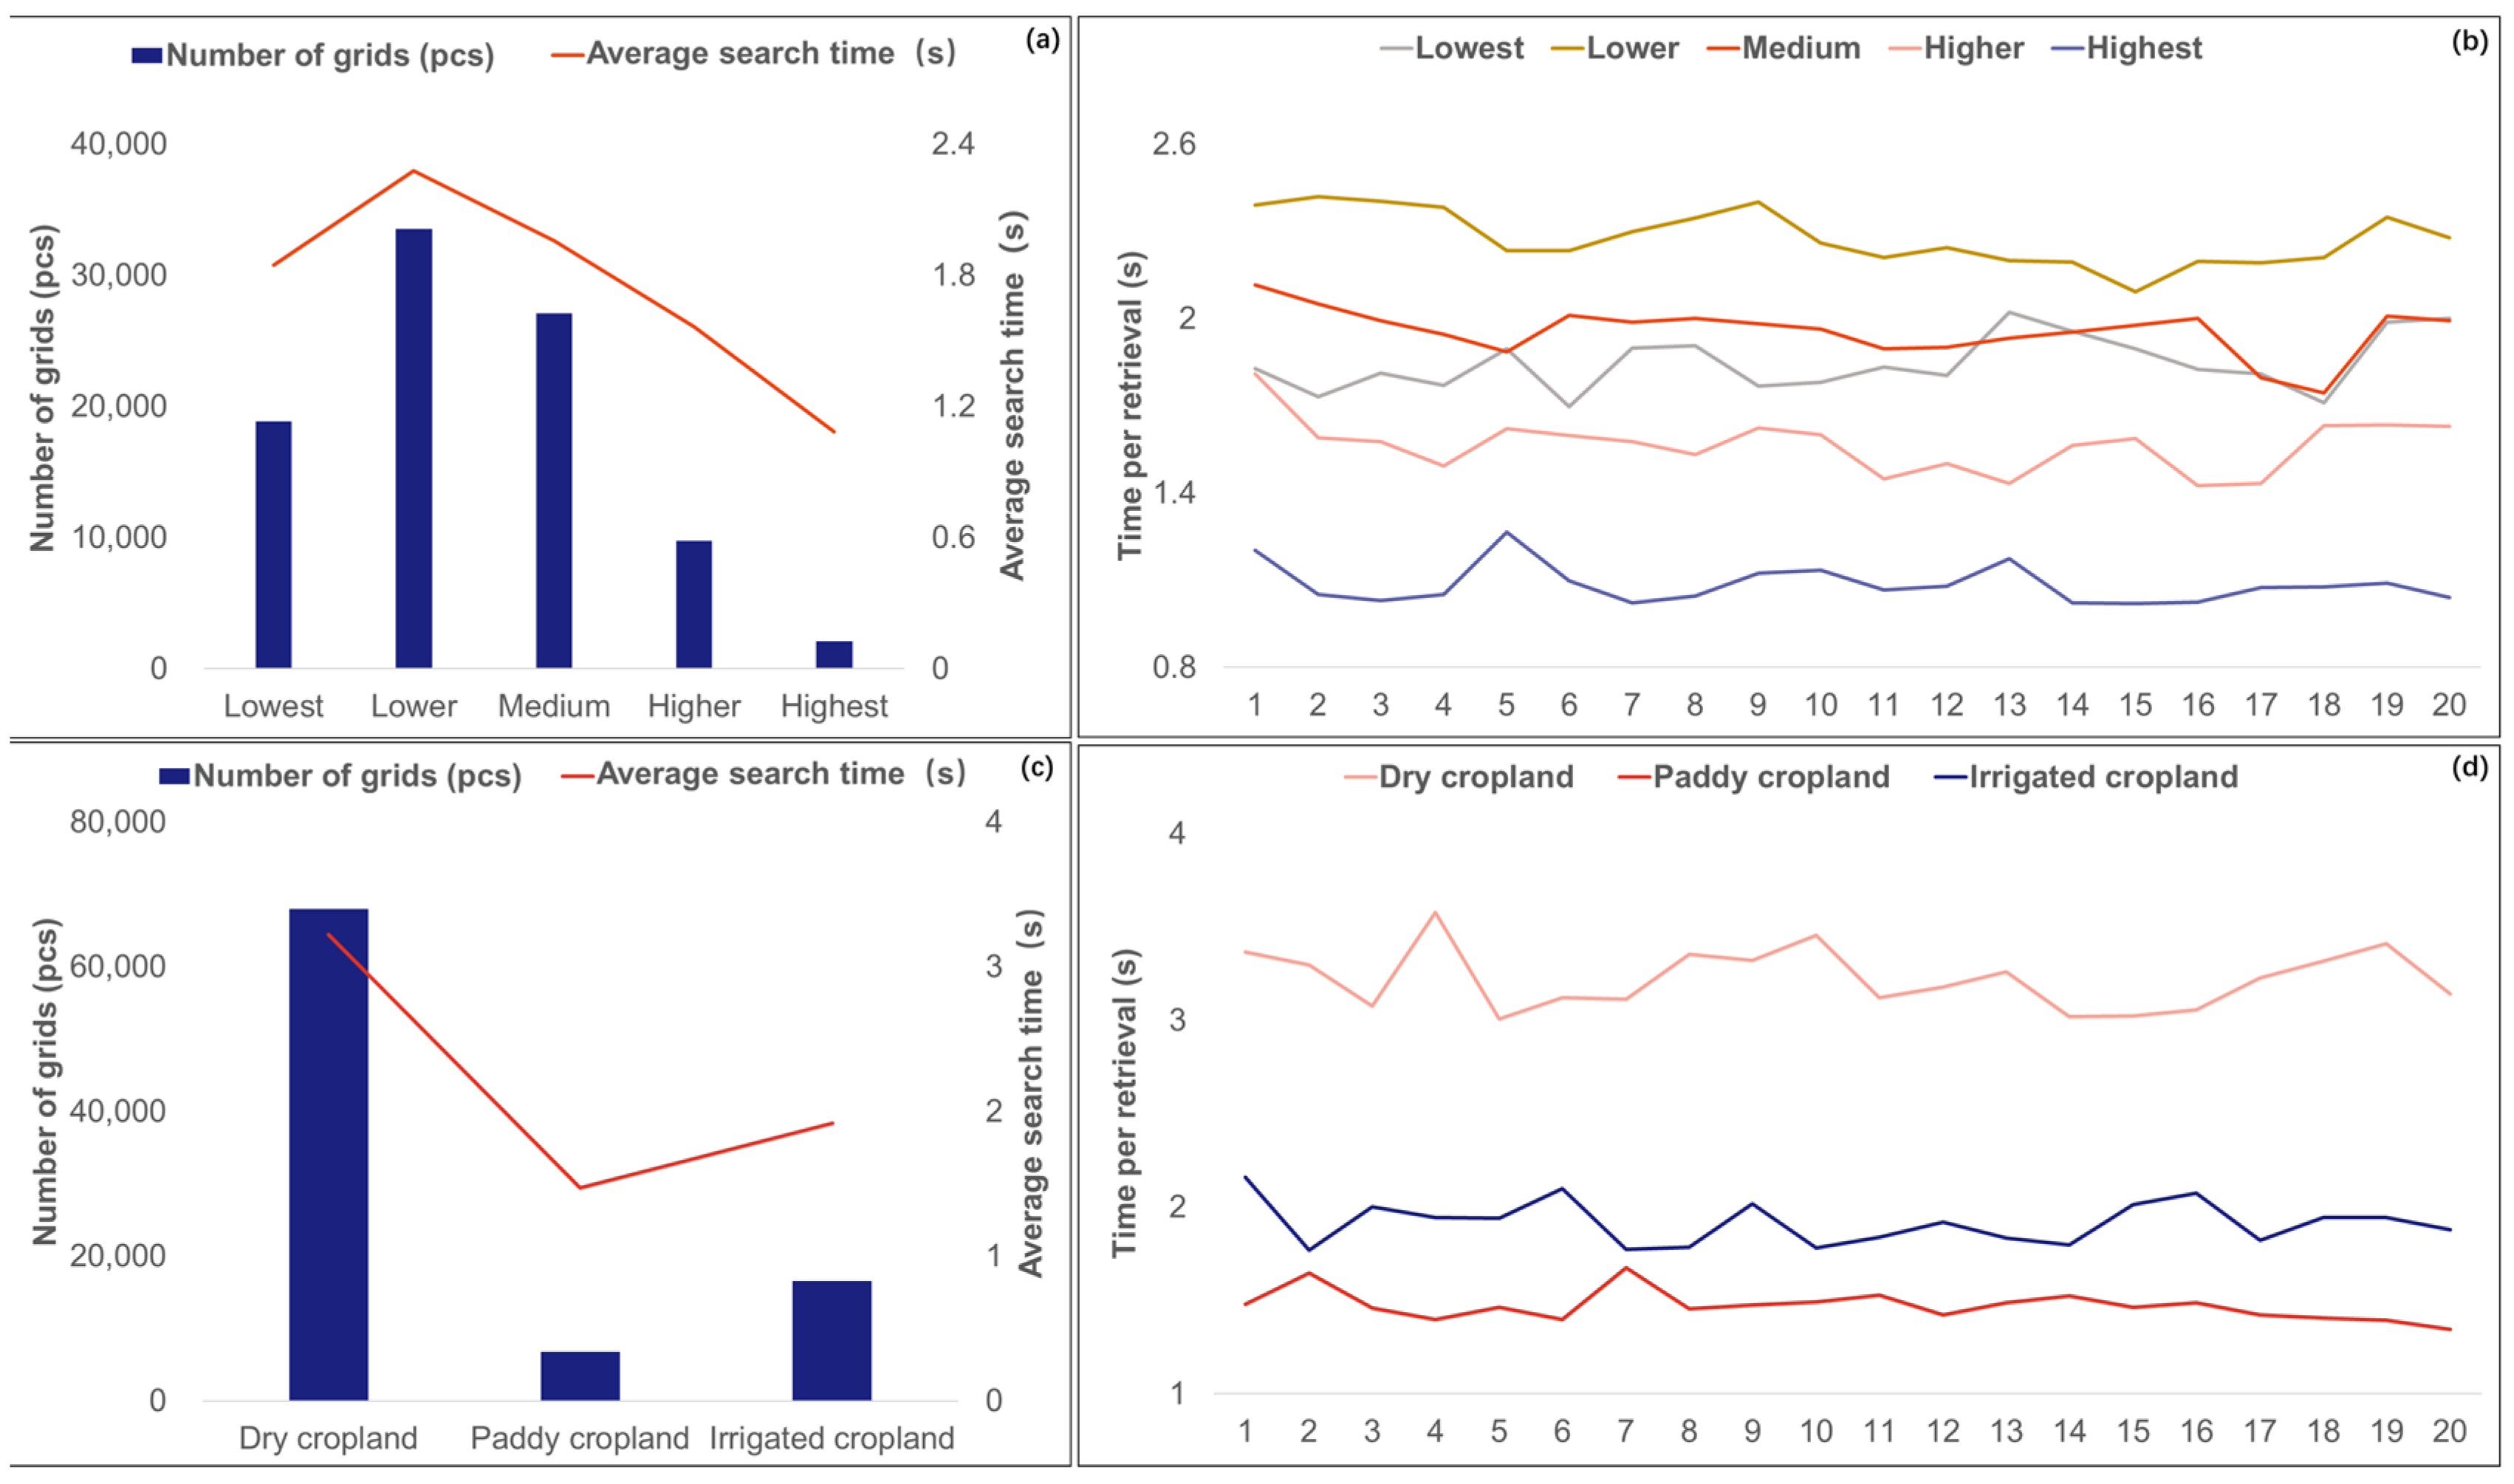
4.2. Factors Affecting the Efficiency of Cropland Big Data Fusion Model

The pre-processing of cropland big data could reduce the differences in the grid mapping of each type of data, so that vector data, raster data and text data are accurately mapped into the same grid cell. This will create a standardised environment for the retrieval of cropland quality information and data mining. In addition, the grid formulation rules will affect model performance. In a related study, the researcher formulated the principle of maximum area and the principle of land priority degree [41,42], which could be used to reasonably allocate land for the grid within the study area. The mapping accuracy may vary depending on the principles of cropland allocation [43,44]. In terms of data management, the application efficiency of the cropland quality database is affected by hardware configuration, data storage structure and other aspects [45]. Therefore, reasonable trade-offs and optimizations are needed in the model design and application process, which could improve the efficiency of the cropland big data fusion model and help to maintain the efficiency of the model in different application scenarios.

4.3. Limitations and Future Work

There are some limitations and challenges in this study that need to be further explored in future work. Firstly, in terms of the object of data fusion management, this paper used vector data, raster data and text data to complete the validation of the model. Remote sensing data could provide key information such as surface cover, vegetation index, and land use in the work of cropland quality evaluation [46]; Therefore, they could be used as research data to further improve the generality of the model in the future. Secondly, in terms of the results of the spatial consistency test, the cropland patch data and the cropland grid data have some discrepancies. In the future, under the premise of ensuring the efficiency of data organization and management, grid mapping could be further explored in machine learning, deep learning and other methods to provide more accurate data organization methods and results of cropland quality evaluations for land management departments [47,48]. Finally, Geohash is a space-filling curve encoded as a grid with Z-order curves [49], which is able to downscale multi-dimensional data to low-dimensional data in order to reduce the complexity of the data [50]. However, the method has the characteristics of storing proximity and not reflecting the actual distance mutation. In the future, in addition to the space-filling curve, grid encoding could use the index structure of quadtree [51] or R-tree [52], which could improve the query efficiency of data and support the efficient organization and management of cropland big data.

5. Conclusions

This paper is centered on the integrated organization and management of cropland big data and introduces an innovative grid-based cropland big data fusion model. The model is founded upon the global subdivision grid data model. Using Da’an County, a representative area characterized by black soil, as a case study, a multilevel grid system for cropland big data is established. Grid mapping is executed by selecting grid levels based on the spatial and quantitative characteristics of cropland patches. Additionally, organizational management efficiency of cropland big data is assessed with the grid as the fundamental unit. Ultimately, the method’s efficiency in evaluating cropland quality is substantiated. The results are as follows: (1) By evaluating the spatial distribution similarity between the cropland grid data and the cropland patch data, the rotation angles of the mean center coordinates and standard deviation ellipses of the two are close to each other. This result proves that the cropland grid data based on the method of this paper are highly accurate and could meet the needs of cropland quality evaluation. (2) The data management efficiency of the cropland big database system is relatively high. When importing a large amount of data, the time it spends increases by about 1 s for every 10,000 data volumes. In addition, taking attribute query as an example, the response time for querying cropland information in 200,000 pieces of data is about 3 s. Therefore, the cropland big database system could meet the needs of basic queries. (3) By testing the method in a case of cropland quality evaluation in Da’an, the method presented in this paper was shown to be conducive to cropland quality evaluation. For the tested case, using the method enhanced the comprehensiveness of the evaluation results, and thereby extended the potential uses of data available for the region.
Overall, this study has developed a new data model for managing multi-source heterogeneous cropland big data. It offers a highly operational reference method for cropland quality evaluation across various spatial scales.

Author Contributions

Conceptualization, S.M. and S.W.; methodology, S.M., S.W. and C.H.; validation, C.H. and X.X.; writing–original draft preparation, S.M., S.W., C.H. and X.X.; writing—review and editing, L.S., H.L., Z.Z., J.Z., J.H., X.H. and F.G. All authors have read and agreed to the published version of the manuscript.

Funding

This research was funded by the National Key Research and Development Program of China (2021YFD1500204) and National Natural Science Foundation of China (No. 42371363, 42001336).

Data Availability Statement

Not applicable.

Conflicts of Interest

The authors declare no conflict of interest.

References

  1. Shi, W.; Tao, F.; Liu, J. Changes in quantity and quality of cropland and the implications for grain production in the Huang-Huai-Hai Plain of China. Food Secur. 2013, 5, 69–82. [Google Scholar] [CrossRef]
  2. Löw, F.; Biradar, C.; Dubovyk, O.; Fliemann, E.; Akramkhanov, A.; Narvaez Vallejo, A.; Waldner, F. Regional-scale monitoring of cropland intensity and productivity with multi-source satellite image time series. GISci. Remote Sens. 2018, 55, 539–567. [Google Scholar] [CrossRef]
  3. Breunig, M.; Bradley, P.E.; Jahn, M.; Kuper, P.; Mazroob, N.; Rösch, N.; Al-Doori, M.; Stefanakis, E.; Jadidi, M. Geospatial data management research: Progress and future directions. ISPRS Int. J. Geo-Inf. 2020, 9, 95. [Google Scholar] [CrossRef]
  4. Robertson, C.; Chaudhuri, C.; Hojati, M.; Roberts, S.A. An integrated environmental analytics system (IDEAS) based on a DGGS. ISPRS J. Photogramm. Remote Sens. 2020, 162, 214–228. [Google Scholar] [CrossRef]
  5. Su, Y.; Zhong, Y.; Zhu, Q.; Zhao, J. Urban scene understanding based on semantic and socioeconomic features: From high-resolution remote sensing imagery to multi-source geographic datasets. ISPRS J. Photogramm. Remote Sens. 2021, 179, 50–65. [Google Scholar] [CrossRef]
  6. Gao, F.; Yue, P.; Cao, Z.; Zhao, S.; Shangguan, B.; Jiang, L.; Hu, L.; Fang, Z.; Liang, Z. A multi-source spatio-temporal data cube for large-scale geospatial analysis. Int. J. Geogr. Inf. Sci. 2022, 36, 1853–1884. [Google Scholar] [CrossRef]
  7. Zhang, H.; Cheng, C.; Miao, S. A Precise Urban Component Management Method Based on the GeoSOT Grid Code and BIM. ISPRS Int. J. Geo-Inf. 2019, 8, 159. [Google Scholar] [CrossRef]
  8. Zhu, J.; Liu, Z.; Qiao, D. Construction and Optimization of Spatial Indexing Model for Massive Geospatial Data Based on HBase. Geosci. Technol. Bull. 2019, 38, 253–260. [Google Scholar]
  9. Franch-Pardo, I.; Napoletano, B.M.; Rosete-Verges, F.; Billa, L. Spatial analysis and GIS in the study of COVID-19. A review. Sci. Total Environ. 2020, 739, 140033. [Google Scholar] [CrossRef]
  10. Chen, Y. Research on Cultivated Land Quality Evaluation Method Based on Multi-Scale Indicator System in Grid Environment; China Agricultural University: Beijing, China, 2015. [Google Scholar]
  11. Shen, L.; Zhang, C.; Sang, L.; Chen, Y.; Zhang, X.; Yang, J.; Zhu, D.; Yun, W. Prioritizing County Farmland Improvement Using a Grid Approach. J. Agric. Eng. 2012, 28, 241–247+296. [Google Scholar]
  12. Chen, Y.; Yang, J.; Xun, W.; Zhang, C.; Zhu, D.; Xiang, Q. A grid-based method for provincial aggregation of cropland quality grading results. J. Agric. Eng. 2014, 30, 280–287. [Google Scholar]
  13. Li, S.; He, F.; Zhang, X. A spatially explicit reconstruction of cropland cover in China from 1661 to 1996. Reg. Environ. Change 2016, 16, 417–428. [Google Scholar] [CrossRef]
  14. He, F.; Yang, F.; Zhao, C.; Li, S.; Li, M. Spatially explicit reconstruction of cropland cover for China over the past millennium. Sci. China Earth Sci. 2023, 66, 111–128. [Google Scholar] [CrossRef]
  15. Yang, T.; Siddique, K.H.; Liu, K. Cropping systems in agriculture and their impact on soil health-A review. Glob. Ecol. Conserv. 2020, 23, e01118. [Google Scholar] [CrossRef]
  16. Liu, C.; Song, C.; Ye, S.; Cheng, F.; Zhang, L.; Li, C. Estimate provincial-level effectiveness of the arable land requisition-compensation balance policy in mainland China in the last 20 years. Land Use Policy 2023, 131, 106733. [Google Scholar] [CrossRef]
  17. Li, X.; Li, H.; Yang, L.; Ren, Y. Assessment of soil quality of croplands in the Corn Belt of Northeast China. Sustainability 2018, 10, 248. [Google Scholar] [CrossRef]
  18. Kazemi, H.; Akinci, H. A land use suitability model for rainfed farming by Multi-criteria Decision-making Analysis (MCDA) and Geographic Information System (GIS). Ecol. Eng. 2018, 116, 1–6. [Google Scholar] [CrossRef]
  19. Kakkar, D.; Lewis, B.; Guan, W. Interactive analysis of big geospatial data with high-performance computing: A case study of partisan segregation in the United States. Trans. GIS 2022, 26, 1633–1641. [Google Scholar] [CrossRef]
  20. Mete, M.O.; Yomralioglu, T. Implementation of serverless cloud GIS platform for land valuation. Int. J. Digit. Earth 2021, 14, 836–850. [Google Scholar] [CrossRef]
  21. Cravero, A.; Pardo, S.; Galeas, P.; López Fenner, J.; Caniupán, M. Data Type and Data Sources for Agricultural Big Data and Machine Learning. Sustainability 2022, 14, 16131. [Google Scholar] [CrossRef]
  22. Yao, X.; Mokbel, M.F.; Ye, S.; Li, G.; Alarabi, L.; Eldawy, A.; Zhao, Z.; Zhao, L.; Zhu, D. LandQv2: A MapReduce-Based System for Processing Cropland Quality Big Data. ISPRS Int. J. Geo Inf. 2018, 7, 271. [Google Scholar] [CrossRef]
  23. Chen, Z.; Huang, W.; Ma, L.; Xu, H.; Chen, Y. Application and Development of Big Data in Sustainable Utilization of Soil and Land Resources. IEEE Access 2020, 8, 152751–152759. [Google Scholar] [CrossRef]
  24. Miao, S.; Cheng, C.; Ren, F.; Chen, B.; Tong, X.; Pu, G. A GIS Data Model Based on Global Subdivision Grid. Journal of Spatio-temporal Information 2020, 27, 22–29. [Google Scholar]
  25. Zhou, C.; Lu, H.; Xiang, Y.; Wu, J.; Wang, F. GeohashTile: Vector geographic data display method based on geohash. ISPRS Int. J. Geo Inf. 2020, 9, 418. [Google Scholar] [CrossRef]
  26. Li, L.; Hu, W.; Zhu, H.; Li, Y.; Zhang, H. Tiled vector data model for the geographical features of symbolized maps. PLoS ONE 2017, 12, e0176387. [Google Scholar] [CrossRef]
  27. Ritter, N.; Ruth, M. The GeoTiff data interchange standard for raster geographic images. Int. J. Remote Sens. 1997, 18, 1637–1647. [Google Scholar] [CrossRef]
  28. Ming, W.; Luo, X.; Luo, X.; Long, Y.; Xiao, X.; Ji, X.; Li, Y. Quantitative Assessment of Cropland Exposure to Agricultural Drought in the Greater Mekong Subregion. Remote Sens. 2023, 15, 2737. [Google Scholar] [CrossRef]
  29. Mori, T.; Smith, T.E.; Hsu, W.T. Common power laws for cities and spatial fractal structures. Proc. Natl. Acad. Sci. USA 2020, 117, 6469–6475. [Google Scholar] [CrossRef]
  30. Tu, Y.; Chen, B.; Yu, L.; Xin, Q.; Gong, P.; Xu, B. How does urban expansion interact with cropland loss? A comparison of 14 Chinese cities from 1980 to 2015. Landsc. Ecol. 2021, 36, 243–263. [Google Scholar] [CrossRef]
  31. Ma, W.; Wei, F.; Zhang, J.; Karthe, D.; Opp, C. Green water appropriation of the cropland ecosystem in China. Sci. Total Environ. 2022, 806, 150597. [Google Scholar] [CrossRef]
  32. Tan, Q.; Geng, J.; Fang, H.; Li, Y.; Guo, Y. Exploring the Impacts of Data Source, Model Types and Spatial Scales on the Soil Organic Carbon Prediction: A Case Study in the Red Soil Hilly Region of Southern China. Remote Sens. 2022, 14, 5151. [Google Scholar] [CrossRef]
  33. Deng, J.; Qiu, L.; Wang, K.; Yang, H.; Shi, Y.Y. An integrated analysis of urbanization-triggered cropland loss trajectory and implications for sustainable land management. Cities 2011, 28, 127–137. [Google Scholar] [CrossRef]
  34. Zhang, J.; Sun, H.; Jiang, X.; He, J. Evaluation of development potential of cropland in Central Asia. Ecol. Indic. 2022, 142, 109250. [Google Scholar] [CrossRef]
  35. Duan, D.; Sun, X.; Liang, S.; Sun, J.; Fan, L.; Chen, H.; Xia, L.; Zhao, F.; Yang, W.; Yang, P. Spatiotemporal patterns of cultivated land quality integrated with multi-source remote sensing: A case study of Guangzhou, China. Remote Sens. 2022, 14, 1250. [Google Scholar] [CrossRef]
  36. Li, Z.; Wang, L.; Zhou, X.; Tang, L.; Zhang, X.; Li, Y. HBase-based vector spatial data storage and query method and its application. Geosciences 2022, 7, 1146–1154. [Google Scholar] [CrossRef]
  37. Awiti, A.O.; Walsh, M.G.; Shepherd, K.D.; Kinyamario, J. Soil condition classification using infrared spectroscopy: A proposition for assessment of soil condition along a tropical forest-cropland chrono sequence. Geoderma 2008, 143, 73–84. [Google Scholar] [CrossRef]
  38. Li, Y.; Chang, C.; Wang, Z.; Li, T.; Li, J.; Zhao, G. Identification of Cultivated Land Quality Grade Using Fused Multi-Source Data and Multi-Temporal Crop Remote Sensing Information. Remote Sens. 2022, 14, 2109. [Google Scholar] [CrossRef]
  39. Tang, Y.; Fan, A.; Wang, Y.; Yao, Y. mDHT: A multi-level-indexed DHT algorithm to extra-large-scale data retrieval on HDFS/Hadoop architecture. Pers. Ubiquitous Comput. 2014, 18, 1835–1844. [Google Scholar] [CrossRef]
  40. Lu, N.; Cheng, C.; Jin, A.; Ma, H. An index and retrieval method of spatial data based on GeoSOT global discrete grid system. In Proceedings of the 2013 IEEE International Geoscience and Remote Sensing Symposium—IGARSS, Melbourne, Australia, 21–26 July 2013. [Google Scholar]
  41. Zhao, C.; He, F.; Yang, F.; Li, S. Uncertainties of global historical land use scenarios in past-millennium cropland reconstruction in China. Quat. Int. 2022, 641, 87–96. [Google Scholar] [CrossRef]
  42. Wu, Z.; Fang, X.; Jia, D.; Zhao, W. Reconstruction of cropland cover using historical literature and settlement relics in farming areas of Shangjing Dao during the Liao Dynasty, China, around 1100 AD. Holocene 2020, 30, 1516–1527. [Google Scholar] [CrossRef]
  43. Klein Goldewijk, K.; Beusen, A.; Doelman, J.; Stehfest, E. Anthropogenic land use estimates for the Holocene—HYDE 3.2. Earth Syst. Sci. Data 2017, 9, 927–953. [Google Scholar] [CrossRef]
  44. Kaplan, J.O.; Krumhardt, K.M.; Gaillard, M.J.; Sugita, S.; Trondman, A.K.; Fyfe, R.; Marquer, L.; Mazier, F.; Nielsen, A.B. Constraining the deforestation history of Europe: Evaluation of historical land use scenarios with pollen-based land cover reconstructions. Land 2017, 6, 91. [Google Scholar] [CrossRef]
  45. Xu, H. Research on mass monitoring data Retrieval Technology based on HBase. In Proceedings of the 2021 6th International Symposium on Advances in Electrical, Nanjing, China, 12–14 March 2021. [Google Scholar]
  46. Firozjaei, M.K.; Sedighi, A.; Firozjaei, H.K.; Kiavarz, M.; Homaee, M.; Arsanjani, J.J.; Makki, M.; Naimi, B.; Alavipanah, S.K. A historical and future impact assessment of mining activities on surface biophysical characteristics change: A remote sensing-based approach. Ecol. Indic. 2021, 122, 107264. [Google Scholar] [CrossRef]
  47. Wang, L.; Zhou, Y.; Li, Q.; Xu, T.; Wu, Z.; Liu, J. Application of three deep machine-learning algorithms in a construction assessment model of farmland quality at the county scale: Case study of Xiangzhou, Hubei Province, China. Agriculture 2021, 11, 72. [Google Scholar] [CrossRef]
  48. Chen, D.; Chang, N.; Xiao, J.; Zhou, Q.; Wu, W. Mapping dynamics of soil organic matter in croplands with MODIS data and machine learning algorithms. Sci. Total Environ. 2019, 669, 844–855. [Google Scholar] [CrossRef] [PubMed]
  49. Chen, J.; Yu, L.; Wang, W. Hilbert space filling curve based scould-order for point cloud attribute compression. IEEE Trans. Image Process. 2022, 31, 4609–4621. [Google Scholar] [CrossRef] [PubMed]
  50. Zhang, D.; Wang, Y.; Liu, Z.; Dai, S. Improving NoSQL storage schema based on Z-curve for spatial vector data. IEEE Access 2019, 7, 78817–78829. [Google Scholar] [CrossRef]
  51. Zhou, J.; Ben, J.; Wang, R.; Zheng, M.; Du, L. Lattice quad-tree indexing algorithm for a hexagonal discrete global grid system. ISPRS Int. J. Geo Inf. 2020, 9, 83. [Google Scholar] [CrossRef]
  52. Sun, L.; Jin, B. Improving NoSQL Spatial-Query Processing with Server-Side In-Memory R*-Tree Indexes for Spatial Vector Data. Sustainability 2023, 15, 2442. [Google Scholar] [CrossRef]
Figure 1. Framework of the study.
Land 12 01916 g001
Figure 2. Location of the study area.
Land 12 01916 g002
Figure 3. UML of cropland big data fusion model.
Land 12 01916 g003
Figure 4. Grid mapping diagram.
Land 12 01916 g004
Figure 5. Power law curve of cropland patches area.
Land 12 01916 g005
Figure 6. Number of grids that fully contain one or more cropland patches.
Land 12 01916 g006
Figure 7. Similarity test of spatial distribution of cropland patch data and cropland grid data.
Land 12 01916 g007
Figure 8. Grid data for cropland quality evaluation indicators: (a) cropland area grade, (b) soil type grade, (c) organic matter content grade, (d) slope grade, (eh) convenience of farming grade (ditch grade, river grade, rural road grade, highway grade).
Land 12 01916 g008
Figure 9. Cropland quality evaluation grades based on grid data.
Land 12 01916 g009
Figure 10. Time spent on data import.
Land 12 01916 g010
Figure 11. Data retrieval efficiency: (a) number of grids and average retrieval time for each grade of cropland quality, (b) retrieval time for each grade of cropland quality, (c) number of grids and average retrieval time for each cropland type, (d) retrieval time for each cropland type.
Land 12 01916 g011
Figure 12. Efficiency comparison: (a) data import efficiency, (b) data retrieval efficiency.
Land 12 01916 g012
Table 1. Experimental data and types.
CategoryDataData Format
Farming conditionsCropland patchShapefile (Polygons)
Topographic slopeRaster
Soil fertilitySoil typeShapefile (Polygons)
Organic matterShapefile (Point)
Convenience of farmingRural roads, highways, rivers, ditchesShapefile (Polylines)
Level of agricultural production capacityCrop production in 2019CSV
Level of agricultural constructionLevel of mechanization in 2019CSV
Level of modernization in 2019CSV
Table 2. Statistics of the total number of grids in each layer.
AccuracyScaleArea (ha)Number of Grids (Pcs)
Geohash439.1 km × 19.5 km76,24512
Geohash54.89 km × 4.89 km2391.21230
Geohash61.22 km × 0.61 km744.426882
Geohash7153 m × 153 m2.3409209,805
Geohash838.2 m × 19.1 m0.07296,689,053
Geohash94.77 m × 4.77 m0.002275≈200,000.000
Table 3. Statistical characteristics of indicators.
IndicatorMinimumMaximumMeanStandard DeviationFirst QuartileMedianThird QuartileSkewnessKurtosis
Cropland area (ha)0.000122812.7284466.94613314.8132131.4928343.9637018.85671128.21205.4
Terrain slope (%)0.00067437.983.032.371.382.393.92.0510.2
Organic matter (g·kg−1)54515.096.861616160.55.1
Distance of rural roads from cropland (m)011,355.871332.271697.85226.02724.341714.112.158
Distance of highway from cropland (m)024,049.085371.095019.891103.83983.148351.140.943
Distance of ditch from cropland (m)024,495.12802.743472.35663.561640.083533.72.712.2
Distance of river from cropland (m)026,281.5310,337.916955.964083.519409.1215,857.450.382
Table 4. Cropland quality evaluation indicator system.
Indicator LayerWeightIndicatorWeight Hierarchy
1234
Farming conditions0.24347Cropland area (ha)0.875Range0–1.49281.4928–3.96373.9637–8.85678.8567–812.7284
Terrain slope (%)0.125>2010–205–100–5
Soil fertility0.5251Soil type0.143Wind sand and sandy soilSoda and salted soilCalcareous soilMeadow soils and black calcareous soils
Organic matter (g·kg−1)0.8570–55–1616–45-
Convenience of farming0.13373Distance from rural road to cropland (m)0.5541714.11–11,355.87724.34–1714.11226.02–724.340–226.02
Distance from highway to cropland (m)0.0898351.14–24,049.083983.14–8351.141103.8–3983.140–1103.8
Distance from river to cropland (m)0.30815857.45–26,281.539409.12–15,857.454083.51–9409.120–4083.51
Distance from ditch to cropland (m)0.0493533.7–24,495.11640.08–3533.7663.56–1640.080–663.56
Level of agricultural production capacity0.06622Level of modernization in 20191-----
Level of agricultural construction0.03149Level of modernization in 20190.8-----
Level of modernization in 20190.2-----
Table 5. Number of grids with different grades for each category.
TypeHighestHigherMediumLowerLowestTotal
Number (pcs)Proportion (%)Number (pcs)Proportion (%)Number (pcs)Proportion (%)Number (pcs)Proportion (%)Number (pcs)Proportion (%)
Dry cropland1362267009.8518,38627.042587438.051568223.0668,004
Irrigated cropland5353.24258415.65554433.58534332.36250615.1816,512
Paddy cropland1812.654646.83317946.78229033.768210.046796
Disclaimer/Publisher’s Note: The statements, opinions and data contained in all publications are solely those of the individual author(s) and contributor(s) and not of MDPI and/or the editor(s). MDPI and/or the editor(s) disclaim responsibility for any injury to people or property resulting from any ideas, methods, instructions or products referred to in the content.

