Article

Spatiotemporal Analysis and Prediction of Urban Land Use/Land Cover Changes Using a Cellular Automata and Novel Patch-Generating Land Use Simulation Model: A Study of Zhejiang Province, China

1
College of Civil Engineering and Architecture, Zhejiang University, Hangzhou 310058, China
2
International Center for Architecture and Urban Development Studies, Zhejiang University, Hangzhou 310058, China
*
Author to whom correspondence should be addressed.
These authors contributed equally to this work.
Land 2023, 12(8), 1525; https://doi.org/10.3390/land12081525
Submission received: 20 June 2023 / Revised: 18 July 2023 / Accepted: 30 July 2023 / Published: 1 August 2023

Abstract

:
Urban land use/land cover (LULC) monitoring and prediction are vital for understanding the spatiotemporal change dynamics of future land uses. They provide the necessary data for effectively planning and managing natural land resources. In this study, we analyzed and simulated the changes in urban LULC within Zhejiang Province, a region in China experiencing rapid urbanization. By exploring the historical change dynamics of the region, we observed substantial transformations in the extent of built-up areas, forests, and agricultural land from 1995 to 2020. Specifically, the study area witnessed the expansion in urban built-up areas by approximately 6126.93 km2, while forests and agricultural land witnessed decreases of 3252.47 km2 and 2885.13 km2, respectively. To predict the study area’s future LULC, a cellular automata (CA) model was utilized in combination with an advanced patch-generating land use simulation (PLUS) model. This integrated approach allowed for multiple land use predictions based on different scenarios. Under the baseline scenario (BLS), it was projected that the area of urban expansion in Zhejiang Province would be approximately 4501.62 km2. However, under the scenario of cultivated land and ecological protection, i.e., CLPS and EPS, urban growth was observed to be 538.64 km2 and 1776.16 km2, respectively. These findings indicate that the extent of built-up area development in Zhejiang Province is significantly reduced when the CLPS and EPS are implemented in comparison to the BLS. Therefore, policy interventions are crucial to protect agricultural land and conserve ecological areas. This research provides the scientific data needed for proper planning and serves as reference data for other regions with similar rapid urbanization.

1. Introduction

Land plays a critical role within the natural environment and holds significant importance in various aspects of human existence as well as the development of ecosystems [1,2,3]. However, the global availability of land resources has become increasingly limited due to the growing urban population and the high demand for agricultural development [4,5]. Currently, more than 56% of the global urban population, approximately 4.4 billion people, reside in cities, which is expected to reach approximately 68% by 2050 [6]. Due to this rapid urbanization process, there has been a notable transformation in the spatio-temporal distribution of land use and land cover (LULC) at local, regional, and global levels [7]. It is, therefore, vital to monitor and analyze the dynamics of LULC to effectively manage land resources and achieve sustainable urban development [8]. In addition, to address the negative impacts of urbanization, such as biodiversity loss, land resource depletion, ecosystem degradation, and environmental pollution [9,10], accurate predictions of changes in LULC are necessary for proper land resource planning and management.
In China, the country’s late 1970s economic reform and opening-up policy have contributed substantially to the severe inconsistency between the demand for land resources and economic supply in most provinces [11,12]. This inconsistency is mainly attributed to the pressures of 21st century urban development and rapid industrialization. The urbanization rate of China has grown considerably from 17.90% in late 1978 to approximately 64.72% in 2021 [13,14]. The impact of this development has been the increased utilization of land resources, resulting in continuous declines in agricultural areas, loss of arable farmlands, ecological deterioration, and inequality between the land supply and demand [15,16,17]. The irrational use and development of land resources, particularly in areas with high commercial and land value, have contributed to these alterations in LULC [18,19]. Therefore, environmental studies that focus on sustainable development in urban areas through ecofriendly strategies are critical for mitigating the negative impacts of urbanization and rapid industrialization [20,21]. Proper monitoring and prediction of land uses are essential to address these urbanization challenges [22,23,24].
Recent environmental studies have employed remotely sensed data using various geospatial techniques to examine the change dynamics of LULC [25]. Such methods provide a cost-effective approach for the spatial and quantitative exploration of land use changes using earth observation data [26,27]. Time-series satellite data analysis, in particular, offers an excellent platform for understanding and predicting urban land use changes [28,29]. Over the years, various spatial models have been used in different urban areas to forecast future land use changes [30]. Among the most utilized simulation models include cellular automata (CA), Markov chain (MC), CA-Markov, logistic regression (LR), artificial neural networks (ANNs), machine learning (ML), and the conversion of land use and its effects (CLUE-S) model [31]. These models are utilized to estimate future LULC transitions on a local and regional scale [32,33]. Each model has unique characteristics and specific modeling abilities. The CA model, for instance, is commonly used for simulating land use transitions because it considers previous LULC conditions, neighboring influences, and transition rules. It employs a nonlinear stochastic process to estimate pixel locations and generates a complex matrix of LULC alterations [34]. Cellular automata models have rapidly evolved in several environmental studies and offer valuable insights into the spatiotemporal complexities of land uses in urban areas [35,36].
Several regional studies have utilized these models to determine the future dynamics of urban LULC [25,37,38,39]. For example, the Markov chain (MC) model was employed to forecast the urban LULC changes in the Bhagirathi-Hugli River, India [40]. In another study, the Markov model was combined with a CA model to forecast changes in LULC based on space and time, effectively integrating the cellular automata model’s spatial capacity with the Markov chain’s long-term simulation abilities [41]. The decadal change dynamics of LULC in the Zarriné-Rūd River Basin, Iran, were spatially mapped using an integrated-based scenario model [42]. By incorporating different socioeconomic and climatic variables, another study demonstrated that most land use changes do not signify land degradation/desertification in Greece, with future predictions indicating a similar trend of land use modification [43]. Recent studies have also determined the anticipated urban sprawl in the city of Lagos, Nigeria, using a spatially explicit model [10,44]. The study results showed substantial urban growth over the last 20 years. Similarly, the CA-Markov was utilized in the Kurdistan region of Iraq to model future LULC. The model was also used in the Mellegue catchment region between Algeria and Tunisia to forecast and assess land use changes [45,46].
While numerous previous studies have forecasted future LULC using spatially explicit models, such models have limited capabilities in understanding the underlying factors responsible for land use changes and experience numerous challenges in simulating patch-level alterations of LULC due to their deficiency in conversion rule strategy. Therefore, there is an imperative need for a novel method that accurately represents the complex and heterogeneous nature of LULC alterations. Such an approach would remedy the deficiency of the conversion rule strategy by providing a multitype seed mechanism that better simulates land changes using multitype land use patches. An example of such a method is the novel patch-generating land use simulation (PLUS) model. The model produces an improved simulation result due to its multiobjective optimization algorithms, providing better insights into the underlying factors of land use changes specific to the study area.
In our current investigation, we applied the PLUS model to examine the factors behind the expansion of urban land uses and forecast the anticipated LULC within Zhejiang Province, China, over the next 20 years, i.e., 2040. The innovative approach employed in this study utilized a rule-mining framework derived from the land expansion analysis strategy and incorporated multiclass random seeds to have a more accurate simulation result compared to the existing CA models. This technique models the nonlinear relationships inherent in patch-level variations of land uses [47]. By utilizing a multiobjective optimization algorithm along with multitype random seeds, the PLUS model effectively forecasted the anticipated changes in the study area’s land uses, which is vital to achieving the three specific objectives of this research. These objectives include (i) analyzing the spatiotemporal LULC change dynamics within Zhejiang Province between 1995 and 2020, (ii) examining the underlying factors that contributed to these land use changes over the last 25 years, and (iii) simulating the anticipated pattern of the future urban LULC under three different scenarios.

2. Materials and Methods

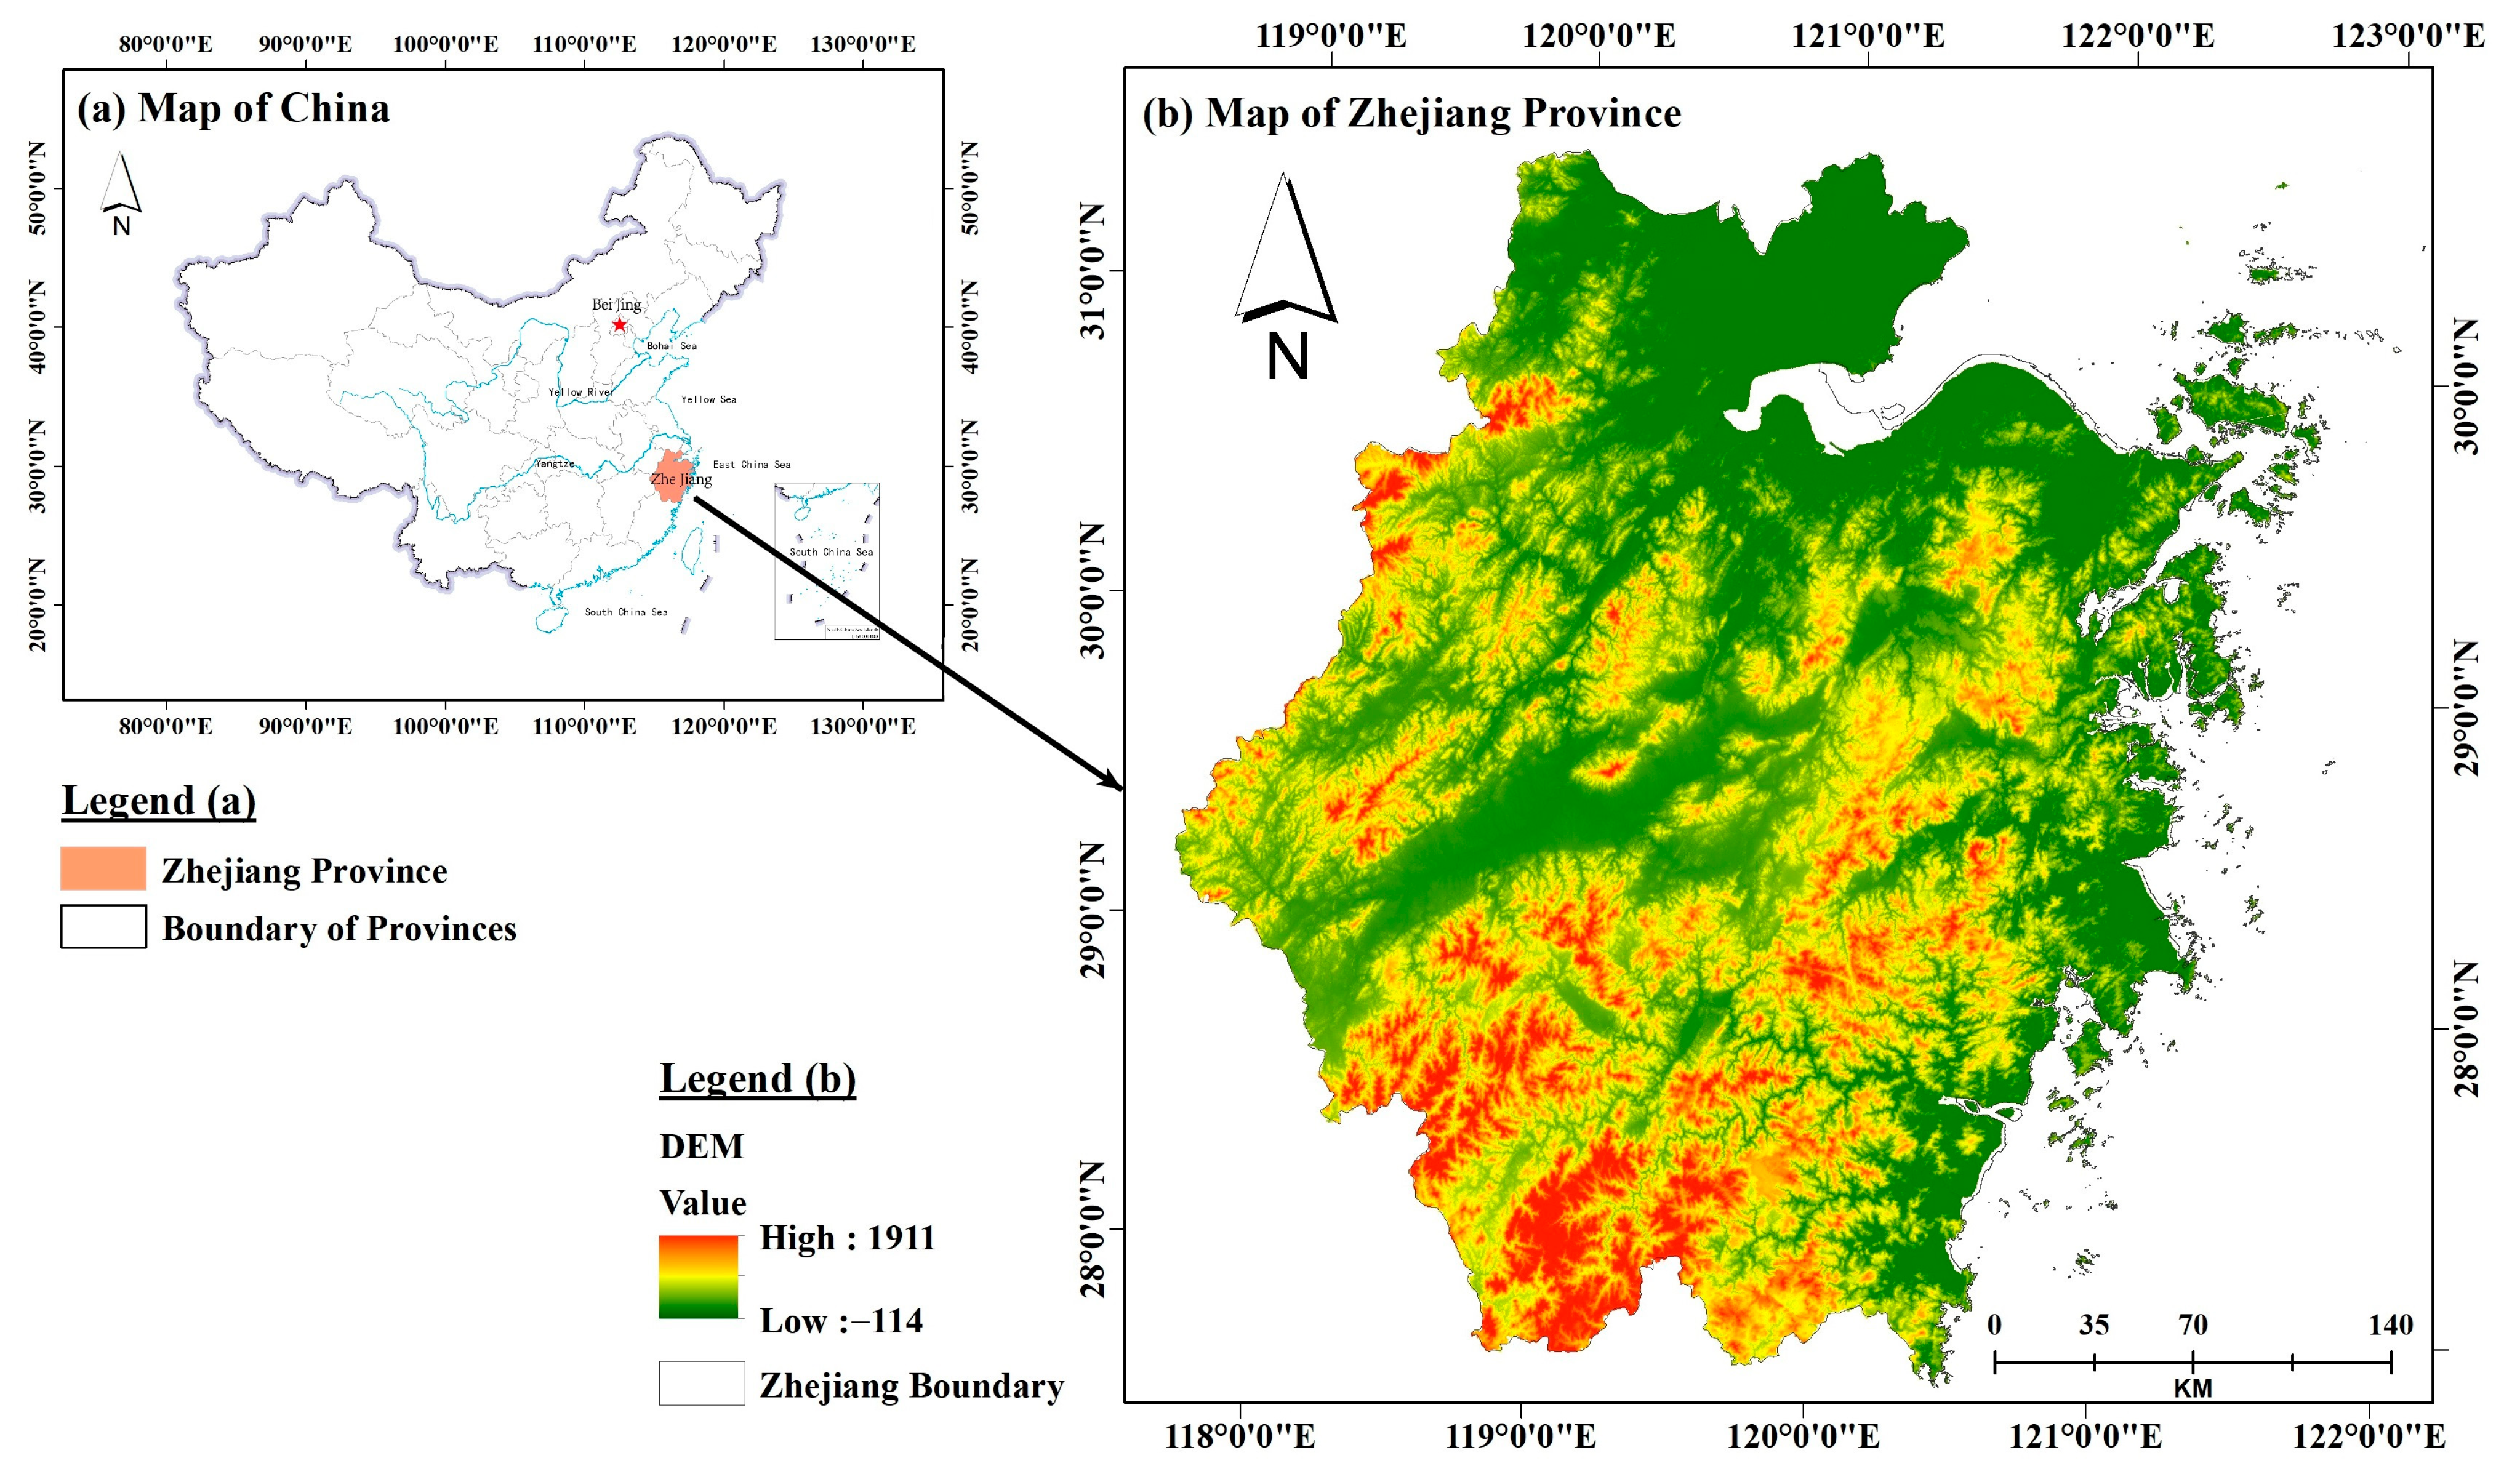
2.1. Study Area, i.e., Zhejiang Province

Zhejiang Province is located in China’s mainland between longitude 119°0′0′′ E and 123°0′0″ E and latitude 28°0′0″ N and 31°0′0″ N around the country’s southeastern coast, as shown in Figure 1. It is bordered by Shanghai and Jiangsu Province to its north, Anhui and Jiangxi Provinces to its west, Fujian Province to its south, and the East China Sea to its east. The province covers approximately 103,117 km2 and has varying topography, with hilly areas in its southern and western regions and flat areas around its north. It has diverse climatic features, with a mean annual rainfall between 1000 and 1900 mm and humid and hot summers/springs. The study area, i.e., Zhejiang Province, is identified as a region with one of the fastest socioeconomic growth in China. In 2021, the region’s gross domestic product was estimated at CNY 7.35 trillion, which is 108 times that of 1978 based on the country’s data. This growth has contributed to significant land use changes, resulting in numerous challenges, such as inadequate land resources and other environmental challenges. The 2019 National Land of China indicated a per capita cultivated land area of approximately 0.30 mu in Zhejiang Province. This amount is far below the United Nations warning level of 0.795 mu, as suggested by the Food and Agriculture Organization (FAO). This makes the region an ideal study area for analyzing land use changes and their associated drivers. By focusing on Zhejiang Province, the study provides more understanding of the driving factors behind land use changes and offers valuable insights into the future LULC pattern.

2.2. Data Sources

We acquired the classified land use and land cover (LULC) datasets from China’s annual classified land cover products (CLCD). These data, which are publicly available in the Zenodo archive [48], cover the period from 1995 to 2020 and consist of nine major LULC classes. The spatial resolution of the data is 30 m. The accuracy of the classification was assessed by validating it against third-party test samples, resulting in an overall accuracy of 79.31%. We obtained additional data for our study from various sources. Specifically, we retrieved information on the digital elevation model (DEM), precipitation, and temperature of Zhejiang Province from the Chinese Academy of Sciences (CAS) Data Center for Resources and Environmental Sciences. To incorporate spatial information, we obtained road and administration center data from the OpenStreetMap platform. Socioeconomic factors were acquired from the Global Change Research Database and Repository. To obtain data on slope and distance to roads, we utilized the DEM and the Euclidean distance technique in ArcGIS 10.7.1 geospatial software. It is important to note that different years were used for these datasets due to their availability. We relied on the most reliable and comprehensive data sources available during the study. Collecting reliable and consistent multiyear socioeconomic data is challenging, especially at a regional scale and for specific variables. Given the constraints we faced, we utilized the GDP and population data for 2015 to perform the analysis changes of the study area’s land uses. A summary of the diverse datasets is provided in Table 1.

2.3. Methods

The methodological procedure comprised two major steps that involved (i) monitoring and analyzing the study area’s LULC change dynamics from 1995 to 2020 and (ii) forecasting the future distribution of the study area’s LULC over the next 20 years. The classified LULC maps and the spatial driving factors served as the input data for the simulation process using the procedures below.

2.3.1. Classification of Land Use/Land Cover

The extent of the study area, i.e., Zhejiang Province’s boundaries, was cropped and projected to WGS 1984 UTM prior to the reclassification of LULC. The collected data were then preprocessed with quality enhancement techniques. The research categorized the study’s areas LULC into six (6) key classes of land uses. The classes include agricultural land (plantations, cropland, fallow land, and farmlands), forest areas (riparian vegetation, open forest, deciduous woodlands, evergreen broad or needle-leaved forests, dense forest, deciduous forest, and mixed forest), grassland (areas with vegetation of two meters and below height and range lands), water bodies (rivers, lakes, ponds, reservoirs, swamps, streams, and wetlands), built-up or urban areas (residential, commercial, and industrial buildings alongside other infrastructural facilities, such as road networks), and barren land (includes gravel or silt deposit, construction site, degraded hillsides, rock, open lands, or bare soil with no plantation or vegetation cover), as described in Table 2. The study further interpreted and verified the reclassified LULC using high-resolution Google Earth images in ArcGIS 10.7.1. Finally, we utilized various resampling techniques, such as the bilinear and nearest neighbor interpolation, to harmonize the spatial resolution discrepancies between classified land cover maps and spatial driving variables, enabling their effective integration and analysis within our study.

2.3.2. Spatiotemporal Analysis of LULC

This research analyzed the spatiotemporal changes in the study area’s land uses using six-time epochs. We utilized the change modeler of TerrSet geospatial software 19.0.6 to estimate the LULC changes between 1995 and 2000, 2000 and 2005, 2005and 2010, 2010 and 2015, 2015 and 2020, and 1995 and 2020. The change transition was analyzed using geospatial techniques that overlapped two classified maps of the different years. The study also produced the statistical data of area changes and change alterations for the different time nodes. For the annual rate of changes in each LULC category, the land use difference between the initial and final periods of individual land use classes was divided by time interval. The change magnitude and the rate of annual changes in LULC were calculated using Equations (1) and (2) below:
Change   Magnitude   ( C M ) = A L ( t 1 ) A L ( t 2 ) ,
Annual   Rate   of   Change   A R C = A L t 1 A L t 2 A L t 2 × N × 100 % ,
where CM is the magnitude of change, AL is the area of individual classes of land uses, t 1 is the initial time, t 2 is the final time, and N is the time interval between t 2 and   t 1 .

2.3.3. Driving Variables of LULC Changes

The study recognized the significance of spatial driving factors to the numerous LULC alterations. The factors that led to the study area’s numerous LULC transitions are diverse and complex, resulting from several physical and natural factors alongside socioeconomic considerations. Physical and socioeconomic factors influence the simulation model’s accuracy. The study area’s geographical and climatic factors served as the physical factors that substantially influenced anthropogenic activities in the province. Physical considerations such as DEM, slope, and distance to roads are utilized to determine their contribution to urban land use transition. The natural condition was the basis for determining the study area’s spatial distribution related to land availability. In addition, socioeconomic factors also helped in understanding the study area’s evolution of LULC. The main driving factors considered in this study comprised gross domestic product (GDP), population, digital elevation model (DEM), slope, precipitation, temperature, distance to road networks, and urban administrative centers.

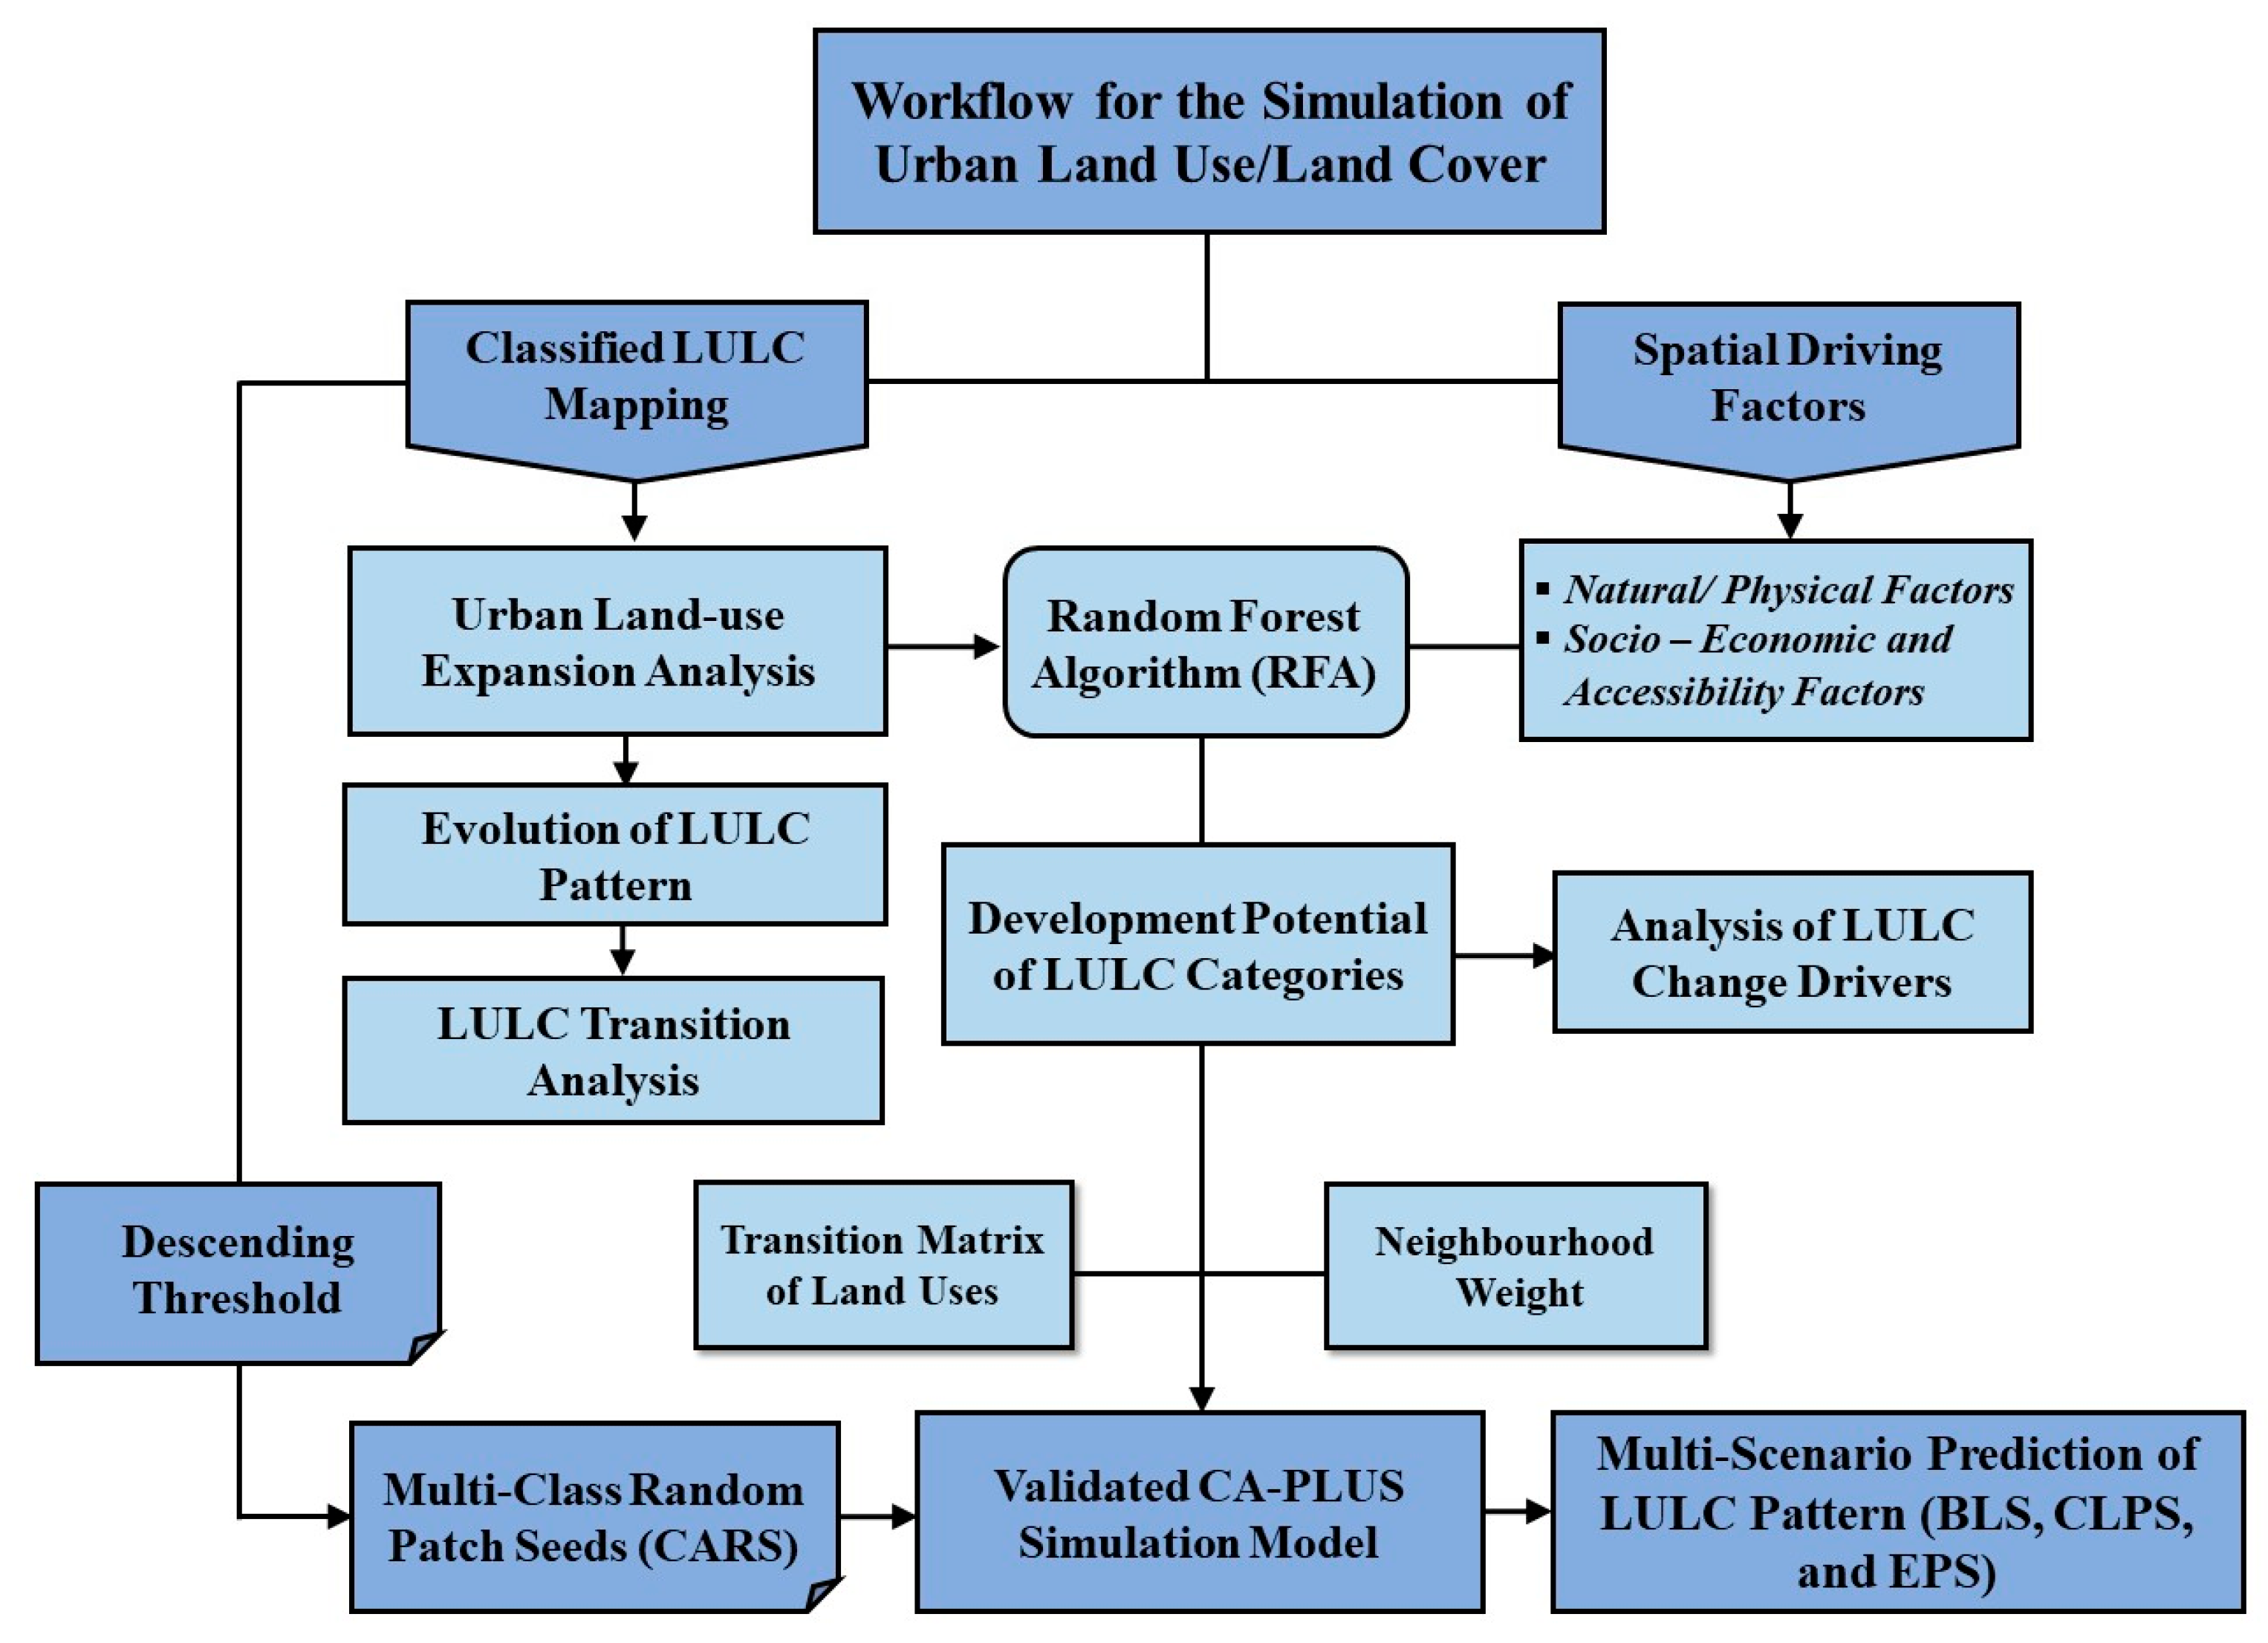
2.3.4. Modeling and Prediction of Future LULC

The study utilized the novel patch-generating land use simulation (PLUS) model coupled with the cellular automata (CA) model using the operational workflow presented in Figure 2. The spatiotemporal LULC distribution was modeled using the classified LULC maps, spatial driving variables, and transition constraints unique to the study area.
The patch-generating land use simulation (PLUS) model is a hybrid simulation approach that utilizes cellular automata techniques and raster data to predict LULC transformations at the patch scale [49,50]. It considers the potential spatial drivers of LULC in understanding the factors contributing to land use changes. The PLUS model has an operational mechanism for handling multiple LULC types and can accommodate a multiobjective optimization algorithm to simulate variations in urban land use [51]. Hence, it serves as a more advanced, effective, and reliable tool for modeling future land uses than the previously utilized LULC simulation models. The PLUS model incorporates a random forest (RF) algorithm to study the correlation between land utilization and spatial factors in understanding the anticipated changes in future LULC. The model employs a mining rule framework that utilizes the land expansion analysis strategy (LEAS) and the multiclass random patch seeds (CARS) of the cellular automata model to simulate LULC transitions [52].
  • Land Use Expansion Analysis Strategy (LEAS)
The LEAS module helps determine land use alteration using multiple patches obtained between the two nodes of LULC alteration. It utilizes a random forest (RF) algorithm in mining the potential variables of land use changes [53]. The modeling process requires overlaying two-time node land use data and extracting the spatial data for each LULC type. The LEAS provides the developmental proximities of each LULC category and determines the significance of the different variables in shaping the transformation of individual land use classes. Therefore, the proposed strategy helps in demonstrating and interpreting a better spatial evolution of land uses [54];
ii.
CA Model’s Multiclass/Type Random Patch Seed (CARS)
The CARS segment of the PLUS model helps forecast the spatiotemporal pattern of land uses based on LULC demand, transition potential, and other parameters. It is a simulation approach that combines the generation of random seeds with a mechanism that gradually reduces its threshold, allowing for a dynamic simulation of patch generation while considering the space and time constraints imposed by developmental probabilities [51,55]. The CARS module has a patch-generating tool that relies on multiclass random seeds to simulate future land use [56]. The multiclass random seeds model land transitions in patches using the threshold-descending rule to limit patch generation in the various LULC types. Therefore, land use cells with higher probabilities will likely transform more rapidly. The selected class of LULC is evaluated based on the decreasing threshold (τ) of the new land uses and calculated using the mathematical expressions presented in Equations (3) and (4) below:
If   k = 1 N G c t 1     k = 1 N G c t < Step   Then ,   l = l   +   1 ,
C h a n g e   P i , c d = 1 > τ   and   T M k , c = 1       N o   C h a n g e   P i , c d = 1   τ     or   T M k , c = 0   τ = δ l × r 1 ,
where Step is the PLUS model’s step size; δ is the decreasing threshold’s decay factor; τ ranges between 0 and 1, with r 1 being the value of the normal random distribution; l is the decay steps number; and T M k , c refers to the LULC transition matrix, which identifies whether (k) land use category can be transformed into (c) land use category.
Using the descending threshold presented above, land use patches of new types develop spontaneously and evolve freely based on transition probability constraints. Therefore, the underlying drivers of urban land use alterations are better identified in our proposed model, i.e., PLUS model, than in previously utilized simulation models.
The hybrid model highlighted a new strategy for LULC prediction, serving as a significant improvement to the previously utilized simulation models. The model maintains the advantages of the previous simulation models and remedies the numerous alterations occurring exponentially with land use categories while providing a better mechanism for forecasting land use changes [53]. Hence, the proposed model provides more efficient and accurate LULC simulation results.

2.3.5. Validation of the Simulation Model

We assessed the accuracy of the PLUS model by examining the real and simulated land use and land cover (LULC) maps of Zhejiang Province. To ensure the model’s reliability, we employed the Kappa statistical index, which allowed us to compare the outcomes of the simulated LULC with the real data of the study area. The validation process was conducted using Equation (5), as described in the mathematical expression below:
Kappa   Index   ( K ) = O c A s E s A s
where K represents the Kappa index, O c represents the overall classification accuracy, A s signifies the accuracy of the real simulation, and E s is the expected simulation accuracy.
The Kappa index usually ranges between zero and one. The upper limit, i.e., 1, signifies a total agreement between the real and forecasted map, while a Kappa value of zero represents an equal chance agreement [57,58]. In general, Kappa values above 0.75 indicate an accurate and satisfactory simulation result due to the high agreement between the real and simulated map. In contrast, Kappa values less than 0.40 signify poor agreement in the simulation modeling process [59,60].

3. Results

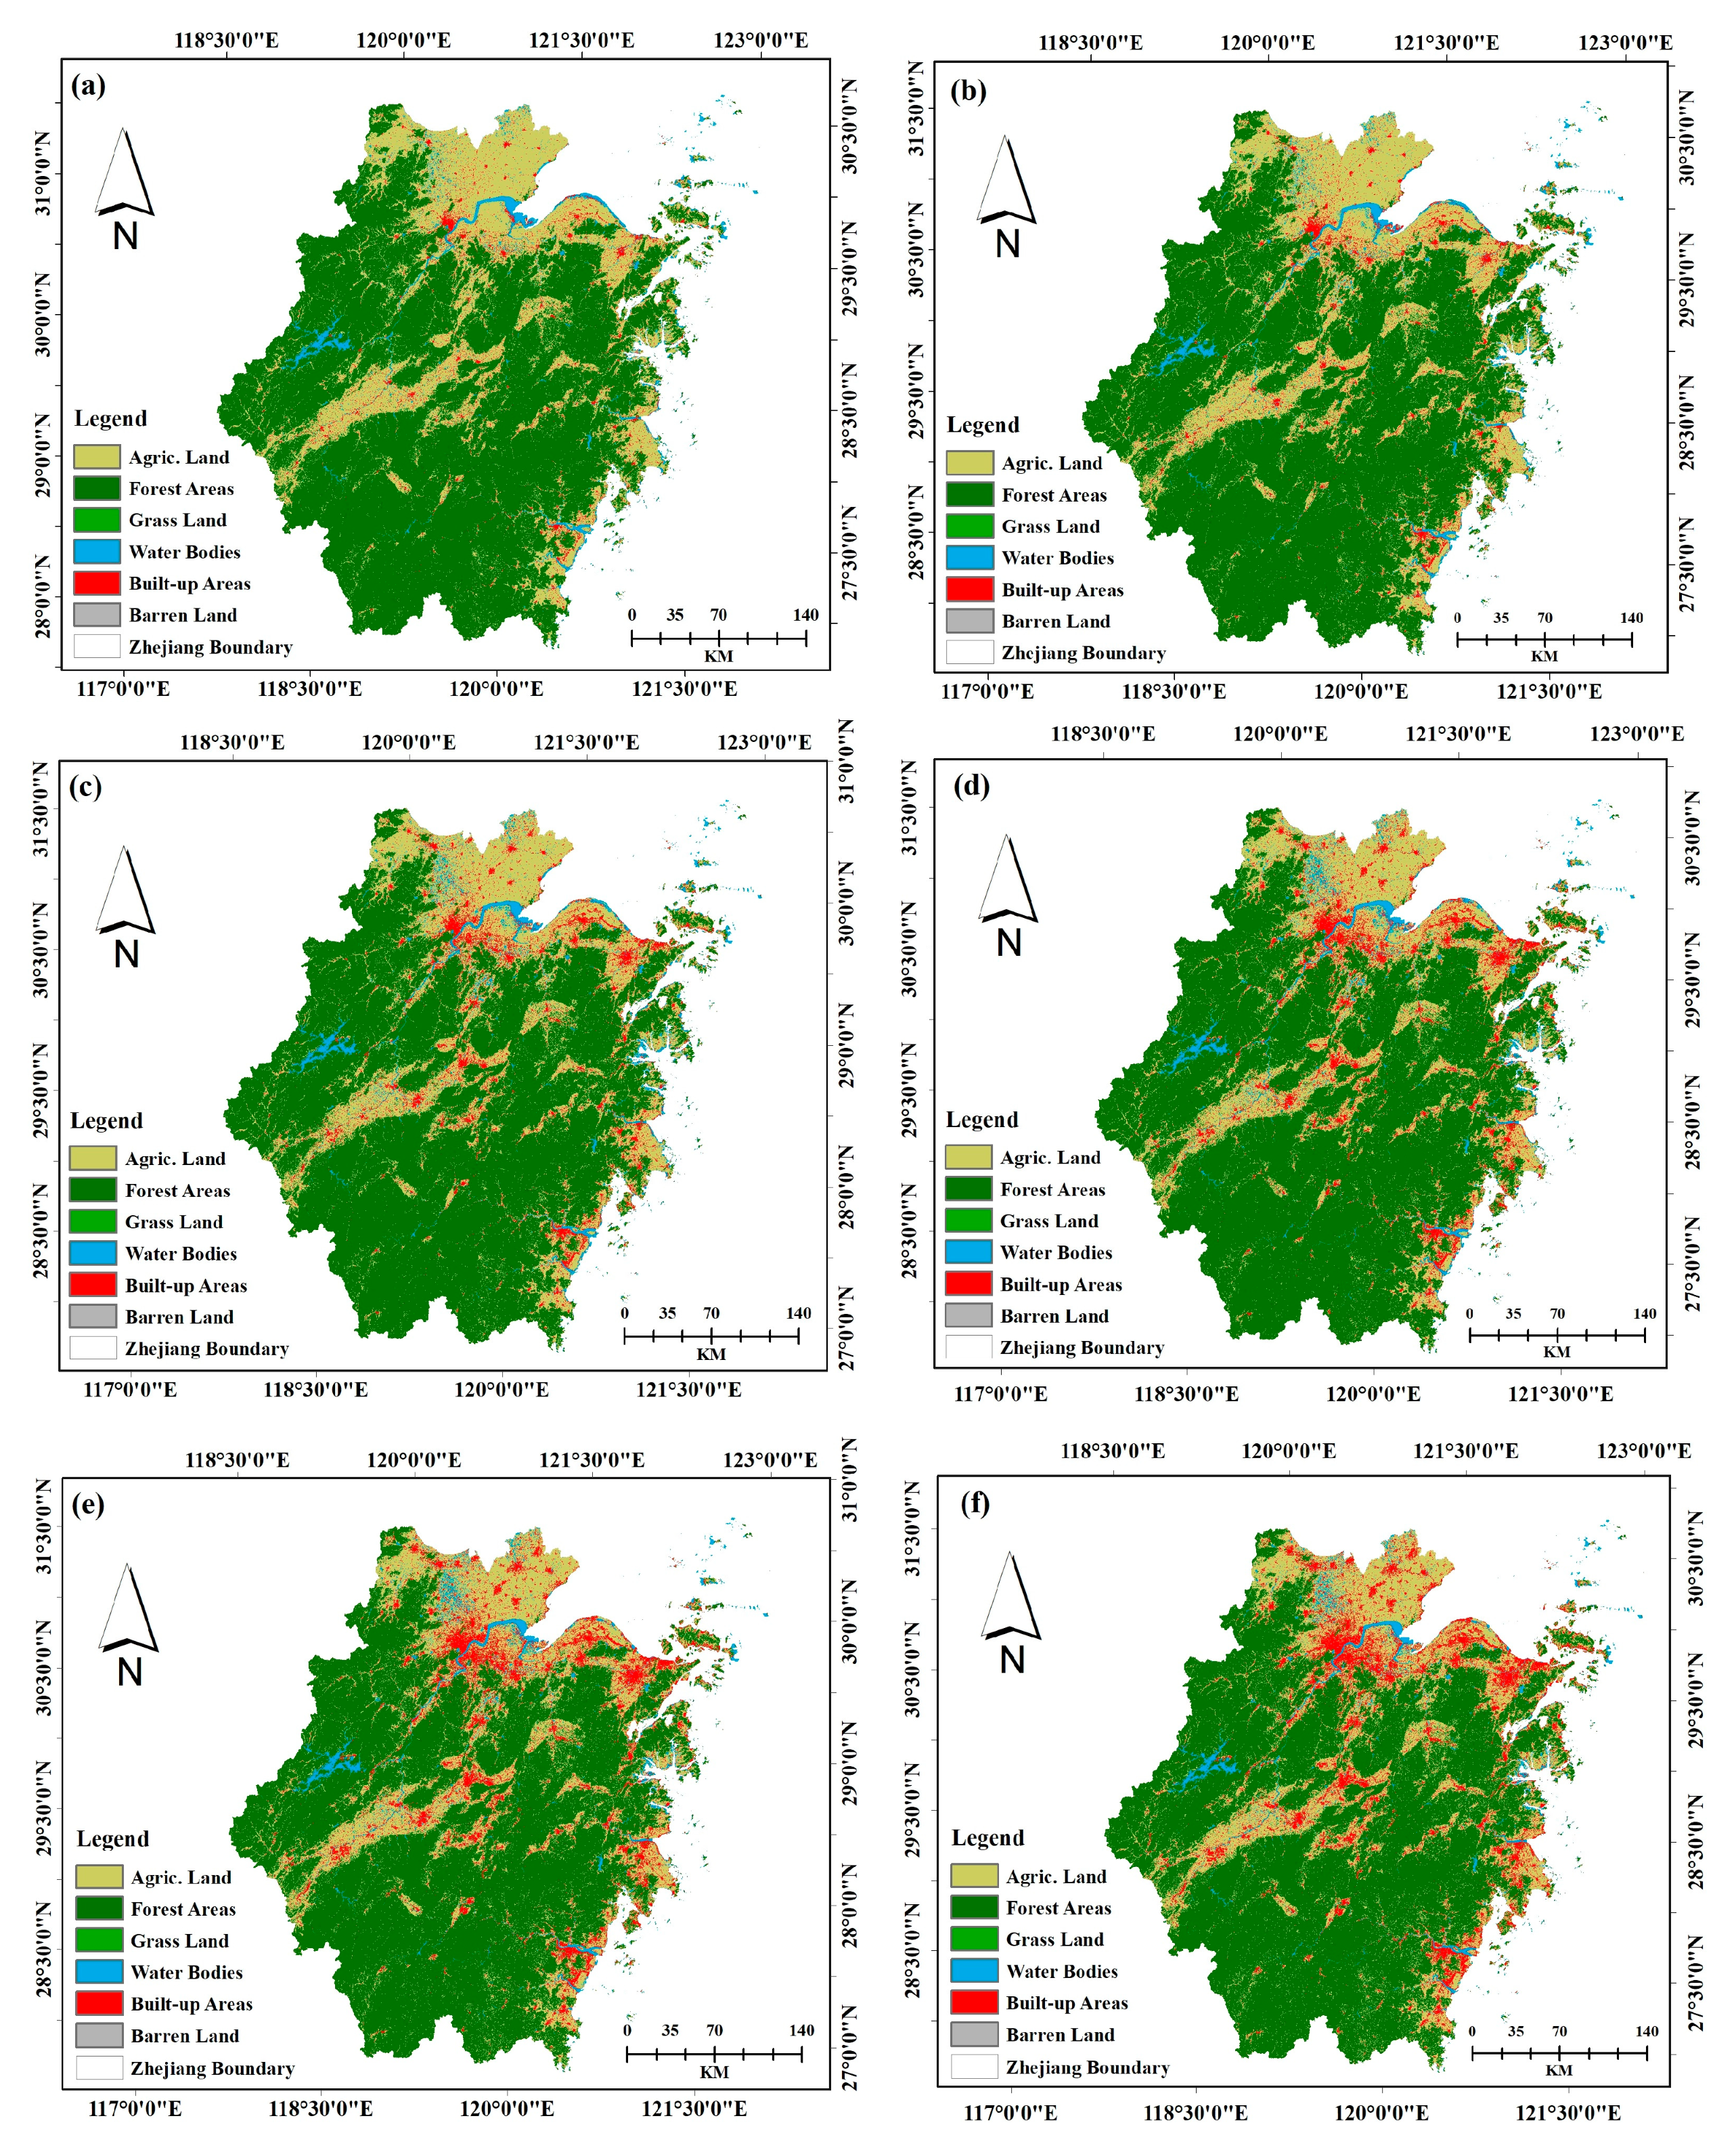
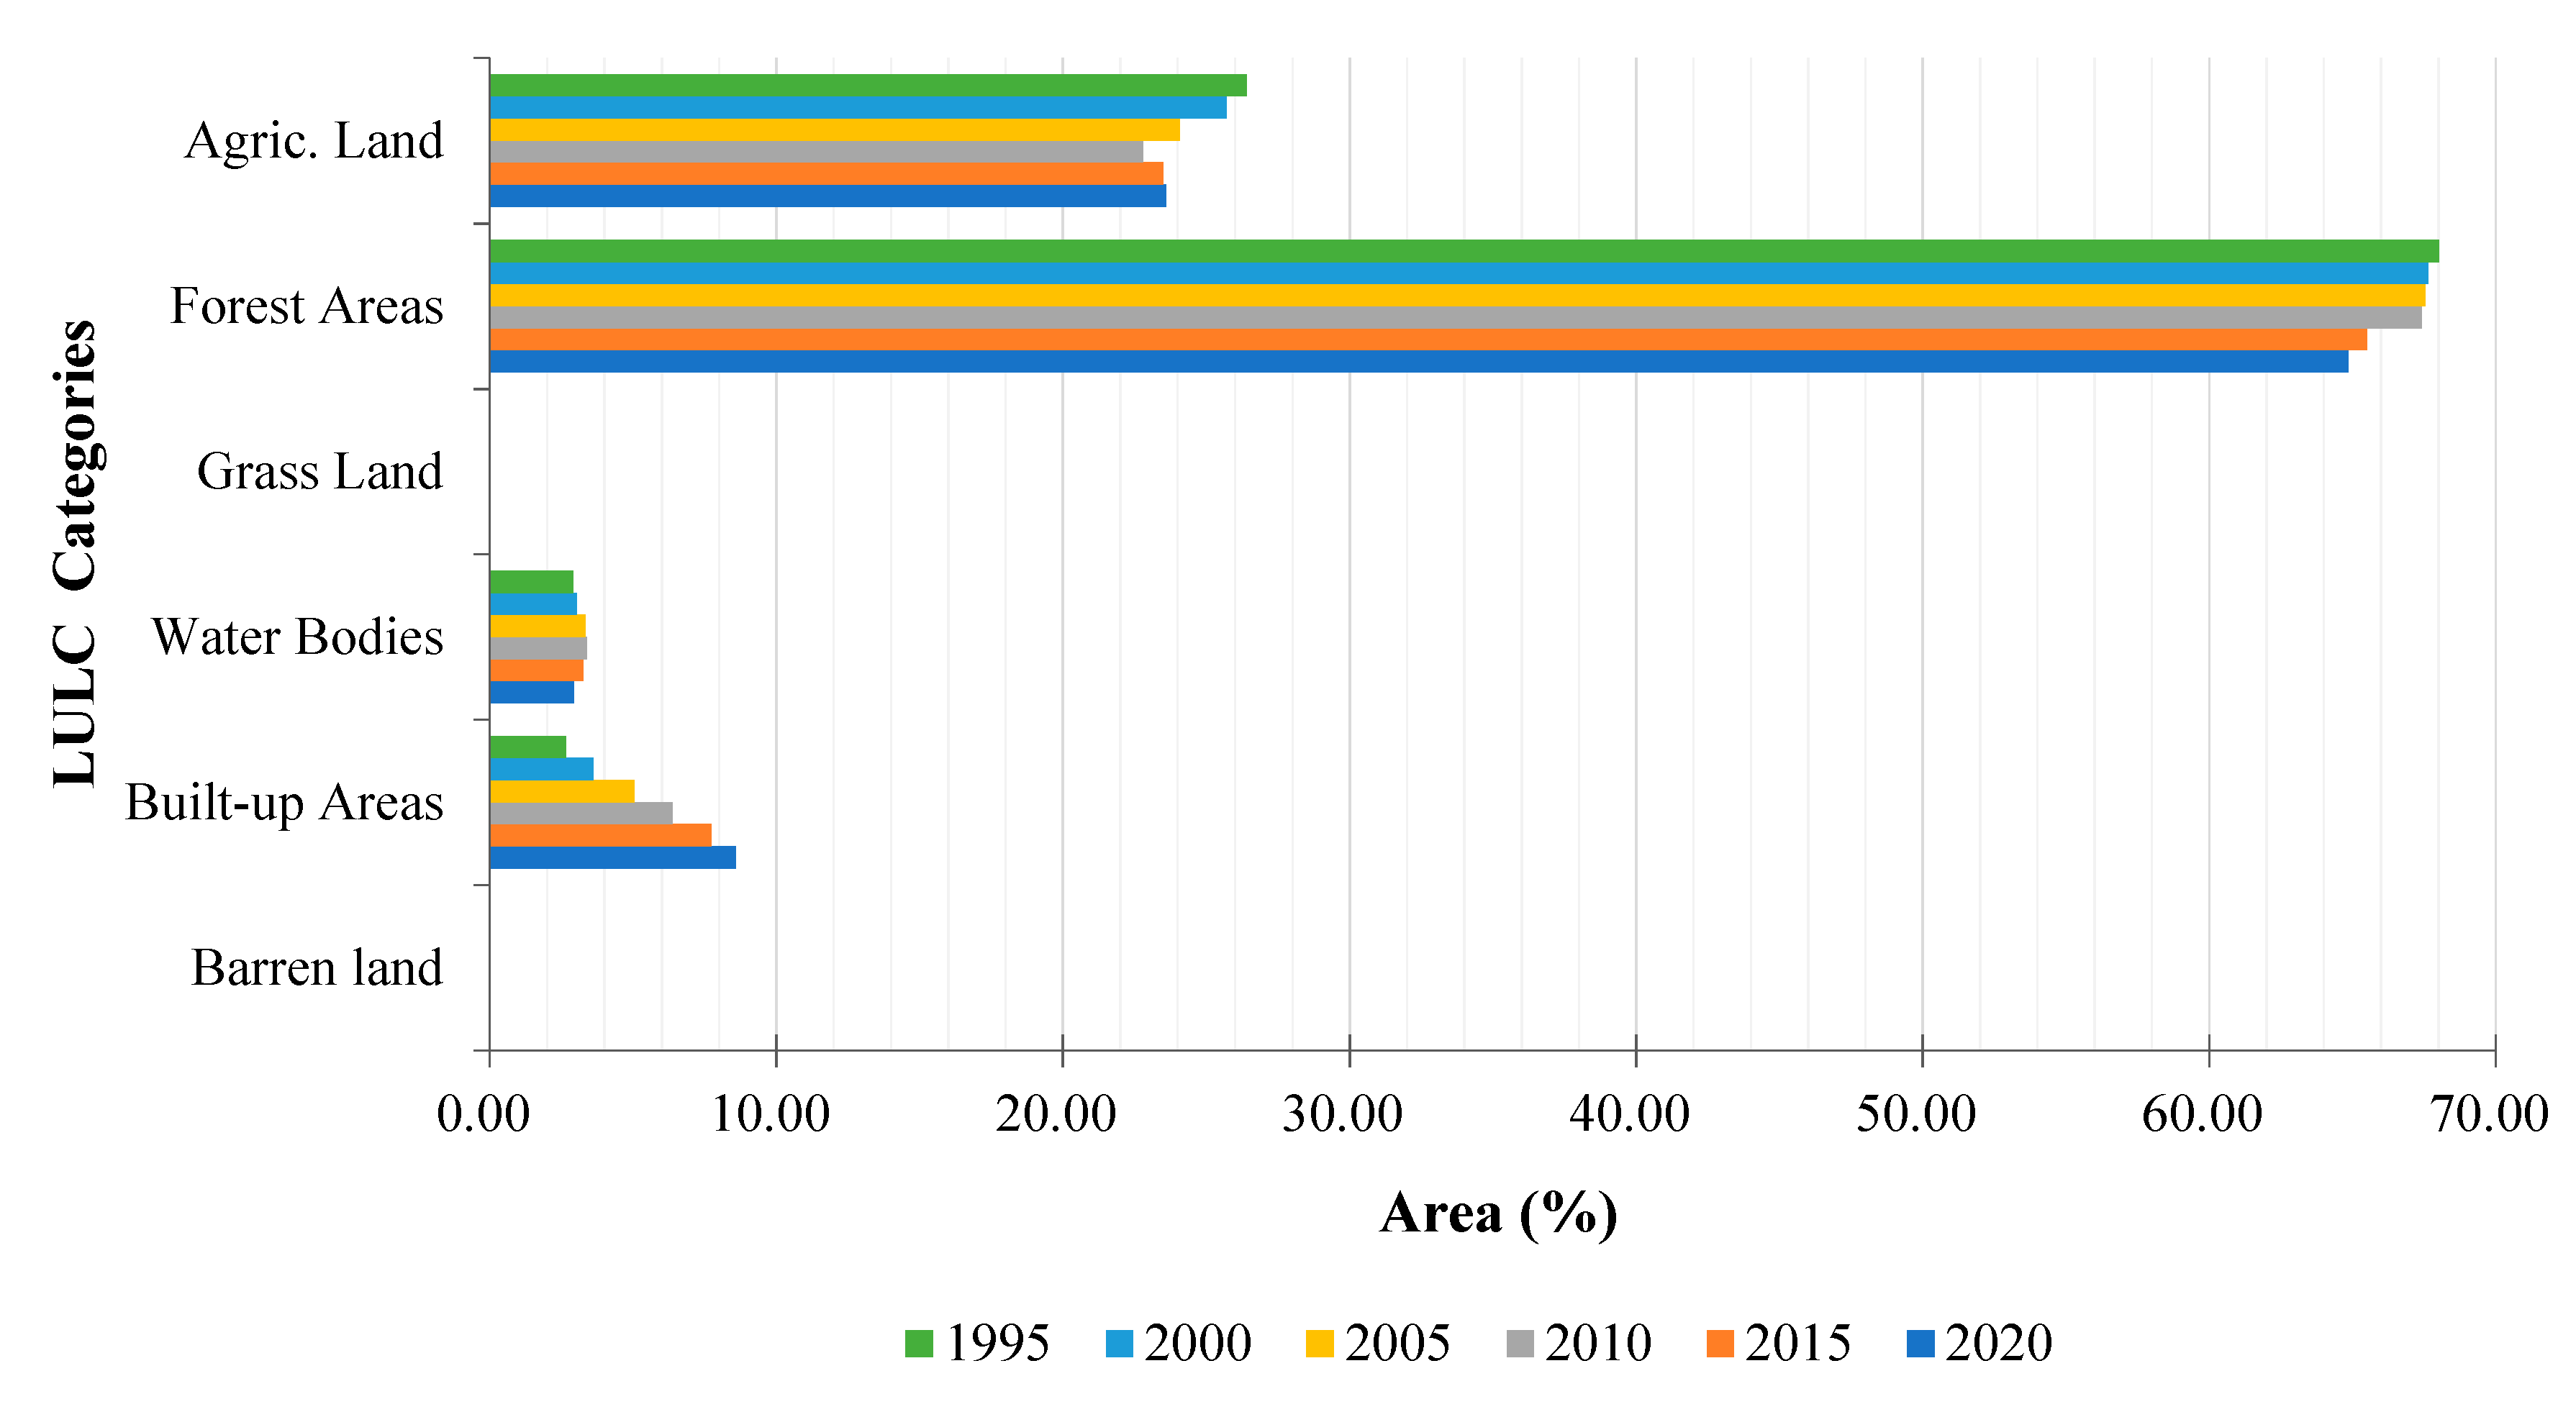
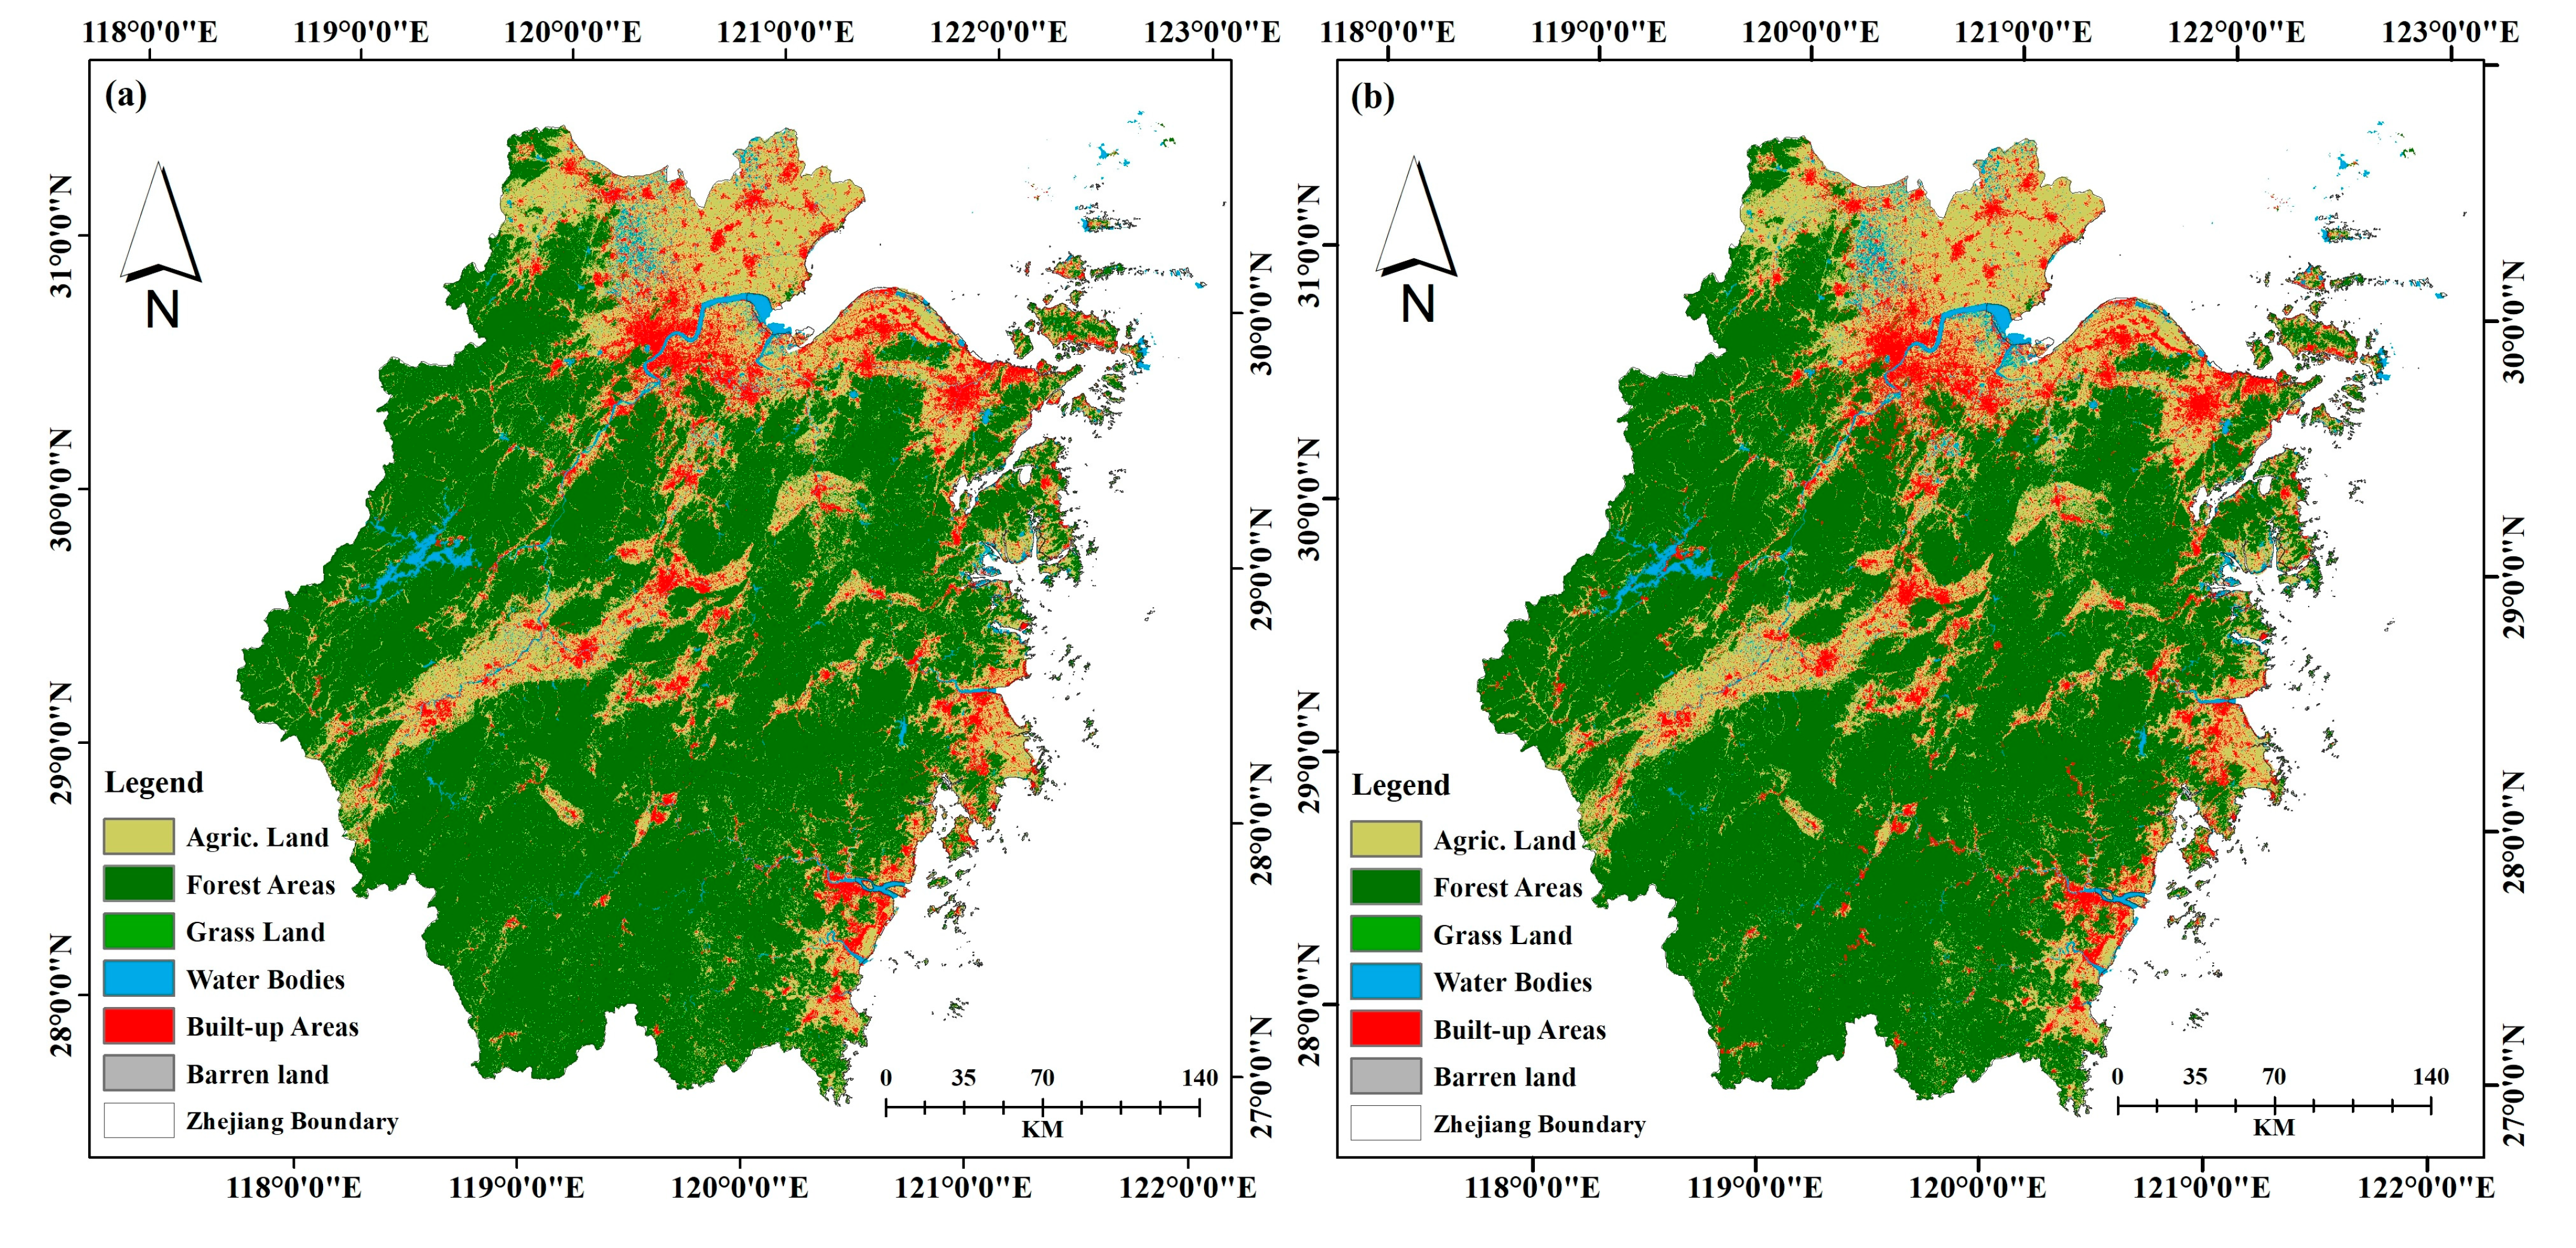
3.1. Spatial and Quantitative Distribution of LULC

The LULC mapping and statistical distributions between 1995 and 2020 are presented in Figure 3 and Table 3, respectively. The result indicates that the study area’s most predominant land use class was forest areas, accounting for over 66.89% of the total landmass in Zhejiang Province, followed by agricultural land and built-up areas, which accounted for over 24.34% and 8.59%, respectively. The result further indicated the differences in the spatial distribution of other LULC classes, as shown in Figure 4.
The spatial distribution of LULC indicates that Zhejiang Province has expanded rapidly over the last 25 years, with a built-up area development of approximately 6126.93 km2 (5.94%), while forest areas declined from 70,133.46 km2 (68.01%) to 66,880.99 km2 (64.86%). Similarly, other LULC categories witnessed positive and negative changes between 1995 and 2020. Barren lands and water bodies increased slightly, with 1.47 km2 (0.00%) and 24.20 km2 (0.02%), respectively, while agricultural land and grassland indicated a substantial and slight decline of −2885.13 km2 (−2.80%) and −15.00 km2 (−0.01%) from 1995 to 2020. The change trend of the study area’s spatial distribution, as presented in Table 4, shows numerous alterations in the different LULC categories. The built-up areas indicated the most prominent urban expansion between 1995 and 2020, with an annual change rate of about 306.35 km2, while forest areas and agricultural land declined annually by approximately −162.62 km2 and −144.26 km2, respectively.

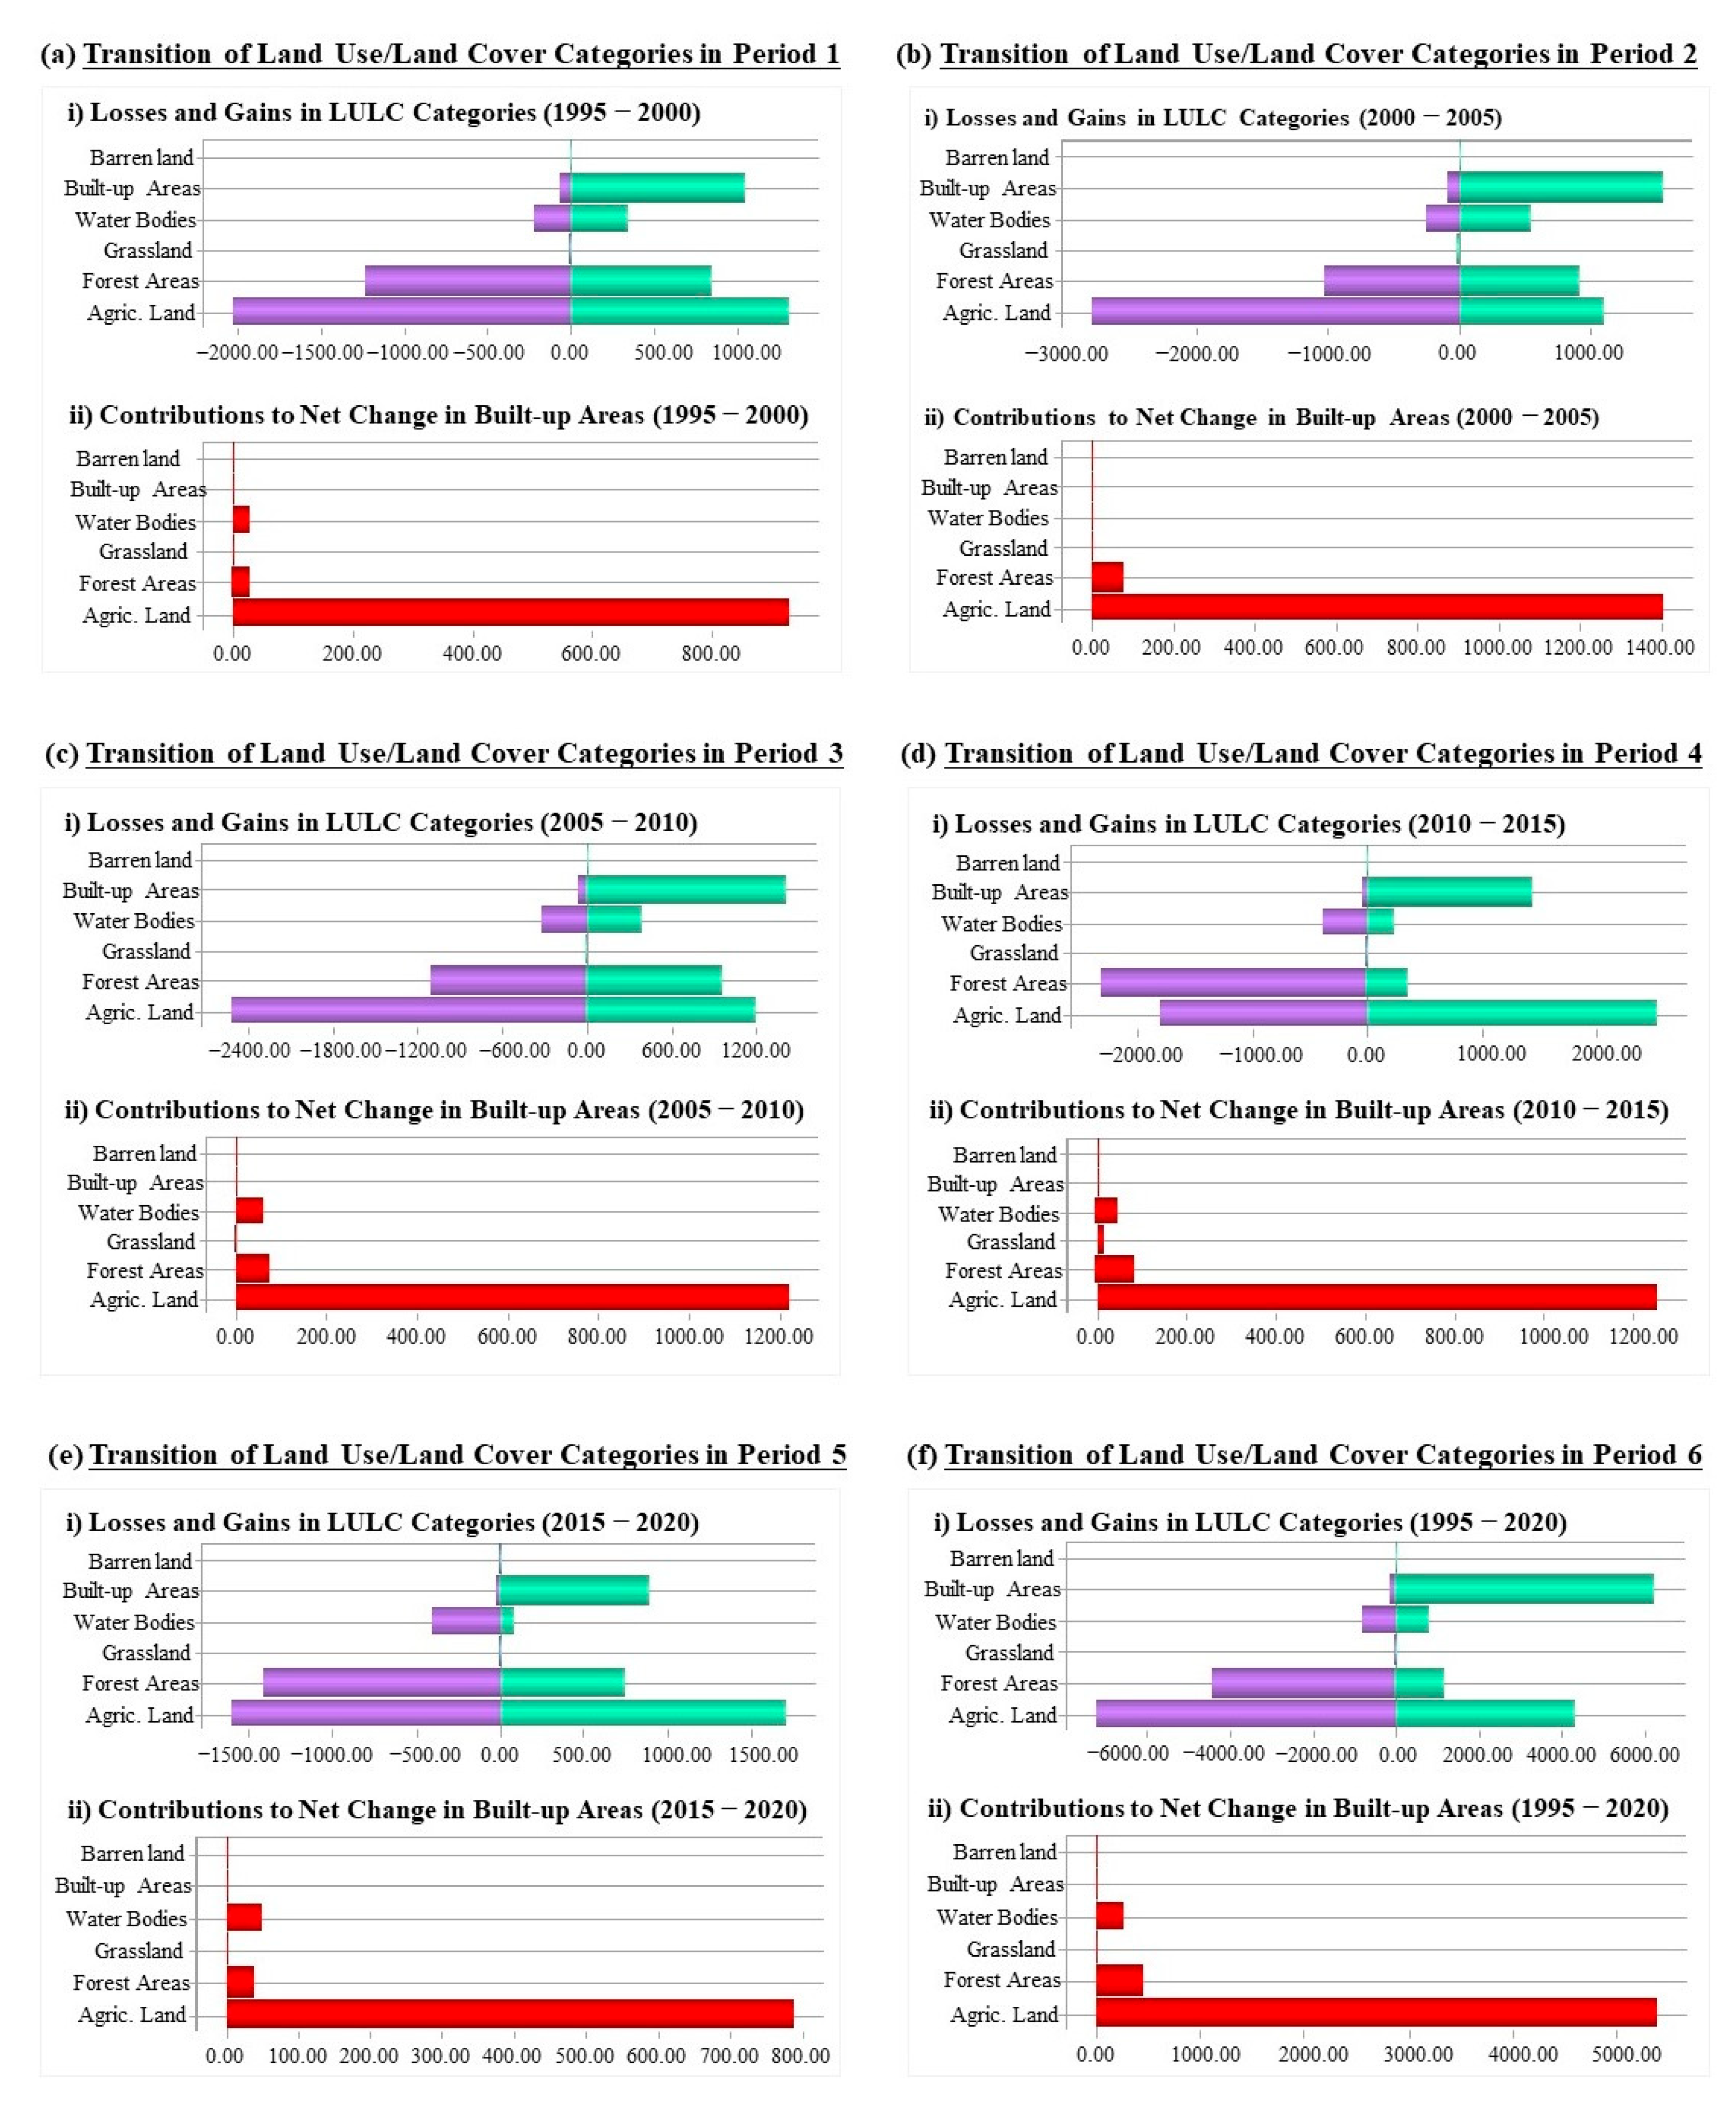
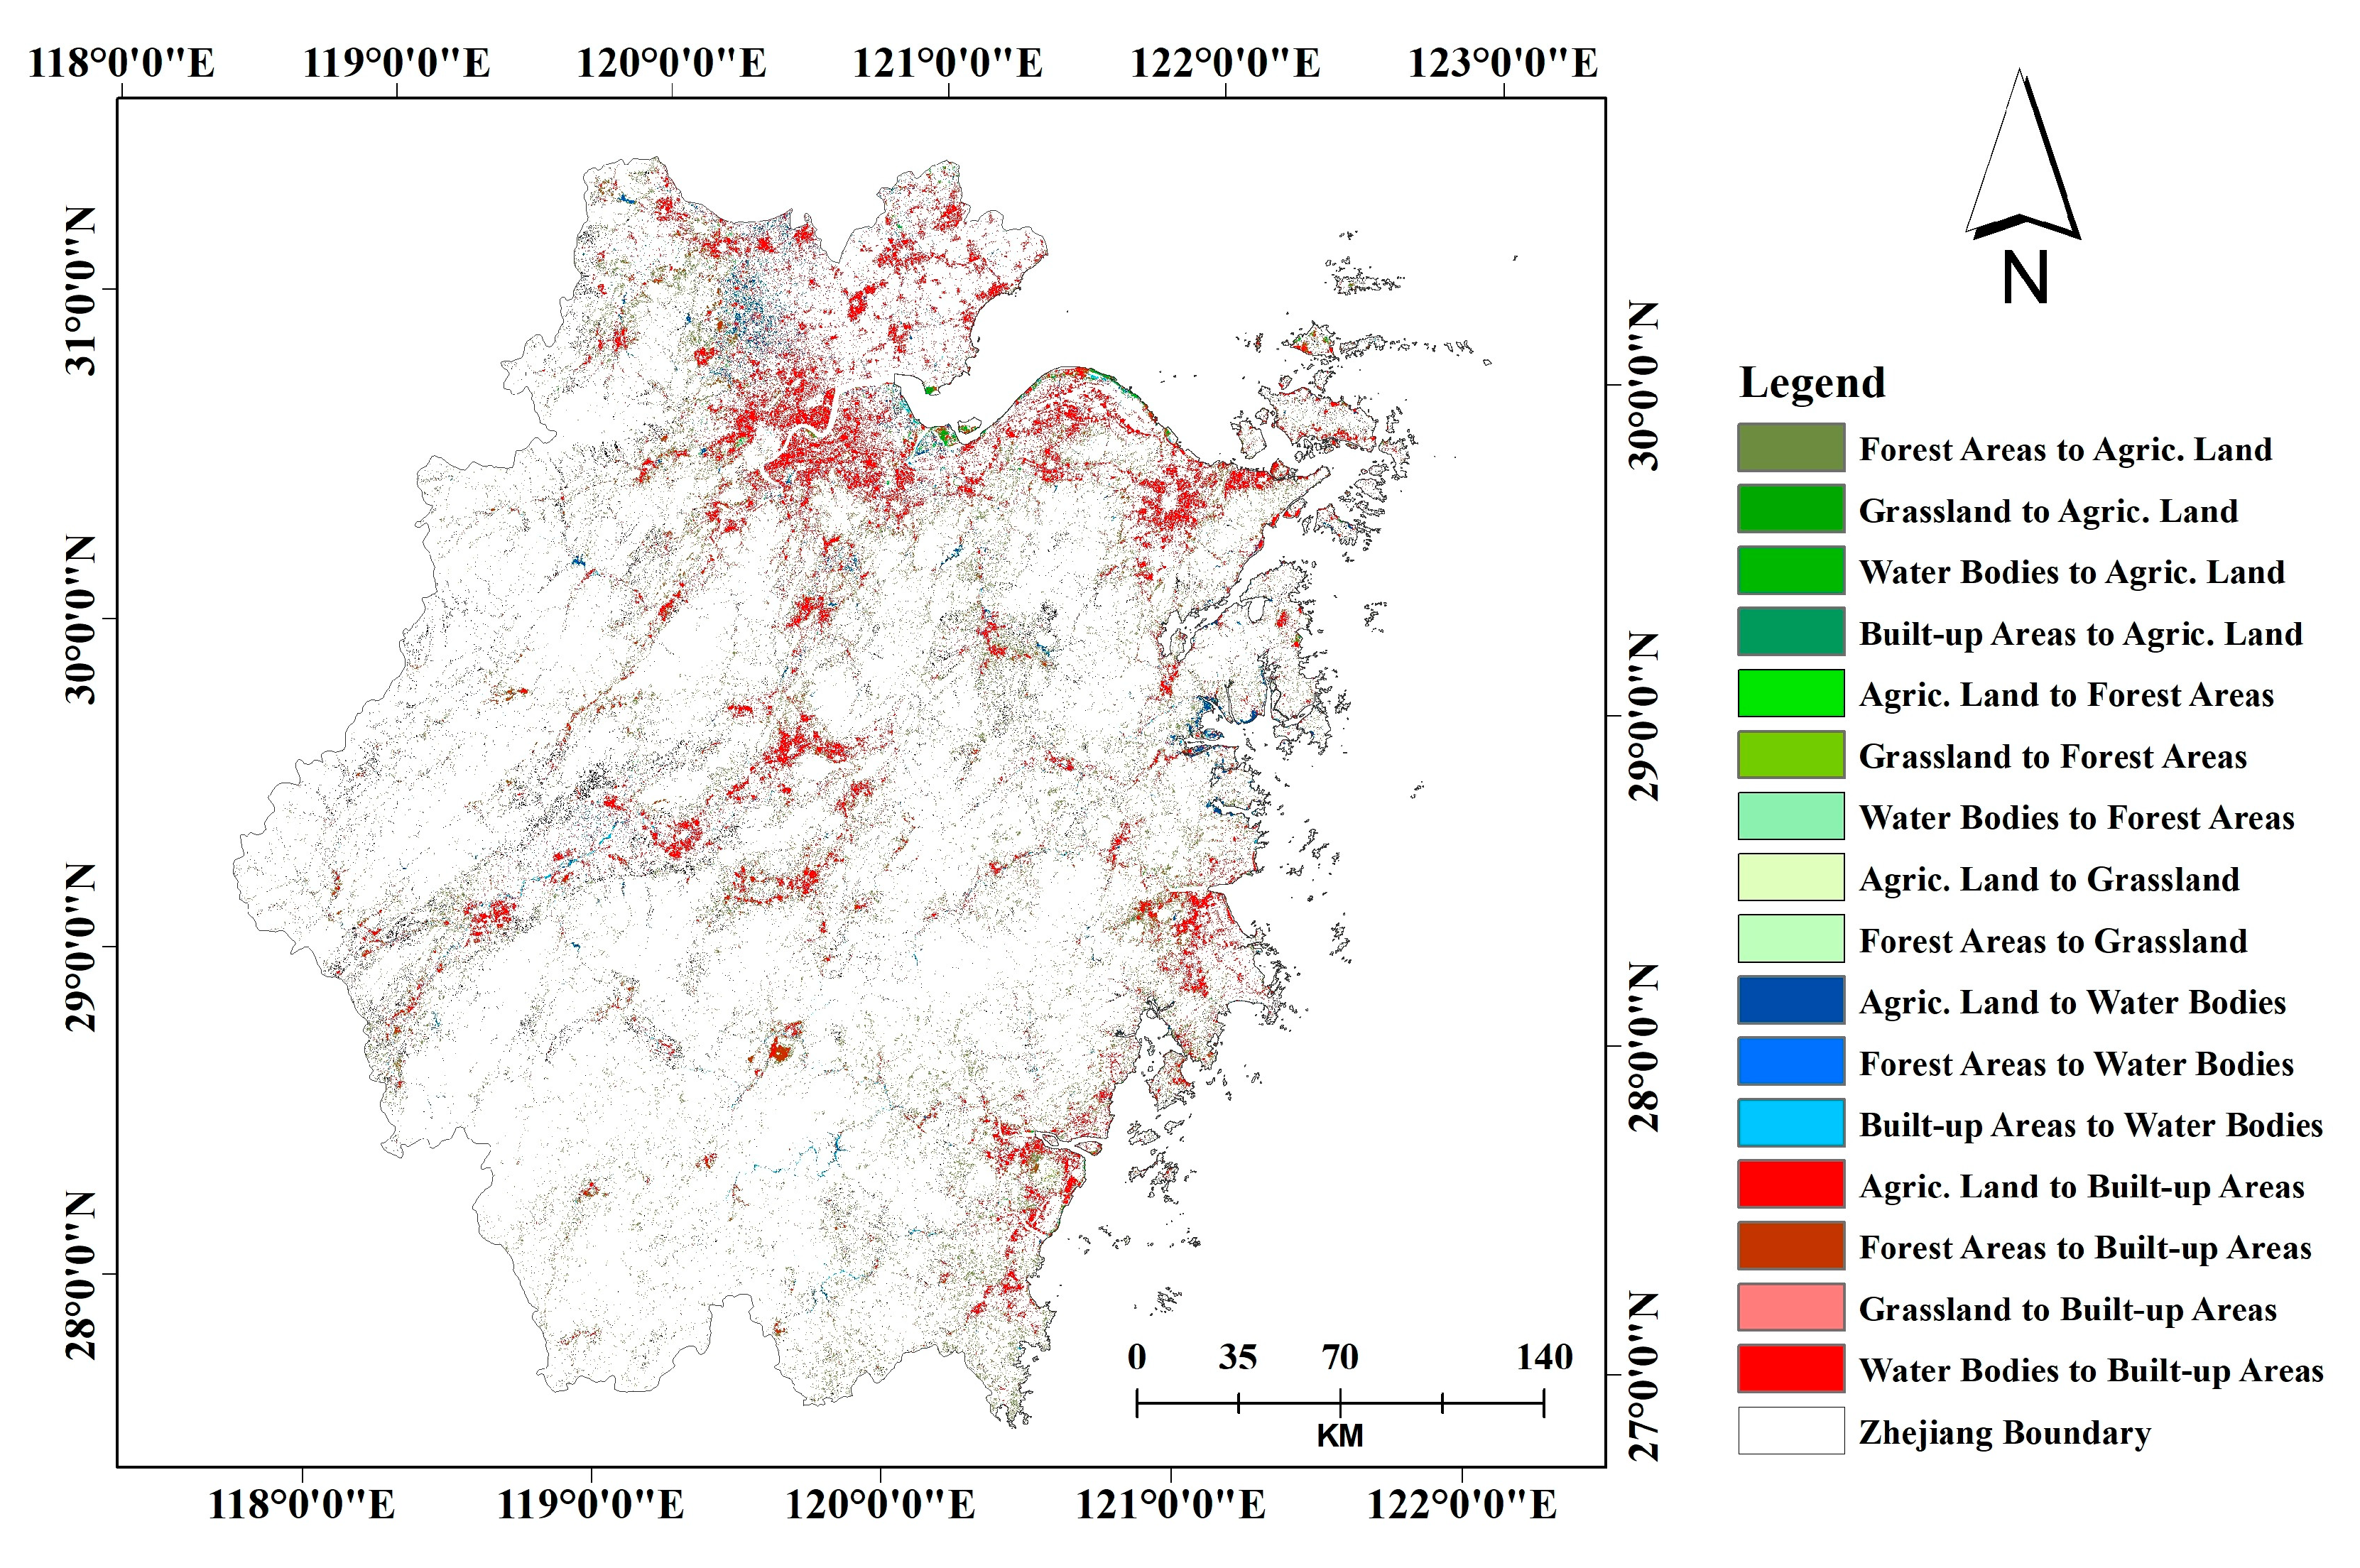
3.2. Spatiotemporal Changes in Land Uses

We analyzed the change dynamics of the six (6) categories of land uses during the historical period between 1995 and 2020 using a time span of five (5) years. The results are presented in Figure 5, which indicates numerous variations in the study area’s LULC categories with notable losses and gains and the contributions of the different land uses to the urban growth of the province.
In Period 1, i.e., 1995–2000, the study area’s barren land lost an area of −0.14 km2 and gained 0.05 km2, witnessing a net loss of −0.09 km2 (−42.86%). Built-up areas lost −60.92 km2 and gained 1055.08 km2, experiencing a net gain of 994.16 km2 (26.71%). Water bodies witnessed a 116.42 km2 (3.73%), comprising an area loss of −228.35 km2 and a 344.77 km2 gain. The grassland of the region observed a net change of −7.76 km2, with a decline of –9.10 km2 and an increase of 1.34 km2, while forest and agricultural areas witnessed a substantial decrease of −386.87 km2 and −715.86 km2, respectively, between 1995 and 2000.
In Period 2, i.e., 2000–2005, barren land, grassland, built-up areas, and water bodies witnessed considerable growth, with an increase of 0.11 km2 (34.38%), 7.41 km2 (30.76%), 1477.72 km2 (28.42%), and 311.25 km2 (9.07%), respectively. Built-up areas observed the most significant increase with 1477.72 km2 (28.42%), comprising an area decline of −83.11 km2 and an increase of 1560.83 km2, while agricultural land witnessed the most substantial decline with an area of –1687.46 km2 (−6.80%), comprising a loss of −2790.23 km2 and a gain of 1102.77 km2. Forest areas also observed a decline of approximately −109.03 km2 (−0.16%).
In Period 3, i.e., 2005–2010, similar change trends were observed in water bodies, barren land, grassland, and built-up areas within the period between 2000 and 2005. However, the undeveloped areas of Zhejiang Province witnessed the most significant growth during this period, with an increase of approximately 0.81 km2 (71.68%), followed by built-up areas and grassland with 1364.15 km2 (20.78%) and 4.77 km2 (16.53%), respectively. Similar to Period 2, agricultural land observed the most significant decline with an area of about −1314.57 km2 (−5.59%), while forest areas declined by −124.85 km2 (−0.18%).
In Period 4, i.e., 2010–2015, contrary to the earlier trend, the agricultural land of the study area witnessed an increase of 722.64 km2 (2.98%), while grassland and water bodies declined by −13.40 km2 (−86.68%) and −151.86 km2 (−4.53%), respectively. Similar to the previous periods, built-up areas observed an expansion of 1410.91 km2 (17.69%) between 2010 and 2015. Barren land increased by 0.14 km2 (11.02%). During this period, the result indicates that the most significant growth and decline were witnessed in built-up areas and grassland, respectively.
In Period 5, i.e., 2015–2020, similar land use changes were observed as the previous 5 years. The study area’s grassland, water bodies, and forestland declined by approximately −6.02 km2 (−63.77%), −321.30 km2 (−10.61%), and −663.29 km2 (−0.99%), respectively, while barren land, built-up areas, and cultivated land expanded by 0.50 km2 (28.25%), 879.99 km2 (9.94%), and 110.12 km2 (0.45%), respectively. The result indicates that the most significant land use increase was witnessed in barren land, while grassland witnessed the most significant decline during this period.
Over the entire period between 1995 and 2020, i.e., Period 6, built-up areas observed a substantial urban expansion with approximately 6126.83 km2, while land uses such as forest areas, agricultural land, and grassland declined by −2885.13 km2, −3252.47 km2, and −15.00 km2, respectively. The LULC classes that led to the significant urban growth between 1995 and 2020 comprise mainly the transition of 5392.96 km2 of agricultural lands into urban growth areas, followed by the transformation of forest areas and water bodies by approximately 463.48 km2 and 266.38 km2, respectively. The numerous transition between the LULC categories is presented in Figure 6.

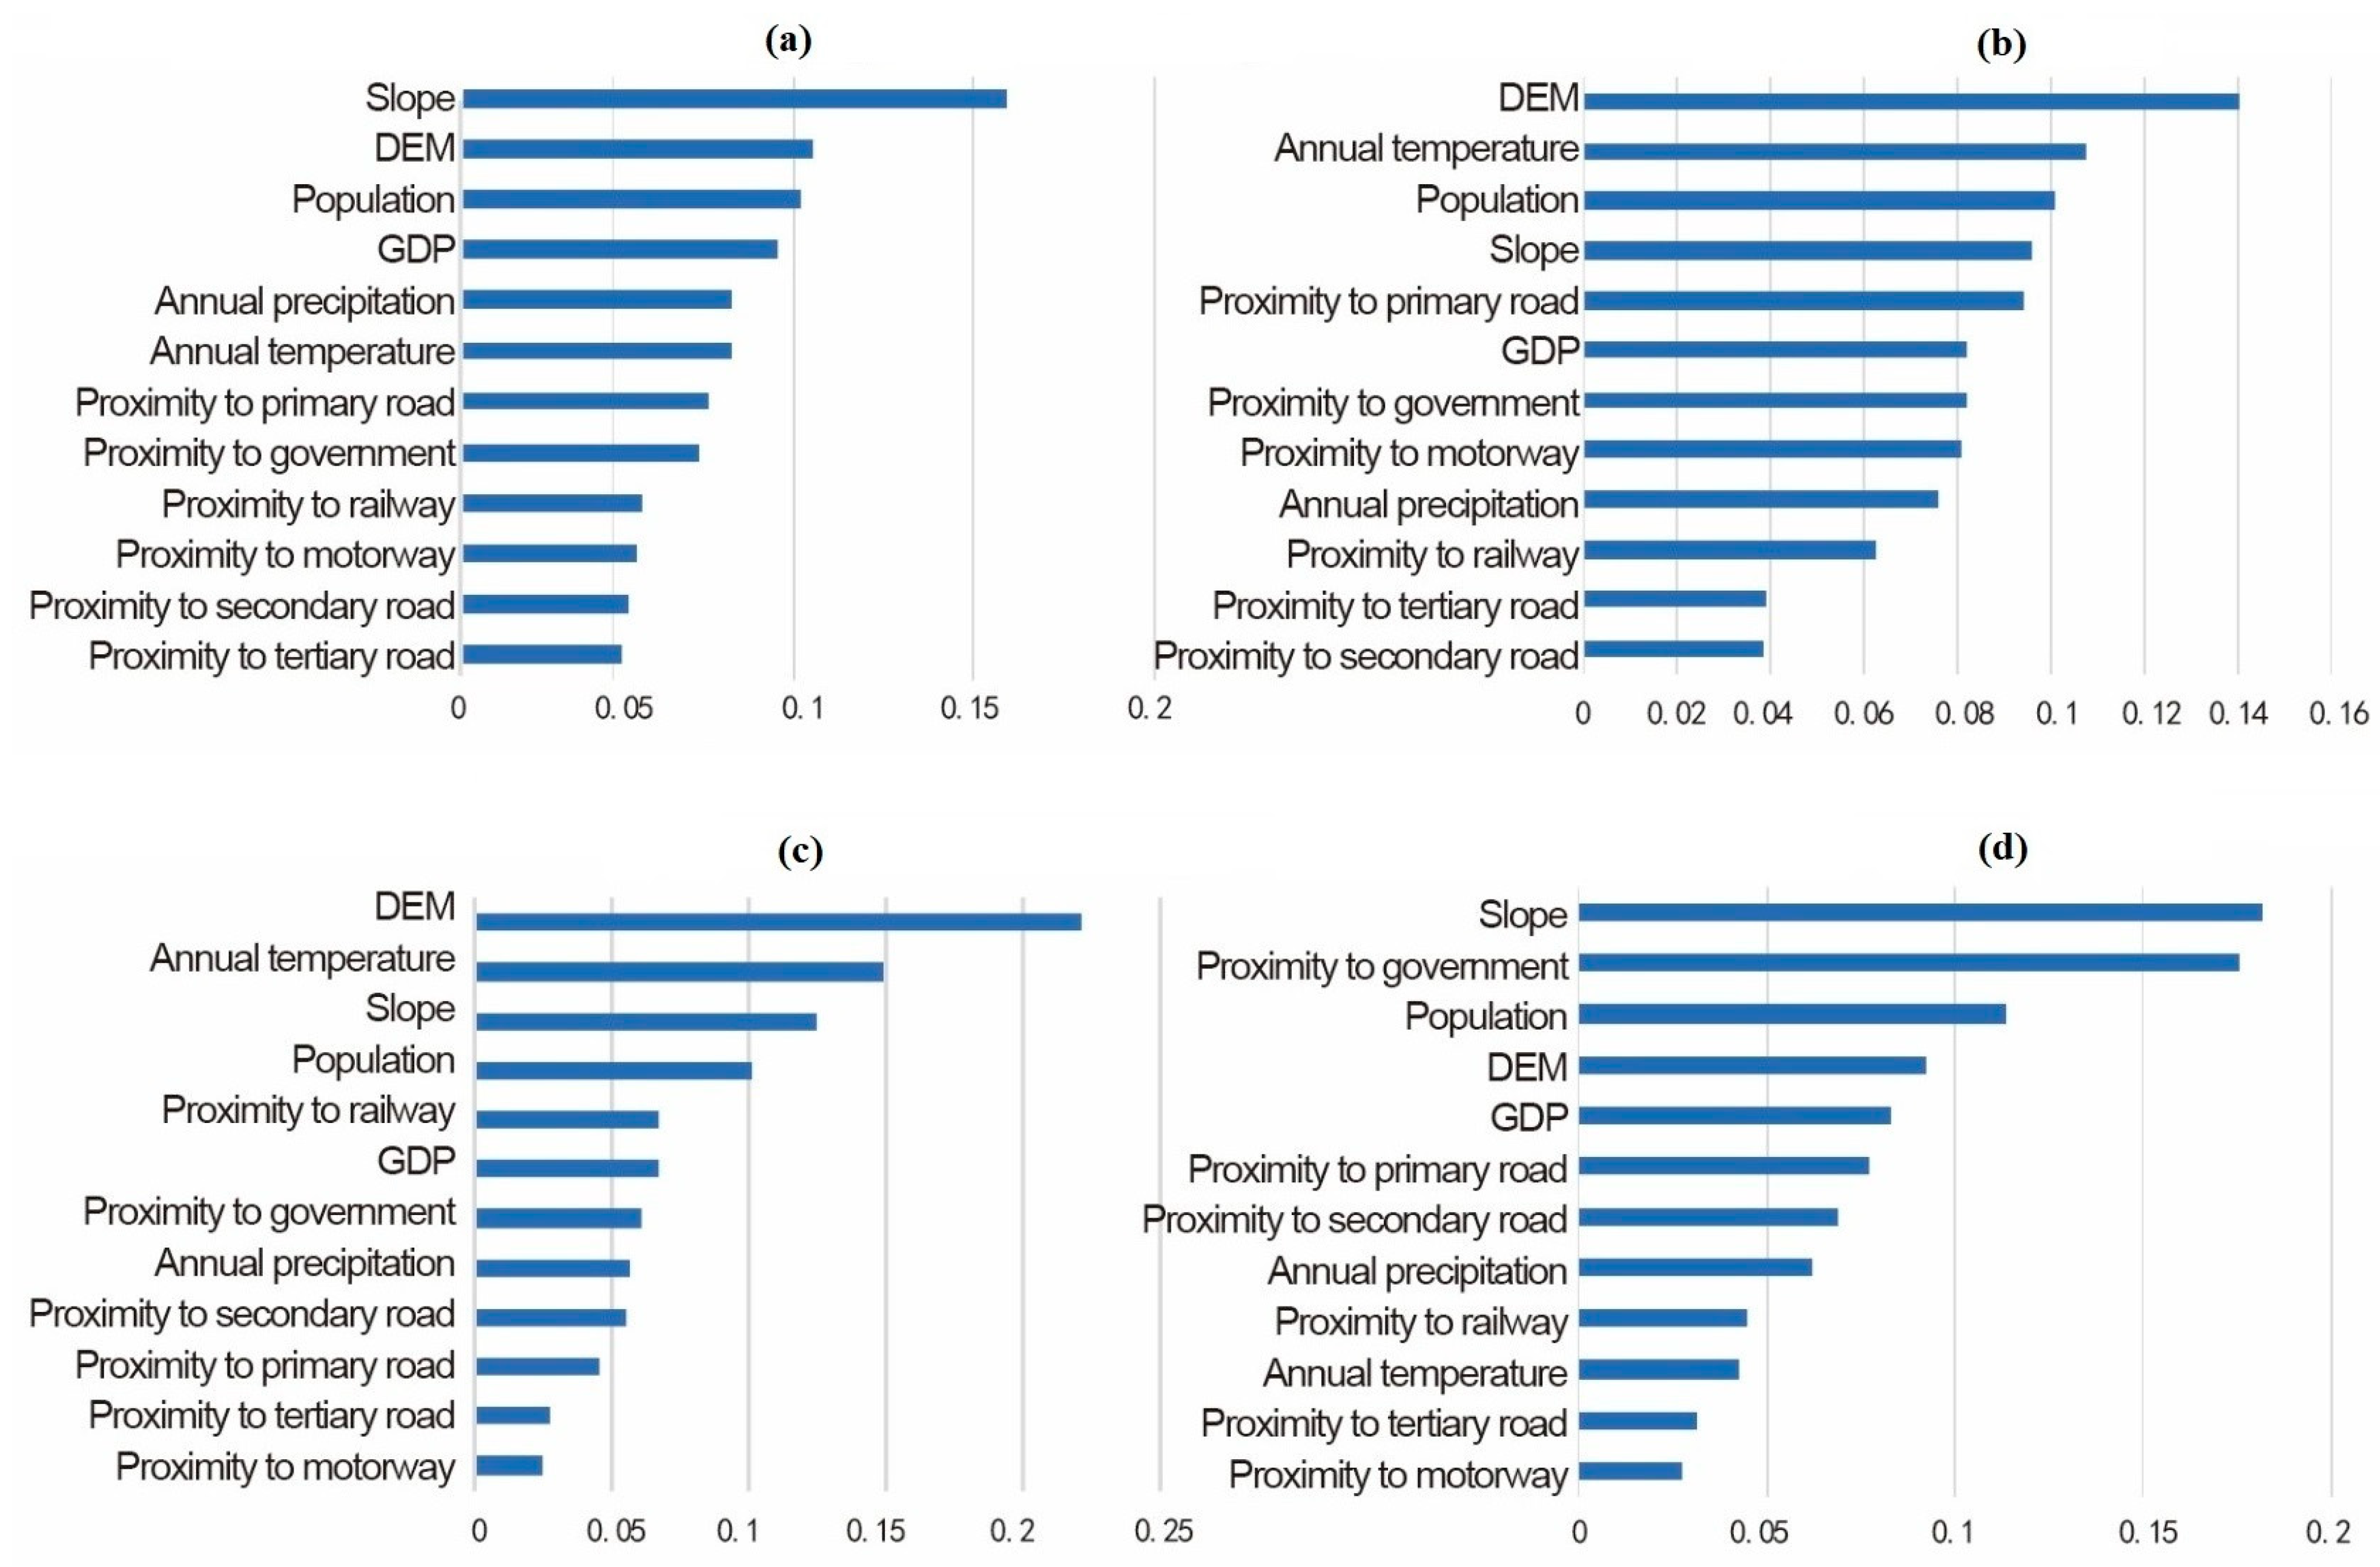
3.3. Underlying Drivers of LULC Changes Using LEAS

The study employed a PLUS model using the LEAS module to examine the relationship between the various alterations in land uses and the factors that influence these changes. The result of the different variables that influenced the LULC changes in Zhejiang Province between 1995 and 2020 are presented in Figure 7.
Figure 7a highlights the significance of each variable to the changes in the agricultural land of Zhejiang Province. The result indicates that slope contributes most substantially to the agricultural land transition, followed by elevation and population. The greater the slope, the more prevalent the area becomes to erosion-related challenges. The result revealed proximity to the tertiary and secondary roads to have the least influence on the transformation of agricultural areas. These findings may be attributed to the importance of slope and elevation in consideration of China’s agricultural areas.
Figure 7b shows the contribution of each variable to forest land changes. The elevation of Zhejiang Province exhibited the most prominent influence on the forest area changes, followed by temperature, population, and slope. Similar to agricultural changes, proximity to secondary and tertiary roads indicated the least influence on the transformation of forest areas. These influences could be associated with the natural correlation between altitude and temperature, which significantly impacts the growth of trees.
Figure 7c,d depict the contribution of each variable to the changes in water bodies and built-up areas. Slope had the most significant influence on changes in built-up areas, followed by proximity to government and population. The built-up areas expand outward around the various administrative centers in the major cities of the province. Such cities have constantly attracted large urban population, contributing to the study area’s rapid urbanization.

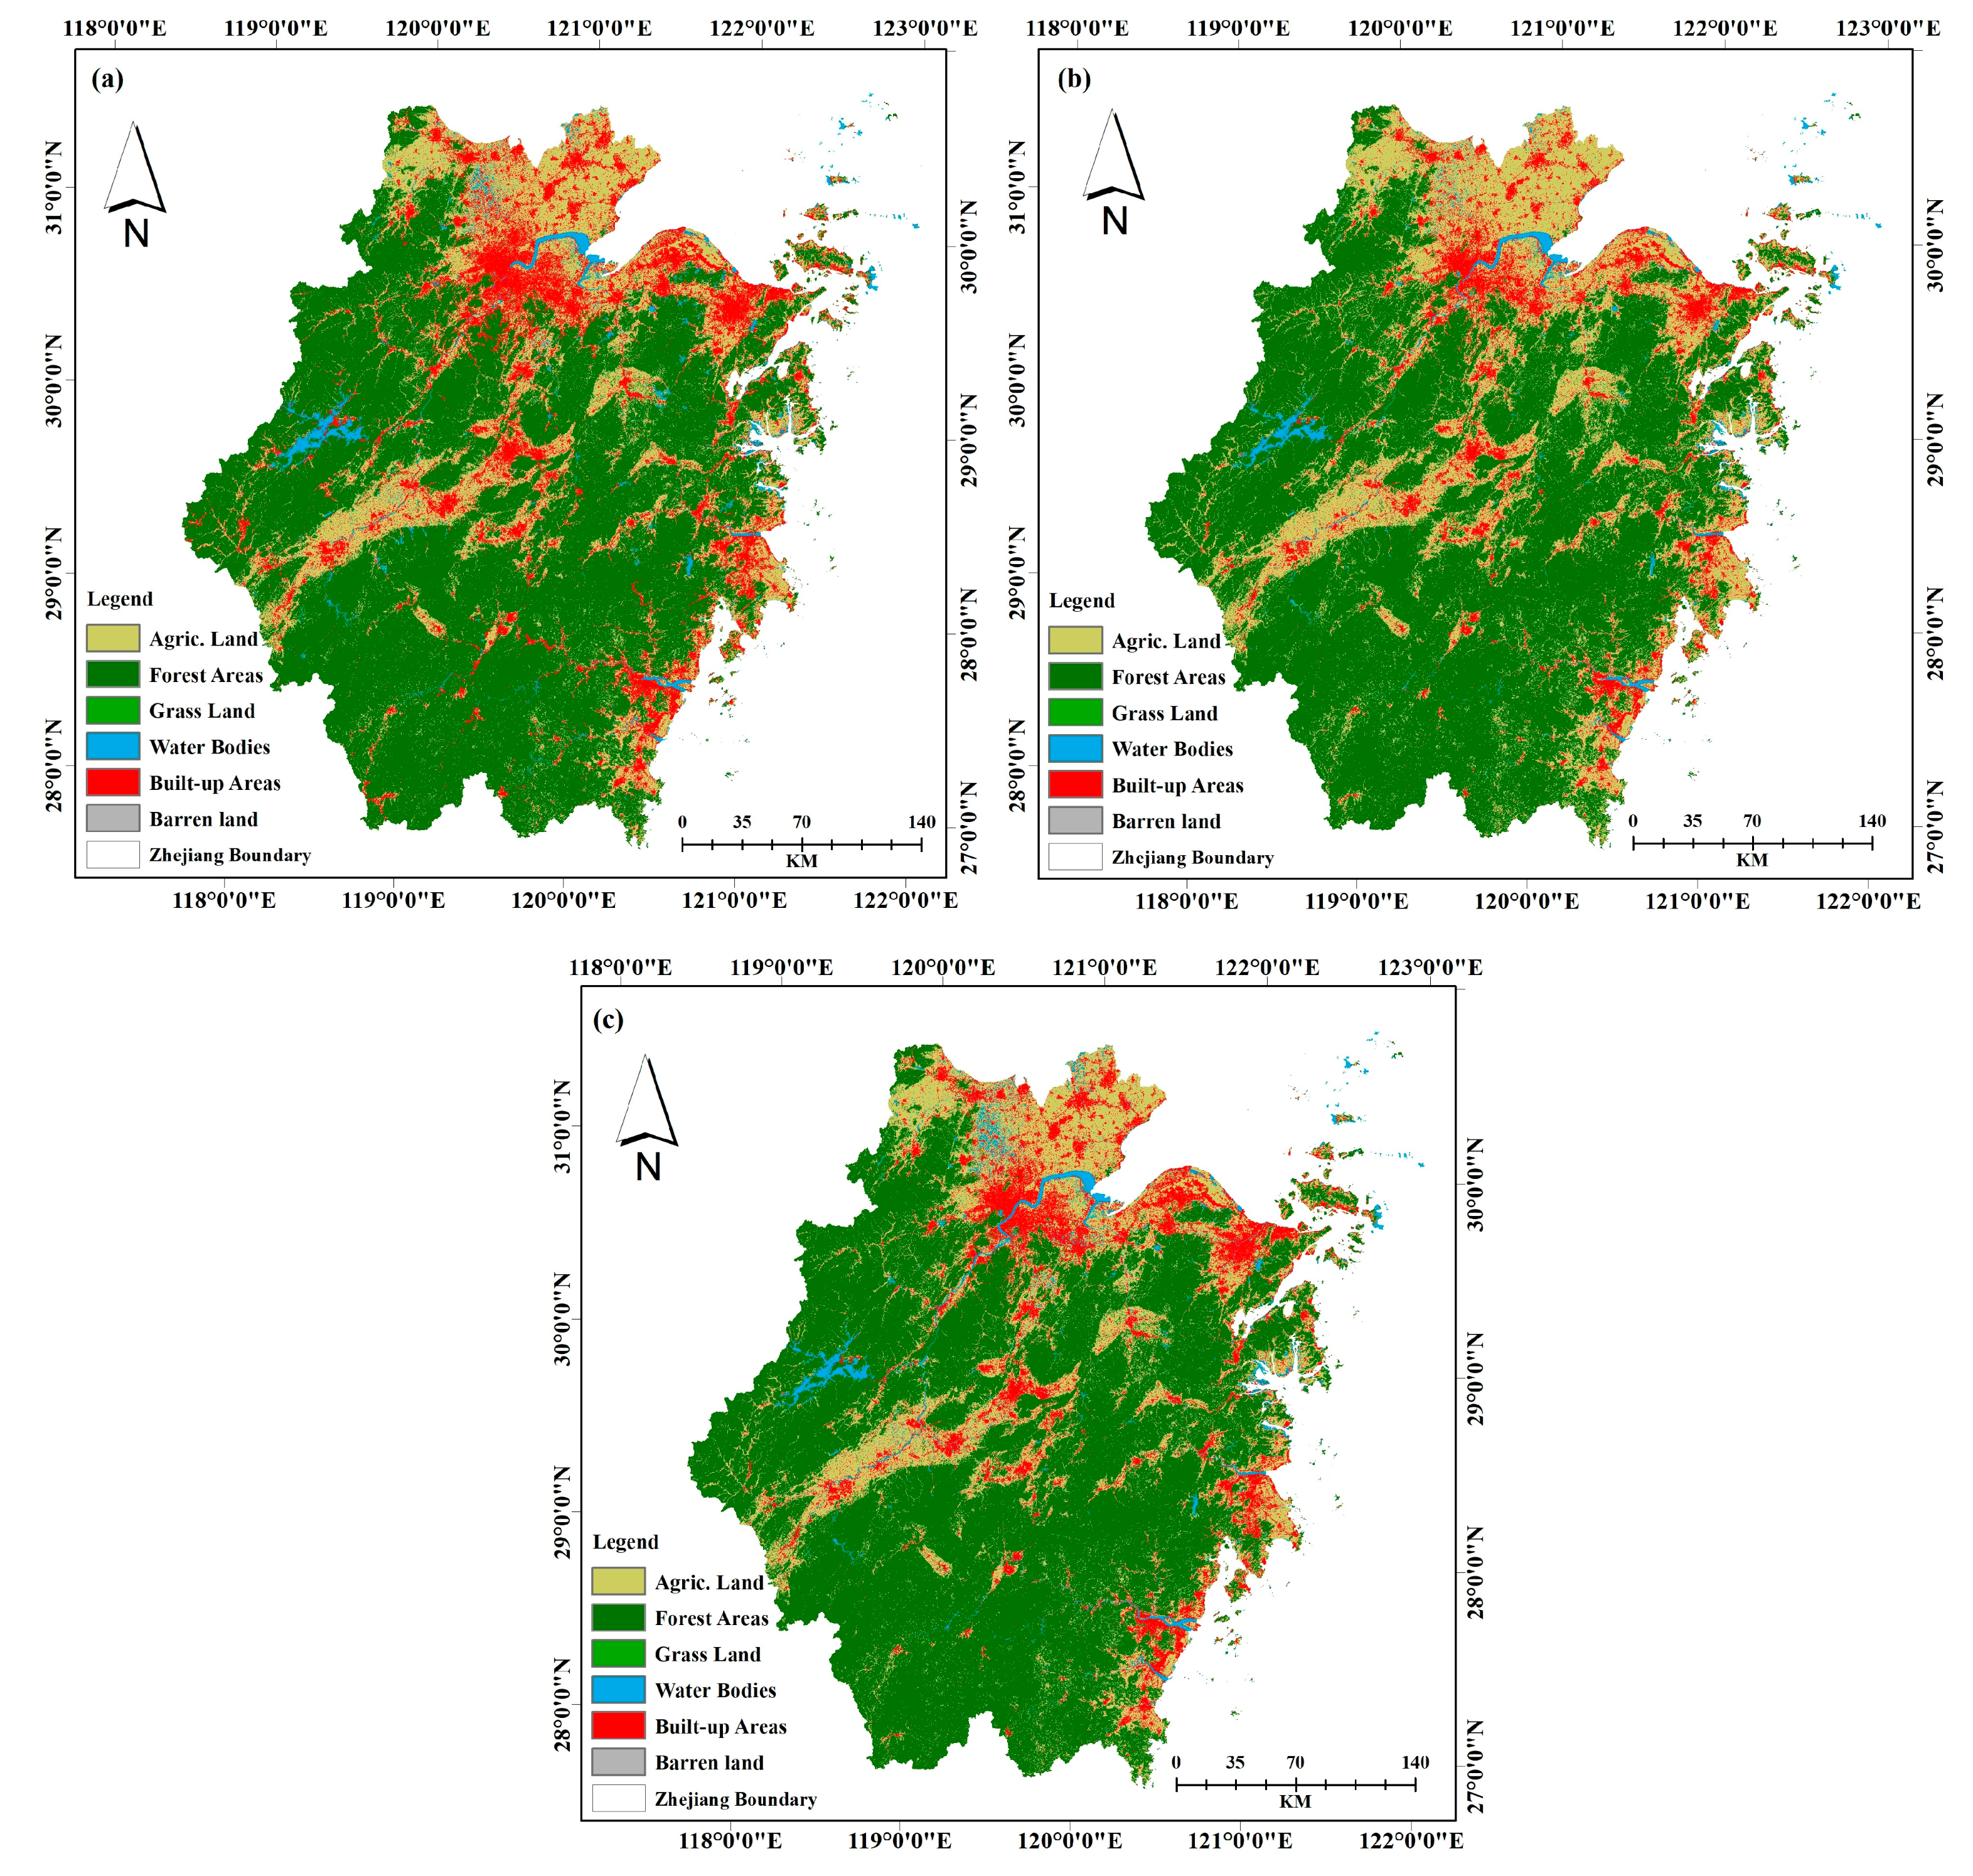
3.4. Future Prediction of LULC, i.e., 2040

Multiscenario Prediction Using a PLUS Model

The study employed a novel method that integrated a PLUS model with CA model to forecast the anticipated pattern of future land use/land cover (LULC) within Zhejiang Province, China, specifically for the year 2040. We examined the dynamics of LULC alterations and predicted future land uses under three (3) different scenarios. Under the baseline scenario (BLS), it is assumed that government policies will not significantly impact land use changes during 2020–2040. The study area’s alteration of LULC is expected to follow a consistent pattern observed between 1995 and 2020. Based on this assumption, the cultivated land protection scenario (CLPS) strategy involves strict control over built-up areas, improvement of land utilization rate, and control of agricultural land conversion into built-up areas. By incorporating the cultivated land protection scenario (CLPS) into our study, we forecasted the potential consequences of land use policies and practices that prioritize the conservation of agricultural areas. The CLPS scenario helps in assessing the long-term impact of measures aimed at maintaining agricultural land productivity, mitigating soil degradation, and sustaining food production systems. The ecological protection strategy (EPS) places emphasis on the conservation of forest areas, grassland, and water bodies. It strictly controls the alteration of these three LULC categories into built-up areas. By incorporating the ecological protection scenario (EPS) in our study, we sought to explore the potential outcomes of policies and interventions in safeguarding the ecological integrity of the study area. The EPS scenario helps assess the implications of prioritizing conservation efforts, such as habitat preservation, biodiversity conservation, and ecosystem restoration.
In the present study, we parameterized the matrix of transition cost with the settings of the cost matrix to develop the three prediction scenarios presented in Table 5, as suggested in previous studies [61,62]. Within the matrix, a value of one (1) signifies that a LULC category is allowed to be converted into another, while a value of zero (0) signifies the nonconvertibility of the LULC category.
To forecast future LULC, we combined a random forest (RF) algorithm with multiclass random seeds to accurately model the land use demand of the six LULC categories in Zhejiang Province under three scenarios. The result of the 2040 multiscenario prediction is spatially mapped and presented in Figure 8.
Under the baseline scenario (BLS), significant transformation will occur in the forest areas, agricultural land, and built-up areas of Zhejiang Province over the next 20 years, i.e., 2040. The result indicates that between 2020 and 2040, the built-up areas will expand by approximately 51.22%, increasing by 4501.62 km2, while forest areas and agricultural land will decline by −2436.72 km2 and −1779.47 km2, respectively. Water bodies are expected to decrease by −283.38 km2, and grassland will experience a reduction of −2.24 km2. In contrast, barren land is projected to increase slightly by 0.19 km2.
Under the cultivated land protection scenario (CLPS), substantial changes will occur in the agricultural areas of Zhejiang Province, experiencing an area increase of 3114.70 km2 between 2020 and 2040. Forest areas and water bodies will decline with −2785.90 km2 and −864.79 km2, respectively, while built-up areas will slightly expand with 538.64 km2. Grassland will decrease slightly by −2.24 km2, and barren land will decline by −0.41 km2.
Under the ecological protection scenario (EPS), built-up land will expand by 1776.16 km2 in 2040. However, agricultural land will significantly decline to −1779.47 km2, while grassland and barren land will slightly decrease by −1.13 km2 and −0.17 km2. Compared to the other two scenarios, forest areas are expected to increase slightly under the EPS with about 1.13 km2 from 2020 to 2040, mainly due to effective ecological protection. The quantitative data for the different LULC categories, as indicated in the three prediction scenarios, are presented in Table 6.

3.5. Result of the Validated PLUS Model

The PLUS model was validated using the LULC maps of Zhejiang Province in 2015 and 2020. The validation result indicated a significant consistency between the real and simulated maps of 2020, as shown in Figure 9. It presented an accuracy of 95.60% and a Kappa coefficient of 0.915, suggesting a satisfactory simulation model. Hence, the validated PLUS model can effectively predict future LULC.

4. Discussion

4.1. Trends of Urban LULC Changes

In this section, we analyze the spatiotemporal changes in the urban LULC dynamics of Zhejiang Province, China, over the last 25 years. The study utilized the change modeler of TerrSet Geospatial software 19.0.6 to determine the losses and gains experienced by the individual classes of land uses. The overall trend indicated numerous transitions in the different LULC categories, with the built-up areas of the province showing the most substantial growth. The result conforms to the outcome of an earlier study that indicated the rapid urbanization of most Chinese cities after the country’s “1979 reform and opening-up” policy [63,64]. The spatial result also aligns with a previous study conducted in 261 cities in China, which revealed a total annual urban expansion of approximately 1869.81 km2 between 1990 and 2015 [65]. The result also conforms to another study conducted in 36 major cities in China; the analysis of the land use changes revealed substantial growth and annual urban expansion of 15.51 km2 per city, suggesting multiple-fold urban development between 1986 and 2015 [66]. The rapid urban expansion of Zhejiang Province could also be attributed to the population growth and socioeconomic development of the region. According to China’s official estimate [67], the total population of Zhejiang Province has significantly increased to 64.57 million people in 2020, witnessing the second largest growth among all the provinces in China, with an increase of 10.14 million people between 2010 and 2020. The province also experienced a substantial increase in gross domestic product (GDP) from CNY 2.74 trillion (USD 405.2 billion) in 2010 to CNY 6.46 trillion (USD 936.8 billion) in 2020, ranking fourth in China’s provinces.

4.2. Driving Factors of Urban LULC Changes

The study indicates that the alteration of LULC results from the different spatial variables comprising mainly natural and anthropogenic factors [68]. The natural factors include the DEM, slope, precipitation, temperature, distance to road networks, and urban administrative center, while the anthropogenic factors comprise mainly socioeconomic data that include gross domestic product and population [69]. Wang and Lu analyzed land use transformation in 55 mountainous cities in China [70]. The result identified population growth and development policies, i.e., urban, transport, and economic, as the main factors that influences the expansion of land uses. In our study, we utilized the PLUS model’s LEAS module to analyze the relationship between LULC changes and the different spatial driving factors. Our results revealed the significant influence of physical and socioeconomic factors that include slope, DEM, population, gross domestic product (GDP), and proximity to administrative center to the urban land use alteration within Zhejiang Province. The results align with earlier studies that revealed the strong influence of regional policies, socioeconomic development, and environmental settings on land use alteration [71,72]. Hence, LULC changes are greatly influenced by several factors that contribute to human–natural environment interactions [73]. Xu et al. maintained that anthropogenic factors, comprising traffic conditions, economic development, and government policies, contribute significantly to the local LULC [7]. Natural factors such as slope and elevation reveal land productivity [74]. Areas with steep slopes are often considered unsuitable for human activities. Such areas may also have low economic value and less probability of changing. Lower elevation areas observed rapid land use alterations mainly as a result of the anthropogenic suitability of the areas for farming. Slope is identified as a vital consideration for agricultural land use in China [75]. Zhou et al. observed that urban growth areas are often found in areas with flat terrain [76]. Such areas are more likely to be subjected to the intensive pressure of urbanization, which contributes to the encroachment of agricultural areas.

4.3. Multiscenario Dynamics of Future Land Uses

The analysis of the predicted land uses reveals that urban growth is evident in all three scenarios, i.e., the baseline scenario (BLS), cultivated land protection scenario (CLPS), and the ecological protection scenario (EPS); however, the growth rate is significantly controlled when the CLPS and EPS are implemented in comparison to the BLS. The agricultural areas of Zhejiang Province were observed to be effectively protected under the cultivated land protection scenario compared to the other two scenarios, i.e., baseline and ecological protection. Therefore, urban expansion will substantially increase in Zhejiang Province over the next 20 years. The consequences of this development will lead to numerous spatiotemporal variations under the three different scenarios, i.e., BLS, CLPS, and EPS. The study’s findings align with the result of Xu et al., which forecasted the urban land use changes in metropolitan areas and subcenters of China [49]. The result shows a more than 10.6% expansion in the built-up areas of Hangzhou and other administrative centers between 2022 and 2030. The development also conforms to the recent discoveries of Mamitimin et al., which modeled the LULC changes in northwest China’s arid and semiarid region under multiple scenarios [77]. The study indicated that under the BLS, urban expansion is expected to persist, while agricultural areas will decrease over the next 7 and 27 years. Similar to these studies, the present study indicates that the agricultural decline, particularly under the BLS and EPS, could significantly influence the self-sufficiency and future availability of agricultural produce in Zhejiang Province over the next few years. Therefore, policy interventions that effectively protect agricultural land while controlling urban expansion are necessary for the study area.

5. Policy Recommendations

Based on the multiscenario dynamics of the study area’s forecasted land uses, the following policies are recommended for the three development scenarios, i.e., BLS, CLPS, and EPS.
  • Baseline scenario (BLS)
The following policy recommendations are suggested to balance urban expansion and preserve agricultural land and natural areas:
  • Smart Growth and Compact Development: Encourage the development of compact and efficient growth patterns in urban areas, prioritizing the infill development and redevelopment of barren land areas. This approach will help minimize the conversion of agricultural land and natural habitats to other land uses;
  • Agricultural Land Protection: Implement policies and regulations to protect agricultural land from urban encroachment. Such strategies can promote sustainable farming practices, support farmers’ livelihoods, and ensure food security;
  • Green Infrastructure Development: Incorporate green infrastructure, such as ecological corridors, parks, and green belts, into the planning of urban areas to enhance urban resilience and improve the overall quality of the urban environment.
ii.
Cultivated Land Protection Scenario (CLPS)
The study recommends the following policy recommendations to effectively protect cultivated land:
  • Strict Land Use Control: Enforce stricter measures and land use regulations to prevent the conversion of cultivated land for nonagricultural purposes. Such a strategy will include enhanced monitoring and enforcement through regulatory bodies to curb illegal land use alteration;
  • Agricultural Innovation and Support: Invest adequately in modern agricultural research and development by encouraging contemporary farming techniques and assisting farmers in embracing sustainable agricultural practices. This will improve productivity and reduce the pressure to convert further land for cultivation;
  • Land Use Consolidation: Encourage land consolidation programs to optimize fragmented agricultural land and improve productivity. This can be achieved through voluntary land exchange programs, agricultural cooperatives, or other mechanisms that facilitate more efficient land use.
iii.
Ecological Protection Scenario (EPS)
The following policy recommendations are suggested to preserve and protect the ecological system:
  • Ecological Conservation and Restoration: Strengthen the protection of key ecological areas, such as forests and wetland areas, classified as water bodies. Implement various measures for ecological restoration, such as reforestation, wetland preservation, and habitat conservation;
  • Sustainable Tourism Development: Promote sustainable tourism practices that minimize negative impacts on ecological systems and support local communities. Encourage nature-based tourism, ecotourism, and the development of protected areas for tourism purposes;
  • Environmental Education and Awareness: Provide educational programs to raise environmental awareness among urban inhabitants about the importance of ecological conservation. In addition, encourage community participation in various conservation efforts.
The above recommendations seek to ensure sustainable urban development and protect valuable ecological resources by addressing the anticipated changes in urban land use of the study area, i.e., Zhejiang Province, China.

6. Conclusions

We analyzed the spatial and temporal alteration of land uses in Zhejiang Province, China, between 1995 and 2020 and predicted the study area’s future land use/land cover (LULC) pattern in 2040 under three multiscenarios. The study employed a cellular automata (CA) model integrated into a patch-generating land use simulation (PLUS) model to predict future land uses. It is a novel prediction technique that utilizes multiclass random patch seeds and land expansion analysis strategy to improve on previous simulation models. The innovative model embodies the framework of the CA model and incorporates factors such as neighborhood effect, adjustment elements, and developmental constraints. The result of the historical analysis indicated significant changes in land uses such as built-up areas, forests, and agricultural land, with an area of approximately 6126.93 km2, 3252.47 km2, and 2885.13 km2 between 1995 and 2020. Various factors related to both physical and socioeconomic aspects were employed to determine their contributions to the alteration of land uses. The result suggests that the main factors influencing the study area’s LULC changes varied according to the land use category. The findings imply that the alteration of cultivated land, forest areas, and water bodies were closely attributed to the significance of the study area’s elevation and slope, while the transformation of other land uses into built-up areas was mainly linked to slope, proximity to government, and population. The LULC prediction under the baseline scenario (BLS) indicated a continuous and substantial urban expansion in Zhejiang Province with an area of approximately 4501.62 km2, while the CLPS and EPS showed a controlled growth of 538.64 km2 and 1776.16 km2, respectively, over the next 17 years, i.e., 2040. By investigating different development scenarios and their potential impacts on land use change, the paper contributes to the understanding of the policy–land use relationship. The study further recommends specific strategies to manage land resources and promote sustainable urban development. While the present study has effectively examined regional scale alteration in LULC systems, other modeling approaches could be employed to compare the simulation results. Also, the study relied mainly on a single-year GDP and population data in understanding the fundamental drivers that influence land use modification. Future research may consider incorporating the study area’s multiyear socioeconomic data and developmental policies as the driving force factors that could improve land use analysis.

Author Contributions

A.F.K. and Z.H., conceptualization; A.F.K. and Z.H., methodology; A.F.K. and Z.H., software; A.F.K. and Z.H., validation; S.Z., N.D. and J.L., formal analysis; A.F.K. and Z.H., resources; Y.W., writing—original draft preparation; A.F.K., writing—review and editing; Z.H., visualization; A.F.K., supervision; Y.W., project administration; Y.W., funding acquisition. All authors have read and agreed to the published version of the manuscript.

Funding

This research received no external funding.

Data Availability Statement

All the relevant data from this study are available from the corresponding author upon request.

Conflicts of Interest

The authors declare no conflict of interest.

References

  1. Phan, T.N.; Kuch, V.; Lehnert, L.W. Land Cover Classification using Google Earth Engine and Random Forest Classifier—The Role of Image Composition. Remote Sens. 2020, 12, 2411. [Google Scholar] [CrossRef]
  2. Long, H. Theorizing land Use Transitions: A Human Geography Perspective. Habitat Int. 2022, 128, 102669. [Google Scholar] [CrossRef]
  3. Besser, H.; Hamed, Y. Environmental Impacts of Land Management on the Sustainability of Natural resources in Oriental Erg Tunisia, North Africa. Environ. Dev. Sustain. 2021, 23, 11677–11705. [Google Scholar] [CrossRef]
  4. Tali, J.A.; Ganaie, T.A.; Naikoo, M.W. Assessing the Link between Land Use/Land Cover Changes and Land Surface Temperature in Himalayan Urban Center, Srinagar. Environ. Sci. Pollut. Res. 2023, 30, 51191–51205. [Google Scholar] [CrossRef] [PubMed]
  5. Seyam, M.M.H.; Haque, M.R.; Rahman, M.M. Identifying the Land Use Land Cover (LULC) Changes using Remote Sensing and GIS Approach: A Case Study at Bhaluka in Mymensingh, Bangladesh. Case Stud. Chem. Environ. Eng. 2023, 7, 100293. [Google Scholar] [CrossRef]
  6. United Nations Department of Economic and Social Affairs. World Urbanization Prospects 2018: Highlights; Division, P., Ed.; United Nations Department of Economic and Social Affairs: New York, NY, USA, 2019. [Google Scholar]
  7. Xu, D.; Zhang, K.; Cao, L.; Guan, X.; Zhang, H. Driving Forces and Prediction of Urban Land Use Change Based on the Geodetector and CA-Markov Model: A Case Study of Zhengzhou, China. Int. J. Digit. Earth 2022, 15, 2246–2267. [Google Scholar] [CrossRef]
  8. Munthali, M.G.; Mustak, S.; Adeola, A.; Botai, J.; Singh, S.K.; Davis, N. Modelling Land Use and Land Cover Dynamics of Dedza District of Malawi using Hybrid Cellular Automata and Markov Model. Remote Sens. Appl. Soc. Environ. 2020, 17, 100276. [Google Scholar] [CrossRef]
  9. Zhang, J.; Hou, Y.; Dong, Y.; Wang, C.; Chen, W. Land Use Change Simulation in Rapid Urbanizing Regions: A Case Study of Wuhan Urban Areas. Int. J. Environ. Res. Public Health 2022, 19, 8785. [Google Scholar] [CrossRef]
  10. Koko, A.F.; Yue, W.; Abubakar, G.A.; Hamed, R.; Noman Alabsi, A.A. Analyzing urban growth and land cover change scenario in Lagos, Nigeria using multi-temporal remote sensing data and GIS to mitigate flooding. Geomat. Nat. Hazards Risk 2021, 12, 631–652. [Google Scholar] [CrossRef]
  11. Wang, F.; Wu, J.; Wu, M.; Zheng, W.; Huang, D. Has the Economic Structure Optimization in China & Supply-Side Structural Reform Improved the Inclusive Green Total Factor Productivity? Sustainability 2021, 13, 12911. [Google Scholar] [CrossRef]
  12. Wu, Y.; Han, Z.; Koko, A.F.; Zhang, S.; Ding, N.; Luo, J. Analyzing the Spatio-Temporal Dynamics of Urban Land Use Expansion and Its Influencing Factors in Zhejiang Province, China. Int. J. Environ. Res. Public Health 2022, 19, 16580. [Google Scholar] [CrossRef] [PubMed]
  13. Xiaomin, G.; Chuanglin, F. How Does Urbanization Affect Energy Carbon Emissions Under the Background of Carbon Neutrality? J. Environ. Manag. 2023, 327, 116878. [Google Scholar] [CrossRef]
  14. Liang, L.; Chen, M.; Lu, D. Revisiting the Relationship Between Urbanization and Economic Development in China Since the Reform and Opening-up. Chin. Geogr. Sci. 2022, 32, 1–15. [Google Scholar] [CrossRef]
  15. Deng, Z.; Zhao, Q.; Bao, H.X.H. The Impact of Urbanization on Farmland Productivity: Implications for China’s Requisition–Compensation Balance of Farmland Policy. Land 2020, 9, 311. [Google Scholar] [CrossRef]
  16. Zhu, C.; Lin, Y.; Zhang, J.; Gan, M.; Xu, H.; Li, W.; Yuan, S.; Wang, K. Exploring the Relationship Between Rural Transition and Agricultural Eco-Environment using a Coupling Analysis: A Case Study of Zhejiang Province, China. Ecol. Indic. 2021, 127, 107733. [Google Scholar] [CrossRef]
  17. Song, X.; Liu, Y.; Zhu, X.; Cao, G.; Chen, Y.; Zhang, Z.; Wu, D. The Impacts of Urban Land Expansion on Ecosystem Services in Wuhan, China. Environ. Sci. Pollut. Res. 2022, 29, 10635–10648. [Google Scholar] [CrossRef] [PubMed]
  18. Sun, X.; Li, G.; Wang, J.; Wang, M. Quantifying the Land Use and Land Cover Changes in the Yellow River Basin while Accounting for Data Errors Based on GlobeLand30 Maps. Land 2021, 10, 31. [Google Scholar] [CrossRef]
  19. Khan, F.; Das, B.; Mohammad, P. Urban Growth Modeling and Prediction of Land Use Land Cover Change Over Nagpur City, India Using Cellular Automata Approach. In Geospatial Technology for Landscape and Environmental Management: Sustainable Assessment and Planning; Rai, P.K., Mishra, V.N., Singh, P., Eds.; Springer Nature: Singapore, 2022; pp. 261–282. [Google Scholar] [CrossRef]
  20. Nuissl, H.; Siedentop, S. Urbanisation and Land Use Change. In Sustainable Land Management in a European Context: A Co-Design Approach; Weith, T., Barkmann, T., Gaasch, N., Rogga, S., Strauß, C., Zscheischler, J., Eds.; Springer International Publishing: Cham, Switzerland, 2021; pp. 75–99. [Google Scholar] [CrossRef]
  21. Trinder, J.; Liu, Q. Assessing Environmental Impacts of Urban Growth using Remote Sensing. Geo-Spat. Inf. Sci. 2020, 23, 20–39. [Google Scholar] [CrossRef] [Green Version]
  22. Mohamed, A.; Worku, H. Simulating Urban Land Use and Cover Dynamics using Cellular Automata and Markov Chain Approach in Addis Ababa and the Surrounding. Urban Clim. 2020, 31, 100545. [Google Scholar] [CrossRef]
  23. Al-Bilbisi, H. Spatial Monitoring of Urban Expansion Using Satellite Remote Sensing Images: A Case Study of Amman City, Jordan. Sustainability 2019, 11, 2260. [Google Scholar] [CrossRef] [Green Version]
  24. Liu, X.; Ning, X.; Wang, H.; Wang, C.; Zhang, H.; Meng, J. A Rapid and Automated Urban Boundary Extraction Method Based on Nighttime Light Data in China. Remote Sens. 2019, 11, 1126. [Google Scholar] [CrossRef] [Green Version]
  25. Abebe, G.; Getachew, D.; Ewunetu, A. Analysing Land Use/Land Cover Changes and its Dynamics using Remote Sensing and GIS in Gubalafito district, Northeastern Ethiopia. SN Appl. Sci. 2021, 4, 30. [Google Scholar] [CrossRef]
  26. Mayani-Parás, F.; Botello, F.; Castañeda, S.; Munguía-Carrara, M.; Sánchez-Cordero, V. Cumulative habitat loss increases conservation threats on endemic species of terrestrial vertebrates in Mexico. Biol. Conserv. 2021, 253, 108864. [Google Scholar] [CrossRef]
  27. Li, D.; Wang, S.; He, Q.; Yang, Y. Cost-Effective Land Cover Classification for Remote Sensing Images. J. Cloud Comput. 2022, 11, 62. [Google Scholar] [CrossRef]
  28. Viana, C.M.; Girão, I.; Rocha, J. Long-Term Satellite Image Time-Series for Land Use/Land Cover Change Detection Using Refined Open Source Data in a Rural Region. Remote Sens. 2019, 11, 1104. [Google Scholar] [CrossRef] [Green Version]
  29. Ali, S.; Henchiri, M.; Sha, Z.; Wilson, K.; Yun, B.; Yao, F.; Zhang, J. A Time Series of Land Cover Maps of South Asia from 2001 to 2015 Generated using AVHRR GIMMS NDVI3G Data. Environ. Sci. Pollut. Res. Int. 2020, 27, 20309–20320. [Google Scholar] [CrossRef]
  30. Koko, A.F.; Han, Z.; Wu, Y.; Abubakar, G.A.; Bello, M. Spatiotemporal Land Use/Land Cover Mapping and Prediction Based on Hybrid Modeling Approach: A Case Study of Kano Metropolis, Nigeria (2020–2050). Remote Sens. 2022, 14, 6083. [Google Scholar] [CrossRef]
  31. Caglıyan, A.; Daglı, D. Monitoring Land Use Land Cover Changes and Modelling of Urban Growth Using a Future Land Use Simulation Model (FLUS) in Diyarbakır, Turkey. Sustainability 2022, 14, 9180. [Google Scholar] [CrossRef]
  32. Wang, J.; Bretz, M.; Dewan, M.A.A.; Delavar, M.A. Machine Learning in Modelling Land-Use and Land Cover-Change (LULCC): Current status, Challenges and Prospects. Sci. Total Environ. 2022, 822, 153559. [Google Scholar] [CrossRef]
  33. Yatoo, S.A.; Sahu, P.; Kalubarme, M.H.; Kansara, B.B. Monitoring Land Use Changes and its Future Prospects using Cellular Automata Simulation and Artificial Neural Network for Ahmedabad city, India. GeoJournal 2022, 87, 765–786. [Google Scholar] [CrossRef]
  34. Dinagarapandi, P.; Saravanan, K.; Mohan, K. Catchment Scale Modeling of Land Use and Land Cover Dynamics. In Impacts of Urbanization on Hydrological Systems in India; Thambidurai, P., Dikshit, A.K., Eds.; Springer International Publishing: Cham, Switzerland, 2023; pp. 43–55. [Google Scholar] [CrossRef]
  35. Yang, J.; Tang, W.; Gong, J.; Shi, R.; Zheng, M.; Dai, Y. Simulating Urban Expansion using Cellular Automata Model with Spatiotemporally Explicit Representation of Urban Demand. Landsc. Urban Plan. 2023, 231, 104640. [Google Scholar] [CrossRef]
  36. Yeh, A.G.O.; Li, X.; Xia, C. Cellular Automata Modeling for Urban and Regional Planning. In Urban Informatics; Shi, W., Goodchild, M.F., Batty, M., Kwan, M.-P., Zhang, A., Eds.; Springer: Singapore, 2021; pp. 865–883. [Google Scholar] [CrossRef]
  37. Singh, K.T.; Singh, N.M.; Devi, T.T. A Remote Sensing, GIS Based Study on LULC Change Detection by Different Methods of Classifiers on Landsat Data; Springer Nature: Singapore, 2022; Volume 234, pp. 107–117. [Google Scholar]
  38. Alshari, E.A.; Gawali, B.W. Development of Classification System for LULC using Remote Sensing and GIS. Glob. Transit. Proc. 2021, 2, 8–17. [Google Scholar] [CrossRef]
  39. Anand, V.; Oinam, B. Future Land Use Land Cover Prediction with Special Emphasis on Urbanization and Wetlands. Remote Sens. Lett. 2020, 11, 225–234. [Google Scholar] [CrossRef]
  40. Das, S.; Sarkar, R. Predicting the Land Use and Land Cover Change using Markov Model: A Catchment Level Analysis of the Bhagirathi-Hugli River. Spat. Inf. Res. 2019, 27, 439–452. [Google Scholar] [CrossRef]
  41. Yutong, X. Applications of Markov Chain in Forecast. J. Phys. Conf. Ser. 2021, 1848, 012061. [Google Scholar] [CrossRef]
  42. Jafarpour Ghalehteimouri, K.; Shamsoddini, A.; Mousavi, M.N.; Binti Che Ros, F.; Khedmatzadeh, A. Predicting Spatial and Decadal of Land Use and Land Cover Change using Integrated Cellular Automata Markov Chain Model Based Ccenarios (2019–2049) Zarriné-Rūd River Basin in Iran. Environ. Chall. 2022, 6, 100399. [Google Scholar] [CrossRef]
  43. Gemitzi, A. Predicting Land Cover Changes using a CA Markov Model under Different Shared Socioeconomic Pathways in Greece. GISci. Remote Sens. 2021, 58, 425–441. [Google Scholar] [CrossRef]
  44. Onilude, O.O.; Vaz, E. Urban Sprawl and Growth Prediction for Lagos Using GlobeLand30 Data and Cellular Automata Model. Sci 2021, 3, 23. [Google Scholar] [CrossRef]
  45. Khwarahm, N.R. Spatial Modeling of Land Use and Land Cover change in Sulaimani, Iraq, using Multitemporal Satellite Data. Environ. Monit. Assess. 2021, 193, 148. [Google Scholar] [CrossRef]
  46. Weslati, O.; Bouaziz, S.; Sarbeji, M.M. Modelling and Assessing the Spatiotemporal Changes to Future Land Use Change Scenarios Using Remote Sensing and CA-Markov Model in the Mellegue Catchment. J. Indian Soc. Remote Sens. 2023, 51, 9–29. [Google Scholar] [CrossRef]
  47. Wang, J.; Zhang, J.; Xiong, N.; Liang, B.; Wang, Z.; Cressey, E.L. Spatial and Temporal Variation, Simulation and Prediction of Land Use in Ecological Conservation Area of Western Beijing. Remote Sens. 2022, 14, 1452. [Google Scholar] [CrossRef]
  48. Yang, J.; Huang, X. The 30m Annual Land Cover Dataset and its Dynamics in China from 1990 to 2019. Earth Syst. Sci. Data 2021, 13, 3907–3925. [Google Scholar] [CrossRef]
  49. Xu, L.; Liu, X.; Tong, D.; Liu, Z.; Yin, L.; Zheng, W. Forecasting Urban Land Use Change Based on Cellular Automata and the PLUS Model. Land 2022, 11, 652. [Google Scholar] [CrossRef]
  50. Ding, Q.; Chen, Y.; Bu, L.; Ye, Y. Multi-Scenario Analysis of Habitat Quality in the Yellow River Delta by Coupling FLUS with InVEST Model. Int. J. Environ. Res. Public Health 2021, 18, 2389. [Google Scholar] [CrossRef] [PubMed]
  51. Liang, X.; Guan, Q.; Clarke, K.C.; Liu, S.; Wang, B.; Yao, Y. Understanding the Drivers of Sustainable Land Expansion using a Patch-Generating Land Use Simulation (PLUS) Model: A Case Study in Wuhan, China. Comput. Environ. Urban Syst. 2021, 85, 101569. [Google Scholar] [CrossRef]
  52. Gao, L.; Tao, F.; Liu, R.; Wang, Z.; Leng, H.; Zhou, T. Multi-Scenario Simulation and Ecological Risk Analysis of Land Use Based on the PLUS Model: A Case Study of Nanjing. Sustain. Cities Soc. 2022, 85, 104055. [Google Scholar] [CrossRef]
  53. Zhu, Z.; Duan, J.; Li, R.; Feng, Y. Spatial Evolution, Driving Mechanism, and Patch Prediction of Grain-Producing Cultivated Land in China. Agriculture 2022, 12, 860. [Google Scholar] [CrossRef]
  54. Ma, G.; Li, Q.; Zhang, J.; Zhang, L.; Cheng, H.; Ju, Z.; Sun, G. Simulation and Analysis of Land-Use Change Based on the PLUS Model in the Fuxian Lake Basin (Yunnan-Guizhou Plateau, China). Land 2023, 12, 120. [Google Scholar] [CrossRef]
  55. Liang, X.; Liu, X.; Li, D.; Zhao, H.; Chen, G. Urban Growth Simulation by Incorporating Planning Policies into a CA-Based Future Land-Use Simulation Model. Int. J. Geogr. Inf. Sci. 2018, 32, 2294–2316. [Google Scholar] [CrossRef]
  56. Zhou, M.; Ma, Y.; Tu, J.; Wang, M. SDG-Oriented Multi-Scenario Sustainable Land-Use Simulation Under the Background of Urban Expansion. Environ. Sci. Pollut. Res. 2022, 29, 72797–72818. [Google Scholar] [CrossRef]
  57. Congalton, R.G. A Review of Assessing the Accuracy of Classifications of Remotely Sensed Data. Remote Sens. Environ. 1991, 37, 35–46. [Google Scholar] [CrossRef]
  58. Yang, X.; Bai, Y.; Che, L.; Qiao, F.; Xie, L. Incorporating Ecological Constraints into Urban Growth Boundaries: A Case Study of Ecologically Fragile Areas in the Upper Yellow River. Ecol. Indic. 2021, 124, 107436. [Google Scholar] [CrossRef]
  59. Norizah, K.; Jamhuri, J.; Balqis, M.; Mohd Hasmadi, I.; Nor Akmar, A.A. Land Use and Land Cover Change Prediction Using ANN-CA Model. In Tropical Forest Ecosystem Services in Improving Livelihoods For Local Communities; Samdin, Z., Kamaruddin, N., Razali, S.M., Eds.; Springer Nature: Singapore, 2023; pp. 107–125. [Google Scholar] [CrossRef]
  60. Girma, R.; Fürst, C.; Moges, A. Land Use Land Cover Change Modeling by Integrating Artificial Neural Network with Cellular Automata-Markov Chain Model in Gidabo River Basin, Main Ethiopian Rift. Environ. Chall. 2022, 6, 100419. [Google Scholar] [CrossRef]
  61. Chen, L.; CAI, H.; Zhang, T.; Zhang, X.; Zeng, H. Land Use Multi-Scenario Simulation Analysis of Rao River Basin Based on Markov-FLUS Model. Acta Ecol. Sin. 2022, 42, 3947–3958. [Google Scholar] [CrossRef]
  62. Niu, T.; Xiong, L.; Chen, J.; Zhou, Y.; Yin, J.; Liu, D. Land Use Simulation and Multi-Scenario Prediction of the Yangtze River Basin Based on PLUS model. Eng. J. Wuhan Univ. 2023, 1–16. [Google Scholar]
  63. Zhou, D.; Li, Z.; Wang, S.; Tian, Y.; Zhang, Y.; Jiang, G. How does the newly urban residential built-up density differ across Chinese cities under rapid urban expansion? Evidence from residential FAR and statistical data from 2007 to 2016. Land Use Policy 2021, 104, 105365. [Google Scholar] [CrossRef]
  64. Zhang, Z.; Wen, Q.; Liu, F.; Zhao, X.; Liu, B.; Xu, J.; Yi, L.; Hu, S.; Wang, X.; Zuo, L.; et al. Urban Expansion in China and its effect on Cultivated Land Before and After Initiating “Reform and Open Policy”. Sci. China Earth Sci. 2016, 59, 1930–1945. [Google Scholar] [CrossRef]
  65. Huang, X.; Xia, J.; Xiao, R.; He, T. Urban Expansion Patterns of 291 Chinese Cities, 1990–2015. Int. J. Digit. Earth 2019, 12, 62–77. [Google Scholar] [CrossRef]
  66. Shen, Y.; Shen, H.; Cheng, Q.; Huang, L.; Zhang, L. Urban Expansion Trajectories in China’s 36 Major Cities. In Proceedings of the 2019 Joint Urban Remote Sensing Event (JURSE), Vannes, France, 22–24 May 2019; pp. 1–4. [Google Scholar]
  67. Zhejiang Statistical Yearbook. Zhejiang Provincial National Economic and Social Development Statistical Bulletin; Zhejiang Provincial Bureau of Statistics: Hangzhou, China, 2020.
  68. Liu, Y.; Yue, W.; Fan, P. Spatial Determinants of Urban Land Conversion in Large Chinese Cities: A Case of Hangzhou. Environ. Plan. B Plan. Des. 2011, 38, 706–725. [Google Scholar] [CrossRef]
  69. Feng, R.; Wang, F.; Wang, K.; Xu, S. Quantifying Influences of Anthropogenic-Natural Factors on Ecological Land Evolution in Mega-Urban Agglomeration: A Case Study of Guangdong-Hong Kong-Macao Greater Bay Area. J. Clean. Prod. 2021, 283, 125304. [Google Scholar] [CrossRef]
  70. Wang, Z.; Lu, C. Urban Land Expansion and its Driving Factors of Mountain Cities in China during 1990–2015. J. Geogr. Sci. 2018, 28, 1152–1166. [Google Scholar] [CrossRef] [Green Version]
  71. Lei, C.; Wagner, P.D.; Fohrer, N. Identifying the Most Important Spatially Distributed Variables for Explaining Land Use Patterns in a Rural Lowland Catchment in Germany. J. Geogr. Sci. 2019, 29, 1788–1806. [Google Scholar] [CrossRef] [Green Version]
  72. Chen, C.; He, X.; Liu, Z.; Sun, W.; Dong, H.; Chu, Y. Analysis of Regional Economic Development Based on Land Use and Land Cover Change Information Derived from Landsat Imagery. Sci. Rep. 2020, 10, 12721. [Google Scholar] [CrossRef] [PubMed]
  73. Liu, X.; Liang, X.; Li, X.; Xu, X.; Pei, F.; Ou, J.; Chen, Y.; Li, S. A Future Land Use Simulation Model (FLUS) for Simulating Multiple Land Use Scenarios by Coupling Human and Natural Effects. Landsc. Urban Plan. 2017, 168, 94–116. [Google Scholar] [CrossRef]
  74. Guan, D.; Zhao, Z.; Tan, J. Dynamic Simulation of Land Use Change Based on Logistic-CA-Markov and WLC-CA-Markov Models: A Case Study in Three Gorges Reservoir Area of Chongqing, China. Environ. Sci. Pollut. Res. Int. 2019, 26, 20669–20688. [Google Scholar] [CrossRef]
  75. Zeng, J.; Bian, J.; Chen, W. Impact of Slope Farmland Use Change on Ecosystem Services Value in China, 2000–2020. J. Mt. Sci. 2023, 20, 821–833. [Google Scholar] [CrossRef]
  76. Zhou, L.; Dang, X.; Sun, Q.; Wang, S. Multi-Scenario Simulation of Urban Land Change in Shanghai by Random Forest and CA-Markov Model. Sustain. Cities Soc. 2020, 55, 102045. [Google Scholar] [CrossRef]
  77. Mamitimin, Y.; Simayi, Z.; Mamat, A.; Maimaiti, B.; Ma, Y. FLUS Based Modeling of the Urban LULC in Arid and Semi-Arid Region of Northwest China: A Case Study of Urumqi City. Sustainability 2023, 15, 4912. [Google Scholar] [CrossRef]
Figure 1. Location of Zhejiang Province indicating its digital elevation model (DEM).
Land 12 01525 g001
Figure 2. Proposed outline for modeling and simulating future LULC.
Land 12 01525 g002
Figure 3. Classified LULC map of Zhejiang Province in (a) 1995, (b) 2000, (c) 2005, (d) 2010, (e) 2015, and (f) 2020.
Land 12 01525 g003
Figure 4. Distribution of LULC categories in Zhejiang Province, China, (in %).
Land 12 01525 g004
Figure 5. Transition of LULC categories at a five (5) year interval.
Land 12 01525 g005
Figure 6. LULC transitions in Zhejiang Province, China, between 1995 and 2020.
Land 12 01525 g006
Figure 7. Contributing factors to the changes in LULC categories comprising (a) agricultural land, (b) forest areas, (c) water bodies, and (d) built-up areas.
Land 12 01525 g007
Figure 8. Spatial mapping of the simulated LULC under (a) BLS, (b) CLPS, and (c) EPS.
Land 12 01525 g008
Figure 9. (a) Classified and (b) simulated LULC map of Zhejiang Province in 2020.
Land 12 01525 g009
Table 1. Summary of the different datasets.
S/
No.
DataSubdataYearSpatial
Resolution
SourceFormat
1.Land use
dataset
Classified LULC1995–202030 mhttps://zenodo.org/Geo TIFF
2.Natural/physical dataDEM
Slope
Precipitation
Temperature
201530 m
30 m
1000 m
1000 m
https://www.resdc.cnGeo TIFF
3.Socioeconomic dataGDP
Population
20151000 mhttps://www.geodoi.ac.cn/Geo TIFF
Distance to motorway
Distance to railway
Distance to primary road
Distance to secondary road
Distance to tertiary road
Distance to government
2020 https://www.openstreetmap.org/.Shp
Table 2. Classification scheme of LULC classes.
S/No.LULC CategoryDescription of LULC Categories
1.Agricultural LandComprises all croplands, farmlands, plantations, and agricultural areas
2.Forest Areas Consist of all land with different types of forestland
3.Grassland Areas with open pasture and green land
4.Water BodiesAreas with rivers, lakes, ponds, streams, and reservoirs
5.Built-up Areas Include residential, institutional, and commercial areas with urban facilities and impervious surfaces
6.Barren Land Covers areas having no vegetation cover, crops, or grasses.
Table 3. Statistical data of the LULC categories in Zhejiang Province.
S/
No.
LULC
Categories
Area (km2)
199520002005201020152020
1.Agric. Land27,225.0026,509.1424,821.6823,507.1124,229.7524,339.87
2.Forest Areas70,133.46069,746.5969,637.5669,512.7167,544.2866,880.99
3.Grassland24.44016.6824.0928.8615.469.44
4.Water Bodies3005.183121.603432.853502.543350.683029.38
5.Built-up Areas2728.563722.725200.446564.597975.508855.49
6.Barren Land0.300.210.321.131.271.77
103,116.90103,116.90103,116.90103,116.90103,116.90103,116.90
Table 4. Statistical data of the LULC changes in Zhejiang Province.
S/
No.
LULC
Categories
Δ Changes in LULC (km2)
1995–20002000–20052005–20102010–20152015–20201995–2020
1.Agric. Land−715.86−1687.46−1314.57722.64110.12−2885.13
2.Forest Areas−386.87−109.03−124.85−1968.43−663.29−3252.47
3.Grassland−7.767.414.77−13.40−6.02−15.00
4.Water Bodies116.42311.2569.69−151.86−321.3024.20
5.Built-up Areas994.161477.721364.151410.91879.996126.93
6.Barren Land−0.090.110.810.140.501.47
Note: Δ signifies the area changes in LULC, and km2 signifies sq. km.
Table 5. Cost matrix of the multiscenario setting (2020–2040).
Scenario SettingBaseline Scenario (BLS)Cultivated Land Protection Scenario
(CLPS)
Ecological Protection Scenario
(EPS)
ALFOGRWBBABLALFOGRWBBABLALFOGRWBBABL
AL111111100000111111
FO111111111011011100
GR111111111111011100
WB000110000110000100
BA000010100010000010
BL111111111111111111
Note: AL represents agricultural land; FO signifies forest areas; GR represents grassland; WB denotes water bodies; BA indicates built-up areas; and BL denotes barren land.
Table 6. Multiscenario statistics of predicted LULC categories (2020–2040).
S/
No.
LULC
Categories
Real and Simulated LULC (km2)Changes in LULC (2020–2040)
2020BLS 2040CLPS 2040EPS 2040BLSCLPSEPS
1.Agric. Land24,274.4022,494.9027,389.1022,494.90–1779.473114.70–1779.47
2.Forest Areas66,765.3064,328.6063,979.4066,766.50–2436.72–2785.901.13
3.Grassland9.407.107.108.20–2.24–2.24–1.13
4.Water Bodies2876.102592.702011.302879.60–283.38–864.793.48
5.Built-up Areas8788.9013,290.609327.6010,565.104501.62538.641776.16
6.Barren Land1.501.701.101.300.19–0.41–0.17
Note: BLS signifies baseline scenario; CLPS represents cultivated land protection scenario; and EPS denotes ecological protection scenario.
Disclaimer/Publisher’s Note: The statements, opinions and data contained in all publications are solely those of the individual author(s) and contributor(s) and not of MDPI and/or the editor(s). MDPI and/or the editor(s) disclaim responsibility for any injury to people or property resulting from any ideas, methods, instructions or products referred to in the content.

