Article

Calculation and Management of Water Supply and Demand under Land Use/Cover Changes in the Yarmouk River Basin Governorates in Jordan

by
Maisa’a W. Shammout
Water, Energy and Environment Center, The University of Jordan, Amman 11942, Jordan
Land 2023, 12(8), 1518; https://doi.org/10.3390/land12081518
Submission received: 13 June 2023 / Revised: 18 July 2023 / Accepted: 26 July 2023 / Published: 31 July 2023
(This article belongs to the Special Issue Geospatial Data in Land Suitability Assessment)

Abstract

:
This paper presents the calculation and management of water supply and demand under land use/cover changes in the Yarmouk River Basin in Jordan for the years 1997, 2007 and 2017. It aims to analyze and link the changes in the land classes with the water resources supply demand as the groundwater is unable to meet the inhabitants demand, necessitating land management practices. The method includes deriving land use/cover maps using the supervised classification, identifying basin governorates, cities and villages, calculating the basin governorates’ inhabitants, water demand, supply of internal wells, water loss, and actual water consumption. The results showed an increase in the urban area by 3.01%, while forests, rain-fed vegetables and crops declined by 1.57% and 1.09%, respectively. Urbanization appears mainly at the expense of rangelands, an important change affecting water supply from internal wells due to increased pumping to balance population demand. Although it is decreasing per capita, the water demand is high. Changing land use practices, securing inter-basin water resources, and calculating water losses is a challenge of great importance that can manage water shortages and increase actual consumption. This research is important in order to understand the supply demand situation and to aid a wide range of users, water-managers, land-planners and decision-makers.

1. Introduction

Worldwide, the spatial extent of human changes to the Earth’s land surface are unprecedented, and studies have indicated that nearly three quarters of the land has been changed by world’s population during the past millennium [1,2]. Changes in land cover “biophysical attributes of the earth’s surface” and changes in land use “human purpose or intention applied to these attributes” are spread globally [3,4]. The drivers of land use/cover changes are multiple and can be linked directly to human activities and natural processes, although they are related to some extent to anthropogenic activities, and the identification of land use change is critical in addressing global challenges, especially water shortages [5,6].
The relationship between water resources management and land use/cover is highly relevant, inextricably entwined, and the need to protect the quantity and quality of water resources can influence potential land uses and land management practices [7,8]. Although this relationship is complex with respect to surface basins and groundwater recharge due to diversity with topography, as well as hydrogeological characteristics [9], water-makers, from governments to nonprofits to corporations, often manage water resources and land use for multiple uses [10,11]. They are challenged to secure additional water for increasing human activity [10]. For example, in the south and east of the United Kingdom, land uses that increase evapotranspiration or rapid runoff should be discouraged, and efforts should be pursued to maintain good water quality in rivers and groundwater in order to maintain usable water resources [12]. On the other hand, in many developing countries, many people still do not have access to sufficient clean water due to extensive areas being subject to land use change and freshwater resources being limited, so its quality is getting worse, all while having to put up with the competing needs and demands of the inhabitants [13].
Changes in land use/cover have also occurred globally with the conversion of forests to cropland, the continuous conversion of agricultural land to urban areas, as well as biodiversity loss and soil degradation [14,15]. The rapid expansion of agriculture is associated with a significant increase in the amount of water used for irrigation, which can be linked to a decrease in the amount of water available to ecosystems in almost all arid regions [16]. At the same time, domestic water demand has increased rapidly as a result of increased economic development and urbanization. Thus, water resource utilization has approached or exceeded the threshold of natural water resources in some arid inland basins [17]. Results showed that basin hydrology is highly linked to growth in urbanization, as this growth leads to an increase in the area of impermeable land, while grass and forests areas control the reduction in surface-runoff [18,19]. Land use/cover change has direct impacts on water yield, which is the total amount of water that runs off within a region [20]. Land use/cover change is therefore a major consideration for sustainable development and for water resources management. This has emerged as a key issue in global environmental change, particularly in water-stressed regions. [21]. Hence, information on the status and trend of land change is important for a better understanding of basic driving processes, as well as for planning and decision-making [21]. Data derived from analysis land use/cover thematic images with full-scene and high-resolution enable us to understand changes in land features over the years, such as changes in urban, crops, water and other land features. Analysis thematic images depend on research objective as water resources management under land use/cover changes [22]. Studies and projects related to the land use evaluation and the sustainability of water resources protection have helped in the rehabilitation of the river basins [23].
In Jordan, renewable water resources are limited and insufficient to meet the domestic needs of water of the Kingdom’s population [10], as groundwater is a major source for domestic uses [24]. The per capita water per year has decreased from 500 m3 to 140 m3 and to less than 100 m3 in the years 1975, 2010 and 2016, respectively [25], and it is expected to decrease by about 90 m3, which could put Jordan in a situation of water scarcity [26], not to mention the rapid increase in population which mainly caused changes in land use that have a significant impact on the land’s surface and hydrological processes, represented by groundwater recharge, infiltration and flow of rivers [20]. In addition to water scarcity, changes in land use/cover and urbanization [27], halting water loss in the water supply system is a priority as it will raise the efficiency of water delivery to inhabitants [25]. In 2004, the water loss was relatively high at 46%, and when calculating water losses, the per capita water decreased to 75 L per capita per day (lpcd) [28]; therefore, the Ministry of Water and Irrigation’s action plan aims to reduce water losses in the domestic water system [25]. All these associated factors negatively limit the sustainable availability of water resources to the Jordanian water basins.
There are 15 surface water basins in Jordan, including the internationally shared basins. The Yarmouk River Basin is considered one of the most important surface water basins in Jordan, as it is shared between Jordan and Syria, and is located within the four main governorates: Mafraq, Irbid, Jerash and Ajloun. The Yarmouk River and the Jordan River are the only two watercourses in the Kingdom that flow permanently [25,29]. Figure 1 shows the location of the Yarmouk River Basin among the surface water basins and within the main four governorates of Jordan.
Recently, there have been serious changes in the use of basin water resources, and more attention has been placed on land use/cover changes especially in urban areas because these areas are strongly influenced by human activities and water resources use. Agricultural areas and urbanization were the main land uses that underwent expansion [27]. In addition to these driving factors, rapid population growth and high rates of resources use also affected water supply [30]. Moreover, the Yarmouk River Basin is subject to transboundary water governance, as the reality of bilateral agreements, political and environmental discourses have also affected the availability and uses of the water resources of the Yarmouk River Basin [31,32]. The Yarmouk Basin needs a broad vision on the use of water resources to preserve the common interests of the inter-sectoral towards the fair use of transboundary waters [33]. Consequently, the problems attributed to the Yarmouk River Basin can be summarized as [10,27,34]: (a) Uncontrolled urban growth and erroneous use of land have reduced aquifer recharge, (b) urbanization has affected the flood pattern, (c) population growth has led to more uses of internal wells in the basin than water availability, (d) excessive pumping of groundwater has affected the quantities of groundwater, (e) declined base-flow and reduced groundwater recharge due to upstream withdrawal, and (f) water supply losses are a major problem in the basin.
The mentioned problems have increased the imbalances between domestic water demand and supply, and management of water resources under land use/cover changes must be adopted by planners, decision-makers, scientists and relevant actors to reduce the gap between domestic supply and demand, as well as to mitigate the negative impacts of the land use/cover changes. For these reasons, the Yarmouk River Basin was selected as a case study for the [WE/2/08/2017] project, funded by the Scientific Research and Innovation Support Fund-Ministry of Higher Education and Scientific Research, Jordan.
This study investigates the calculation and management of water supply and demand under land use/cover changes in the Yarmouk River Basin in Jordan over twenty years 1997, 2007 and 2017. It aims to analyze, compare and link the changes in ten classes of land use/cover with water resources supply and inhabitants demand, as the groundwater wells are unable to meet the water demand, necessitating land management for water supply and demand. The specific objectives were: (1) To analyze and compare changes in land use/cover of the Yarmouk River Basin for the years 1997, 2007 and 2017, (2) to calculate the number of Yarmouk River Basin inhabitants and their domestic water demand versus the internal supply of the basin wells, the total water supply, and the actual water consumption, and (3) to highlight water supply and demand management in the Yarmouk River Basin that may assist water-managers, land-planners and decision-makers in managing water supply and demand under land use/cover changes.

2. Materials and Methods

2.1. Study Site

The area of the Yarmouk River Basin in Jordan is about 1393 km² and it is located in the northwestern part of Jordan. The basin elevation is approximately −200 m in the Jordan Valley and 1150 m at the upper basin boundary; Ras Munif. In Jordan, the Yarmouk River originates, then composes the border between Hashemite Kingdom of Jordan and the Syrian Arab Republic. It is the main water source for the King Abdullah Canal, which is the development backbone of the Jordan Valley [35,36]. The basin is densely populated in the western part, and includes the main cities of Irbid, Al Mafraq and Ar Ramtha. The basin contains many communities in the four governorates, such as Sakhra, Soof, Qafqafa, Sama el Serhan, Hosha, Um Eloolo, Fa’a, Al No’ayymeh, Al Hoson, Boshra, Aidoon and Um Qais. The most important water resources for domestic use purposes in the Yarmouk River Basin communities consist primarily of groundwater.
The rock formations of the Yarmouk Basin are classified as the Ajloun Group, Balqa Group and the Jordan Valley Group from the Upper Cretaceous to Tertiary ages. Wadi Es-Sir Limestone formation is the oldest and is from the Turonian age; it belongs to the Ajloun Group and consists of limestone and dolomitic limestone. The principal sources of groundwater are classified into Shallow and Upper Cretaceous aquifers, levels of groundwater range from 0 to 250 m, aquifers are confined, and the groundwater flow directions are north and northwest [37].
The flow of the Yarmouk Basin ranges between 11 m3/s to 0 [38], depending on individual rainfall events, as well as changes in the flow regime due to over-extraction by highland farmers and the construction of several dams in the upper part of the Yarmouk River on the Syrian side, which also led to lower flow rates of the river. The downstream flow of the Yarmouk River on the Jordanian side is impounded by the only major dam, which is the Wehdah Dam, where the dam’s water is used to irrigate various crops in the Jordan Valley [39], and there are three desert dams located within the basin, namely Al Bouwayda Dam, Sama as Serhan Dam and Al Ghadir Al Abyad Dam. Wadi al Shalalah, Wadi ar Ruqqad, Wadi al Allan, Wadi al Showmar, Wadi al Ghadir Al Abyad and Wadi Shaqq al Barid are the main wadis in the Yarmouk Basin. Al Adasiya runoff gauge is an essential point in the Yarmouk Basin because it measures and monitors the total flow and surface runoff for the Yarmouk River [39]. Within the Yarmouk Basin, there are five municipal wastewater treatment plants (TPs), namely Al Akaidar TP, Wadi al Shalalah TP, Mafraq TP, Wadi Hassan TP and Ramtha TP [10]. The effluents from these TPs are mainly used for on-site irrigation. Figure 2 shows the Yarmouk River Basin tributaries and the Yarmouk River, treatment plants, dams and major cities and towns.

2.2. Analysis of Land Use/Cover Changes of the Yarmouk River Basin

At the Royal Jordanian Geographic Centre (RJGC); The dataset included full scenes for the years 1997, 2007 and 2017 of medium spatial resolution images from three different (3) Satellites that were used in land use/cover maps of the Yarmouk River Basin in Jordan. Table 1 shows the images specification. This table was provided by RJGC [40].
Several image processing techniques were performed specifically for this study in order to set imageries for supervised classification [40], such as rectification and adjustment imageries at the boundary of the Yarmouk Basin in Jordan. The land use/cover maps were classified into ten (10) classes. These classes have been identified to demonstrate the aim of the research. The land use/cover classes are bare soil, urban area, extraction sites, forest, rangelands, irrigated orchards, irrigated vegetables and crops, rain-fed orchards, rain-fed vegetables and crops and water bodies.

2.3. Calculating the Yarmouk River Basin Inhabitants and Their Water Demand versus Internal Supply, Total Water Supply and Actual Water Consumption

The method includes the following:
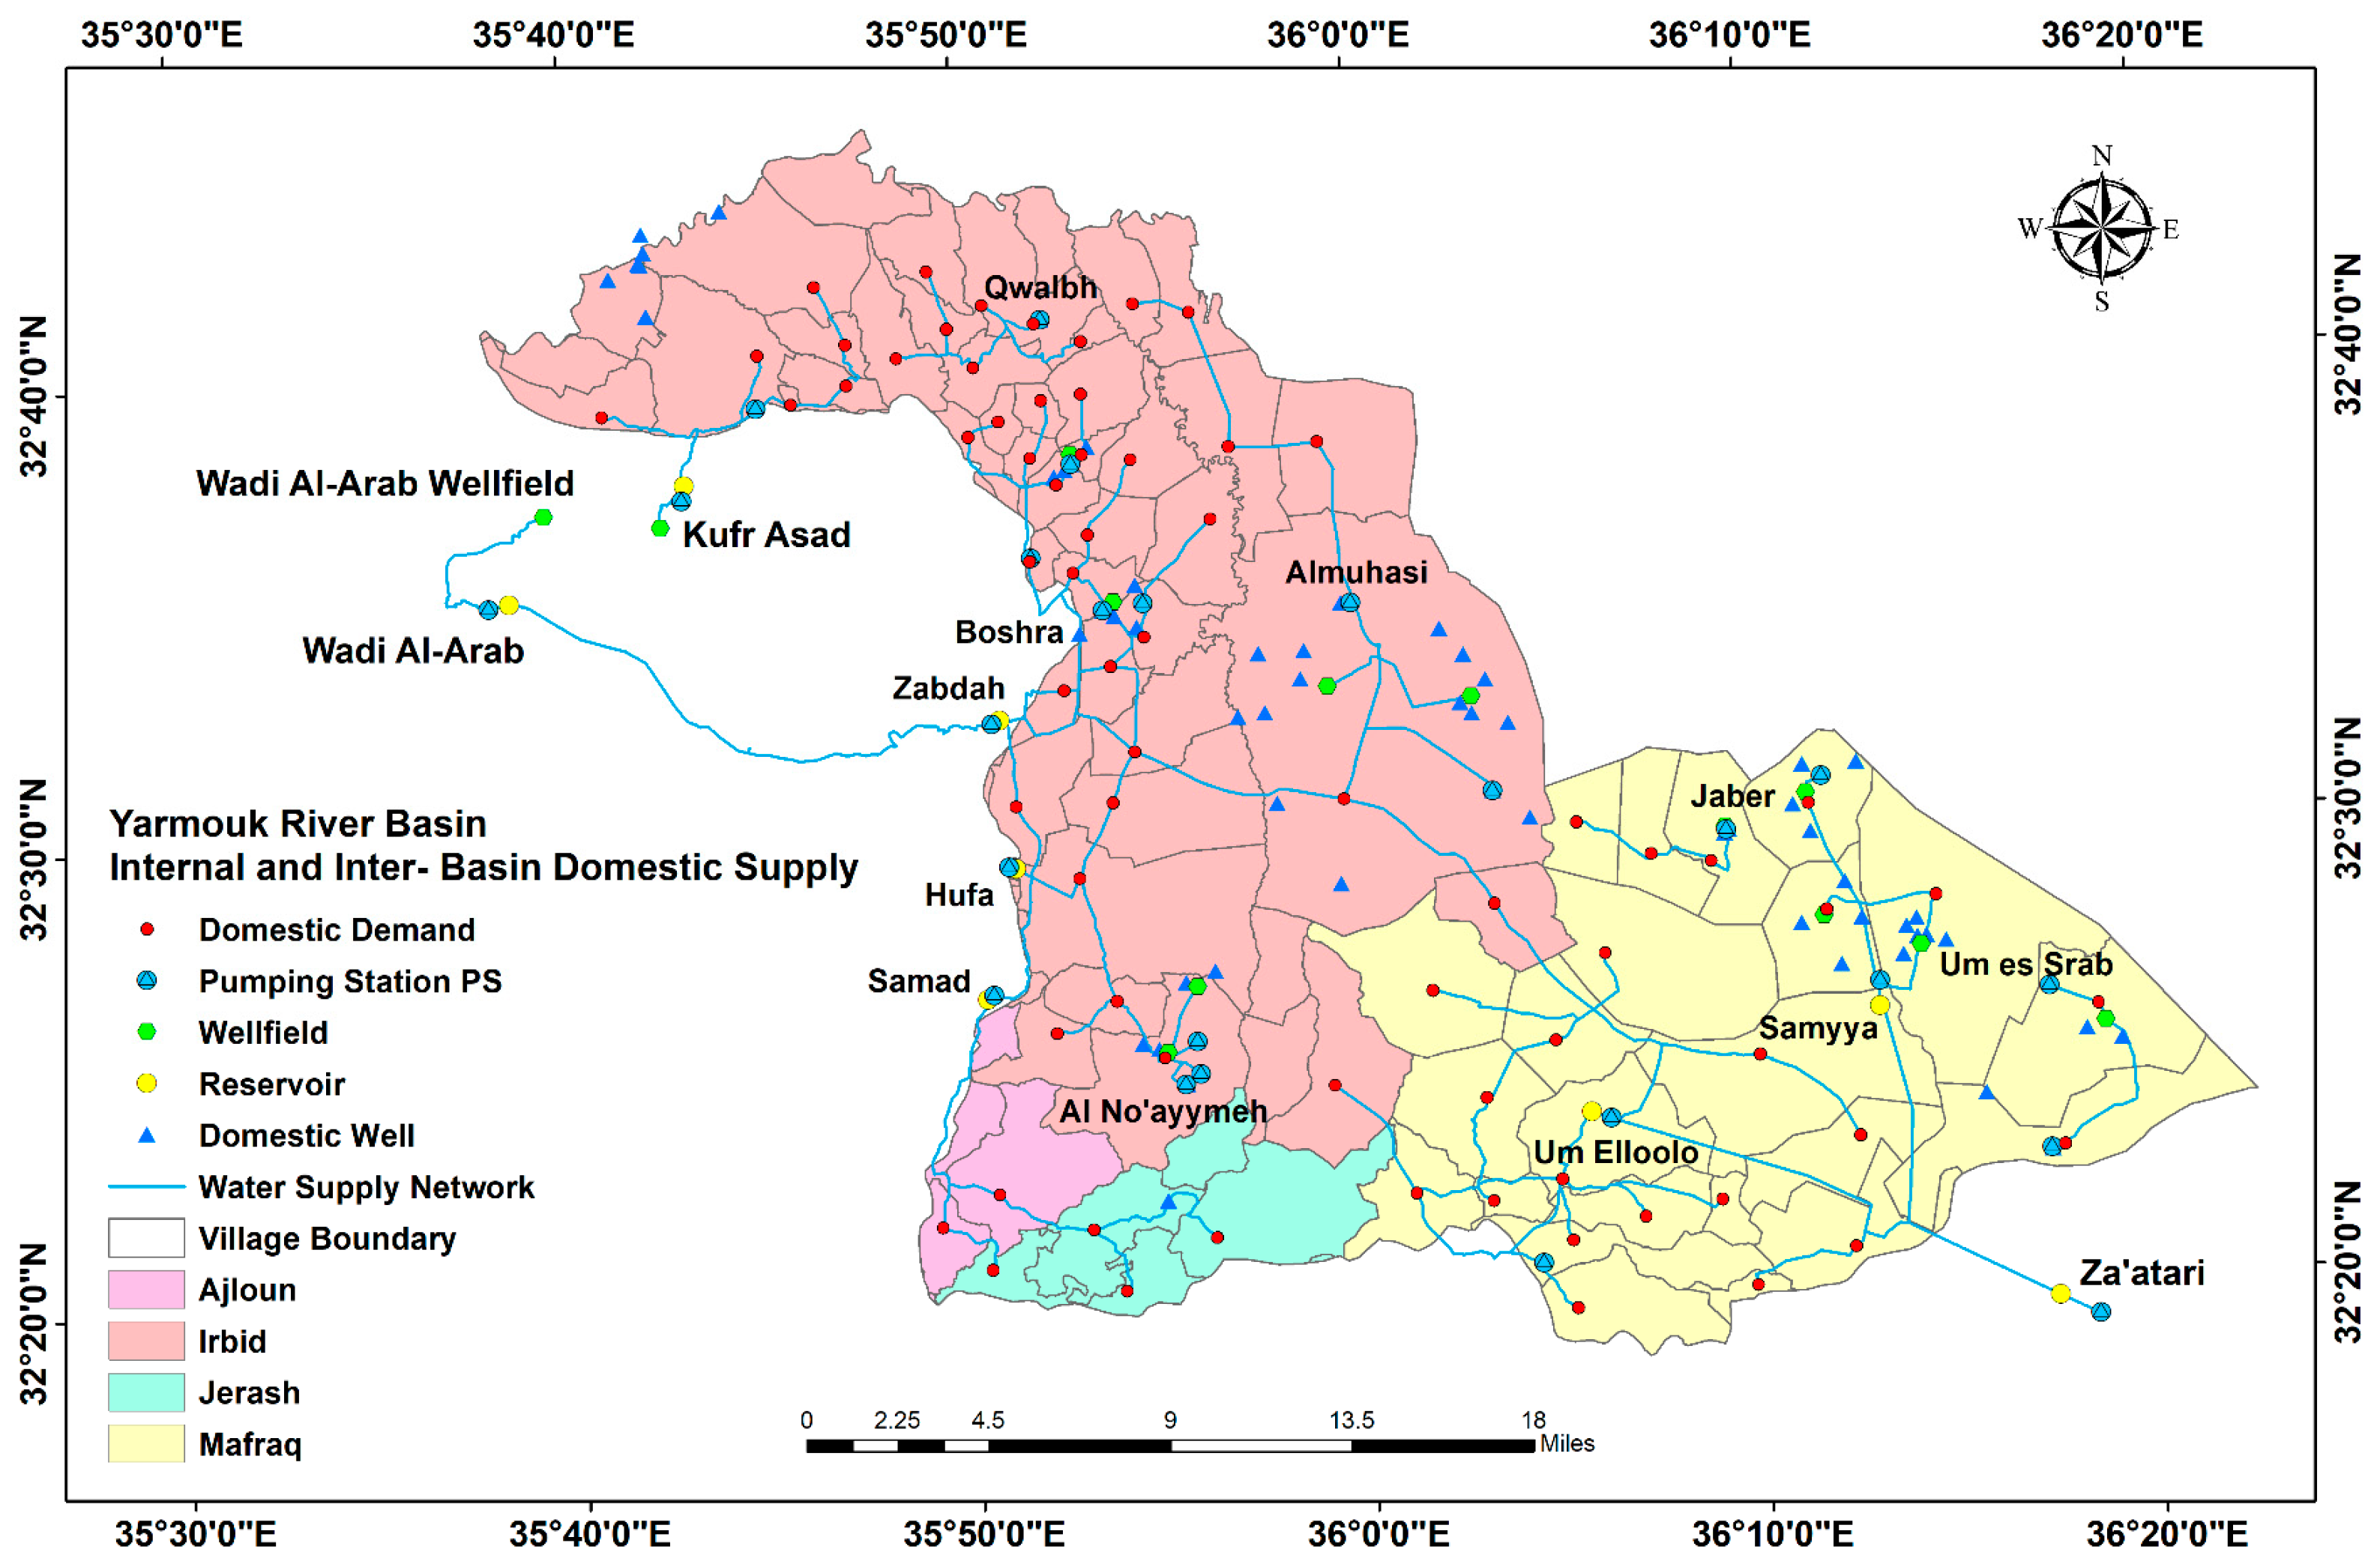
  • Identifying the basin governorates, cities and villages and groundwater wells. For this study, in the laboratories of the Water, Energy and Environment Centre at the University of Jordan, using ArcMap 10.8.1., the four governorates (Mafraq, Irbid, Jerash and Ajloun) within the Yarmouk River Basin were clipped to the boundaries of the study area, and then the boundaries of villages and cities within the boundary of the basin were demarcated based on the information provided by the Department of Lands and Survey in Jordan [41]. The quantities and the locations of domestic supply wells for each governorate were identified based on the information provided by the Ministry of Water Irrigation [42,43,44]. The water quantities were calculated for each governorate within the entire basin and the entire basin for the years 1997, 2007 and 2017.
  • The inhabitants of each community (villages and cities) in each governorate within the entire basin were calculated using information provided by the Department of Statistics for the years 1997, 2007 and 2017 [45,46,47]. The total inhabitants of the Yarmouk Basin were also calculated for the target years.
  • Domestic water demand (DWD) in the entire Yarmouk River Basin was calculated as the volume of water required by the inhabitants to meet their need, Equation (1). Water demand was calculated for the years 1997, 2007 and 2017. This is based on the per capita share of water (PCW) in each of the basin governorates, which the government identified according to the geographical locations of the four major governorates, Mafraq, Irbid, Jerash and Ajloun. Each governorate has its own figure for per capita share of water, varying from year to year, provided from the open files of Department of Statistics [45,46,47]. Equation (1):
D W D   Y a r m o u k   B a s i n   = P C W   M a f r a q M a f r a q   I n h a b i t a n t s + P C W   I r b i d     I r b i d   I n h a b i t a n t s + P C W   J e r a s h     J e r a s h   I n h a b i t a n t s   +   P C W   A j l o u n     A j l o u n   I n h a b i t a n t s
d.
The deficit in water supply from internal wells was calculated by comparing the water demand against internal supply of each governorate and the entire Yarmouk River Basin. Shortages in the water supply and water losses in the water supply system are a high liability for water-managers [25]. For this research, the information about the volumes of additional water supplies transported from outside the Yarmouk Basin, called inter-basin domestic water supplies, is from the open files of the Yarmouk Water Company (YWC), where an inter-basin depends on external wells located outside the basin.
e.
The actual water consumption volume for each governorate was calculated according to the actual volume of water reaching the inhabitants of the basin. This is carried out by subtracting the volume of water losses from the total volume of the water supply for the targeted years; each governorate has a figure of water losses that was used for this study [25,34].
f.
The results of calculating water volumes for 1997, 2007 and 2017 were compared versus changes in land use over twenty years to highlight the role of supply and demand management.

3. Results and Discussion

3.1. Land Use/Cover Changes for the Years 1997, 2007 and 2017

Table 2 shows the land use/cover distribution in % of the Yarmouk River Basin for the years 1997, 2007 and 2017. Figure 3 shows the land use/cover maps of the Yarmouk River Basin during 1997–2017: (A) 1997; (B) 2007; (C) 2017]. The land use/cover map of the year 1997 illustrates that the classes are distributed in % as: 23.17% bare soil, 8.39% urban area, 0.29% extraction sites, 6.45% forest, 23.89% rangelands, irrigated orchards 2.42%, irrigated vegetables and crops 1.14%, 7.17% rainfed orchards, 27.04 rainfed vegetables and crops and 0.03% of water bodies. The 2007 land use/cover map illustrates that the classes are distributed in % as: 20.82% bare soil, 10.48% urban area, 0.29% extraction sites, 4.85% forest, 23.24% rangelands, 2.53% irrigated orchards, 1.23% irrigated vegetables and crops, 10.33% rain-fed orchards, 26.11% rain-fed vegetables and crops and 0.12% of water, whereas the land use/cover map for the year 2017 illustrates that the classes are distributed as: 20.64% bare soil, 11.4% urban area, 0.29% extraction sites, 4.88% forest, 20.93% rangelands, 2.65% irrigated orchards, 1.58% irrigated vegetables and crops, 11.54% rain-fed orchards, 25.95% rain-fed vegetables and crops and 0.14% of water (Table 2). Remarkably, urban areas and the rain-fed orchards are expanding, and rangelands are declining.
Comparing 1997 to 2017, urban areas have increased by 3.01%, forests have decreased by 1.57%, rain-fed orchards have increased by 4.37%, and irrigated crops and vegetables have also increased by 0.44%. On the other hand, there has been a reduction in rain-fed vegetables and crops of 1.09%, and a reduction in open rangelands and bare soils of 2.96% and 2.53%, respectively. This is to be expected under climate change and environment conditions, which caused variability in rainfall during and across seasons. These findings have been emphasized previously in the Yarmouk Basin as in [24,48] and in similar cases [49].
Urbanization mainly happened on expenses of rangelands and rain-fed vegetables and crops areas, as well as the expansion of irrigated areas, also on expenses of rangelands. These trends of land use/cover changes, particularly the urban areas with a high percentage of change at 3.01%, have added further pressure on water supply and led to the over-pumping of groundwater to balance inhabitants demand in the Yarmouk Basin [7,10]. Findings of [50,51] showed that need for water has risen with urbanization and land uses. Focusing on dimensions around the world, changes in land use, particularly urbanization are currently on the schedule of policy-makers to provide tools and policies to deal with urbanization and land changes [52]. In Jordan, the Ministry of Water and Irrigation, water-managers and decision-makers disclose illegal land use practices and audit groundwater abstraction data.

3.2. Water Supply and Demand in the Yarmouk River Basin Governorates for the Years 1997, 2007 and 2017

Results in land use/cover show that urbanization is vital and dynamic, with a high percentage of changes between classes over twenty years. This would certainly affect the supply and demand of water. The trend of urbanization has increased the pumping of domestic wells to balance the inhabitants’ demands. This is also clearly observed from the calculation, as shown in Table 3. Table 3 shows the inhabitants, per capita water, water demand, supply from internal domestic wells, inter-basins domestic supply, total water supply, water losses, and actual consumption in the Yarmouk River Basin governorates and the entire basin for the years 1997, 2007 and 2017.
From the calculations for this study (Table 3), the demand for domestic water for the years 1997, 2007 and 2017 showed remarkable changes as evidenced by the significant increase in population in the governorates, as well as in the entire basin. Although the Jordanian decision-makers have taken measures to reduce the per capita share of water among the governorates [42,43,44], the demand is still increasing and exceeding the supply from internal basin wells. The inhabitants of the basin are concentrated in Irbid, followed by Mafraq, although the increases in growth rate percentages over twenty years were concentrated in Mafraq, followed by Irbid [10], due to the influx of Syrian Refugees to Mafraq located near the Syrian border [53], but the highest demand for domestic water among the four governorates in the Yarmouk River Basin is the Irbid governorate, where domestic water demand reached 18.37 MCM, 24.3 MCM and 34 MCM for the years 1997, 2007 and 2017, respectively. These quantities of water demand exceed the water supply from the wells within basin, although the per capita water was about 97.6 lpcd, 86.7 lpcd and 73.8 lpcd for the years 1997, 2007 and 2017, respectively. Reducing the per capita share of water will not compensate for the increase in water demand. The same trend was observed in Mafraq, Jerash and Ajloun governorates.
Focusing on the entire Yarmouk River Basin, the total inhabitants of the basin were 639,992, 928,120 and 1,526,375 for the years 1997, 2007 and 2017, respectively. The domestic demand for water changed from 26.49 MCM in 1997 to 31.56 MCM in 2007 and reached 45.01 MCM in 2017 although the per capita water was about 115.3 lpcd, 93.2 lpcd and 81 lpcd for the years 1997, 2007 and 2017, respectively. The available water from domestic wells within the basin has also been changed from 10.52 MCM in 1997 to 12.64 MCM in 2017. This means that pumping more water from internal wells and reducing the per capita share of water, demand will exceed supply necessitating the management of water supply and demand [54,55].

3.3. Management of Water Supply and Demand in the Yarmouk River Basin

Jordanian decision-makers face the challenge of securing additional domestic water sources besides calculating water losses [25,38,56]. This kind of management requires several pumping stations and reservoirs in order to bridge the gap between supply and demand within the Yarmouk Basin [57]. For this study, Figure 4 summarizes and shows the internal and inter-basin domestic water supply for the Yarmouk River Basin. It also shows the pumping stations, well fields, reservoirs, domestic wells, water supply network and the boundaries of the governorates and villages of the Yarmouk River Basin. It can be seen from Figure 4, that the external well fields provide several pumping stations and reservoirs to supply and compensate for the water deficit in the Yarmouk Basin [57], especially, the major governorates, Mafraq and Irbid. The main inter-basin for Irbid Governorate is the well fields of Wadi Al-Arab which supply the Zabdah Reservoir with about 2100 m3/h. In addition, the Kufr Asad wells supply Kufr Asad Reservoir with about 214 m3/h, and Za’atari supplies Hufa with about 700 m3/h. The main inter-basin for Mafraq Governorate is from the Za’atari which supplies Um Elloollo 150 m3/h and Smayya 500 m3/h for a total of 650 m3/h. The governorates of Jerash and Ajloun within the Yarmouk River Basin lack internal domestic wells, and, therefore, the domestic water supply comes from the inter-basins of Zabdah and Um Elloollo reservoirs, where Zabdah Reservoir provides Hufa and Samad Stations, while the Um Elloolo Reservoir provides Hufa to meet the population’s needs. The supply quantities from the inter-basins in MCM of each governorate and the entire Yarmouk Basin are shown in Table 3. The total water supply MCM comes from the supply from internal wells MCM and the supply from inter-basin MCM, so the total water supply will meet the demand of each governorate.
Calculating water losses is a priority of the Ministry of Water and Irrigation and the Yarmouk Water Company [38,57,58,59]. Losses in the water distribution system have led to a shortage in the water supply and, thus, in the actual consumption of water of the inhabitants. It is indicated that the water loss is about 50% [38,54]. Table 3 shows the percentages of water loss and the actual consumption of water. Mafraq Governorate is considered to have the highest water loss among the four governorates in the Yarmouk River Basin, as the water losses were 78.9% in 1997, 67% in 2007 and reached 62% in 2017. These water loss percentages resulted in an actual consumption of about 1.48 MCM, 1.88 MCM and 3.27 MCM for the years 1997, 2007 and 2017, respectively. Irbid Governorate followed Mafraq in losses, as the water losses reached 49.5% in 1997, 45% in 2007 and reached 43% in 2017. These water loss percentages resulted in an actual consumption of about 9.28 MCM, 13.34 MCM and 19.38 MCM for the years 1997, 2007 and 2017, respectively. The water loss in the entire Yarmouk River Basin reached 57.4% in 1997, 48.6% in 2007 and 46.3% in 2017. These water loss percentages resulted in an actual consumption of water of about 11.53 MCM, 16.23 MCM and 24.20 MCM for the years 1997, 2007 and 2017, respectively. It is clear from these calculations that water losses has decreased, and the actual consumption has increased over the last twenty years.

4. Conclusions

The Yarmouk River Basin is one of the most important basins in Jordan. There are serious changes in the uses of water resources of the Yarmouk Basin water resources, and great concern has been given to changes in land use/cover, as the basin land is affected by sudden population growth, human activities, limited water resources, water losses and illegal land use practices. Linking the changes in land classes with water supply and demand in terms of using satellite imageries over twenty years, analyzing land use maps, calculating inhabitants within the basin and their water demand, internal water supply, total water supply, water loss and actual water consumption is the basis for understanding the interactions of basin land with water resources and highlighting supply demand management actions.
The findings of the calculations of this study showed that urbanization negatively affects rangelands, forests and water supplies from internal wells. The domestic demand for water is increasing, and the per capita share of water is decreasing, and the supply from internal wells is unable to meet the basin’s water needs. Managing water supply and demand under land use/cover changes in the basin will address the challenge of providing sufficient quantities of water supply to meet the water demand. Land management in terms of changing land use practices, such as inter-basin water supply and water losses calculation and reduction, will increase actual water consumption. The findings can assist decision-makers, water-managers and land-planners who face enormous challenges in finding more alternatives in land management practices for the future of water.

Funding

This research was funded by the Scientific Research and Innovation Support Fund—Ministry of Higher Education and Scientific Research, Jordan [Grant Number: WE/2/08/2017].

Data Availability Statement

The data presented in this manuscript are available upon request of the authors.

Acknowledgments

Special thanks and appreciation to the Scientific Research and Innovation Support Fund-Ministry of Higher Education and Scientific Research, The Hashemite Kingdom of Jordan, for the financial support through the [WE/2/08/2017] project. Special thanks also to the Deanship of Scientific Research, The University of Jordan, Amman, Jordan, for providing research facilities.

Conflicts of Interest

The author declares no conflict of interest.

References

  1. Winkler, K.; Fuchs, R.; Rounsevell, M.; Herold, M. Global land use changes are four times greater than previously estimated. Nat. Commun. 2021, 12, 2501. [Google Scholar] [CrossRef]
  2. Luyssaert, S.; Jammet, M.; Stoy, P.; Estel, S.; Pongratz, J.; Ceschia, E.; Churkina, G.; Don, A.; Erb, K.; Ferlicoq, M.; et al. Land management and land-cover change have impacts of similar magnitude on surface temperature. Nat. Clim. Chang. 2014, 4, 389–393. [Google Scholar] [CrossRef] [Green Version]
  3. Lambin, E.F.; Turner, B.L.; Geist, H.J.; Agbola, S.B.; Angelsen, A.; Bruce, J.W.; Coomes, O.T.; Dirzo, R.; Fischer, G.; Folke, C.; et al. The cause of land-use and land-cover change: Moving beyond the myths. Glob. Environ. Chang. 2001, 11, 261–269. [Google Scholar] [CrossRef]
  4. Giri, C.; Pengra, B.; Long, J.; Loveland, T.R. Next generation of global land cover characterization, mapping, and monitoring. Int. J. Appl. Earth Obs. Geoinf. 2013, 25, 30–37. [Google Scholar] [CrossRef]
  5. Kleemann, J.; Baysal, G.; Bulley, H.N.N.; Fürst, C. Assessing driving forces of land use and land cover change by a mixed-method approach in north-eastern Ghana West Africa. J. Environ. Manag. 2017, 196, 411–442. [Google Scholar] [CrossRef]
  6. Marchant, R.; Richer, S.; Boles, O.; Capitani, C.; Courtney-Mustaphi, C.J.; Lane, P.; Prendergast, M.E.; Stump, D.; De Cort, G.; Kaplan, J.O.; et al. Drivers and trajectories of land cover change in East Africa: Human and environmental interactions from 6000 years ago to present. Earth-Sci. Rev. 2018, 178, 322–378. [Google Scholar] [CrossRef]
  7. Shammout, M.W.; Shatanawi, M.; Nelson, J. Curve Number Applications for Restoration the Zarqa River Basin. Sustainability 2018, 10, 586. [Google Scholar] [CrossRef] [Green Version]
  8. Mongelli, G.; Argyraki, A.; Lorenzo, M.L.G.; Shammout, M.W.; Paternoster, M.; Simeone, V. Groundwater Quality in the Mediterranean Region. Geofluids 2019, 2019, 7269304. [Google Scholar] [CrossRef]
  9. Anderson, M.G.; Burt, T.P. The role of topography in controlling through flow generation. Earth Surf. Process. 1978, 3, 331–344. [Google Scholar] [CrossRef]
  10. Shammout, M.W.; Shatanawi, K.; Abualhaija, M.M. Influence of Population Growth on Supply, Demand, and Quality Issues of Water Resources in the Yarmouk River Basin in Jordan. J. Exp. Biol. Agric. Sci. 2023, 11, 171–178. [Google Scholar] [CrossRef]
  11. Kaushal, S.S.; Gold, A.J.; Mayer, P.M. Land Use, Climate, and Water Resources—Global Stages of Interaction. Water 2017, 9, 815. [Google Scholar] [CrossRef] [PubMed]
  12. Weatherhead, E.K.; Howden, N.J.K. The relationship between land use and surface water resources in the UK. Land Use Policy 2009, 26 (Suppl. S1), S243–S250. [Google Scholar] [CrossRef]
  13. Savenije, H.H.G.; Van der Zaag, P. Integrated water resources management: Concepts and issues. Phys. Chem. Earth 2008, 33, 290–297. [Google Scholar] [CrossRef]
  14. Foley, J.A.; DeFries, R.; Asne, G.P.; Barford, C.; Bonan, G.; Carpenter, S.R.; Chapin, F.S.; Coe, M.T.; Daily, G.C.; Gibbs, H.K.; et al. Global consequences of land use. Science 2005, 309, 570–574. [Google Scholar] [CrossRef] [PubMed] [Green Version]
  15. Maitima, J.M.; Mugatha, S.M.; Reid, R.S.; Gachimbi, L.N.; Majule, A.; Lyaruu, H.; Pomery, D.; Mathai, S.; Mugisha, S. The linkages between land use change, land degradation and biodiversity across East Africa. Afr. J. Environ. Sci. Technol. 2009, 3, 310–325. [Google Scholar]
  16. Cai, X.; McKinney, D.C.; Rosegrant, M.W. Sustainability analysis for irrigation water management in the Aral Sea region. Agric. Syst. 2003, 76, 1043–1066. [Google Scholar] [CrossRef] [Green Version]
  17. Fang, C.L.; Bao, C.; Huang, J.C. Management implications to water resources constraint force on socioeconomic system in rapid urbanization: A case study of the Hexi Corridor, NW China. Water Resour. Manag. 2007, 21, 1613–1633. [Google Scholar] [CrossRef] [Green Version]
  18. Apollonio, C.; Balacco, G.; Novelli, A.; Tarantino, E.; Piccinni, A.F. Land Use Change Impact on Flooding Areas: The Case Study of Cervaro Basin (Italy). Sustainability 2016, 8, 996. [Google Scholar] [CrossRef] [Green Version]
  19. Li, L.; Eetvelde, V.; Cheng, X.; Uyttenhove, P. Assessing storm water runoff reduction capacity of existing green infrastructure in the city of Ghent. Int. J. Sustain. Dev. World Ecol. 2020, 27, 749–761. [Google Scholar] [CrossRef]
  20. Chow, V.T.; Maidment, D.R.; Mays, L.W. Applied Hydrology; McGraw-Hill Book Company: New York, NY, USA, 1988. [Google Scholar]
  21. Luo, G.P.; Zhou, C.H.; Chen, X.; Li, Y. A methodology of characterizing status and trend of land changes in oases: A case study of Sangong River watershed, Xinjiang, China. J. Environ. Manag. 2008, 88, 775–783. [Google Scholar] [CrossRef]
  22. Gautam, N.C.; Shankar, R.; Raghavswamy, G.V.; Narasimha Rao, K.; Nagaraja, R.; Saxena, M.R.; Jayanthi, S.C.; Suesh, L.S. Spatial Analysis of Land use/ Land cover over India using satellite based remote sensing techniques. India J. Agric. Econ. 2000, 55 (Suppl. S2), 19–28. [Google Scholar] [CrossRef]
  23. Demir, O.; Yaçinkaya, M.; Atasoy, M.; Bayrak, T.; Bryik, C. Evaluating sustainable land use for the Değirmendere valley: A case study from northeastern Turkey. Int. J. Sustain. Dev. World Ecol. 2007, 14, 626–633. [Google Scholar] [CrossRef]
  24. Awawdeh, M.; Jaradat, R. Evaluation of aquifers vulnerability to contamination in the Yarmouk river basin, Jordan, based on DRASTIC method. Arab. J. Geosci. 2010, 3, 273–282. [Google Scholar] [CrossRef]
  25. MWI—Ministry of Water and Irrigation. National Water Strategy of Jordan 2016–2025; Hashemite Kingdom of Jordan: Amman, Jordan, 2016; Available online: http://extwprlegs1.fao.org/docs/pdf/jor156264E.pdf (accessed on 15 April 2023).
  26. El-Naser, H. Management of Scarce Water Resources: A Middle Eastern Experience; Witpress: Southampton, UK, 2009; Available online: https://www.witpress.com/books/978-1-84564-414-7 (accessed on 1 April 2023).
  27. Obeidat, M.; Awawdeh, M.; Lababneh, A. Assessment of land use/land cover change and its environmental impacts using remote sensing and GIS techniques, Yarmouk River Basin, north Jordan. Arab. J. Geosci. 2019, 12, 685. [Google Scholar] [CrossRef]
  28. Al-Ansari, N.; Alibrahiem, N.; Alsaman, M.; Knutsson, S. Water Supply Network Losses in Jordan. J. Water Resour. Prot. 2014, 6, 83–96. [Google Scholar] [CrossRef] [Green Version]
  29. MWI—Ministry of Water and Irrigation. Jordan Water Sector, Facts and Figures 2015; Ministry of Water and Irrigation Amman: Amman, Jordan, 2015. [Google Scholar]
  30. Sala, O.E.; Chapin, F.S.; Armesto, J.J.; Berlow, E.; Bloomfield, J.; Dirzo, R.; Huber-Sanwald, E.; Huenneke, L.F.; Jackson, R.B.; Kinzig, A.; et al. Global biodiversity scenarios for the year 2100. Science 2000, 287, 1770–1774. [Google Scholar] [CrossRef]
  31. Hussein, H. Whose ‘reality’? Discourses and hydropolitics along the Yarmouk River. Contemp. Levant 2017, 2, 103–115. [Google Scholar] [CrossRef] [Green Version]
  32. Hussein, H. Yarmouk, Jordan, and Disi basins: Examining the impact of the discourse of water scarcity in Jordan on transboundary water governance. Mediterr. Politics 2019, 24, 269–289. [Google Scholar] [CrossRef] [Green Version]
  33. Zeitoun, M.; Abdallah, C.; Dajani, M.; Khresat, S.; Elaydi, H.; Alfarra, A. The Yarmouk tributary to the Jordan River I: Agreements impeding equitable transboundary water arrangements. Water Altern. 2019, 12, 1064–1094. [Google Scholar]
  34. Al-Ansari, N.; Al-Oun, S.; Hadad, W.; Knutsson, S. Water loss in Mafraq Governorate, Jordan. Nat. Sci. 2013, 5, 333–340. [Google Scholar] [CrossRef] [Green Version]
  35. FAO. AQUASTAT Transboundary River Basins Overview—Jordan; Food and Agriculture Organization of the United Nations (FAO) Reports; FAO: Rome, Italy, 2009; Available online: http://www.fao.org/3/CA2131EN/ca2131en.pdf (accessed on 1 May 2023).
  36. Shammout, M.W.; Abualhaija, M.M. An analysis of long term yearly water flow trend and its impact on sediment yield in King Talal dam. Int. J. Eng. Res. Technol. 2019, 12, 3041–3049. [Google Scholar]
  37. Ta’any, R.; Batayneh, A.; Jaradat, R. Evaluation of Groundwater Quality in the Yarmouk Basin, North Jordan. J. Environ. Hydrol. 2007, 15, 28. [Google Scholar]
  38. MWI—Ministry of Water and Irrigation. Water Year Book, Hydrological Year 2016–2017, Spring, Surface Water and Ground Water; Hashemite Kingdom of Jordan: Amman, Jordan, 2018. Available online: http://waterjo.mwi.gov.jo/Ar/DocLib/Water%20Yearbook%202016-2017.pdf (accessed on 1 May 2023).
  39. Avisse, N.; Tilmant, A.; Rosenberg, D.; Talozi, S. Quantitative Assessment of Contested Water Uses and Management in the Conflict-Torn Yarmouk River Basin. J. Water Resour. Plan. Manag. 2020, 146, 05020010. [Google Scholar] [CrossRef]
  40. RJGC—Royal Jordanian Geographic Centre. Images Specification; Hashemite Kingdom of Jordan: Amman, Jordan, 2021. [Google Scholar]
  41. DLS—Department of Lands & Survey. Detection, Villages, and Basins within the Kingdom and Its Borders; Hashemite Kingdom of Jordan: Amman, Jordan, 2021. Available online: https://www.dls.gov.jo/ (accessed on 15 August 2020).
  42. MWI—Ministry of Water and Irrigation. Open Files; Hashemite Kingdom of Jordan: Amman, Jordan, 1997. Available online: https://www.mwi.gov.jo (accessed on 1 July 2020).
  43. MWI—Ministry of Water and Irrigation. Open Files; Hashemite Kingdom of Jordan: Amman, Jordan, 2007. Available online: https://www.mwi.gov.jo (accessed on 1 July 2020).
  44. MWI—Ministry of Water and Irrigation. Open Files; Hashemite Kingdom of Jordan: Amman, Jordan, 2017. Available online: https://www.mwi.gov.jo (accessed on 1 July 2020).
  45. DoS—Department of Statistics. Open Files; Hashemite Kingdom of Jordan: Amman, Jordan, 1997. Available online: https://dosweb.dos.gov.jo/ (accessed on 1 July 2020).
  46. DoS—Department of Statistics. Open Files; Hashemite Kingdom of Jordan: Amman, Jordan, 2007. Available online: https://dosweb.dos.gov.jo/ (accessed on 1 July 2020).
  47. DoS—Department of Statistics. Open Files; Hashemite Kingdom of Jordan: Amman, Jordan, 2017. Available online: https://dosweb.dos.gov.jo/ (accessed on 1 July 2020).
  48. Al-Bakri, J.T.; Shawash, S.; Ghanim, A.; Abdelkhaleq, R. Geospatial Techniques for Improved Water Management in Jordan. Water 2016, 8, 132. [Google Scholar] [CrossRef] [Green Version]
  49. Arifeen, H.M.; Phoungthong, K.; Mostafaeipour, A.; Yuangyai, N.; Yuangyai, C.; Techato, K.; Jutidamrongphan, W. Determine the Land-Use Land-Cover Changes, Urban Expansion and Their Driving Factors for Sustainable Development in Gazipur Bangladesh. Atmosphere 2021, 12, 1353. [Google Scholar] [CrossRef]
  50. Muller, M.F.; Yoon, J.; Gorelick, S.M.; Avisse, N.; Tilmant, A. Impact of the Syrian refugee crisis on land use and transboundary freshwater resources. Proc. Natl. Acad. Sci. USA 2016, 113, 14932–14937. [Google Scholar] [CrossRef]
  51. Rajsekhar, D.; Gorelick, S.M. Increasing drought in Jordan: Climate change and cascading Syrian land-use impacts on reducing transboundary flow. Sci. Adv. 2017, 3, e1700581. [Google Scholar] [CrossRef] [Green Version]
  52. Weith, T.; Barkmann, T.; Gaasch, N.; Rogga, S.; Strauß, C.; Zscheischler, J. Sustainable Land Management in a European Context: A Co-Design Approach. Hum.-Environ. Interact. 2021, 8, 347. [Google Scholar] [CrossRef]
  53. UNHCR—United Nations High Commissioner for Refugees. Factsheet-Mafraq Governorate. 2015. Available online: https://www.unhcr.org (accessed on 20 January 2023).
  54. Shatanawi, M.; Shammout, M.W. Supply-demand modeling of water resources in Zarqa river basin in Jordan. Int. J. Appl. Environ. Sci. 2011, 6, 261–278. [Google Scholar]
  55. Nuissl, H.; Siedentop, S. Urbanisation and Land Use Change. In Sustainable Land Management in a European Context; Weith, T., Barkmann, T., Gaasch, N., Rogga, S., Strauß, C., Zscheischler, J., Eds.; Springer: Cham, Switzerland, 2021; Volume 8, pp. 75–99. [Google Scholar] [CrossRef]
  56. MWI—Ministry of Water and Irrigation. Water Sector Green Growth National Action Plan 2021–2025; Hashemite Kingdom of Jordan: Amman, Jordan, 2020. [Google Scholar]
  57. YWC—Yarmouk Water Company. Open Files; Hashemite Kingdom of Jordan: Irbid, Jordan, 2019. [Google Scholar]
  58. MWI—Ministry of Water and Irrigation. Jordan Water Utilities Monitoring Report 2020; Utilities Performance Monitoring Unit (UPMU): Amman, Jordan, 2020. [Google Scholar]
  59. MWI—Ministry of Water and Irrigation. Jordan Water Utilities Monitoring Report 2019; Utilities Performance Monitoring Unit (UPMU): Amman, Jordan, 2019. [Google Scholar]
Figure 1. Location of the Yarmouk River Basin among the surface water basins of Jordan and within the main four governorates of Jordan.
Land 12 01518 g001
Figure 2. The Yarmouk River Basin tributaries and the Yarmouk River, treatment plants, dams, and major cities and towns.
Land 12 01518 g002
Figure 3. Land use/cover maps of the Yarmouk River Basin during 1997–2017: (A) 1997; (B) 2007; (C) 2017.
Land 12 01518 g003
Figure 4. Internal and inter-basin domestic water supply for the Yarmouk River Basin.
Land 12 01518 g004
Table 1. The images specification [40].
Image SpecificationsDate
Acquired
Grid Cell Size ReflectiveBand
Landsat Thematic Mapper
(TM)
8 July 199730 mBand-1 0.45–0.52 µm (8 bit GeoTIFF)
Band-2 0.52–0.60 µm (8 bit GeoTIFF)
Band-3 0.63–0.69 µm (8 bit GeoTIFF)
Band-4 0.76–0.90 µm (8 bit GeoTIFF)
ALOS AVNIR-2 ORI 12 October 200710 mBand-1 0.42–0.50 µm (8 bit GeoTIFF)
Band-2 0.52–0.60 µm (8 bit GeoTIFF)
Band-3 0.61–0.69 µm (8 bit GeoTIFF)
Band-4 0.76–0.89 µm (8 bit GeoTIFF)
Sentinel-2
(European earth polar-orbiting satellite)
10 July 201710 mBand-1 (Blue) 0.49 µm
Band-2 (Green) 0.56 µm
Band-3 (Red) 0.665 µm
Band-4 (NIR) 0.842 µm
Table 2. Land use/cover distribution in % of the Yarmouk River Basin for the years 1997, 2007 and 2017.
Land Use Distribution (%)1997
%
2007
%
2017
%
% Change 1997–2017
Bare Soil23.1720.8220.64−2.53
Urban Area8.3910.4811.43.01
Extraction Sites0.290.290.290
Forest6.454.854.88−1.57
Rangelands23.8923.2420.93−2.96
Irrigated Orchards2.422.532.650.23
Irrigated Vegetables and Crops1.141.231.580.44
Rain-fed Orchards7.1710.3311.544.37
Rain-fed Vegetables and Crops27.0426.1125.95−1.09
Water bodies0.030.120.140.11
Total100100100
Table 3. Inhabitants, per capita water, water demand, supply from internal domestic wells, inter-basins domestic supply, total water supply, water losses and actual consumption in the Yarmouk River Basin governorates and the entire basin for the years 1997, 2007 and 2017.
Governorate-YearInhabitantsPer Capita Water LpcdWater Demand
MCM
Supply from Internal Wells MCMSupply from Inter-Basin
MCM
Total Water Supply
MCM
Water
Losses
%
Actual
Consumption MCM
Mafraq-199773,834256.76.924.42.6778.91.48
Mafraq-2007109,635141.55.663.951.755.69671.88
Mafraq-2017180,458129.98.564.24.48.6623.27
Irbid-1997515,59097.618.376.1212.2518.3749.59.28
Irbid-2007767,86586.724.35.31924.34513.34
Irbid-20171,262,54973.8348.425.6344319.38
Jerash-199725,17482.80.7600.80.847.40.42
Jerash-200721,59575.80.6000.60.6380.37
Jerash-201735,57686.61.120.041.11.14360.73
Ajloun-199725,39496.50.8900.90.9600.36
Ajloun-200729,02592.31011400.6
Ajloun-201747,79276.71.3301.331.33380.83
Entire Basin-1997639,992115.326.9410.5216.5527.0957.411.53
Entire Basin-2007928,12093.231.569.2422.431.6448.616.26
Entire Basin-20171,526,3758145.0112.6432.4345.0746.324.20
Disclaimer/Publisher’s Note: The statements, opinions and data contained in all publications are solely those of the individual author(s) and contributor(s) and not of MDPI and/or the editor(s). MDPI and/or the editor(s) disclaim responsibility for any injury to people or property resulting from any ideas, methods, instructions or products referred to in the content.

