Article

High-Speed Rail and Industrial Agglomeration: Evidence from China’s Urban Agglomerations

School of Economics and Management, Beijing Jiaotong University, Beijing 100044, China
*
Author to whom correspondence should be addressed.
Land 2023, 12(8), 1570; https://doi.org/10.3390/land12081570
Submission received: 18 July 2023 / Revised: 5 August 2023 / Accepted: 7 August 2023 / Published: 8 August 2023
(This article belongs to the Special Issue Geospatial Data in Land Suitability Assessment)

Abstract

:
This paper explores the relationship between high-speed rail (HSR) and industrial agglomeration within urban agglomerations. The paper selects the data of the Beijing–Tianjin–Hebei Urban Agglomeration (BJHUA) and Central Plains Urban Agglomeration (CPUA) from 2002 to 2016 as the research object. The time-varying difference-in-difference (TVDID) model is innovatively applied to analyze the impact of HSR on the agglomeration of secondary and tertiary industries in urban agglomerations, and the industrial agglomeration effects of the two urban agglomerations are compared. The results show that the influence of high-speed railways on the industrial agglomeration of urban agglomerations is heterogeneous. In the BJHUA, the impact of HSR on the agglomeration of secondary and tertiary industries is not particularly significant. On the other hand, in the CPUA, HSR does not have a significant impact on the agglomeration of secondary industry. However, it does have a significant negative effect on the agglomeration of tertiary industry. In addition, further analysis reveals significant variations in the impact of HSR on the agglomeration of industries within urban agglomerations after excluding the central cities. It is important to note that the impact of HSR on regional industries can be complex and multifaceted. The findings enrich the theoretical understanding of the relationship between HSR and industrial agglomeration.

1. Introduction

The COVID-19 pandemic has demonstrated the importance of industrialization and resilient infrastructure such as transportation in rebuilding a better home and achieving sustainable development goals [1]. Various countries and public transportation authorities have implemented incentive measures and coherent financial frameworks to support the increased use of railways, and global HSR transport is expected to double compared to today’s levels by 2030 [2]. China’s density of HSR reached 145.5 km/10,000 square kilometers in 2019 [3]. China accounted for 69% of the global HSR operating mileage, as its HSR network spanned 37,900 km in 2020 [4]. China’s high-speed rail (HSR) system has undergone rapid development in recent years. There are 3665 high-speed EMUs on the railway line, and the operating length of the HSR network and the number of high-speed EMUs account for more than two-thirds of that of the world, ranking the first in the world [5].
With the improvement of transportation infrastructure, industrial agglomeration has also attracted widespread attention. The agglomeration economy has a significant impact on productivity within specific regions, and there are significant spatial spillover effects between neighboring regions as well [6]. Industrial agglomeration can result in labor concentration, shared suppliers, and specialization, which can contribute to increased productivity and economic growth as external benefits [7]. However, the effect of human capital similarity on service industry agglomeration is greater than that on manufacturing industry agglomeration [8]. There is a U-shaped trend between industrial agglomeration and environmental efficiency [9]. Therefore, it can be inferred that industrial agglomeration is highly necessary.
The impact of HSR on economic development, especially on industries, has also attracted attention. The HSR has already had a positive regional economic impact [10]; through facilitating the movement of industrial labor across regions and improving market accessibility, it promotes industrial agglomeration [11]. The existence of HSR promotes opportunities for employee communication and improves knowledge productivity [12]. Because high-speed rail can promote short-term population mobility, it thus increases the proportion of added value of tertiary industry [13]. The construction of HSR has a significant impact on the spatial layout of urban industries [14]. The impact of HSR on economic productivity is higher in areas with HSR stations, especially in areas within a radius of 150–200 km from large cities, rather than in areas adjacent to large cities [15]. The improvement of HSR network location levels may suppress the agglomeration of service industries in peripheral regions [16]. The impact of HSR on urban specialization and diversity is based on the distance of HSR services. High-speed rail promotes industrial diversity in cities located further away, while it promotes industrial specialization in cities located closer [17]. HSR has greatly shortened the temporal and spatial distance between regions; promoted the flow of capital, industry, population, and other factors between regions; and accelerated the connection between regions. In addition, industrial agglomeration acts as a mediator in the relationship between transportation infrastructure and energy efficiency [18]. The vitality of HSR stations depends on their interaction with existing urbanized areas, which is often lacking for stations located on the outskirts of cities [19].
There are no universally applicable standard results on the impact of HSR on regional, urban, and economic factors, as it varies in each case [20]. While the impact of transportation infrastructure on the economy itself may not be transformative, it can be achieved with other policy interventions [21]. China proposed to build a convenient and smooth urban (agglomeration) transport network by 2035 [22]. Urban agglomerations are a state of urban development to a certain extent. Due to the unbalanced development of urban agglomerations, relatively backward market factors, unreasonable industrial structure, market barriers, and other reasons, the development gap between urban agglomerations is still large. What is the agglomeration effect of HSR on different urban agglomerations and different industries? Does it have the same aggregation effect on central and peripheral cities? These questions remain to be studied. To address the aforementioned issues, this article selects two representative urban agglomerations in China, namely the BTHUA and the CPUA, as the research objects. Data from 2002 to 2016 are collected, and a TVDID model is employed to investigate the impact of HSR on the agglomeration of different industries within the urban agglomerations.
Previous research on the economic impact of high-speed rail on urban agglomerations has predominantly focused on regions such as the Yangtze River Delta [23] or the BJHUA [24]. Specifically, the impact of HSR on industries has been primarily examined in relation to its effects on the service sector [25] and specific industries [26]. In contrast to previous studies, this research demonstrates innovation in the following aspects: This study adopts a comparative perspective to explore the impact of HSR on industry agglomeration within two urban agglomerations (BJHUA and CPUA) with significant economic development differences, as well as the impact of HSR on secondary and tertiary industries. And the innovation of this article also lies in using the TVDID method to study the impact of HSR on industry agglomeration. This study reveals significant heterogeneity in the industrial agglomeration effects of high-speed rail across different urban agglomerations, as well as its effects on the agglomeration of secondary and tertiary industries within the same urban agglomeration. The findings of this study enrich the theoretical understanding of the relationship between HSR and industry agglomeration. It also widens the application of the TVDID method in empirical research. Clarifying the role of HSR in the industrial agglomeration of urban agglomerations on secondary and tertiary industries is conducive to promoting the upgrading of the industrial structure of urban agglomerations and has important guiding significance for relevant departments to formulate industrial development policies for urban agglomerations. This study is of great significance to alleviate the unbalanced development of national economic regions and promote the sustainable development of urban agglomerations’ economic integration.
The section arrangement of this article is as follows: In the Literature Review section, relevant literature is summarized, organized, and evaluated according to specific modules. In the Case Study section, the construction of HSR in the BJHCU and CPUA is described. In the Model Design section, the TVDID model used in this study and the selection of variables are explained. In the Results and Discussion section, the parallel trend test is first conducted on the two city clusters. Then, the model results of the impact of HSR on the agglomeration of secondary and tertiary industries in the two urban agglomerations are separately explained and discussed. Secondly, in order to further discuss the robustness of the model results, the model results of the impact of HSR on the agglomeration of secondary and tertiary industries in the two urban agglomerations (excluding the central cities) are separately explained and discussed. Finally, a placebo test is conducted. In the Conclusion section, the results of the study are summarized, emphasizing the theoretical and practical significance of this research, as well as its limitations and prospects for future research.

2. Literature Review

The research on the impact of high-speed rail on the economic development and industrial agglomeration of urban agglomerations, as well as the DID model, provides a certain theoretical basis for this study.
In terms of the impact of HSR on the economic development of urban agglomerations, Wang et al. analyzed the impact of HSR on population mobility and urbanization in the Yangtze River Delta and found that it has a negative impact on population urbanization but promotes the upgrading of industrial structure [23]. Zhang et al. analyzed the impact of HSR on the spatial structure of BJHUA from the perspective of social networks and confirmed that HSR has a positive effect on the spatial connection density of urban agglomerations [24]. Okamoto and Sato found that Japan’s Shinkansen HSR would cause land prices to rise in large metropolitan areas [27]. Ahlfeldt and Feddersen explored the intensity and spatial extent of the impact of HSR on agglomeration [28]. Cui et al. explored the spatial relationship between high-speed traffic strength and land use efficiency in the Shandong Peninsula Urban agglomeration [29]. Li et al. studied the impact of HSR on the spatial reconstruction of urban agglomerations through taking the Chengdu–Chongqing urban agglomeration as an example and found that the urban system showed a trend of agglomeration and distribution [30]. Chinese scholars are the main researchers studying the impact of HSR on the economic development of urban agglomerations. The urban agglomerations involve the Yangtze River Delta urban agglomeration, BJHUA, Shandong Peninsula urban agglomeration, Chengdu–Chongqing urban agglomeration, etc. The research directions involve urbanization, industrial structure, spatial structure, land use efficiency, and the urban elasticity of urban agglomeration. These research results provide some theoretical basis and research experience for this research work.
In terms of the research about the impact of HSR on industrial agglomeration, Tian et al. used panel data to evaluate the impact of the Wuhan–Guangzhou HSR on the agglomeration of service industries along the route and found that the Wuhan–Guangzhou HSR produced a spillover effect and a siphon effect [25]. Li et al. found that HSR has a significant positive impact on urban economic efficiency and a significant threshold effect on the improvement of service sector efficiency from the perspective of agglomeration economy [26]. Dai et al. analyzed the influence of the Beijing–Shanghai HSR on surrounding subdivided industries based on agglomeration and diffusion theory and found that it produced agglomeration effects on 11 subdivided industries in cities with stations [31]. Cheng et al. explored the role of HSR in promoting economic integration and regional specialization in China and the European Union [32]. Shao et al. found that HSR has a positive impact on the service industry agglomeration of the Yangtze River Delta urban agglomeration in China, and HSR does not weaken the service industry agglomeration of small and medium-sized cities located along the railway and around the core cities [33]. Vickerman believed that the service level and potential economic impact of HSR on the intermediate areas between metropolitan areas are not significant [34]. Masson and Petiot proposed that HSR intensifies spatial competition among tourist destinations through improving accessibility and that it brings tourism agglomeration [35]. As for the influence of HSR on industrial agglomeration, most researchers are focused on the influence of HSR on the agglomeration of the service industry, the agglomeration of subdivided industries, and the diversity and specialization of regional industries. In terms of research objects, a certain HSR line or an entire region is mostly selected for research.
In terms of the TVDID model, many scholars have used the difference-in-difference (DID) model to evaluate the effect of policy implementation, software application, effect of HSR or subway and enterprise alliance effect, etc. Stuart et al. believed that the DID model has outstanding advantages in analyzing policy effectiveness [36]. Bertoni et al. used the difference-in-difference coarsened exact method to study the effect of implementing agricultural environmental measures on improving green agricultural practices [37]. Koltai used the DID method to analyze the impact of deciding whether or not to be vaccinated against COVID-19 on mental health [38]. Beck et al. assessed the impact of bank deregulation on income distribution in the United States through applying the TVDID model [39]. Tang et al. adopted the super-SBM DEA model, DID, and DDD methods to evaluate the impact of command-and-control regulation policy on enterprises’ green innovation performance [40]. Turunen et al. used the DID model to assess the impact of the participatory working-time-scheduling software on the sick absences of Finnish hospital staff [41]. Douglas and Tan embraced the DID model to study the impact of the formation of global aviation alliances and the expansion of network scope on the profitability of founding member enterprises [42]. Fan et al. adopted the TVDID model to analyze the spillover effect of the subway on the housing prices and area around it [43]. Zhu et al. used the multi-stage DID method to evaluate the impact of HSR on urban land expansion in China [44]. The DID model and TVDID model have a wide range of applications in evaluating the implementation effects of policies and measures. The applied research of the DID model in related fields provides a certain theoretical basis and research experience for the research work of this paper.
In conclusion, some achievements have been made in studies about the impact of HSR on urban economic development, but there are still some limitations. In terms of research objects, most of the current research focuses on a certain railway line or a certain region. And most of the urban agglomerations involved are in the middle and lower reaches of the Yangtze River; however, there is few research on urban agglomerations in north and central China. In terms of research directions, most of them focus on the study of urbanization, industrial structure, spatial structure, and the agglomeration of the service industry, while there is few research on the agglomeration of secondary industry. Assessing the impact of HSR on secondary and tertiary industry agglomeration in the BJHUA and the CPUA is the focus of this paper.

3. Case Study

In view of the limitations of previous studies, the BJHUA and CPUA are selected as research objects to analyze the impact of HSR on the industrial agglomeration of the two urban agglomerations. The reason for selecting these two city clusters is that there is a significant difference in economic development level between the two urban agglomerations. The cities within the BJHUA have a large disparity in economic development [45], while the overall economic development strength of the CPUA is not strong [46]. Choosing these two city clusters as the research objects highlights the differences in the model results.

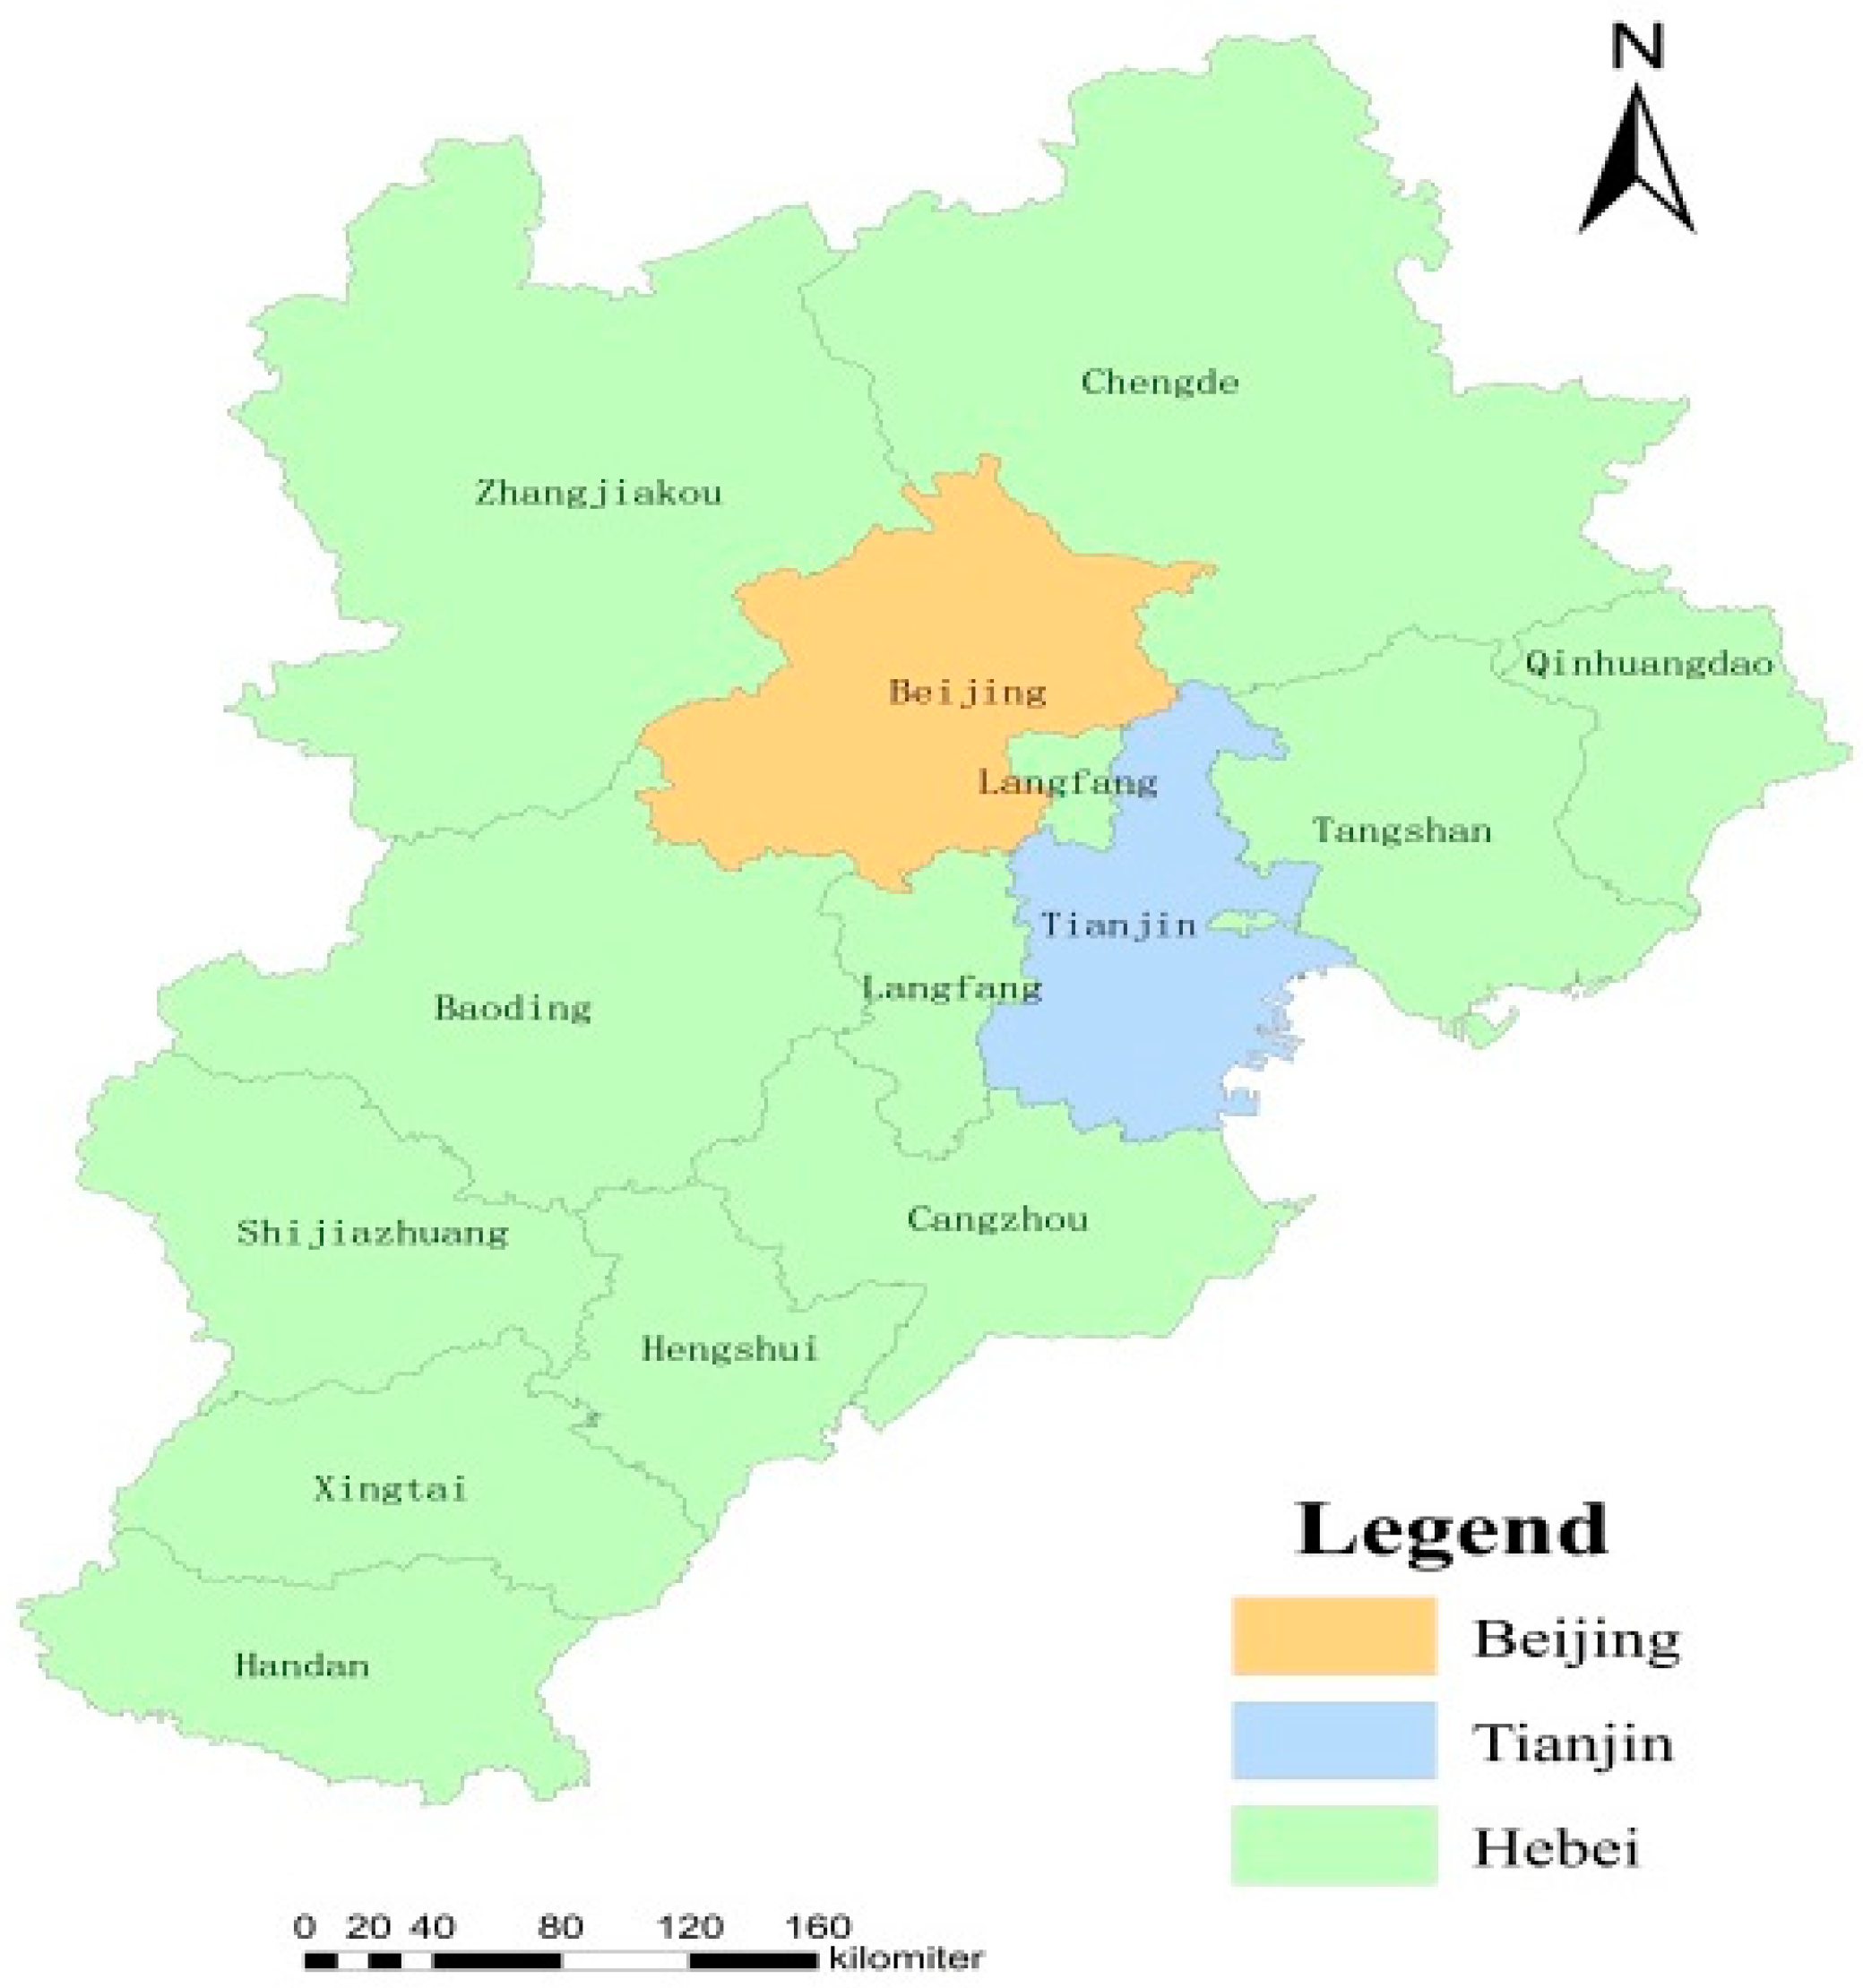
3.1. Beijing–Tianjin–Hebei Urban Agglomeration

As shown in Figure 1, there are 13 cities in the BJHUA, including Beijing, Tianjin, and 9 cities in Hebei province, and this urban agglomeration covers an area of about 216,000 square kilometers, accounting for 2.3% of China’s land area [47]. The goal of the coordinated development of BTHUA is that by 2030, the regional integration pattern would be basically formed and the regional economic structure would be more reasonable [48]. The data of the BJHUA from 2002 to 2016 are studied. In 2003, Qinhuangdao in Hebei province became the first city to open high-speed trains. By the end of 2016, there were still three cities without high-speed trains. The details are shown in Table 1.

3.2. Central Plains Urban Agglomeration

As shown in Figure 2, the CPUA covers an area of 287,000 square kilometers, and its economic development is lower than BJHUA [49]. The Zhongyuan urban agglomeration includes 18 cities in Henan province, 3 cities in Shanxi Province, 2 cities in Hebei province, 2 cities in Shandong province, and 5 cities in Anhui province, a total of 30 cities in five provinces [49].
The CPUA development plan pointed out that it is located between the east and the west of China, with the obvious function of being a transportation link [50]. In 2018, views on the establishment of new and more effective mechanisms for coordinated regional development clearly stated that Zhengzhou should be the center to lead the overall development of the CPUA and promote the integration and complementarity between regional cities [51].
In 2010, Zhengzhou and Sanmenxia became the first cities in the Central Plains Urban Agglomeration to open an HSR network, as shown in Table 2. By the end of 2016, a total of 18 cities had opened high-speed trains, but 12 cities were still not along the line. The data of the Central Plains Urban Agglomeration from 2006 to 2016 are analyzed. And Jiyuan, a county-level city, is removed in order to maintain the consistency of the sample level.
The BJHUA and CPUA are two important economic growth engines in China. According to the economic development situation [52], this study designates the top two cities in terms of economic development as the central cities, while the remaining cities are designated as peripheral cities. For the BJHUA, Beijing and Tianjin are considered the central cities. For the CPUA, Zhengzhou and Luoyang are designated as the central cities. The selection of these two urban agglomerations provides a relatively perfect “quasi-natural experiment” for this paper to use the TVDID model to study the influence of HSR on the industrial agglomeration of different urban agglomerations.

4. Model Design

4.1. Data Source

(1)
The economic development data of the BJHUA and CPUA used in the model in this paper are from the National Statistical Yearbook (2003–2017) [52].
(2)
The HSR opening information is from China’s National Railway Administration’s official website [53].

4.2. Time-Varying Difference-in-Difference Model

The traditional DID model is expressed as follows:
Y i t = β 0 + θ P t × T i + x M i t + u i + δ t + ε i t
i stands for individual (i = 1, 2…, N), and t stands for time (t = 1, 2…, N). Y i t is the dependent variable, P t is a dummy variable which stands for whether the HSR is enabled (Yes = 1 and No = 0), and T i is a dummy variable which stands for whether the group is controlled (Yes = 1 and No = 0). P t × T i is the difference-in-difference estimator, and θ is the average processing effect. M i t is the other control variable, x is the coefficient of the control variable, u i is the fixed effect of the region, δ t is the fixed effect of time, and ε i t is the random disturbance term. However, due to the time difference between cities in the urban agglomeration to open HSR, the TVDID method is selected to analyze the influence of the opening of HSR on the industrial agglomeration of different urban agglomerations. The model is set as follows.
Y i t = β 0 + θ P i t × T i + x M i t + δ t + γ i + ε i t
P t in Formula (1) is replaced with P i t in Formula (2); that is, the opening time of HSR in the treatment group varies with individual i.
Formula (2) is equivalent to Formula (3).
Y i t = β 0 + θ Q i t + x M i t + δ t + γ i + ε i t
Q i t represents the virtual variable of the treatment group that varies from individual to individual. If individual i HSR opens in phase t, it represents entering the treatment group; then, the value of Q i t is 1 in all subsequent periods. Otherwise, it’s 0.

4.3. Variables

Factors such as economy, politics, history, industrial structure, wages, employment opportunities, land price, technology, and distance between cities are all important factors affecting industrial agglomeration and population mobility. Ma et al. calculated the resilience level of the urban agglomeration from the perspective of ecological environment, economy, social environment, and infrastructure services [54]. Wang et al. made a study of the spatial structure of the population movement and migration and found that economic, political, industrial structure, and historical factors are important factors which affect population movement [55]. Wang et al. believed that urban land price changes and national environmental regulation policies have a negative impact on chemical industry agglomeration [56]. Wei et al. deemed that efficiency changes and technological changes have different influences on urban industrial agglomeration efficiency for city clusters at different levels [57]. The research experience of these scholars provides some experience for the selection of variables.
(1)
Core explanatory variable
This paper mainly evaluates the influence of HSR on the industrial agglomeration of secondary and tertiary industries in BJHUA and CPUA. The core explanatory variable is the following dummy variable: whether the HSR is open or not. The coefficient θ of the dummy variable Q i t in Formula (3) is the main effect indicator we care about.
(2)
Dependent variable
Location quotient is an indicator used to measure the concentration of the commercial sector and industry specialization in a region [58]. Wu and Lin developed the location quotient to characterize the agglomeration of the steel industry and investigated the relationship between agglomeration and efficient energy services [59]. Li et al. used the location quotient to measure pollution-intensive industries and explored whether the agglomeration of pollution-intensive industries significantly increased residents’ health expenditures [60]. Morrissey utilized location quotient analysis and combined it with other methods to investigate regional industry specialization in relevant Irish sectors [61]. Prats used location quotients to estimate the specialization degree of different sectors in studying the impact of economic policy applications on various production activities and their effects on socio-economic groups [62]. The location quotient is selected as the dependent variable. The location quotient represents the degree of urban economic agglomeration. The formula is set as follows.
Q i j = X i j j X i j i X i j i j X i j
X i j represents the number of employees of i industry in j region; j X i j represents the number of employees in all industries in j region; i X i j represents the number of employees in all regions of i industry; i j X i j represent all industry employees in all regions. Q i j stands for location quotient. The greater the value of Q i j is, the higher the industrial agglomeration level of the region will be.
(3)
Control variables
In this paper, wage level, degree of openness, urban infrastructure level, permanent residents, and the technological development level of the city are selected as control variables. In order to keep the consistency of units, this paper deals with the variables logarithmically, as shown in Table 3.
(1)
Wage level. The wage level will have an impact on the economic agglomeration of the city. Higher wages attract more workers, but higher wages also increase firms’ wage costs. The role of agglomeration in wage fluctuations stems from the spatial proximity between firms, the pooling of labor markets, and knowledge spillovers [63]. Wage level is expressed as the average employee salary in a city.
(2)
Degree of openness. The actual utilization of foreign capital can reflect the degree of regional openness. Foreign investment can bring capital and technology, and industries with foreign investment will be more dynamic, thus influencing the regional industrial agglomeration. Foreign direct investment has a significant impact on industrial location patterns. Domestic firms set up factories near foreign companies to benefit from the spillover effects of foreign investment [64]. Specialized industrial structures absorb knowledge spillovers from foreign direct investment within cities and promote their dissemination to neighboring cities, while diversified industrial structures provide a vibrant environment for local innovation [65].
(3)
Urban infrastructure level. Investment in fixed assets can reflect the conditions of urban infrastructure, which is an important factor affecting industrial development, especially since the development of tertiary industry is more dependent on infrastructure. Road improvements have a positive effect on industrial agglomeration overall. Specifically, the improvement of the highway network has a positive impact on the agglomeration of non-local and related industries, while it has a negative impact on the agglomeration of local and unrelated industries [66].
(4)
Permanent residents. Permanent resident population is another key factor affecting industrial development. On the one hand, the permanent resident population provides a market for industrial development; on the other hand, it provides a labor force for industrial development. The existence of population diversity can and often does make a positive contribution to the economic growth of firms and innovation in urban areas [67]. Moderate population agglomeration is conducive to alleviating production and consumption pollution brought about by industrial agglomeration [68].
(5)
Technological development level. The number of college students is used to measure the technological development level of a city. Generally speaking, cities with a higher technological development level are more conducive to the agglomeration of tertiary industry. The implementation of export policies oriented toward high technology and subsidies for technological activities has encouraged specialization and concentration [69].

5. Results and Discussion

5.1. Parallel Trend Test

The TVDID method requires that the variables of the control group and the treatment group can meet the assumption of a parallel trend; that is, the cities of the control group and the treatment group have the same industrial agglomeration situation before the opening of HSR. In this paper, STATA16.0 is used to conduct parallel trend tests on the data of the BJHUA from 2002 to 2016 and CPUA from 2006 to 2016, respectively. On the basis of the data, variables, and model, the agglomeration effects of HSR on the tertiary and secondary industries of the BJHUA and CPUA are respectively evaluated. The parallel trend test is shown in Figure 3.
In Figure 3, (1) and (2) are the parallel trend test results of the effect of HSR on the agglomeration of tertiary industry and secondary industry in the BJHUA, respectively. And (3) and (4) are the parallel trend test results of the effect of HSR on the agglomeration of tertiary industry and secondary industry in the CPUA, respectively. All four datasets passed the parallel trend test. In view of the test results, the influence of the opening of HSR on the industrial agglomeration of different urban agglomerations can be analyzed via the TVDID method.

5.2. The Effect of HSR on the Industrial Agglomeration of Different Urban Agglomerations

Combined with the 2002–2016 data of the BJHUA and the 2006–2016 data of the CPUA, as well as the mathematical model of Formula (3), STATA16.0 is used to evaluate the agglomeration effect of HSR on the tertiary and secondary industries of the two urban agglomerations (Table 4).
The results are analyzed and discussed as follows.
(1)
As shown in Table 4, model A(1) and model B(2) respectively represent the agglomeration effect of HSR opening on the tertiary industry of the BJHUA and CPUA without adding control variables. Without control variables, the agglomeration effect of HSR on the tertiary industry of the BJHUA is negative, but not obvious. And the agglomeration effect on the tertiary industry in the CPUA is significantly negative.
Model A(3) and model B(4) respectively represent the agglomeration effect of HSR on the tertiary industry of the BJHUA and CPUA after the addition of control variables, and the effects are still negative. Moreover, the negative agglomeration effect of HSR on the tertiary industry of the CPUA is significant, which indicates that the impact of HSR on the tertiary industry in the urban agglomeration has an obvious spillover effect [25]. However, the negative agglomeration effect of HSR on the tertiary industry of the BJHUA is still not significant, which may be due to the siphon effect of Beijing and Tianjin (this hypothesis will be tested in Section 5.3). The economic development gap between the cities in the BJHUA is large. Beijing and Tianjin, two municipalities directly under the Central Government, enjoy good economic development and are attractive to the population of surrounding cities. Meanwhile, as the capital city, people have a certain political preference for Beijing.
According to model B(4), it can be seen that the negative agglomeration effect of HSR on the tertiary industry of the CPUA is significant at the level of 5%, which verifies model B(2). In the CPUA, the agglomeration degree of tertiary industry in cities along the HSR decreases by 0.058, and the HSR has a negative agglomeration effect on the development of tertiary industry in the CPUA. The economic development level of the CPUA is relatively weak, and its development in technology is not sufficient, so it cannot provide conditions for the development of tertiary industry, especially the high-tech industry. While the HSR brings the convenience of transportation, it also attracts more talent resources from the CPUA to tertiary industry in regions with better economic development.
(2)
Model A(5) and model B(6) respectively represent the agglomeration effect of the opening of HSR on the secondary industry of the BJHUA and CPUA without adding control variables. Without control variables, the agglomeration effect of HSR on the secondary industry of the BJHUA and CPUA both exists but is not obvious. After adding control variables (as shown in model A(7) and model B(8)), HSR still has no significant agglomeration effect on the secondary industry of the BJHUA and CPUA. The reasons for the less significant impact of HSR on the agglomeration effect of secondary industry may lie in the government’s industrial policies and support measures, as well as the regional resource endowment. While HSR does have an impact, it is not prominent.
(3)
The wage level has a significant negative agglomeration effect on tertiary industry in the CPUA at the level of 5%. There are two main reasons for the negative agglomeration effect brought by the increase in wage level. On the one hand, CPUA is not as suitable for the development of tertiary industry as the Yangtze River Delta urban agglomeration, especially the financial industry, real estate industry, information transmission, software and information technology services. On the other hand, the increase in wages in the CPUA is not very attractive to talents. And due to higher wage costs, enterprises will turn to other regions more suitable for their own development, such as the Yangtze River Delta urban agglomeration and the Pearl River Delta urban agglomeration.
The wage level has a relatively significant agglomeration effect on secondary industry in the CPUA. For every 1% increase in the wage level, the agglomeration of secondary industry in the CPUA will increase by 0.379. Secondary industry does not require high knowledge and skill level of human resources, and the labor cost is relatively low. The increase in wages will not bring great cost pressure to enterprises but will attract many people to stay here and work, promoting the development of secondary industry in the CPUA. At the same time, the CPUA is rich in natural resources, which is conducive to carrying on the transfer of secondary industry in the eastern region.
(4)
The degree of openness has a negative influence on the agglomeration of tertiary industry in the CPUA, but has a significant positive influence on the agglomeration of secondary industry. The degree of openness is expressed by the amount of foreign capital actually used. With abundant resources and cheap labor, the CPUA is more likely to attract foreign investment in secondary industry, especially in the mining and processing industries, so as to promote the agglomeration of secondary industry.

5.3. The Influence of HSR on the Industrial Agglomeration of Different Regions (Center and Periphery) in Urban Agglomeration

The central cities with better economic development in the two urban agglomerations are excluded to further analyze the influence of HSR on the industrial agglomeration of urban agglomerations, and the results obtained in Section 5.1 are verified. The data of Beijing and Tianjin are excluded from the BJHUA. The CPUA excludes the data of Zhengzhou and Luoyang. After the completion of urban agglomeration data processing, parallel trend tests are conducted on the two groups of data, respectively, and both groups of data passed the parallel trend test. Then, we use STATA16.0 to fit Formula (3) again for the data of two urban agglomerations without center cities. The results are shown in Table 5.
Based on the model results of excluding central cities from the two urban agglomerations, analysis and discussion are carried out.
(1)
Model A’(1) in Table 5 shows that for the BJHUA excluding Beijing and Tianjin, the negative agglomeration effect of HSR on tertiary industry is significant at 10%. In Table 4, the negative agglomeration effect of model A(3) is not significant. This indicates that HSR has a siphon effect on the tertiary industry of the center cities in the BJHUA, to a certain extent, which widens the economic gap within the urban agglomeration. Beijing and Tianjin, as the central cities of the BJHUA, have higher attractiveness to high-quality talents, especially those engaged in tertiary industry, compared to surrounding cities. The surrounding cities are unable to provide higher wages and better living environments, which leads to a significant negative agglomeration effect of HSR on the peripheral cities of the BJHUA.
(2)
Model B’(2) in Table 5 shows that HSR has a negative agglomeration effect on tertiary industry in the CPUA excluding Zhengzhou and Luoyang. And the absolute value of the influence coefficient is larger than that of model B(4) in Table 4. This shows that the negative agglomeration effect on tertiary industry in the periphery cities of the CPUA is more prominent.
The impact of HSR on tertiary industry within the BJHUA and CPUA is negative, which differs significantly from the findings of Shao et al. [33] that high-speed rail did not weaken the service industry agglomeration of small and medium-sized cities along the railway line and surrounding core cities in the Yangtze River Delta urban agglomeration. This also indicates that the economic driving effect of the BJHUA and CPUA on major cities within the urban agglomeration has not yet been fully realized.
(3)
Model A’(3) in Table 5 shows that HSR has a positive significant agglomeration effect on the secondary industry of the BJHUA excluding Beijing and Tianjin. Through comparing model A(7) in Table 4, it shows that the agglomeration effect of HSR on secondary industry in the BJHUA is more reflected in the peripheral cities. The HSR has promoted the peripheral cities in the BJHUA to undertake the transfer of secondary industry from Beijing and Tianjin, and shortens the commuting time between Beijing, Tianjin, and peripheral cities. Thus, it drives the agglomeration of secondary industry in surrounding cities within the BJHUA. The wage level in Beijing is much higher than that in peripheral cities, attracting talents. However, the high housing price makes a large proportion of people working in Beijing turn to buy houses in surrounding cities, which promotes the agglomeration of secondary industry, especially real estate, in peripheral cities within the BJHUA.
(4)
Model B’(4) in Table 5 shows that the effect of HSR on the secondary industrial agglomeration of the CPUA excluding Zhengzhou and Luoyang is positive but not significant, which is the same as the result of model B(8) in Table 4. The reasons for this phenomenon may be that secondary industry is mainly composed of manufacturing industries with closely linked upstream and downstream supply chains. The operation of HSR promotes close connections between surrounding cities and central cities, facilitating the collaborative development of upstream and downstream enterprises in the industry chain. Surrounding cities can participate in larger industrial clusters through collaborating with central city enterprises. This promotes the sharing and optimal allocation of resources, enhancing the competitiveness and innovation capabilities of secondary industry. However, the smaller population size in the surrounding cities of the CPUA results in insufficient market demand for secondary industry. As a result, these cities are unable to fully leverage the driving force of high-speed rail on secondary industry.
To sum up, the effect of HSR on the industrial agglomeration of urban agglomerations varies in different urban agglomerations, different industries, as well as the center and periphery of urban agglomeration. The effects of HSR on the industrial agglomeration of the BJHUA and CPUA are summarized as shown in Table 6.

5.4. Placebo Test

To test the stability of the model results, a placebo test is performed. The placebo test can be either a fictitious treatment group or a fictitious opening time of the HSR to estimate [70]. In this paper, the fictitious opening time of HSR is used to test the model and the results. The actual opening year of HSR in all cities is brought forward by 7 years. For example, while the actual opening of HSR in Beijing was in 2008, we assume that the opening of HSR in Beijing was in 2001. Then, Formula (3) is used to fit the data. In this case, if the dummy variable Rail is still significant, it indicates that industrial agglomeration may come from other factors rather than the opening of HSR. If the virtual variable Rail is not significant, it indicates that the model is stable and meets the research expectation.
The opening time of HSR in each city in the BJHUA is put forward by 7 years, and the data from 2002 to 2007 are obtained. The opening time of cities in CPUA is put forward by 7 years, and the data from 2003 to 2009 are obtained. STATA16.0 is used to fit the two groups of newly acquired data. The results of the placebo test are shown in Table 7.
Model A’’(1) and B’’ (2) respectively show the influence of HSR on the agglomeration of tertiary industry in the BJHUA and CPUA. Models A’’(3) and B’’(4) respectively show the influence of HSR on the secondary industrial agglomeration of the BJHUA and CPUA. In Table 7, the coefficients of Rail are not significant, indicating that the results of the TVDID model adopted in this paper are stable.

6. Conclusions

This paper studies the relationship between HSR and industrial agglomeration within urban agglomerations. This paper applied the TVDID model to explore the effect of HSR on the agglomeration of secondary and tertiary industries in the BJHUA and CPUA, respectively, and make a comparison. On this basis, the central cities and peripheral cities of the two urban agglomerations are divided to further study the impact of HSR on the industrial agglomeration of different regions in the urban agglomeration and make a comparison. We drew the following research conclusions.
Overall, HSR has a negative agglomeration effect on tertiary industry and a positive agglomeration effect on secondary industry. However, the impact on industry agglomeration within different urban agglomerations is heterogeneous. Specifically, in the BTHUA, although the agglomeration effect of HSR on tertiary industry is negative, it is not significant. However, when the core cities within the agglomeration are removed, the agglomeration effect of HSR on agglomeration becomes significantly negative. The agglomeration effect of HSR on secondary industry in the BTHUA is positive, but there are also insignificant issues. However, when the core cities within the agglomeration are removed, this agglomeration effect becomes very significant. Specifically, in the CPUA, the agglomeration effect of HSR on tertiary industry is significantly negative, and even after removing the central city of the agglomeration, such negative effect still exists. The agglomeration effect of HSR on secondary industry in the agglomeration is positive, but whether the central city is removed or not, this agglomeration effect is not significant.
(1)
Theoretical implications
This study adopts a comparative perspective to explore the impact of HSR on industrial agglomeration within urban agglomerations with significant differences in economic development, enriching the theoretical understanding of the relationship between HSR and industry agglomeration. At the same time, this study also expands the application of the TVDID method in empirical research, improving the credibility and accuracy of the research. These research findings are helpful for a deeper understanding of the mechanism of HSR’s impact on industrial agglomeration within urban agglomerations.
(2)
Practical implications
The practical significance of this study lies in clarifying the impact of HSR on different industries within different urban agglomerations, which has important practical guidance for relevant departments to formulate industrial development policies within urban agglomerations. According to the research findings of this article, the impact of HSR on industrial agglomeration varies depending on the economic development and industries of the urban agglomerations, as well as their central or peripheral status. Therefore, when promoting HSR to drive economic development, relevant departments should consider this diversity and avoid making broad generalizations. This study is conducive to promoting the coordinated development of the economy within urban agglomerations, which is beneficial for optimizing and coordinating regional economic development. Furthermore, this study has practical guidance for promoting the economic development and industrial upgrading of urban agglomerations, as well as promoting their comprehensive and sustainable development.
However, this study only analyzes the impact of HSR on secondary and tertiary industries within urban agglomerations. In the future, research can be conducted on the impact of HSR on the sub-industries within secondary and tertiary industries to improve the accuracy of the research. In addition, due to data availability limitations, this study only compares the impact of HSR on industry agglomeration within two major urban agglomerations in China. Future research can explore the impact of HSR on industry agglomeration within urban agglomerations in different countries, increasing the diversity of the sample and enhancing the diversity of research.

Author Contributions

Conceptualization, W.L.; methodology, J.X.; software, J.X.; formal analysis, J.X.; data curation, J.X.; writing—original draft, J.X.; writing—review and editing, W.L.; supervision, W.L. All authors have read and agreed to the published version of the manuscript.

Funding

This research was funded by the Fundamental Research Funds for the Central Universities, grant number 2023YJS109; the Humanities and Social Science Planning Project, grant number 2023JBW8006; the National Key Research and Development Plan Advanced Rail Transit Special Project, grant number 2018YFB1201401.

Data Availability Statement

All data included in this study are available upon request from the corresponding author.

Conflicts of Interest

The authors declare no conflict of interest.

References

  1. The United Nations. The Sustainable Development Goals Report 2022. 2022. Available online: https://unstats.un.org/sdgs/report/2022/The-Sustainable-Development-Goals-Report-2022.pdf (accessed on 8 May 2023).
  2. International Union of Railways. Design a Better Future. 2022. Available online: https://uic.org/IMG/pdf/uic-design-a-better-future-vision-of-rail-2030.pdf (accessed on 6 August 2023).
  3. Ministry of Transport of the People’s Republic of China. Development Statistical Bulletin of the Transport Industry 2019. 2020. Available online: https://xxgk.mot.gov.cn/2020/jigou/zhghs/202006/t20200630_3321335.html (accessed on 6 August 2023).
  4. Qiushi Journal. Building China’s Impressive High-Speed Rail. 2021. Available online: https://www.chinadaily.com.cn/a/202111/17/WS6194c074a310cdd39bc75e82.html (accessed on 8 May 2023).
  5. China National Railway Corporation Ltd. 2019 Statistical Bulletin of China National Railway Group Co., Ltd. 2020. Available online: http://www.china-railway.com.cn/wnfw/sjfw/202003/t20200330_102460.html (accessed on 8 May 2023).
  6. Kim, Y.R.; Williams, A.M.; Park, S.; Chen, J.L. Spatial spillovers of agglomeration economies and productivity in the tourism industry: The case of the UK. Tour. Manag. 2021, 82, 104201. [Google Scholar] [CrossRef]
  7. Giuliano, G.; Kang, S.; Yuan, Q. Agglomeration economies and evolving urban form. Ann. Reg. Sci. 2019, 63, 377–398. [Google Scholar] [CrossRef] [Green Version]
  8. Diodato, D.; Neffke, F.; O’Clery, N. Why do industries coagglomerate? How Marshallian externalities differ by industry and have evolved over time. J. Urban Econ. 2018, 106, 1–26. [Google Scholar] [CrossRef]
  9. Shen, N.; Peng, H. Can industrial agglomeration achieve the emission-reduction effect? Socio-Econ. Plan. Sci. 2021, 75, 100867. [Google Scholar] [CrossRef]
  10. Chen, Z. Measuring the regional economic impacts of high-speed rail using a dynamic SCGE model: The case of China. Eur. Plan. Stud. 2019, 27, 483–512. [Google Scholar] [CrossRef]
  11. Lin, S.; Gan, T. Does High-Speed Rail Promote Agglomeration in China? Wirel. Commun. Mob. Comput. 2022, 2022, 6443204. [Google Scholar] [CrossRef]
  12. Komikado, H.; Morikawa, S.; Bhatt, A.; Kato, H. High-speed rail, inter-regional accessibility, and regional innovation: Evidence from Japan. Technol. Forecast. Soc. Chang. 2021, 167, 120697. [Google Scholar] [CrossRef]
  13. Li, L.S.; Yang, F.X.; Cui, C. High-speed rail and tourism in China: An urban agglomeration perspective. Int. J. Tour. Res. 2019, 21, 45–60. [Google Scholar] [CrossRef] [Green Version]
  14. Fang, L.; Zhang, X.; Feng, Z.; Cao, C. Effects of high-speed rail construction on the evolution of industrial agglomeration: Evidence from three great bay areas in China. EM Econ. Manag. 2020, 23, 17–32. [Google Scholar] [CrossRef]
  15. Wetwitoo, J.; Kato, H. High-speed rail and regional economic productivity through agglomeration and network externality: A case study of inter-regional transportation in Japan. Case Stud. Transp. Policy 2017, 5, 549–559. [Google Scholar] [CrossRef]
  16. Tian, M.; Li, T.; Ye, X.; Zhao, H.; Meng, X. The impact of high-speed rail on service industry agglomeration in peripheral cities. Transp. Res. Part D Transp. Environ. 2021, 93, 102745. [Google Scholar] [CrossRef]
  17. Wetwitoo, J. Industrial Specialization or Diversity? How High-Speed Rail Fosters Japan’s Regional Agglomeration Economy; ADBI Working Papers 954; Asian Development Bank Institute: Tokyo, Japan, 2019. [Google Scholar]
  18. Wang, N.; Zhu, Y.; Yang, T. The impact of transportation infrastructure and industrial agglomeration on energy efficiency: Evidence from China’s industrial sectors. J. Clean. Prod. 2020, 244, 118708. [Google Scholar] [CrossRef]
  19. Kim, H.; Sultana, S.; Weber, J. A geographic assessment of the economic development impact of Korean high-speed rail stations. Transp. Policy 2018, 66, 127–137. [Google Scholar] [CrossRef]
  20. Chen, C.L.; Loukaitou-Sideris, A.; de Ureña, J.M.; Vickerman, R. Spatial short and long-term implications and planning challenges of high-speed rail: A literature review framework for the special issue. Eur. Plan. Stud. 2019, 27, 415–433. [Google Scholar] [CrossRef]
  21. Vickerman, R. Can high-speed rail have a transformative effect on the economy? Transp. Policy 2018, 62, 31–37. [Google Scholar] [CrossRef] [Green Version]
  22. The CPC Central Committee and the State Council. Outline for Building a Transport Powerhouse. 2019. Available online: https://www.gov.cn/zhengce/2019-09/19/content_5431432.htm (accessed on 6 August 2023).
  23. Wang, F.; Wei, X.; Liu, J.; He, L.; Gao, M. Impact of high-speed rail on population mobility and urbanisation: A case study on Yangtze River Delta urban agglomeration, China. Transp. Res. Part A Policy Pract. 2019, 127, 99–114. [Google Scholar] [CrossRef]
  24. Zhang, P.; Zhao, Y.; Zhu, X.; Cai, Z.; Xu, J.; Shi, S. Spatial structure of urban agglomeration under the impact of high-speed railway construction: Based on the social network analysis. Sustain. Cities Soc. 2020, 62, 102404. [Google Scholar] [CrossRef]
  25. Tian, M.; Li, T.; Yang, S.; Wang, Y.; Fu, S. The Impact of High-Speed Rail on the Service-Sector Agglomeration in China. Sustainability 2019, 11, 2128. [Google Scholar] [CrossRef] [Green Version]
  26. Li, Y.; Chen, Z.; Wang, P. Impact of high-speed rail on urban economic efficiency in China. Transp. Policy 2020, 97, 220–231. [Google Scholar] [CrossRef]
  27. Okamoto, C.; Sato, Y. Impacts of high-speed rail construction on land prices in urban agglomerations: Evidence from Kyushu in Japan. J. Asian Econ. 2021, 76, 101364. [Google Scholar] [CrossRef]
  28. Ahlfeldt, G.M.; Feddersen, A. From periphery to core: Measuring agglomeration effects using high-speed rail. J. Econ. Geogr. 2018, 18, 355–390. [Google Scholar] [CrossRef]
  29. Cui, X.; Fang, C.; Wang, Z.; Bao, C. Spatial relationship of high-speed transportation construction and land-use efficiency and its mechanism: Case study of Shandong Peninsula urban agglomeration. J. Geogr. Sci. 2019, 29, 549–562. [Google Scholar] [CrossRef] [Green Version]
  30. Li, J.; Qian, Y.; Zeng, J.; Yin, F.; Zhu, L.; Guang, X. Research on the Influence of a High-Speed Railway on the Spatial Structure of the Western Urban Agglomeration Based on Fractal Theory—Taking the Chengdu–Chongqing Urban Agglomeration as an Example. Sustainability 2020, 12, 7550. [Google Scholar] [CrossRef]
  31. Dai, X.; Xu, M.; Wang, N. The industrial impact of the Beijing-Shanghai high-speed rail. Travel Behav. Soc. 2018, 12, 23–29. [Google Scholar] [CrossRef]
  32. Cheng, Y.S.; Loo, B.P.; Vickerman, R. High-speed rail networks, economic integration and regional specialisation in China and Europe. Travel Behav. Soc. 2015, 2, 1–14. [Google Scholar] [CrossRef] [Green Version]
  33. Shao, S.; Tian, Z.; Yang, L. High speed rail and urban service industry agglomeration: Evidence from China’s Yangtze River Delta region. J. Transp. Geogr. 2017, 64, 174–183. [Google Scholar] [CrossRef]
  34. Vickerman, R. High-speed rail and regional development: The case of intermediate stations. J. Transp. Geogr. 2015, 42, 157–165. [Google Scholar] [CrossRef]
  35. Masson, S.; Petiot, R. Can the high speed rail reinforce tourism attractiveness? The case of the high speed rail between Perpignan (France) and Barcelona (Spain). Technovation 2009, 29, 611–617. [Google Scholar] [CrossRef]
  36. Stuart, E.A.; Huskamp, H.A.; Duckworth, K.; Simmons, J.; Song, Z.; Chernew, M.E.; Barry, C.L. Using propensity scores in difference-in-differences models to estimate the effects of a policy change. Health Serv. Outcomes Res. Methodol. 2014, 14, 166–182. [Google Scholar] [CrossRef] [Green Version]
  37. Bertoni, D.; Curzi, D.; Aletti, G.; Olper, A. Estimating the effects of agri-environmental measures using difference-in-difference coarsened exact matching. Food Policy 2020, 90, 101790. [Google Scholar] [CrossRef]
  38. Koltai, J.; Raifman, J.; Bor, J.; McKee, M.; Stuckler, D. COVID-19 vaccination and mental health: A difference-in-difference analysis of the understanding America study. Am. J. Prev. Med. 2022, 62, 679–687. [Google Scholar] [CrossRef]
  39. Beck, T.; Levine, R.; Levkov, A. Big bad banks? The winners and losers from bank deregulation in the United States. J. Financ. 2010, 65, 1637–1667. [Google Scholar] [CrossRef] [Green Version]
  40. Tang, K.; Qiu, Y.; Zhou, D. Does command-and-control regulation promote green innovation performance? Evidence from China’s industrial enterprises. Sci. Total Environ. 2020, 712, 136362. [Google Scholar] [CrossRef] [PubMed]
  41. Turunen, J.; Karhula, K.; Ropponen, A.; Koskinen, A.; Hakola, T.; Puttonen, S.; Hämäläinen, K.; Pehkonen, J.; Härmä, M. The effects of using participatory working time scheduling software on sickness absence: A difference-in-differences study. Int. J. Nurs. Stud. 2020, 112, 103716. [Google Scholar] [CrossRef]
  42. Douglas, I.; Tan, D. Global airline alliances and profitability: A difference-in-difference analysis. Transp. Res. Part A Policy Pract. 2017, 103, 432–443. [Google Scholar] [CrossRef]
  43. Fan, Z.Y.; Zhang, H.; Chen, J. Spillover effect and Siphon Effect of Public transport on housing market: A Case study of Subway. China Ind. Econ. 2018, 5, 99–117. (In Chinese) [Google Scholar]
  44. Zhu, X.; Qian, T.; Wei, Y. Do high-speed railways accelerate urban land expansion in China? A study based on the multi-stage difference-in-differences model. Socio-Econ. Plan. Sci. 2020, 71, 100846. [Google Scholar] [CrossRef]
  45. Tian, W.; Li, W.; Song, H.; Yue, H. Analysis on the difference of regional high-quality development in Beijing-Tianjin-Hebei city cluster. Procedia Comput. Sci. 2022, 199, 1184–1191. [Google Scholar] [CrossRef]
  46. Zhou, G.; Zhao, C.; Wu, M.; Chen, Y.; Zhou, F. Spatial heterogeneity of coupling coordination development between logistics and economy in central plains of China. Discret. Dyn. Nat. Soc. 2022, 2022, 7388666. [Google Scholar] [CrossRef]
  47. National Development and Reform Commission. Beijing-Tianjin-Hebei Coordinated Development. 2019. Available online: https://www.ndrc.gov.cn/gjzl/jjjxtfz/201911/t20191127_1213171.html (accessed on 8 May 2023).
  48. The CPC Central Committee and the State Council. Outline of the Plan for Coordinated Development of the Beijing-Tianjin-Hebei Region. 2015. Available online: https://www.ndrc.gov.cn/gjzl/jjjxtfz/201911/t20191127_1213171.html (accessed on 6 August 2023).
  49. Henan Provincial Bureau of Statistics. Report on the Development of Central Plains Urban Agglomeration 2017. 2018. Available online: https://tjj.henan.gov.cn/2018/12-17/1371929.html (accessed on 6 August 2023).
  50. National Development and Reform Commission. Central Plains Urban Agglomeration Development Plan. 2016. Available online: https://www.ndrc.gov.cn/xxgk/zcfb/ghwb/201701/t20170105_962218.html (accessed on 8 May 2023).
  51. Central People’s Government of the People’s Republic of China. Views on the Establishment of New and More Effective Mechanisms for Coordinated Regional Development. 2018. Available online: http://www.gov.cn/zhengce/2018-11/29/content_5344537.htm (accessed on 8 May 2023).
  52. China’s National Bureau of Statistics. National Statistical Yearbook (2003–2017). Available online: http://www.stats.gov.cn/sj/ndsj/ (accessed on 6 August 2023).
  53. China’s National Railway Administration Official Website. High-Speed Railway Opening Information. Available online: https://www.nra.gov.cn/xxgk/gkml/ (accessed on 6 August 2023).
  54. Ma, F.; Wang, Z.; Sun, Q.; Yuen, K.F.; Zhang, Y.; Xue, H.; Zhao, S. Spatial–Temporal Evolution of Urban Resilience and Its Influencing Factors: Evidence from the Guanzhong Plain Urban Agglomeration. Sustainability 2020, 12, 2593. [Google Scholar] [CrossRef] [Green Version]
  55. Wang, X.; Ding, S.; Cao, W.; Fan, D.; Tang, B. Research on Network Patterns and Influencing Factors of Population Flow and Migration in the Yangtze River Delta Urban Agglomeration, China. Sustainability 2020, 12, 6803. [Google Scholar] [CrossRef]
  56. Wang, Q.; Wang, Y.; Chen, W.; Zhou, X.; Zhao, M.; Zhang, B. Do land price variation and environmental regulation improve chemical industrial agglomeration? A regional analysis in China. Land Use Policy 2020, 94, 104568. [Google Scholar] [CrossRef]
  57. Wei, W.; Zhang, W.L.; Wen, J.; Wang, J.S. TFP growth in Chinese cities: The role of factor-intensity and industrial agglomeration. Econ. Model. 2020, 91, 534–549. [Google Scholar] [CrossRef]
  58. Pominova, M.; Gabe, T.M.; Crawley, A. The pitfalls of using Location Quotients to identify clusters and represent industry specialization in small regions. Int. Financ. Discuss. Pap. 2021, 1329. [Google Scholar] [CrossRef]
  59. Wu, R.; Lin, B. Does industrial agglomeration improve effective energy service: An empirical study of China’s iron and steel industry. Appl. Energy 2021, 295, 117066. [Google Scholar] [CrossRef]
  60. Li, H.; Lu, J.; Li, B. Does pollution-intensive industrial agglomeration increase residents’ health expenditure? Sustain. Cities Soc. 2020, 56, 102092. [Google Scholar] [CrossRef]
  61. Morrissey, K. A location quotient approach to producing regional production multipliers for the Irish economy. Pap. Reg. Sci. 2016, 95, 491–506. [Google Scholar] [CrossRef]
  62. Prats, G.M. Analysis of the behavior of a regional economy through the shift-share and location quotient techniques. Manag. Dyn. Knowl. Econ. 2018, 6, 553–568. [Google Scholar]
  63. Ridhwan, M.M. Spatial wage differentials and agglomeration externalities: Evidence from Indonesian microdata. Econ. Anal. Policy 2021, 71, 573–591. [Google Scholar] [CrossRef]
  64. Ramachandran, R.; Sasidharan, S.; Doytch, N. Foreign direct investment and industrial agglomeration: Evidence from India. Econ. Syst. 2020, 44, 100777. [Google Scholar] [CrossRef]
  65. Ning, L.; Wang, F.; Li, J. Urban innovation, regional externalities of foreign direct investment and industrial agglomeration: Evidence from Chinese cities. Res. Policy 2016, 45, 830–843. [Google Scholar] [CrossRef]
  66. Liu, Z.; Zeng, S.; Jin, Z.; Shi, J.J. Transport infrastructure and industrial agglomeration: Evidence from manufacturing industries in China. Transp. Policy 2022, 121, 100–112. [Google Scholar] [CrossRef]
  67. Syrett, S.; Sepulveda, L. Realising the diversity dividend: Population diversity and urban economic development. Environ. Plan. A 2011, 43, 487–504. [Google Scholar] [CrossRef] [Green Version]
  68. Xiao, Z.; Li, H.; Sun, L. Does population and industrial agglomeration exacerbate China’s pollution? J. Environ. Plan. Manag. 2022, 65, 2696–2718. [Google Scholar] [CrossRef]
  69. Zheng, D.; Kuroda, T. The impact of economic policy on industrial specialization and regional concentration of China’s high-tech industries. Ann. Reg. Sci. 2013, 50, 771–790. [Google Scholar] [CrossRef]
  70. Martins, H.C. Competition and ESG practices in emerging markets: Evidence from a difference-in-differences model. Financ. Res. Lett. 2022, 46, 102371. [Google Scholar] [CrossRef]
Figure 1. Beijing–Tianjin–Hebei Urban Agglomeration.
Land 12 01570 g001
Figure 2. Central Plains Urban Agglomeration.
Land 12 01570 g002
Figure 3. Parallel trend test results.
Land 12 01570 g003
Table 1. HSR opening time in Beijing–Tianjin–Hebei Urban Agglomeration (2002–2016).
HSR Opening TimeCity
2003Qinhuangdao
2008Beijing, Tianjin
2009Shijiazhuang
2011Langfang, Cangzhou,
2012Baoding, Xingtai, Handan
2013Tangshan
Table 2. HSR opening time in Central Plains Urban Agglomeration (2006–2016).
HSR Opening TimeCity
2010Zhengzhou, Luoyang, Sanmenxia
2011Suzhou, Bengbu
2012Anyang, Hebi, Xinxiang, Xuchang, Luohe, Zhumadian, Xinyang, Xingtai, Handan
2014Kaifeng, Yuncheng
2015Jiaozuo
2016Shangqiu
Table 3. Variables set.
VariableDefine
QLocation quotient
RailHigh speed railway is open or not. (Yes = 1 and No = 0)
WageWage level
OpenDegree of openness
UrinUrban infrastructure level
PepoPermanent residents
TechTechnological development level
Table 4. Effects of HSR on industrial agglomeration of different urban agglomerations.
VariableDependent Variable: Location Quotient of the Tertiary IndustryDependent Variable: Location Quotient of the Secondary Industry
A(1)B(2)A(3)B(4)A(5)B(6)A(7)B(8)
Rail−0.027−0.061 **−0.052−0.058 **0.0790.0560.1140.042
(0.045)(0.029)(0.036)(0.027)(0.077)(0.037)(0.066)(0.031)
Wage −0.372−0.200 ** 0.7520.379 ***
(0.252)(0.079) (0.432)(0.103)
Open −0.003−0.040 ** −0.0010.037 **
(0.014)(0.017) (0.025)(0.016)
Urin 0.0450.056 −0.069−0.049
(0.072)(0.048) (0.116)(0.055)
Pepo 0.2630.032 −0.301−0.029
(0.371)(0.050) (0.580)(0.070)
Tech −0.0780.093 0.105−0.046
(0.046)(0.055) (0.076)(0.056)
Year fixed effectYesYesYesYesYesYesYesYes
City fixed effectYesYesYesYesYesYesYesYes
Observation195319195319195319195319
R-squared0.2810.0610.4120.2410.2100.0390.3480.257
Note: A stands for BTHUA; B stands for CPUA. ** and *** represent significances at 5% and 1% levels, respectively.
Table 5. Effects of HSR on industrial agglomeration of different urban agglomerations (excluding center cities).
VariableDependent Variable: Location Quotient of the Tertiary IndustryDependent Variable: Location Quotient of the Secondary Industry
A’(1)B’(2)A’(3)B’(4)
Rail−0.050 *−0.063 **0.112 *0.046
(0.027)(0.030)(0.053)(0.034)
Wage−0.500 **−0.201 **0.945 **0.384 ***
(0.161)(0.080)(0.306)(0.106)
Open0.001−0.040 **−0.0060.037 **
(0.015)(0.017)(0.028)0.016
Urin0.167 ***0.060−0.255 **−0.052
(0.052)(0.051)(0.102)(0.058)
Pepo−0.1260.0370.178−0.032
(0.566)(0.053)(1.010)(0.074)
Tech−0.0100.0960.007−0.046
(0.028)(0.057)(0.059)(0.059)
Year fixed effectYesYesYesYes
City fixed effectYesYesYesYes
Observation165297165297
R-squared0.6030.2580.4910.271
Note: A’ stands for BJHUA (excluding Beijing and Tianjin); B’ stands for CPUA (excluding Zhengzhou and Luoyang). *, **, and *** represent significances at 10%, 5%, and 1% levels, respectively.
Table 6. Influence of HSR on industrial agglomeration of urban agglomerations.
Urban AgglomerationAgglomeration Effect
Tertiary IndustrySecond
Industry
Beijing–Tianjin–HebeiNegativePositive
Central PlainsNegative
(significant)
Positive
Beijing–Tianjin–Hebei (excluding Beijing and Tianjin)Negative
(significant)
Positive (significant)
Central Plains (excluding Zhengzhou and Luoyang)Negative
(significant)
Positive
Table 7. Placebo test results.
VariableDependent Variable: Location Quotient of the Tertiary IndustryDependent Variable: Location Quotient of the Secondary Industry
A’’(1)B’’(2)A’’(3)B’’(4)
Rail−0.026−0.0260.0170.033
(0.022)(0.019)(0.036)(0.027)
Wage−0.109−0.1150.4290.175
(0.125)(0.092)(0.213)(0.134)
Open−0.007−0.022−0.0010.023
(0.013)(0.009)(0.021)(0.012)
Urin−0.038−0.0190.0510.017
(0.040)(0.019)(0.056)(0.027)
Pepo0.504−0.031−0.4250.026
(0.362)(0.022)(0.438)(0.031)
Tech−0.185−0.0120.1950.011
(0.068)(0.028)(0.074)(0.039)
Year fixed effectYesYesYesYes
City fixed effectYesYesYesYes
Observation73203165203
R-squared0.7110.1600.6260.126
Note: A’’ stands for BJHUA (the opening time of HSR is put forward by 7 years); B’’ stands for CPUA (the opening time of HSR is put forward by 7 years).
Disclaimer/Publisher’s Note: The statements, opinions and data contained in all publications are solely those of the individual author(s) and contributor(s) and not of MDPI and/or the editor(s). MDPI and/or the editor(s) disclaim responsibility for any injury to people or property resulting from any ideas, methods, instructions or products referred to in the content.

