Article

Evaluating the Impact of County-to-District Transformation on Urban Residential Land Supply: A Multi-Period Difference-in-Differences Model Analysis

1
School of Geography and Ocean Science, Nanjing University, Nanjing 210023, China
2
School of Government, Nanjing University, Nanjing 210023, China
*
Author to whom correspondence should be addressed.
Land 2023, 12(6), 1149; https://doi.org/10.3390/land12061149
Submission received: 27 April 2023 / Revised: 27 May 2023 / Accepted: 27 May 2023 / Published: 30 May 2023
(This article belongs to the Special Issue Urban Land Development in the Process of Urbanization)

Abstract

:
Utilizing panel data from 264 prefecture-level cities in mainland China between 2009 and 2017, this study employs a multi-period difference-in-differences model and propensity score matching to assess the effects of county-to-district transformation (CDT) on the scale, proportion, and price of the urban residential land supply. The findings reveal the following details: (1) CDT led to a short-term increase in the overall proportion and price of this land, whereas its influence on the scale of the supply exhibited a time lag; (2) the policy’s impact on residential land supply varied across different types of cities, with a more pronounced effect on the scale, proportion, and price in large cities; and (3) the current implementation of CDT primarily modified the urban land’s supply–demand relationship through the expansion of built-up space, conversion of spatial function, and agglomeration of population and the labor force, consequently affecting the supply of the aforementioned land. Finally, this paper puts forward relevant policy suggestions on how to adjust land supply and effectively regulate the land market during the process of promoting the withdrawal of counties in the future.

1. Introduction

In recent years, the rapid development of the Chinese economy and society has led numerous cities in China to actively promote county-to-district transformation (CDT) 1. This process involves incorporating surrounding counties or county-level cities under the jurisdiction of a central urban district of a newly designated district government 2. County-to-district transformation in China signifies, to some extent, the expansion of cities into suburban and rural areas. However, it diverges from the phenomenon of urban sprawl observed in many countries, including the United States and certain European countries, which is the result of uncontrolled growth that is typically driven by housing demands and development [1,2]. Conversely, CDT represents a form of urban expansion guided by local governments through administrative means. Furthermore, it differs distinctively from metropolitan integration, which is a process whereby the cities involved maintain separate administrative jurisdictions; CDT entails the inclusion of administrative units under the jurisdiction of a single city. In China, the primary objectives of this practice are to expand urban space, enhance urban competitiveness, and foster the coordinated development of urban areas [3]. Nevertheless, as CDT implementation progresses, the developmental orientation of cities often undergoes adjustments, especially during their expansion into large cities or megacities. Urban governments increasingly focus on spatial function transformation, industrial structure optimization, and attracting external population inflows and labor forces agglomeration, which inevitably result in significant impacts on urban land use and allocation. Given that land is a fundamental element of urban development, the transformation of spatial functions, the upgrading and optimizing of industries, and the resulting changes in population and labor force all impose new requirements on the urban land supply. Consequently, it is crucial to systematically explore the effects and underlying mechanisms of CDT on urban land supply.
Based on the existing literature, research on the relationship between regional integration and land use has primarily focused on two areas. First, within the context of regional integration, researchers have employed statistical methods and remote sensing analysis to depict the dynamics of land use changes in specific urban agglomerations. Additionally, econometric techniques have been utilized to explore the underlying factors driving these changes [4,5,6,7]. Second, studies have shed light on the impacts of the regional integration process on land management. Numerous investigations have highlighted the benefits of intercity government cooperation and the spatial integration of labor and housing markets within metropolitan areas when promoting effective land use management [8,9,10,11]. Nevertheless, a considerable body of evidence demonstrates that regional integration inevitably leads to socioeconomic conflicts and poses severe challenges to land management. For example, Gao et al. [12] examined the spatial spillover effects of regional economic integration on urban land use efficiency in the Wuhan metropolitan area since 2001. They observed that regional economic integration facilitates resource optimization and improves urban land use efficiency. Furthermore, Ma et al. [13] identified three types of land use conflicts in the Beijing-Tianjin-Hebei urban–rural transition zone and investigated the implicit role of regional integration policies in such conflicts using a theoretical framework. The results revealed that the policy objectives of conflict regulation were not effectively achieved.
Regarding the practice of CDT, existing research on the phenomenon’s effects is relatively abundant and primarily focuses on analyzing its multi-dimensional consequences on macro-level social and economic development. Some studies have examined the effects of CDT on economic growth [14]. For example, based on their analysis of CDT samples from 1990 to 2007 in China, Li and Xu [15] found that it had a short-term promotional effect on urban economic growth that was chiefly driven by large-scale infrastructure investment. Other investigations have also scrutinized the effects of the phenomenon on urbanization. For instance, research has indicated that CDT can facilitate urban spatial development [16], promote population aggregation and local labor force urbanization [17], drive industrial structure upgrading [18], improve public service allocation [19], and achieve coordinated regional development [20]. However, in some cases, this type of transformation may also result in artificial urbanization and imbalanced urban development [21]. In recent years, scholars have investigated the impact of CDT on land, which fundamentally supports economic and social development. These studies have focused on land use efficiency [22,23] and changes in urban land use’s structure and spatial layout [24,25,26]. Additionally, a few researchers have explored the relationship between CDT and changes in urban housing and land prices. Wang and Zhang [27] found that CDT drives up housing prices in megacities, whereas it slows down the growth rate of housing prices in their prefecture-level counterparts. Meanwhile, Ji and Jin [28] discovered that local officials sold industrial land in the merged areas at low prices in order to pursue promotions in Shangyu City, Zhejiang Province. To date, relatively few studies have established a connection between CDT and land supply, and they have failed to systematically investigate its influence on the changes to the urban land supply. Our research utilizes statistical data of prefecture-level cities to examine the impact and mechanisms of CDT in China regarding alterations to the aforementioned variable. The study is organized in the following manner. First, policy background and theoretical analyses are discussed, including the policies and practices relating to CDT in China since the reform and opening up. Subsequently, the study explores the mechanisms of CDT with regard to changes to urban residential land supply. Second, a multi-period difference-in-differences (DID) model is constructed for empirical evaluation, and the variables and data are explained. Finally, the study analyzes the empirical results of the model, draws brief conclusions, and offers policy recommendations.
This study’s contributions and research significance are twofold. On the one hand, from the perspective of residential land supply, exploring and revealing the effects of CDT on changes to the urban land market contributes to a comprehensive understanding of the phenomenon’s effect on urban development, particularly in relation to the utilization and allocation of land elements. Moreover, our work bolsters theoretical understandings of the driving factors behind changes in urban land supply, particularly with regard to residential land. On the other hand, the DID model provides a precise assessment of CDT’s impact on the scale, proportion, and price of the urban residential land supply, thereby enhancing the empirical evidence for its effectiveness. Indeed, it offers valuable insights to policymakers in relevant regions for adjusting land supply and improving regulatory policies, which will have significant practical implications.

2. Policy Background and Theoretical Analysis

2.1. Policy Background

Since the initiation of the reform and opening up, China has implemented extensive administrative division adjustments to mitigate the adverse effects of administrative boundaries on economic development, which result from discrepancies between administrative and economic regions [29]. This administrative restructuring primarily encompasses the transformation of prefectures into prefecture-level cities, the amalgamation of prefectures and prefecture-level cities, the conversion of counties to county-level cities, the transition of counties to districts, and the reconfiguration of district boundaries. As one of the most prevalent types of administrative division adjustments, CDT entails the integration of various resources, such as land, population, industry, and infrastructure [1]. By examining relevant information on administrative division adjustments from China’s administrative divisions website (http://www.xzqh.org, accessed on 15 December 2020), this study identified four distinct stages of CDT practice since the reform and opening up (Figure 1), with each of them exhibiting unique characteristics in response to urban development 3.
(1)
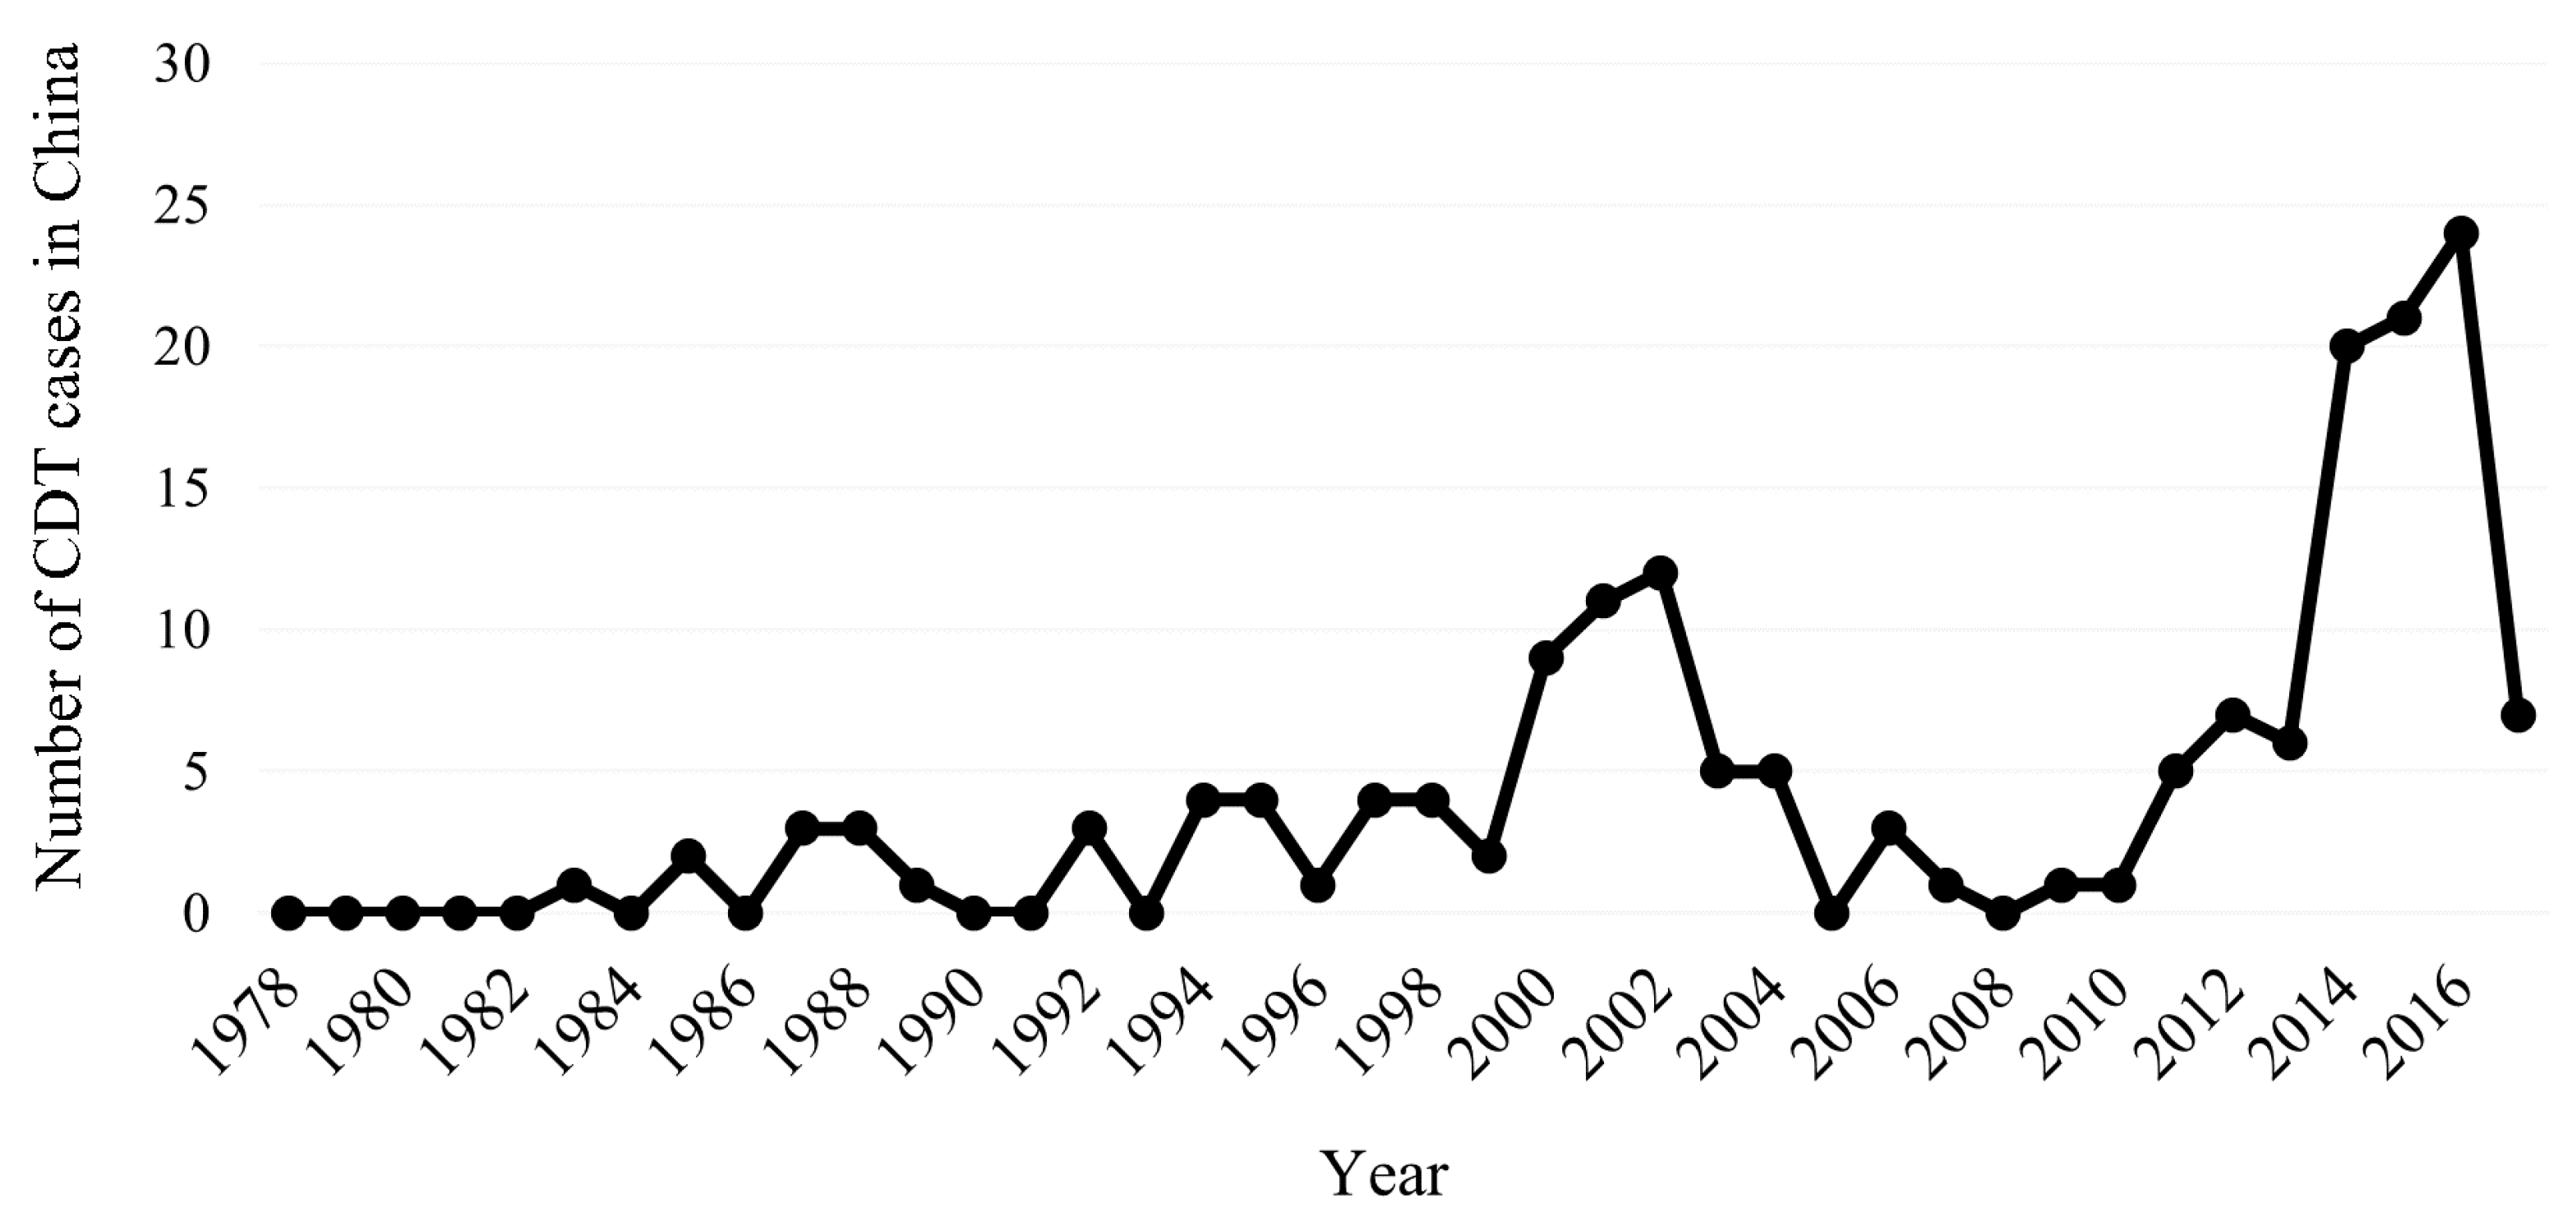
Initial exploration of CDT (1983–1997): During the early stages of China’s reform and opening up period, the primary focus of administrative restructuring was on transforming prefectures into prefecture-level cities and counties into county-level cities [30]. It was not until 1983 that cities began experimenting with the implementation of CDT. For over a decade, the practice of this phenomenon in China was sporadic until 1997, with fewer than 30 cases existing. Many were primarily within the eastern region (12 cases) and within cities of higher administrative levels and larger scales, such as sub-provincial cities and municipalities directly under the central government’s control.
(2)
First peak in CDT (1998–2004): Due to the conflict between the conversion of counties to county-level cities and urbanization demands, CDT approval was suspended in 1997. Concurrently, local governments sought to increase fiscal revenue through urban land expansion following the tax-sharing reform in 1994. As a result, CDT adoption increased significantly, with 48 cases reported between 1998 and 2004. Although examples remained concentrated in economically developed eastern coastal areas (33 cases), they also occurred in several different types of cities and were no longer exclusive to directly controlled municipalities or provincial capitals. The number of cases in general prefecture-level cities rose to 24.
(3)
Postponement period of CDT (2005–2009): Due to the central government’s tightened approval process, CDT reform entered a cooling-off period. During this time, CDT cases declined substantially, with only five cities (Baishan in Jilin Province, Harbin in Heilongjiang Province, Chongqing Municipality, Urumqi in Xinjiang Uygur Autonomous Region, and Nantong in Jiangsu Province) implementing the practice.
(4)
Second peak in CDT (2010–2017): In 2009, the Ministry of Finance actively promoted the implementation of provincially administered county reform, prompting local governments to eagerly pursue CDT to prevent the detachment and uncontrolled management of counties within their jurisdictions. There were 91 cases of CDT distributed across the eastern (43 cases), central (12 cases), western (31 cases), and northeastern (5 cases) regions. Compared to the first peak, the number of CDT examples during this stage increased significantly overall, and inter-regional differences gradually diminished. From an administrative perspective, the number of cases in general-level cities rapidly increased, reaching 60 cases and accounting for 65.3% of the total during this stage. This trend suggests that general-level cities have actively sought opportunities to expand urban development space and enhance economic development scale, leading to the continued emergence of CDT practices.

2.2. Theoretical Analysis

Government policies and decisions primarily influence the scale and proportion of urban residential land supply in response to changes in housing demand, which is referred to as demand-driven supply changes. Conversely, the driving factors of residential land prices are relatively complex and are closely related to fluctuations in housing and residential land supply and demand. Residential land supply policies partially influence these factors. For instance, the supply price of high-quality residential land will be considerably higher than that of ordinary residential land. With these factors in mind, CDT can impact the supply of urban residential land through the following three pathways (Figure 2).
First, following CDT, the expansion of built-up space and the transformation of urban functional positioning will substantially increase the demand for housing, leading to changes in the supply of residential land (functional transformation effect).
Second, the urban industrial upgrading and optimization driven by CDT will improve the city’s economic development and residents’ incomes, ultimately leading to alterations in housing demand and residential land supply (income-boosting effect).
Third, after CDT, particularly as a result of the expansion of built-up space and the upgrading and optimization of industries, the city will attract more population inflows and labor force agglomeration [17], leading to an increase in housing demand and corresponding changes in the supply of residential land (scale-expansion effect).
To clarify, the above effects of CDT on changes in urban residential land supply can be further explained as follows:
(1)
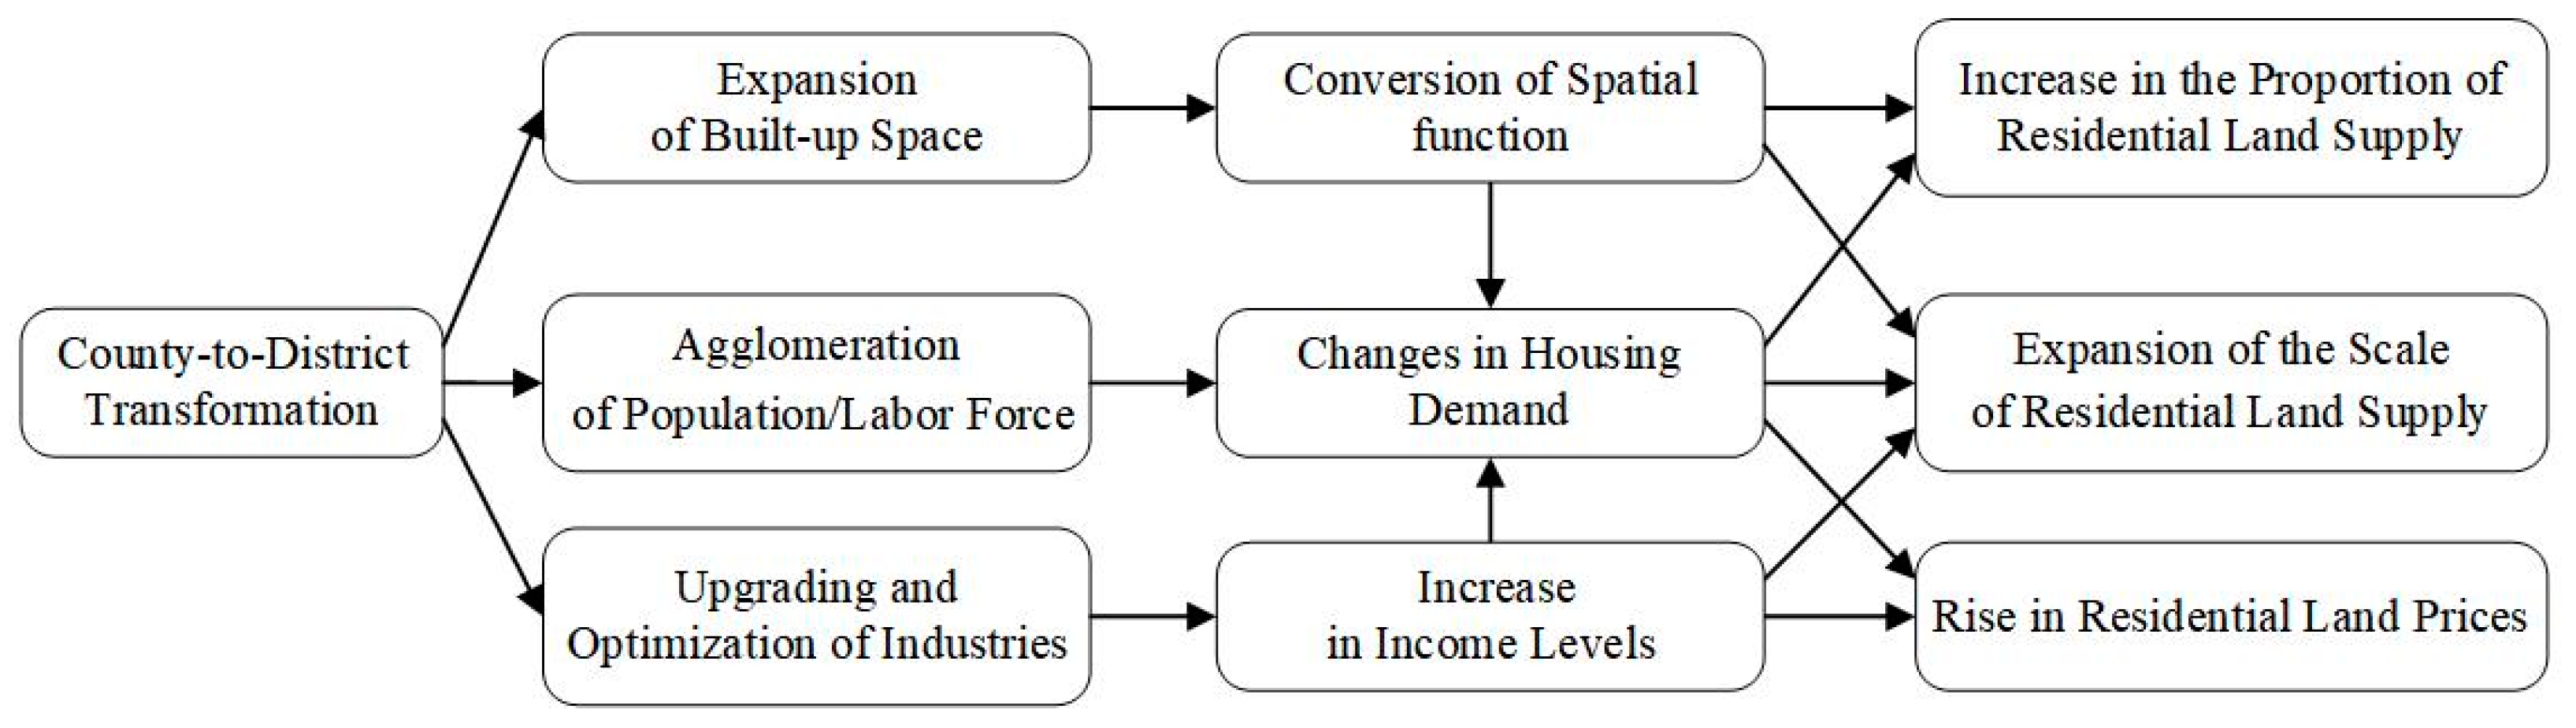
Functional transformation effect: On the one hand, as CDT is implemented, and counties are progressively integrated into the comprehensive urban development plan as part of the central urban area, they hold the potential to develop as new commercial and residential hubs for the entire city. This may lead to an expansion of the residential land supply within the original county area. On the other hand, due to the expansion of built-up areas, many cities adopt or transition toward a large-city model, which transforms spatial functions, particularly the growth and extension of residential and service areas based on the initial plan. Consequently, the city government will inevitably intensify residential construction and public facilities investment [19], leading to a substantial increase in the proportion of residential land supply for the entire city.
(2)
Income-boosting effect: Generally, before CDT, and influenced by factors such as location and size, counties primarily focused on developing urban support industries and agriculture. As they gradually become part of the central urban area and infrastructure improves, they will not only prioritize acquiring related industries by relocating from the central city, but they will also serve as an incubator for emerging industries; thus, these areas foster the enhancement and optimization of the city’s entire industry [31]. This will contribute to the city’s overall economic development and significantly increase the residents’ income. It is plausible that the rise in urban residents’ income will result in heightened demand for housing, particularly high-quality housing. Consequently, this will encourage the government to expand the residential land supply scale, leading to a price increase in residential land due to the heightened demand for high-quality accommodation.
(3)
Scale-expansion effect: This effect is primarily associated with the agglomeration of the population and the labor force, and the impact of CDT on the urban populace and workers can be observed in the following three situations. First, the expansion of urban areas and investment in supporting infrastructure attracts more people to migrate and gather, especially those from outside the area [32]. Second, CDT is a catalyst for urban-based industry upgrading and optimization, particularly the rapid development of commercial and service industries, which significantly promotes the introduction and concentration of the labor force. Third, the development of the urban economy and the improvement in residents’ income after CDT also helps curb the outflow of the population and workers [33]. Each of these situations may increase the demand for housing in the entire city to varying degrees, leading to an expansion in the supply scale and proportion of residential land.
Based on the preceding analysis, this study proposes the following research hypothesis: There will be a significant change in the supply of urban residential land after CDT implementation. Specifically, with the execution of CDT and the integration of relevant counties into the urban area, the supply scale of residential land in the entire city will notably expand, and the proportion of residential land supply will correspondingly increase. Moreover, due to the escalating demand of urban residents for high-quality housing and the lagging decision making of urban governments in the land supply response, the level of residential land prices will also exhibit an upward trend.

3. Model and Data

3.1. Multi-Period DID

We treated policy implementation as a quasi-natural experiment to investigate the precise influence of the practice of CDT policy on urban residential land supply. A multi-period DID model was employed to effectively address endogeneity issues in the analysis. More specifically, we adopted the methodology proposed by Beck et al. [34] and Gentzkow [35] to construct a baseline model, which is as follows:
Y it = α 0 + α 1 T r e a t i + α 2 P o s t t + α 3 T r e a t i × P o s t t + ε i t
In Equation (1), Y it represents the dependent variable, including the supply, proportion, and price of residential land. T r e a t i is a dummy variable that indicates whether city i belongs to the treatment group. If it has implemented a CDT policy, T r e a t i = 1 ; otherwise, it is 0. P o s t t denotes the time variable, and in the years after city i implements the policy, P o s t t = 1 ; otherwise, it equals 0. Meanwhile, the interaction term T r e a t i × P o s t t represents the policy implementation effect. α 0 is the constant term, α 1 and α 2 are the regression coefficients of the dummy variable and the time variable, α 3 is the net effect of the practice of CDT on the supply of urban residential land, and ε i t is the error term. Given that the timing of policy implementation varies across cities, the above model applies only to cases in which the implementation timing is consistent. Therefore, this study incorporated the interaction term between grouping variables and time variables into the model and adopted the following multi-period differential model:
Y it = β 0 + β 1 R e f o r m i t + γ n C o n t r o l s i t + μ i + f t + ε i t
If the city i implemented the CDT policy in year t, then from this year onward, R e f o r m i t = 1 , or it is 0 otherwise. n C o n t r o l s i t represents a series of control variables that affect the dependent variable, and γ is the regression coefficient of that variable. μ i denotes individual fixed effects, f t denotes time-fixed effects, and β 0 represents the constant term. β 1 is the estimated net effect of the CDT policy that requires particular attention.

3.2. Data, Variables, and Descriptive Statistics

(1)
Dependent variables: As the Ministry of Land and Resources (currently the Ministry of Natural Resources) generally selects indicators, such as supply scale, structure, and price for compiling and summarizing information on urban land supply, this study employed three indicators of its own: residential land supply area (Supply, unit: hm2), the proportion of residential land supply (Prop, the ratio of residential land supply to total land supply, unit: %), and residential land price (Price, unit: RMB yuan/m2) to reflect the situation and changes in urban residential land supply. The first two data sets were obtained from China Land and Resources Statistical Yearbook, which collected panel data for 285 prefecture-level cities in China. The residential land price data were sourced from the China Land Value Information Service Platform (www.landvalue.com.cn, accessed on 23 December 2020), which includes monitored information on land prices in 105 cities, such as municipalities directly under the central government’s jurisdiction, provincial capital cities, and cities specifically designated in the state plan. Given the level of data availability, this paper primarily investigated the impact of CDT policy on the overall residential land supply of prefecture-level cities.
(2)
Independent variable: To ensure data typicality and availability and to exclude interference caused by the first wave of policy implementation, this study selected the timespan from 2009 to 2017 as the research period 4. The key explanatory variable is the CDT policy (Reform, which is designated according to the relevant discussions in Section 3.1). It is important to note that the policy-related research object of this study refers to the practice of local governments actively applying for and obtaining central government approval for the CDT to expand the urban spatial scale. However, it does not include CDT practices indirectly caused by other administrative adjustments, such as converting prefectures to prefecture-level cities and counties to county-level cities [36]. This study pre-processed the samples as follows: First, four special municipalities with independent administrative status, namely, Beijing, Shanghai, Chongqing, and Tianjin, were excluded. Second, samples that had experienced this transformation at least once between 2005 and 2008 or two or more times during the sample period were excluded to avoid the mutual interference of policy practices in different timespans and to concentrate on the dynamic effects of CDT policy. Third, samples with significant data missing, including some prefecture-level cities in the Xinjiang Uygur Autonomous Region, Qinghai Province, and Tibet Autonomous Region, were excluded. After the screening, a total of 264 prefecture-level city samples were obtained, of which 79 prefecture-level cities with observable residential land prices were selected for analysis with regard to the impact of CDT on residential land prices.
(3)
Control variables: First, economic development indicators were selected. Economic growth can directly stimulate the demand for residential land [37]. Consequently, gross regional product (Gdp, unit: RMB ten thousand yuan) and fiscal expenditure (Gov, unit: RMB ten thousand yuan) were utilized to reflect the degree of urban economic development. Second, since the development of the real estate industry is a crucial factor in influencing the supply of residential land [38], the proportion of real estate investment to fixed asset investment (Inv, unit: %) was employed to characterize the activity of real estate investment. Third, as the adjustment and upgrading of the industrial structure will inevitably lead to the reorganization of construction land across different sectors [39], the ratio of secondary and tertiary industries (Is, unit: %) was used to reflect changes in the urban industrial structure. Finally, areas with high population densities have a relatively greater demand for residential land [40], so population density (Pd, unit: persons/km2) was used to measure the urban population. The data for the aforementioned control variables were sourced from the China City Statistical Yearbook, the China Stock Market and Accounting Research Database (https://www.gtarsc.com/, accessed on 23 December 2020), and various provincial and municipal statistical bulletins.
This study applied a natural logarithmic transformation to continuous variables with significant numerical differences (excluding those measured in ratios or percentages). Additionally, linear interpolation was employed to impute missing values, and 1%-level trimming was performed on all continuous variables to mitigate errors resulting from outliers [41]. Descriptive statistics for the variables used in the model are presented in Table 1.

4. Results and Discussion

4.1. Results of the Baseline Model

To accurately assess the net impact of CDT policy, we employed a multi-period DID model to complete our baseline regression analysis. The results are presented in Table 2. Models 1–3 display the regression results without control variables, and Models 4–6 show the results with the control variables included. Both individual and time-fixed effects were controlled across all models.
In Models 1–3, the coefficients of reform were consistently positive for the three dependent variables (Supply, Prop, and Price), and each passed significance tests at the 1%, 10%, and 10% levels, respectively. In Models 4–6, the Reform on Supply, Prop, and Price coefficients remained positive, with values of 0.142, 0.015, and 0.064, respectively, and each passed the corresponding significance tests. These findings indicate that CDT policy has significantly increased residential land supply in relevant cities, mitigated the low proportion of residential land availability, and contributed to the rise in residential land prices.

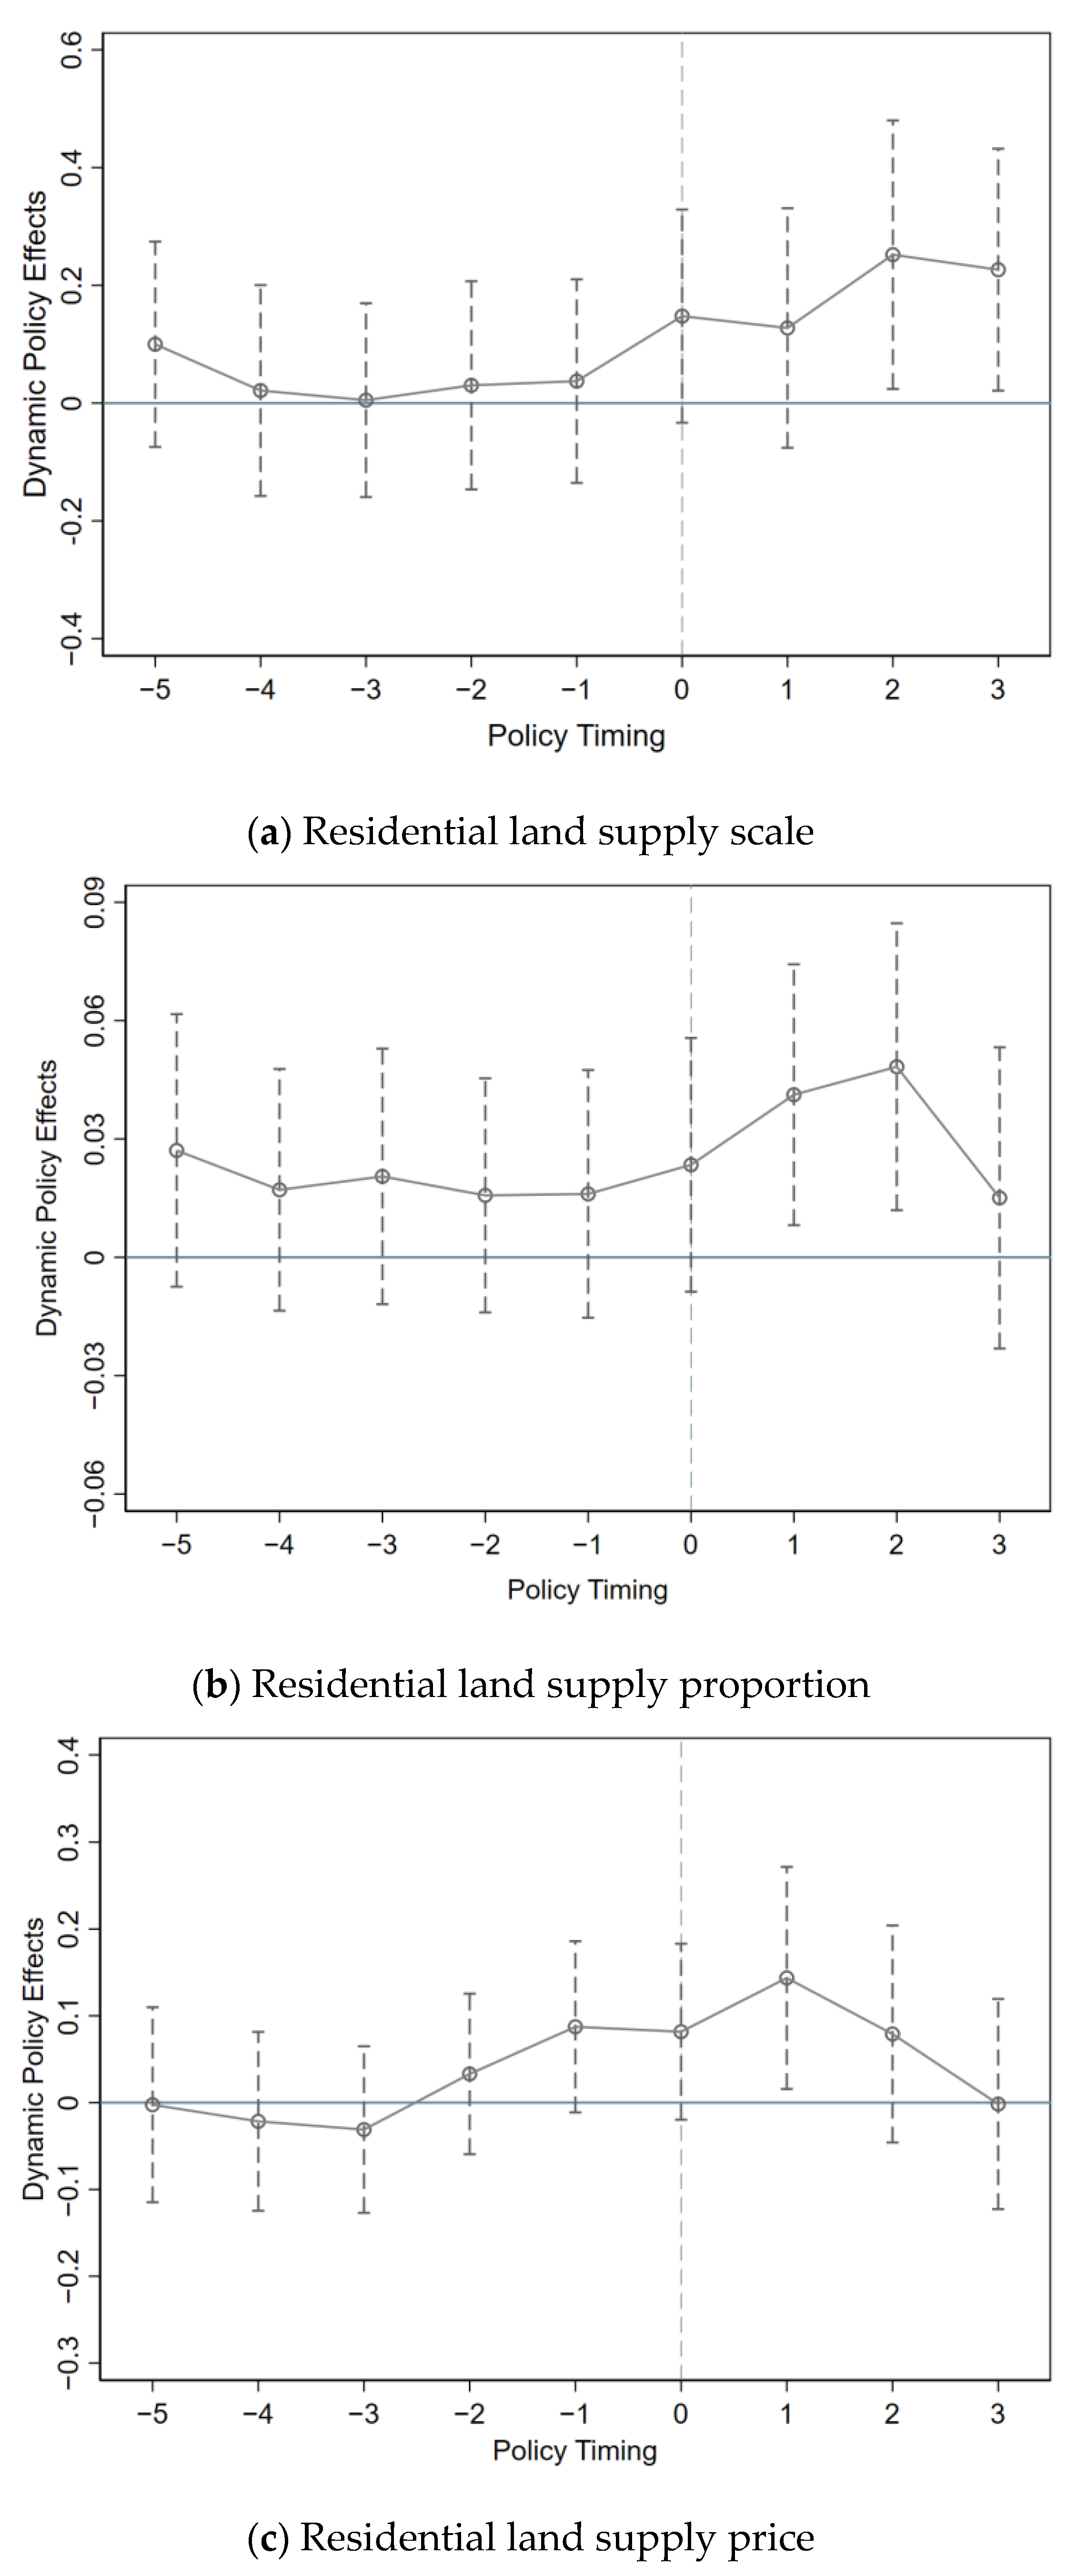
4.2. Parallel Trend Test

The DID model, which is based on natural experiments, necessitates the fundamental assumption of homogeneity. Specifically, the pre-treatment trends of the dependent variables in the treatment and control groups must be similar to ensure unbiased estimation [42]. To satisfy this condition, this investigation employs the event study methodology suggested by Li et al. [43], Wang et al. [44], and Yu et al. [45] to empirically analyze the dynamic effects of CDT practices. Consequently, the following model has been constructed:
Y i t = β 0 + k = 6 k = 4 β k × D i , t 0 + k + γ n C o n t r o l s i t + μ i + f t + ε i t
D i , t 0 + k represents a series of dummy variables, assuming a value of 1 in year k following CDT policy implementation (where k < 0 denotes the period preceding policy implementation, and t0 signifies the implementation year) and 0 otherwise. A regression analysis is conducted using k = −6 as the reference group. The estimated coefficients, which demonstrate a 95% confidence level, are illustrated in Figure 3. As the figure shows, the coefficients β−5–β−1 exhibit fluctuations around 0, with 0 encompassed within their 95% confidence interval, regardless of residential land supply, the proportion of residential land supply, or residential land prices. This finding suggests that no significant difference existed with regard to residential land supply between the treatment and control groups prior to the policy implementation of CDT, fulfilling the parallel trend test’s requirements.

4.3. Robustness Test

4.3.1. Difference-in-Differences after Propensity Score Matching (PSM-DID)
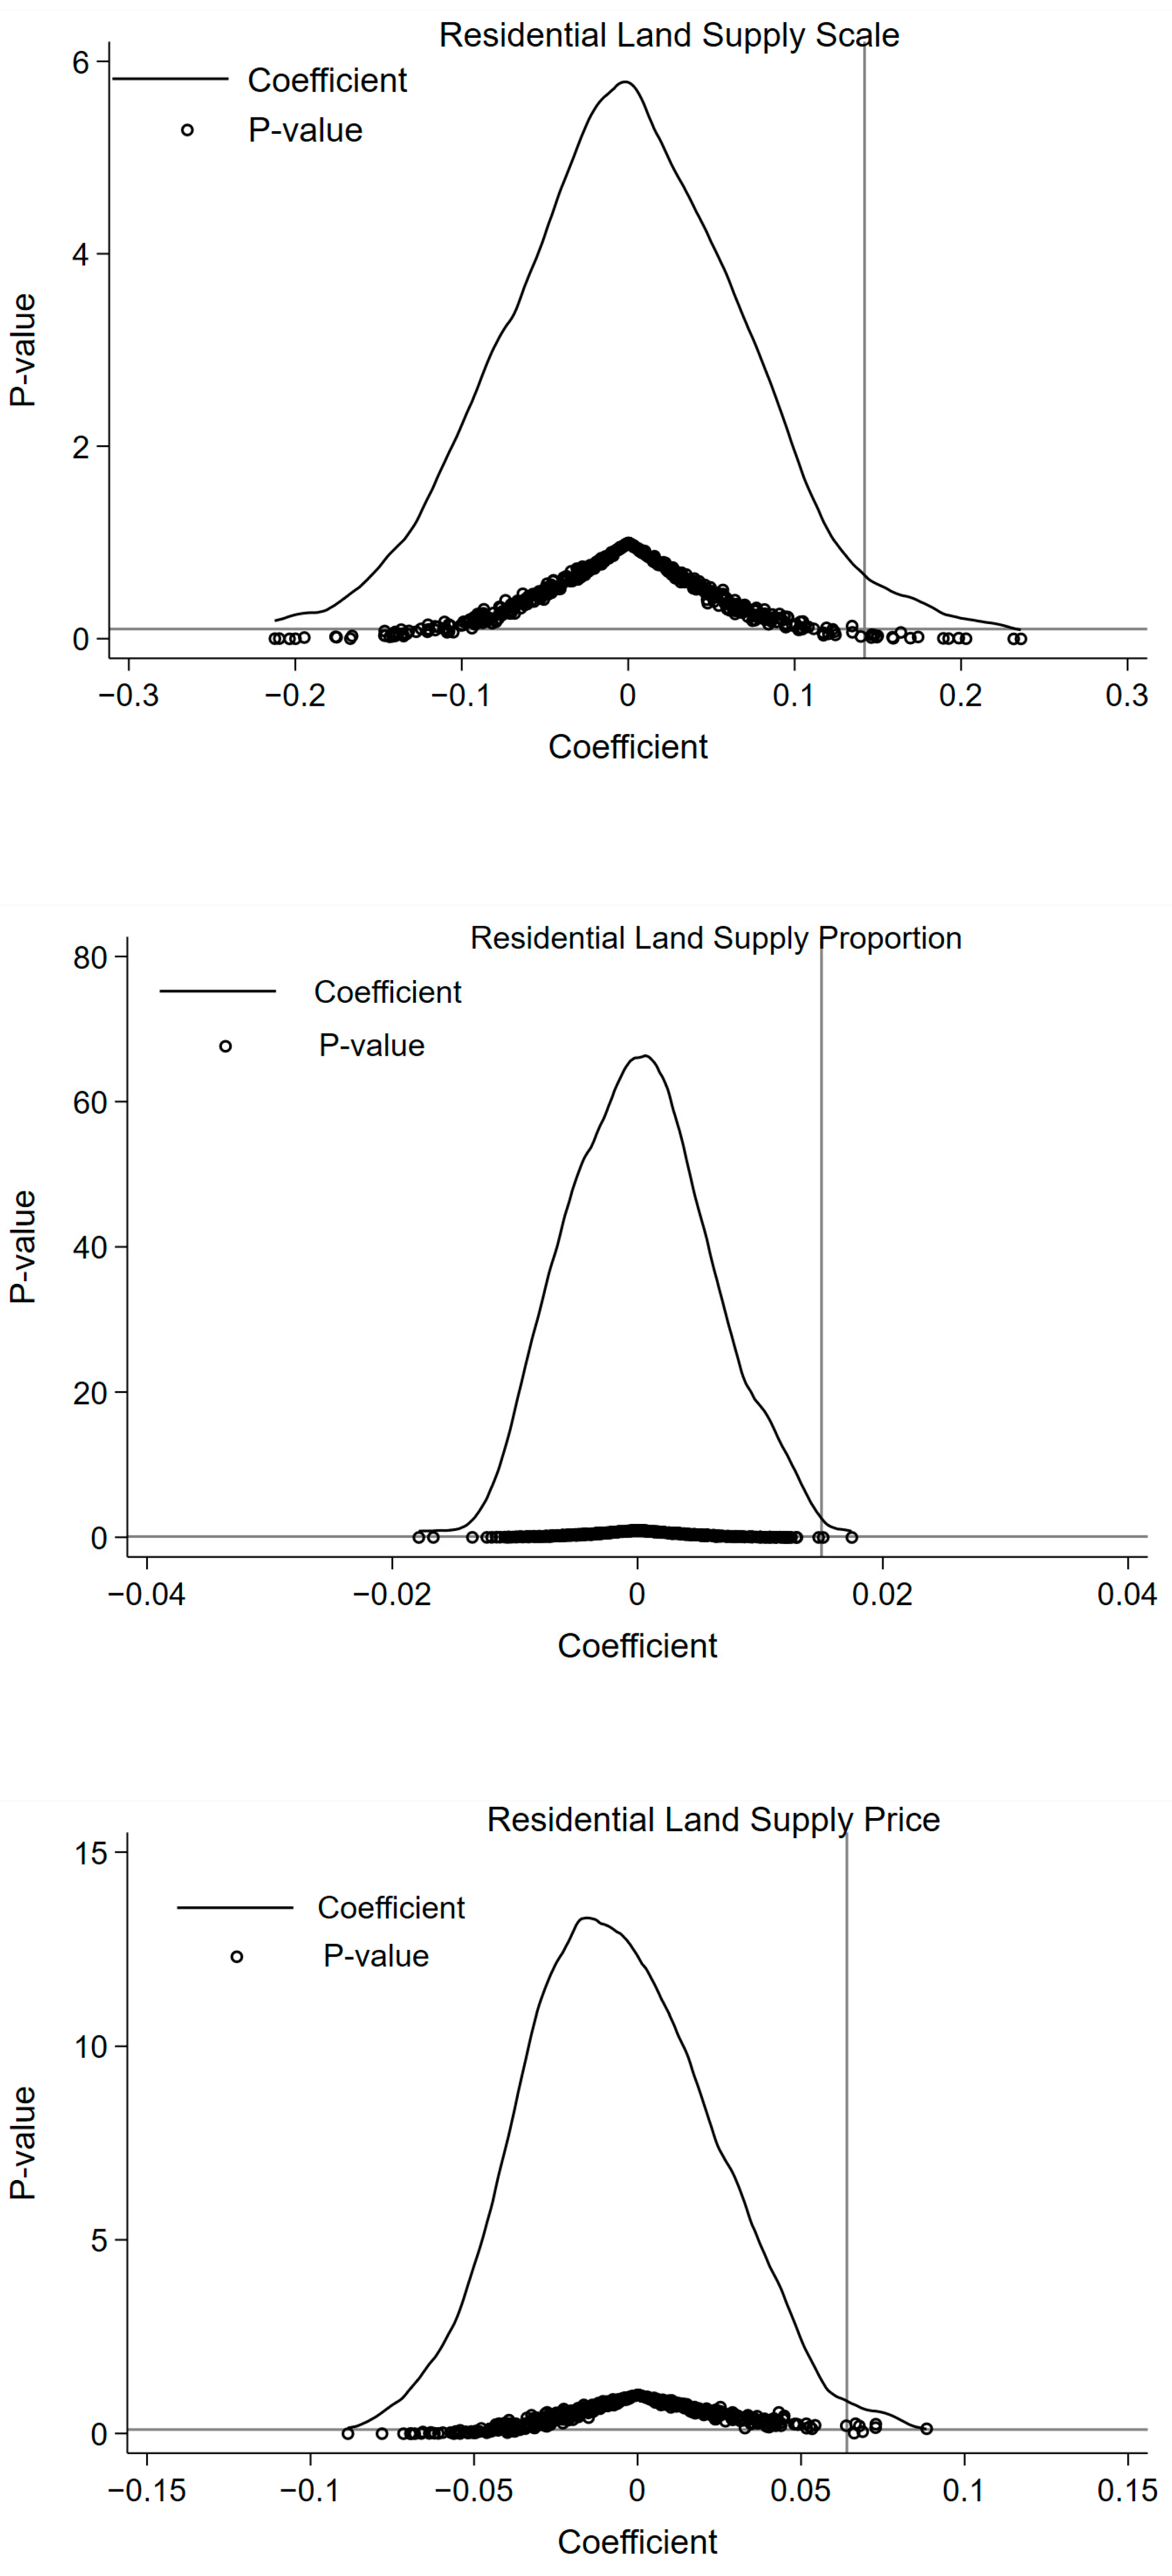
Given that the CDT policy is not a random event, but necessitates rigorous approval processes at multiple levels, including on-site inspections by the Ministry of Civil Affairs and the State Council prior to implementation, we employed propensity score matching (PSM) to create a comparable control group [46,47]. This approach ensures the exogeneity of the policy and mitigates selection bias in the sample grouping. Following the “Subordinate District Standards” (a draft document for soliciting opinions) established by the Ministry of Civil Affairs in China in 2014, we selected sample feature variables across four dimensions: economic aggregate, fiscal revenue, population scale, and industrial structure [48]. Subsequently, using the logit model, we calculated propensity scores and applied the nearest neighbor matching method. The samples of the experimental and control groups were matched at a 1:4 ratio, and the matched sample was subsequently used for the DID test. It is important to note here that the year of CDT policy implementation varies across regions. In accordance with the method proposed by Nie et al. [32], we matched data based on information from 2009, as this is the only time point in the sample period when all regions were unaffected by the policy. Table 3 presents the PSM-DID regression results. Meanwhile, Models 4–6 demonstrate that the positive effects of CDT on Supply, Prop, and Price were 0.152, 0.016, and 0.066, respectively, which passed significance tests at levels of 1%, 10%, and 10%. These findings suggest that PSM effectively addresses the endogeneity issue of the policy, and that the baseline regression results are robust.

4.3.2. Placebo Test

To eliminate potential estimation bias due to unobservable variables, we conducted a placebo test to assess the robustness of the DID results, which follows the methodologies of Chetty et al. [49] and Zhou et al. [50]. Specifically, individual examples were randomly selected from the samples as the treatment group, and a random time was chosen as the policy implementation threshold. The number of “pseudo-treatment’ groups should align with the original treatment group. Subsequently, “pseudo-policy dummy variables” were generated for the purposes of baseline regression. This procedure was repeated 500 times to obtain the kernel density of the estimated coefficient and the corresponding p-value distribution of the pseudo-policy dummy variables (Figure 4). As shown in the figure below, the estimated coefficients of the pseudo-policy dummy variables display a normal distribution with a mean of zero, and most scatter points fall above the horizontal line of p = 0.1 (insignificant at the 10% level). Moreover, the vertical lines representing the true estimation coefficients are situated in the low-tail position of the kernel density distribution of the random sampling coefficient, significantly differing from the core estimation coefficients obtained through random testing. This suggests that the model specification does not suffer from serious variable omission issues, and the baseline regression results pass the placebo test.

4.3.3. Policy Spillover Effect Test

Policy interventions must not cause spillover or equilibrium effects to satisfy the stable unit treatment value assumption within the context of a DID model, and behavioral changes in the treatment group should not impact those in the control group [51]. However, it is crucial to investigate how CDT policy influences the residential land supply in surrounding prefecture-level cities. To address this issue, we referred to the approach of Jiang et al. [52] and constructed the following model:
Y it = λ 0 + λ 1 N R i t + γ n C o n t r o l s i t + μ i + f t + ε i t
NRit = 1 if city i implemented the CDT policy in its adjacent prefecture-level cities in and after year t; otherwise, it takes a value of 0. λ1 represents the spillover effect of the policy. It should be noted that this model primarily investigates the impact of the policy on adjacent prefecture-level cities that have not implemented CDT while excluding cities that have undergone such interventions. As the majority of the sample’s residential land prices are unmonitored, this study mainly reported the impact of CDT policy on the scale and proportion of residential land supply in the surrounding prefecture-level cities, as illustrated in Table 4. The results indicate that CDT practices do not significantly affect the supply of residential land in the surrounding prefecture-level cities, and the baseline regression satisfies the assumption that the individual treatment effects are stable.

4.4. Results of Heterogeneous Regression

Significant disparities in land supply exist among various regions of China due to differences in economic development and land supply preferences. From experience, coastal cities with developed economies and large populations prefer to supply residential and commercial land, whereas some manufacturing-dominated cities tend to supply more industrial land [53,54]. Within cities, the government tends to prioritize the supply of industrial and infrastructure-related land for investment promotion, resulting in there being a relatively low proportion of residential land available, especially in economically developed cities [55]. Consequently, a heterogeneity analysis of the CDT policy effects is essential. Based on the “Notice of the State Council on Adjusting the Standards for Urban Scale Division,” which was released in 2014, cities were classified into four categories in accordance with the makeup of the 2017 urban population: small cities (<0.5 million), medium cities (0.5–1 million), type-II large cities (1–3 million), and type-I large cities (3–5 million) 5. The total sample comprised 104 small cities, 93 medium cities, 57 type-II large cities, and seven type-I large cities, with 15, 27, 19, and 5 cities in these respective strata undergoing CDT policy intervention. Among the sample of cities with monitored land prices, the ratios of cities and those experiencing CDT policy intervention were 3:0, 31:5, 36:15, and 6:5 for the four respective city types. Due to the small sample size of cities categorized as type I, in order to maintain the validity of the regression results, this paper mainly uses a multi-period, difference-in-differences model to empirically test the impact of CDT on the supply of residential land in small- and medium-sized cities and type-II large cities. Table 5 displays the heterogeneity regression results relating to the effect of CDT policy on residential land supply for different city types.
As shown in Table 5, CDT implementation fostered an increase in residential land supply in small -and medium-sized cities, as well as among type-II large cities. Regarding the proportion of residential land supply, the phenomenon exhibited a significant positive effect on type-II large cities, whereas it had no significant impact on small and medium-sized cities. A possible explanation is that the overall competitiveness of small- and medium-sized cities is relatively weak, resulting in the slower transformation of regional functional positioning and limited attractiveness to the foreign labor force during the CDT process. Consequently, there may not be an urgent need to increase the residential land supply. In contrast, CDT can facilitate development-based and population-related (labor force) influxes to large cities; given the limited land supply, large-city governments may be willing to adjust the proportion of residential land available to meet the growing demand for residential space. In terms of residential land prices, CDT policy had a notably positive impact on the increase in land prices in large type-II cities but did not significantly influence either small- or medium-sized cities. This could be due to the fact that large type-II cities, typically categorized as second-tier cities, generally have a more tight land supply and demand relationship than medium-sized cities. On the one hand, the land supply of type-II large cities is more strictly restricted, but on the other hand, type-II large cities, due to the high level of economic development and more optimal public service systems in these places, can trigger an increase in real residential demand and the speculative demand of the population, resulting in rising residential land prices.
To explore the impact of CDT on urban residential land supply more intuitively, this paper selects typical cases of the practice from cities of different scales as natural experiments and uses the synthetic control method proposed by Abadie and Gardeazabal [56]. In contrast with the difference-in-differences method, the synthetic control method uses the city of the control group to fit the counterfactual state of a treatment group, so that the common trend fit of the control group and the treatment group is higher, and the bias is less pronounced. We selected Meizhou City in Guangdong Province and Baoding City in Hebei Province as respective examples, and the results are highlighted in Figure 5 and Figure 6, respectively. It is clear in Figure 5 that after CDT practices were undertaken in Meizhou City in 2013, the true value of the residential land supply scale in the area began to grow significantly higher than its synthetic value, and the two curves underline the divergent change trajectories; the real value was always greater than the synthetic value, and the proportion of urban residential land supply was not obvious, indicating that CDT in Meizhou City markedly increased the scale of urban residential land supply, but it had no obvious impact on the proportion of it. Meanwhile, Figure 6 shows that since CDT was implemented in Baoding City, Hebei Province, in 2015, the scale, proportion, and price of the urban residential land supply have been significantly improved. This is consistent with the results of our heterogeneity test, which is described above.

4.5. Mechanism Analysis

In the preceding theoretical analysis, this study proposed that CDT policy could affect the supply of urban residential land via three pathways: the functional transformation effect, the income-boosting effect, and the scale-expansion effect. To empirically test the validity of this mechanism, this study utilized the urban built-up area (Bua, unit: km²), the average wage of employees (Ptw, unit: RMB ten thousand yuan), the ratio of population density between the previous and current year (Pdr) [38], and the number of employees at the end of the year (Ne, unit: ten thousand people) 6 as proxies for urban construction service space, income level, population mobility, and labor force agglomeration, respectively. In line with the approaches of Fan et al. [57] and Wang et al. [58], the aforementioned proxy variables were used as dependent variables, and Equation (2) was employed to estimate the effects. The results are presented in Table 6. The estimated coefficients of the independent variable for Model 1, Model 3, and Model 4 were all positive, and the estimated coefficient for Model 2 was not significant. This finding suggests that following CDT policy implementation, decision-making authority is typically transferred to the city government (often at the prefecture level), prompting the local government to implement unified planning and management measures to enhance functional transformation and service space expansion. Consequently, the merged county and the city become more closely connected, which increases the development and construction intensity of the city and ultimately results in the expansion of urban built-up areas. Simultaneously, as the level of construction space expands, service facilities improve, employment opportunities rise, and the population and labor force of the entire city also experience significant growth. However, the impact of CDT on the income level of urban residents is not significant, possibly due to the short-term challenges in promoting industrial upgrading and optimizing policy practices to improve residents’ incomes. Although CDT does not significantly enhance the income levels of urban residents, it indirectly drives changes in residential land prices by impacting its demand and supply via other pathways. In summary, these results validate the theoretical analysis presented in the previous section.

5. Conclusions and Recommendations

CDT policy serves as a dynamic mechanism for redistributing development power and resources, which is critical for optimizing regional urban systems and promoting urban development [59]. This study employed panel data from Chinese prefecture-level cities between 2009 and 2017 and utilized multi-period and PSM-DID methods to assess the impact of CDT policy on overall residential land supply. The results indicate that the phenomenon primarily influences the urban land supply–demand relationship by fostering spatial expansion, facilitating the functional transformation of construction space, and promoting population and labor force aggregation, thereby affecting the supply of urban residential land. Specifically, the expansion of built-up areas caused by CDT has increased the scale and proportion of residential land on the supply side. At the same time, the labor agglomeration and increased income levels it has facilitated have led to an increase in the demand for residential land. Furthermore, the adjustment of supply and demand has changed residential land prices; of course, the increase in demand here includes not only the increase in real demand due to factors such as population expansion, but also the increase in speculative demand caused by urban expansion. Nevertheless, the increase in supply is relatively insufficient, resulting in an increase in the price of residential land. It is worth noting that the dynamic test results (Figure 3) show that the impact of the CDT on the scale, proportion, and price of urban residential land supply is heterogeneous across time. More precisely, the promotional effect on the proportion of residential land supply and the residential land price has short-term characteristics, which are reflected in the first year and the first-to-second year after removing counties into districts, whereas the impact on the scale of residential land supply only begins to increase in the second year after the CDT, and the related effects seem to lag. This may be because after CDT occurs, the original county and the prefecture-level municipal governments need a defined transition period to transfer land management practices, approval, and other authoritative roles, leading to a delay in land transfer and planning. After that, the scale of residential land supply gradually increased, the real residential demand and speculative demand caused by the CDT were satisfied, and the positive effect of the withdrawal of counties on land prices decreased. Moreover, heterogeneity analysis demonstrates that CDT practice has a promotional effect on the scale of residential land supply in small- and medium-sized cities and large cities. Additionally, CDT has a stronger positive impact on the proportion and price of residential land supply in large cities compared to their small- and medium-sized counterparts.
Considering that this study mainly investigated the impact of past CDT practices on urban land supply, and given the ongoing prevalence of such practices in China’s urban areas, the research findings bear significant policy implications for relevant city governments with regard to optimizing land supply and effectively regulating the land market during the CDT process. First, governments must foresee the impact of the phenomenon on economic and social development, particularly in terms of population- and labor-force-related changes, and they should subsequently adjust the supply of residential land from the supply perspective to address fluctuations in residential land prices caused by CDT. Second, to mitigate the impact of the transformation on the proportion of residential land supply, city governments must also adjust the urban land supply structure in a timely manner, especially in accordance with the population and industrial changes experienced by the entire city, so as to effectively prevent the imbalance of the urban land supply structure. Third, different types of cities should concentrate on various land-based market regulation measures during the CDT process. For example, some large cities may need to attend to the regulation of the scale, proportion, and price of residential land supply. Finally, a sound income distribution mechanism needs to be established, the compensation standard for land acquisition during this process must be raised reasonably, the legitimate rights and interests of landless peasants need to be protected, the construction of affordable housing and controlled land/housing prices should be completed via various methods (such as “fixed construction, competitive land price”, “limited land price, and competitive construction” in the land transfer link), and the social welfare brought about by the construction of affordable housing while pursuing land transfer income should be promoted.
We acknowledge that this study has certain limitations and shortcomings. First, due to the diverse and complex effects introduced by CDT, although we have endeavored to examine the various potential impacts and mechanisms of the phenomenon on urban residential land supply, there may still be omissions, which necessitate further exploration in the future. Second, as the available residential land price data are limited to 105 cities, the analysis coverage regarding the impact of CDT on urban land prices is relatively restricted. Third, owing to the absence of long-term time-series data, this study has not been able to investigate the far-reaching effects of this form of transformation on the residential land supply. Consequently, more in-depth research will be required in the future as relevant data become accessible.

Author Contributions

Conceptualization, Z.C.; methodology, M.Z., N.W. and S.C.; validation, M.Z. and S.C.; formal analysis, M.Z., S.C., J.Y. and Z.C.; investigation, M.Z. and S.C.; data curation, N.W. and S.C.; writing—original draft preparation, M.Z., J.Y. and S.C.; writing—review and editing, J.Y. and Z.C.; visualization, M.Z. and J.Y.; supervision, Z.C.; project administration, Z.C.; funding acquisition, Z.C. All authors have read and agreed to the published version of the manuscript.

Funding

This research was supported by the research project of Shanghai Institute of Geological Survey (2017(D)-028(F)-02), the National Natural Science Foundation of China (42171244), and the research project of Humanities and Social Sciences of the Ministry of Education in China (19YJC810018).

Data Availability Statement

The data that support the findings of this study are available from the author upon reasonable request.

Conflicts of Interest

The authors declare no conflict of interest.

Notes

1
Strictly speaking, the term “county” include county-level cities in this context and the phrasing should be “county (or county-level city)-to-district transformation.” For the sake of brevity, however, this paper shall adopt the shorthand “county-to-district transformation.”
2
The urban hierarchy in China can be generally classified into three levels. The first level consists of municipalities directly under the jurisdiction of central government, including Beijing, Tianjin, Shanghai, and Chongqing, which concurrently govern multiple districts and counties (or county-level cities). The second level comprises prefecture-level cities, which also govern several districts or counties (or county-level cities), including some sub-provincial cities and regular prefecture-level cities. The third level consists of county-level cities, which are governed by prefecture-level cities and are administratively unified with the districts under their jurisdiction.
3
In the following text, the number of CDT cases in different regions, periods, and degrees of cities is obtained through the statistical analysis of relevant data on China’s administrative divisions website.
4
First, in terms of the stages of CDT practice, this study primarily focused on the second peak of CDT (2010–2017). Compared to the first peak (1998–2004), this period has more policy practice samples, and the distribution of sample cities’ locations and scales is more balanced, making the samples more representative and comprehensive. Second, to reduce estimation bias caused by policy expectations (the impact of the first peak of CDT on the current period), the threshold of this policy should be in or after 2005. Finally, due to data availability (the monitoring range of national land prices was only upgraded to 105 cities since the fourth quarter of 2008, and the relevant statistical yearbooks have not published the total supply and proportion of residential land supply in each city after 2017), this paper ultimately selected 2009 as the pre-treatment point and 2017 as the post-treatment point.
5
To maintain the validity of the regression results, we did not include the types of cities with a small number of samples in the empirical analysis-mega-cities and super large cities.
6
The data of the aforementioned dependent variables were sourced from the China City Statistical Yearbook. Additionally, a logarithmic transformation was applied to the continuous variables (excluding those measured in proportion) during the model estimation.

References

  1. Peiser, R.B. Does It Pay to Plan Suburban Growth? J. Am. Plan. Assoc. 1984, 50, 419–433. [Google Scholar] [CrossRef]
  2. Bueno-Suárez, C.; Coq-Huelva, D. Sustaining What Is Unsustainable: A Review of Urban Sprawl and Urban Socio-Environmental Policies in North America and Western Europe. Sustainability 2020, 12, 4445. [Google Scholar] [CrossRef]
  3. Wei, H.; Wei, Q.; Cao, T.; Zhao, J. Types, problems and changes for readjustment of administrative divisions in the process of urbanization. Hum. Geogr. 2009, 24, 55–58. [Google Scholar]
  4. Dai, L.; Zhan, Z.; Shu, Y.; Rong, X. Land Use Change in the Cross-Boundary Regions of a Metropolitan Area: A Case Study of Tongzhou-Wuqing-Langfang. Land 2022, 11, 153. [Google Scholar] [CrossRef]
  5. Yu, J.; Zhou, K.; Yang, S. Land use efficiency and influencing factors of urban agglomerations in China. Land Use Policy 2019, 88, 104143. [Google Scholar] [CrossRef]
  6. Wu, K.-Y.; Ye, X.-Y.; Qi, Z.-F.; Zhang, H. Impacts of land use/land cover change and socioeconomic development on regional ecosystem services: The case of fast-growing Hangzhou metropolitan area, China. Cities 2013, 31, 276–284. [Google Scholar] [CrossRef]
  7. Rahnama, M.R. Forecasting land-use changes in Mashhad Metropolitan area using Cellular Automata and Markov chain model for 2016-2030. Sustain. Cities Soc. 2021, 64, 102548. [Google Scholar] [CrossRef]
  8. van den Berg, L.; Braun, E.; van der Meer, J. The organising capacity of metropolitan regions. Environ. Plan. C Gov. Policy 1997, 15, 253–272. [Google Scholar] [CrossRef]
  9. Sohn, C.; Reitel, B.; Walther, O. Cross-border metropolitan integration in Europe: The case of Luxembourg, Basel, and Geneva. Environ. Plan. C Gov. Policy 2009, 27, 922–939. [Google Scholar] [CrossRef]
  10. Lu, X.; Kuang, B.; Li, J. Regional difference decomposition and policy implications of China’s urban land use efficiency under the environmental restriction. Habitat Int. 2018, 77, 32–39. [Google Scholar] [CrossRef]
  11. Zhao, J.; Zhu, D.; Cheng, J.; Jiang, X.; Lun, F.; Zhang, Q. Does regional economic integration promote urban land use efficiency? Evidence from the Yangtze River Delta, China. Habitat Int. 2021, 116, 102404. [Google Scholar] [CrossRef]
  12. Gao, X.; Zhang, A.; Sun, Z. How regional economic integration influence on urban land use efficiency? A case study of Wuhan metropolitan area, China. Land Use Policy 2020, 90, 104329. [Google Scholar] [CrossRef]
  13. Ma, W.; Jiang, G.; Chen, Y.; Qu, Y.; Zhou, T.; Li, W. How feasible is regional integration for reconciling land use conflicts across the urban–rural interface? Evidence from Beijing–Tianjin–Hebei metropolitan region in China. Land Use Policy 2020, 92, 104433. [Google Scholar] [CrossRef]
  14. Tang, W.; Hewings, G.J.D. Do city-county mergers in China promote local economic development? Econ. Transit. Inst. Chang. 2017, 25, 439–469. [Google Scholar] [CrossRef]
  15. Li, X.; Xu, X. Impact analysis of turning counties(cities) into districts to the urban economic growth in China. Acta Geogr. Sin. 2015, 70, 1202–1214. [Google Scholar]
  16. Chen, Y.; Wang, K. Influence and mechanism of “Turning Counties (Cities) into Districts” on urban space expansion: Taking Hangzhou as a case study. Geogr. Res. 2019, 38, 221–234. [Google Scholar]
  17. Tang, W.; Wang, Y. Administrative boundary adjustment and urbanization of population: Evidence from city-county merger in China. Econ. Res. J. 2015, 50, 72–85. [Google Scholar]
  18. Lai, S. A Study on the Upgrading Effect of Industrial Structure and Its Influencing Factors in the Turning Countries into Districts. Econ. Surv. 2021, 38, 3–13. [Google Scholar]
  19. Chen, Y.; Wang, K. Influence and Mechanism of “Turning Counties (Cities) into Districts” on Urban Public Service Allocation and Spatial Layout. Econ. Geogr. 2019, 39, 76–86. [Google Scholar]
  20. Zhang, J.; Li, G.; Wang, C. Dynamic mechanism of administrative division adjustment under the context of scale rescaling: The case of Guangdong province. Hum. Geogr. 2016, 31, 74–82. [Google Scholar]
  21. Yang, T.; Zhu, Y.; Zhou, B. The Influence of Administrative Division Adjustment on the Unbalance of Urbanization Development: A Quasi Natural Experiment on “County to the Urban Areas” Reforms. Mod. Financ. Econ.-J. Tianjin Univ. Financ. Econ. 2020, 40, 88–99. [Google Scholar]
  22. Zhang, J.; Qi, Y.; Zhu, D.; Li, Y.; Song, Y. Does the Transformation of Counties into Districts Promote Urban Land Use Efficiency? Based on an Empirical Study of 261 Cities in China. China Land Sci. 2022, 36, 59–68. [Google Scholar]
  23. Wang, S.; Chen, X. The Impact of Transformation of Counties into Districts on Urban Land Use Efficiency. China Land Sci. 2022, 36, 117–127. [Google Scholar]
  24. Zhou, S.; Xu, S. The role of withdrawing counties and setting up districts in promoting urban development: Empirical research based on the perspective of urban construction. Urban Probl. 2020, 11, 14–22. [Google Scholar]
  25. Sun, Z.; Yang, Q. The mechanism of land use influence under the background of turning county into district: A case study on Ningbo Yinzhou. China City Planning Review. 2019, 5, 114–120. [Google Scholar]
  26. Zhang, L.; Zhang, J. The review and consideration on adjustment of administrative divisions: Exemplified by Dantu district of Zhenjiang. Urban Probl. 2007, 1, 36–40. [Google Scholar]
  27. Wang, F.; Zhang, C. Impacts of administrative division adjustment on housing price in urban China. Geogr. Res. 2017, 36, 913–925. [Google Scholar]
  28. Ji, X.; Jin, B. Influence of city-county merger on the industrial land price: An experience from Shangyu City of Zhejiang Province. Urban Probl. 2019, 12, 57–63+96. [Google Scholar]
  29. Liu, J. Analysis of the phenomenon of “Administrative Region Economy” prominent in China’s transformation period. Theor. Front. 2004, 10, 20–22. [Google Scholar]
  30. Zuo, Y.; Chen, X. Research on the spatiotemporal pattern of administrative division adjustment in urban jurisdiction. Study Pract. 2014, 9, 13–24. [Google Scholar]
  31. Li, J.; Li, J.; Fu, Z.; Wang, H. The “Withdrawal of Counties and Establishment of Districts” and the Upgrading of Regional Industrial Structure: Evidence from County Data from 1995 to 2012. China Econ. Trade Her. 2016, 17, 26–27. [Google Scholar]
  32. Nie, W.; Lu, J.; Zhou, W. Research into Effect Mechanism of County to City Reform on Local Urbanization—Analysis Based on the Viewpoint of Central vs. Peripheral Districts. Popul. Dev. 2019, 25, 2–13. [Google Scholar]
  33. Zhang, C.; Zhou, Z.; Kong, X. Demolition of counties (cities) into districts and transfer of rural labor force: Empirical evidence from Jiangsu Province. J. Agrotech. Econ. 2017, 7, 18–30. [Google Scholar]
  34. Beck, T.; Levine, R.; Levkov, A. Big bad banks? The winners and losers from bank deregulation in the United States. J. Financ. 2010, 65, 1637–1667. [Google Scholar] [CrossRef]
  35. Gentzkow, M. Television and Voter Turnout. Q. J. Econ. 2006, 121, 931–972. [Google Scholar] [CrossRef]
  36. Dong, W. A study on the impact of the removal of counties into districts on the land financial dependence of local governments—An empirical analysis based on panel data of prefecture level cities. J. Ningxia Univ. Humanit. Soc. Sci. Ed. 2018, 40, 123–129. [Google Scholar]
  37. Wu, Y.; Zhang, X.; Skitmore, M.; Song, Y.; Hui, E.C.M. Industrial land price and its impact on urban growth: A Chinese case study. Land Use Policy 2014, 36, 199–209. [Google Scholar] [CrossRef]
  38. Jin, J.; Chen, D.; Huang, Z.; Du, X. Empirical Study on the Effect of County-to-District Reforms on Real Estate Market. Sci. Geogr. Sin. 2021, 41, 473–480. [Google Scholar]
  39. Hua, W.; Fan, L.; Wu, Q.; Peng, B. Regression analysis of urban land value influencing factors: For Jiangsu province. Econ. Geogr. 2005, 2, 203–205+218. [Google Scholar]
  40. Song, M.; Xie, Q.; Chen, J. Effects of government competition on land prices under opening up conditions: A case study of the Huaihe River ecological economic belt. Land Use Policy 2022, 113, 105875. [Google Scholar] [CrossRef]
  41. Tan, X.; Qian, J. Capital Market Pressure and Strategic Patent Behavior: The Perspective of Short Selling Mechanism. China Ind. Econ. 2020, 5, 156–173. [Google Scholar]
  42. Meyer, B.D. Natural and quasi-experience in economics. J. Bus. Econ. Stat. 1995, 13, 151–161. [Google Scholar]
  43. Li, P.; Lu, Y.; Wang, J. Does flattening government improve economic performance? Evidence from China. J. Dev. Econ. 2016, 123, 18–37. [Google Scholar] [CrossRef]
  44. Wang, Y.; Delgado, M.S.; Khanna, N.; Bogan, V.L. Good news for environmental self-regulation? Finding the right link. J. Environ. Econ. Manag. 2019, 94, 217–235. [Google Scholar] [CrossRef]
  45. Yu, F.; Xiao, D.; Chang, M.-S. The impact of carbon emission trading schemes on urban-rural income inequality in China: A multi-period difference-in-differences method. Energy Policy 2021, 159, 112652. [Google Scholar] [CrossRef]
  46. Heckman, J.J.; Ichimura, H.; Todd, P. Matching as an Econometric Evaluation Estimator. Rev. Econ. Stud. 1998, 65, 261–294. [Google Scholar] [CrossRef]
  47. Rosenbaum, P.R.; Rubin, D.B. The Central Role of the Propensity Score in Observational Studies for Causal Effects. Biometrika 1983, 70, 41–55. [Google Scholar] [CrossRef]
  48. Zhan, X.; Zeng, F. Does Adjustment of Administrative Divisions Improve Economic Development Quality? Empirical Evidence from the “City-county Merger”. Financ. Trade Res. 2021, 32, 70–82. [Google Scholar]
  49. Chetty, R.; Looney, A.; Kroft, K. Salience and Taxation: Theory and Evidence. Am. Econ. Rev. 2009, 99, 1145–1177. [Google Scholar] [CrossRef]
  50. Zhou, D.B. Discussion of randomization analysis of experimental data: The fisher randomization test. J. Am. Stat. Assoc. 1980, 75, 591–593. [Google Scholar]
  51. Rubin, M.; Wang, B.; Chen, Z. Has the anti-corruption campaign decreased air pollution in China? Energy Econ. 2020, 91, 104878. [Google Scholar]
  52. Jiang, L.; Lu, Y.; Zhang, G. The construction of the polot free trade zone and chinese exports. China Ind. Econ. 2021, 8, 75–93. [Google Scholar]
  53. Xiong, C.S.; Tan, R. Will the land supply structure affect the urban expansion form? Habitat Int. 2018, 75, 25–37. [Google Scholar] [CrossRef]
  54. Liu, J.M.; Hou, X.H.; Wang, Z.Q.; Shen, Y. Study the effect of industrial structure optimization on urban land-use efficiency in China. Land Use Policy 2021, 105, 105390. [Google Scholar] [CrossRef]
  55. Zhang, L. Imbalance of Land Supply Structure and Housing Price in Chinese Citie-Based on Land Transaction Records. Res. Econ. Manag. 2019, 40, 30–46. [Google Scholar]
  56. Abadie, A.; Hou, J.G. The economic costs of conflict: A case study of the basque country. Am. Econ. Rev. 2003, 93, 112–132. [Google Scholar] [CrossRef]
  57. Fan, D.; Fang, L.; Song, Z. Research on the Effect and Mechanism of Smart City Construction on Industrial Structure Upgrading. Sci. Technol. Prog. Policy 2021, 38, 61–68. [Google Scholar]
  58. Wang, L.; Wu, Q.; Luo, D. Market barriers, administrative approval and firms’ markup. China Ind. Econ. 2020, 6, 100–117. [Google Scholar]
  59. Wang, K.; Chen, T.; Liu, Y. New discussion and reflection on “Administrative division itself can be seen as a resource”. Geogr. Res. 2019, 38, 195–206. [Google Scholar]
Figure 1. Number of CDT cases in China from 1978 to 2017.
Land 12 01149 g001
Figure 2. Theoretical framework.
Land 12 01149 g002
Figure 3. Parallel trend of urban residential land supply.
Land 12 01149 g003
Figure 4. Results of the placebo test.
Land 12 01149 g004
Figure 5. Comparison of the scale and proportion of actual and synthetic residential land supply in Meizhou City, Guangdong Province.
Land 12 01149 g005
Figure 6. Comparison of the scale, proportion, and price of actual and synthetic residential land supply in Baoding City, Hebei Province.
Land 12 01149 g006
Table 1. Descriptive statistics.
VariableImplicationObservationsMeanStd. Dev.MinMax
Dependent
variable
lnSupplyResidential land supply total, take logarithm value23765.3200.9352.7547.373
PropProportion of residential land supply23760.2050.1070.0220.513
lnPriceResidential land price, take logarithm value7117.6270.8315.36110.734
Independent variable
(full sample)
ReformWhether to implement the policy practice23760.1030.30401
Independent variable
(samples of key monitored cities for land prices)
ReformWhether to implement the policy practice7110.1420.34901
Control
variable
(full sample)
lnGdpGross regional product, take logarithm237616.3160.85014.44518.405
InvReal estate as a percentage of fixed investment23760.1470.0890.0220.441
lnGovFiscal expenditure, take logarithm237614.5450.66612.97216.285
IsIndustrial structure23760.8690.0780.5450.997
lnPdPopulation density, take logarithm23765.7090.9051.6037.882
Control
variable
(samples of key monitored cities for land prices)
lnGdpGross regional product, take logarithm71116.9230.84014.44518.405
InvReal estate as a percentage of fixed investment7110.1860.0990.0320.671
lnGovFiscal expenditure, take logarithm71114.9160.70712.87416.900
IsIndustrial structure7110.8990.0770.5840.997
lnPdPopulation density, take logarithm7116.1330.7773.6577.825
Note: The term “full sample” refers to the 264 prefectural-level city samples obtained after screening and selection, and the term “samples of key monitored cities for land prices” denotes the 79 prefectural-level city samples for which land price data were available.
Table 2. The impact of CDT on urban residential land supply.
Dependent VariablelnSupplylnProplnPricelnSupplylnProplnPrice
Independent VariableModel 1Model 2Model 3Model 4Model 5Model 6
Reform0.141 ***0.013 *0.081 **0.142 ***0.015 *0.064 *
(0.044)(0.008)(0.037)(0.043)(0.008)(0.036)
lnGdp 0.491 **−0.0010.093
(0.204)(0.015)(0.106)
Inv 0.882 ***0.100 *1.021 ***
(0.284)(0.056)(0.197)
lnGov 0.823 ***0.033 **0.185 **
(0.157)(0.015)(0.075)
Is 2.997 ***0.1470.856
(0.995)(0.139)(0.664)
lnPd 0.193−0.0320.644 ***
(0.289)(0.052)(0.203)
Control variableNONONOYESYESYES
Individual fixed effectYESYESYESYESYESYES
Time fixed effectYESYESYESYESYESYES
Constant term5.306 ***0.203 ***7.613 ***−18.510 ***−0.221−1.611
(0.011)(0.000)(0.009)(2.915)(0.398)(1.664)
Observations2376237671123762376711
R20.7570.4160.9540.7830.4190.960
Note: 1. *** p < 0.01, ** p < 0.05, * p < 0.1; 2. The clustering of robust standard errors of regression coefficients is shown in parentheses.
Table 3. Results of PSM-DID regression.
Dependent VariablelnSupplylnProplnPricelnSupplylnProplnPrice
Independent VariableModel 1Model 2Model 3Model 4Model 5Model 6
Reform0.151 ***0.014 *0.074 **0.152 ***0.016 *0.066 *
(0.045)(0.008)(0.037)(0.044)(0.008)(0.038)
Control variableNONONOYESYESYES
Individual fixed effectYESYESYESYESYESYES
Time fixed effectYESYESYESYESYESYES
Observations2291229168622912291685
R20.7580.4240.9560.7850.4270.960
Note: 1. *** p < 0.01, ** p < 0.05, * p < 0.1; 2. The clustering of robust standard errors of regression coefficients is shown in parentheses.
Table 4. Test of the policy spillover effect.
Dependent VariablelnSupplylnProplnSupplylnProp
Independent VariableModel 1Model 2Model 3Model 4
NR−0.039−0.011−0.054−0.013
(0.053)(0.008)(0.047)(0.008)
Control variableNONOYESYES
Individual fixed effectYESYESYESYES
Time fixed effectYESYESYESYES
Observations1784178417841784
R20.7030.4020.7420.703
Note: The clustering of robust standard errors of regression coefficients is shown in parentheses.
Table 5. Heterogeneity regression results.
lnSupplylnProplnPrice
City
Type
Small CityMedium
City
Type-II Large CitySmall CityMedium
City
Type-II Large CityMedium
City
Type-II Large City
Reform0.1300.160 **0.262 ***−0.0030.0170.031 **0.0060.092 **
(0.093)(0.071)(0.067)(0.019)(0.014)(0.013)(0.104)(0.044)
Control variableYESYESYESYESYESYESYESYES
Individual fixed effectYESYESYESYESYESYESYESYES
Time
fixed effect
YESYESYESYESYESYESYESYES
Observations936837513936837513279324
R20.6920.7200.7720.4150.3900.4600.9300.964
Note: 1. *** p < 0.01, ** p < 0.05; 2. The clustering of robust standard errors of regression coefficients is shown in parentheses.
Table 6. Mechanism validation of the impact of CDT on residential land supply.
Dependent VariablelnBuaPdrlnNelnPtw
Independent VariableModel 1Model 2Model 3Model 4
Reform0.147 ***0.327 **0.034 **0.035
(0.019)(0.166)(0.015)(0.028)
Control variableYESYESYESYES
Individual fixed effectYESYESYESYES
Time fixed effectYESYESYESYES
Constant term1.859 ***91.790 ***−1.500 *10.140 ***
(0.525)(4.733)(0.887)(0.317)
Observations2376237621122292
R20.9410.1770.9570.301
Note: 1. *** p < 0.01, ** p < 0.05, * p < 0.1; 2. The clustering of robust standard errors of regression coefficients is shown in parentheses.
Disclaimer/Publisher’s Note: The statements, opinions and data contained in all publications are solely those of the individual author(s) and contributor(s) and not of MDPI and/or the editor(s). MDPI and/or the editor(s) disclaim responsibility for any injury to people or property resulting from any ideas, methods, instructions or products referred to in the content.

