Article

Study on the Effect of Job Accessibility and Residential Location on Housing Occupancy Rate: A Case Study of Xiamen, China

1
Institute of Population and Ecology Studies, Xiamen University, Xiamen 361005, China
2
School of Sociology and Population Studies, Renmin University of China, Beijing 100872, China
3
School of Public Affairs, Xiamen University, Xiamen 361005, China
*
Author to whom correspondence should be addressed.
Land 2023, 12(4), 912; https://doi.org/10.3390/land12040912
Submission received: 22 March 2023 / Revised: 12 April 2023 / Accepted: 18 April 2023 / Published: 19 April 2023
(This article belongs to the Special Issue Urban Land Development in the Process of Urbanization)

Abstract

:
The serious mismatch between industrialization and urbanization has led to the emergence of ghost cities. Industry-and-city integration aims to agglomerate industries and the population simultaneously by coordinating the planning and construction, and by mixing different functional areas including industry, office, living, and commercial functions. Based on the population spatial vector database of Jimei District in Xiamen in 2020, this paper empirically analyzes the effects of spatial patterns between industry and city, in terms of residential location and job accessibility, on the housing occupancy rate in new towns and cities. The findings demonstrate that: (1) The attraction of residential location to population varies among three different urban expansion models. The housing occupancy rate of residential areas that meet the concentric circle model is the highest, followed by the sector model, and the multiple nuclei model is the lowest; (2) The jobs–housing relationship has a stable and positive impact on the occupancy rate of commercial housing in the new town, which verifies that job accessibility is the basic demand for families’ residential location choice; (3) There is a significant pattern difference in the influence of job accessibility on the occupancy rate. The occupancy rate of the sector model residential area is highly dependent on job accessibility: the higher the job accessibility, the lower the occupancy rate of the concentric residential area, while job accessibility has a weak impact on the occupancy rate of the multiple nuclei residential area. The conclusions suggest that the spatial planning of new towns should include a clear population absorbing strategy, and the residential location should follow the expansion law of the urban residential functional area, balance the relationship between industrial agglomeration and the job–housing relationship, and allocate life factors in a targeted manner according to the actual impact of job accessibility.

1. Introduction

China has undergone a strikingly rapid urbanization process since its economic reform starting in the late 1970s. In order to accommodate the increasing population and to ameliorate the overcrowding issues in the old city, physical urban expansion is an indispensable process. In China, in order to improve urbanization and industrialization, city expansion has been carried under different, and sometimes confusing and misleading titles, such as university, airport, and high-speed rail new towns (xin zhen)/new cities (xin cheng)/new districts (xin qu), because zhen/shi/qu also refer to administrative level and the new towns/cities/districts do not necessarily match the administrative jurisdiction area. The excessive planning and construction of new districts and towns around booming cities come at a cost of no or very low population density and a very high housing vacancy rate, resulting in the emergence of so-called ‘ghost cities’ [1,2,3]. A ghost city is not necessarily an administrative level of a city (shi in Chinese), but often a new district as a sublevel administrative division of the shi; for example, the most infamous ghost cities are Kangbashi District in Ordos [1], and Zhengdong New District in Zhengzhou [4]. The existence of ghost cities has caused significant economic and social costs, and a waste of land resources, which violates the development objectives of intensive use of land resources and high-quality urbanization [5,6]. The reason for the ghost cities can be attributed to the serious mismatch between industrialization and urbanization [7,8,9], leading to the emergence of new towns and districts without industries. Housing vacancy often coexists with housing congestion, which is the major source of public dissatisfaction with housing policies, and it is also a typical manifestation of land use spatial mismatch and low utilization efficiency [10]. Scholars have put forward the concept of industry-and-city integration [11]; industry refers to activities involving goods and services production, while city refers to residential and commercial facilities, and places of leisure. Industry-and-city integration aims to match and combine industry and infrastructure, industry and settlement, and eventually attract the population and reach a seamless integration among industry, city, and people [12,13].
The core of industry-and-city integration is to agglomerate industries and the population simultaneously by coordinating the planning and construction, and a mixture of different functional areas including industry, office, living, and commercial functions. For the new towns, the number of potential jobs is estimated through the expected scale of the industry, and a certain number of houses for potential workers are built. In this way, it aims to create a job–housing balance, a spatial match between employment opportunities and living spaces [9,14]. However, efforts to promote mixed land use and built self-contained communities often do not have good results, and the trend of “job–housing separation” has become more and more obvious [15].
In other words, there is disagreement on whether job–housing proximity or job–housing separation is more conducive to population agglomeration in new towns. For the former, it is believed that residents’ housing location and employment should be as close as possible to reduce commuting time, traffic congestion, and transportation costs. However, relying on decentralized job opportunities to achieve job–housing balance is at the expense of agglomeration’s economic gains. Industrial agglomeration can bring economic efficiency, so the spatial pattern of job–housing separation is conducive to enterprises concentrating more effectively, enjoying the economic advantage of agglomeration, and improving labor productivity. Job–housing balance requires that every enterprise can find suitable employees in the vicinity, and every worker can find suitable jobs around the place of residence, which is difficult to achieve in the labor market. Moreover, when there are multiple workers in one family, the places of work will be very scattered, and one place of residence cannot be balanced with multiple places of employment. Finally, with the increasing diversity of urban residents’ lives, families should consider not only job accessibility, but also all kinds of public services they need, such as schools, hospitals, green spaces, and commercial centers, which do not match the spatial distribution of jobs. Therefore, families may sacrifice job–housing balance to achieve the goal of maximizing their overall utility.
In reality, the family faces doubly constrained markets: the labor market and the housing market. The current understanding of the spatial relationship between industry and the city lags far behind the practical needs. Therefore, this paper attempts to clarify the application scenarios of the job–housing spatial relationship and its effect on the housing occupancy rate. This paper takes the housing occupancy rate of Jimei District as the dependent variable and examines the impact of job accessibility and housing site location. Job accessibility is calculated by the estimated labor market outcome (ELMO) model developed by Östh [16], which captures the state of competition in doubly constrained markets: the labor market and housing market. Housing site location considers and operationalizes the three models of urban expansion theories; i.e., the concentric zone model [17], sector model [18], and multiple nuclei theory [19].
This paper contributes to the current studies in the following ways. First, China lacks authoritative data on urban housing vacancies, and this paper provides a residential scale occupancy rate, instead of housing vacancy mainly based on either satellite images of nightlight brightness at the city scale, or on-the-spot investigation, or geographic location-based service data [1,2,20,21]. The accuracy of vacancy rate data obtained through survey or indirect inference in prefecture-level cities can meet the needs of national-level research. However, research on housing vacancies within cities needs to be carried out at the small-scale residential block level. Second, it connects the urban expansion model with the housing occupancy rate, and examines the difference in the job–housing spatial structure and population attraction mechanism under different urban expansion models; therefore it provides practical implications and room for urban planning and government intervention.
The paper is structured as follows. Section 2 reviews the literature. Section 3 presents the hypotheses, and is followed by methods and data in Section 4. Section 5 presents the empirical results, and Section 6 concludes.

2. Literature Review

2.1. Job–Housing Distance and Population Distribution in the City

Population agglomeration in suburban new towns has long attracted academic attention. Gibbs [22] pointed out that after the 1960s, the concentration trend of the rural population migrating to large cities turned to suburbanization, and the population began to move from large cities to satellite cities, and from metropolises to small cities, and the places of work and residence were increasingly separated. Goldstein and Mayer [23] proposed a typical pattern of population migration within North American cities during the period of rapid industrialization. Most new European immigrants settled in the old areas of the city, and then moved to areas with better housing conditions on the edge of the city through a generation or more of adjustment and socialization, and the inner circle of the city began to be abandoned. However, not all migrants could complete the migration from the inner circle to the suburbs. Only the high-level elite among the migrants tended to settle on the edge of the suburbs, while the young and middle-aged (unmarried, married without children) tended to still choose to live in the inner circle of the city. The emergence of a large number of “urban villages” after World War II is another notable feature of the population distribution of Western cities. The population size of rural communities adjacent to big cities is increasing, and rural residents mainly rely on urban employment, which also makes the distance between jobs and residences more and more distant. In the 1980s, the trend of suburbanization in Western industrial cities turned into gentrification [24]. The once-declining central urban area experienced urban renewal, attracting high-income groups to move in again, while the original residents moved out because they could not afford the cost of living. The distance between jobs and residences of ordinary wage earners working in the old city has widened, and excessive commuting has become a problem that damages the urban environment. To curb the waste of resources and pollution caused by the spread of urban suburbanization, the new urbanism that emerged in the 1990s put forward smart growth requirements for urban land use planning, advocating increased residential density and reduced commuting to reverse the dispersion of urban population since industrialization.
However, long-term vacancy of housing not only occurs in cities with population loss: there is also a high housing vacancy rate in peripheral towns of cities with population growth [25]. This is also the problem with China’s new towns, even in the eastern population growth cities [20,21]. Both the newly arrived migrant population and native residents of the old city do not tend to live in new towns, resulting in a relatively high vacancy rate of housing in the new towns. How land use planning can increase the population concentration of new towns has become the focus of China’s urbanization.

2.2. Industry-and-City Integration and Population Aggregation

In order to explore the population aggregation mechanism in the development of new towns in China, scholars put forward the concept of industry-and-city integration [11,12,13]. A high level of industry or urbanization cannot be directly translated into the attractiveness of the population. Instead, it is the integration of urbanization and industrialization, and the corresponding living and employment functions that meet people’s needs, which are the driving force for the gradual increase in population. Yue and Gu [12] emphasized that within the multi-dimensional integration of industry and city in terms of the natural geographical environment, urban functions, development stages, industry types, spatial scales, and historical and cultural characteristics, the integration of employment and residential space is most crucial. On this basis, it is generally assumed that the integration of employment–residential spatial relationships can attract more people to choose to live in new towns [26,27]. However, how to realize the spatial integration of industry and city causes difficulties in both theory and application, and theoretical development lags far behind practical needs.
In the field of land use and planning, the term closest to industry-and-city integration is job–housing balance, which is used to represent the matching degree between the number of laborers and the number of jobs in a city within a certain area [28]. In land use planning, advocating the layout of employment and residences close to each other and reducing the separation of jobs and housing has gradually become the mainstream spatial layout principle of urban planning practice in China. However, when some new town developers try to implement the concept of integration of industry, city, and people to build residential areas around the industrial parks, they find that the actual occupancy rate is not high. In other words, the job–housing balance to minimize commuting cannot be directly translated into the effect of population aggregation [29]. There should be a more complex mechanism of influence between the integration of industry and city and the attractiveness of population aggregation. It is necessary to conduct an in-depth analysis from the perspective of job accessibility and the behavior of residential location choice.

2.3. Job–Housing Balance and Residential Location Choice

The causal logic that the jobs–housing balance can promote population agglomeration mainly comes from the behavior of residential location selection at the micro level. Under the assumption of the classic single-center city model, all residents work in the CBD, and residents will make a trade-off between commuting costs and housing costs, so the choice of family residence becomes a problem of location choice. Since there are differences in employment opportunities, housing costs and commuting costs in each location, under the principle of utility maximization, residents tend to choose the residential location with the lowest commuting cost. Liu and Wang [8] used job accessibility to reflect the jobs and residences relationship in the region, and verified that the job accessibility of the region affects residents’ commuting time, thereby affecting the choice of residential location. By extending the microcosmic behavior of residents to the regional level, the area where the occupation and residence are close has the effect of attracting the population.
However, residential–employment mixed land use alone does not achieve high employment self-containment of residents [15,29]. There are many reasons for questioning job–housing balance’s effect on population aggregation. First, critics of the relationship between job–housing balance and commuting efficiency point out that the job–housing balance may not necessarily reduce commuting time, as it reduces external trips but may increase the congestion for the growing internal trips [30,31]. Ibeasb et al. [32] found that under different circumstances, it is job accessibility, not commuting time, which affects the choice of residential location. Second, the role of commuting costs in residential location decisions is not decisive. In real life, the selection of residential locations not only considers commuting costs, but also considers land prices, housing prices, and the distribution of public resources, and there are large differences in the selection goals of residential locations for different socioeconomic groups [33,34]. Through study of the Paris metropolitan area, Korsu and Wenglenski [35] found that the job–housing balance still plays a key role in residents’ job and residence location choice, but it is no longer the main factor in residential location choice. In other words, the job–housing balance is not the decisive factor in the location selection of jobs and residences, and is not a rigid principle that needs to be followed in the location selection of industries and residential areas. Third, under the market economy, job–housing separation has its inevitability and rationality. Zheng et al. [15] pointed out that the spatial pattern of “separation of jobs and housing” is conducive to a more effective concentration of enterprises, enjoying the advantages of agglomeration economies, and improving labor productivity. Relying on dispersed job opportunities to eliminate job–housing separation is at the expense of agglomeration economic benefits, which is often difficult to achieve in an urban spatial structure dominated by market forces.
To sum up, the research on urban sprawl focuses on whether the job–housing balance is conducive to population aggregation and enhances industry–city integration. The views in the literature that support or question the population aggregation effect of employment and housing are mainly from the micro level of family behavior, while the occupancy rate is a phenomenon at the level of residential areas. The distribution of population in a region cannot be directly inferred from micro-level behavior. Even if there are indeed factors that weaken the importance of job accessibility in the choice of family residential location, it does not mean that the distribution pattern of higher population density in areas close to jobs and residences will be changed at the residential area level. Second, as a spatial feature, the job–housing balance does not include the location factor and discussion of its relationship with population agglomeration. Therefore, this paper intends to focus on the occupancy rate of residential areas to explore the spatial variation law of the influence of job accessibility on occupancy rate.

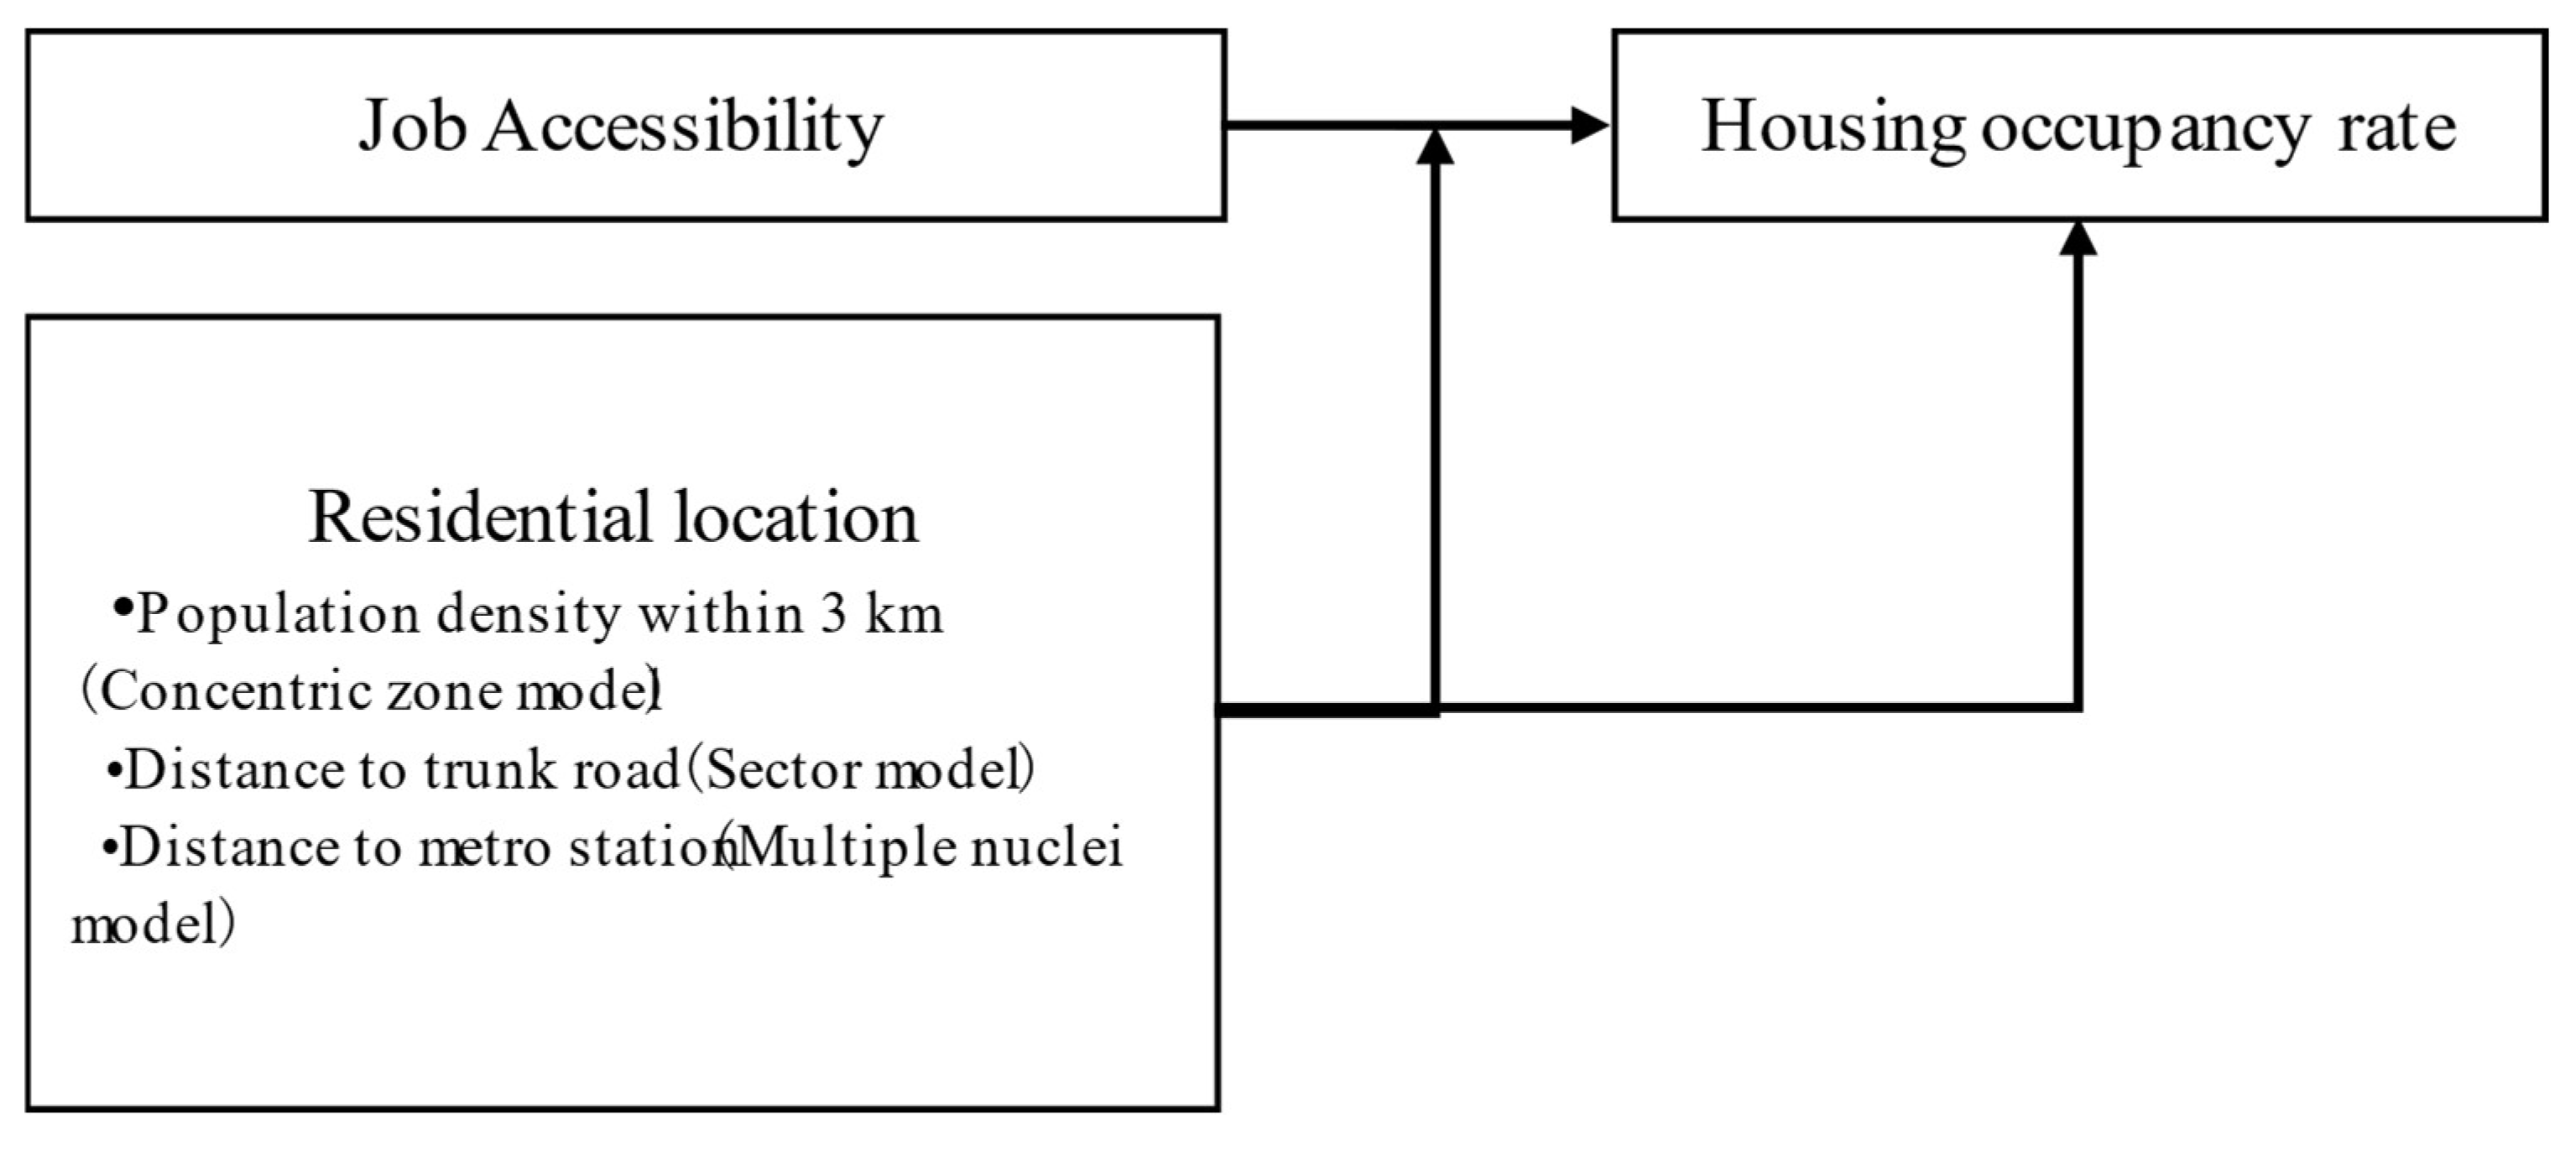
3. Theoretical Hypotheses

Urban scientists and planners have put forward many theories to improve our understanding of the spatial urban expansion and functionality of cities. Among them, the most well-known are the concentric zone theory, the sector theory, and the multiple nuclei theory [17,18,19,36]. These theories take into account the coordination of residential–employment spatial relations, spatial function, and the realization of population growth. These Western classical urban expansion models are the main reference for Chinese urban planners in the land use planning of new towns and have been verified to a certain degree in Chinese literature [37,38,39,40,41,42,43]. The population density distribution in some Chinese cities presents an obvious concentric zone pattern, with the city center as the core and suburban new town as the extension. The population density decreases gradually from the inside out [40,41]. Sector urban expansion along main roads is a common strategy in the expansion of Chinese cities. For example, by studying the urban spatiotemporal dynamics based on remote sensing and GIS in Dongguan, Guangdong, Li et al. [42] revealed the wave-like characteristics of urban expansion along main roads. Under the influence of New Urbanism, the “group + TOD” planning model connecting new cities and old cities with modern closed transportations tools such as BRT, subway, and light rail has become increasingly popular, and the growth of urban spatial structure shows a multiple nuclei pattern [43]. However, few studies have explored the impact of urban spatial structure on housing occupancy rates, which is the starting point for the current paper.
Under different urban expansion patterns, the residential–employment spatial structure realizes different urban functions, and the reasons for attracting people to live are different. It should be noted that the job–housing relationship does not act independently on population agglomeration. It is the urban function formed by the combination of job–housing relationship and residential location that attracts people to live in an area. The housing occupancy rate varies due to the difference in the residential locations. Residential location and job accessibility both have influenced housing occupancy rates. Therefore, in the following section, we propose our hypotheses according to the combination of job accessibility and residential location under three urban expansion models; namely, the concentric zone model, the sector model, and the multiple nuclei model. To make it clear, we elucidate each model’s logic of attracting the population, and propose hypotheses on the relationship between the job accessibility and occupancy rate.

3.1. Concentric Zone Model and Occupancy Rate

Burgess’s theory of concentric circles divides the internal structure of the city into three rings: the central business district (CBD), the residential area, and the commuting area. The process of urban growth is that each ring expands its scope by invading the outer ring, and the urban spatial pattern after the expansion is still concentric circles [17]. Therefore, the location of the new residential area should be on the periphery of the expanded central business district and within the commuting area. At the same time, the expansion of concentric circles also emphasizes the close relationship between jobs and residences. It is advocated that the location of residential areas should be kept close to the commercial and industrial areas of workers, and the layout of high-end commercial residences in the outer commuting areas away from the center, so that the residential population is still concentrated. The population introduction mechanism of the concentric circle structure is to accommodate the residential needs of the growing population of the central business district by sharing the urban functions and facilities of the old city.
Although the concentric circle model has been criticized for having no real boundaries for the functional areas, this does not mean that the location of the concentric circles cannot be measured. In the Chinese context, cities have generally formed through the sprawl process of traditional monocentric old cities, with a central area with a high concentration of population and functions. As the population continues to increase, the population density gradually decreases from the inside to the outside. Therefore, the principle of site selection for residential areas that conform to concentric circle expansion is to arrange residential areas near high-density centers. In this way, residential population density is a reflection of the location characteristics for residential areas in the concentric zone urban structure. The higher the population density of a residential area, the closer it is to the central business district. Meanwhile, an increase in residential population density in suburban areas indicates that residential functions have been transferred to that area. Based on this, the hypothesis on the spatial relationship between industry and city and occupancy rate under the concentric circle expansion model is proposed:
H1. 
The higher the population density around the residential block and job accessibility, the higher the occupancy rate of commercial housing.

3.2. Sector Model and Occupancy Rate

The sector model, also known as the Hoyt model, is a modification of the concentric zone model of city development. Hoyt [18] argued that cities do not develop in the form of simple rings; instead, cities extend outward along the roads and railways and the expansion of cities is in a wedge-like fashion. The location advantages formed by the convenient circulation of the traffic arteries can promote the concentration of investment, industry, and population to the traffic arteries, and will gradually form an industrial belt with the traffic lines as the main axis. With the development of the economy and the expansion of the spatial scope of the development zone, the development zone is gradually integrated with the original urban area, making the original urban area expand into a belt. The spatial layout of the sector expansion model is to lay out new industrial spaces on both sides of the trunk road, and provide supporting residential spaces nearby. The sector expansion model is also a common strategy in the expansion of industrial cities or urban industrial areas in China, and has the characteristics of tidal wave expansion along traffic roads [42]. The urban expansion process presents an oscillation between the diffusion phase and coalescence phase. The former is a dispersed development of newly expanded patches after the newly built roads, while the coalescence phase refers to infilling in the urban complex or the expansion outward from the existing urban patches [44]. It can be seen that the population introduction mechanism of expanding the new towns in a sector mode is to provide living space for the employed population absorbed by industrial agglomeration and to attract the population to live with the convenience of employment and commuting. The main trunk roads across regions are the infrastructure for sector expansion, or axial expansion in Chinese literature [42], and are designed and constructed to intentionally highlight the purpose of improving commuting efficiency between new and old cities. The trunk roads usually adopt a closed road model similar to a highway with two-way multi-lanes and no traffic lights, and it is free of charge. The site selection characteristics of the sector expansion residential area are close to the main trunk roads across the region, and it is emphasized that the living space should be close to the employment space. Based on this, the hypothesis of the industrial–city spatial relationship and occupancy rate under the strip-shaped axial expansion model is proposed:
H2. 
The closer the distance to the cross-regional trunk road and the higher the job accessibility, the higher the occupancy rate of commercial housing.

3.3. Multiple Nuclei Model and Occupancy Rate

The multiple nuclei model advocates solving the problems of urban sprawl and population organic evacuation by building satellite towns and districts around large cities [19]. From the perspective of the process of regional economic development, new regional growth poles are always firstly concentrated in a few areas with better conditions, and they are distributed in spots. When clusters of growth poles appear, a complete regional functional center including employment, administration, commerce, and entertainment will be formed within a certain area. Then, traffic is built to connect the scattered centers so that the crowded population in the old city can be organically evacuated to the subcenter of the city, and finally realize the population distribution pattern of polycentric aggregation. Since 2000, under the influence of new urbanism, the “group + TOD” planning model that connects the new towns with the old city by means of modern closed transportation such as BRT, subway, and light rail has become increasingly popular [45,46]. The structural growth of Chinese cities is shifting towards polycentric.
The population import mechanism of the multiple nuclei expansion model is that the overpopulation of the old city drives the population to evacuate to other urban subcenters. In order to connect the multiple centers and transfer population rapidly, subways have been built. In the multiple nuclei model, the subway stations are often located at or near the functional center in new towns, such as administrative, leisure, medical, commercial, and residential centers. Unlike the sector expansion model, the polycentric “axes” are only responsible for the transfer of populations, not all factors of production. In other words, the essence of the multiple nuclei model is to greatly improve job accessibility and realize population dispersal by using the mobility of modern means of transportation. Therefore, the residential location characteristics of the multiple nuclei model are that they are adjacent to the main stations of the modern transportation network. Based on this, the hypothesis of the industrial–city spatial relationship and occupancy rate under the polycentric expansion model is proposed:
H3. 
The closer the commercial housing is to the subway station and the higher the job accessibility, the higher the occupancy rate of commercial housing.

4. Empirical Framework and Data

4.1. Econometric Model

We estimated the effects of job accessibility and residential location on housing occupancy using OLS regressions. The baseline model used takes the form:
Y i = β 0 + β 1 A i + β 2 M i + β 3 R i + β 4 D i + β 5 M i A i + β 6 R i A i + β 7 D i A i + α j X i + ε i
where Yi represents the occupancy rate of the ith residential block, A i represents the job accessibility, Mi is the distance between the residential block and the nearest metro station, Ri is the distance to the nearest trunk road, and Di represents the population density within 3 km of the residential block. Xi stands for the control variables. M i A i , R i A i , D i A i are the interactions between job accessibility and the variables of the three location models, to examine the effect of residential location (see the conceptual framework in Figure 1).
In order to present the spatial difference of the influence of job accessibility on housing occupancy rate, this study used geographically weighted regression (GWR) to estimate the spatial heterogeneity of the job accessibility coefficient. The model is as follows:
Y i = β 0 + β 1 i u i , v i A i + β 2 M i + β 3 R i + β 4 D i + α j X i + ε i
where β 1 i u i , v i is the regression coefficient of the job accessibility A i at the ith sample point, and its numerical magnitude changes with the change of the point position. The coefficients for other variables do not vary spatially.

4.2. Variables

The dependent variable, the occupancy rate, was calculated by dividing the number of households living in the residential block by the number of housing units. Unlike the prior studies, in which the data were often obtained by estimation, the household information used was the information registered by the public security department, and the number of housing units in each residential block was provided by the planning department. The occupancy rate ranged from 0 to 100%.
The main independent variable was job accessibility, which represents the spatial relationship between the distribution of the labor force-age resident population aged 18–59 and the distribution of employment opportunities in the region. Prior models of job accessibility involve the summarization of potential job opportunities within the bounds of a predetermined boundary, which creates the problem of endogeneity since the delineation of the area is not made on basis of individual preferences but rather on the basis of conditions that are common to all individuals. In this study, we used the approach developed by Östh [16] to address endogeneity. The estimated labor market outcome (ELMO) [16] is a direct response to the need for the creation of an improved measure of accessibility, mimicking the state of competition in doubly constrained markets: the labor market and housing market. Compared with the traditional two-step search method, which only uses distance as a weight, the model takes into account the situation where different individuals compete for the same job. In other words, the EMLO three-step search model first computes the weight of job competition among firms, the weight of job search competition among labor forces, and then job accessibility.
Referring to Östh [16], the calculation of ELMO was conducted via three steps.
The first step was to search for job opportunities around the residential area within the realms of an annulus, and to measure the degree of job competition among residents. Assuming that the individual labor force has requirements on the distance between jobs and residences, job opportunities within a certain realm of an annulus r were acceptable, and job opportunities outside the circle were not considered. Then, we calculated the summed potential workers (Si) aged between 18 and 59 residing within the realms of an annulus of the jobs;
S i = s i
The ELMO model assumes that job seekers have a distance preference for job opportunities, and are more interested in jobs that are close to them, and less interested in jobs that are far away. Therefore, the degree of interest of residents in residential area i in the jobs provided by enterprises in the surrounding area decreases with the distance between residential block i and enterprise j. Let wij be the degree of interest of the residents of residential block i in the job opportunities of enterprise j, and the number of jobs provided by enterprise j in the circle Dj. Then, the total amount of acceptable job opportunities ADi for residential block i is:
A D i = D j w i j
The Zi, the job competition coefficient, is the ratio of the total labor force supply in residential block i to the total available job opportunities within the realms of the annulus:
Z i = S i A D i
Zi reflects the employment supply and demand relations; if Zi > 1, it means that the supply of labor exceeds the demand, and there is job competition among the laborers. Conversely, if Zi < 1, it means that the enterprises within the realms of the annulus provide more job opportunities than the labor supply.
The second step is to search for labor supply around the enterprise, and to measure the degree of competition in recruitment among enterprises. Due to the distance between jobs and residence, enterprises can only recruit employees from residential areas with distances less than r. The job-seeking competition coefficient Zi of each residential block determines how difficult it is for enterprise j to recruit enough labor. The larger Zi is, the more difficult it is for enterprises to recruit employees from residential block i. The attractiveness of enterprises to labor still decays with the degree of distance wji. Therefore, the calculation of the number of potential job seekers AZj that enterprise j can recruit from the surrounding area is as follows.
A Z j = Z i w j i
D C i , labor demand under competition, is calculated by dividing the actual demand for jobs with the competition value A Z i . High competition (value above 1) decreases the amount of DC at the location, whereas low completion increases the amount of DC.
D C i = D i A Z i
Centering on the location of the residential block, the third step is to search for effective job opportunities in the surrounding area, and calculate the job accessibility of the labor force in the residential area. The higher the D C i value of the job’s popularity, the lower the possibility that the job seeker will secure the job. If the recruitment competition coefficient of enterprises in the circle is very low, the possibility of employees working in this enterprise is very low. Considering the distance preference Wij, ADC, the abbreviation of aggregation of demand for labor under competition is calculated as:
A D C i = Z i w j i
For a specific residential block, the effective number of jobs that the labor force is willing to go to and can go to is not equal to the jobs actually provided by the enterprises in the area. After considering the job competition among the labor force and the recruitment competition among enterprises, the effective job estimate EEi of the labor force is as follows:
E E i = A D C i Z i
Finally, the average number of available jobs for residents in residential block i is the job accessibility:
A c c e s s n = E E i n i
The second independent variable is the residential site location, which is operationalized under three models of urban expansion theories; i.e., concentric zone model, sector model, and multiple nuclei theory. We used the proxies of the population density around the residential block (3 km), the distance to the trunk road (Xiamen–Shaxian Expressway and Shenyang–Haikou Expressway in this study), and the distance to the metro station (as Metro Line 1 connects multiple centers, such as the Jimei educational cluster and software park in Jimei District). For the latter two proxies, the reciprocal value was used in the model. The planning and development of new towns and districts usually use a combination of these three urban expansion strategies, and there is no clear boundary between the different modes of expansion. Therefore, the geographic location of each residential block conforms to the characteristics of the concentric zone, sectoral model, and multiple nuclei model to varying degrees.
Control variables include the distance from the Xiamen North Railway Station, real estate price (second-hand housing prices were captured from the Anjuke website in December 2020), delivery time of the residential block, and residential population characteristics. The reason for considering Xiamen North Railway Station was that Xiamen, as a regional central city, attracts a large number of home buyers from surrounding cities. Being close to Xiamen North Railway Station and convenient for dual-city living is an important principle for those home buyers. The behavior of home buyers from other places has resulted in changes in the occupancy rate around Xiamen North Railway Station. When analyzing the factors affecting the occupancy rate, the distance from Xiamen North Railway Station should be used as a control variable. Gaoqi Airport does not have this kind of influence and was therefore not chosen as a control variable.
The instrumental variable was chosen to address potential endogeneity between job accessibility and occupancy rate. We exploited the proportion of industrial land and proportion of residential land to the total construction land in the community where the residential area was located as our IV. The higher the proportion of industrial land, the more employment opportunities; the higher the proportion of residential land, the more living space; these two exogenous variables affect the level of job accessibility but have no direct impact on the occupancy rate of the residential block, which meets the requirement that exogenous variables affect independent variables but not dependent variables.

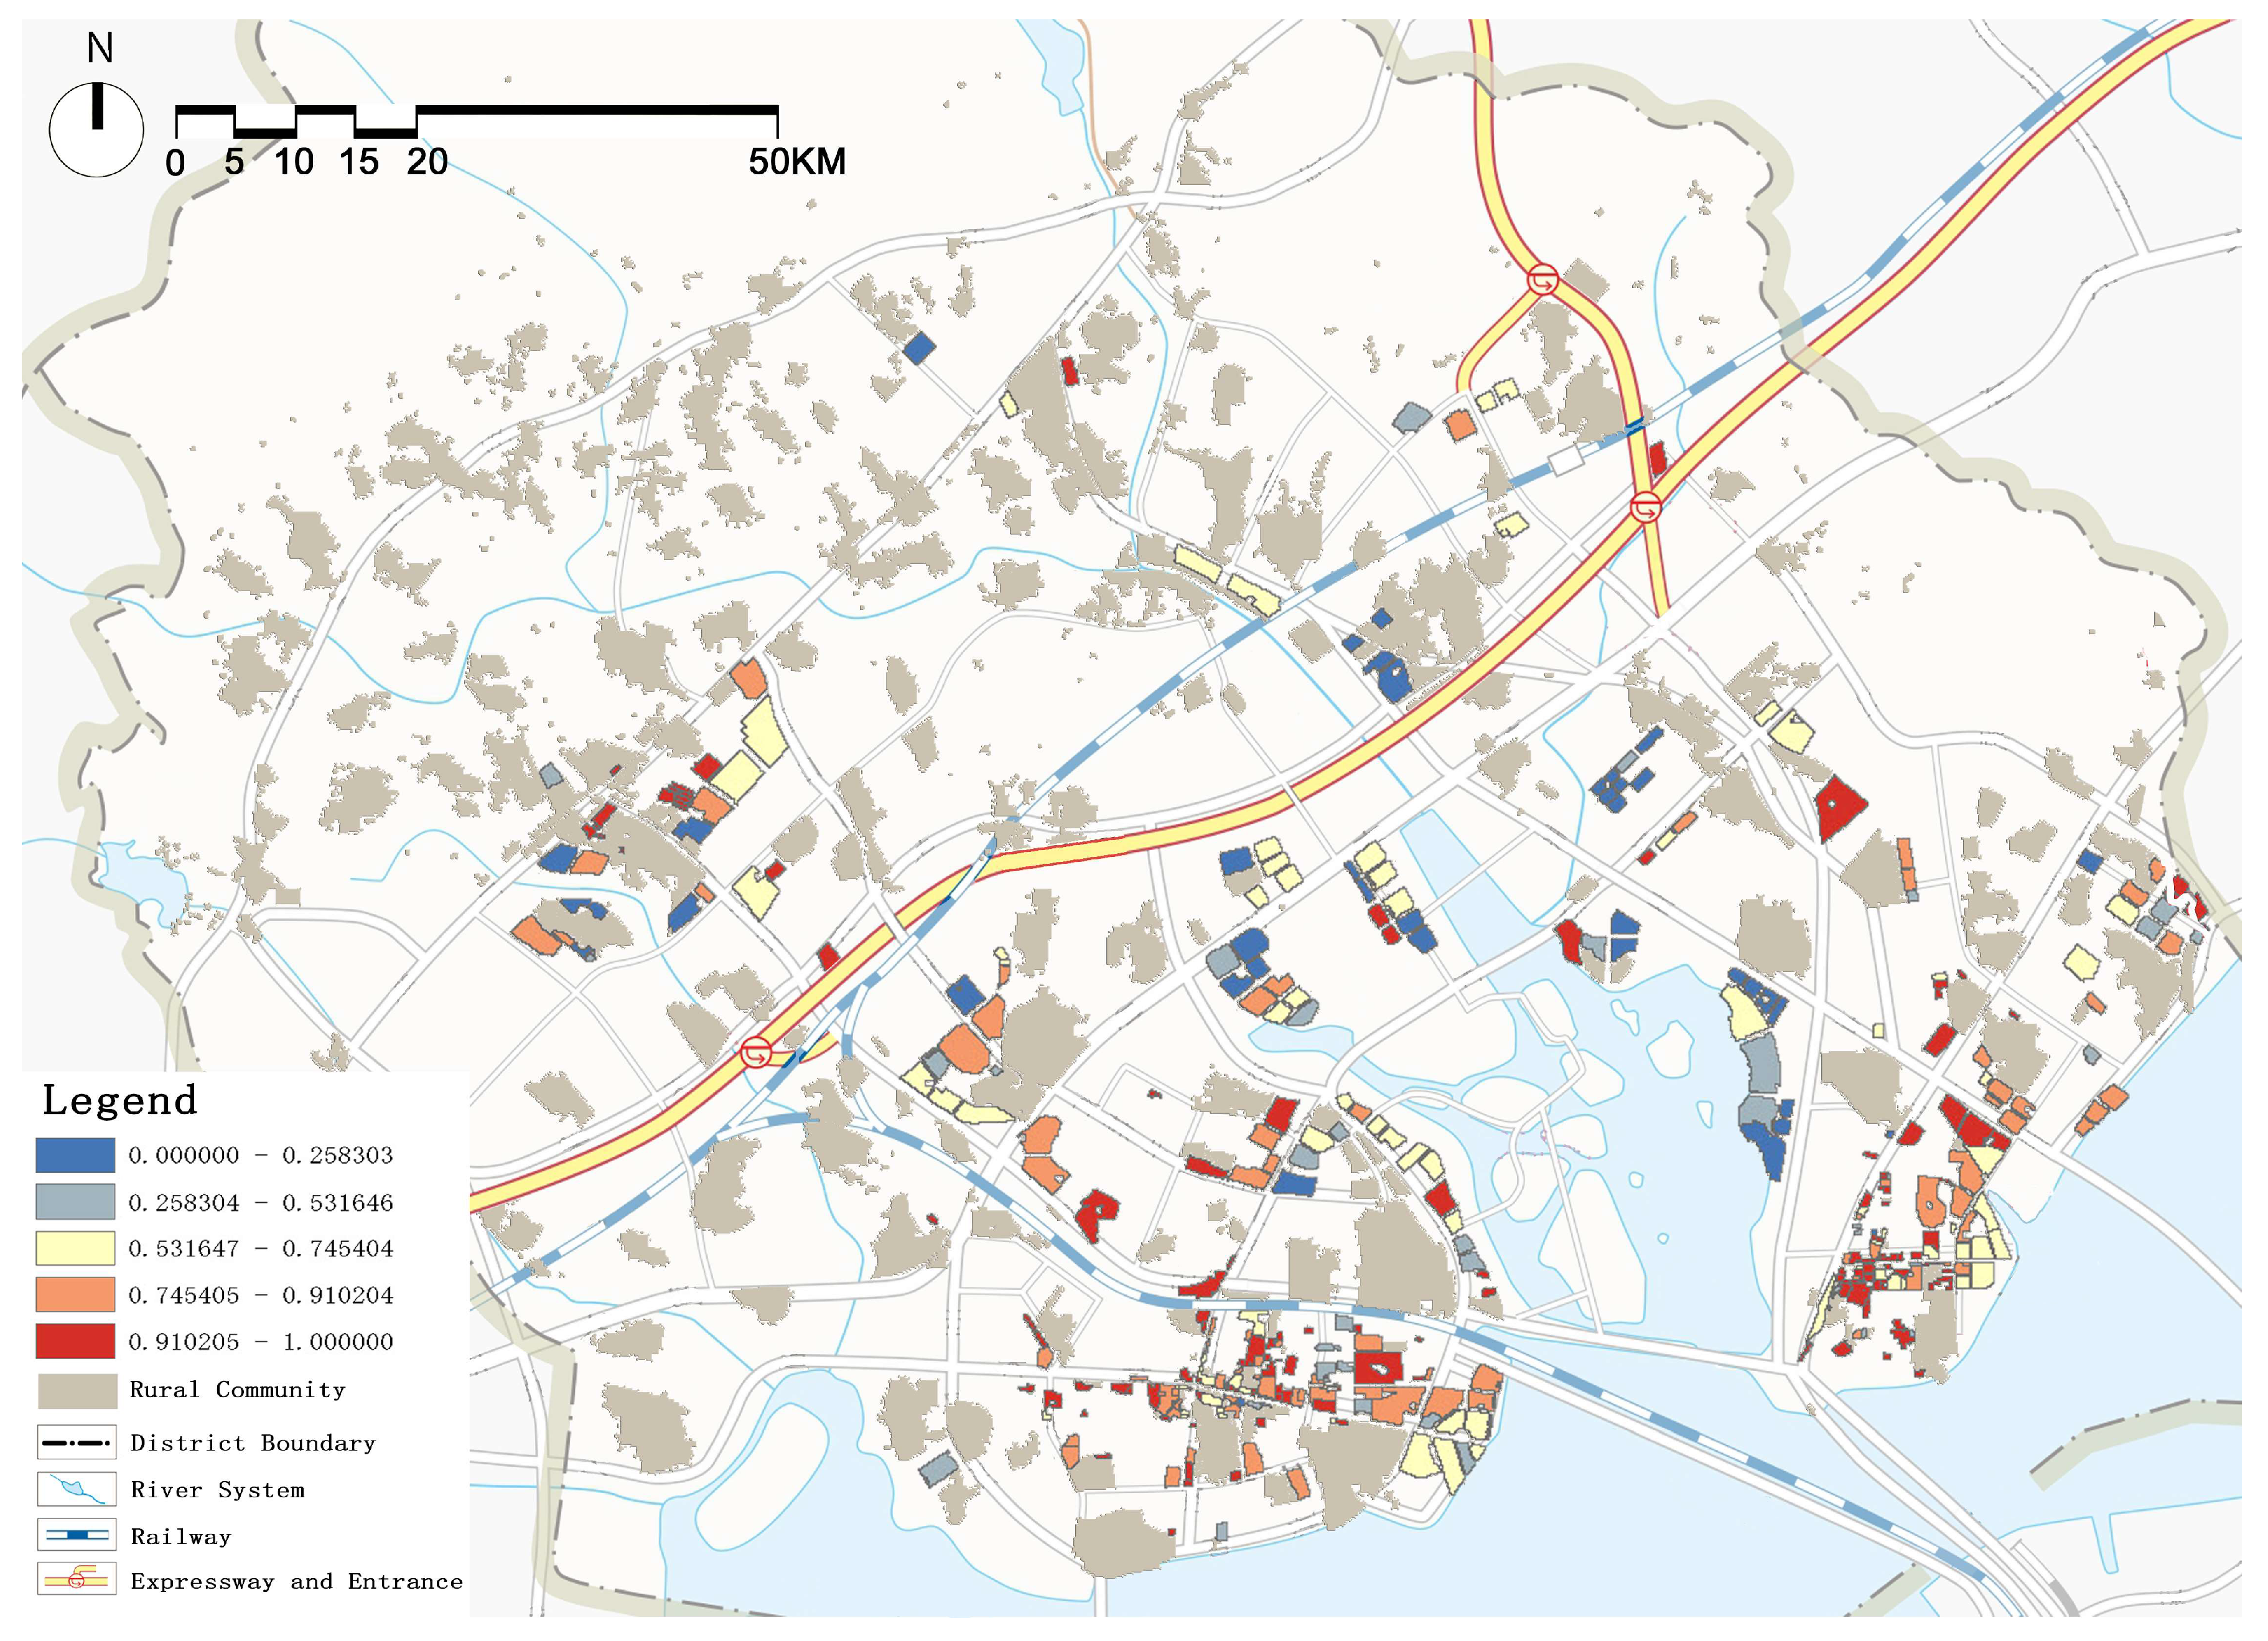
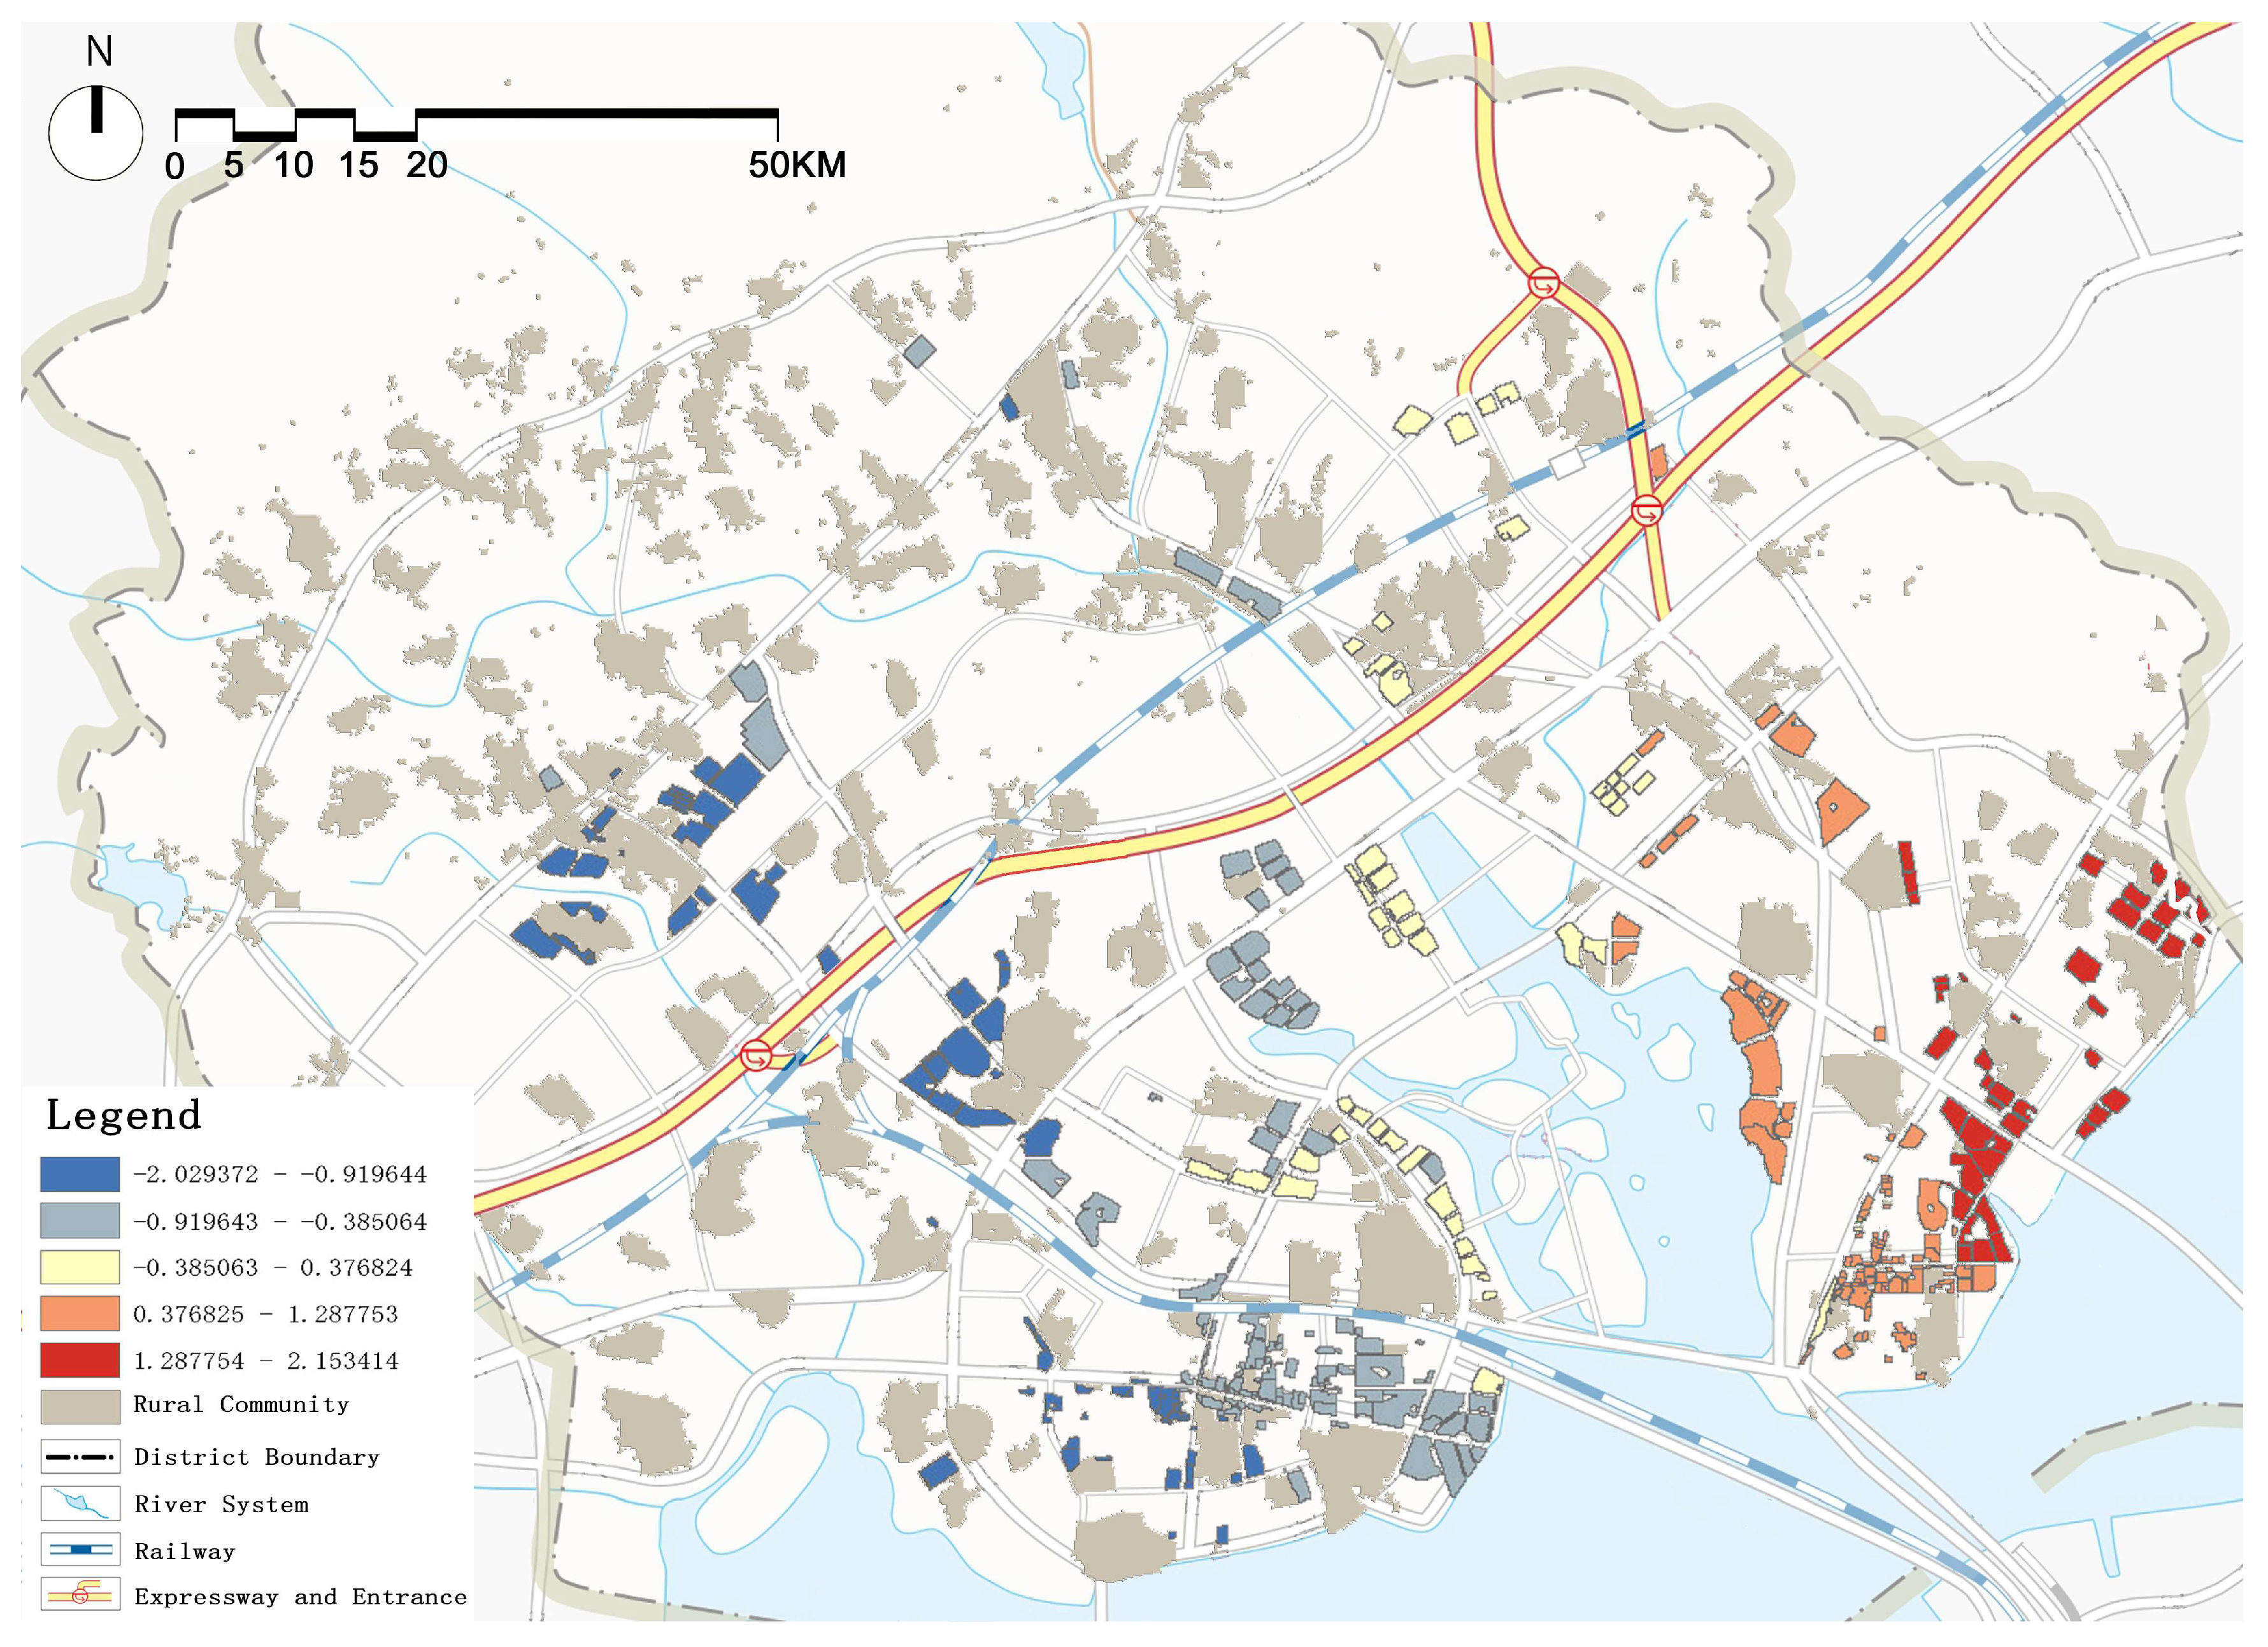
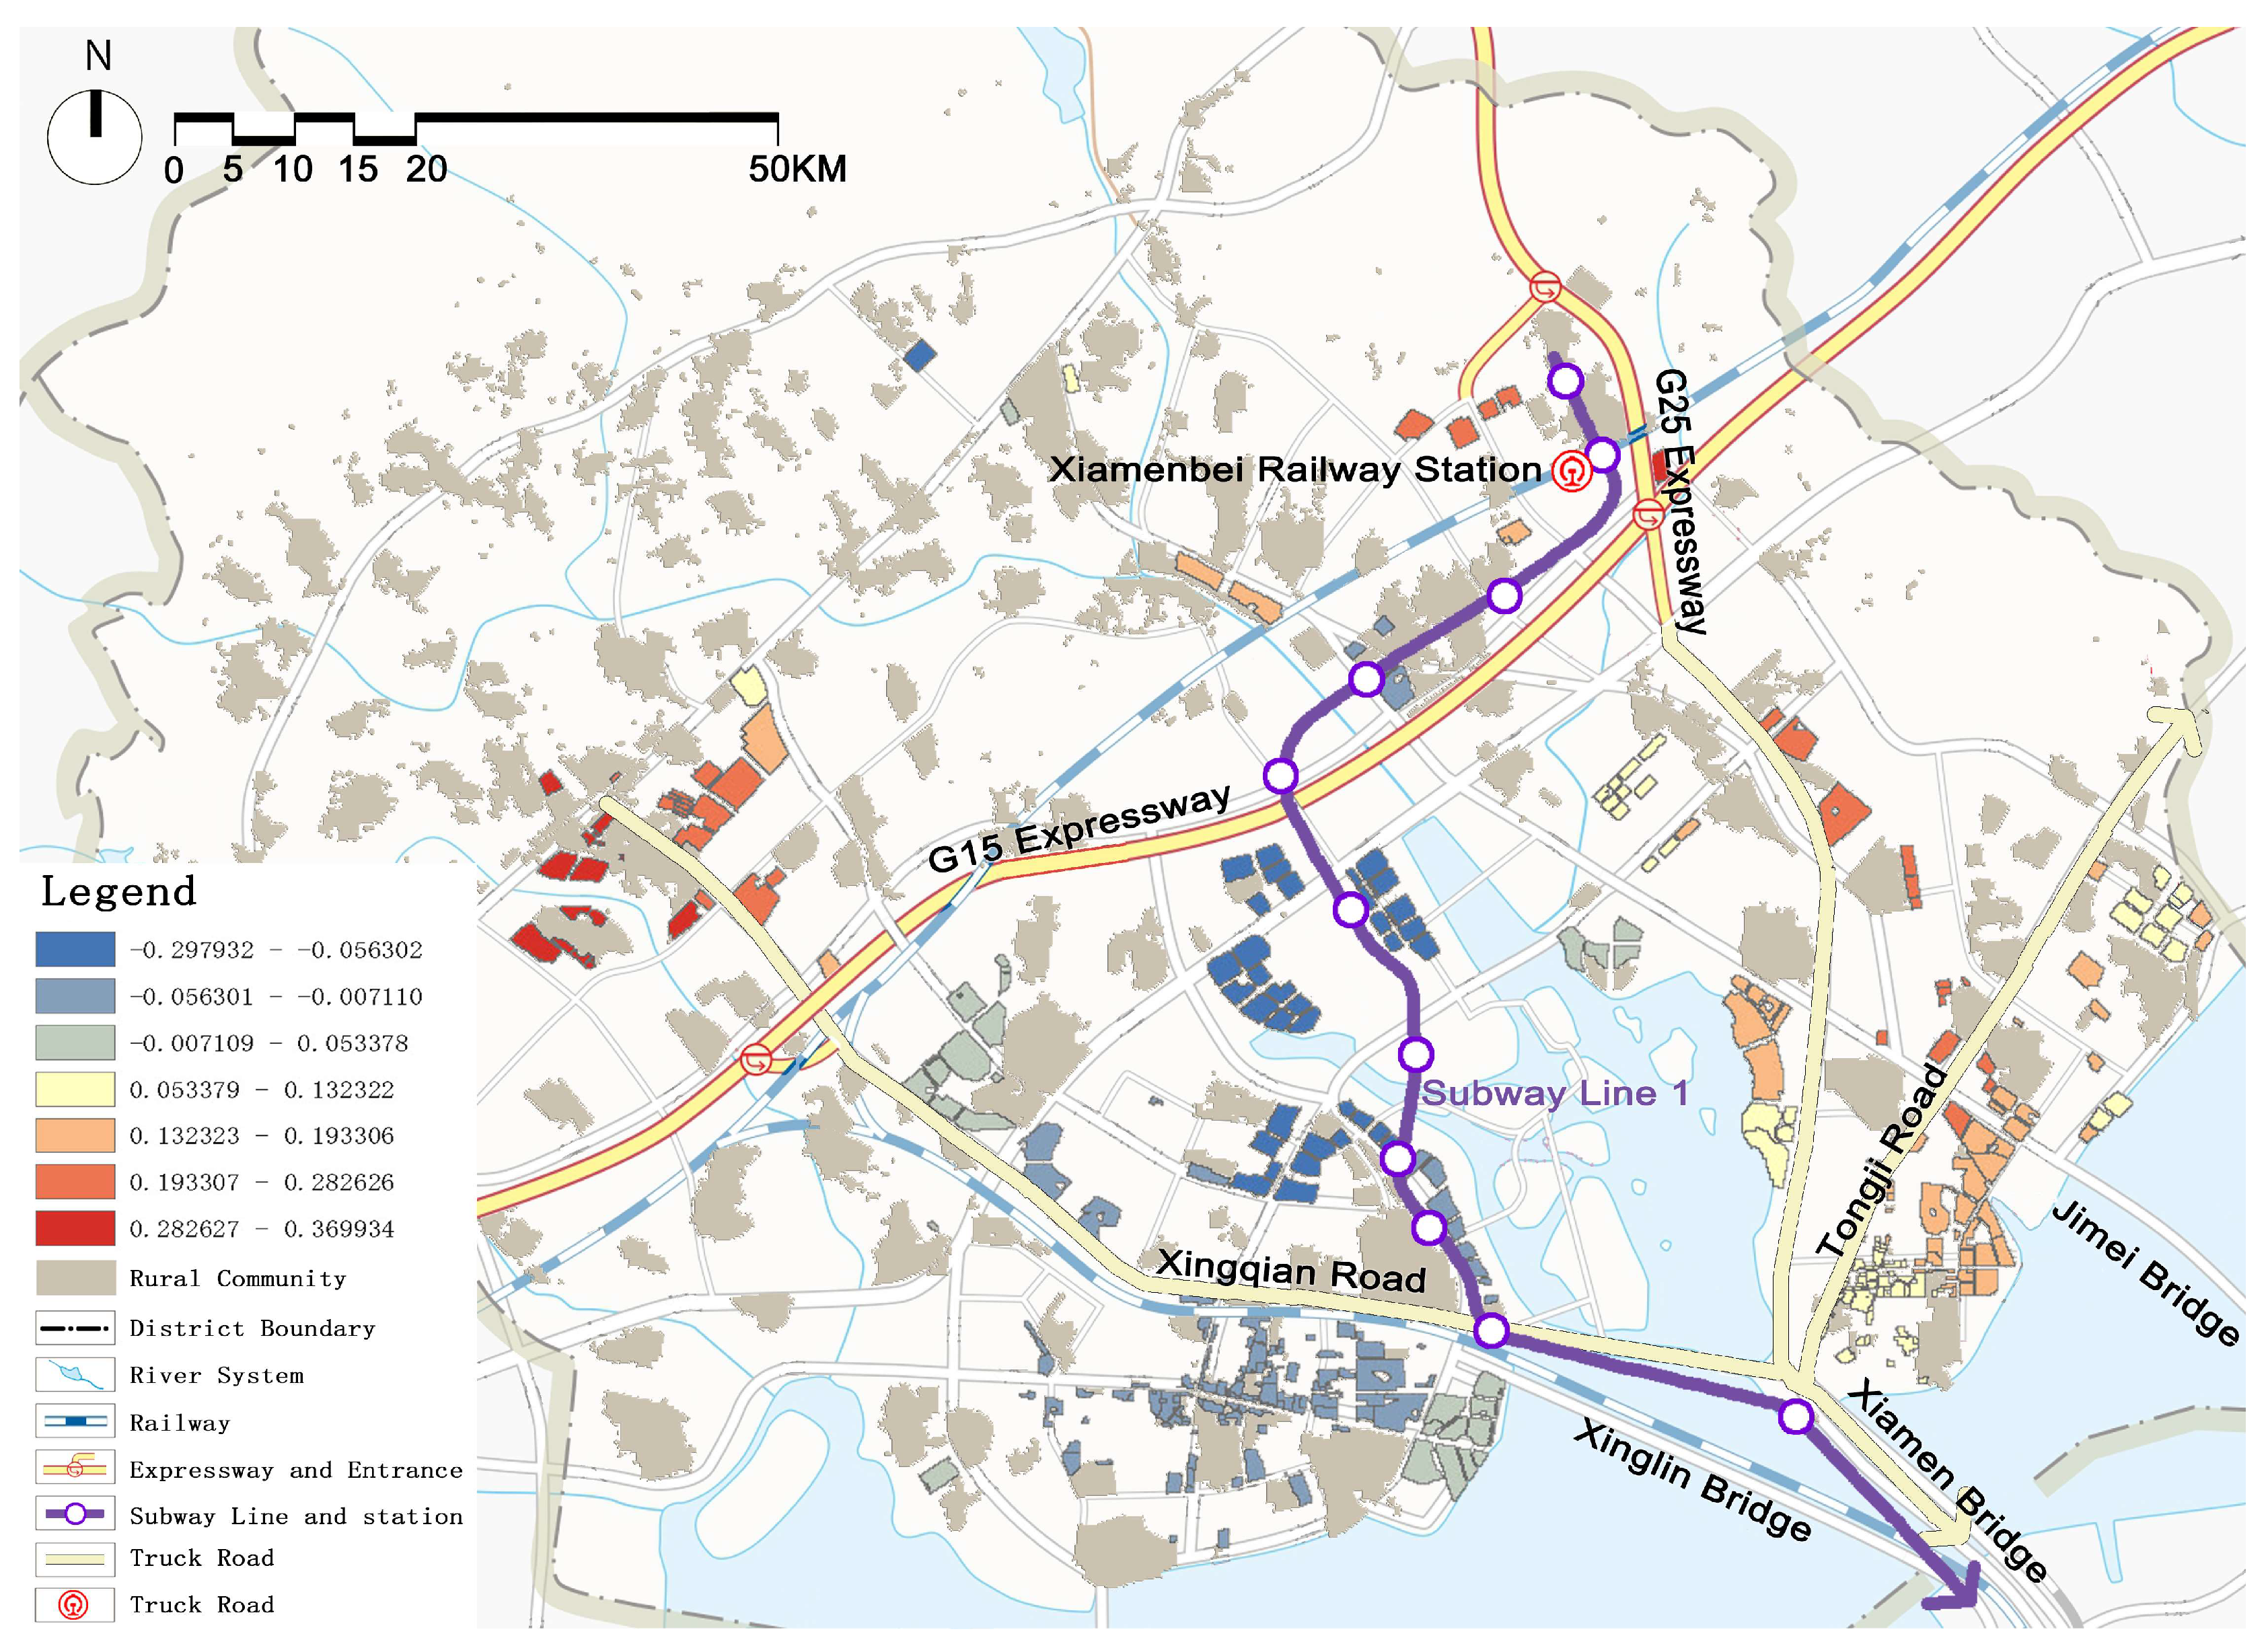
4.3. Overview of the Study Area and Data

This study used the Jimei District of Xiamen as a case study. Xiamen is located in the coastal area of Fujian Province, southeast China. The city has a territory of 1699.39 km2, geographically divided into two areas: Xiamen Island, which is the original and central area of the city, and Outside Island, which is a booming new area. Since 2000, Xiamen has experienced rapid urban and population expansion from the central city to the outer suburbs [47]. From 2000 to 2021, the city’s population increased more than 2.5 times, from 2.05 million to 5.16 million. The studied Jimei District underwent an even more explosive population increase from 0.148 to 1.04 million, or sevenfold.
Jimei District has experienced three different development modes, which provides an example for examining the urban expansion modes’ effect on the housing vacancy rate. In the first stage before 2003, Jimei was at the concentric expansion ring of Xiamen’s old city. Due to the spillover of the industries and population of Xiamen Island (old city), the southern part of Jimei, near the bridge connecting the inside and outside island, formed two suburban population centers. In the second stage between 2003 and 2010, the main reason for the expansion of Jimei was the opening of the Xiamen–Shaxian Expressway and Shenyang–Haikou Expressway, and the corresponding sectoral urban expansion and industrial agglomeration along the expressways. In the third stage from 2010 till present, Jimei was officially designated as a subcenter of Xiamen city, and the government began to build a software park, city park, municipal library, science and technology museum, administrative service center, and commercial centers, aiming to develop multiple centers. In 2010, Xiamen North High-Speed Railway Station began to operate, and in 2017, Metro Line 1 began to operate and connected municipal service facilities, commercial centers, high-tech industrial parks, and commercial residences. After more than 10 years of development, the population of Jimei reached 1.04 million in 2021, a comparable size to the old city. In the development planning of Jimei District, different urban expansion models and different strategies were used to develop industries and attract the population, making it a suitable object for the focus of this study. This paper focuses on Jimei District, rather than the entire city of Xiamen, as its research scope. It mainly examines the impact of the internal job–housing spatial relationship in the new city on occupancy rates. A comparative analysis of the three urban expansion models reveals spatial differences in the influence of job accessibility and the phenomenon of job–housing separation both inside and outside the island. The behavior involving work and living inside and outside the island will not interfere with the judgement of research conclusions.
The unit of analysis of this study is the residential block. There are two reasons why the residential block was used as the geographical unit. Prior studies often used the subdistrict level (the jiedao or town) or even at the city level [29,48]; the residential block is the smallest level; an analysis at such a level is more useful when it comes to conducting policy-relevant research. The second reason is that the residential block is the basic statistical unit of the census; the observation at such a geographical level would be consistent with that based on census tracts in other countries. This study collected spatial vector data on residential blocks and job opportunities, provided by the department of land and resources, public security, industrial and commercial department, and planning department. It includes 367 residential blocks, covering all types of housing; i.e., commercial housing, affordable housing, and 194 urban villages. At the same time, 392,000 household addresses were extracted from the public security’s population information, and data of 477,000 employees in 48,000 large, medium, and small enterprises. After converting the above data into vector information with geographical location, all of them were included in the land use spatial map, and an ArcGIS database including land, household, employment, housing, roads, and public facilities was constructed. The data used were aggregated at the residential block level and do not breach the privacy of individuals and families, and are available upon request from the authors.
Table 1 presents the variables. The occupancy rate is shown in Figure 2. The occupancy rate close to the main urban area on the east and west sides is higher, and the occupancy rate in the central and north is lower. Figure 3 shows that the distribution of job accessibility in Jimei District gradually decreases from east to west.

5. Results

5.1. Results of the Baseline Model

OLS regression was used to examine the interactive relationships between job accessibility and residential location on occupancy rate, as shown in Table 2. Under the condition of controlling other factors, the coefficient of the job accessibility factor was 0.069 and significant, consistent with expectations. No matter what kind of urban expansion mode, the job accessibility will have a certain impact on the occupancy rate. The results of the interaction term of job accessibility and urban expansion mode show that the effect of each residential location feature on job accessibility was not consistent with expectations. The interaction coefficient between job accessibility and the distance to the trunk road was 0.084 and significant, indicating that the closer to the trunk road and the higher the job accessibility, the higher the occupancy rate of the residential area. This means that under the sector expansion mode, the occupancy rate of residential areas is highly dependent on job accessibility, and Hypothesis 2 is verified. The interaction coefficient between the distance from the subway station and the job accessibility was not significant, which means that job accessibility had no significant impact on the occupancy rate of the polycentric residential area. Hypothesis 3 has not been verified. Unexpectedly, the interaction coefficient between the population density and job accessibility was −0.316 and significant, which is opposite to the prediction of Hypothesis 1. This means that the residential area developed by the concentric zone pattern excluded the proximity of employment and housing, and the proximity to employment opportunities was not conducive to the increase in occupancy rate. This result presents the difference between China’s urban structure change and the West’s. The rapid urbanization in the past 40 years in China has involved the simultaneous promotion of new city expansion and old city renewal, and the two trends of suburbanization and gentrification are intertwined. Compared with the outer suburbs, the central urban areas still have advantages in terms of public facilities, urban environment, and public services, and the population centripetal living pattern is still obvious. The demographic appeal of high-end residential areas in the outer suburbs has not yet taken effect.
Without considering the interaction effect, Model 2 is clearer about the differences in population attractiveness of urban expansion patterns. Under the concentric circle expansion mode, the surrounding rural population density has a significant positive impact on the occupancy rate. The distance from the trunk road representing the sector expansion has no obvious effect. However, the distance from the subway station, which represents the multiple nuclei expansion, has a significant negative impact on the occupancy rate. To sum up, it is generally verified that the jobs and housing relation is still an influencing factor for occupancy rates, and the spatial variation of job accessibility and occupancy rates can be grasped from the perspective of urban expansion patterns.

5.2. Instrumental Evidence

The results of the model re-estimation using the two-stage instrumental variable method are shown in Table 3. As Model 3 indicates, the proportion of industrial land and the proportion of residential land have a significant impact on job accessibility, and they meet the conditions of instrumental variables. The Hausman test showed that the chi-square value was −0.793, and the null hypothesis that all explanatory variables were exogenous could not be rejected. This implies a weak endogenous relationship between job accessibility and occupancy. The test of underidentification obtained an LM statistic value of 54.574 and a p-value of 0.000, less than 0.05, strongly refuting the null hypothesis of underidentification. Through the weak instrumental variable test, the statistics of Cragg-Donald Wald F and Kleibergen-Paap rk Wald-F are 40.163 and 42.328, respectively, both of which are greater than the 10% critical value of the Stock-Yogo test, refuting the null hypothesis of weak instrumental variable; that is, there are no weak instrumental variables in the equation. For the Hansen J statistics, we obtained a chi-square statistical value of 0.873, and a p value of 0.350, which was greater than 0.05, indicating that the null hypothesis of overidentification was accepted. The above test shows that the estimated results in Table 2 exclude the influence of endogeneity; the coefficient estimates of job accessibility and its related interaction items are basically consistent with the results of the baseline model, and the results of the hypothesis test are consistent with the baseline model.

5.3. Robustness Test

In the measurement of job accessibility, the distance decay, the spatial barrier between origin (residence location) and destination (workplace), is inversely related to its distance [49]. In other words, individuals located far from the job will have lesser availability than others. However, there is no definite principle for the setting of the job search radius and distance decay function [50,51,52]. The robustness test in this paper was to set cross-combinations of different search distances and distance decay functions, and then examine the corresponding changes in job accessibility coefficient and significance. The search radius was set at four levels: 5 km, 7 km, 9 km (Model 1 and 2 in Table 2), and 11 km, and four different decay functions were employed: Gaussian function, kernel density function, gravity function, and no distance decay.
The results are shown in Table 4. The robustness test of the search radius shows that it is a reasonable interval for the job search distance. Taking the Gaussian decay function as an example, Models 5–7 show how the coefficient of job accessibility varies with search distance. When the search radius is 5 km, the coefficient of job accessibility is not significant. As the search radius increases, the significance of job accessibility is the highest at 9 km (see Model 2), and then decreases at 11 km. In the models, the radius below 5 km means that only job opportunities within walking distance are accepted, while the radius above 11 km exceeds the boundary of the entire area (the built-up area of Jimei District is 126.9 km2, and the east–west and north–south straight-line distances are about 11 km). Within a reasonable search distance between 7 and 9 km, the job accessibility coefficients are all positively significant, thus verifying the robustness of the results from the perspective of the search radius.
The results in Models 8–10 show that the choice of the distance decay function is reasonable and the results of different functions are stable. The test results of Model 8 with no decay show that the coefficient of influence of job accessibility on occupancy rate is not significant, which is not surprising. Because if there were no difference in preference for working distance, employment and living space naturally would have no effect on housing location choice. It confirms that residents’ preference for nearby employment is the realistic basis for the close layout of jobs and residences. The results of Model 9 and Model 10 on the kernel density and gravity decay functions respectively show that the convexity and concavity of the decay function shape are sensitive to the job accessibility coefficient. Under the kernel density function, the job accessibility coefficient is positive and significant, while under the gravity function setting, the job accessibility coefficient is negative and significant. However, in the two function forms of convex and concave, the concave function does not match the practical meaning of job search behavior. The concave function means that the individual’s preference for short-distance job opportunities decays at an accelerated rate, while the preference for long-distance jobs decays more and more slowly. Therefore, the result of the concave function is more reliable. The output results of the Gaussian function of Model 1 and the kernel density of Model 9 are quite close, being 0.069 and 0.071, respectively. The robustness of the results is also verified from the perspective of the decay function.

5.4. Heterogeneity Analysis

The baseline model above validates the spatial heterogeneity of job accessibility under different residential locations. Figure 4 further shows the levels of job accessibility coefficient measured by geographically weighted regression (GWR). The colors red, orange, light blue, and dark blue in the figure represent the changes in the job accessibility coefficient from large to small. Figure 4 vividly reflects the spatial differences in the influence of job accessibility on the occupancy rate of residential areas in the concentric zone, sector, and polycentric expansion models.
The areas with the highest influence on job accessibility (red and orange areas) are along the two expressways, the north–south direction is the G25 (Xiamen–Shaxian) Expressway, the east–west direction is the G15 (Shenyang–Haikou) Expressway, and the intersection is Xiamen North Railway Station. There are many industrial parks along these two expressways. The high influence of job accessibility in these two belts confirms that the population agglomeration in the sector expansion model is highly dependent on job accessibility. Proximity to employment opportunities is a spatial condition for the occupancy of residential areas in this area.
The area with job accessibility in light blue is Xinglin Street (formerly Xinglin Town), which was the earliest suburb to realize road connection with the old city (Xinglin Bridge and Xiamen Bridge on the island). This area was the first to undertake the residential needs of the overflowing population growth in the old city, and a considerable number of residents are employed in the old city on the island. Job accessibility has an influence on the occupancy rate of the area, which confirms that under the concentric zone expansion mode, the occupancy rate of residential areas is not highly dependent on employment accessibility.
The area with job accessibility in dark blue is along the Metro Line 1, and it is an area developed by the multiple nuclei model. Job accessibility has the least influence on the occupancy rate of polycentric residential areas, indicating that the convenient population transfer reduces the commuting time to the new and old cities, and also significantly weakens the demand of new town residents for nearby employment. This finding is in conflict with the idea of the polycentric model. From the results, it can be seen that more employment cannot improve the occupancy rate of polycentric residential areas. It may be that there is a problem with the current strategy for the development of polycentric new cities. The proximity of the residential area to the station is not welcomed by residents. It does not mean that the polycentric new city does not need employment, but that there is a problem with the spatial relationship between residence and employment. The “sleeping city” lifestyle of living in a new city with long-distance commuting every day is not popular, and residents may prefer that job opportunities gather around subway stations. It is more suitable for low-frequency travel needs such as connecting industrial divisions, administration, and entertainment between sites.
In sum, the spatial differences in the influence of job accessibility on occupancy rate are relatively obvious, which is basically consistent with the spatiotemporal characteristics of urban expansion in Jimei District, further verifying the differences in population aggregation logic in different residential locations.

6. Discussion and Conclusions

This paper explores the theoretical mechanisms of job accessibility under different urban expansion models to promote population concentration in new towns. The research found that: (1) Job accessibility, which represents the spatial relationship between residence and employment, has a stable and positive impact on the occupancy rate of commercial housing in new towns. The proximity of job and residence is the basic requirement of Chinese families’ residential location choice, and the separation of job and residence is only a compromise of the constraints of residential choice. (2) Residential areas with different urban characteristics have varying degrees of success in attracting the population. The occupancy rate of residential areas that meet the characteristics of the concentric zone is the highest, followed by that of residential areas that meet the characteristics of the sector model site, and the residential area with polycentric site has the lowest occupancy rate. (3) The influence of job accessibility on the occupancy rate has significant differences in residential areas. The occupancy rate of residential areas in the sector model is highly dependent on job accessibility, and the higher the job accessibility of residential areas with concentric circles, the lower the occupancy rate. Job accessibility has no significant impact on the occupancy rate of the polycentric residential area.
The theoretical exploration of population agglomeration through the spatial integration of industry and city has great application value for improving the efficiency of land resource use, rationalizing the population distribution pattern, and maintaining the attractiveness of urban population. The implications and limitations of this study are further elaborated in following sections.
The research results enrich the understanding of the spatial integration of industry and city, and provide enlightenment for the integrated development of industry, city, and people. First, the planning of new towns must clarify population aggregation as the top priority. The functional positioning of new towns cannot be just as marketing symbols, such as cultural new city, ecological new city, financial new city, and subway new city. Preliminary research and forecasts should be carried out on the attractiveness of new towns, what kind of groups they can attract, and the expected size of the population gathering. Under the condition of having a relatively clear understanding of the industry level and scale of the new towns and the corresponding employment and lifestyle of the living groups, the development plan of the new towns should be carefully formulated and adjusted in a timely manner according to the population concentration. Second, the location selection of residential areas should be guided by the ecological laws of the transfer of residential functional areas. The concentric expansion of the suburbs is the easiest way to achieve population aggregation, and there is a trap of population aggregation in the leap-frog development of “sleeping cities” in the outer suburbs. Without the development of the industry first, the TOD development model overuses the convenience of the subway to increase the commuting distance between workers and residences [53]. It is only a long-distance version of the concentric zone expansion model. The use of the multiple nuclei model should still be based on the job–housing balance in new towns, and use the subway to connect urban functions such as urban employment, administration, entertainment, and public services to form a functional network, and the residential area should not be directly close to the transit station, but close to the employment and living functional area on the periphery. Third, make reasonable use of the principle of job–housing balance according to the spatial pattern of job and housing. Residential areas also have a cluster effect. The job–housing balance does not require a blindly scattered industrial layout, which hinders the industrial cluster effect. From the perspective of ensuring the residential occupancy rate, the residential area and employment space of the concentric expansion new districts should not intersect; the polycentric new districts need the employment space to be concentrated in a small area.
Scholars have pointed out that planning should avoid blindly implementing mixed land use at the macro level [54], and this is not conducive to industry agglomeration and orderly traffic travel [55]. Other studies show that from the perspective of the micro level of individuals, the streets with relatively high mixed land use are conducive to reducing the probability of job–housing separation [29]. From the macro level of urban development, the agglomeration of population and industries at their respective agglomeration clusters are the inevitable trends and requirements of urban development, but have also caused an imbalance and mismatch for population and employment. This is particularly true in metropolises like Beijing, where the employment is gathered in the central region, and the population continues to move into and scatter in the suburbs [48]. How to reasonably arrange the use of mixed land use at small scale under the spatial structure of industrial and population agglomeration at the macro level requires in-depth research. Reasonable urban land use is not only conducive to the performance of the economy, but also for residents to find employment nearby and reduce cross-regional commuting.
There is still much room for improvement in this study. First, the research scope was limited to the Jimei District rather than the whole Xiamen city. In the future, if the job search scope is expanded to the whole Xiamen city, and the impact of the job accessibility between the new and old cities and between the new urban areas on the population structure of the city is further explored, it will have a positive impact on the overall urban development and provide more valuable insights. Second, the assumption of homogeneity of job opportunities did not involve the structural matching between different industries, occupations, and levels of positions. In the future, under the condition of data availability, if we can master the laws of the job–housing relationship at different industrial levels, we can provide more specific suggestions on the characteristics of price, area, apartment type, and floor area ratio of the residential blocks. Third, living preferences are worthy of long-term monitoring. The underlying logic of the layout of job–housing relationship affecting population aggregation is the family’s preference for job–housing proximity. In the internet age, working lifestyles such as home office, cross-regional division of labor and collaboration, multi-site business operations, and frequent business trips may affect job–housing preference.

Author Contributions

Conceptualization, F.R.; data curation, F.R.; formal analysis, F.R. and J.Z.; methodology, F.R. and J.Z.; project administration, X.Y.; software, F.R. and J.Z.; supervision, X.Y.; visualization, F.R.; writing—original draft, F.R. and X.Y.; writing—review and editing, F.R. and X.Y. All authors have read and agreed to the published version of the manuscript.

Funding

This research was funded by National Social Science Foundation of China, grant number 21BGL205, and Major Project of Fujian Social Science Research Base, grant number FJ2020MJDZ002.

Institutional Review Board Statement

Not applicable.

Informed Consent Statement

Not applicable.

Data Availability Statement

Data are unavailable due to privacy or ethical restrictions.

Acknowledgments

The authors are also grateful for the research assistance provided by Jinjiao Zhang.

Conflicts of Interest

The authors declare no conflict of interest.

References

  1. Williams, S.; Xu, W.; Tan, S.B.; Foster, M.J.; Chen, C. Ghost cities of China: Identifying urban vacancy through social media data. Cities 2019, 94, 275–285. [Google Scholar] [CrossRef]
  2. Pan, J.; Dong, L. Spatial Identification of Housing Vacancy in China. Chin. Geogr. Sci. 2021, 31, 359–375. [Google Scholar] [CrossRef]
  3. Jin, X.; Long, Y.; Sun, W.; Lu, Y.; Yang, X.; Tang, J. Evaluating cities’ vitality and identifying ghost cities in China with emerging geographical data. Cities 2017, 63, 98–109. [Google Scholar] [CrossRef]
  4. Xue, C.Q.L.; Wang, Y.; Tsai, L. Building new towns in China—A case study of Zhengdong New District. Cities 2013, 30, 223–232. [Google Scholar] [CrossRef]
  5. Shi, L.; Wurm, M.; Huang, X.; Zhong, T.; Leichtle, T.; Taubenböck, H. Urbanization that hides in the dark—Spotting China’s “ghost neighborhoods” from space. Landsc. Urban Plan. 2020, 200, 103822. [Google Scholar] [CrossRef]
  6. Jiang, Y.; Mohabir, N.; Ma, R.; Zhu, P. Sorting through Neoliberal Variations of Ghost Cities in China. Land Use Policy 2017, 69, 445–453. [Google Scholar] [CrossRef]
  7. Smith, T.E.; Zenou, Y. Spatial mismatch, search effort, and urban spatial structure. J. Urban Econ. 2003, 54, 129–156. [Google Scholar] [CrossRef]
  8. Liu, Z.; Wang, M. Job accessibility and its impacts on commuting time of urban residents in Beijing: From a spatial mismatch perspective. Acta Geogr. Sin. 2011, 66, 457–467. [Google Scholar]
  9. Dong, R.; Yan, F. Revealing characteristics of the spatial structure of megacities at multiple scales with jobs-housing big data: A case study of Tianjin, China. Land 2021, 10, 1144. [Google Scholar] [CrossRef]
  10. Zheng, S.Q.; Fu, Y.M.; Liu, H.Y. Housing-choice hindrances and urban spatial structure: Evidence from matched location and location-preference data in Chinese cities. J. Urban Econ. 2006, 60, 535–557. [Google Scholar] [CrossRef]
  11. Zhang, D. New concepts of “city-industry integration”. Decis. Mak. 2011. [Google Scholar] [CrossRef]
  12. Yue, J.; Gu, J. Research on the conceptual framework of city and idustry integration based upon identification and evaluation of spatial organization logic. Urban Insight 2015, 168–177. [Google Scholar] [CrossRef]
  13. Gan, L.; Shi, H.; Hu, Y.; Lev, B.; Lan, H. Coupling coordination degree for urbanization city-industry integration level: Sichuan case. Sustain. Cities Soc. 2020, 58, 102136. [Google Scholar] [CrossRef]
  14. He, C.; Li, D.; Yu, J. Quantifying the Spatial-Temporal Variation of Population Urbanization and Affordable Housing Land in China. Land 2022, 11, 259. [Google Scholar] [CrossRef]
  15. Zheng, S.; Xu, Y.; Gu, Y. Rethinking “Job-housing balance”: Providing mode choices rather than imposing constraints. Acad. Mon. 2014, 46, 29–39. [Google Scholar]
  16. Östh, J. Introducing a Method for the Computation of Doubly Constrained Accessibility Models in Larger Datasets. Netw. Spat. Econ. 2011, 11, 581–620. [Google Scholar] [CrossRef]
  17. Burgess, E.W. The growth of the city: An introduction to a research project. In The City; Park, R.E., Burgess, E.W., McKenzie, R., Eds.; University of Chicago Press: Chicago, IL, USA, 1968; pp. 47–62. ISBN 1315748509. [Google Scholar]
  18. Hoyt, H. The Structure and Growth of Residential Neighborhoods in American Cities; US Government Printing Office: Washington, DC, USA, 1939.
  19. Harris, C.D.; Ullman, E.L. The nature of cities. Ann. Am. Acad. Pol. Soc. Sci. 1945, 242, 7–17. [Google Scholar] [CrossRef]
  20. Yue, X.; Wang, Y.; Zhao, Y.; Zhang, H. Estimation of Urban Housing Vacancy Based on Daytime Housing Exterior Images—A Case Study of Guangzhou in China. ISPRS Int. J. Geo-Inf. 2022, 11, 349. [Google Scholar] [CrossRef]
  21. Shi, L.; Wurm, M.; Huang, X.; Zhong, T.; Leichtle, T.; Taubenböck, H. Estimating housing vacancy rates at block level: The example of Guiyang, China. Landsc. Urban Plan. 2022, 224, 104431. [Google Scholar] [CrossRef]
  22. Gibbs, J.P. The evolution of population concentration. Econ. Eography 1963, 39, 119–129. [Google Scholar] [CrossRef]
  23. Goldstein, S.; Mayer, K. Migration and the Journey to Work. Soc. Forces 1964, 42, 472–481. [Google Scholar] [CrossRef]
  24. Smith, N. Toward a theory of gentrification a back to the city movement by capital, not people. J. Am. Plan. Assoc. 1979, 45, 538–548. [Google Scholar] [CrossRef]
  25. Wang, K.; Immergluck, D. Housing vacancy and urban growth: Explaining changes in long-term vacancy after the US foreclosure crisis. J. Hous. Built Environ. 2019, 34, 511–532. [Google Scholar] [CrossRef]
  26. Hao, J.; Ma, H. Spatial Heterogeneity of Public Service Facilities in the Living Circle and Its Influence on Housing Prices: A Case Study of Central Urban Dalian, China. Land 2022, 11, 1095. [Google Scholar] [CrossRef]
  27. Zhang, L.; Zhang, X.; Huang, H.; Zhang, L.; Li, H. Spatial Accessibility of Multiple Facilities for Affordable Housing Neighborhoods in Harbin, China. Land 2022, 11, 1940. [Google Scholar] [CrossRef]
  28. Peng, Z.R. The jobs-housing balance and urban commuting. Urban Stud. 1997, 34, 1215–1235. [Google Scholar] [CrossRef]
  29. Zhou, X.; Yeh, A.G.O.; Yue, Y.; Li, W. Residential-employment mixed use and jobs-housing balance: A case study of Shenzhen, China. Land Use Policy 2022, 119, 106201. [Google Scholar] [CrossRef]
  30. Wachs, M.; Taylor, B.D.; Levine, N.; Ong, P. The Changing Commute: A Case-study of the Jobs-Housing Relationship over Time. Urban Stud. 1993, 30, 1711–1729. [Google Scholar] [CrossRef]
  31. Engelfriet, L.; Koomen, E. The impact of urban form on commuting in large Chinese cities. Transportation 2018, 45, 1269–1295. [Google Scholar] [CrossRef]
  32. Ibeas, Á.; Cordera, R.; Dell’Olio, L.; Coppola, P. Modelling the spatial interactions between workplace and residential location. Transp. Res. Part A Policy Pract. 2013, 49, 110–122. [Google Scholar] [CrossRef]
  33. Giuliano, G. Is Jobs-Housing Balance a Transportation Issue? Transp. Res. Rec. 1991, 1305, 305–312. [Google Scholar]
  34. van Ommeren, J.; Rietveld, P.; Nijkamp, P. Residence and Workplace Relocation: A Bivariate duration model approach. Geogr. Anal. 1996, 28, 315–329. [Google Scholar] [CrossRef]
  35. Korsu, E.; Wenglenski, S. Job Accessibility, Residential Segregation and Risk of Long-Term Unemployment in the Paris Region. Urban Stud. 2010, 47, 2279–2324. [Google Scholar] [CrossRef]
  36. Schwirian, K. Ecological models of urban form: Concentric zone model, the sector model, and the multiple nuclei model. In The Blackwell Encyclopedia of Sociology; Wiley Online Library: Hoboken, NJ, USA, 2007. [Google Scholar]
  37. Tian, G.; Wu, J.; Yang, Z. Spatial pattern of urban functions in the Beijing metropolitan region. Habitat Int. 2010, 34, 249–255. [Google Scholar] [CrossRef]
  38. Yang, Z.; Chen, Y.; Zheng, Z.; Wu, Z. Identifying China’s polycentric cities and evaluating the urban centre development level using Luojia-1A night-time light data. Ann. GIS 2022, 28, 185–195. [Google Scholar] [CrossRef]
  39. Kuang, W. Spatio-temporal patterns of intra-urban land use change in Beijing, China between 1984 and 2008. Chin. Geogr. Sci. 2012, 22, 210–220. [Google Scholar] [CrossRef]
  40. Zheng, H.; Wu, C.; Zheng, S.; Zhuo, Y.; Zhang, Q. The Spatial Consistency between Compact City and Mixed Land Use Development: A Case Study of Shanghai. China Land Sci. 2016, 30, 35–42. [Google Scholar]
  41. Wu, W.; Gao, X. Population density functions of Chinese cities: A review. Prog. Geogr. 2010, 29, 968–974. [Google Scholar]
  42. Li, S.; Li, X.; Liu, X.; Chen, Y. A model of axial urban spatio-temporal dynamics—A case study in Gongguan, in Guangdong Province. Urban Stud. 2009, 16, 73–80. [Google Scholar]
  43. Zhou, C.; Ye, C. Features and causes of urban spatial growth in Chinese metropolises. Acta Geogr. Sin. 2013, 68, 728–738. [Google Scholar]
  44. Fei, W.; Zhao, S. Urban land expansion in China’s six megacities from 1978 to 2015. Sci. Total Environ. 2019, 664, 60–71. [Google Scholar] [CrossRef] [PubMed]
  45. Xu, W.; Fan, Y.; Guthrie, A.; Li, Y. Transit-oriented development in China: Literature review and evaluation of TOD potential across 50 chinese cities. J. Transp. Land Use 2017, 10, 743–762. [Google Scholar] [CrossRef]
  46. Cervero, R.; Day, J. Suburbanization and transit-oriented development in China. Transp. Policy 2008, 15, 315–323. [Google Scholar] [CrossRef]
  47. Tang, L.; Zhao, Y.; Yin, K.; Zhao, J. Xiamen. Cities 2013, 31, 615–624. [Google Scholar] [CrossRef]
  48. Zhao, P.; Lü, B.; de Roo, G. Impact of the jobs-housing balance on urban commuting in Beijing in the transformation era. J. Transp. Geogr. 2011, 19, 59–69. [Google Scholar] [CrossRef]
  49. Hansen, W.G. How accessibility shapes land use. J. Am. Inst. Plann. 1959, 25, 73–76. [Google Scholar] [CrossRef]
  50. Cheng, J.; Bertolini, L. Measuring urban job accessibility with distance decay, competition and diversity. J. Transp. Geogr. 2013, 30, 100–109. [Google Scholar] [CrossRef]
  51. Halás, M.; Klapka, P.; Kladivo, P. Distance-decay functions for daily travel-to-work flows. J. Transp. Geogr. 2014, 35, 107–119. [Google Scholar] [CrossRef]
  52. Ding, N.; Bagchi-Sen, S. An Analysis of Commuting Distance and Job Accessibility for Residents in a U.S. Legacy City. Ann. Am. Assoc. Geogr. 2019, 109, 1560–1582. [Google Scholar] [CrossRef]
  53. Wang, X.; Shao, C.; Yin, C.; Dong, C. Exploring the effects of the built environment on commuting mode choice in neighborhoods near public transit stations: Evidence from China. Transp. Plan. Technol. 2021, 44, 111–127. [Google Scholar] [CrossRef]
  54. Zhuo, Y.; Jing, X.; Wang, X.; Li, G.; Xu, Z.; Chen, Y.; Wang, X. The Rise and Fall of Land Use Mix: Review and Prospects. Land 2022, 11, 2198. [Google Scholar] [CrossRef]
  55. Almansoub, Y.; Zhong, M.; Raza, A.; Safdar, M.; Dahou, A.; Al-qaness, M.A.A. Exploring the Effects of Transportation Supply on Mixed Land-Use at the Parcel Level. Land 2022, 11, 797. [Google Scholar] [CrossRef]
Figure 1. Conceptual framework.
Land 12 00912 g001
Figure 2. Spatial distribution of occupancy rate.
Land 12 00912 g002
Figure 3. Spatial distribution of job accessibility.
Land 12 00912 g003
Figure 4. Spatial pattern of job accessibility coefficient.
Land 12 00912 g004
Table 1. Definition and description of main variables.
VariablesDescriptionsMinMaxMeanStd
YOccupancy rate: the number of households divided by the number of housing units0.0001.0000.7430.281
AJob accessibility via ELMO−2.0292.1530.0001.000
M1/distance to nearest metro station−1.2007.7570.0001.000
R1/distance from residential block to trunk road−0.25715.4560.0001.000
DPopulation density within 3 km−2.6482.1770.0001.000
Plog(housing price)9.12311.36610.2350.334
DX1/distance to Xiamen North Railway Station0.0971.7510.1640.137
YXYear of house delivery before 20000.0001.0000.4530.451
Year of house delivery 2001–20100.0001.0000.1650.372
Year of house delivery 2011–20120.0001.0000.1110.315
Year of house delivery 2013–20140.0001.0000.1110.315
Year of house delivery After 20150.0001.0000.1600.367
EduMean of education years in residential block2.53624.2859.4621.342
LaborProportion of labor force in residential block0.2500.9830.6450.084
IRIndustrial land ratio0.0000.6560.1510.205
RRResidential land ratio0.0630.8180.2870.134
Table 2. OLS regression of occupancy rate.
VariablesModel 1Model 2
CoefficientStandard ErrorsCoefficientStandard Errors
A0.069 ***0.0240.0210.017
M−0.048 ***0.015−0.035 **0.015
M × A0.0080.048
R−0.0220.015−0.0090.014
R × A0.084 *0.054
D0.0040.0160.024 *0.015
D × A−0.099 ***0.018
P−0.146 ***0.051−0.132 **0.052
DX−273.008 **110.565−186.025 *113.971
YX
2001–2010−0.0070.039−0.0420.040
2011–20120.0000.054−0.0580.055
2013–20140.073 *0.0530.096 *0.055
After 2015−0.132 **0.045−0.185 ***0.046
Edu0.0040.0110.0150.011
Labor0.420 **0.1790.1200.175
Constant1.992 ***0.5481.940 ***0.558
R20.2030.128
N367
Note: * p < 0.1; ** p < 0.05; *** p < 0.001. The search radius of the job accessibility is 9 km, and the job preference is decayed with Gaussian function.
Table 3. Results of two-stage instrumental evidence for the effect of job accessibility.
VariablesModel 3Model 4
CoefficientStandard ErrorsCoefficientStandard Errors
IR (industrial land ratio)−1.549 ***0.220
RR (residential land ratio)−2.235 ***0.262
A 0.168 ***0.058
M−0.159 ***0.031−0.043 ***0.0161
M × A−1.173 ***0.0750.151 *0.085
R0.0460.030−0.026 *0.015
R × A−0.493 ***0.1070.130 **0.058
D0.0110.0360.0110.016
D × A0.332 ***0.035−0.138 ***0.025
P0.1430.107−0.214 ***0.063
DX0.413 *0.220−0.357 ***0.119
YX
2001–2010−0.311 ***0.0780.136**0.065
2011–2012−0.334 ***0.1080.0570.070
2013–20140.0220.1060.1030.071
After 2015−0.267 **0.089−0.0770.062
Edu0.069 ***0.021−0.0020.011
Labor−1.235 ***0.3560.493 ***0.188
Constant−0.3891.1702.693 ***0.679
Chi-sq(3)−0.793
Kleibergen-Paap rk LM54.574
Chi-sq(2) p-value0.0000
Cragg-Donald Wald F40.163
Kleibergen-Paap rk Wald F42.328
Stock-Yogo 10% maximal IV size19.93
Hansen J0.873
Chi-sq(1) p-value0.350
Note: * p < 0.1; ** p < 0.05; *** p < 0.001.
Table 4. Robustness test on the impact of job accessibility on occupancy rate.
Decay Function (Search Radius)Model 5Model 6Model 7Model 8Model 9Model 10
Variables Gaussian (5 km)Gaussian (7 km)Gaussian (11 km)No Decay
(9 km)
Kernel Density (9 km)Gravity
(9 km)
A0.0060.030 *0.046 *−0.0320.071 ***−0.057 ***
M−0.036 **−0.044 ***−0.049 ***−0.043 ***−0.047 ***−0.004
M × A−0.055 ***−0.047−0.0400.050 *0.033−0.046 ***
R−0.021−0.020−0.020−0.014−0.023−0.008
R × A0.101 **0.088 *0.090 **−0.303 **0.0830.007
D0.0120.010−0.0040.0230.0050.021
D × A−0.065 ***−0.083 ***−00.96 ***0.020−0.098 ***0.017
constant1.510 ***1.626 ***2.152 ***1.644 ***2.055 ***1.623 **
R20.1910.1910.1960.1520.2030.197
Note: * p < 0.1; ** p < 0.05; *** p < 0.001. The regression results of the control variables are omitted for space.
Disclaimer/Publisher’s Note: The statements, opinions and data contained in all publications are solely those of the individual author(s) and contributor(s) and not of MDPI and/or the editor(s). MDPI and/or the editor(s) disclaim responsibility for any injury to people or property resulting from any ideas, methods, instructions or products referred to in the content.

