
Needs Hierarchy for Public Service Facilities and Guidance-Control Programming in Small Chinese Towns Influenced by Complex Urbanization of Residents: The Evidence from Zhejiang

Abstract
:1. Introduction
2. Methods
2.1. Cognitive Paths of Resident Types in Diverse Urbanization Patterns
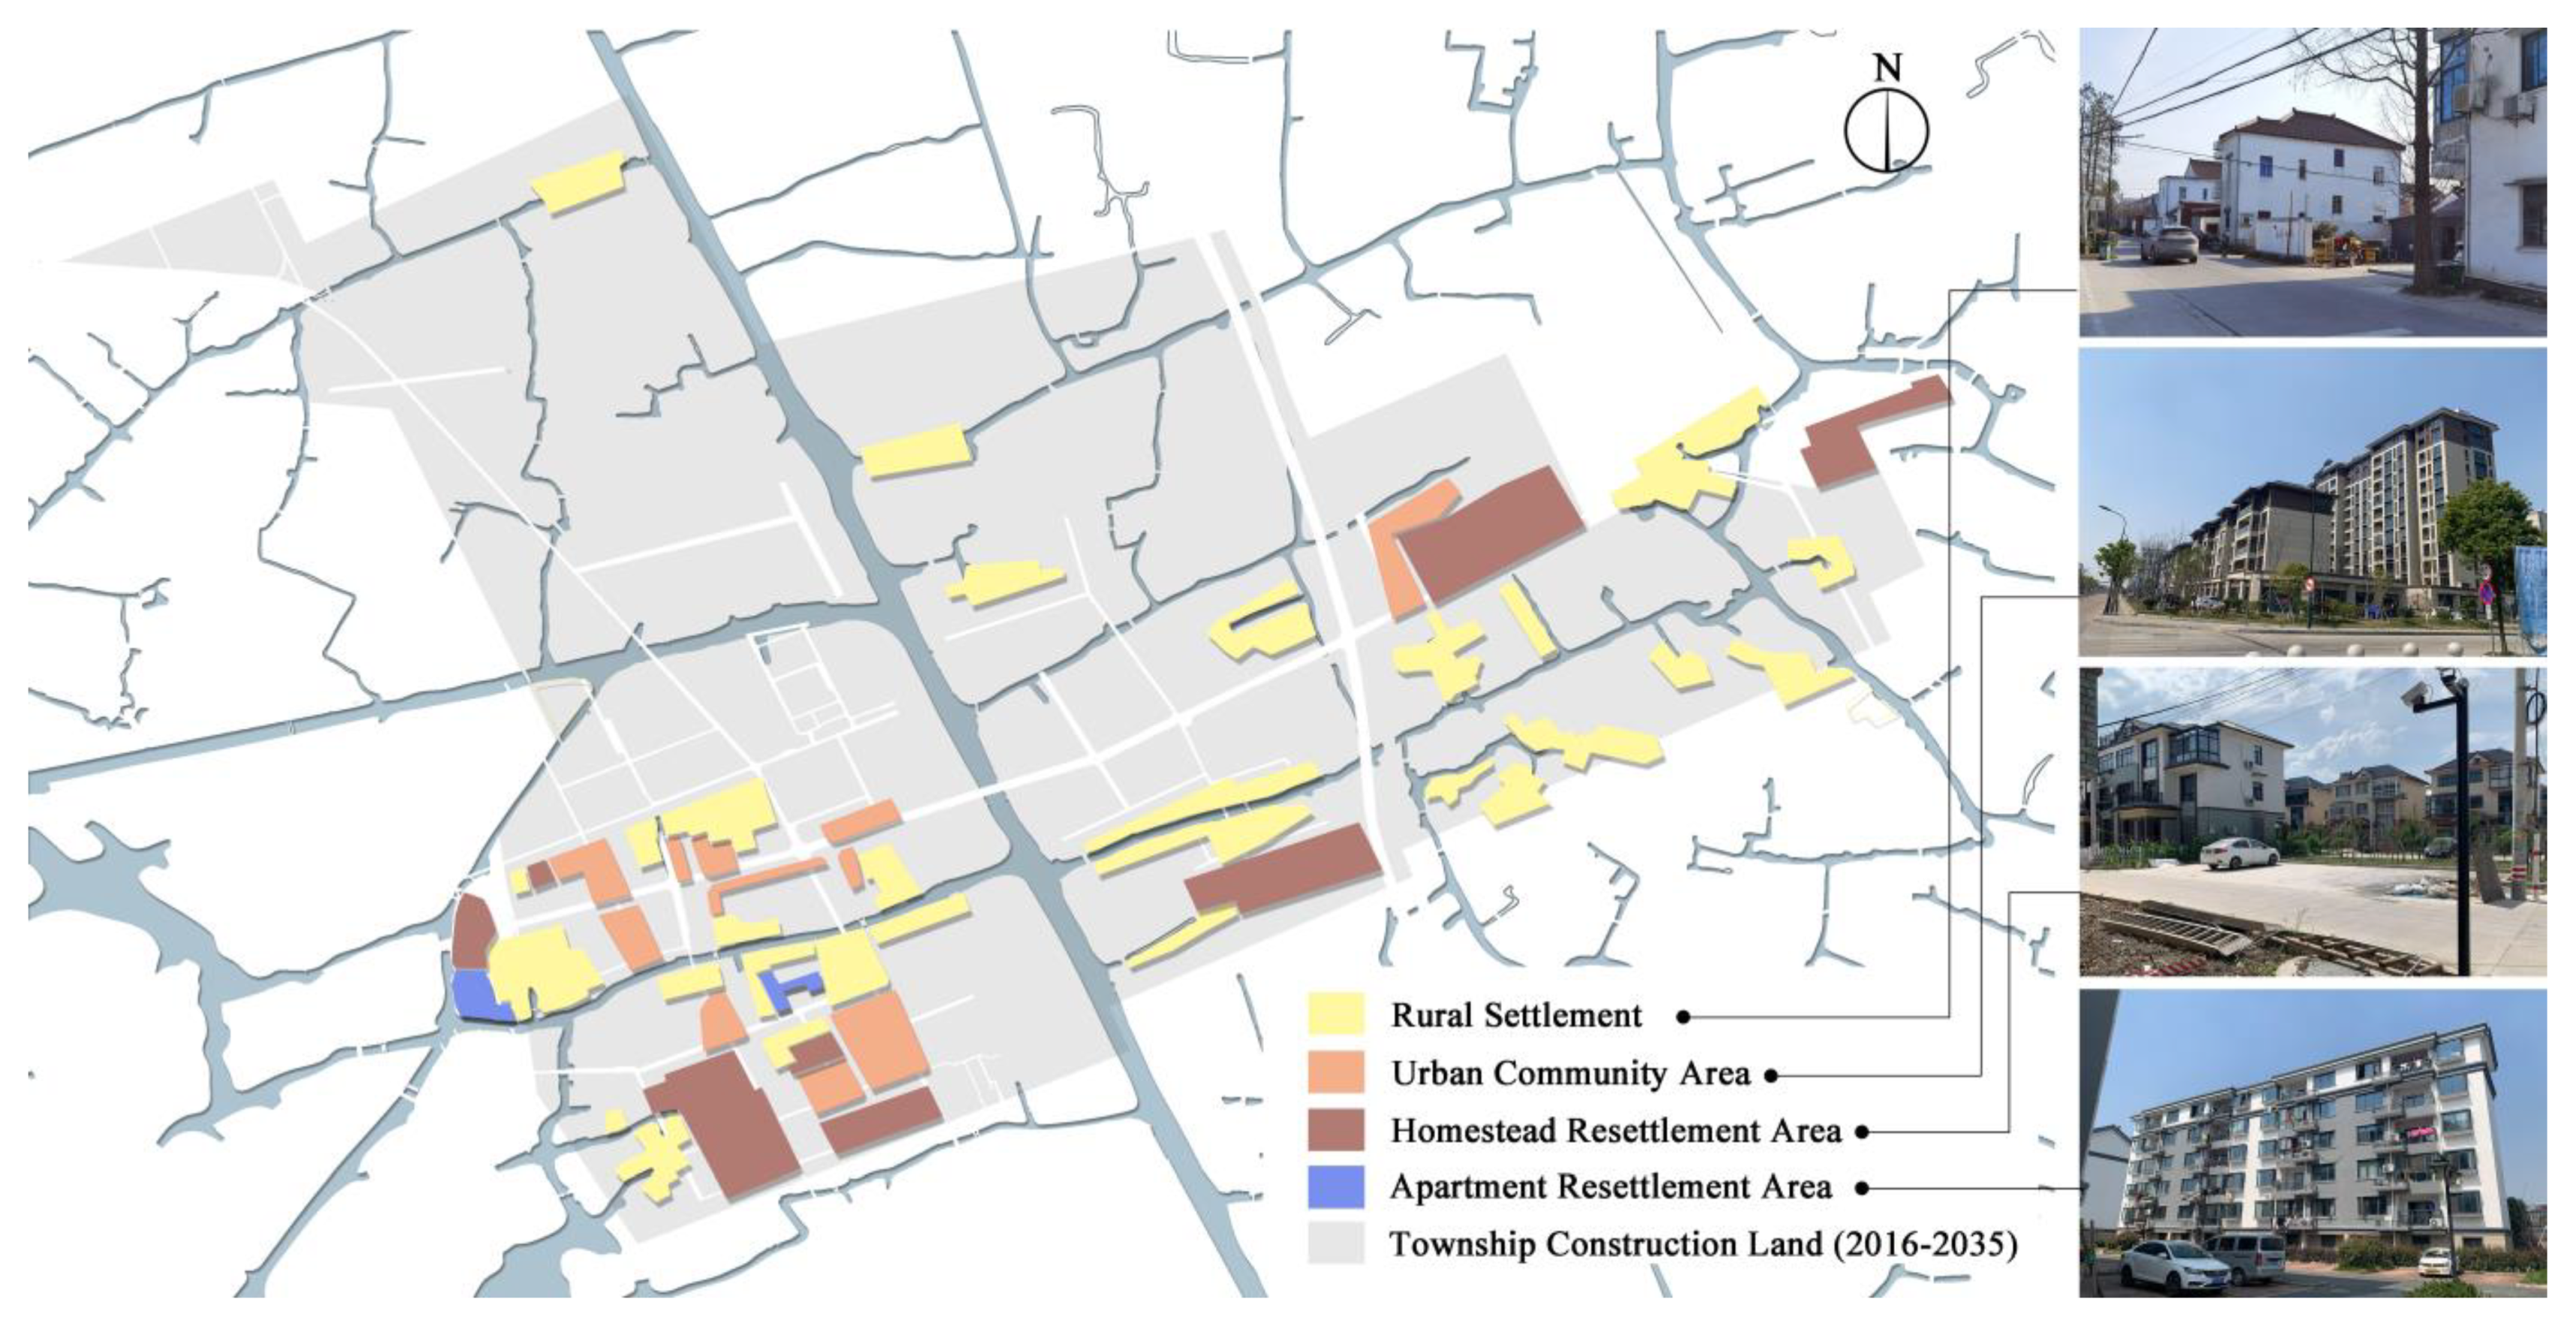
2.1.1. Cognitive Perception of the Types of Urbanization Patterns in Residential Areas
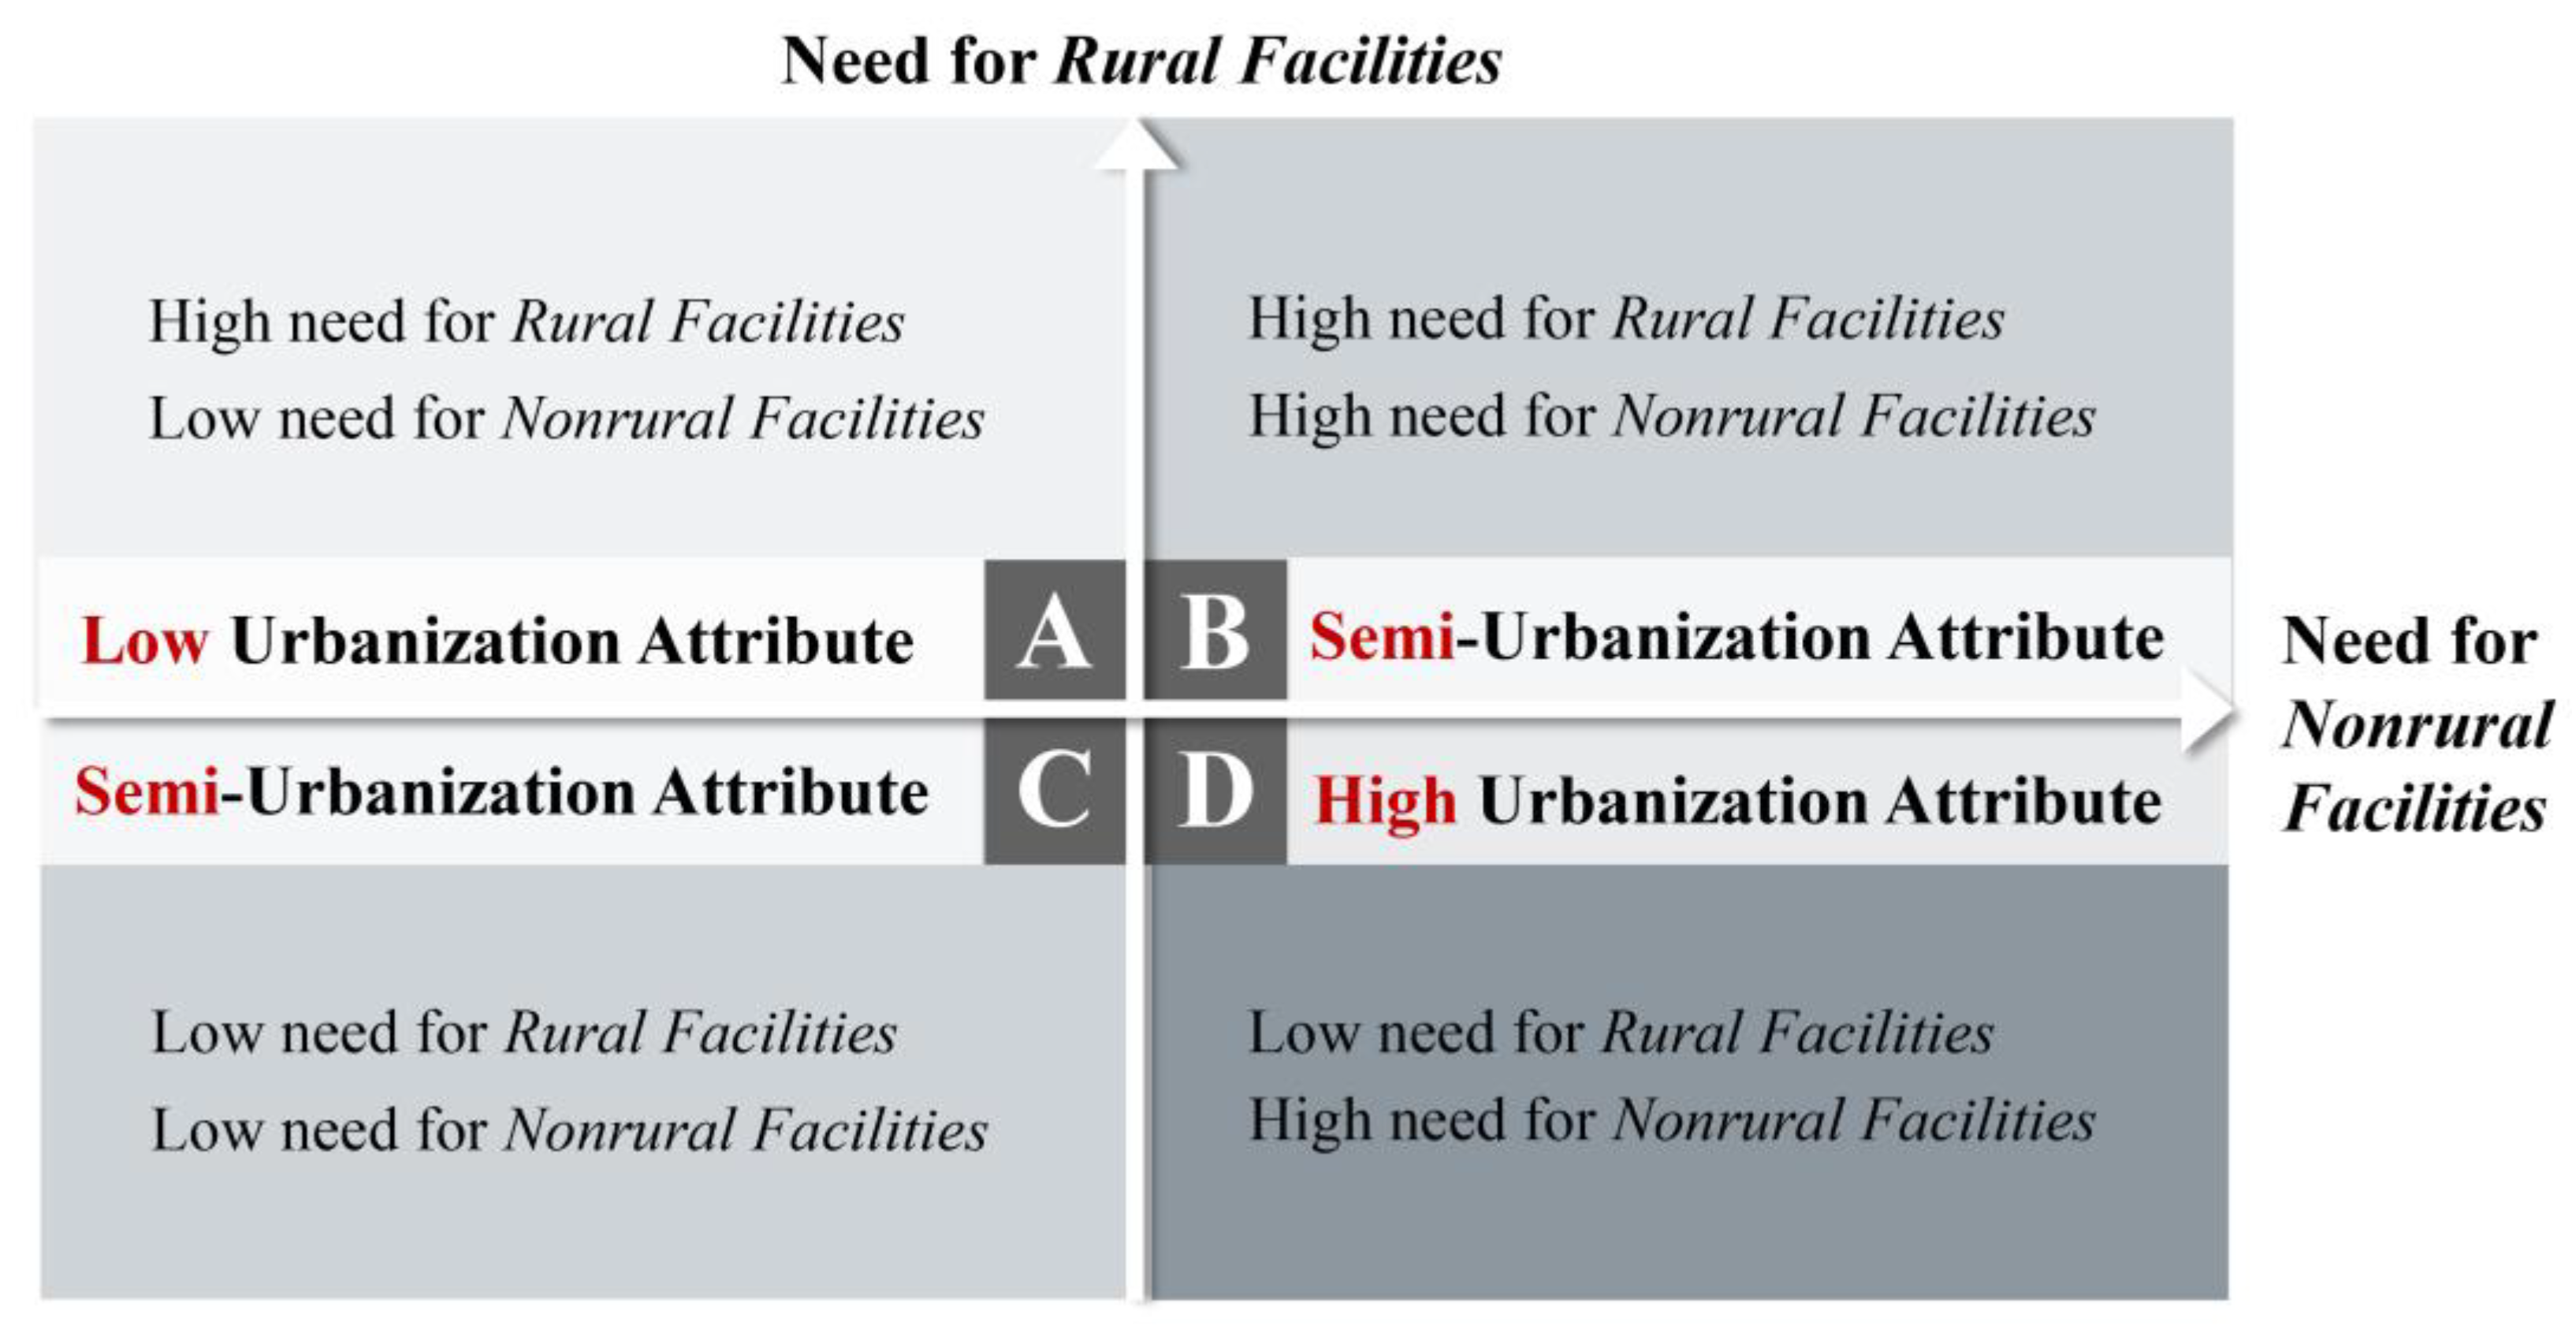
2.1.2. Analysis of Urbanization Characteristics Based on Residents’ Facility Needs
2.2. The Facility Programming Path Based on Residents’ Needs
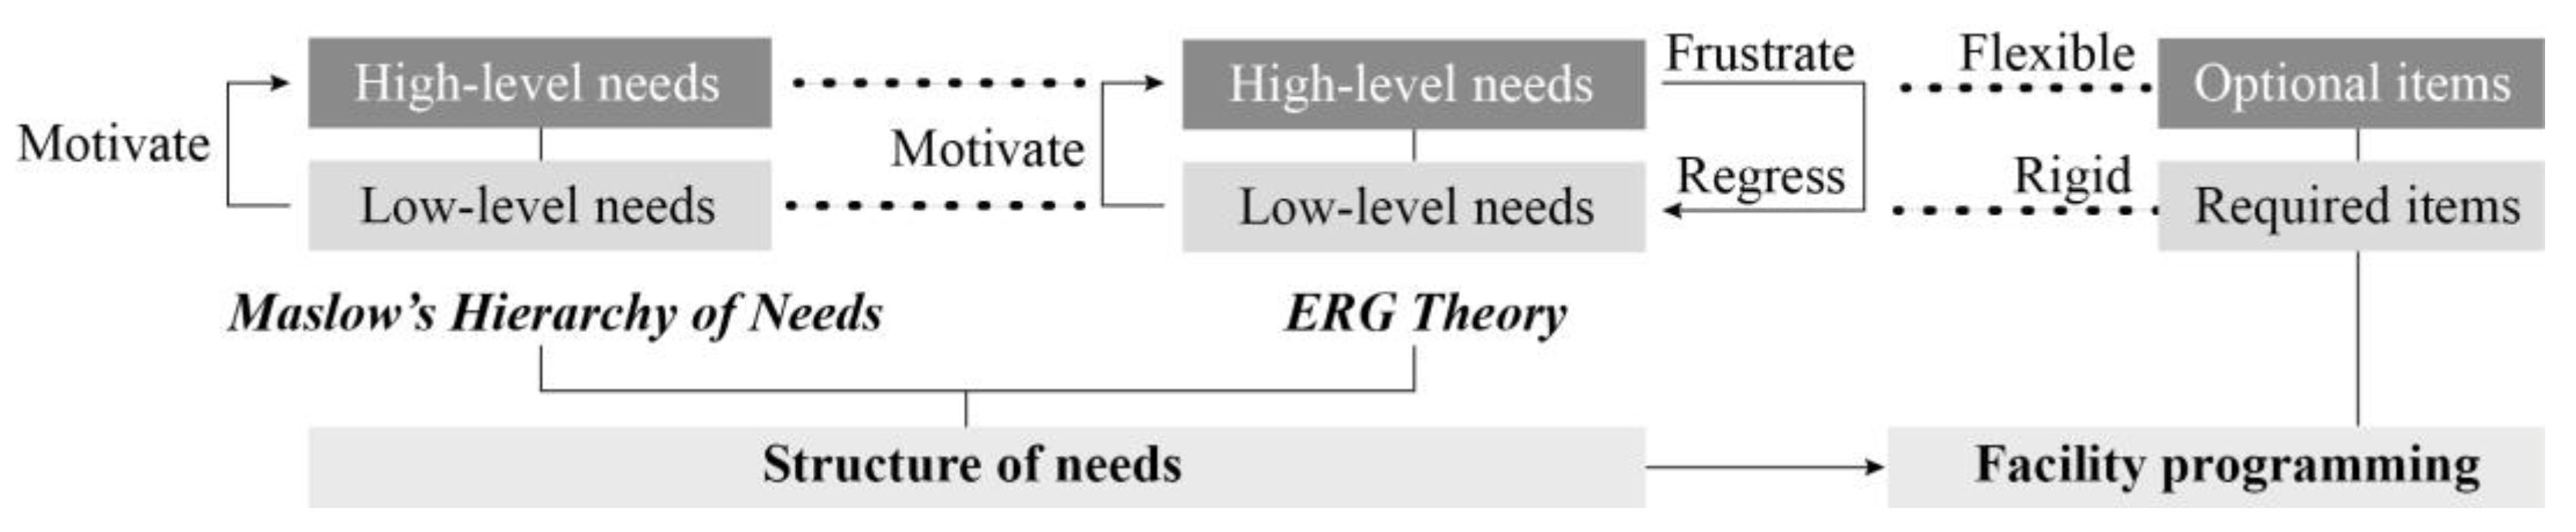
2.2.1. Establishment of a Guidance and Control Hierarchy Based on Needs Theory
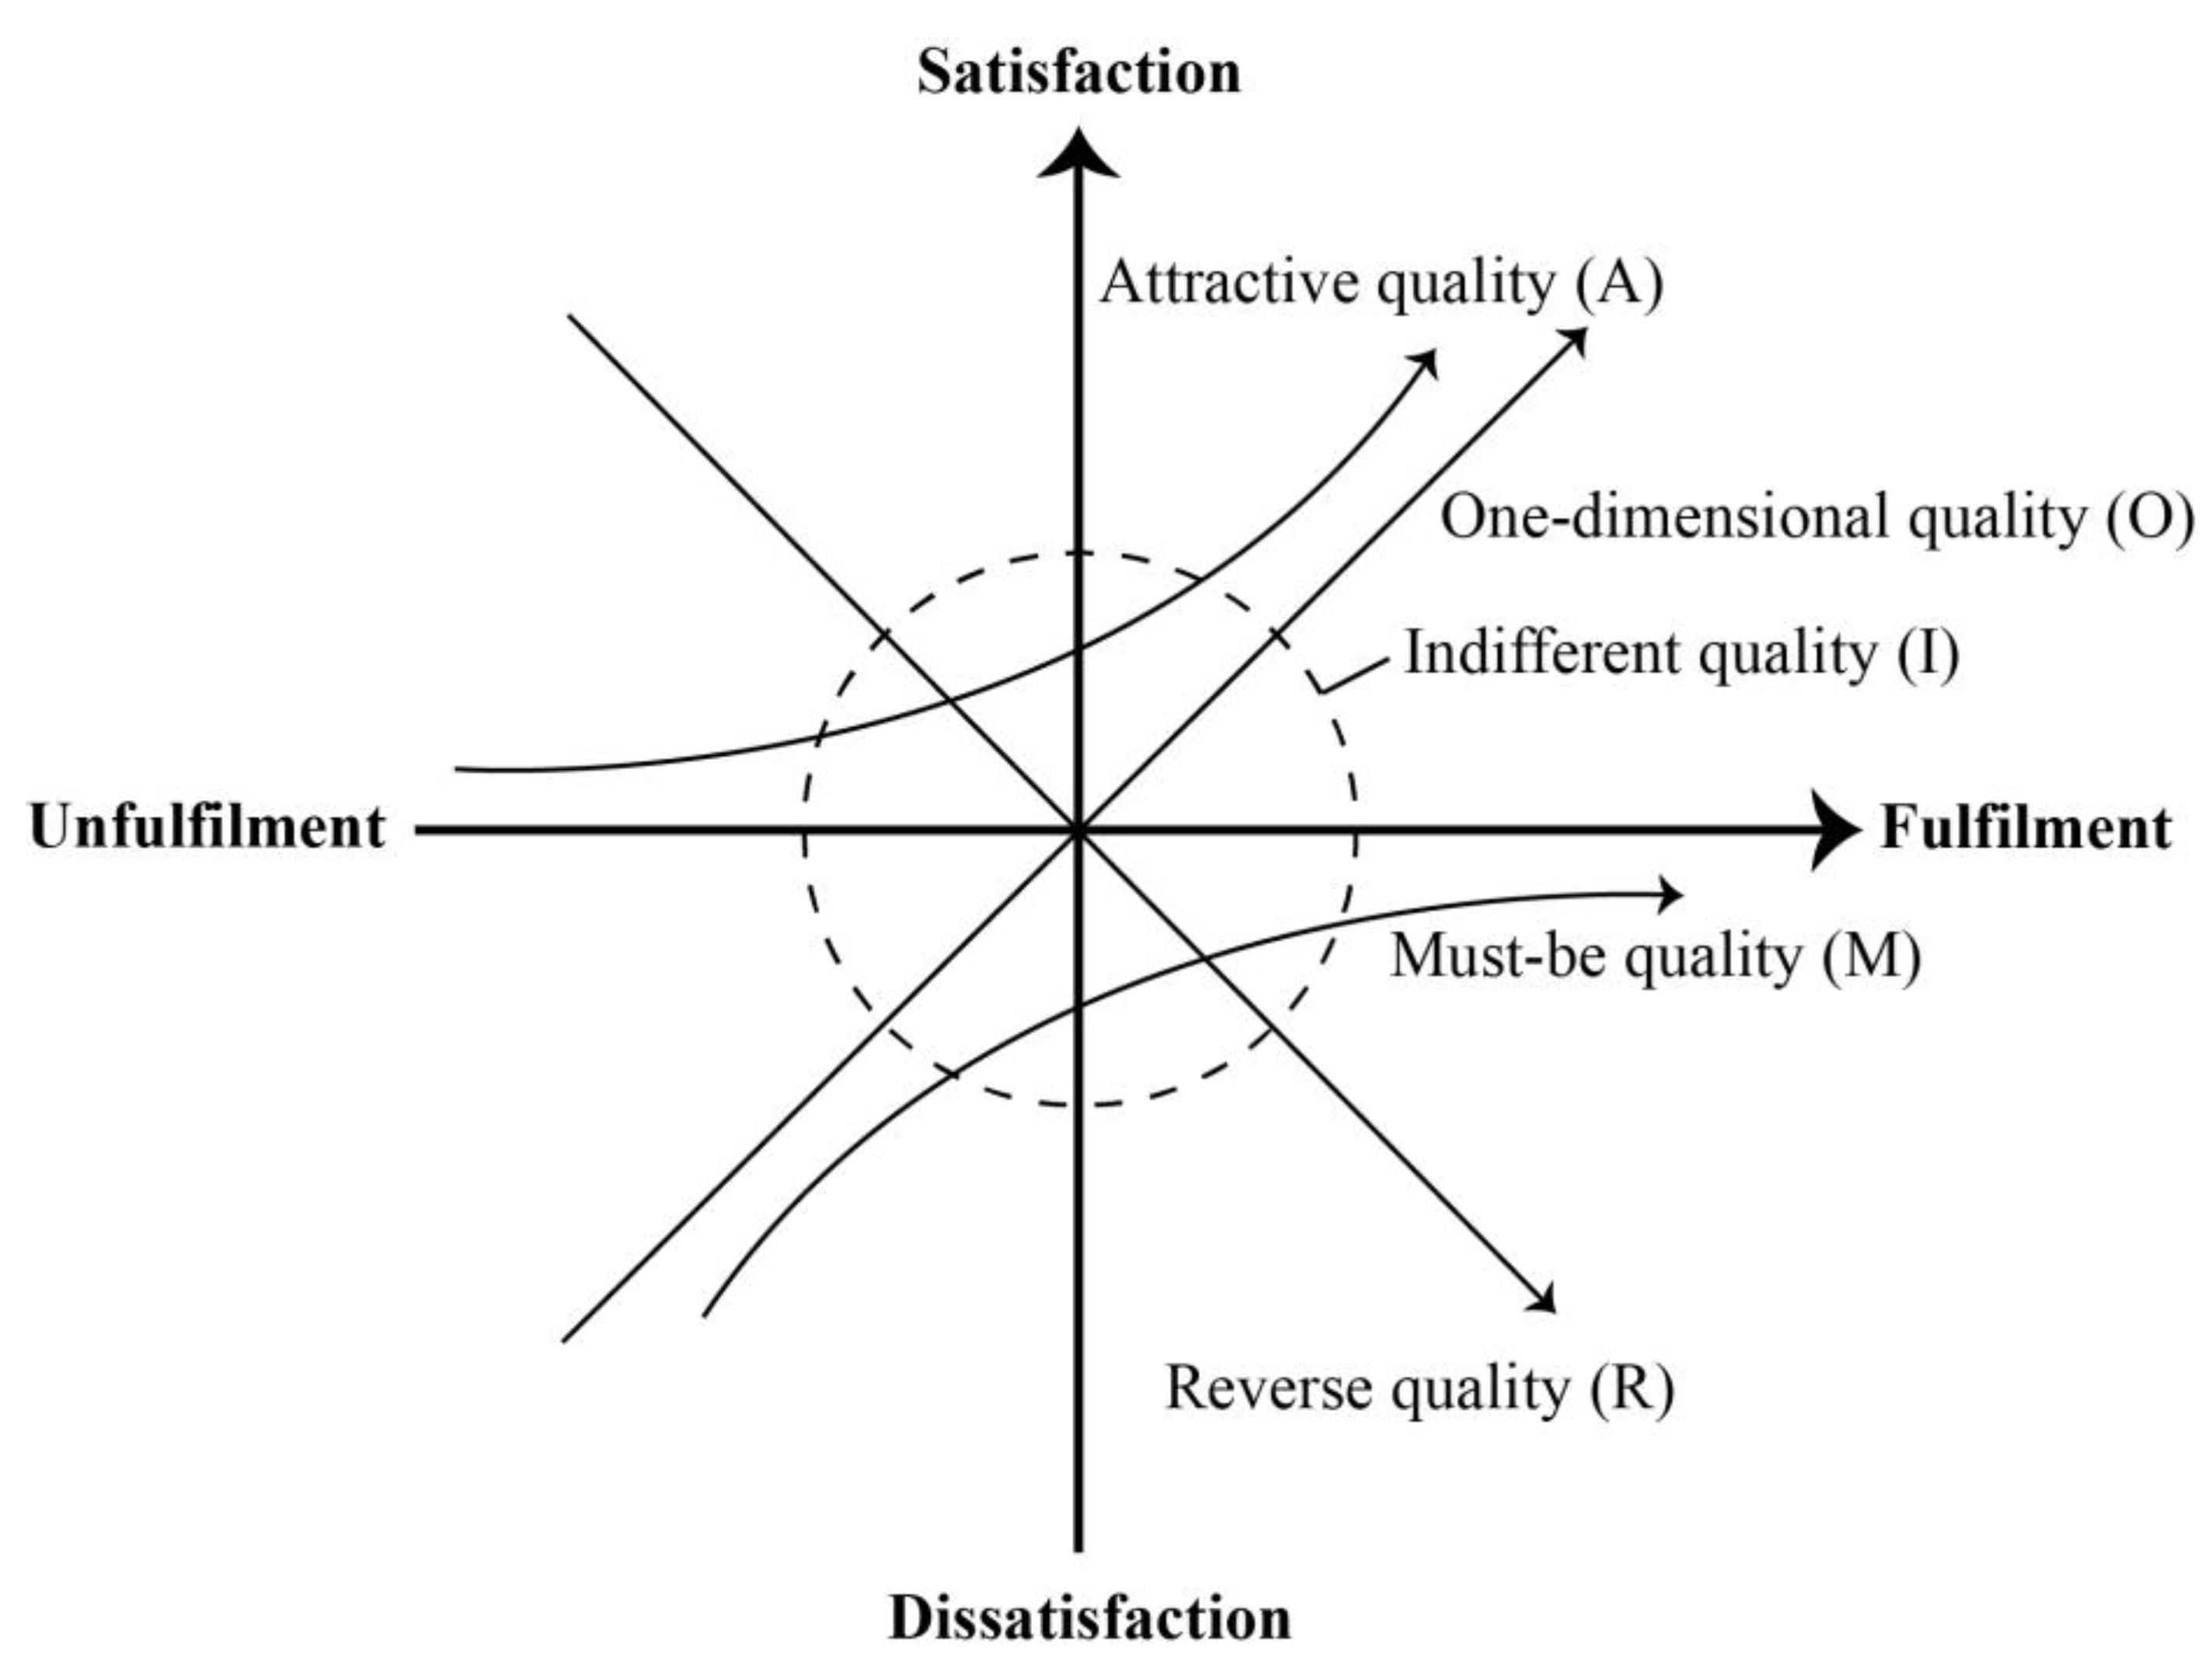
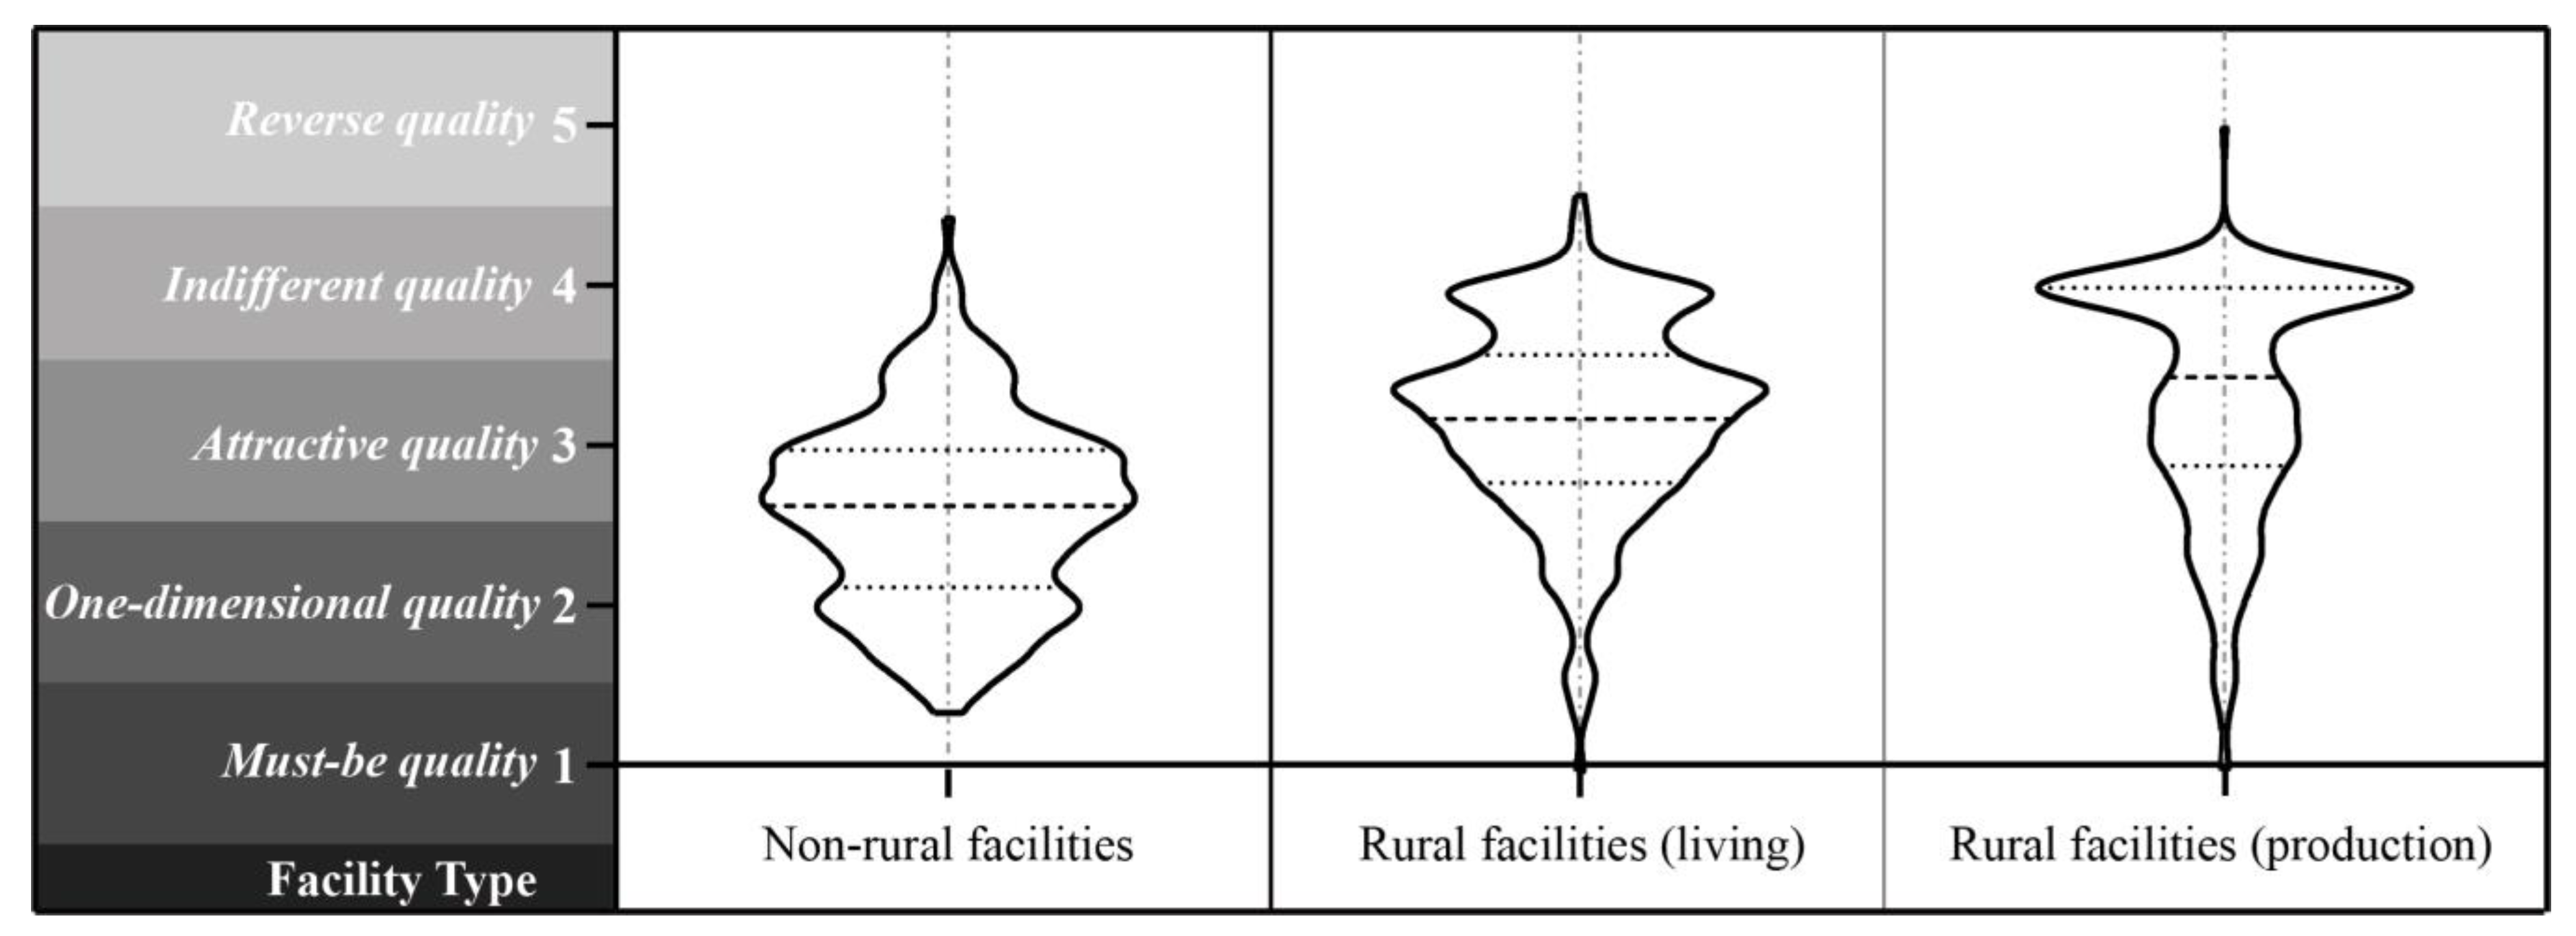
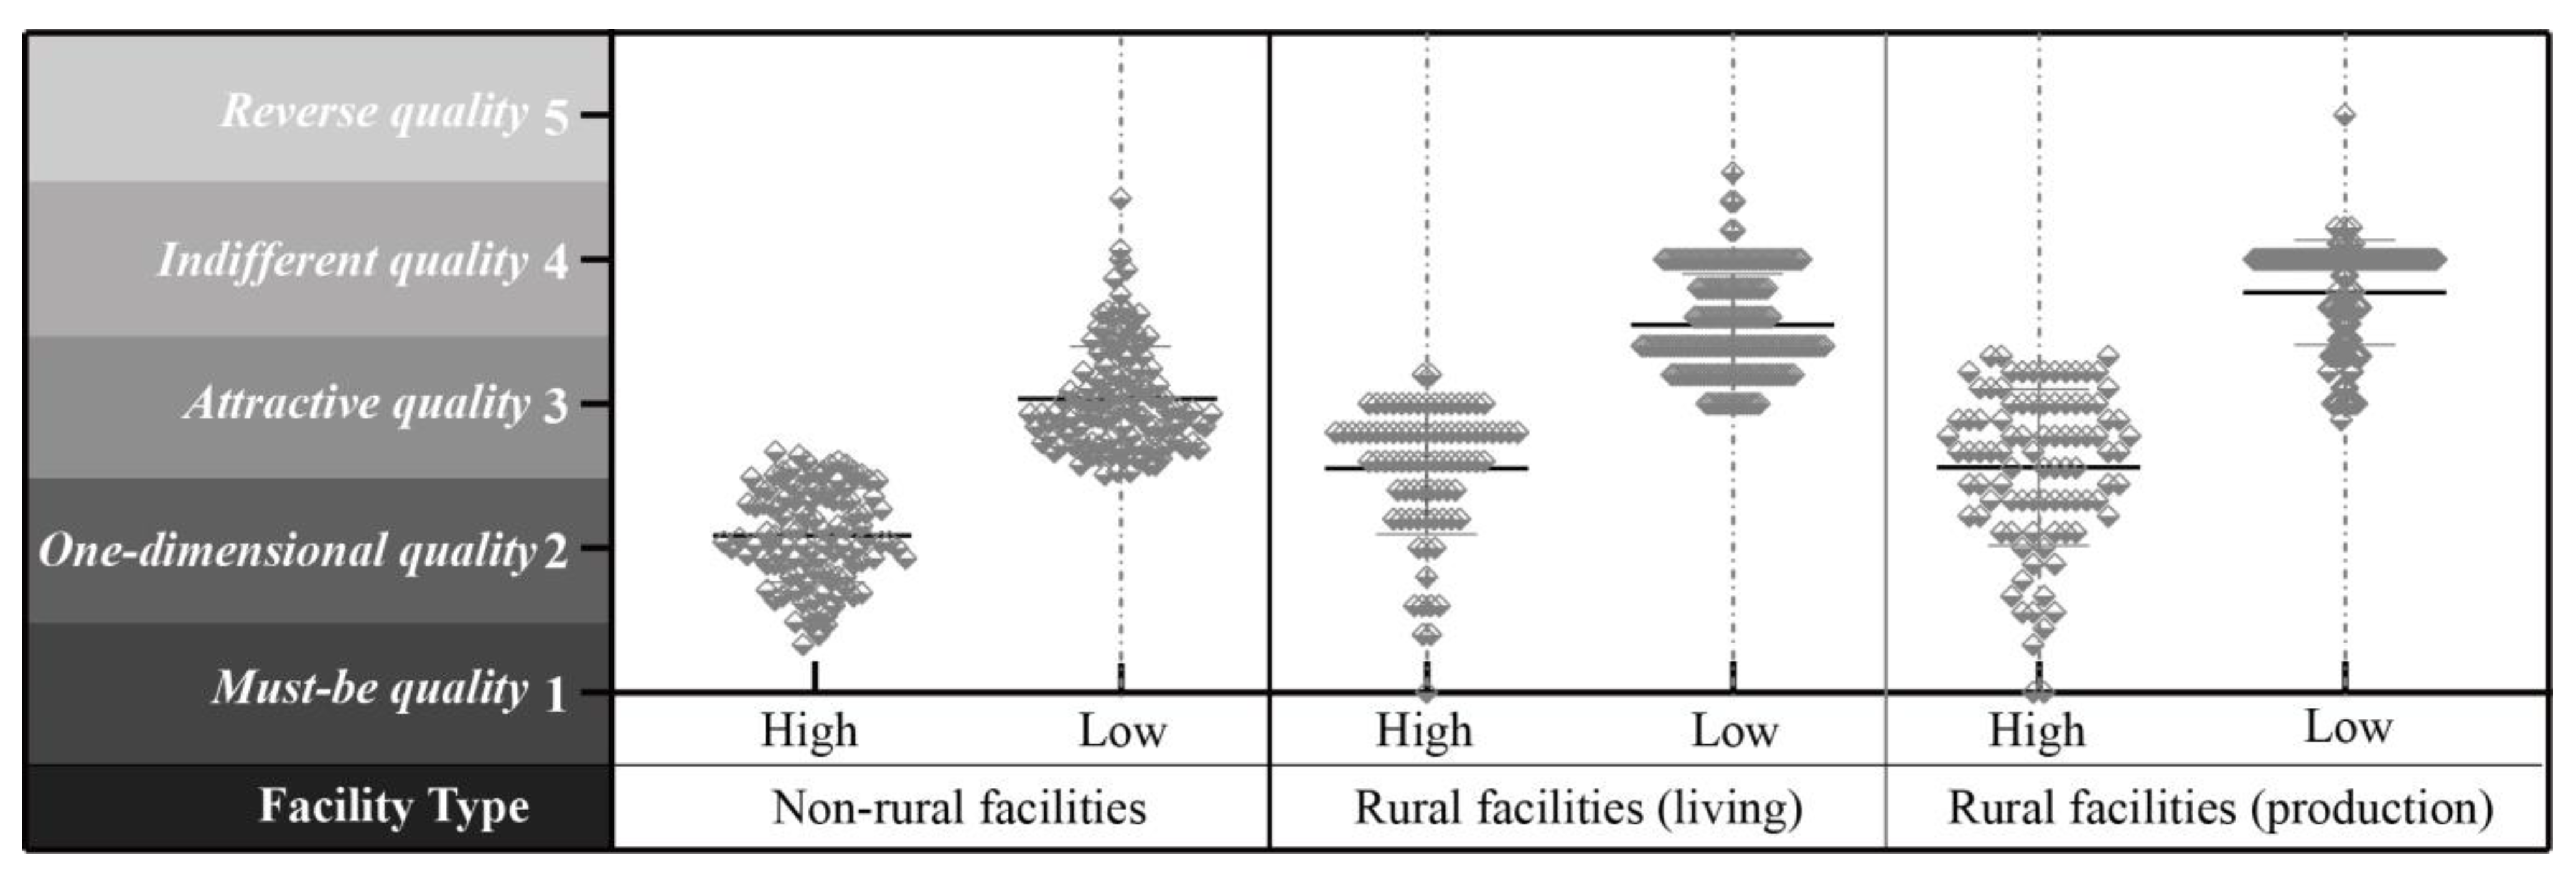
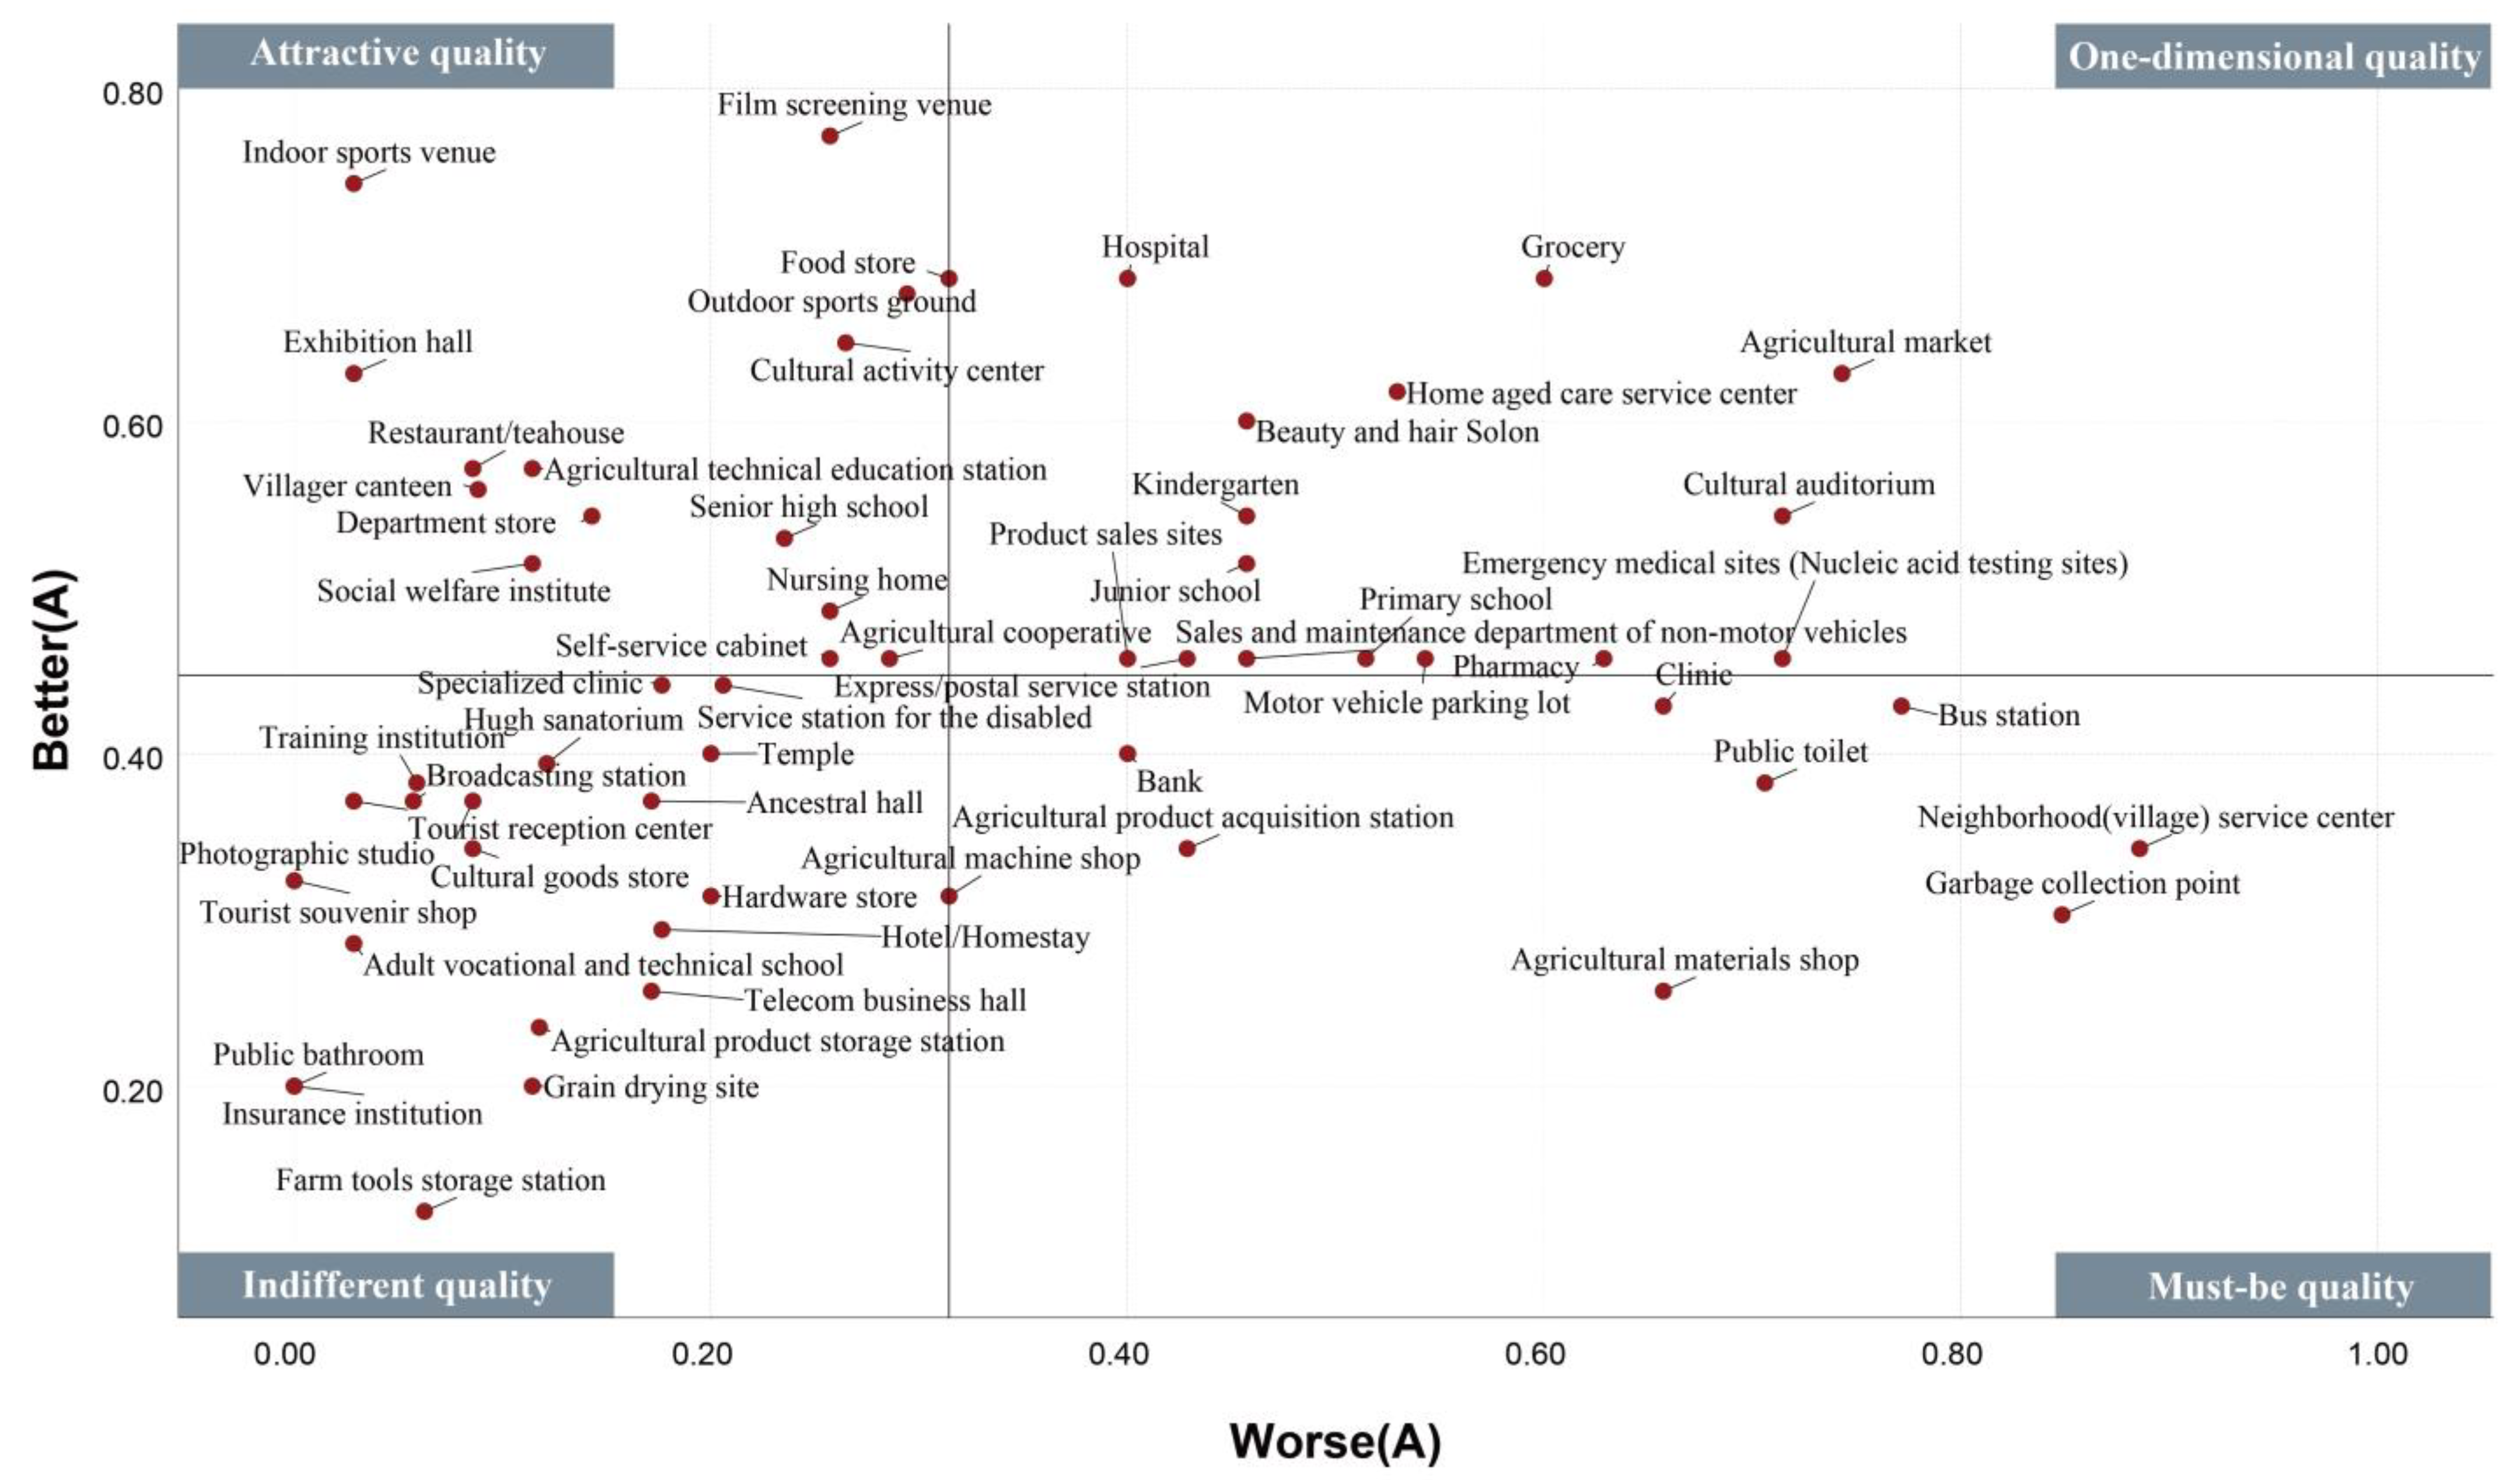
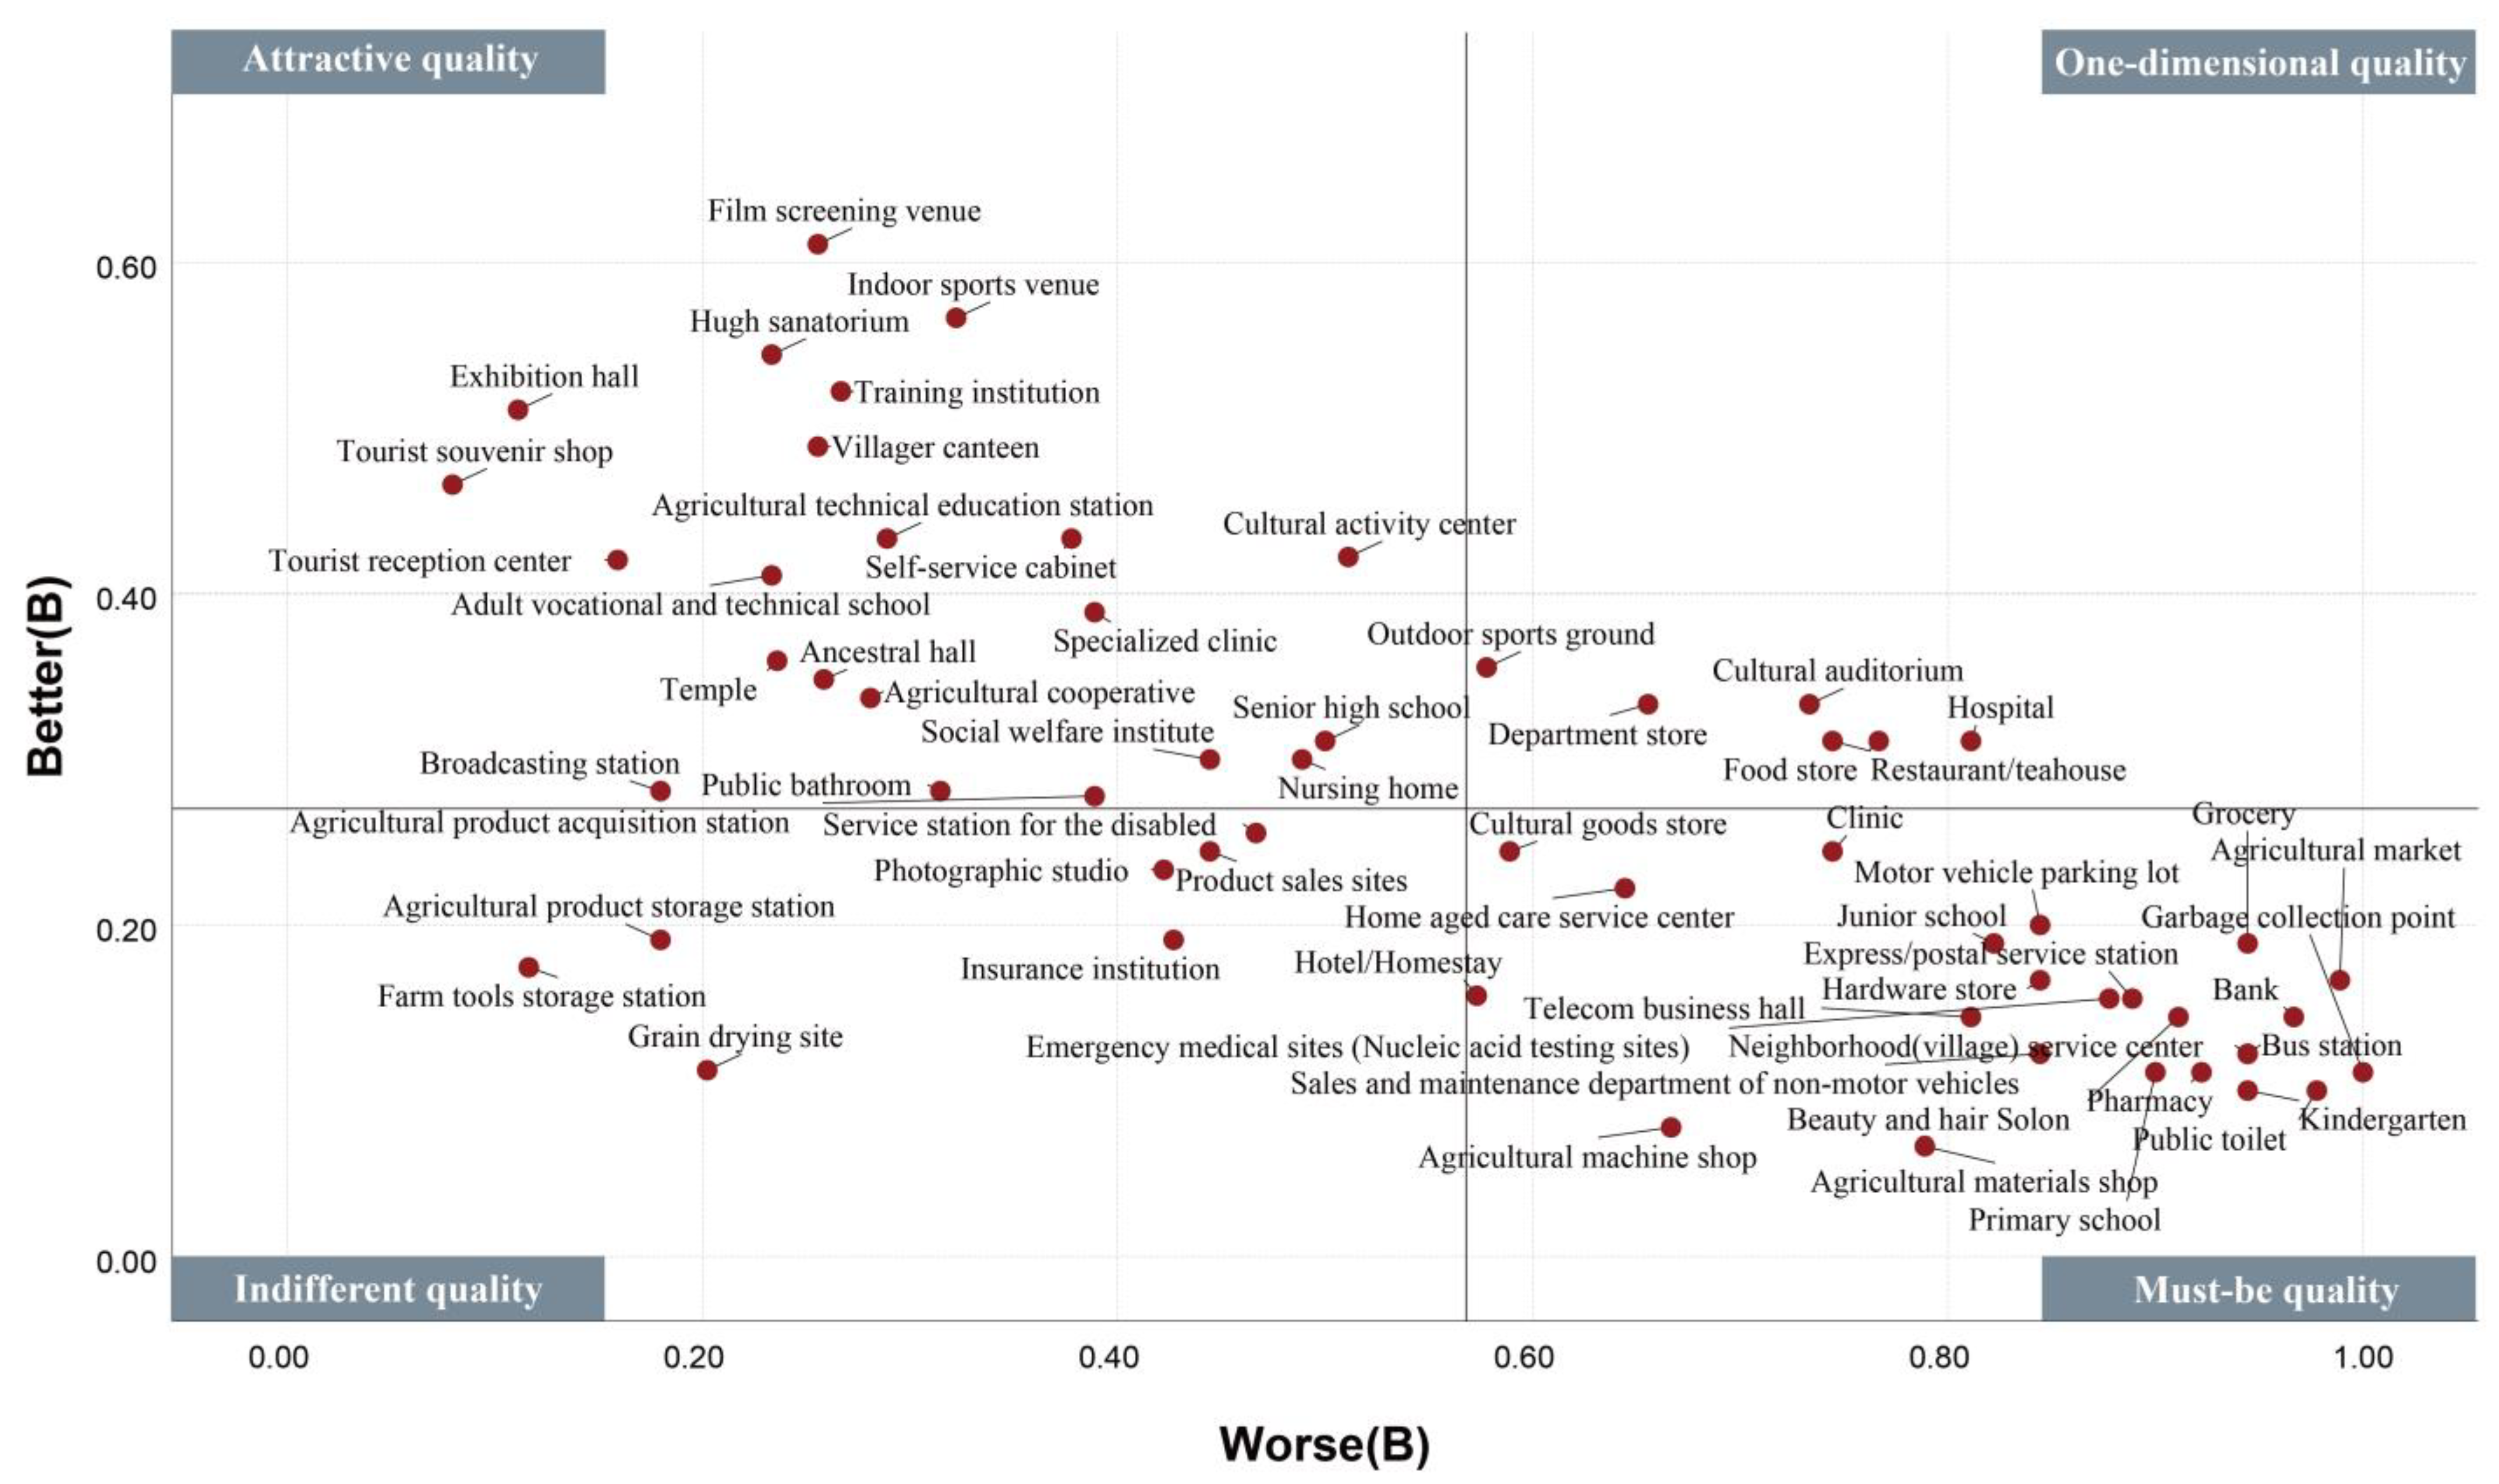
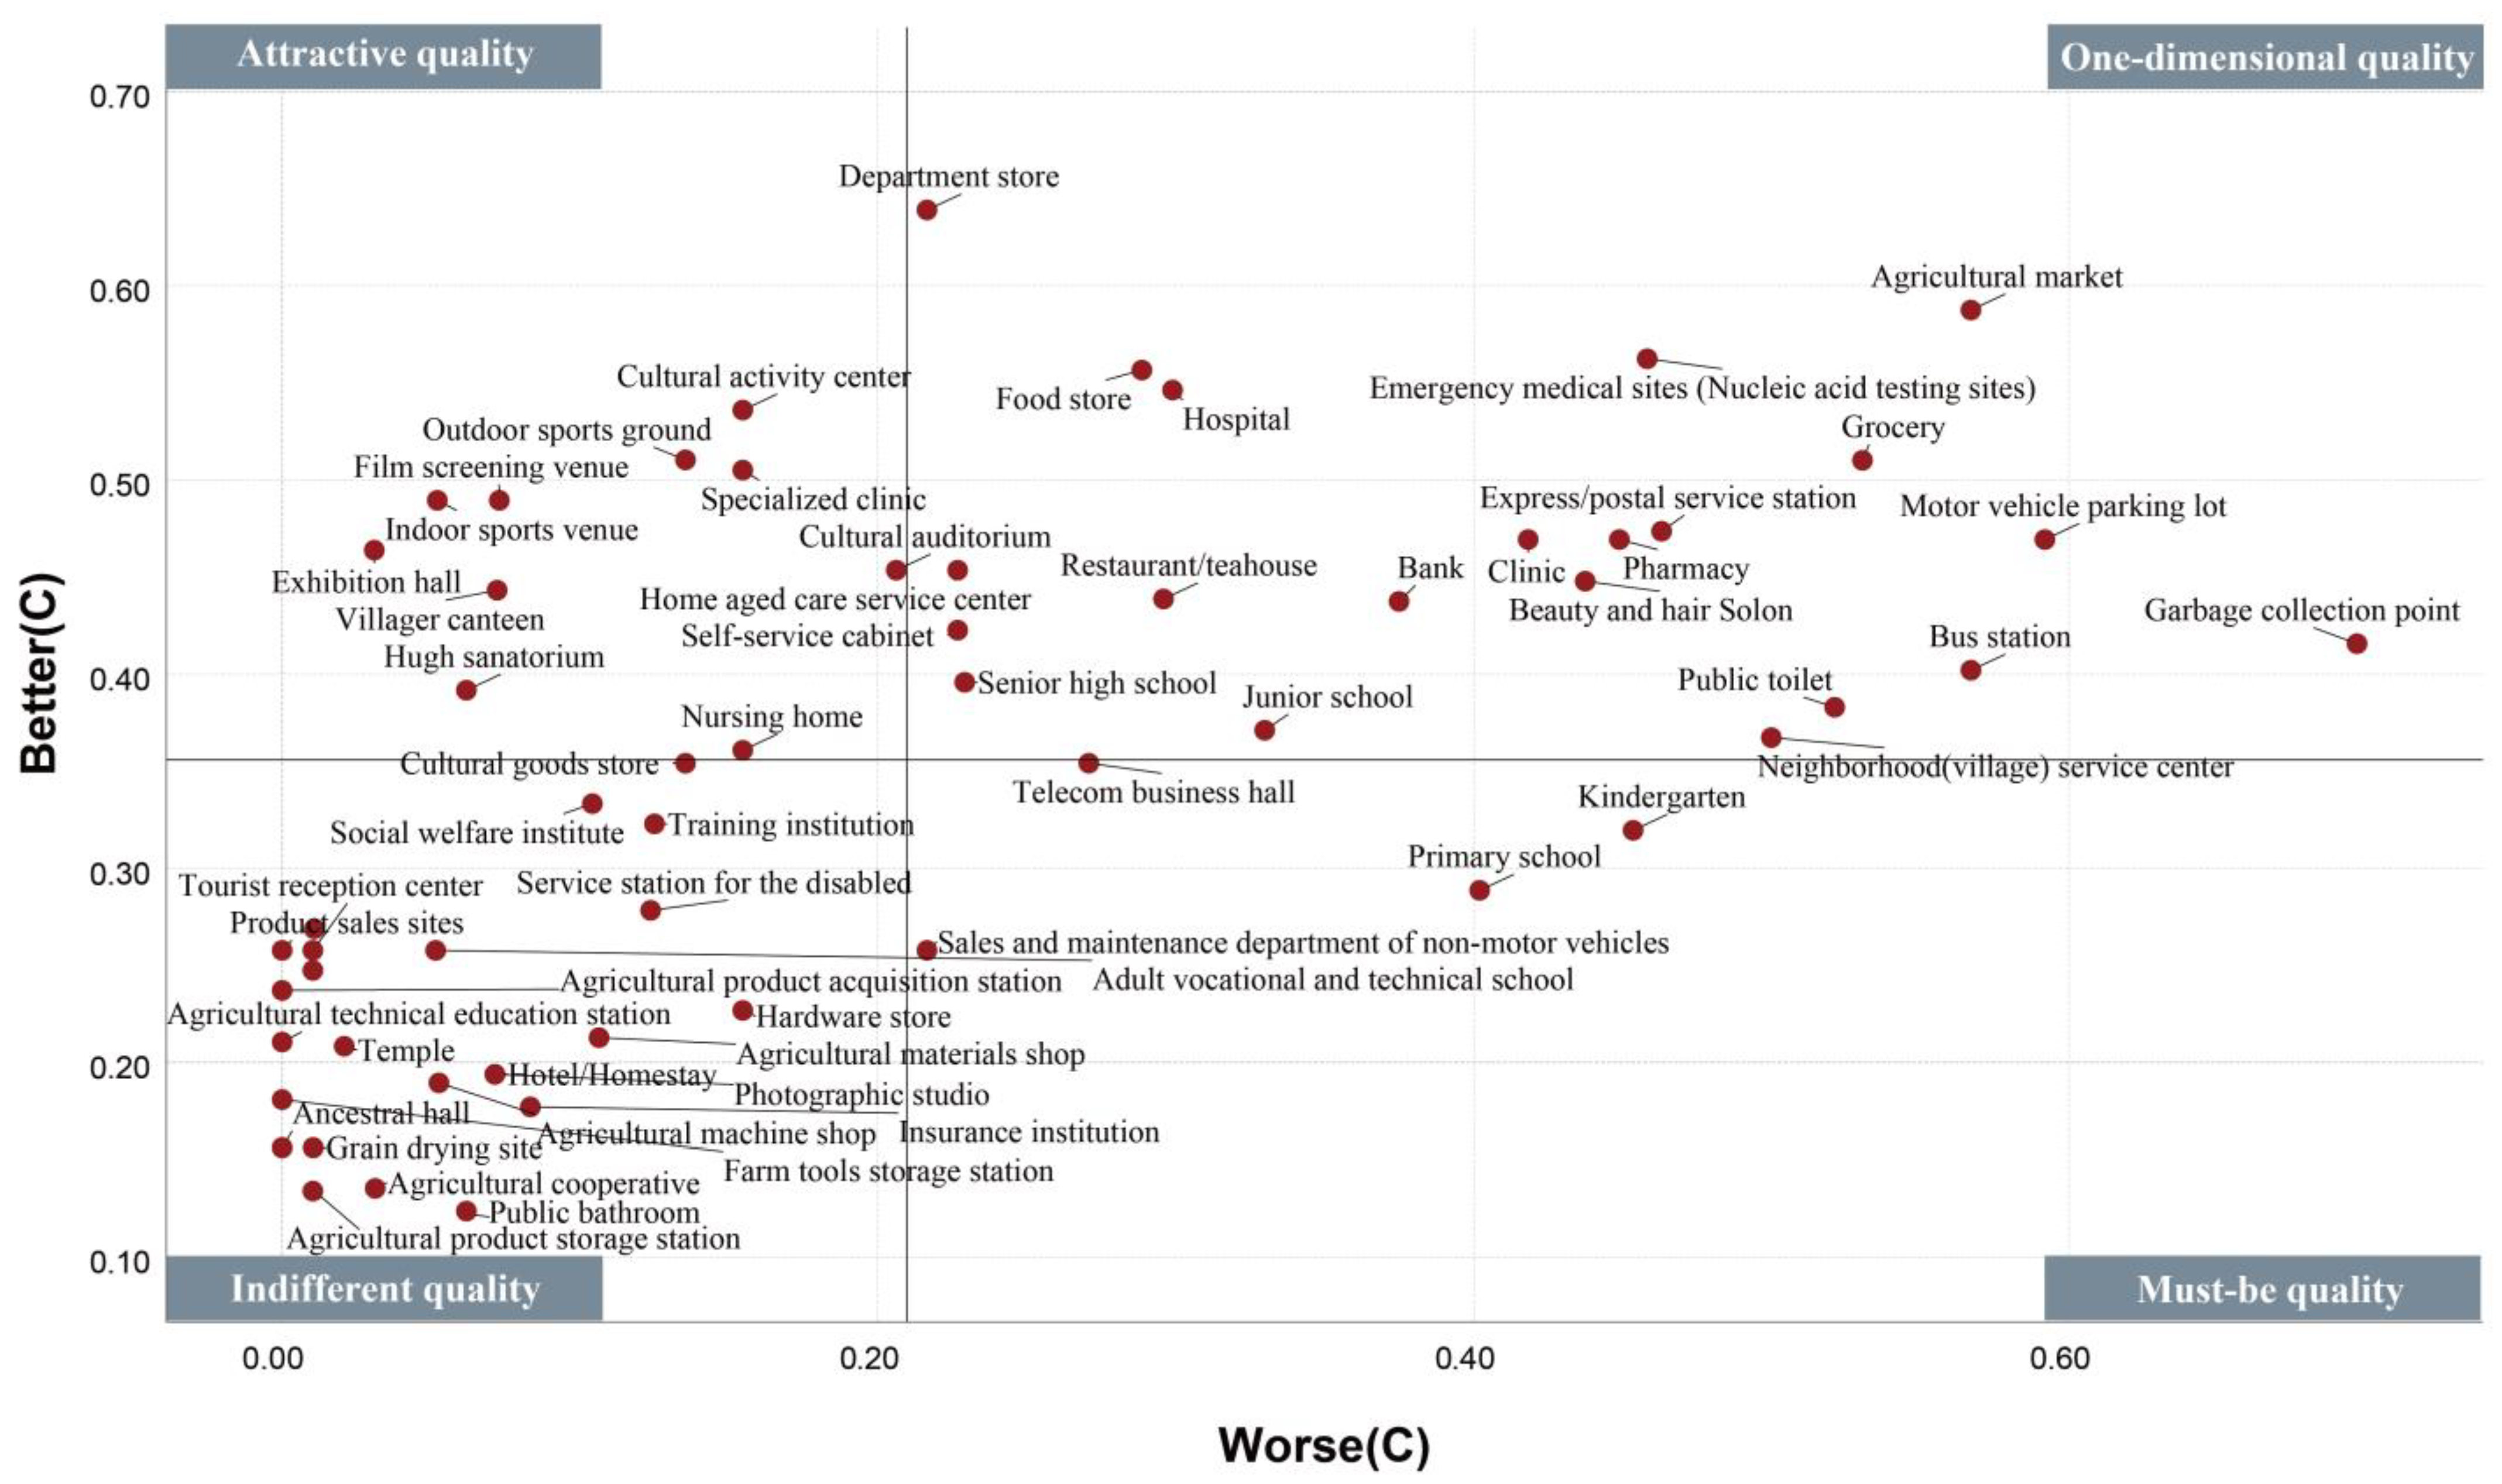
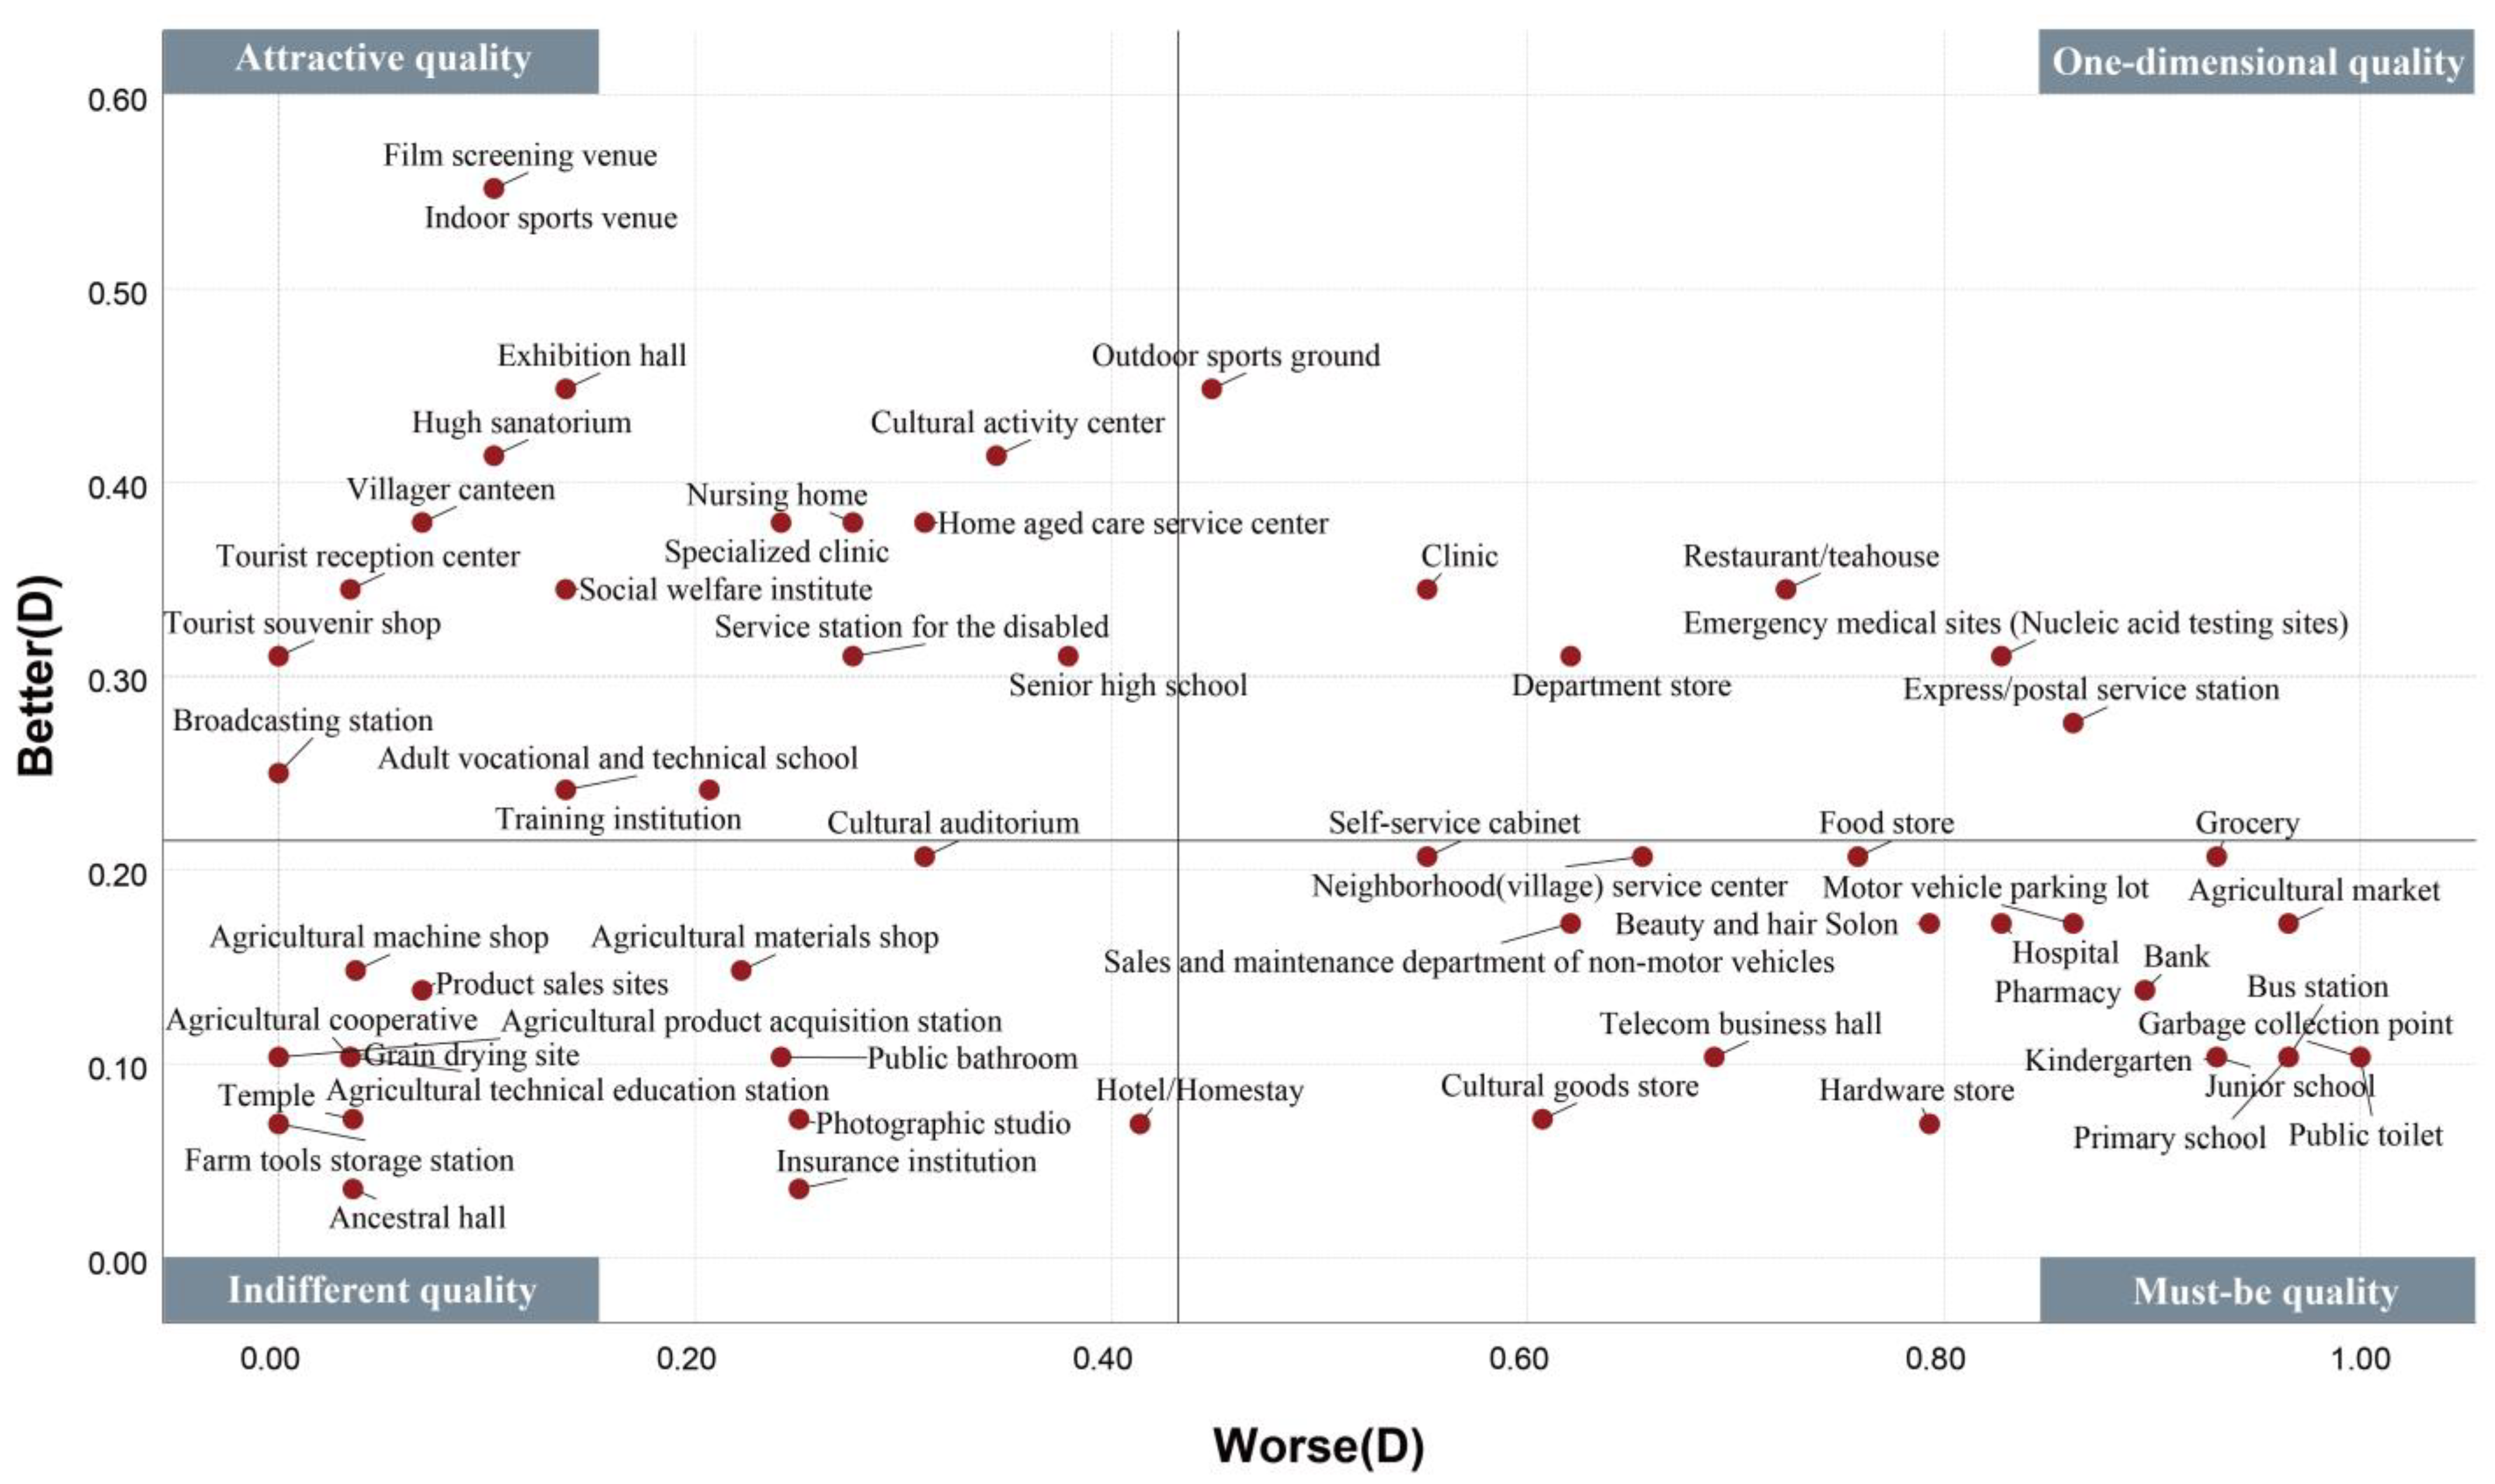
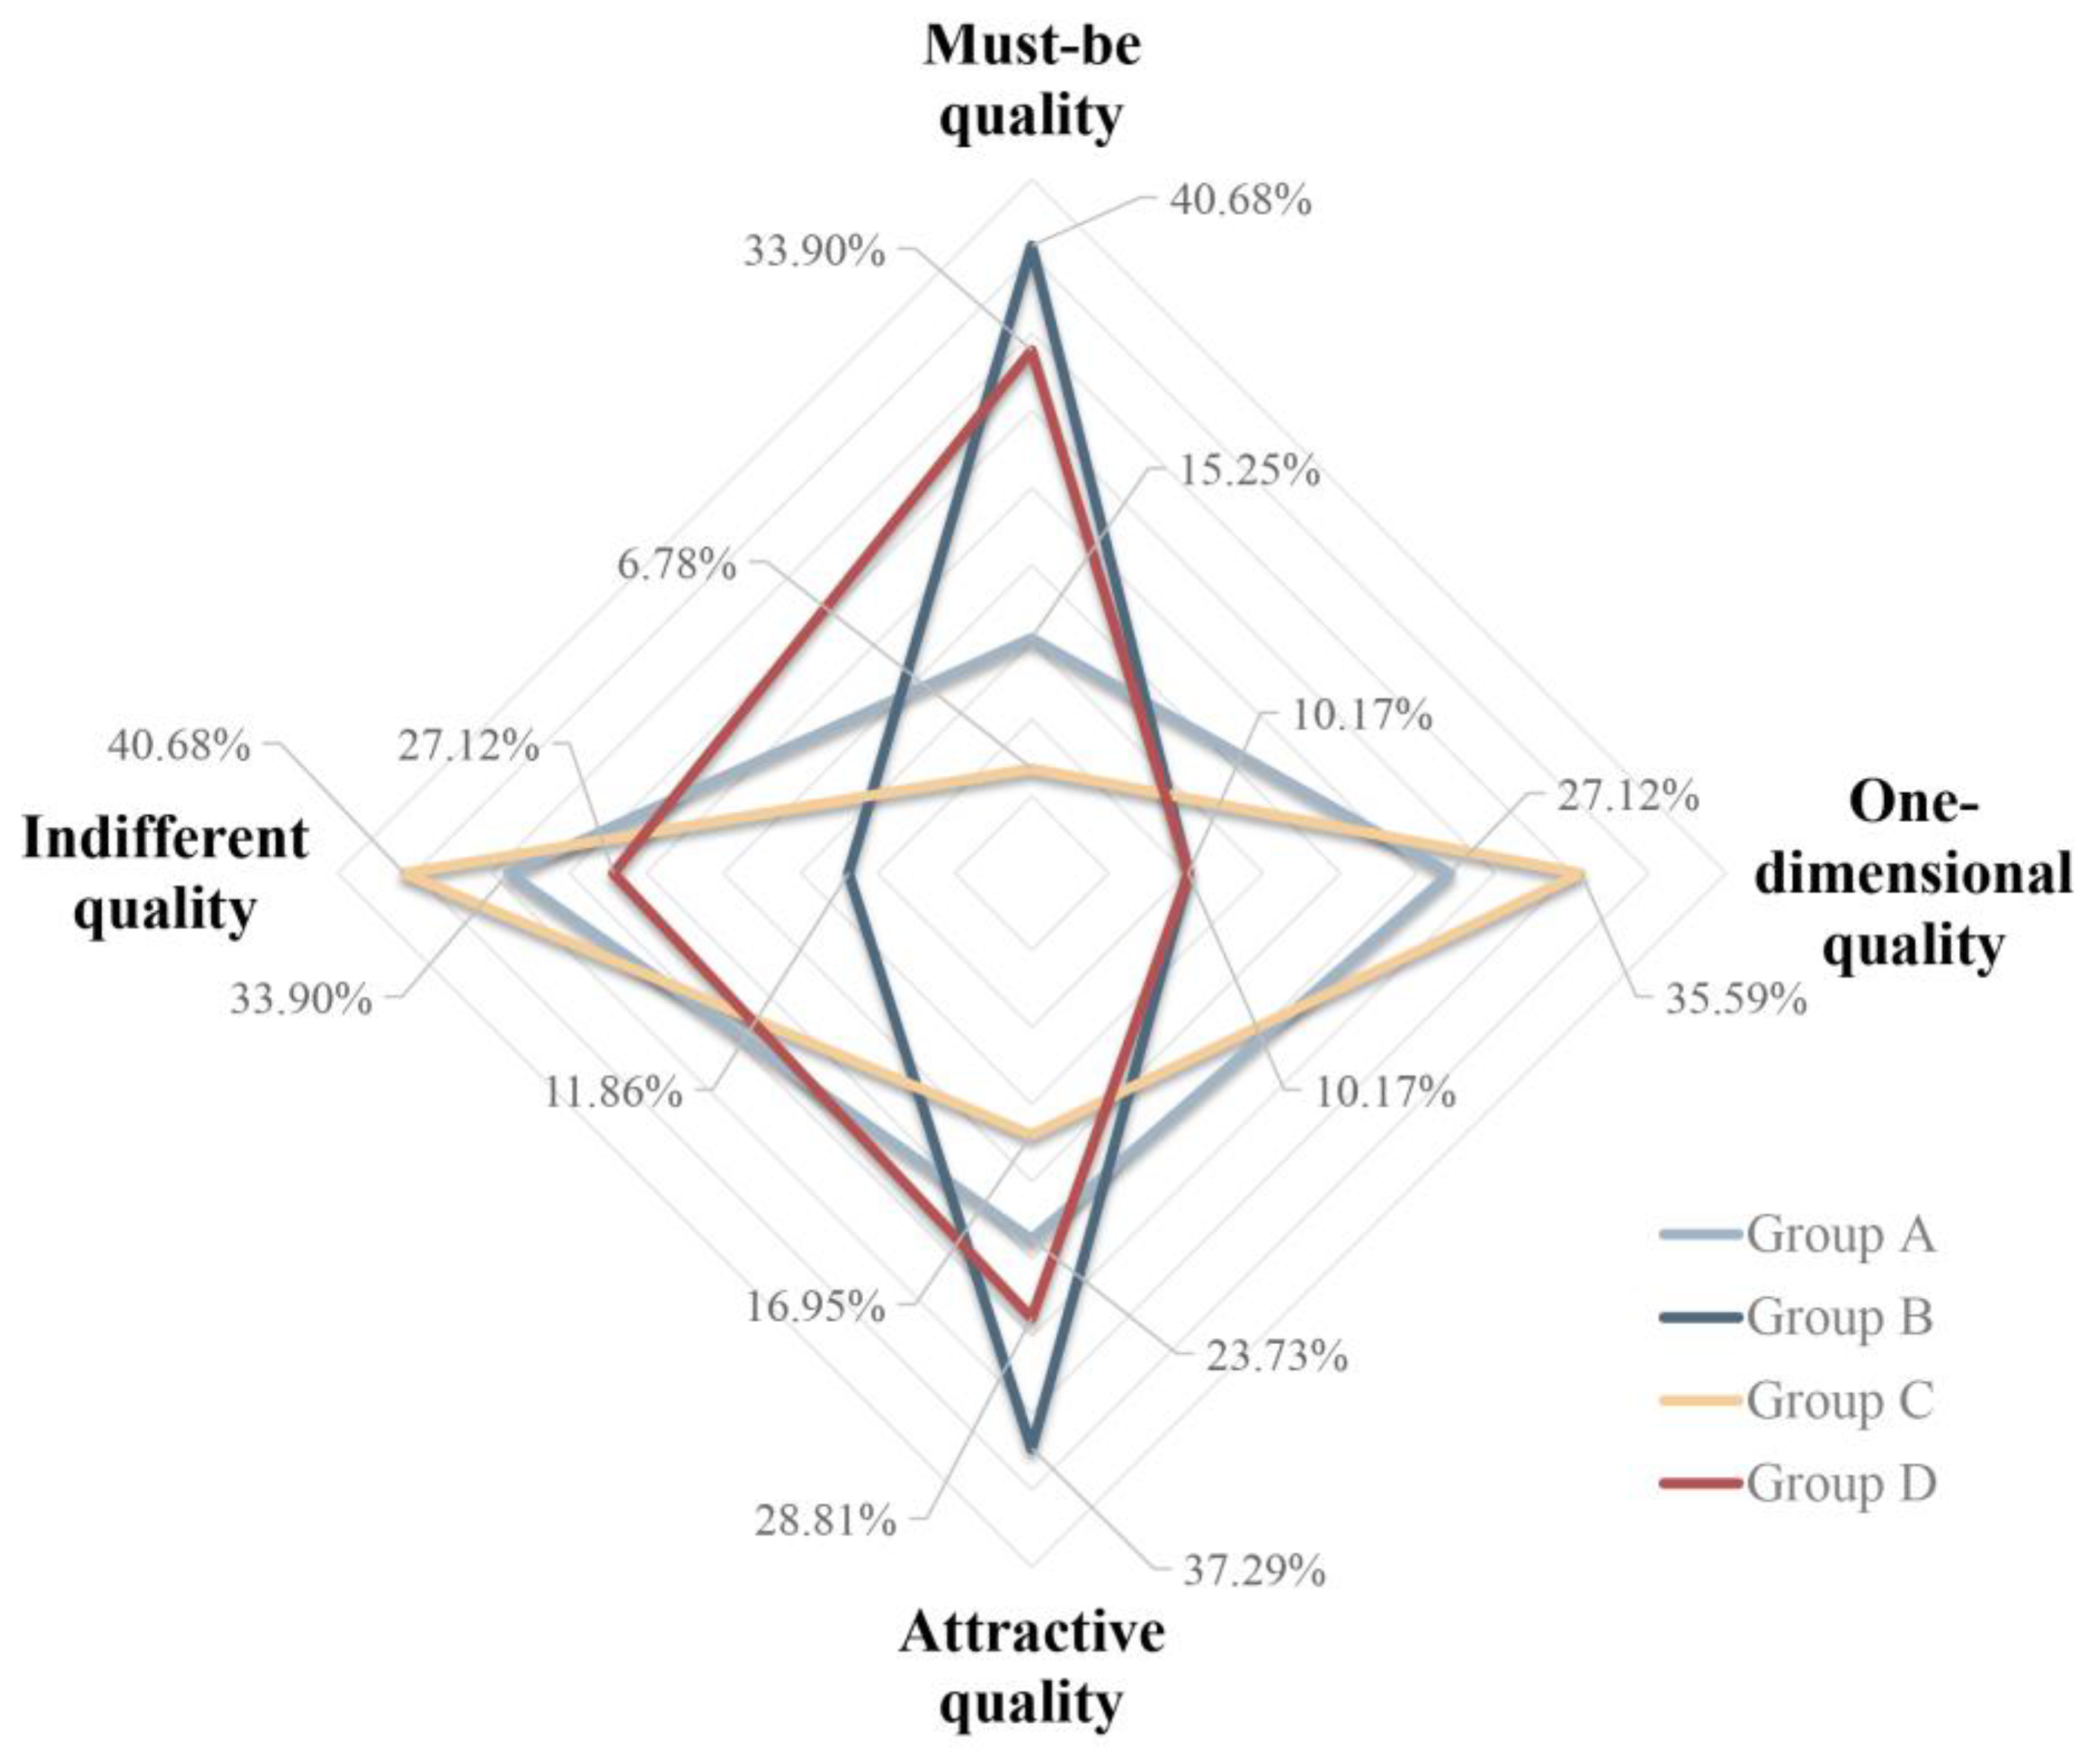
2.2.2. Identification of Needs Structure Characteristics Based on the Kano Model
- Must-be quality (M): Facilities that are essential to the lives of residents. Providing these facilities in the community may not increase residents’ satisfaction; however, without such facilities, residents will be extremely inconvenienced.
- One-dimensional quality (O): Facilities that residents expect to have. The provision of these facilities will satisfy the residents, while the absence of such facilities will make the residents feel dissatisfied; however, they can tolerate such an absence.
- Attractive quality (A): Facilities that are unexpected and will pleasantly surprise residents. Such facilities are beyond residents’ expectations and do not affect their normal lives if they are unavailable; however, if provided, they can greatly improve satisfaction and quality of life.
- Indifferent quality (I): Facilities that are not a concern for residents. Whether such facilities are provided or not has a minimal effect on the residents’ quality of life.
- Reverse quality (R): Facilities that residents do not want.
2.3. Investigation Method
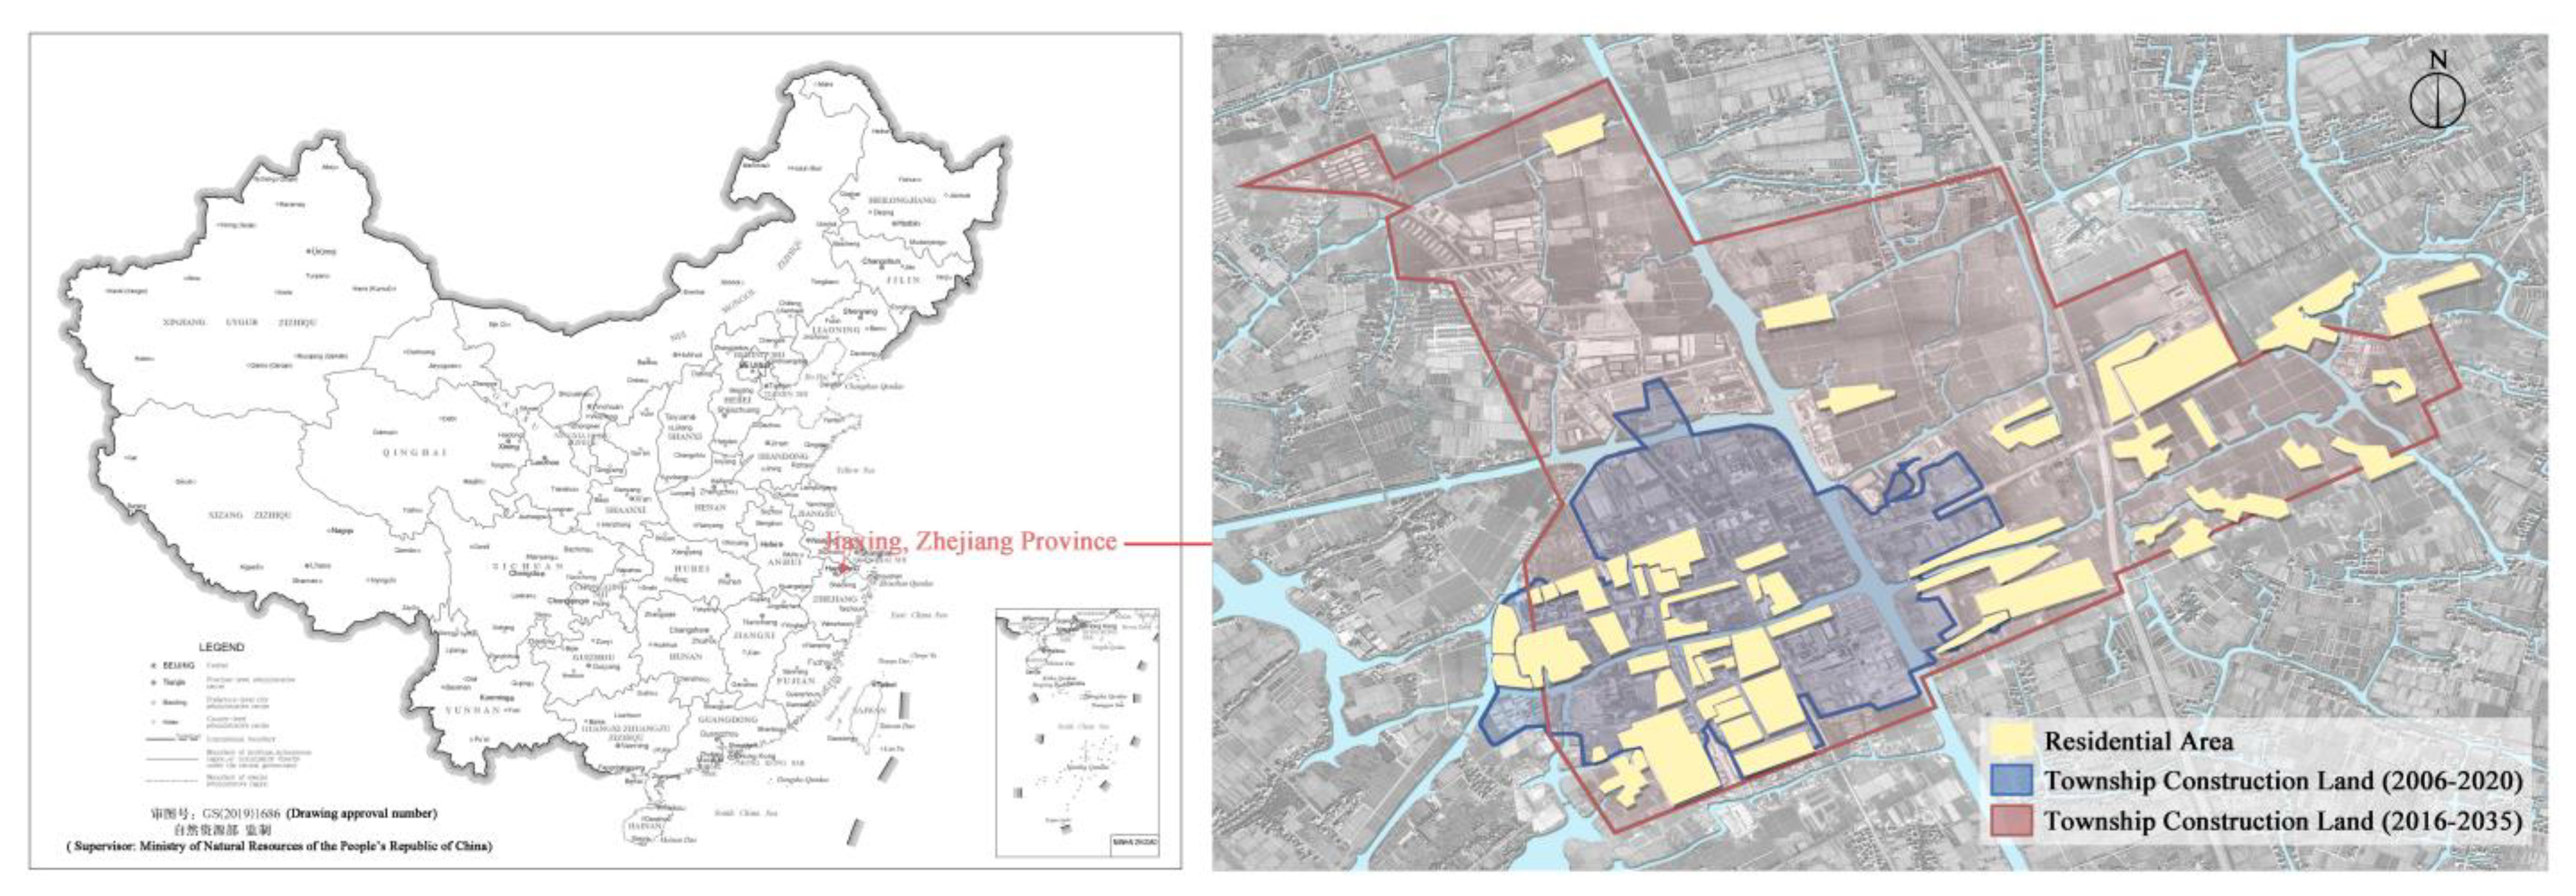
2.3.1. Sample Selection
2.3.2. Questionnaire Design and Investigation Process
3. Results
3.1. Classification of Residents’ Urbanization Stages
3.2. Demand Characteristics of Residents in Different Urbanization Stages
3.3. Matching Characteristics of the “Residential Area–Residential Facility” Relationship
4. Discussion
4.1. Guidance-Control Principle of Facility Programming Based on the Characteristics of Residents’ Needs
4.2. Programming Guidance-Control System of Public Service Facilities in Small Towns Based on the Pattern of Human–Land Urbanization
5. Conclusions
Author Contributions
Funding
Data Availability Statement
Acknowledgments
Conflicts of Interest
References
- Kaufmann, D.; Wittwer, S. Business centre or bedroom community? The development of employment in small and medium-sized Towns. Reg. Stud. 2019, 53, 1483–1493. [Google Scholar] [CrossRef]
- Ma, X. Study on economic development planning of small towns around big cities—A case study of Tung Chung Town, Panyu District, Guangzhou. Dev. Small Cities Towns 2007, 2, 16–20. [Google Scholar] [CrossRef]
- Caselli, B.; Ventura, P.; Zazzi, M. Performance-based spatial monitoring. An interpretative model for long-term shrinking medium-small Italian towns. Sustain. Cities Soc. 2020, 53, 101924. [Google Scholar] [CrossRef]
- Yin, X.; Wang, J.; Li, Y.; Feng, Z.; Wang, Q. Are small towns really inefficient? a data envelopment analysis of sampled towns in Jiangsu Province, China. Land Use Policy 2021, 109, 105590. [Google Scholar] [CrossRef]
- Zhu, Y. In situ urbanization in rural China: Case studies from Fujian Province. Dev. Chang. 2000, 31, 413–434. [Google Scholar] [CrossRef]
- Farrell, K.; Westlund, H. China’s rapid urban ascent: An examination into the components of urban growth. Asian Geogr. 2018, 35, 85–106. [Google Scholar] [CrossRef] [Green Version]
- Chen, X.; Wang, H.; Lei, C. Spatial evolution characteristics and subjective dynamic mechanism of Suzhou Cities and Towns. In Proceedings of the Sharing and Quality—The 2018 China Urban Planning Annual Conference, Hangzhou, China, 24–26 November 2018; pp. 1233–1242. [Google Scholar]
- Lu, L. Spatial Development Pattern of Suzhou Villages and Towns in New Urbanization. Master’s Thesis, Suzhou University of Science and Technology, Suzhou, China, 2015. [Google Scholar]
- McGee, T. The Emergence of Desakota Regions in Asia: Expanding a Hypothesis; University of Hawaii Press: Honolulu, HI, USA, 1991; pp. 3–25. [Google Scholar]
- Halfacree, K.H. Urban–rural continuum. In International Encyclopedia of Human Geography; Kitchin, R., Thrift, N., Eds.; Elsevier: Oxford, UK, 2009; pp. 119–124. [Google Scholar]
- Qiu, Z.; Hua, Y.; Wang, Y.; Song, J.; Wang, Z. A tentative study of the elderly human settlements in Urban-insertion reservoir resettlement communities. Archit. Cult. 2020, 132–134. [Google Scholar]
- Yan, Q. Discrimination of the concept of Small Towns. Planners 2010, 26, 118–121. [Google Scholar] [CrossRef]
- Gong, W.; Zhou, J. Exploring new planning mode for new socialist countryside construction—Taking Beishan Village of Nanping Town in Zhuhai City as an example. Planners 2007, 55–59. [Google Scholar]
- Fan, L. Analysis of process and characteristics of Sunan rural urbanization from the perspective of social space: A case study of Suzhou. Urban Plan. Forum 2015, 4, 27–35. [Google Scholar] [CrossRef]
- Li, L. Study on the Layout of Rural Public Service Facilities in the Surrounding Areas of Big Cities from the Perspective of Life Circle Theory. Master’s Thesis, Huazhong University of Science and Technology, Wuhan, China, 2018. [Google Scholar]
- Qiu, Z.; Hua, Y.; Wang, Y.; Wang, Z. Analysis of resettlement community in town based on “Environmental Transformation Theory”. Huazhong Archit. 2022, 40, 152–155. [Google Scholar] [CrossRef]
- Qiu, Z.; Hua, Y.; Wang, Y.; Wang, Z. Research on the features and mechanism of behavior-oriented “adapted use” of the resettlement community in towns. Archit. J. 2021, 114–119. [Google Scholar]
- Zhou, C.; Mo, W.; Huang, Z. The analysis on distribution characteristics of basic public service facilities of towns in Chongqing. Econ. Geogr. 2018, 38, 53–60. [Google Scholar] [CrossRef]
- Ruth, M.; Franklin, R.S. Livability for all? conceptual limits and practical implications. Appl. Geogr. 2014, 49, 18–23. [Google Scholar] [CrossRef] [Green Version]
- Atkinson, R. The small towns conundrum: What do we do about them? Reg. Stat. 2019, 9, 3–19. [Google Scholar] [CrossRef]
- Bosworth, G.; Annibal, I.; Carroll, T.; Price, L.; Sellick, J.; Shepherd, J. Empowering local action through neo-endogenous development; the case of LEADER in England. Sociol. Rural. 2016, 56, 427–449. [Google Scholar] [CrossRef]
- CEC. Green Paper on Territorial Cohesion: Turning Territorial Diversity into Strength; Office for Official Publications of the European Communities: Luxembourg, 2008. [Google Scholar]
- Zhang, C. The practice of rural development in EU—Taking the LEADER series plan as an example. World Agric. 2011, 8, 10–15. [Google Scholar] [CrossRef]
- Cheng, C.; Chen, W. Collaborative governance: Grassroots logic of grassroots governance. Dyn. Soc. Sci. 2023, 5–14. [Google Scholar]
- Shi, Y. Study on the Evaluation and Influence Mechanism of the People Urbanization Based on the Differentiation of Villagers’ Settlement in Suzhou. Master’s Thesis, Suzhou University of Science and Technology, Suzhou, China, 2018. [Google Scholar]
- Wang, X. The Quality of China’s Urbanization-Based on Citizenization. Ph.D. Thesis, Nankai University, Tianjin, China, 2013. [Google Scholar]
- Liu, C.; Xu, J. Second generation peasant workers and their citizenization. China Popul. Resour. Environ. 2007, 17, 6–12. [Google Scholar] [CrossRef]
- Yu, M. Research on Construction Mode and Strategy of Ankang Migration Relocation and Resettlement Areas under the Background of New Urbanization. Ph.D. Thesis, Xi’an University of Architecture and Technology, Xi’an, China, 2017. [Google Scholar]
- Li, Y. Study on the Transformation of Living Environment caused by Rapid Urbanization—A Case Study of H Community in Suzhou City. Master’s Thesis, Tongji University, Shanghai, China, 2008. [Google Scholar]
- Puren, K.; Roos, V.; Coetzee, H. Sense of place: Using people’s experiences in relation to a rural landscape to inform spatial planning guidelines. Int. Plan. Stud. 2018, 23, 16–36. [Google Scholar] [CrossRef]
- Li, B.; Fan, J.; Li, H. Study on the change of habitation environment of the rural areas in small towns precincts: Taking Chuansha Town of Shanghai as example. Archit. J. 2012, 11, 72–77. [Google Scholar] [CrossRef]
- Hua, Y.; Qiu, Z.; Luo, W.; Wang, Y.; Wang, Z. Correlation between elderly migrants’ needs and environmental adaptability: A discussion based on human urbanization features. Int. J. Environ. Res. Public Health 2021, 18, 5068. [Google Scholar] [CrossRef]
- Shen, J. Evaluation and Study on the Walkability of Built Environment in Urban Neighborhood under the Perspective of Needs—A Case Study of Wuhan. Ph.D. Thesis, Wuhan University, Wuhan, China, 2019. [Google Scholar]
- Jin, X.; Xiang, Y.; Weber, K.; Liu, Y. Motivation and involvement in adventure tourism activities: A Chinese tourists’ perspective. Asia Pac. J. Tour. Res. 2019, 24, 1066–1078. [Google Scholar] [CrossRef]
- Ye, C.; Ma, X.; Cai, Y.; Gao, F. The countryside under multiple high-tension lines: A perspective on the rural construction of Heping Village, Shanghai. J. Rural. Stud. 2018, 62, 53–61. [Google Scholar] [CrossRef]
- Zhu, W.; Zhao, G.; Liang, S. Demand and configuration of rural public service facilities under the background of rural revitalization. In Proceedings of the 2020/2021 China Urban Planning Annual Conference, Chengdu, China, 25–27 September 2021; pp. 537–548. [Google Scholar]
- Chen, L.; Yan, L.; Wang, Y. Study on supporting standards of village public service facilities in Beijing. In Proceedings of the 2020/2021 China Urban Planning Annual Conference, Chengdu, China, 25–27 September 2021; pp. 344–355. [Google Scholar]
- Liu, S. Types and structural differences of farmers’ public service demand in ethnic areas. Gansu Soc. Sci. 2016, 6, 172–177. [Google Scholar] [CrossRef]
- Maslow, A.H. A theory of human motivation. Psychol. Rev. 1943, 50, 370–396. [Google Scholar] [CrossRef] [Green Version]
- Desmet, P.; Fokkinga, S. Beyond Maslow’s pyramid: Introducing a typology of thirteen fundamental needs for human-centered design. Multimodal Technol. Interact. 2020, 4, 38. [Google Scholar] [CrossRef]
- Yao, J. Thinking about modern community planning and design under Maslow’s Needs Theory. Planners 2015, 31, 140–144. [Google Scholar] [CrossRef]
- Schneider, B.; Alderfer, C.P. Three studies of measures of need satisfaction in organizations. Adm. Sci. Q. 1973, 18, 489–505. [Google Scholar] [CrossRef]
- Tang, Y. Research and suggestions on the physical and mental needs of the elderly from the perspective of aging of population—Analysis based on ERG Theoretical Model. J. Nanjing Arts Inst. (Fine Arts Des.) 2020, 157–164. [Google Scholar] [CrossRef]
- Alderfer, C.P. An empirical test of a new theory of human needs. Organ. Behav. Hum. Perform. 1969, 4, 142–175. [Google Scholar] [CrossRef]
- Poulou, M.S.; Norwich, B. Adolescent students’ psychological needs: Development of an existence, relatedness, and growth needs scale. Int. J. Sch. Educ. Psychol. 2019, 7, 75–83. [Google Scholar] [CrossRef]
- Alderfer, C.P. The methodology of organizational diagnosis. Prof. Psychol. 1980, 11, 459–468. [Google Scholar] [CrossRef]
- Parasuraman, A.; Zeithaml, V.A.; Berry, L.L. A conceptual model of service quality and its implications for future research. J. Mark. 1985, 49, 41–50. [Google Scholar] [CrossRef]
- Obayomi, A.B.; Ogunbayo, O.T. User’s satisfaction with private housing estates in abuja using analytical hierarchy process (AHP). Intell. Build. Int. 2021, 15, 21–30. [Google Scholar] [CrossRef]
- Martilla, J.A.; James, J.C. Importance-performance analysis. J. Mark. 1977, 41, 77–79. [Google Scholar] [CrossRef]
- Kano, N. Attractive quality and must be quality. J. Jpn. Soc. Qual. Control 1984, 14, 38–48. [Google Scholar]
- Song, D.; Xu, Y.; Gu, J.; Zhao, X. Demand weights of shower space for the self-care elderly based on Kano Model. Packag. Eng. 2018, 39, 122–127. [Google Scholar] [CrossRef]
- Shao, J.; Zhang, H.; Liu, J. Quality evaluation of square space based on the aging-friendly City: Central city plaza in Harbin. Build. Energy Effic. 2018, 46, 78–83. [Google Scholar] [CrossRef]
- Li, S.; Duan, L. Exploration on the paths to targeted identification of demands for public service in urban-Rural continuum—Founded on Costumer Delight Theory and Kano Model. Public Gov. Res. 2019, 31, 29–34. [Google Scholar] [CrossRef]
- Hartono, M.; Chuan, T.K. How the Kano model contributes to Kansei engineering in services. Ergonomics 2011, 54, 987–1004. [Google Scholar] [CrossRef] [PubMed] [Green Version]
- Pizam, A.; Shapoval, V.; Ellis, T. Customer satisfaction and its measurement in hospitality enterprises: A revisit and update. Int. J. Contemp. Hosp. Manag. 2016, 28, 2–35. [Google Scholar] [CrossRef]
- Yang, C.-C. The refined Kano’s Model and its application. Total. Qual. Manag. Bus. Excel. 2005, 16, 1127–1137. [Google Scholar] [CrossRef]
- Qiao, L.; Zhang, Y. Analysis of MOOC quality requirements for landscape architecture based on the KANO Model in the context of the COVID-19 epidemic. Sustainability 2022, 14, 15775. [Google Scholar] [CrossRef]
- Matzler, K.; Hinterhuber, H.H.; Bailom, F.; Sauerwein, E. How to delight your customers. J. Prod. Brand Manag. 1996, 5, 6–18. [Google Scholar] [CrossRef]
- Wu, Y. Study on the Integrated Planning Direction and Control Method of Above-Ground and Underground in Urban Center. Master’s Thesis, Southeast University, Nanjing, China, 2019. [Google Scholar]


| Urban-Biased Residential Areas | Rural-Biased Residential Areas | ||
|---|---|---|---|
| Urban community area | Apartment resettlement area | Homestead resettlement area | Rural settlement |
 |  |  | |
| Types | Facilities | |
|---|---|---|
| Nonrural facilities | Education | Kindergarten, primary school, junior school, senior high school, training institution, adult vocational and technical school |
| Medical | Clinic, hospital, specialized clinic, emergency medical site (nucleic- acid-testing site), Hugh sanatorium | |
| Cultural and Sports | Outdoor sports ground, indoor sports venue, cultural activity center, exhibition hall | |
| Social Welfare | Home aged care service center, nursing home, service station for the disabled, social welfare institute, villager canteen | |
| Administration | Neighborhood (village) service center | |
| Commerce | Grocery, agricultural market, food store, sales and maintenance department of non-motor vehicles, hardware store, pharmacy, department store, book and video store, cultural goods store, express/postal service station, self-service cabinet, bank, telecom business hall, insurance institution, restaurant/teahouse, beauty and hair salon, photographic studio, public bathroom | |
| Infrastructure | Bus station, motor vehicle parking lot, public toilet, garbage collection point | |
| Productive Service (Tourism, etc.) | Tourist reception center, hotel/homestay, tourist souvenir shop | |
| Rural facilities | Productive Service (Agriculture, etc.) | Agricultural machine shop, agricultural materials shop, grain-drying site, agricultural product storage station, product sales site, agricultural product acquisition station, farm tool storage station, agricultural technical education station, agricultural cooperative |
| Cultural and Sports | Cultural auditorium, ancestral hall, temple, film-screening venue, broadcasting station | |
| Criteria/Attributes | Dysfunctional | |||||
|---|---|---|---|---|---|---|
| Satisfied | It Should Be That Way | I Am Indifferent | I Can Live with It | Dissatisfied | ||
| Functional | Satisfied | Q | A | A | A | O |
| It should be that way | R | I | I | I | M | |
| I am indifferent | R | I | I | I | M | |
| I can live with it | R | I | I | I | M | |
| Dissatisfied | R | R | R | R | Q | |
| Type | Facility and Service | If There Is Such a Facility Nearby | If There Is No Such Facility Nearby | ||||||||
|---|---|---|---|---|---|---|---|---|---|---|---|
| Satisfied | It Should Be That Way | I Am Indifferent | I Can Live with It | Dissatisfied | Satisfied | It Should Be That Way | I Am Indifferent | I Can Live with It | Dissatisfied | ||
| Medical | Clinic | ||||||||||
| Hospital | |||||||||||
| …… | …… | ||||||||||
| Types | Facilities | Group A | Group B | Group C | Group D | Cognitive Attribute * | ||||||||
|---|---|---|---|---|---|---|---|---|---|---|---|---|---|---|
| Better | |Worse| | Better | |Worse| | Better | |Worse| | Better | |Worse| | A | B | C | D | |||
| Nonrural facilities | Medical | Clinic | 0.4286 | 0.6571 | 0.2444 | 0.7444 | 0.4694 | 0.4184 | 0.3448 | 0.5517 | 1 | 1 | 2 | 2 |
| Hospital | 0.6857 | 0.4000 | 0.3111 | 0.8111 | 0.5464 | 0.2990 | 0.1724 | 0.8276 | 2 | 2 | 2 | 1 | ||
| Specialized clinic | 0.4412 | 0.1765 | 0.3889 | 0.3889 | 0.5052 | 0.1546 | 0.3793 | 0.2414 | 4 | 3 | 3 | 3 | ||
| Emergency medical site (Nucleic-acid-testing site) | 0.4571 | 0.7143 | 0.1556 | 0.8778 | 0.5625 | 0.4583 | 0.3103 | 0.8276 | 2 | 1 | 2 | 2 | ||
| Hugh sanatorium | 0.3939 | 0.1212 | 0.5444 | 0.2333 | 0.3918 | 0.0619 | 0.4138 | 0.1034 | 4 | 3 | 3 | 3 | ||
| Cultural and sports | Outdoor sports ground | 0.6765 | 0.2941 | 0.3556 | 0.5778 | 0.5104 | 0.1354 | 0.4483 | 0.4483 | 3 | 2 | 3 | 2 | |
| Indoor sports venue | 0.7429 | 0.0286 | 0.5667 | 0.3222 | 0.4896 | 0.0521 | 0.5517 | 0.1034 | 3 | 3 | 3 | 3 | ||
| Cultural activity center | 0.6471 | 0.2647 | 0.4222 | 0.5111 | 0.5361 | 0.1546 | 0.4138 | 0.3448 | 3 | 3 | 3 | 3 | ||
| Exhibition hall | 0.6286 | 0.0286 | 0.5111 | 0.1111 | 0.4639 | 0.0309 | 0.4483 | 0.1379 | 3 | 3 | 3 | 3 | ||
| Education | Kindergarten | 0.5429 | 0.4571 | 0.1000 | 0.9444 | 0.3196 | 0.4536 | 0.1034 | 0.9310 | 2 | 1 | 1 | 1 | |
| Primary school | 0.4571 | 0.5143 | 0.1111 | 0.9000 | 0.2887 | 0.4021 | 0.1034 | 0.9655 | 2 | 1 | 1 | 1 | ||
| Junior school | 0.5143 | 0.4571 | 0.1889 | 0.8222 | 0.3711 | 0.3299 | 0.1034 | 0.9310 | 2 | 1 | 2 | 1 | ||
| Senior high school | 0.5294 | 0.2353 | 0.3111 | 0.5000 | 0.3958 | 0.2292 | 0.3103 | 0.3793 | 3 | 3 | 2 | 3 | ||
| Training institution | 0.3824 | 0.0588 | 0.5222 | 0.2667 | 0.3229 | 0.1250 | 0.2414 | 0.2069 | 4 | 3 | 4 | 3 | ||
| Adult vocational and technical school | 0.2857 | 0.0286 | 0.4111 | 0.2333 | 0.2577 | 0.0515 | 0.2414 | 0.1379 | 4 | 3 | 4 | 3 | ||
| Social welfare | Home aged care service center | 0.6176 | 0.5294 | 0.2222 | 0.6444 | 0.4536 | 0.2268 | 0.3793 | 0.3103 | 2 | 1 | 2 | 3 | |
| Nursing home | 0.4857 | 0.2571 | 0.3000 | 0.4889 | 0.3608 | 0.1546 | 0.3793 | 0.2759 | 3 | 3 | 3 | 3 | ||
| Service station for the disabled | 0.4412 | 0.2059 | 0.2556 | 0.4667 | 0.2784 | 0.1237 | 0.3103 | 0.2759 | 4 | 4 | 4 | 3 | ||
| Social welfare institute | 0.5143 | 0.1143 | 0.3000 | 0.4444 | 0.3333 | 0.1042 | 0.3448 | 0.1379 | 3 | 3 | 4 | 3 | ||
| Villager canteen | 0.5588 | 0.0882 | 0.4889 | 0.2556 | 0.4433 | 0.0722 | 0.3793 | 0.0690 | 3 | 3 | 3 | 3 | ||
| Administration | Neighborhood (village) service center | 0.3429 | 0.8857 | 0.1222 | 0.9444 | 0.3673 | 0.5000 | 0.2069 | 0.6552 | 1 | 1 | 2 | 1 | |
| Commerce | Agricultural market | 0.6286 | 0.7429 | 0.1667 | 0.9889 | 0.5876 | 0.5670 | 0.1724 | 0.9655 | 2 | 1 | 2 | 1 | |
| Grocery | 0.6857 | 0.6000 | 0.1889 | 0.9444 | 0.5102 | 0.5306 | 0.2069 | 0.9310 | 2 | 1 | 2 | 1 | ||
| Food store | 0.6857 | 0.3143 | 0.3111 | 0.7667 | 0.5567 | 0.2887 | 0.2069 | 0.7586 | 2 | 2 | 2 | 1 | ||
| Pharmacy | 0.4571 | 0.6286 | 0.1111 | 0.9222 | 0.4694 | 0.4490 | 0.1379 | 0.8966 | 2 | 1 | 2 | 1 | ||
| Bank | 0.4000 | 0.4000 | 0.1444 | 0.9667 | 0.4375 | 0.3750 | 0.1379 | 0.8966 | 1 | 1 | 2 | 1 | ||
| Telecom business hall | 0.2571 | 0.1714 | 0.1444 | 0.8111 | 0.3542 | 0.2708 | 0.1034 | 0.6897 | 4 | 1 | 1 | 1 | ||
| Beauty and hair salon | 0.6000 | 0.4571 | 0.1444 | 0.9111 | 0.4479 | 0.4375 | 0.1724 | 0.7931 | 2 | 1 | 2 | 1 | ||
| Department store | 0.5429 | 0.1429 | 0.3333 | 0.6556 | 0.6392 | 0.2165 | 0.3103 | 0.6207 | 3 | 2 | 2 | 2 | ||
| Cultural goods store | 0.3429 | 0.0857 | 0.2444 | 0.5889 | 0.3542 | 0.1354 | 0.0714 | 0.6071 | 4 | 1 | 4 | 1 | ||
| Insurance institution | 0.2000 | 0.0000 | 0.1910 | 0.4270 | 0.1771 | 0.0833 | 0.0357 | 0.2500 | 4 | 4 | 4 | 4 | ||
| Photographic studio | 0.3714 | 0.0857 | 0.2333 | 0.4222 | 0.1939 | 0.0714 | 0.0714 | 0.2500 | 4 | 4 | 4 | 4 | ||
| Public bathroom | 0.2000 | 0.0000 | 0.2809 | 0.3146 | 0.1237 | 0.0619 | 0.1034 | 0.2414 | 4 | 3 | 4 | 4 | ||
| Sales and maintenance department of non-motor vehicles | 0.4571 | 0.4571 | 0.1222 | 0.8444 | 0.2577 | 0.2165 | 0.1724 | 0.6207 | 2 | 1 | 1 | 1 | ||
| Hardware store | 0.3143 | 0.2000 | 0.1667 | 0.8444 | 0.2268 | 0.1546 | 0.0690 | 0.7931 | 4 | 1 | 4 | 1 | ||
| Express/postal service station | 0.4571 | 0.4286 | 0.1556 | 0.8889 | 0.4737 | 0.4632 | 0.2759 | 0.8621 | 2 | 1 | 2 | 2 | ||
| Self-service cabinet | 0.4571 | 0.2571 | 0.4333 | 0.3778 | 0.4227 | 0.2268 | 0.2069 | 0.5517 | 3 | 3 | 2 | 1 | ||
| Restaurant/teahouse | 0.5714 | 0.0857 | 0.3111 | 0.7444 | 0.4388 | 0.2959 | 0.3448 | 0.7241 | 3 | 2 | 2 | 2 | ||
| Infrastructure | Bus station | 0.4286 | 0.7714 | 0.1222 | 0.9444 | 0.4021 | 0.5670 | 0.1034 | 0.9655 | 1 | 1 | 2 | 1 | |
| Motor vehicle parking lot | 0.4571 | 0.5429 | 0.2000 | 0.8444 | 0.4694 | 0.5918 | 0.1724 | 0.8621 | 2 | 1 | 2 | 1 | ||
| Public toilet | 0.3824 | 0.7059 | 0.1000 | 0.9778 | 0.3830 | 0.5213 | 0.1034 | 1.0000 | 1 | 1 | 2 | 1 | ||
| Garbage collection point | 0.3030 | 0.8485 | 0.1111 | 1.0000 | 0.4157 | 0.6966 | 0.1034 | 1.0000 | 1 | 1 | 2 | 1 | ||
| Productive Service (Tourism, etc.) | Tourist reception center | 0.3714 | 0.0286 | 0.4205 | 0.1591 | 0.2577 | 0.0103 | 0.3448 | 0.0345 | 4 | 3 | 4 | 3 | |
| Tourist souvenir shop | 0.3235 | 0.0000 | 0.4659 | 0.0795 | 0.2474 | 0.0103 | 0.3103 | 0.0000 | 4 | 3 | 4 | 3 | ||
| Hotel/Homestay | 0.2941 | 0.1765 | 0.1573 | 0.5730 | 0.1939 | 0.0714 | 0.0690 | 0.4138 | 4 | 1 | 4 | 4 | ||
| Rural facilities | Productive service (Agriculture, etc.) | Agricultural machine shop | 0.3143 | 0.3143 | 0.0778 | 0.6667 | 0.1895 | 0.0526 | 0.1481 | 0.0370 | 1 | 1 | 4 | 4 |
| Agricultural materials shop | 0.2571 | 0.6571 | 0.0667 | 0.7889 | 0.2128 | 0.1064 | 0.1481 | 0.2222 | 1 | 1 | 4 | 4 | ||
| Grain-drying site | 0.2000 | 0.1143 | 0.1124 | 0.2022 | 0.1563 | 0.0104 | 0.1034 | 0.0345 | 4 | 4 | 4 | 4 | ||
| Agricultural product storage station | 0.2353 | 0.1176 | 0.1910 | 0.1798 | 0.1340 | 0.0103 | 0.0690 | 0.0000 | 4 | 4 | 4 | 4 | ||
| Product sales site | 0.4571 | 0.4000 | 0.2444 | 0.4444 | 0.2577 | 0.0000 | 0.1379 | 0.0690 | 2 | 4 | 4 | 4 | ||
| Agricultural product acquisition station | 0.3429 | 0.4286 | 0.2778 | 0.3889 | 0.2371 | 0.0000 | 0.1034 | 0.0000 | 1 | 3 | 4 | 4 | ||
| Farm tool storage station | 0.1250 | 0.0625 | 0.1744 | 0.1163 | 0.1809 | 0.0000 | 0.0690 | 0.0000 | 4 | 4 | 4 | 4 | ||
| Agricultural technical education station | 0.5714 | 0.1143 | 0.4333 | 0.2889 | 0.2105 | 0.0000 | 0.1034 | 0.0345 | 3 | 3 | 4 | 4 | ||
| Agricultural cooperative | 0.4571 | 0.2857 | 0.3371 | 0.2809 | 0.1354 | 0.0313 | 0.1034 | 0.0345 | 3 | 3 | 4 | 4 | ||
| Cultural and sports | Cultural auditorium | 0.5429 | 0.7143 | 0.3333 | 0.7333 | 0.4536 | 0.2062 | 0.2069 | 0.3103 | 2 | 2 | 3 | 4 | |
| Ancestral hall | 0.3714 | 0.1714 | 0.3483 | 0.2584 | 0.1563 | 0.0000 | 0.0357 | 0.0357 | 4 | 3 | 4 | 4 | ||
| Temple | 0.4000 | 0.2000 | 0.3596 | 0.2360 | 0.2083 | 0.0208 | 0.0714 | 0.0357 | 4 | 3 | 4 | 4 | ||
| Film-screening venue | 0.7714 | 0.2571 | 0.6111 | 0.2556 | 0.4896 | 0.0729 | 0.5517 | 0.1034 | 3 | 3 | 3 | 3 | ||
| Broadcasting station | 0.3714 | 0.0571 | 0.2809 | 0.1798 | 0.2688 | 0.0108 | 0.2500 | 0.0000 | 4 | 3 | 4 | 3 | ||
| Population Attributes | Option | Group A | Group B | Group C | Group D | p | ||
|---|---|---|---|---|---|---|---|---|
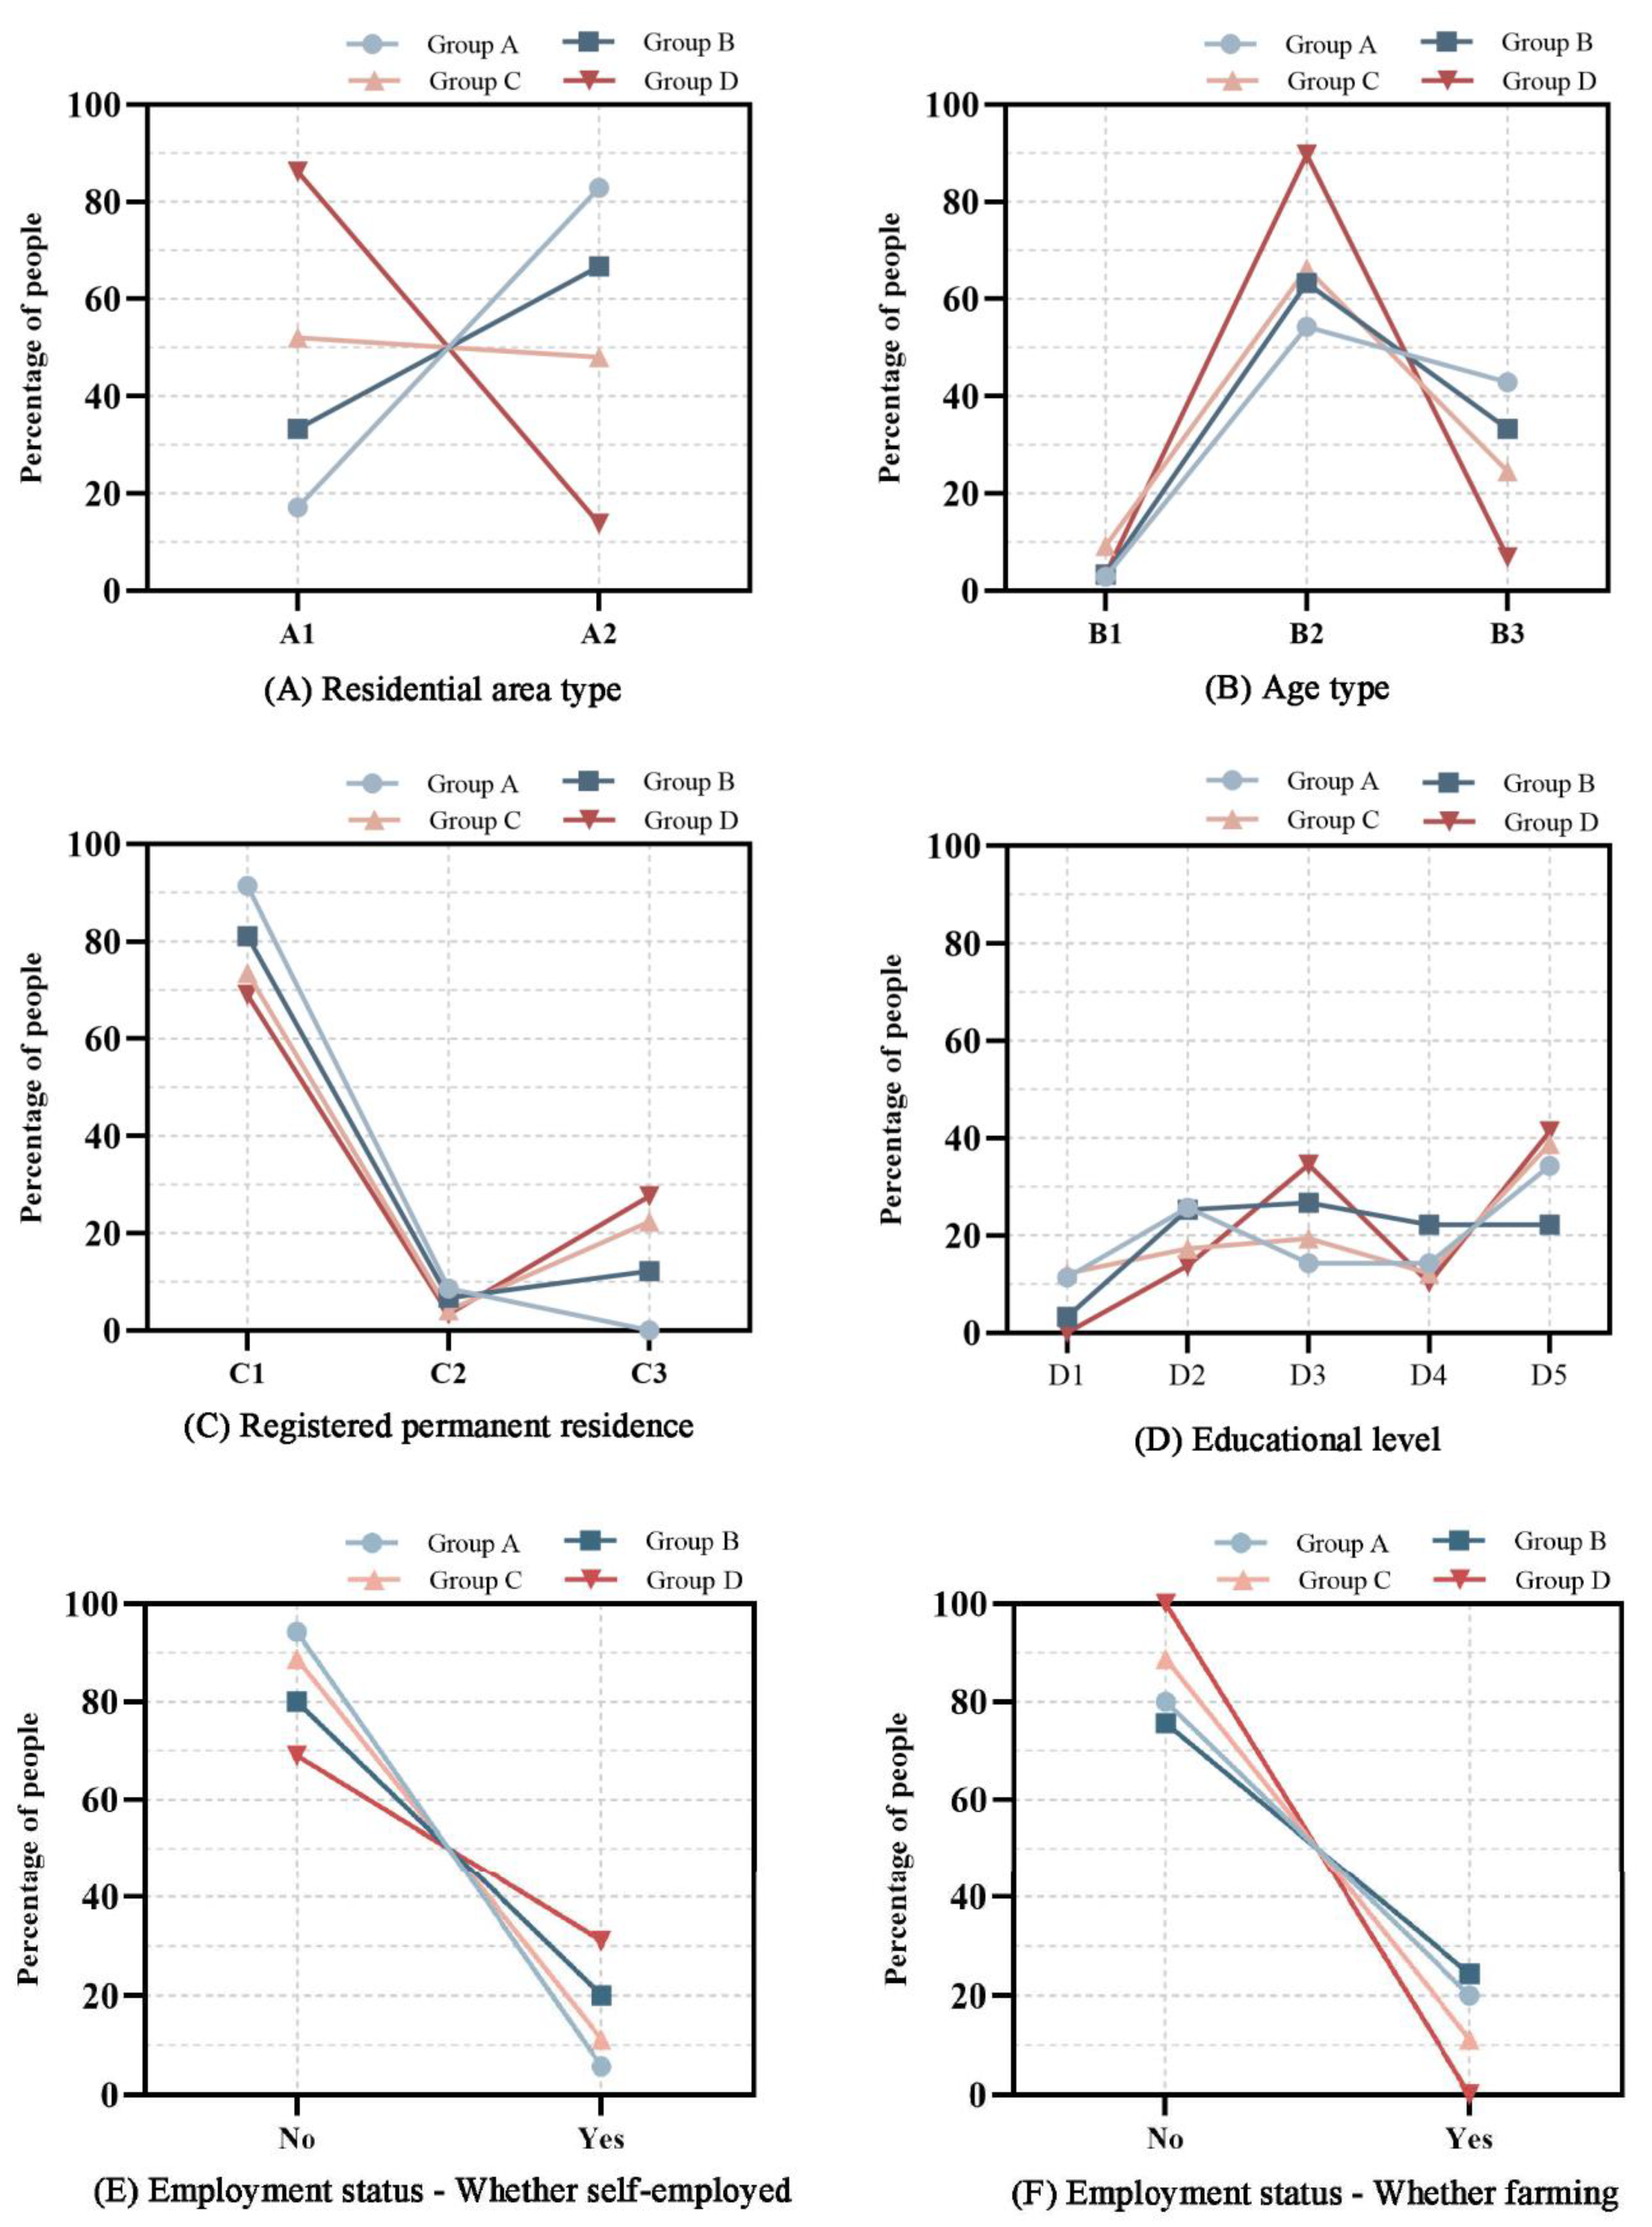
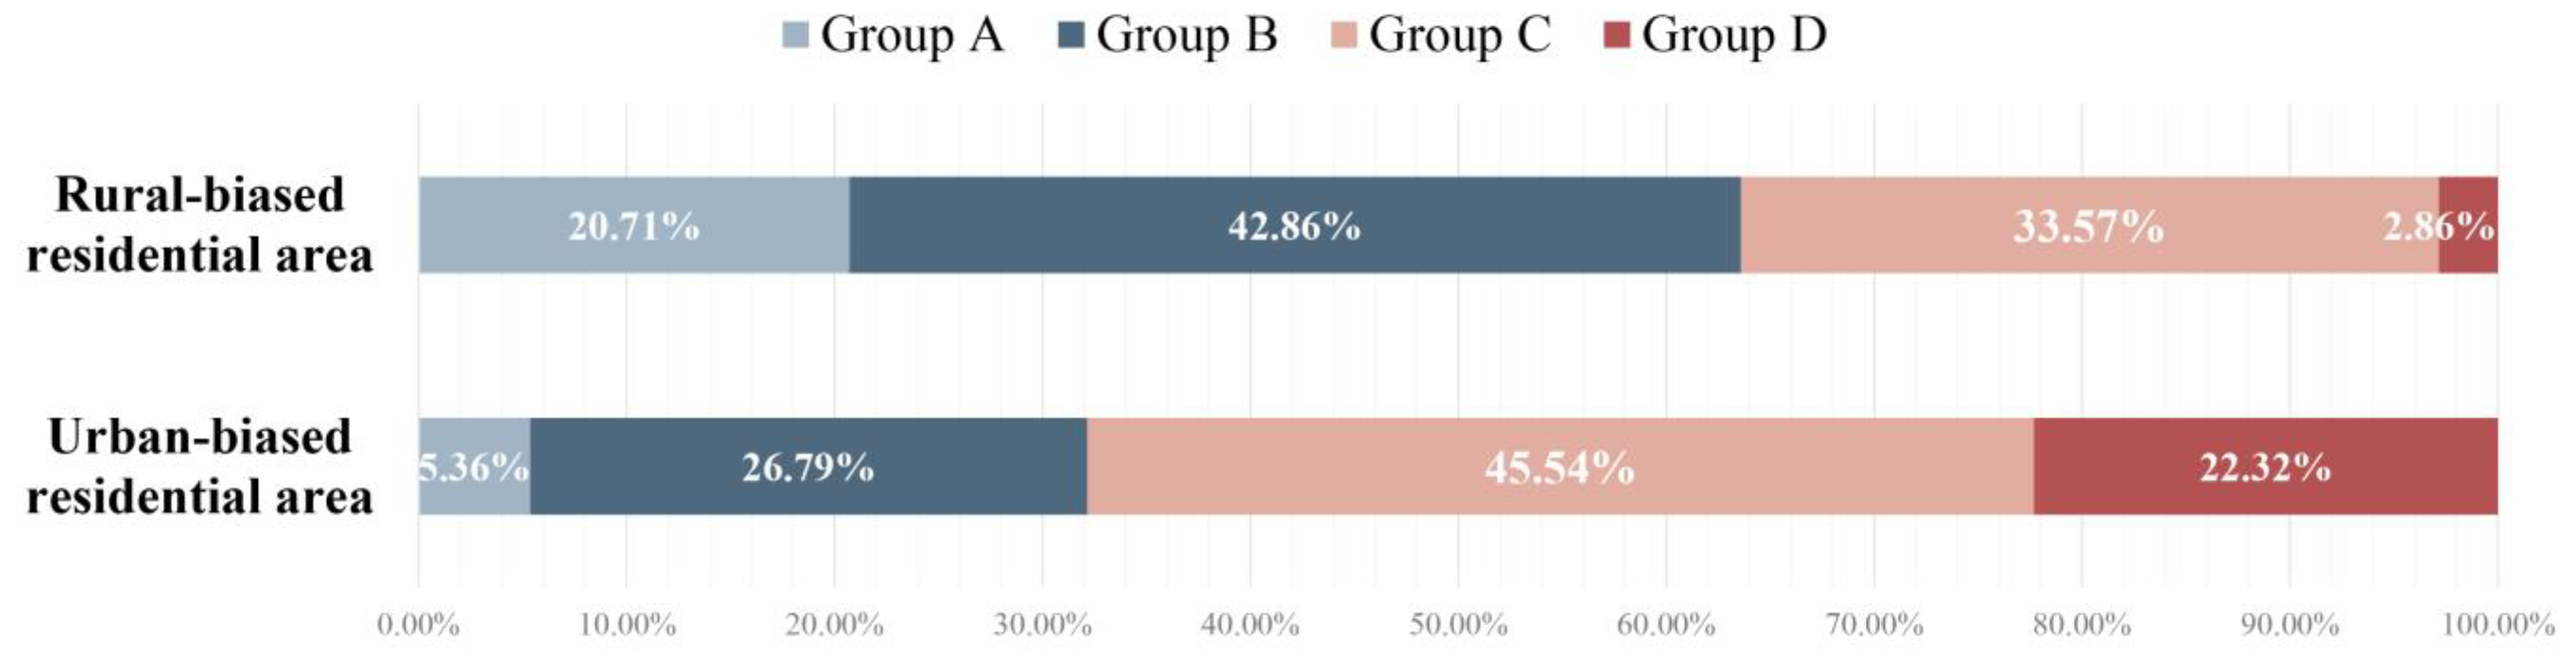
| (A) Residential Area Type | A1 | Urban-biased residential area | 17.1% | 33.3% | 52.0% | 86.2% | 0.000 ** | |
| A2 | Rural-biased residential area | 82.9% | 66.7% | 48.0% | 13.8% | |||
| (B) Age Type | B1 | Youth (18–25) | 2.9% | 3.3% | 9.2% | 3.4% | 0.015 * | |
| B2 | Middle-aged (25–65) | 54.3% | 63.3% | 66.3% | 89.7% | |||
| B3 | Seniors (over 65) | 42.9% | 33.3% | 24.5% | 6.9% | |||
| (C) Registered Permanent Address | C1 | Rural | 91.4% | 81.1% | 73.5% | 69.0% | 0.029 * | |
| C2 | Urban (experienced rural–urban migration) | 8.6% | 6.7% | 4.1% | 3.4% | |||
| C3 | Urban | 0 | 12.2% | 22.4% | 27.6% | |||
| (D) Education Level | D1 | Did not complete primary School | 11.4% | 3.3% | 12.2% | 0 | 0.028 * | |
| D2 | Completed primary school | 25.7% | 25.3% | 17.3% | 13.8% | |||
| D3 | Completed junior school | 14.3% | 26.7% | 19.4% | 34.5% | |||
| D4 | Completed senior high school | 14.3% | 22.2% | 12.2% | 10.3% | |||
| D5 | Completed university and above | 34.3% | 22.2% | 38.8% | 41.4% | |||
| (E) Employment Status | Whether self-employed | - | No | 94.3% | 80.0% | 88.8% | 69.0% | 0.015 * |
| - | Yes | 5.7% | 20.0% | 11.2% | 31.0% | |||
| Whether farming | - | No | 80.0% | 75.6% | 88.8% | 100.0% | 0.006 ** | |
| - | Yes | 20.0% | 24.4% | 11.2% | 0 | |||
| The Relationship between Human–Land Urbanization Patterns | Differentiation Items (Rural-Biased Residential Area) | Common Items | Differentiation Items (Urban-Biased Residential Area) | ||
|---|---|---|---|---|---|
| Land ≈ Human/Land (Urban-Biased Residential Area) > Human (Elderly, Low Education Level, Rural Household Registration, Engaged in Farming) | |||||
| Land ≈ Human/Land (Urban-Biased Residential Area) < Human (Young, High Education Level, Urban Household Registration, Self-Employed) | |||||
| Required Items | Medical | Clinic, Hospital, Emergency medical site (Nucleic-acid-testing site) | |||
| Education | Kindergarten, Primary school, Junior school | Senior high school | |||
| Cultural and sports | Cultural auditorium | Outdoor sports ground | |||
| Social welfare | Home aged care service center | ||||
| Administration | Neighborhood (village) service center | ||||
| Commerce | Agricultural market, Grocery, Food store, Pharmacy, Bank, Telecom business hall, Beauty and hair salon, Department store, Sales and maintenance department of non-motor vehicles, Express/postal service station, Restaurant/teahouse | Cultural goods store, Hardware store, Self-service cabinet | |||
| Infrastructure | Bus station, Motor vehicle parking lot, Public toilet, Garbage collection point | ||||
| Productive Service | Agricultural machine shop, Agricultural materials shop | ||||
| Optional Items 1 | Education | Senior high school | |||
| Cultural and sports | Outdoor sports ground | Cultural auditorium | |||
| Commerce | Cultural goods store, Hardware store, Self-service cabinet | ||||
| Productive Service | Product sales site, Agricultural product acquisition station | Hotel/Homestay | Agricultural machine shop, Agricultural materials shop | ||
| Optional Items 2 | Medical | Specialized clinic, Hugh sanatorium | |||
| Education | Training institution, Adult vocational and technical school | ||||
| Cultural and sports | Indoor sports venue, Cultural activity center, Exhibition hall, Ancestral hall, Temple, Film-screening venue, Broadcasting station | ||||
| Social welfare | Nursing home, Social welfare institute | Service station for the disabled | |||
| Commerce | Villager canteen, Public bathroom | ||||
| Productive Service | Tourist reception center, Tourist souvenir shop, Agricultural technical education station, Agricultural cooperative | Agricultural product acquisition station | |||
| Optional Items 3 | Social welfare | Service station for the disabled | |||
| Commerce | Insurance institution, Photographic studio | ||||
| Productive Service | Grain-drying site, Agricultural product storage station, Farm tool storage station | Product sales site | |||
Disclaimer/Publisher’s Note: The statements, opinions and data contained in all publications are solely those of the individual author(s) and contributor(s) and not of MDPI and/or the editor(s). MDPI and/or the editor(s) disclaim responsibility for any injury to people or property resulting from any ideas, methods, instructions or products referred to in the content. |
© 2023 by the authors. Licensee MDPI, Basel, Switzerland. This article is an open access article distributed under the terms and conditions of the Creative Commons Attribution (CC BY) license (https://creativecommons.org/licenses/by/4.0/).
Share and Cite
Qiu, Z.; Wang, Y.; Wang, J.; Wang, Z.; Zhou, Y. Needs Hierarchy for Public Service Facilities and Guidance-Control Programming in Small Chinese Towns Influenced by Complex Urbanization of Residents: The Evidence from Zhejiang. Land 2023, 12, 1205. https://doi.org/10.3390/land12061205
Qiu Z, Wang Y, Wang J, Wang Z, Zhou Y. Needs Hierarchy for Public Service Facilities and Guidance-Control Programming in Small Chinese Towns Influenced by Complex Urbanization of Residents: The Evidence from Zhejiang. Land. 2023; 12(6):1205. https://doi.org/10.3390/land12061205
Chicago/Turabian StyleQiu, Zhi, Yue Wang, Jie Wang, Zhu Wang, and Yi Zhou. 2023. "Needs Hierarchy for Public Service Facilities and Guidance-Control Programming in Small Chinese Towns Influenced by Complex Urbanization of Residents: The Evidence from Zhejiang" Land 12, no. 6: 1205. https://doi.org/10.3390/land12061205