Article

Enabling Regenerative Agriculture Using Remote Sensing and Machine Learning

by
Michael Gbenga Ogungbuyi
1,
Juan P. Guerschman
2,
Andrew M. Fischer
3,
Richard Azu Crabbe
4,
Caroline Mohammed
1,
Peter Scarth
2,
Phil Tickle
2,
Jason Whitehead
5 and
Matthew Tom Harrison
1,*
1
Tasmanian Institute of Agriculture, University of Tasmania, Launceston, TAS 7248, Australia
2
Cibo Labs Pty Ltd., 15 Andrew St., Point Arkwright, QLD 4573, Australia
3
Institute for Marine and Antarctic Studies, University of Tasmania, Launceston, TAS 7248, Australia
4
Gulbali Institute, Charles Sturt University, Albury, NSW 2640, Australia
5
Cape Herbert Pty Ltd., Blackstone Heights, TAS 7250, Australia
*
Author to whom correspondence should be addressed.
Land 2023, 12(6), 1142; https://doi.org/10.3390/land12061142
Submission received: 26 April 2023 / Revised: 15 May 2023 / Accepted: 23 May 2023 / Published: 29 May 2023

Abstract

:
The emergence of cloud computing, big data analytics, and machine learning has catalysed the use of remote sensing technologies to enable more timely management of sustainability indicators, given the uncertainty of future climate conditions. Here, we examine the potential of “regenerative agriculture”, as an adaptive grazing management strategy to minimise bare ground exposure while improving pasture productivity. High-intensity sheep grazing treatments were conducted in small fields (less than 1 ha) for short durations (typically less than 1 day). Paddocks were subsequently spelled to allow pasture biomass recovery (treatments comprising 3, 6, 9, 12, and 15 months), with each compared with controls characterised by lighter stocking rates for longer periods (2000 DSE/ha). Pastures were composed of wallaby grass (Austrodanthonia species), kangaroo grass (Themeda triandra), Phalaris (Phalaris aquatica), and cocksfoot (Dactylis glomerata), and were destructively sampled to estimate total standing dry matter (TSDM), standing green biomass, standing dry biomass and trampled biomass. We invoked a machine learning model forced with Sentinel-2 imagery to quantify TSDM, standing green and dry biomass. Faced with La Nina conditions, regenerative grazing did not significantly impact pasture productivity, with all treatments showing similar TSDM, green biomass and recovery. However, regenerative treatments significantly impacted litterfall and trampled material, with high-intensity grazing treatments trampling more biomass, increasing litter, enhancing surface organic matter and decomposition rates thereof. Pasture digestibility and sward uniformity were greatest for treatments with minimal spelling (3 months), whereas both standing senescent and trampled material were greater for the 15-month spelling treatment. TSDM prognostics from machine learning were lower than measured TSDM, although predictions from the machine learning approach closely matched observed spatiotemporal variability within and across treatments. The root mean square error between the measured and modelled TSDM was 903 kg DM/ha, which was less than the variability measured in the field. We conclude that regenerative grazing with short recovery periods (3–6 months) was more conducive to increasing pasture production under high rainfall conditions, and we speculate that – in this environment - high-intensity grazing with 3-month spelling is likely to improve soil organic carbon through increased litterfall and trampling. Our study paves the way for using machine learning with satellite imagery to quantify pasture biomass at small scales, enabling the management of pastures within small fields from afar.

1. Introduction

Grasslands comprise key terrestrial ecosystems, providing feed and habitat for domesticated livestock and wildlife globally [1,2,3]. Grasslands allow significant carbon sequestration [4,5] in addition to existing carbon stocks they prevent from entering the atmosphere [6,7]. The resilience of grasslands to extreme drought and future climate requires an innovative agroecosystem approach that promotes functional biological drivers (such as soil microbial activities) and adaptive grazing management [8,9]. One such adaptive technique is using regenerative grazing principles [8,10] to stimulate ecosystem functions through short, intense grazing, adjustable stocking rate, and multi-paddock-system at the farm level (1–100 ha) with long rest periods allowing pasture biomass and land to recover. Residual biomass from trampling effects associated with regenerative grazing plays a significant role in reducing bare ground, enabling soil health (through soil microbial functionality), litter conversion, soil aggregation and porosity, and carbon sequestration [8,11]. Stimulation of organic microbial activities through residual biomass and trampling effects of grazing livestock contrasts with conventional farming systems in developed nations (through the use of irrigation, synthetic fertilizers, etc.) [8]. In practice, evidence of regenerative grazing impacts on pasture biomass, litterfall, and decomposition tend to be based on anecdotal rather than quantitative evidence [11,12,13]. Since the current information is not experimentally driven, available monitoring tools have not been tested to understand their usefulness to end-users. Due to large land areas and the dynamic and spatially variable nature of grazing [14,15], physical monitoring of grassland conditions is often cumbersome, particularly where land areas are remote, large, and/or geographically challenging. The rise of satellite imagery, cloud computing, big data analytics, and machine learning have paved the way for innovative opportunities for land managers to remotely monitor crop, pasture, or grassland biomass from afar [16].
Conventional methods for monitoring pasture biomass and livestock utilisation (i.e., ground-based measurement and proximal sensing) are limited in terms of scope, and both spatial and temporal extent [17]. Previous research in Australia [18], the United Kingdom [19], New Zealand [20], and the United States [21] has reported limitations of ground sampling approaches (i.e., visual, rising plate meter, and destructive method by clipping) in quantifying the spatial variability of pasture biomass. By contrast, remote sensing provides timely spatiotemporal information that can predict the availability of feed prior to grazing [19], allowing for feed budgeting. However, in most cases, remote sensing of pasture biomass is not process-driven (i.e., based on vegetation indices); often the use of such reflectance indices at small field scales (e.g., less than 50 ha) is constrained by the resolution of the satellite imagery [19,22] and accurate calibration [23]. Remote sensing that considers process-based retrieval of pasture biomass and other biophysical variables may invoke site-specific modelling and machine-learning techniques [24]. Although some successes have been reported, physical-based techniques such as radiative transfer modelling and light use efficiency modelling can be prohibitive as they may require a set of parametric rules for different study locations [25,26,27]. However, machine learning techniques including artificial neural networks (ANN) [16], random forest (RF) [28], and support vector machine (SVM) [21] are not site-specific and can be used to retrieve pasture biomass estimates [22]. ANN [16] was used to estimate pasture biomass leveraging multitemporal Sentinel-2 data collected over dairy farms in Tasmania [16]. The study showed that the accuracy of ANN improved when meteorological variables were included in the model; indeed, much process-based modelling is based primarily on longitudinal measurements of climate at a given site [2,23,29]. However, process-based applications are required as an operational service to support farm management—what is often known as a decision support system (DSS) [16,17,30,31]—and are often limited by the accuracy of site-specific soil characterisation [32,33].
Previous estimates of pasture biomass at the field (paddock) scale with machine learning algorithms have used standing green vegetation as a proxy to quantify the actual biomass from the normalised difference vegetation index (NDVI) [21,28,34,35]. Information derived from NDVI can provide sufficient information about active photosynthetic [36] vegetation, whereas non-green senescent pasture species or dormant vegetation are often much more difficult to quantify due to their low reflectance in the near-infrared [37]. To successfully realise improved land-use sustainability through more timely, accurate biologically-intelligent monitoring of pasture sustainability indicators, more robust approaches are urgently needed [30,38,39,40]. This would also allow livestock farmers to better predict feed on offer (for total green and non-green forage) enabling planning of their stocking rate to maximise liveweight production while maximising environmental stewardship [32,33]. While a range of commercial technologies exists, outputs from many of these applications are site-specific and others have not been validated. This raises questions as to how well such applications predict pasture biomass outside their zone of calibration.
The launch of the European Space Agency’s Sentinel-2 satellites has enhanced the development of “agricultural technology” or “Ag-tech” companies offering products aimed at quantifying land surface conditions. One such company—“Cibo Labs” (https://www.cibolabs.com.au/; accessed on 1 December 2022)—uses a predictive time series machine learning approach to derive spectral information from Sentinel-2 data about local properties at the field scale. Cibo Labs uses pasture cuts to train and validate the total standing dry matter (TSDM) model. Several thousand fields from farms across Australia are used to train a deep neural network (DNN). Cibo Labs uses the dropout regularisation method to reduce overfitting and computational costs, hence improving the generalisation of the DNN [41]. This is achieved by randomly dropping units (i.e., hidden and visible layers) to improve the neural network’s performance during training. Hitherto the present study, Cibo Labs validated total standing dry matter (TSDM) estimates using 2000 field measured samples collected over two years from across eastern and northern Australia. Thirty-three percent of field sites were used to train a three-layer, multilayer perceptron regression model (MPRM) using a 50% dropout and a maximum norm constraint [42,43,44]. The remainder of the field samples were used for validation. The model was trained with 100 iterations (~16,000 epochs) before reaching a termination criterion characterised by a median prediction error of 295 ± 8 kg DM/ha.
While such predictive accuracy was within the variability of measured data, the study was primarily conducted using measurements taken from low-latitude environments (the Northern part of Australia). Additionally, previous investigations of Cibo Labs’ utility did not consider regenerative grazing principles implemented at the farm level. Therefore, it remains to be seen how well Cibo Labs performs in mid-latitude environments such as the island state of Tasmania, where cloud cover in winter and spring is frequent [45], as well as examine if the tool can support regenerative grazing at the farm level. Clouds reduce spatial and temporal coverage by reducing target clarity and increasing the time between clear useable images [16,46]. In the present study, we used a destructive sampling method to measure the total standing dry matter (kg DM/ha), equivalent to standing green and standing dry before and after grazing, with 3, 6, 9, 12, and 15 months of biomass regrowth. We applied regenerative grazing to the smaller plots of similar size (<1 ha), while three plots of size 10–50 ha were used as controls (i.e., business-as-usual grazing). Our hypothesis was that the treatment plots or disturbance caused by the high stocking density would account for the TSDM variability. The key aim was to examine the effects of regenerative grazing on TSDM productivity in the plots and whether Sentinel-2 imagery and the Cibo Labs model could estimate the TSDM at the plot level. This was conducted by comparing Cibo Labs estimates of TSDM with destructively sampled pasture biomass for a site in south-eastern Tasmania subject to sheep grazing treatments.
Our objectives were to thus provide insight into: (1) the effects of regenerative grazing on TSDM productivity, consumption, and trampling and (2) the usefulness of Sentinel-2 imagery and accuracy of the Cibo Labs model to estimate TSDM on effects of regenerative grazing at the farm level.

2. Materials and Methods
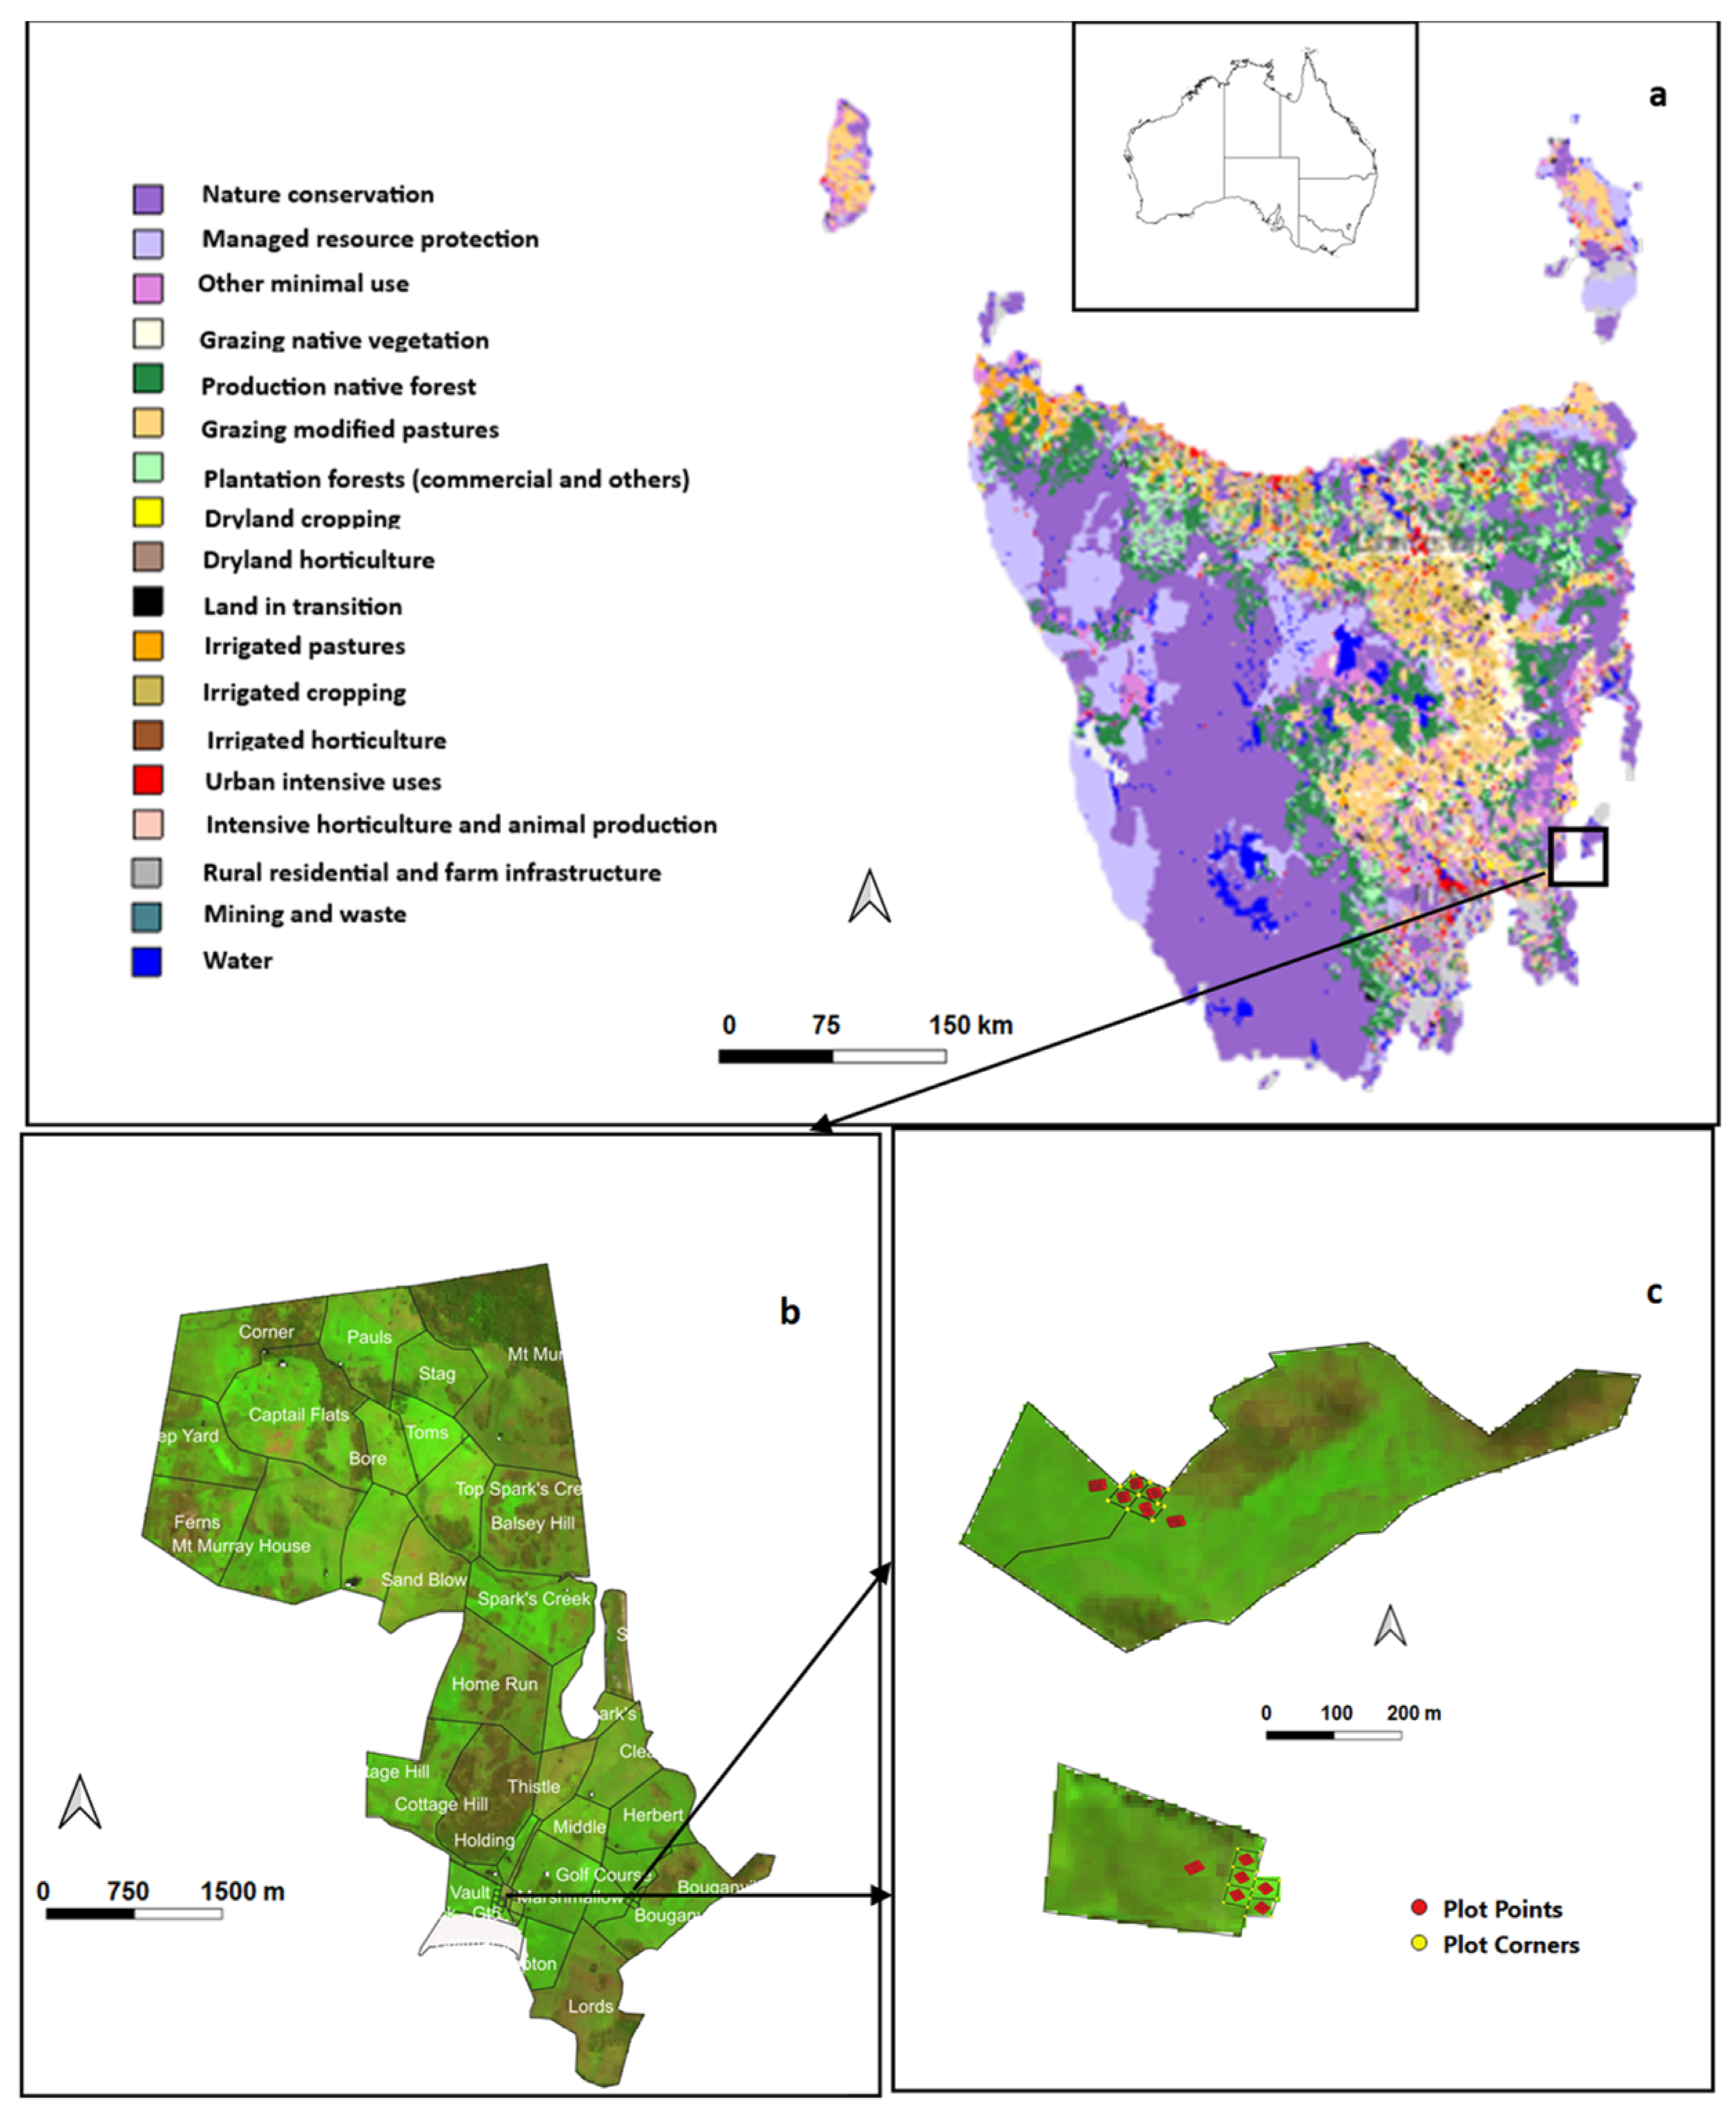
2.1. Study Site

The location for this study was south-eastern Tasmania, Australia. We worked on a case study farm (42°30′ S, 147°59′ E) north of the town of Triabunna called ‘Okehampton’. The average annual rainfall at this location is 648 mm while the average annual minimum and maximum temperature are 7 °C and 17 °C, respectively [47]. Okehampton consists of 52 paddocks of sizes ranging from 1–138 ha covering an estimated area of 1446 ha (Figure 1). The botanical composition of fields comprises a mixture of native and sown pastures with mostly annual and perennial ryegrass (wallaby grass (Austrodanthonia species), kangaroo grass (Themeda triandra), Phalaris (Phalaris aquatic) and cocksfoot spear grass (Dactylis glomerata) [48]. The absence of irrigation and synthetic fertilizers on this site and the goal to stimulate pasture growth to improve livestock production, demand that agronomic systems implemented be sustainable, profitable, inclusive, and enduring—especially given the uncertainty of future climate conditions in this region [29,49]. The farm has a history of sheep grazing but the field layouts have evolved over time to accommodate inclusive, intensive grazing management, conservation of biodiversity, and environmental stewardship, including protection of endangered grass species and implementation of cultural burning practices informed by the local indigenous people (Pakana Services).

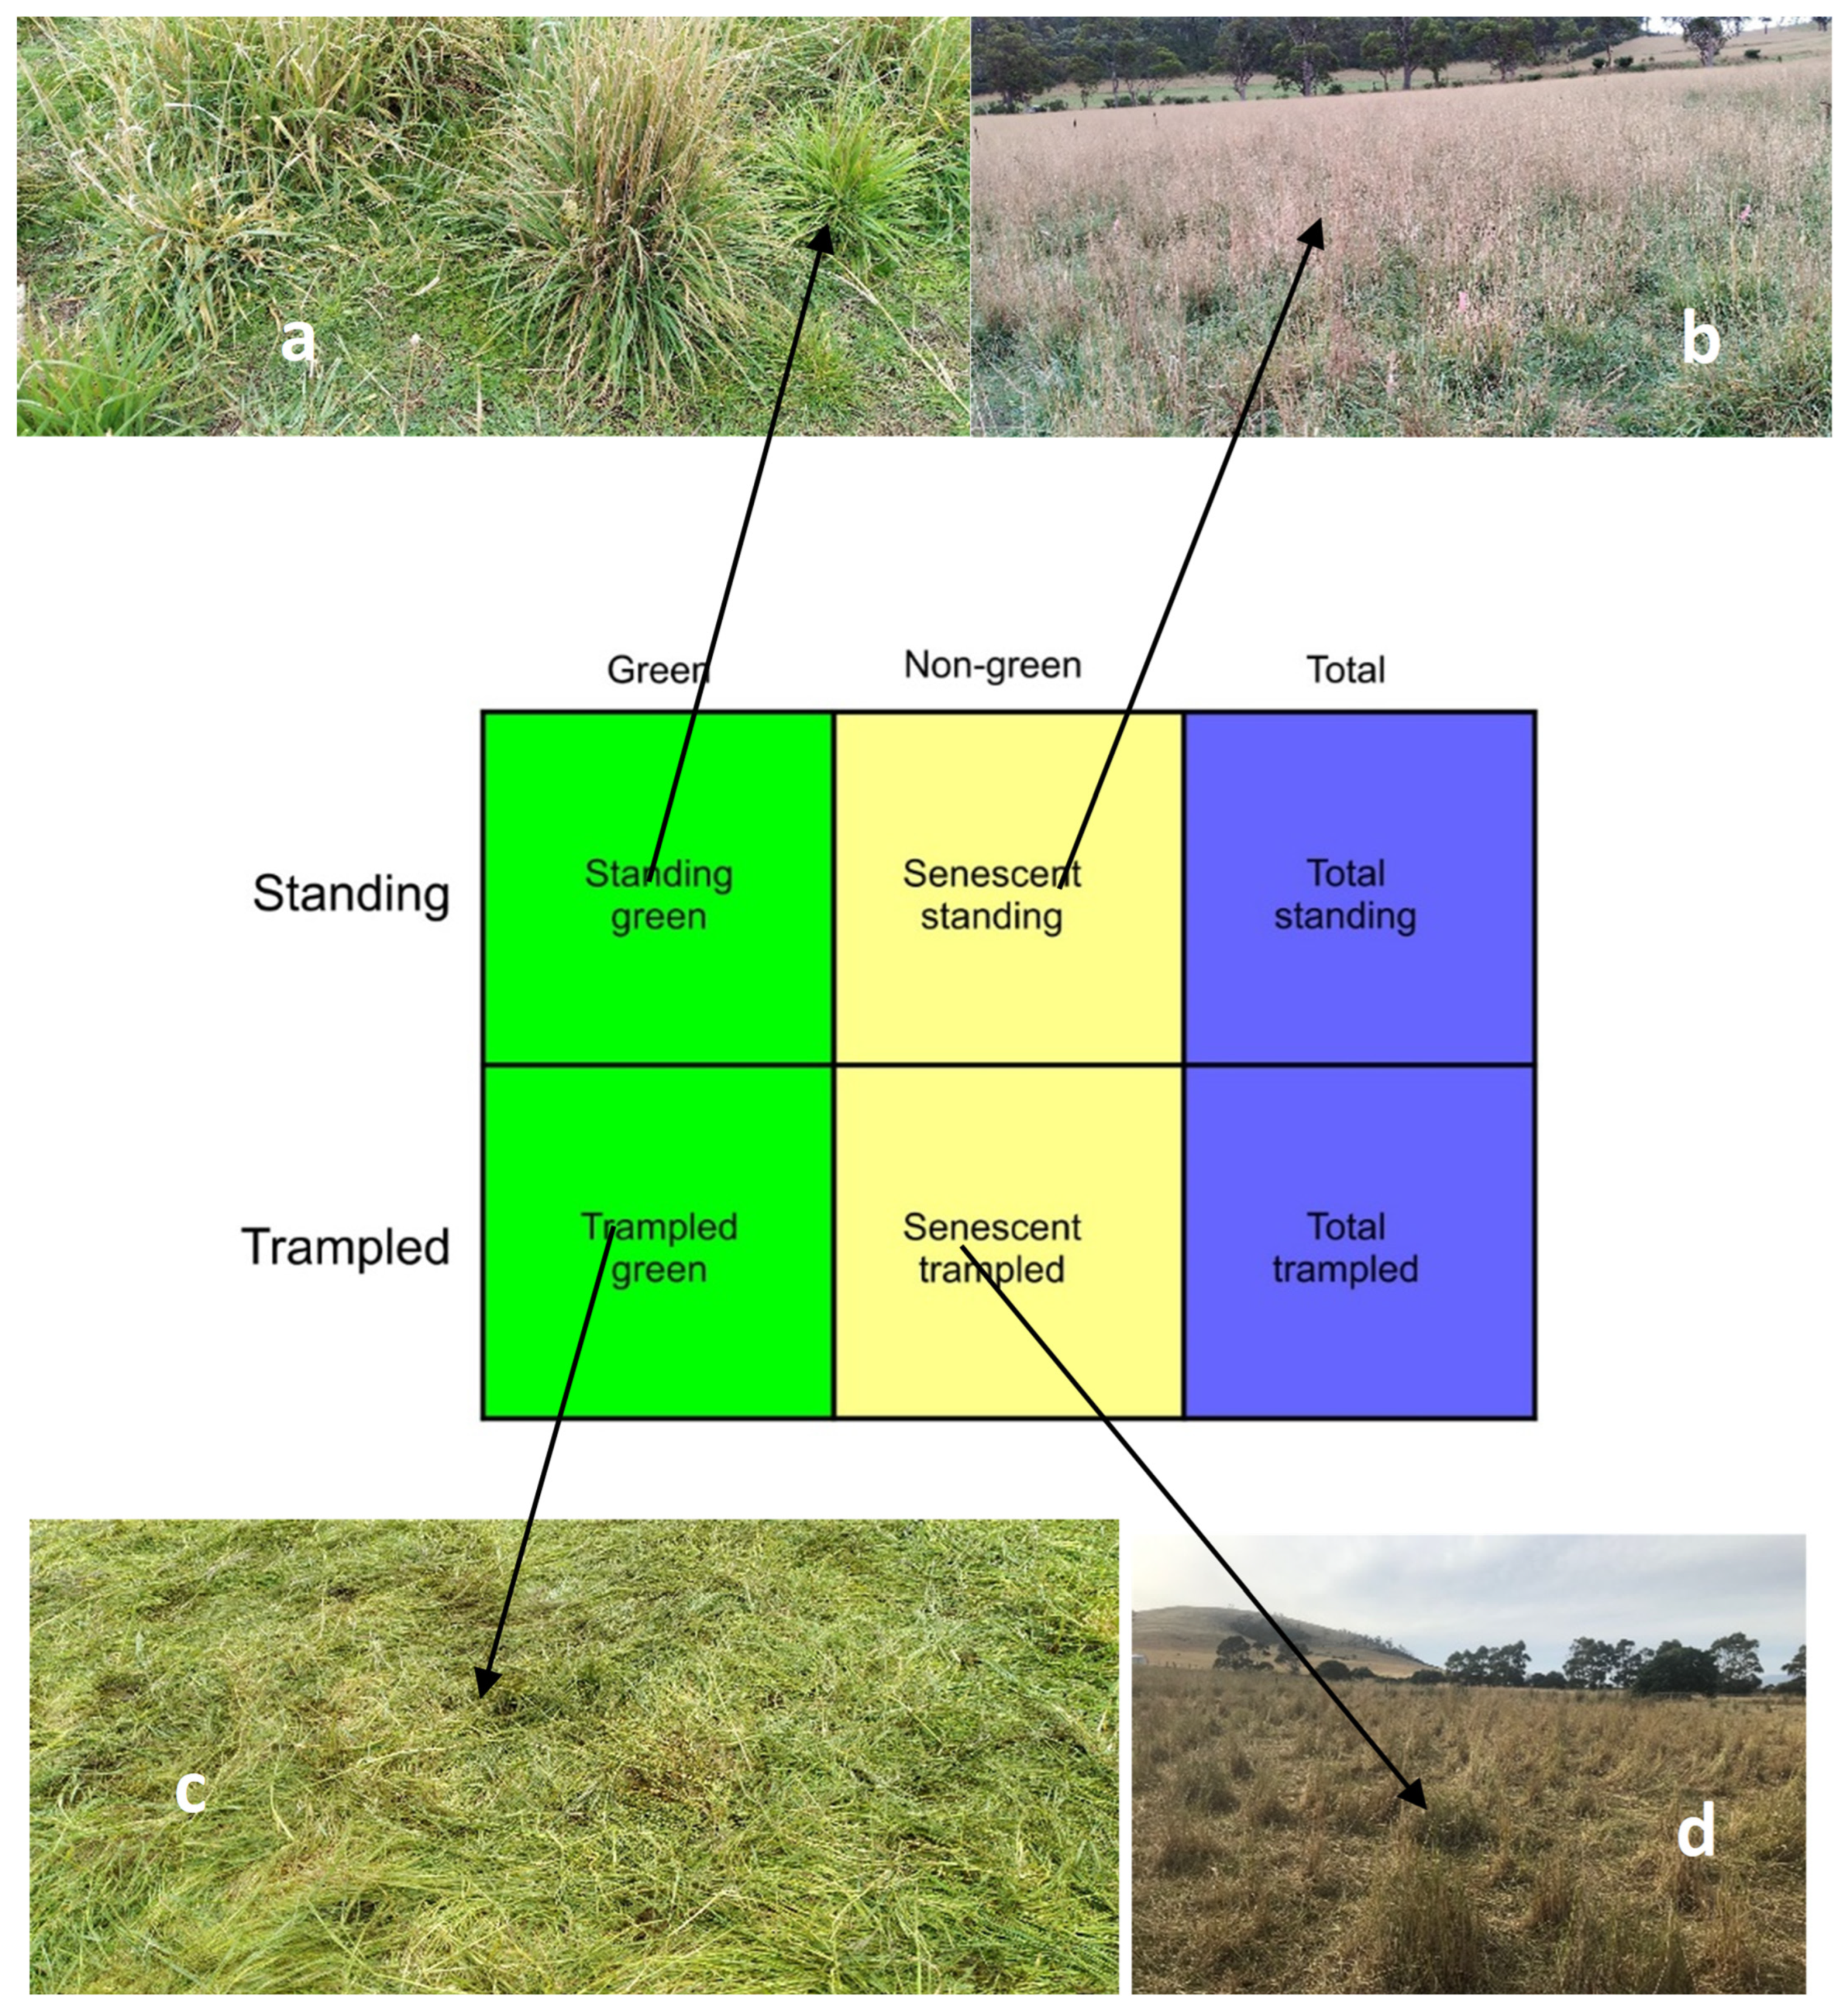
2.2. Regenerative Grazing Data Collection

Twelve paddocks nominated by the case study farmer were used for the field sampling campaign. Biomass samples were collected by a local consultant from December 2021 through November 2022. Grazing was conducted for 1 day in the treatment plots (early morning to late evening). The control has “business-as-usual” grazing (Table 1). Pasture biomass fractions were generally quantified before grazing. Three plots [Vault control (VC), lower Bougainville (LB), and upper Bougainville (UB)] were used as controls following grazing regimes that were business-as-usual. These plots were grazed for longer periods (weeks) at lower stocking rates (2000 DSE/ha) than the intensive treatments (i.e., the other seven paddocks) and allowed less time between subsequent grazing compared with intensively grazed paddocks. Control paddocks were larger in size compared with treatment plots. Treatment plots were stocked at the same rate while following adjusted stocking density (Table 1) and grazed for one day on consecutive days within the same week to minimise potential confounding effects of weather impacts on pasture growth, then rested for three, six, nine or twelve months before re-grazing. Treatment plots were conducted based on ‘regenerative’ principles that conduct short, intense grazing, with long rest periods allowing pastures to recover [50]. In contrast, control paddocks were grazed at lighter stocking rates (Equation (1)), for longer durations, and allowed less time to recover (Table 1). Henceforth, the business-as-usual plots would be called BAU.
Stocking rate (DSE/ha) = grazing area per dry sheep equivalent for a
nominated period
From Equation (1), if the stocking rate of BAU plots is 2000 (DSE/ha), then the stocking rate for the treatment plots is ¼ of ha = 8000 DSE/ha.
Pasture biomass was harvested to the ground level from five locations (quadrats) that were predetermined within each plot (from plot points with red layouts in Figure 1) using a battery-operated shearing handpiece and a 0.25 m2 quadrat (a square of 0.5 × 0.5 m). Standing biomass (green and dry) was cut prior to grazing while standing residuals (green and dry) and trampled biomass (green and dry) were taken post grazing, in a location immediately adjacent to the pre-grazing biomass harvest. Biomass was quickly placed in sealed, labelled plastic bags and transported to a 4 °C room in the laboratory where each bag was weighed after dung was excluded. The biomass was mixed, and using a quartering method, subsampled for separation and drying. Sub-samples of green and dry biomass were separated and then dried in a 60 °C oven for at least 48 h, before being weighed using a Mettler scale. This process was repeated for post-grazing biomass in some of the paddocks that were grazed. To account for the high volume of trampled biomass (i.e., biomass lying on the surface disturbed by the high density of sheep) this component was measured separately from the standing biomass (Table 1). Total standing dry matter (TSDM) was computed by the summation of green and dry biomass without trampled components. To determine actual biomass utilised during a post-grazing event, we used Equations (2) and (3) for total trampled dry matter (TTDM), as shown in Figure 2.
total standing dry matter (TSDM) − trampled residual = Biomass consumed
trampled green dry matter + trampled senesced dry matter =
Total trampled dry matter (TTDM)
Since the sampled biomass collected from the five locations was completed only once in each plot following a predetermined layout (plot points in Figure 1), we computed the mean for these locations to account for sampling error and tested if the treatment plots and grazing days have a significant effect on biomass using statistical analysis (ANOVA and general linear model). We developed a time series analysis for the treatment plots (including BAU) and compared them with statistical outcomes.
The experiment was for twelve months, from December 2021 to November 2022, where the effects of short, intense grazing compared with the conventional grazing (control) on plot treatments for their drought resilience were observed. Hence, the experiment covered the four seasonal variations (summer, winter, autumn, and spring) in the study area. Summer is from December to February; autumn is from April to May; winter is from June to August; spring is from September to November [46].

2.3. Remote Sensing

Estimates of TSDM were derived using the ‘PastureKey’ app within Cibo Labs, which is produced using 10 m resolution Sentinel-2 imagery provided by the European Space Agency (ESA). Only cloud-free pixels of Sentinel-2 imagery are used by Cibo Labs, and the application produces TSDM estimates for cloud-free paddocks every 5 days (Sentinel 2 revisit time). Cloudy pixels are detected and masked with the ‘Fmask’ algorithm [51]. Ten bands (b2, b3, b4, b5, b6, b7, b8, b8A, b11 and b12) of Sentinel-2 imagery were used to derive TSDM products. Using a predictive machine learning approach driven by deep neural networks (DNN), measured data are trained to predict TSDM within and across the paddock for every satellite revisit across a property. Cibo Labs uses Sentinel-2 bands from several thousand paddocks and dates of satellite imagery acquisition to train a three-layer, multilayer perceptron neural network regression model using a 20–50% dropout regularisation method. The dropout regularisation method addresses the problem of overfitting [41].
Pasture estimates in near real-time are available from the PastureKey application within Cibo Labs. Hereafter, the PastureKey application would be referred to as Cibo Labs for convenience. The multilayer perceptron model can learn in real-time, complementing the delivery of products to end-users in cloud optimised GeoTiff (COG) format. Estimates of pasture biomass are available on demand or in a batch mode through a high-performance computing (HPC) environment.

2.4. Comparing Measured Pasture Biomass with Satellite Estimates

On the account that Sentinel-2 could retrieve total standing green and dry matter from the plot with a size less than 1 ha, pasture estimates from Cibo Labs were evaluated by comparison with corresponding measured values for each time point (in each case using the most proximal Sentinel-2 imagery). Comparisons of measured against estimated data were assessed using, time series trendline and error bar, root mean square error, and R2 following [15,29,52].

3. Results

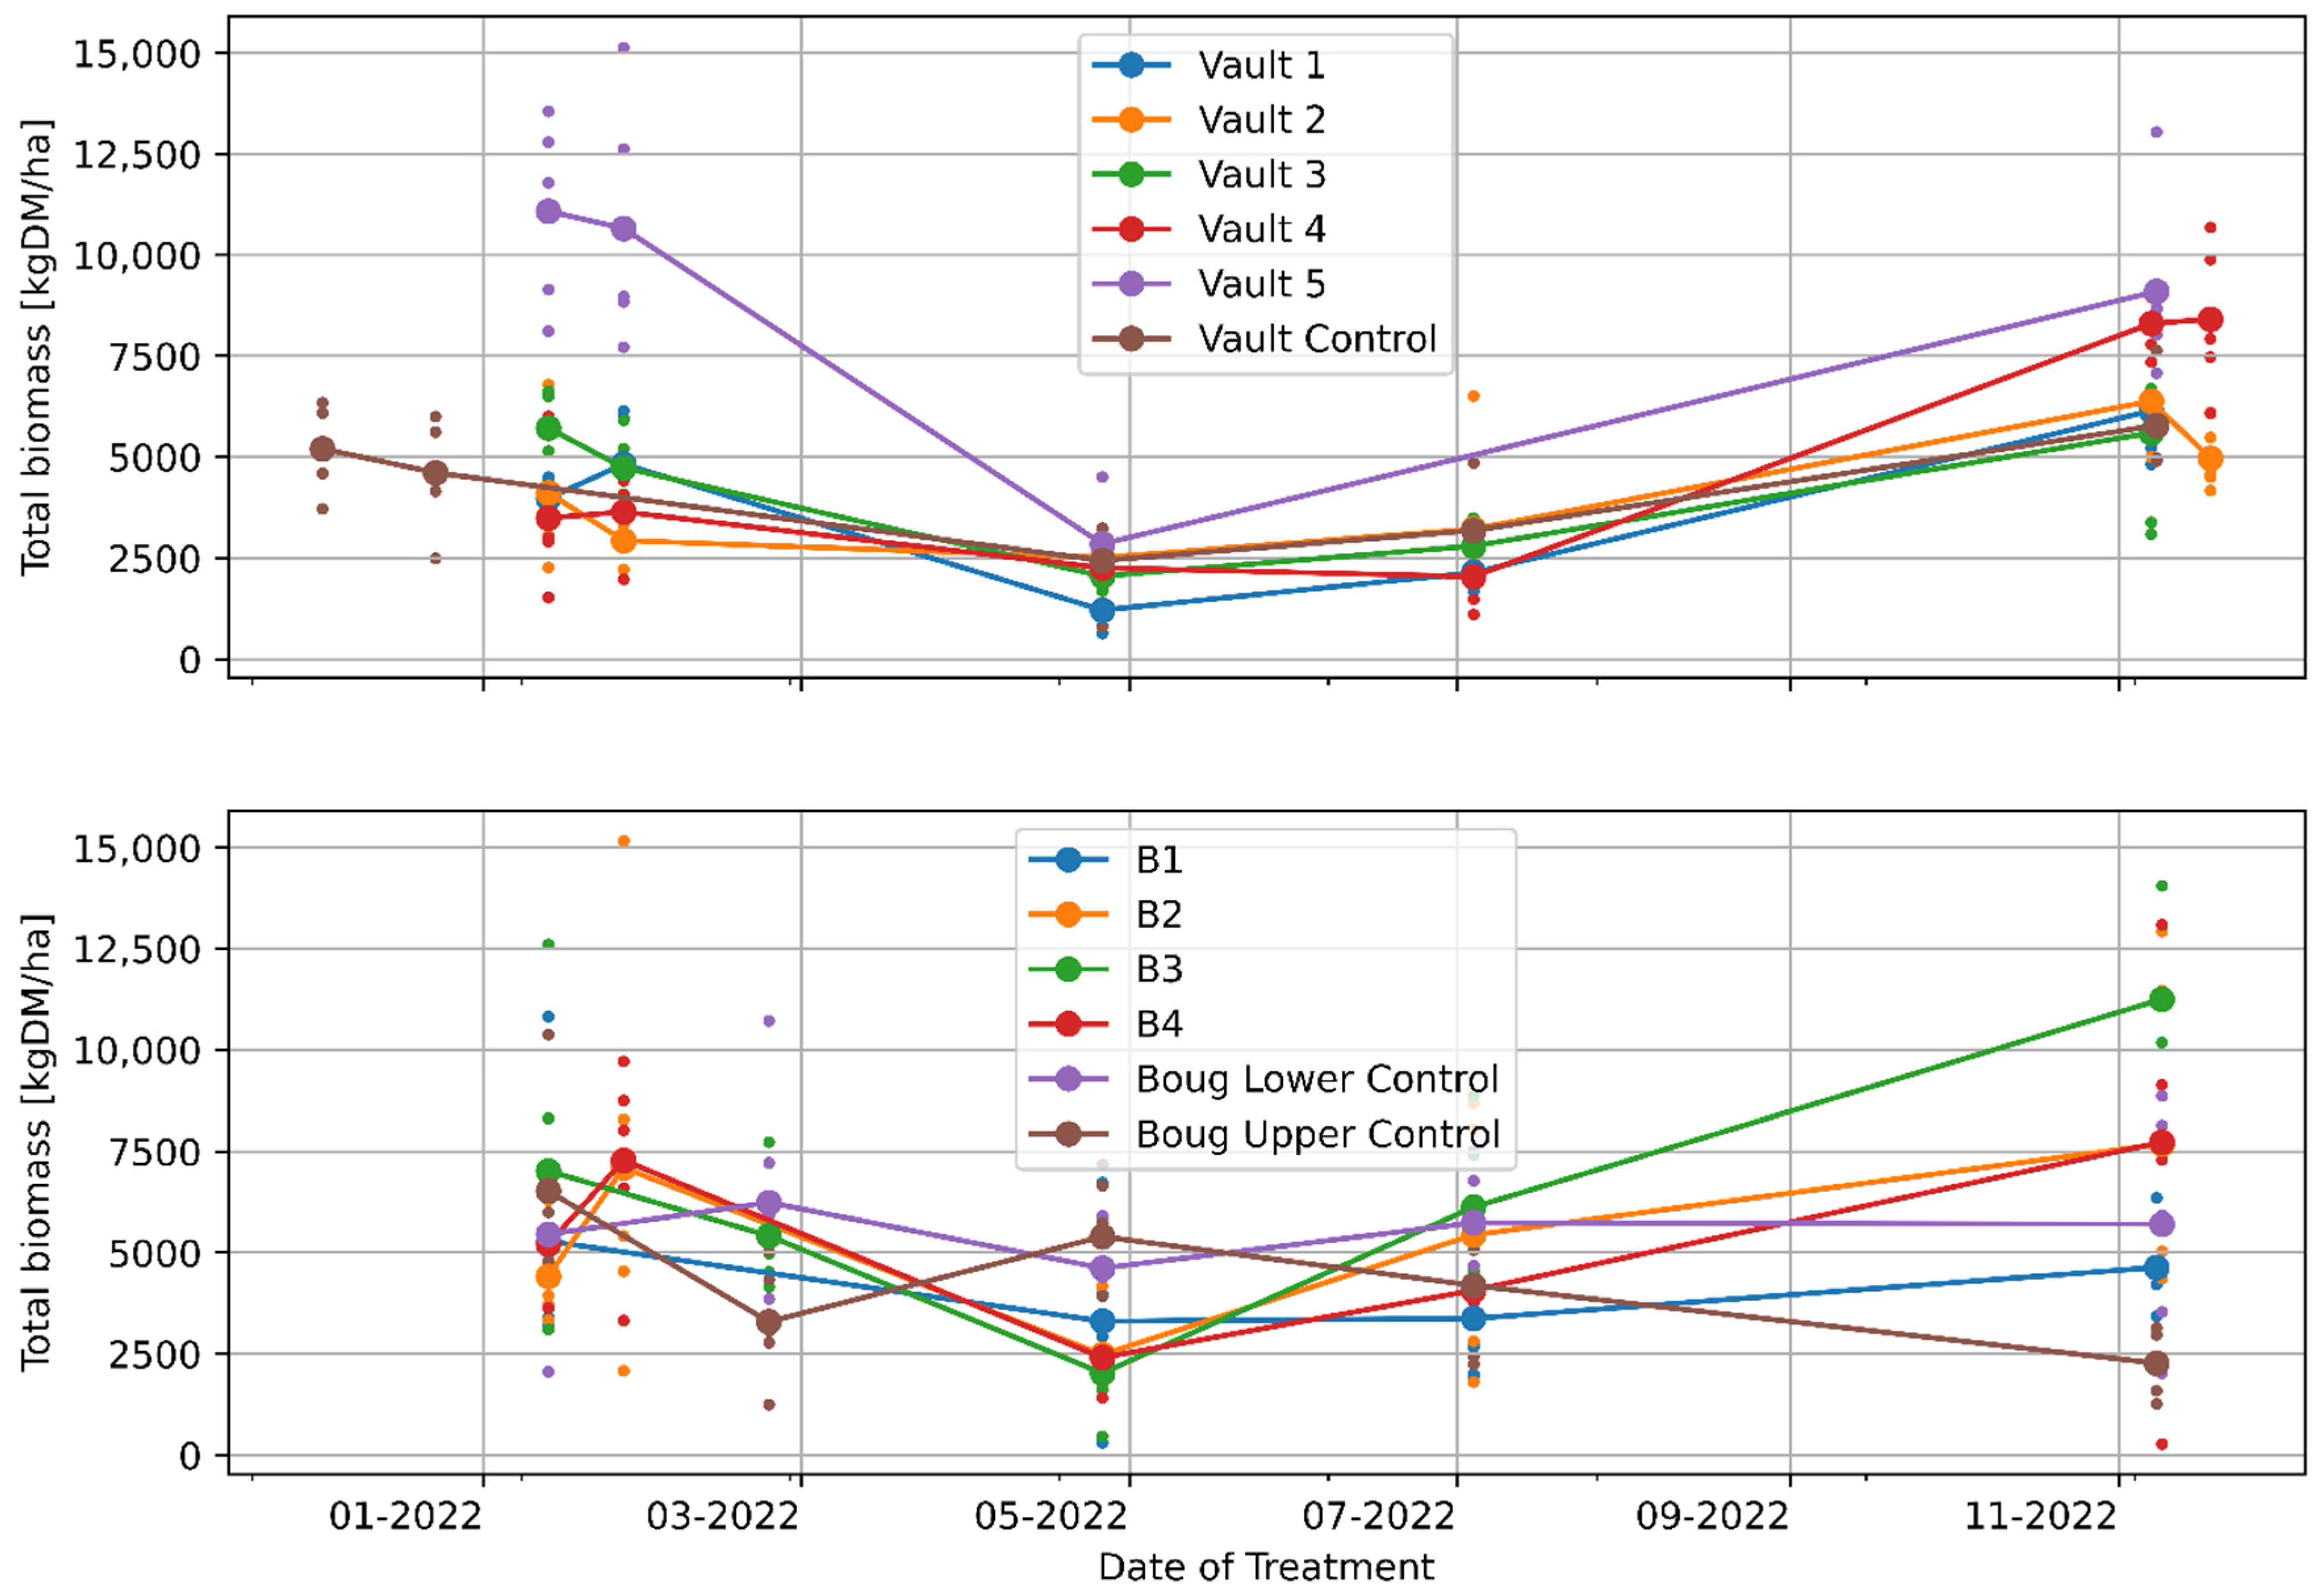
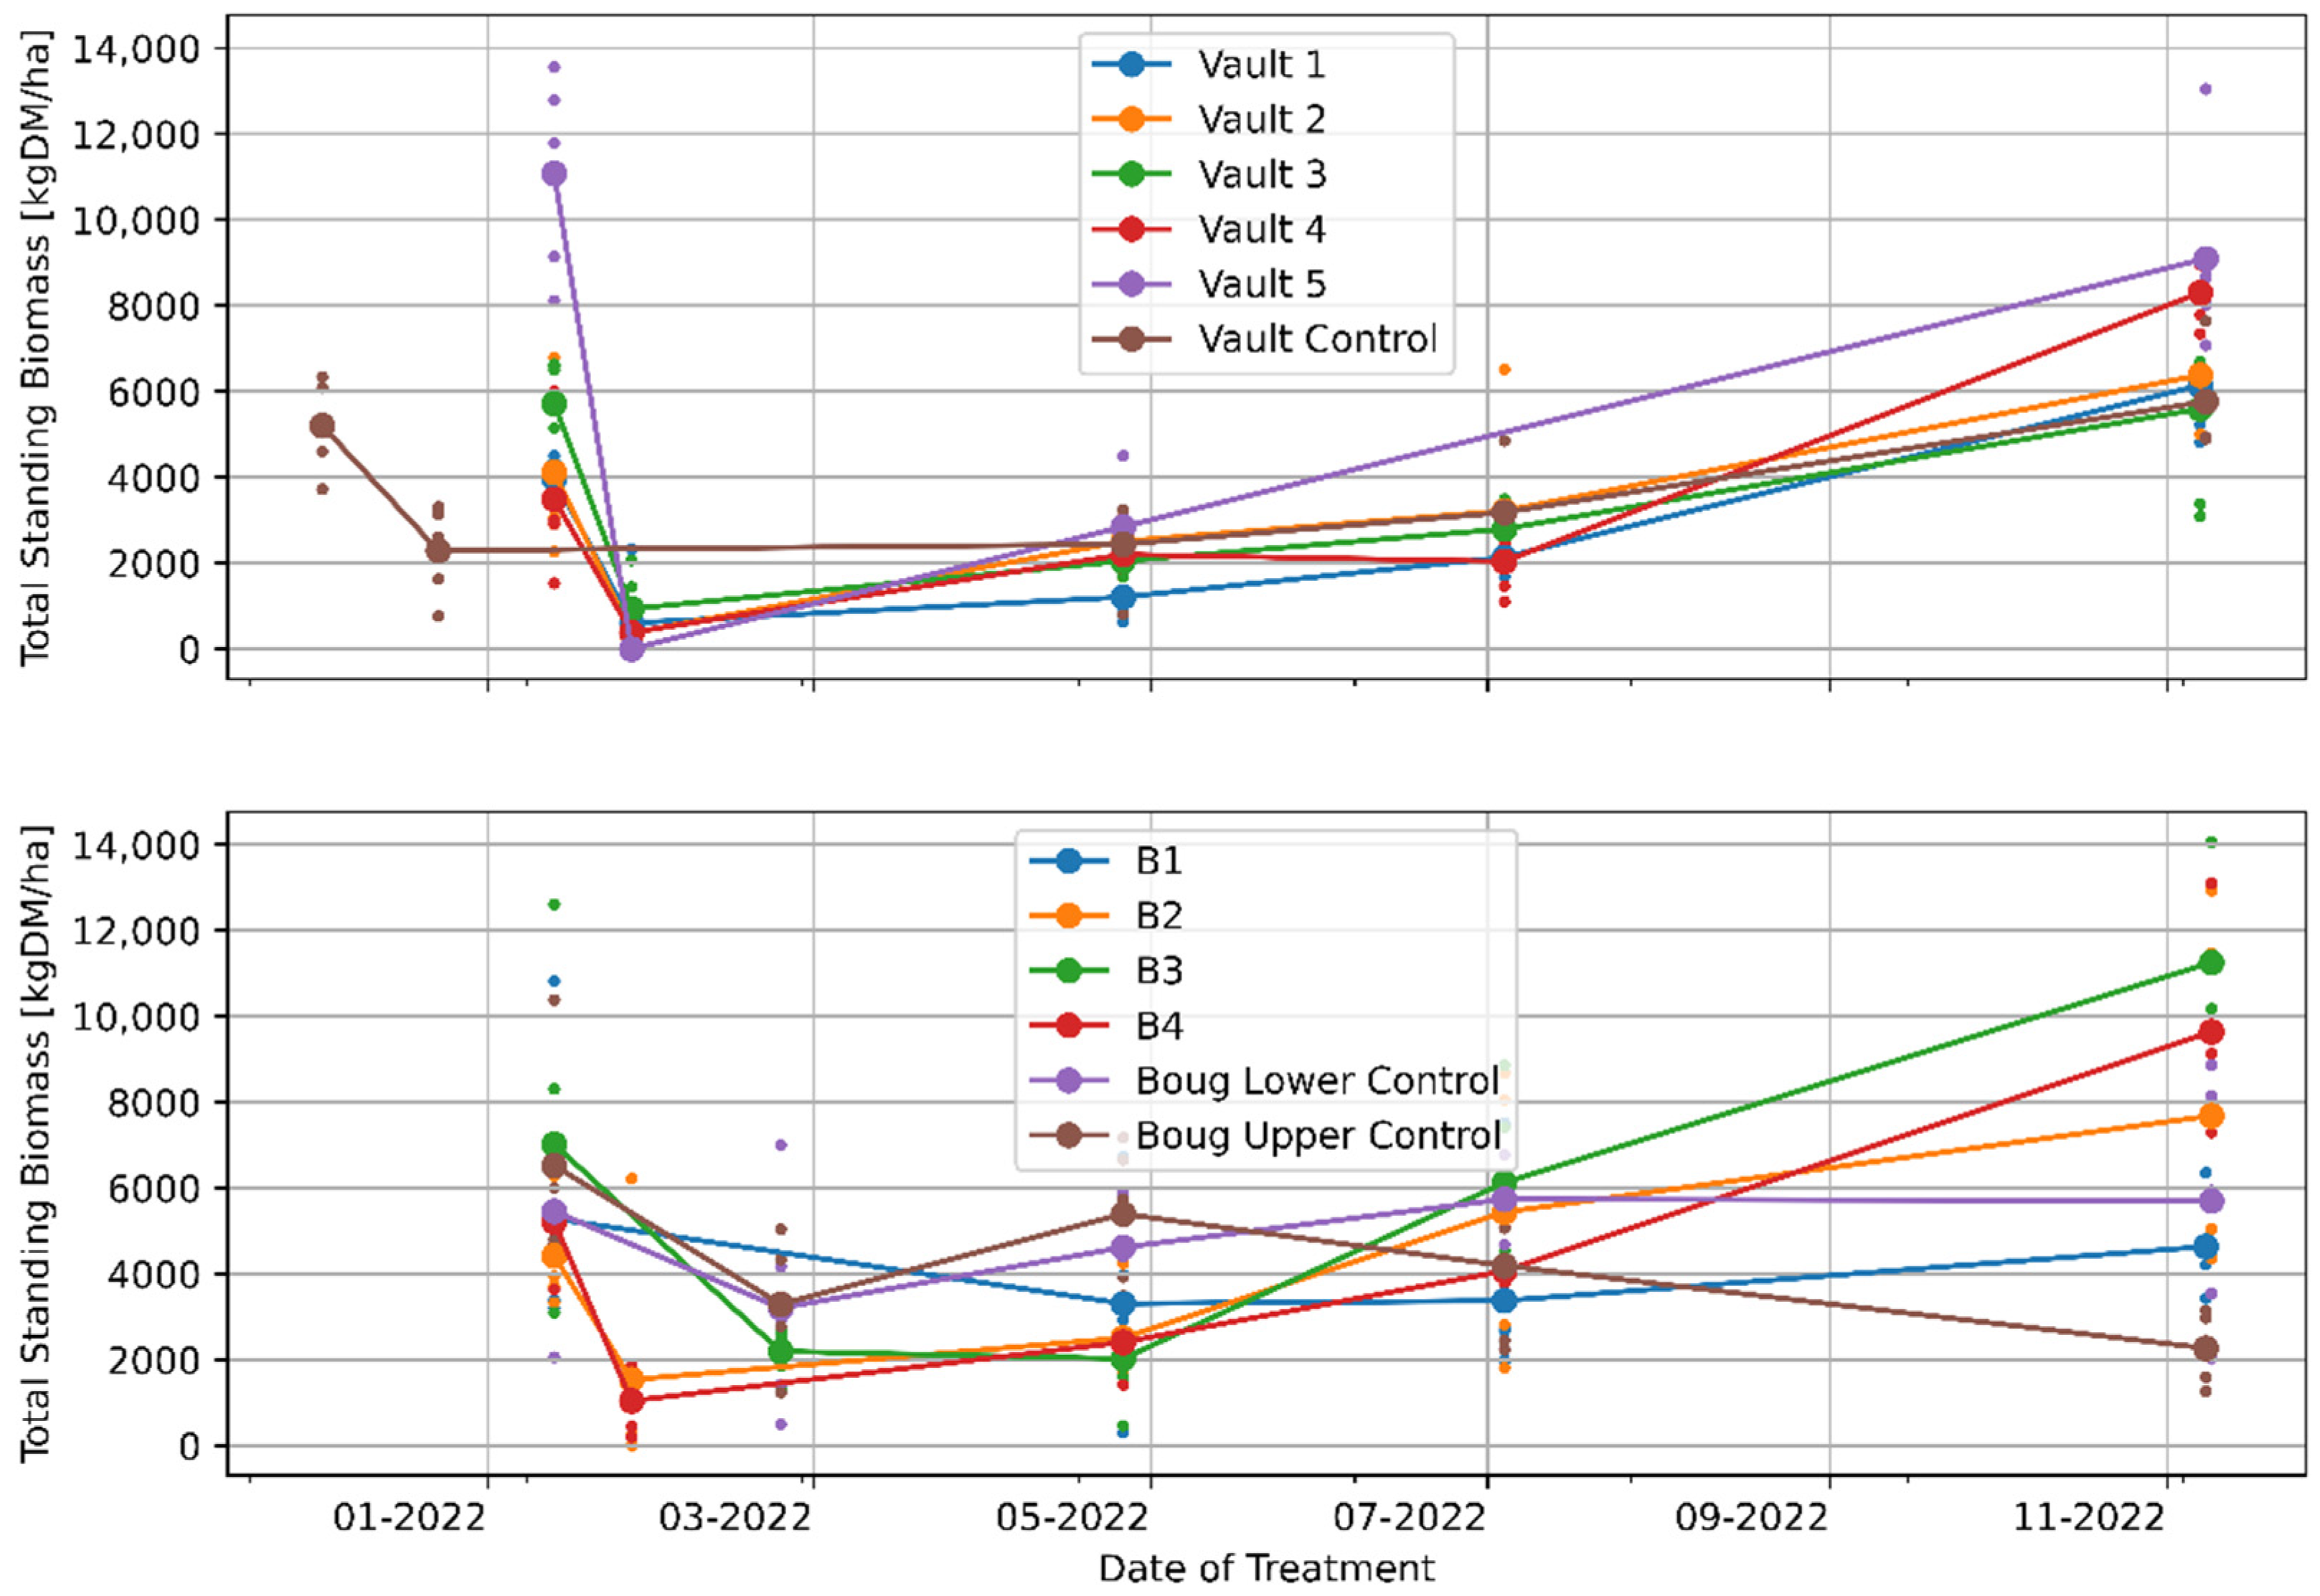
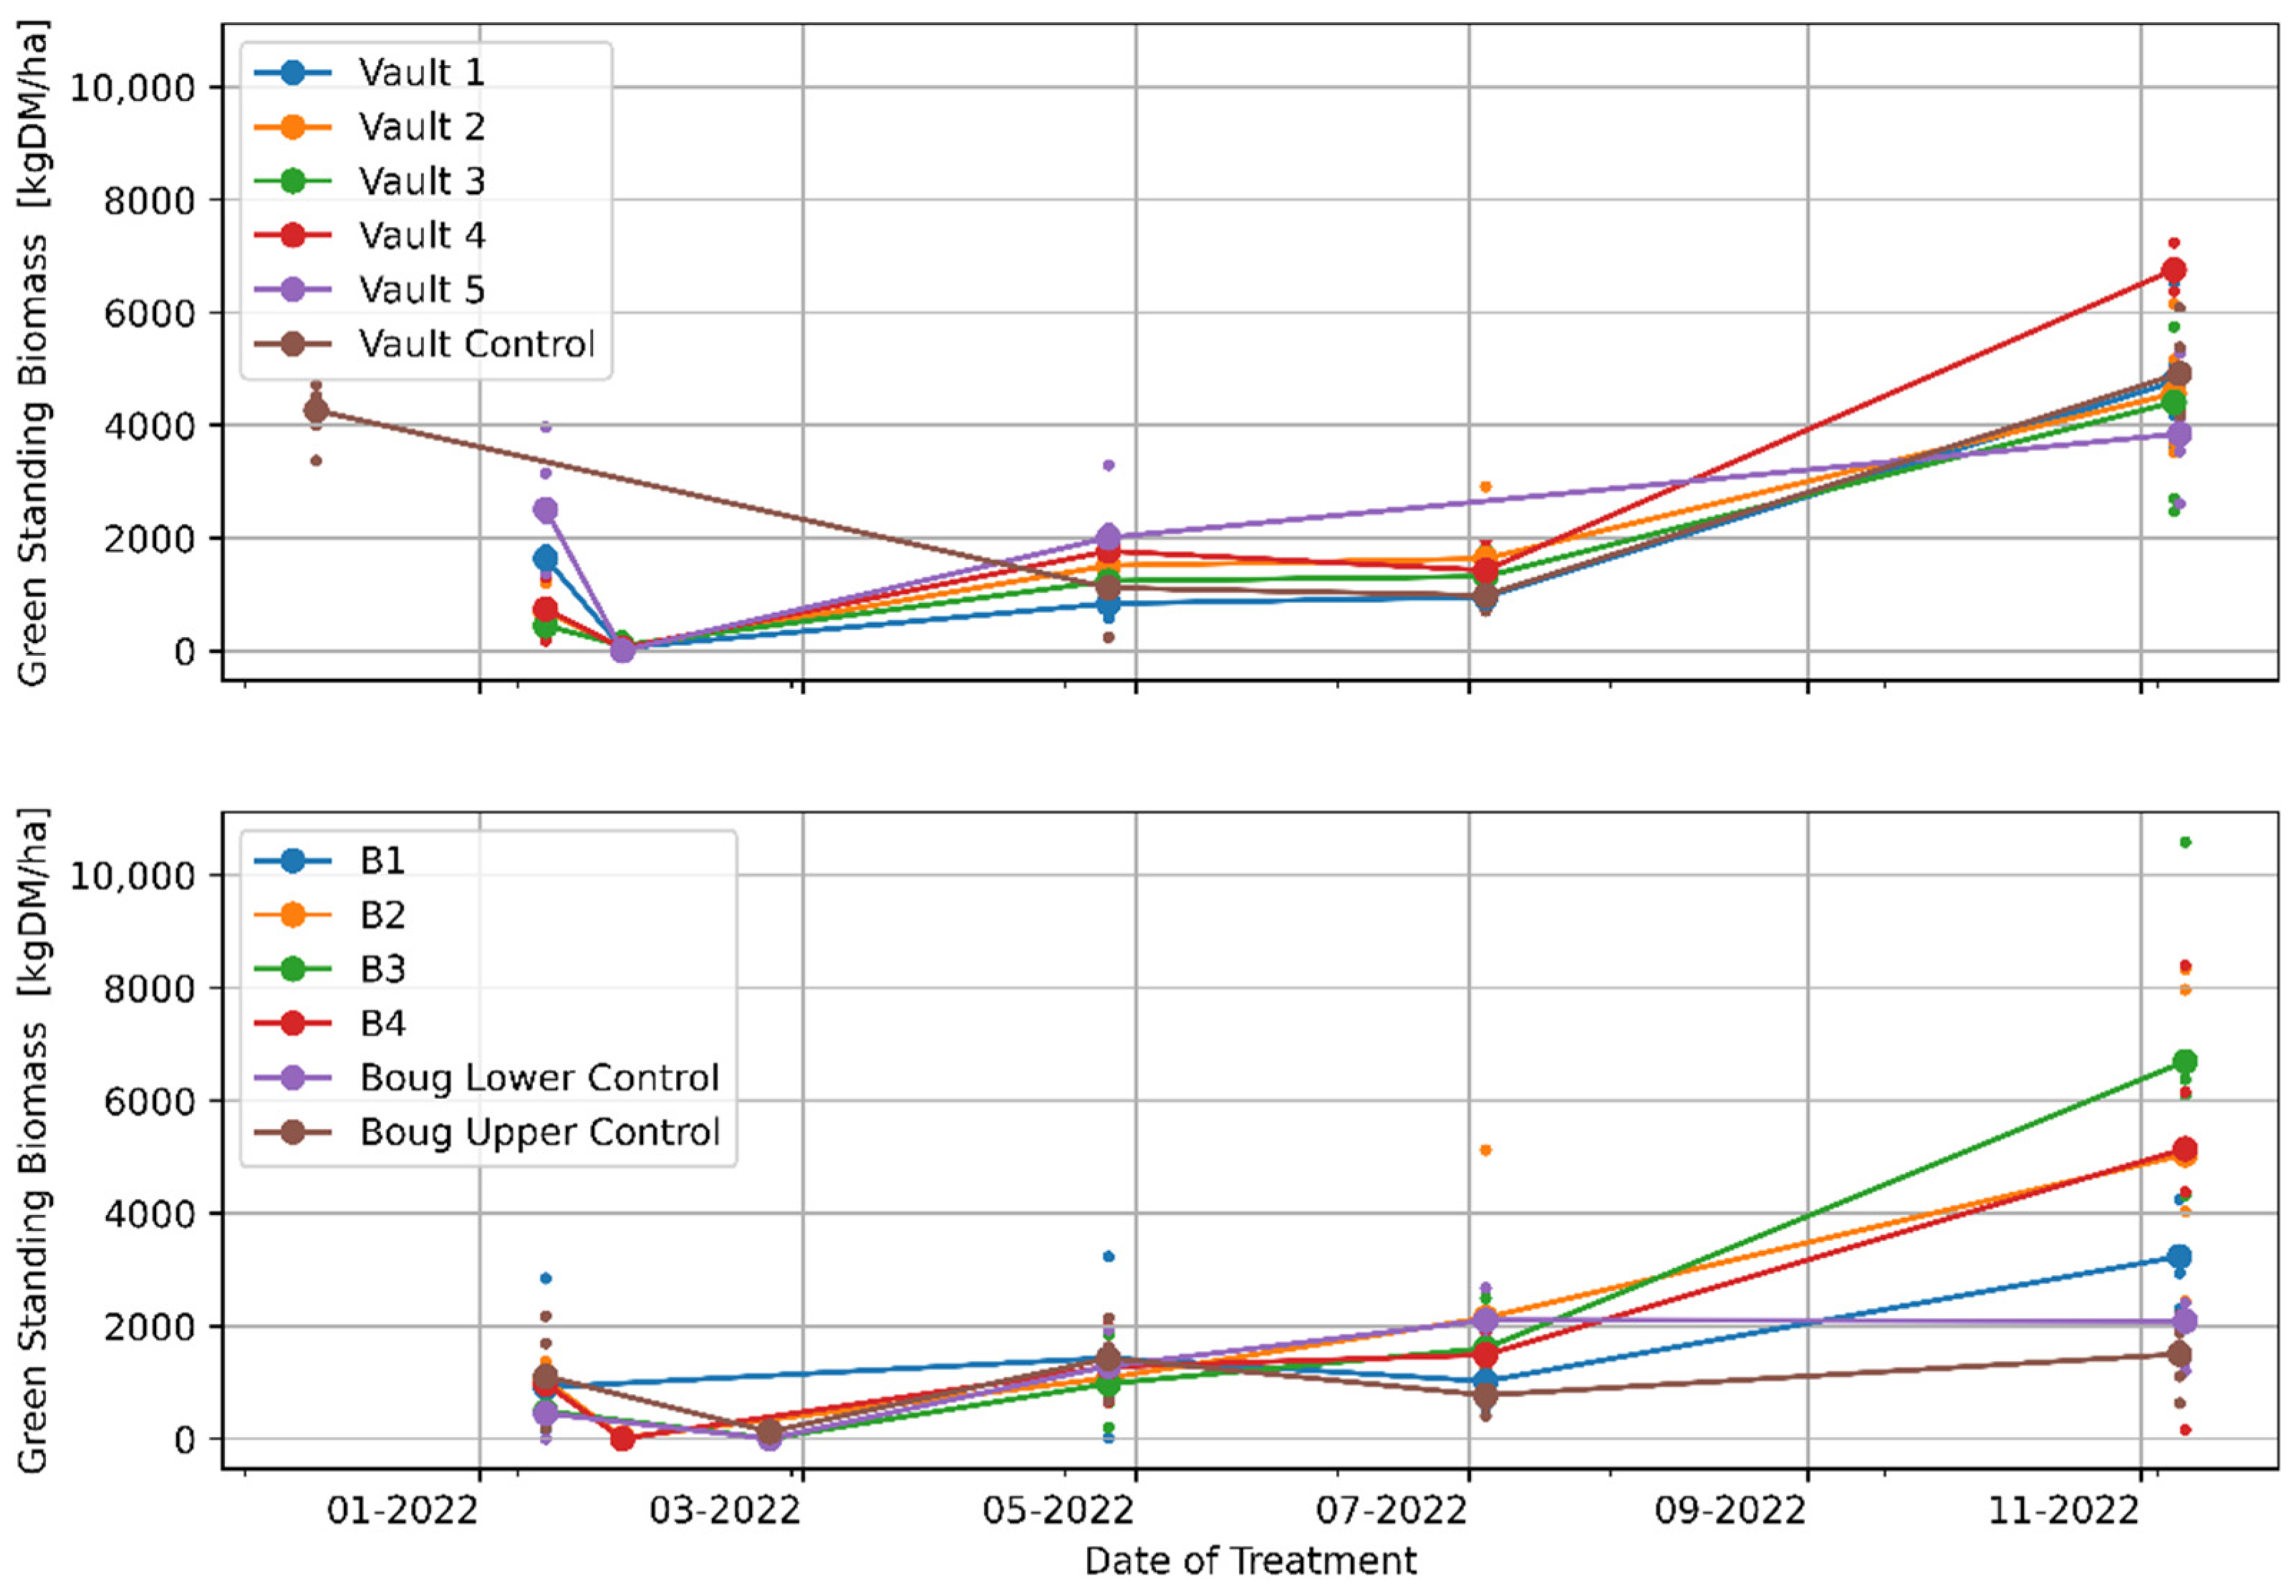
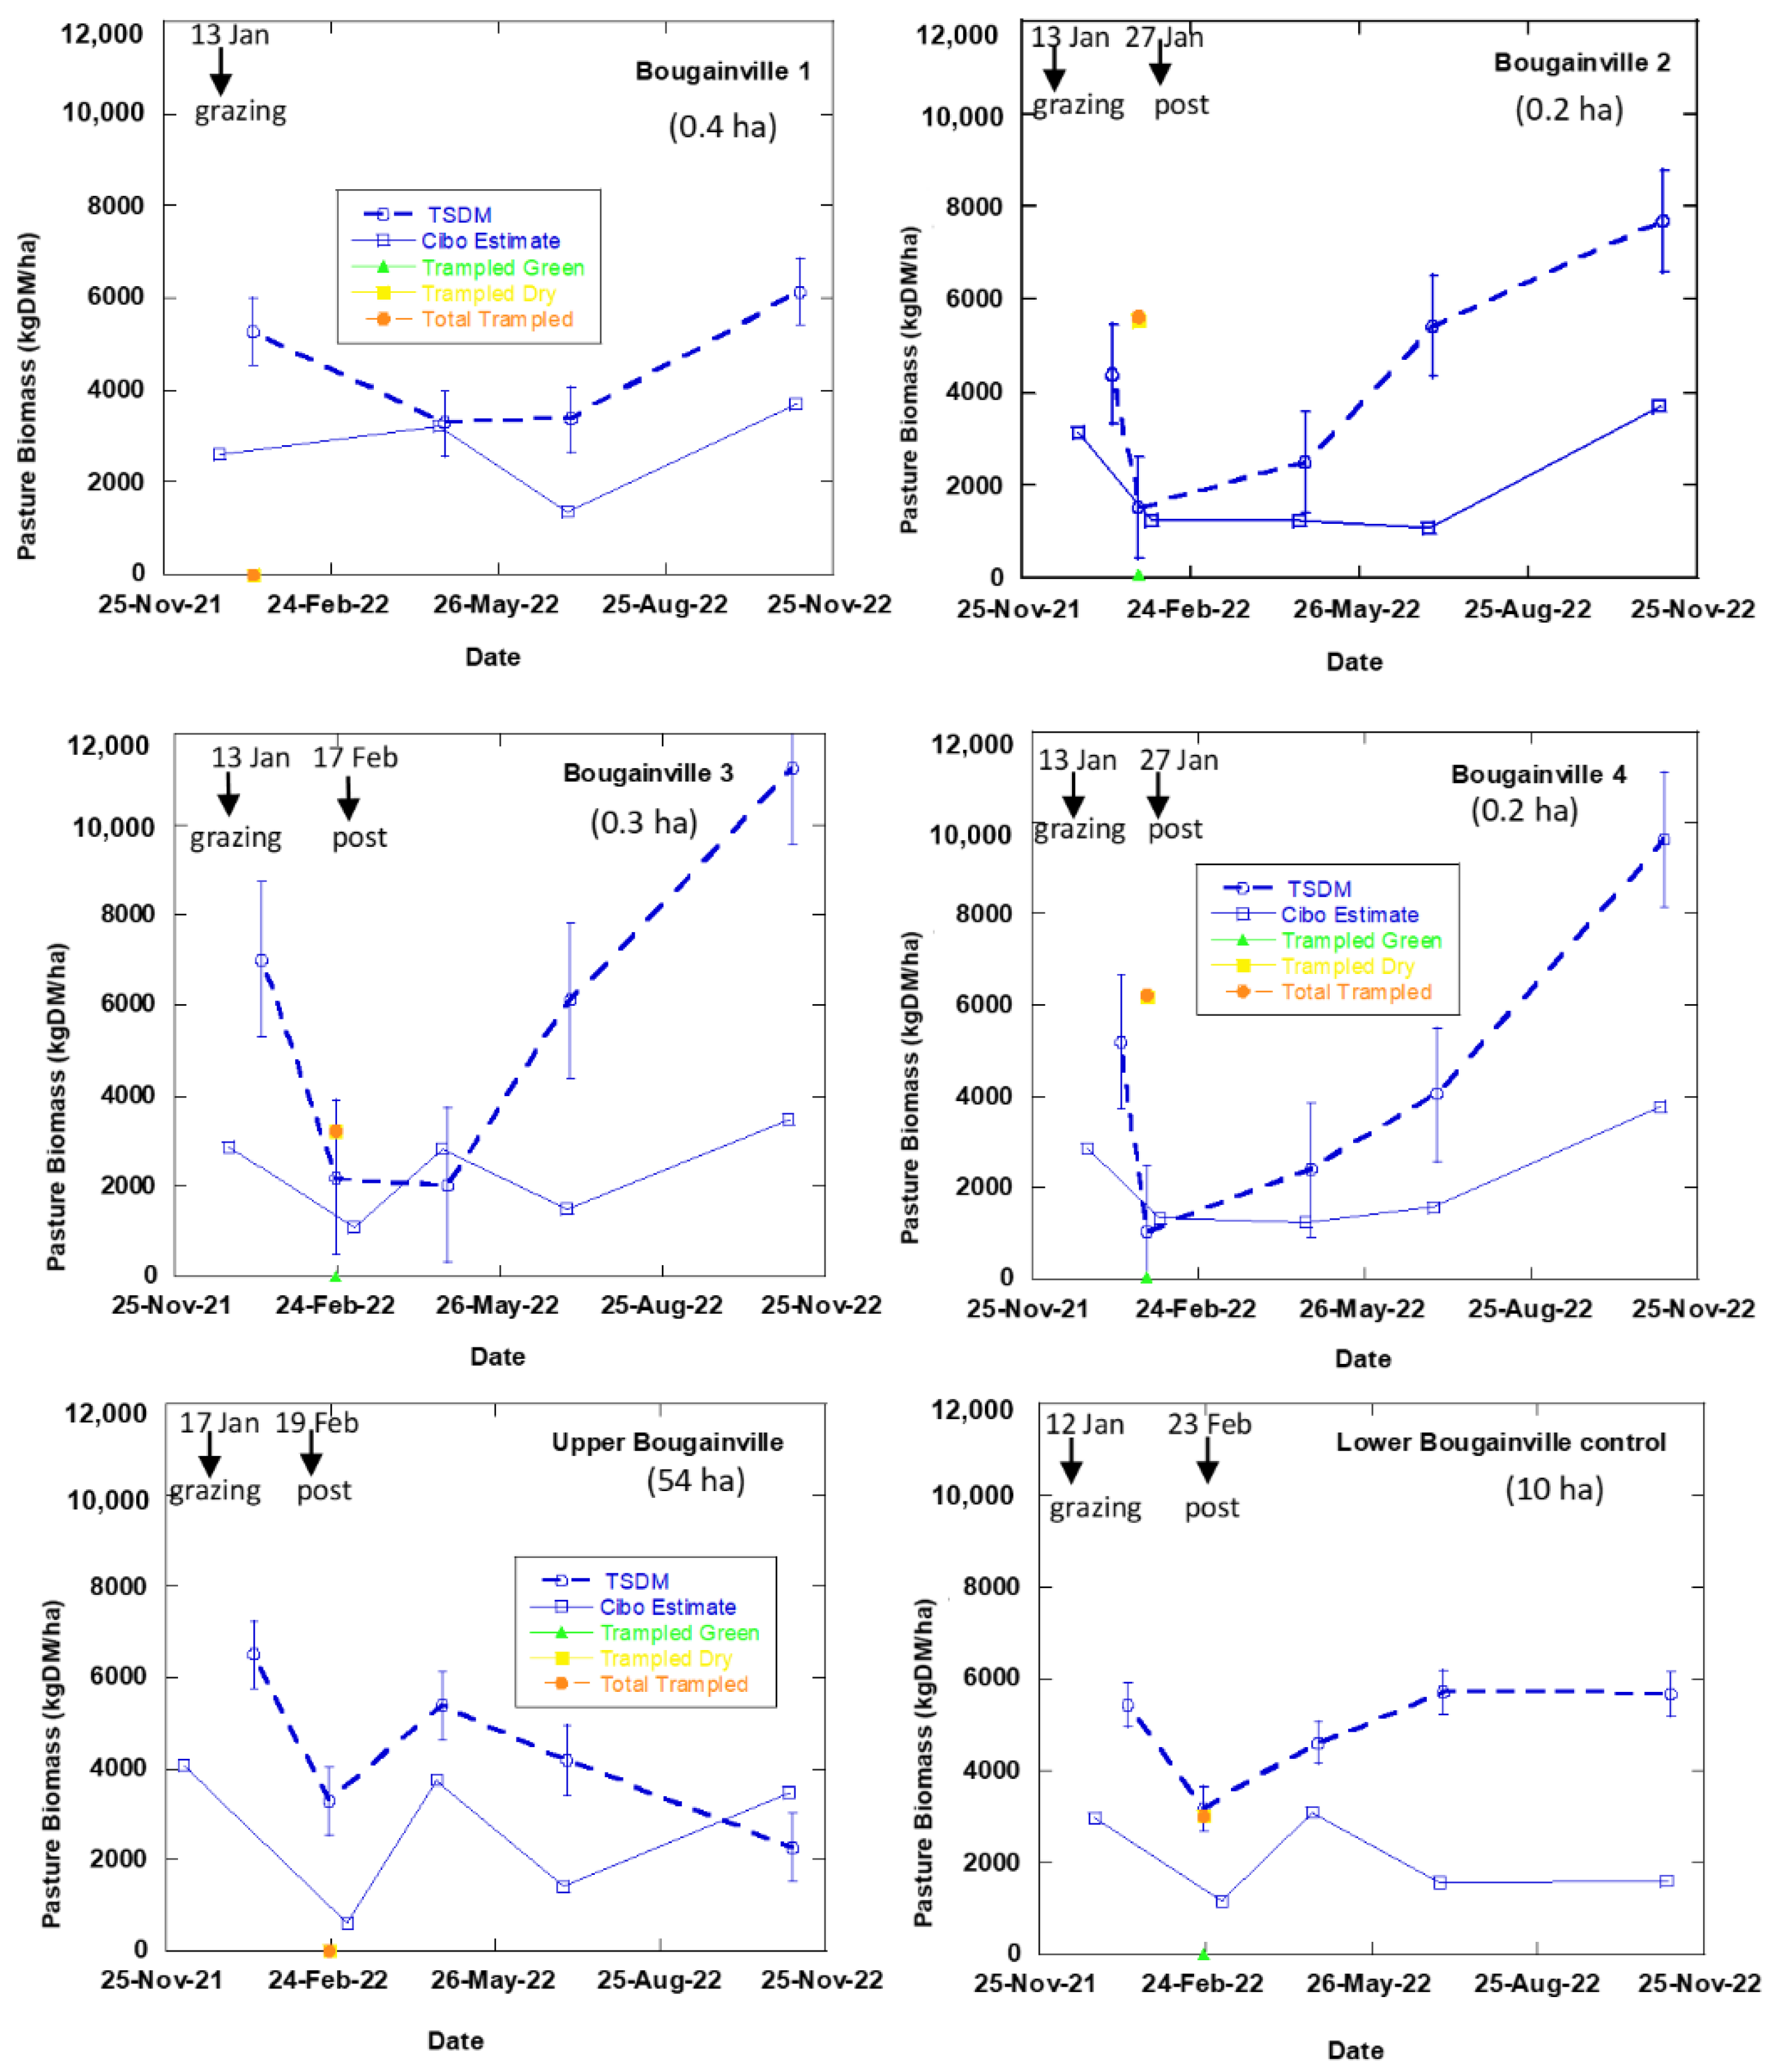
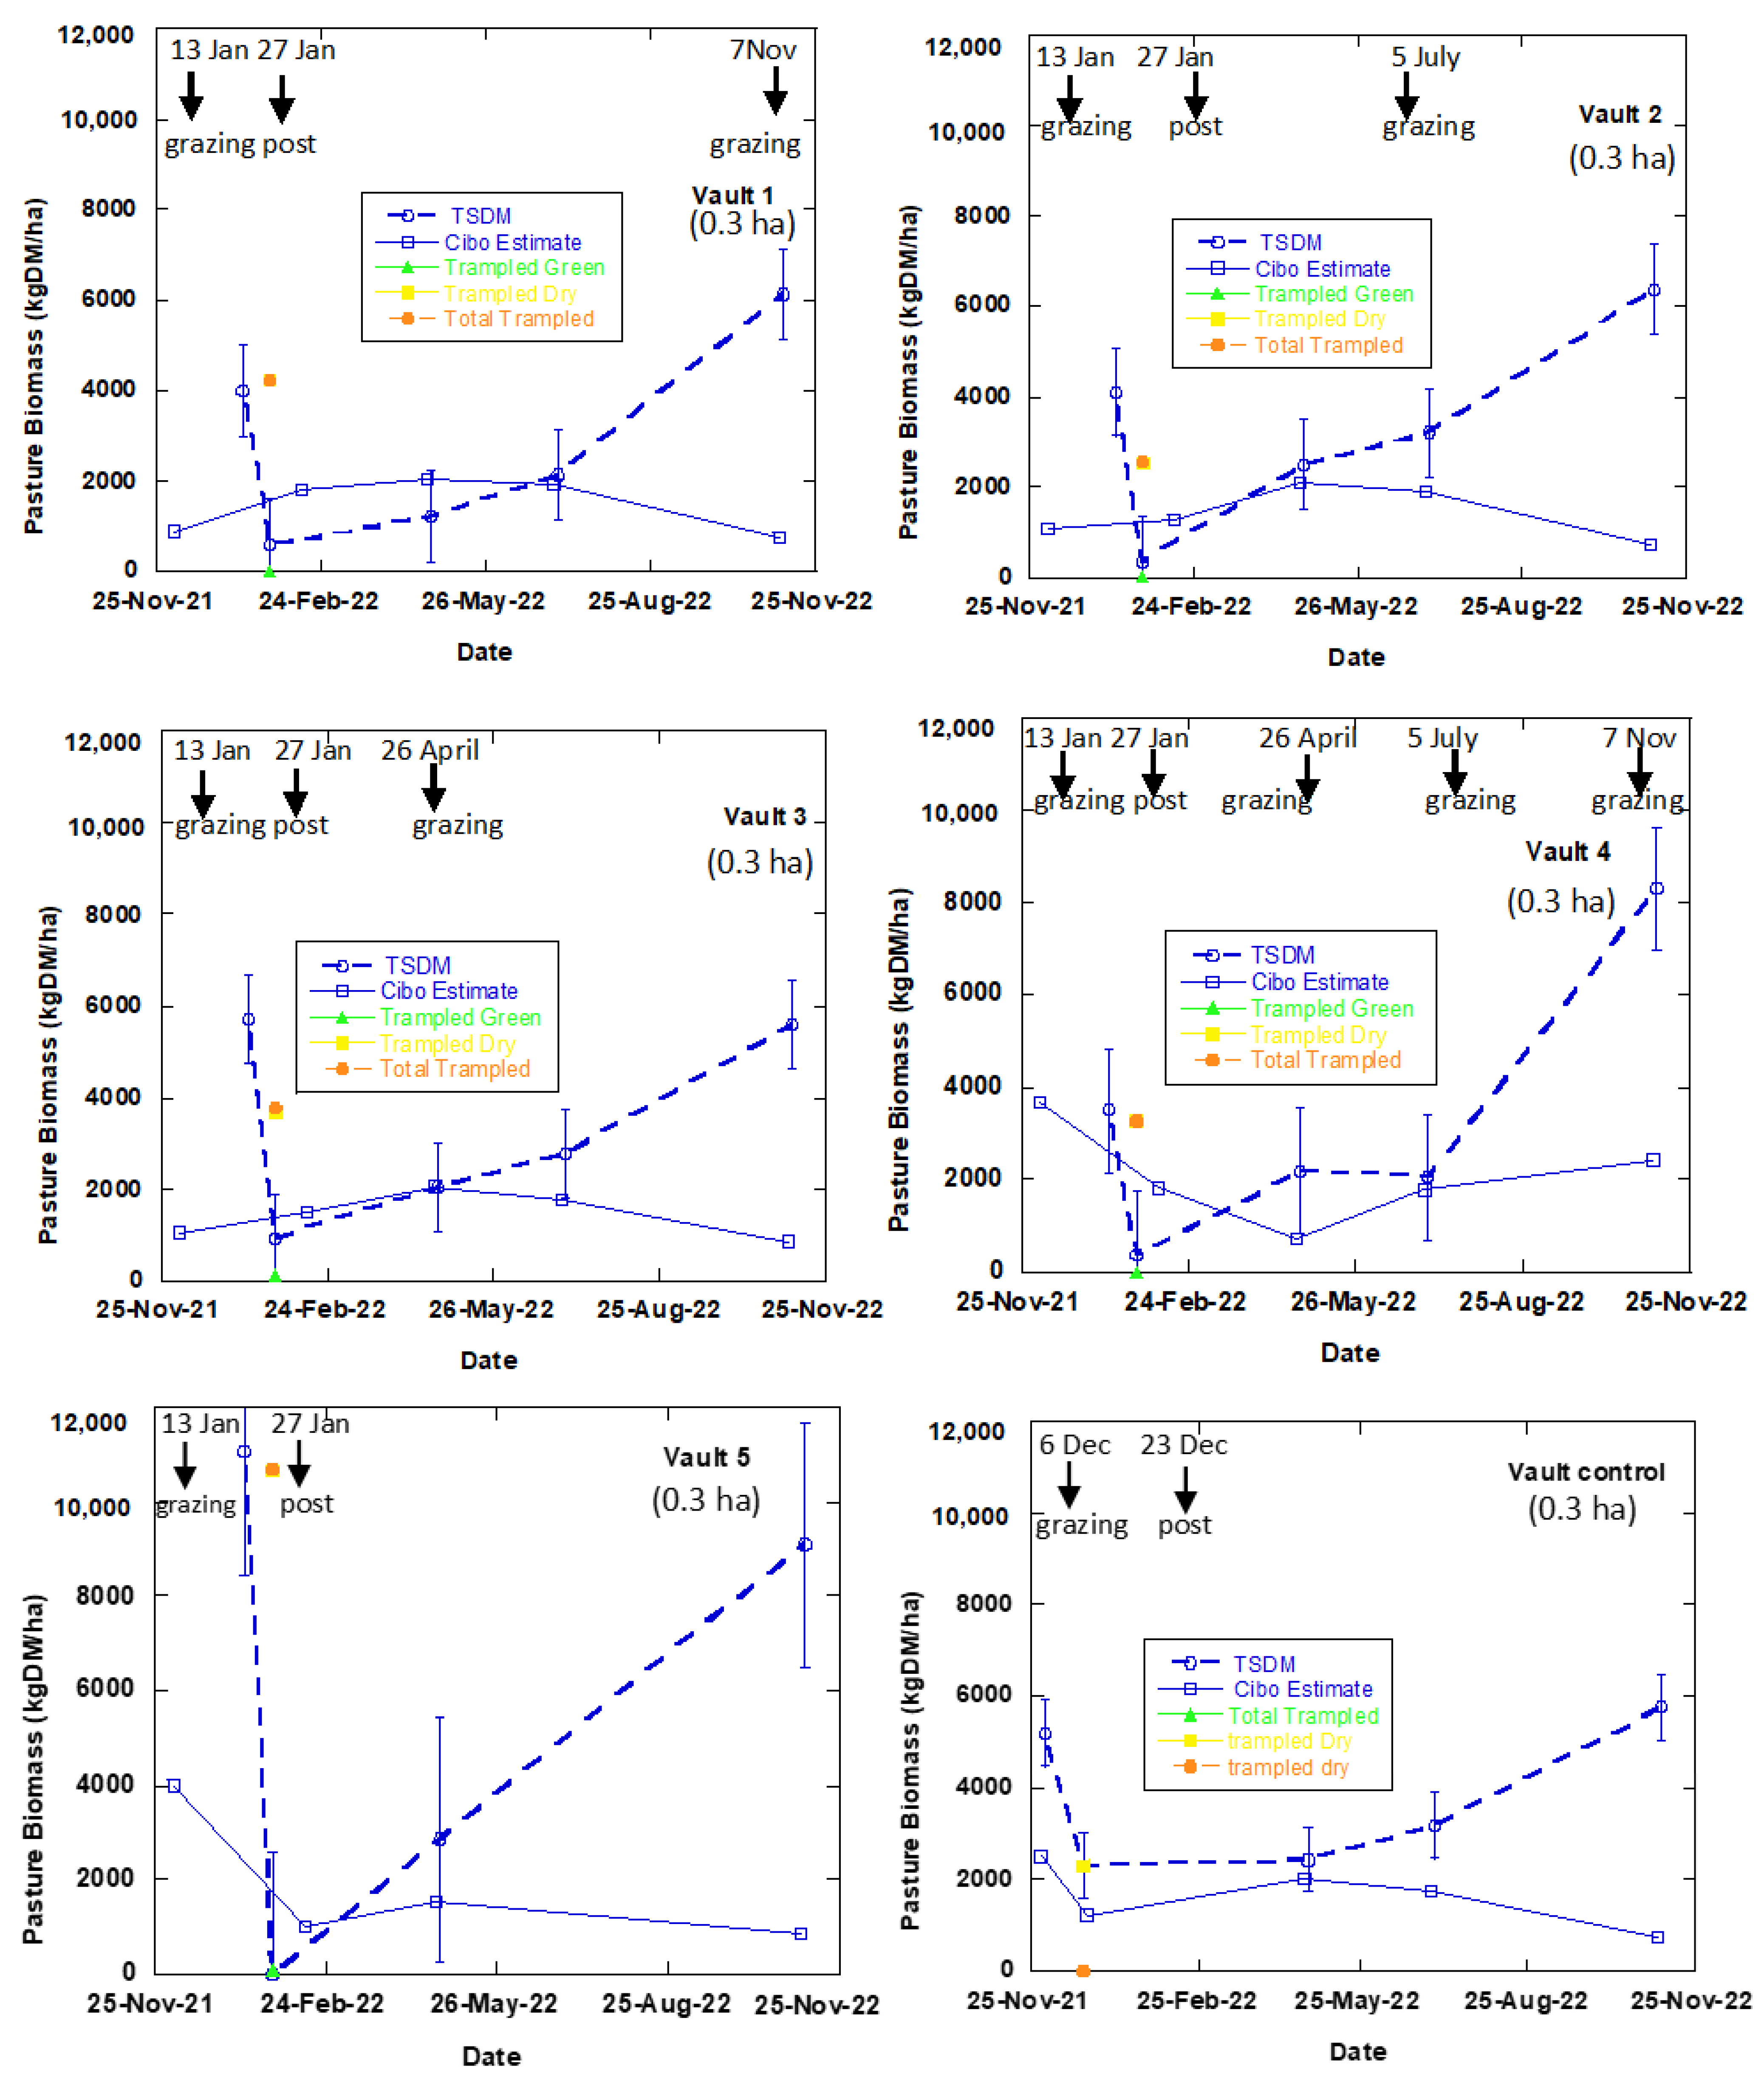
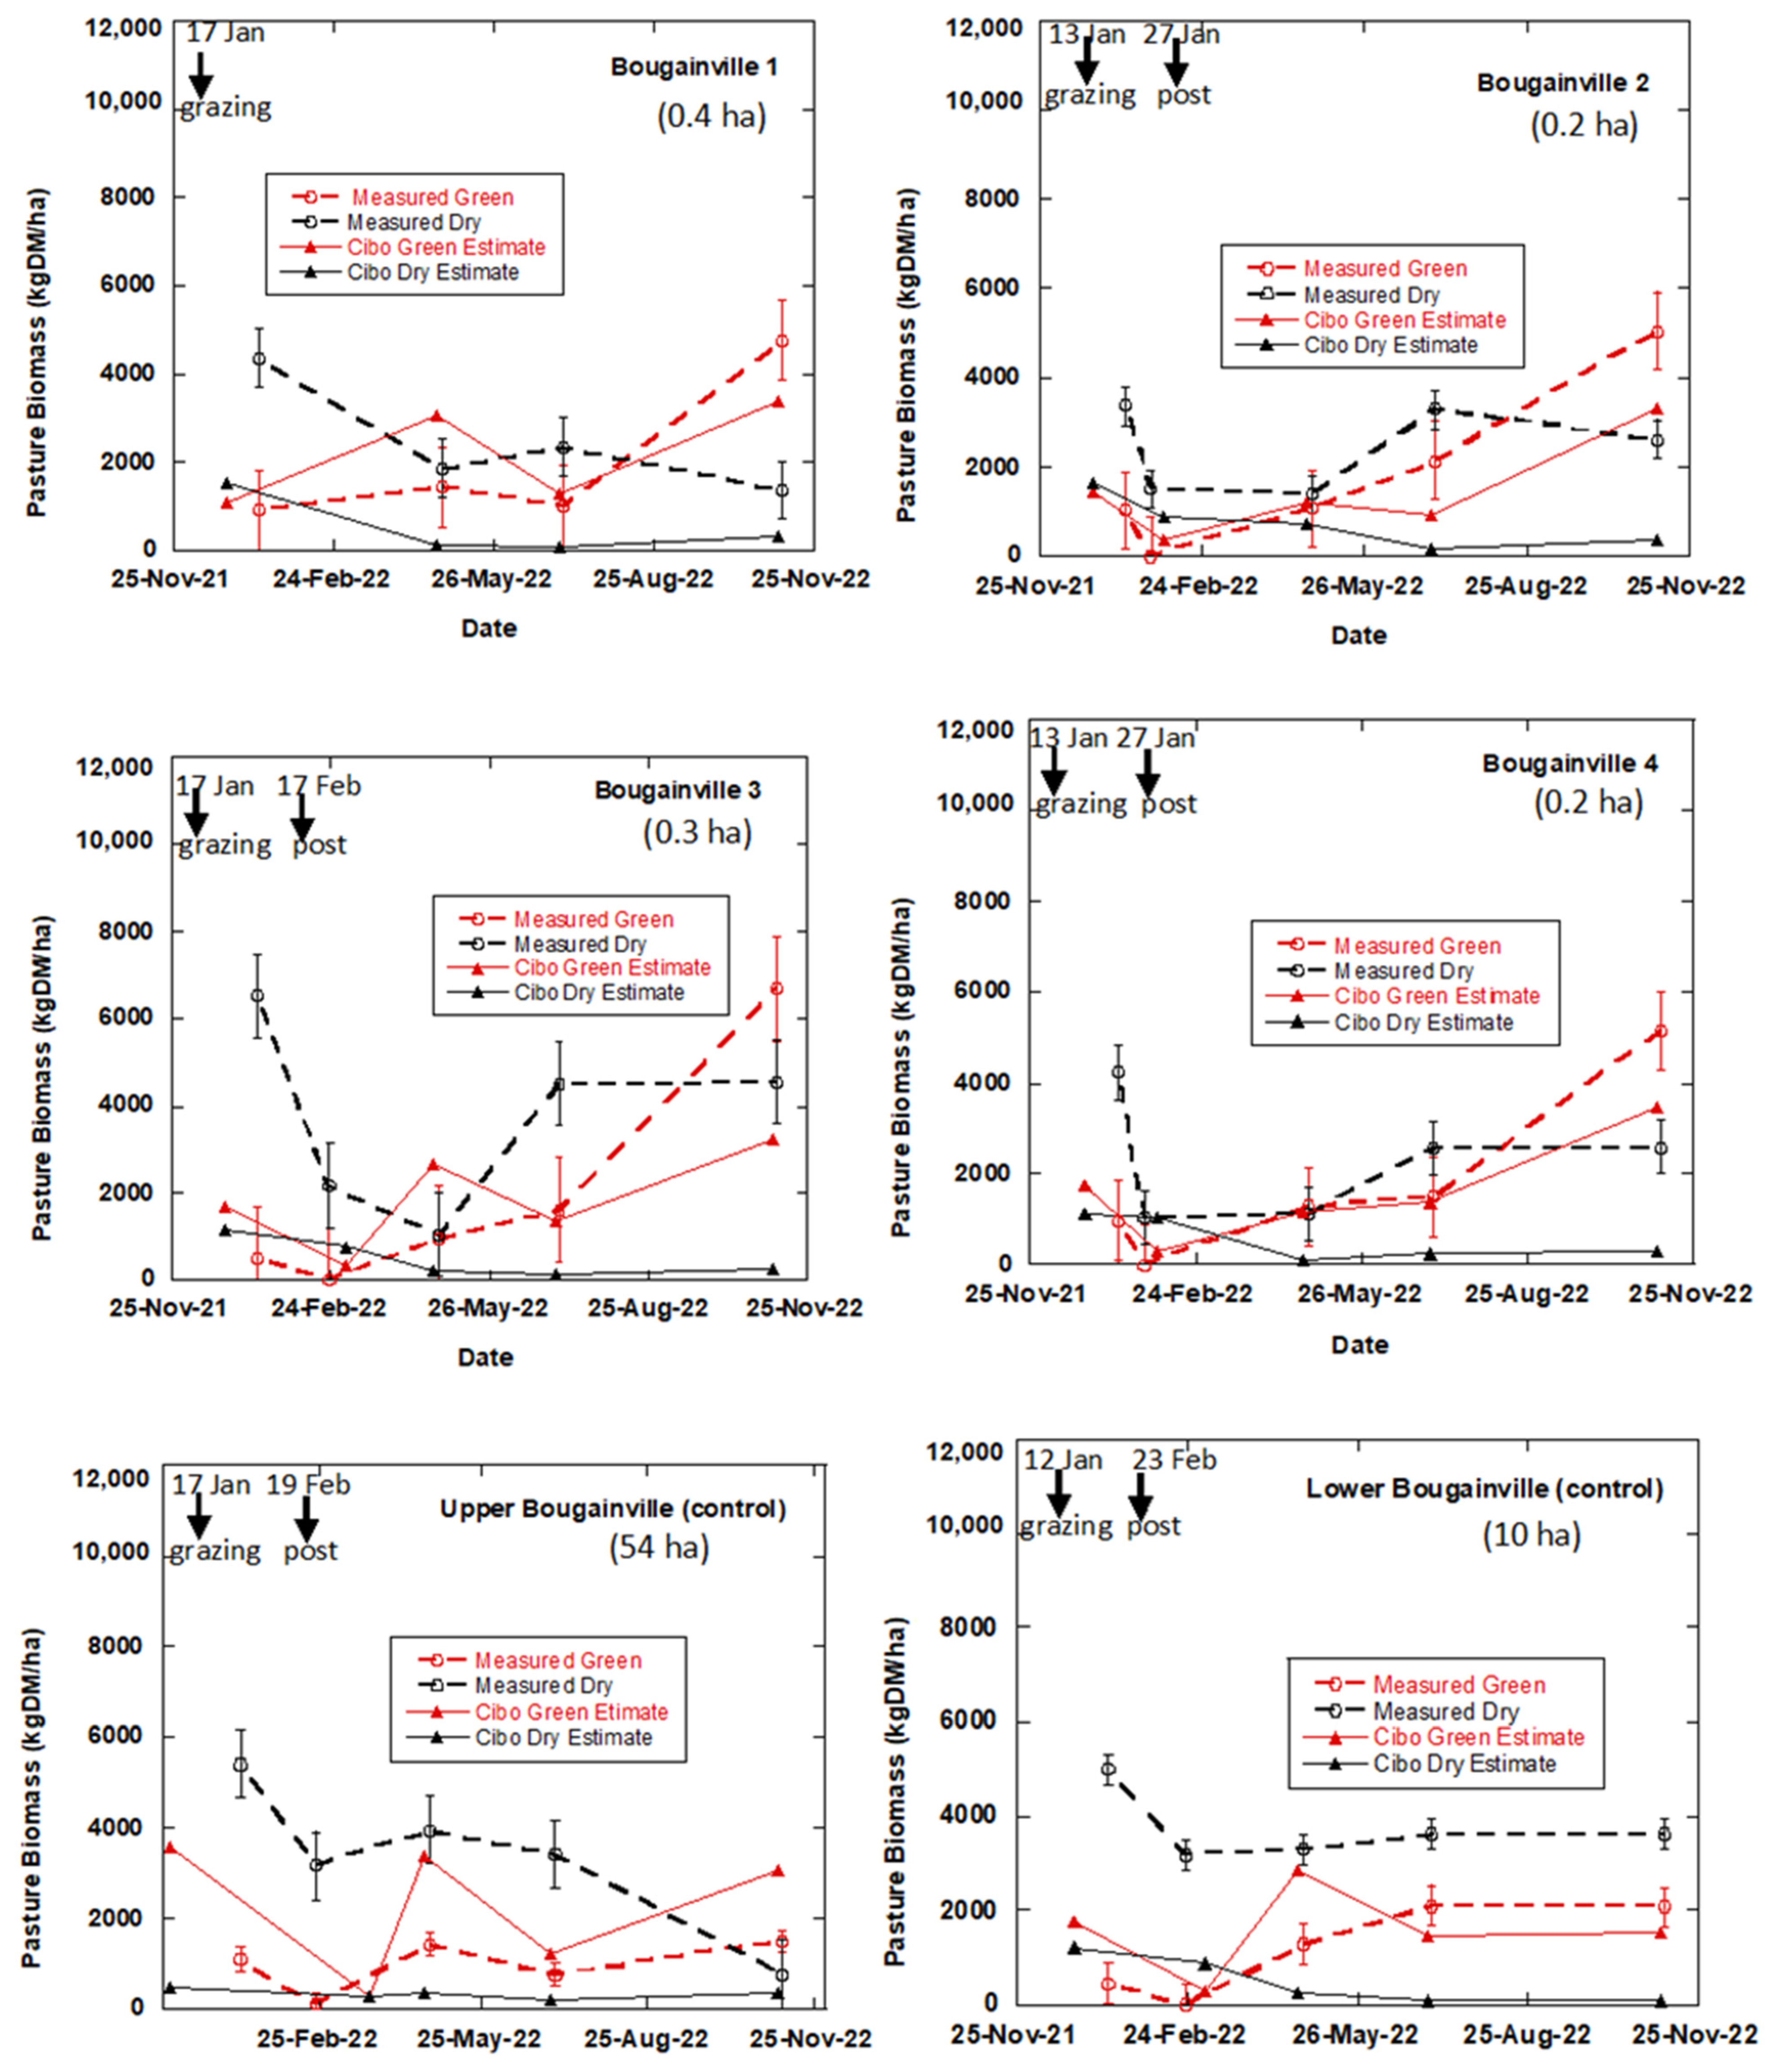
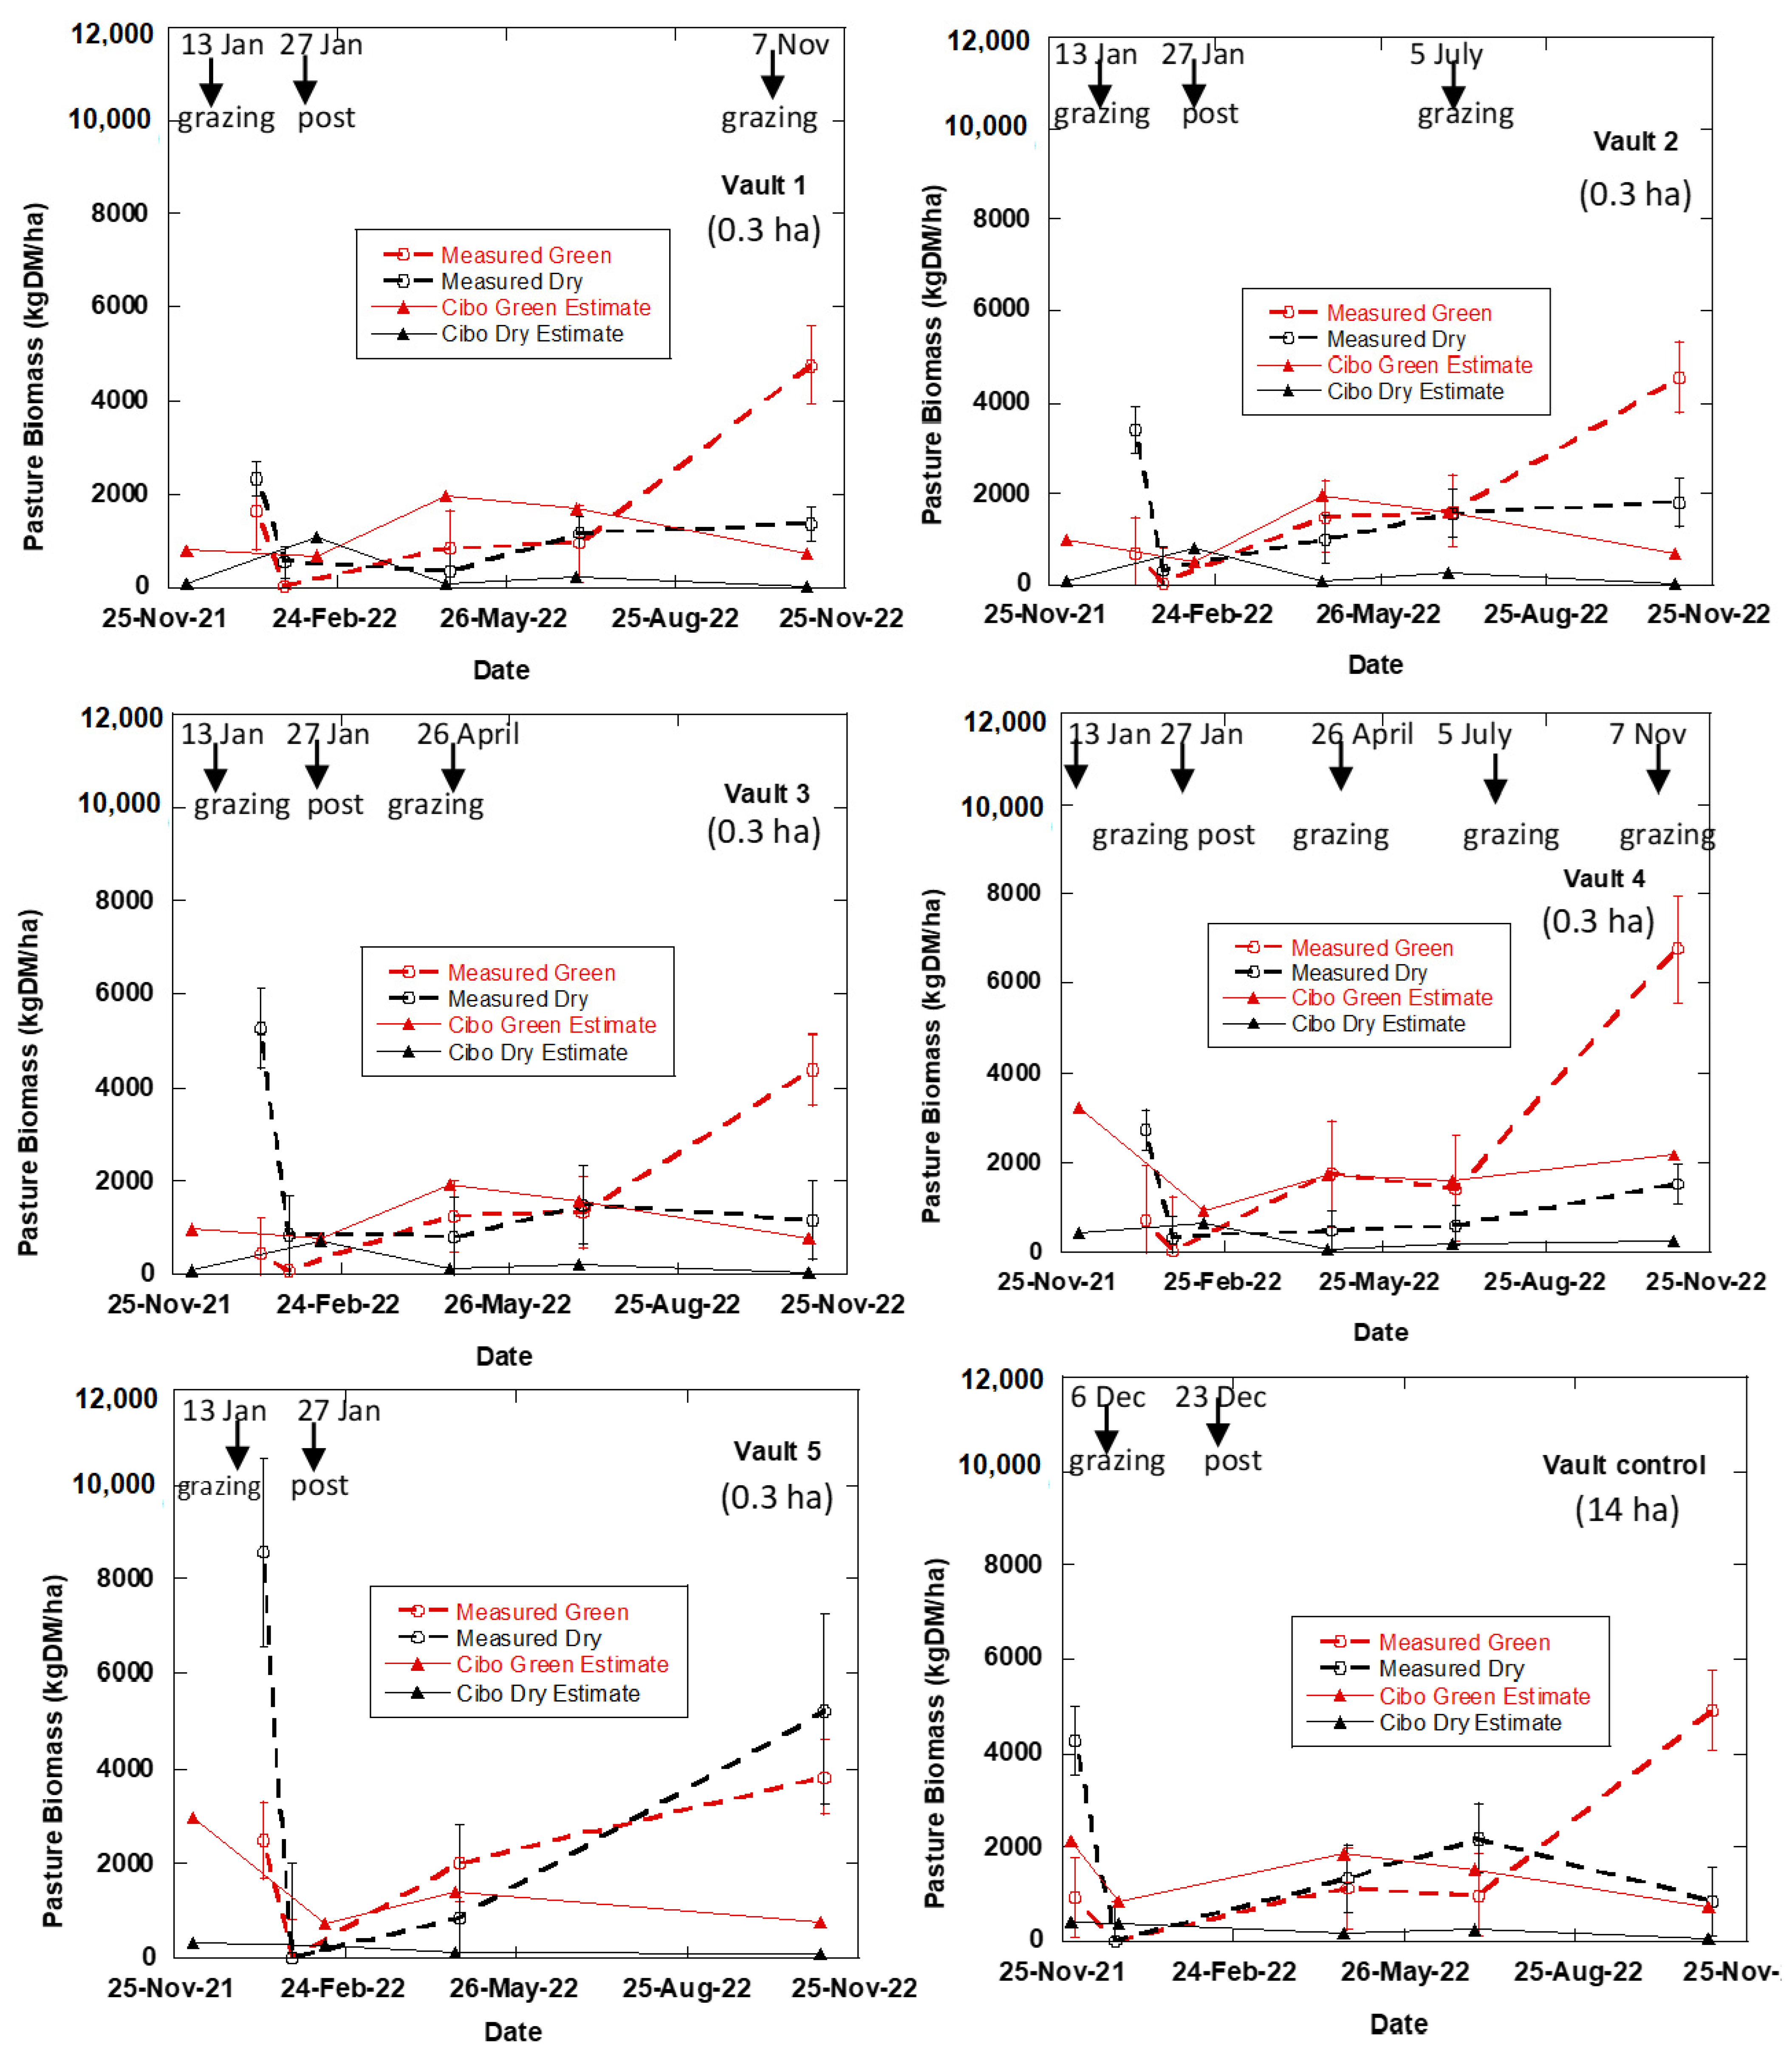
3.1. The Effects of Regenerative Grazing on Pasture Productivity, Consumption and Trampling

In all treatments and BAU plots, pasture biomass removal through intensive and conventional (control) grazing typically shows biomass loss between pre-grazing (December 2021–January 2022) and post-grazing (January–February) in phase 1 (Figure 3). This is also observed in phase 4, where Vault 2 and Vault 4 plots went through a post-grazing regime (Figure 3). The actual biomass consumed in the one-day grazing for all treatments is shown in Figure 3. As shown in Figure 3, the actual biomass utilised (see Equation (2)) through grazing is low compared to the trampled biomass (see Equation (3)) for all treatment plots (BAU inclusive). Therefore, trampling has a more significant effect on the TSDM than the actual grazing (i.e., consumption).
All treatments, including BAU plots, show similar temporal variability and trends of total standing biomass (Figure 4). A similar trend is observed in standing green DM and standing dry DM (Figure 5 and Figure 6). This indicates that the grazing intervals and the resting periods (3, 6, 9, 12, and 15 months) did not significantly influence biomass recovery or productivity in the experiment. For instance, after the first three months of rest in phase 1, where all treatment plots were grazed, pastures did not recover to the biomass level at the start of the experiment, likely due to seasonal variations in rainfall and temperature (Figure 5). However, following the consecutive increase in rainfall and temperature in winter through spring, total standing biomass increased, as observed in the Vaults and Bougainville 3 and 4 treatments (Figure 5). For example, the treatment plot (Vault 1) grazed only once (i.e., 12 months of rest) was similar to the Vault 4 plot, which was grazed every three months. In the same way, the Vault 5 plot that has not been grazed (i.e., 15 months of rest) is similar to the plot that was grazed every three months (Vault 4). In similar manner, the Vault 4 treatment is similar to the Bougainville 2–4 plots that were left ungrazed after phase 1 (Figure 3 and Figure 4). Only Bougainville 3 plot exceeded Vault 4 treatment in the TSDM during spring by 3000 kg DM/ha. Therefore, biomass removal and recovery through regenerative grazing or conventional method does not influence Vaults and Bougainville treatments (Figure 3).
During spring, the TSDM in the Bougainville 1–4 plots varied due to rainfall, as shown in Figure 3 and Figure 4. The Bougainville 3 plot had more available TSDM than the Vault 5 treatment, as seen in Figure 4. Since the Bougainville plots are situated on a sloping hill, it is uncertain if their location played a role in the significant biomass growth observed in Bougainville 2–4 during spring, as depicted in Figure 4. The Bougainville 1 plot had the lowest TSDM volume.
ANOVA and generalized linear models showed no significant association between plots and pasture biomass productivity (TSDM). However, there were significant differences when the date of grazing was used as an effect of treatment. Generally, the ANOVA test shows the effect of grazing date is statistically significant (p < 0.001) to the TSDM, while the post hoc Dunnett test does not show the level of interaction. Analysing the effects of dates of treatments and TSDM further with interaction using the GML model shows strong evidence of significant difference (p < 0.05) on 27 January 2022 by an estimated −11,076 kg DM/ha compared to other grazing dates. The treatment plots associated with the 27 January grazing event include Bougainville 2, Bougainville 4, Vault 1, Vault 2, Vault 3, Vault 4, and Vault 5. In contrast, there is no statistical evidence that the BAU (Lower Bougainville, Upper Bougainville, and Vault Control) is significantly different (p > 0.1) from variability in biomass. Therefore, we conclude that the effect of regenerative treatments (i.e., short, intense grazing, and rest periods) in the plots did not affect TSDM productivity and consumption. Only the trampling effect (surface disturbed by the high density of sheep) associated with the 27 January 2022 post-grazing event in phase 1 for Vaults (1, 2, 3, 4, and 5) and Bougainville 2 and 4 plots explained the variability in biomass. We conclude that regenerative grazing did not have an effect on pasture biomass productivity in the wet year of 2022. All treatment plots have similar results.
In summary, the Vault 4 plot with three months grazing interval has the highest volume of standing green DM compared with Vault 5 with 15 months of resting interval (Figure 5). The Vault 5 plot with 15 months of resting interval has the highest standing dry matter compared to other treatment plots as there was no grazing in this period (Figure 6).

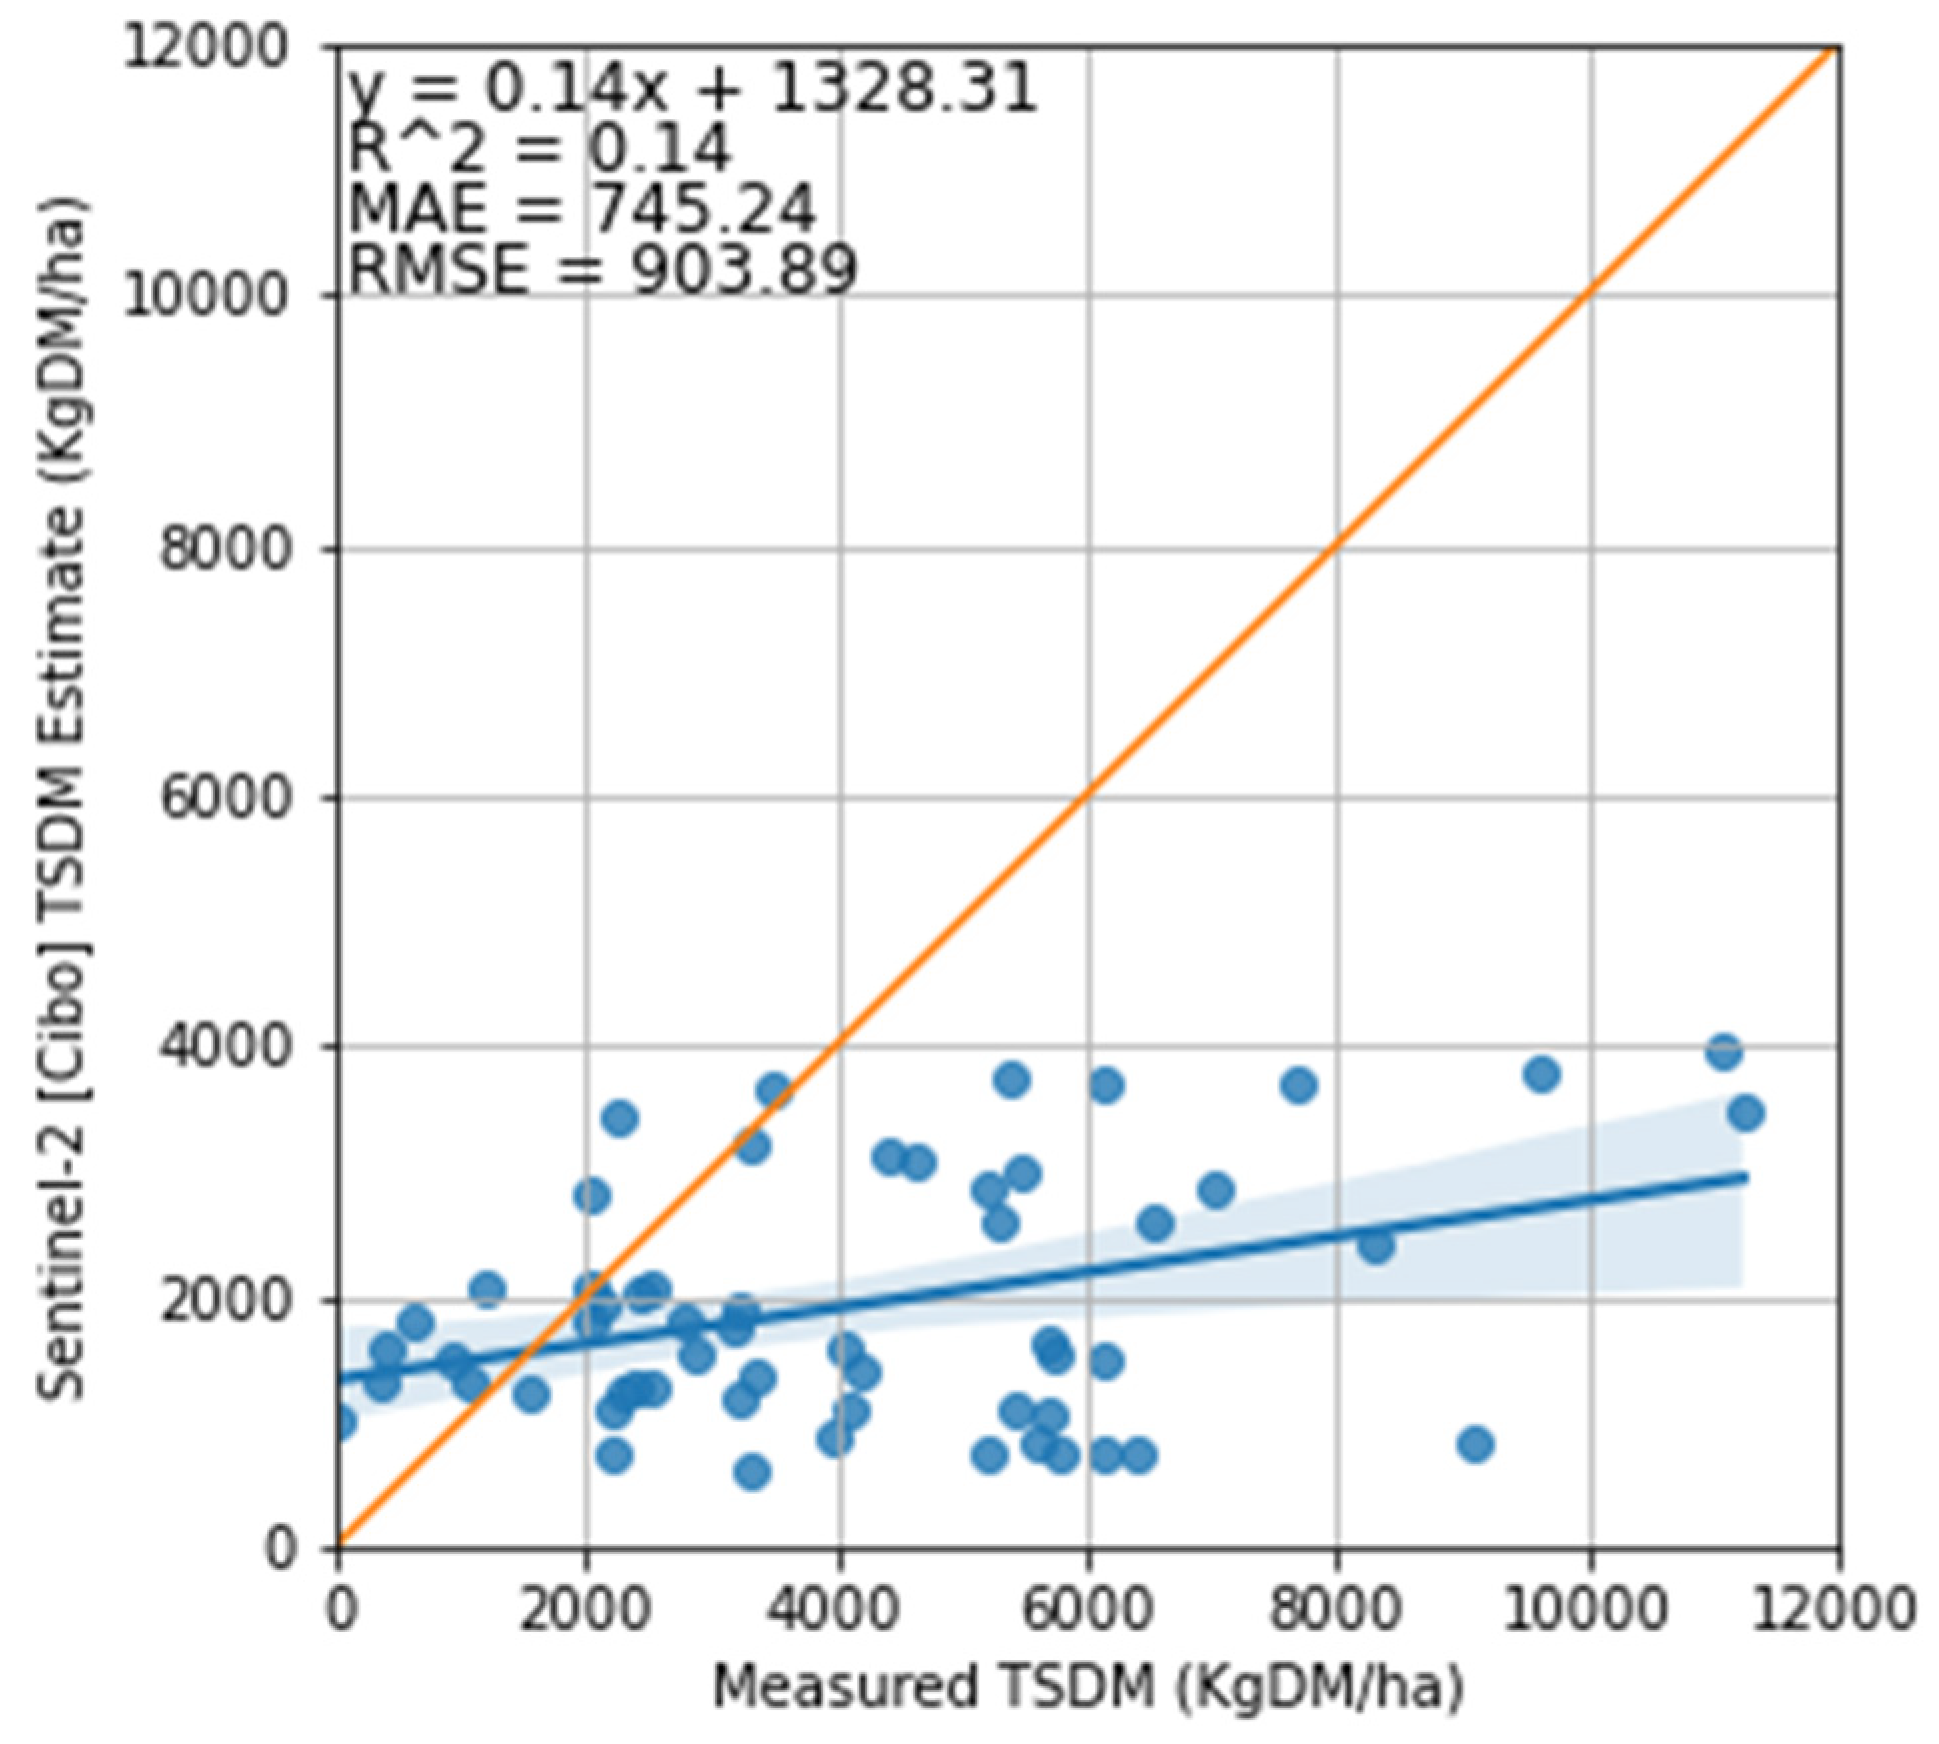
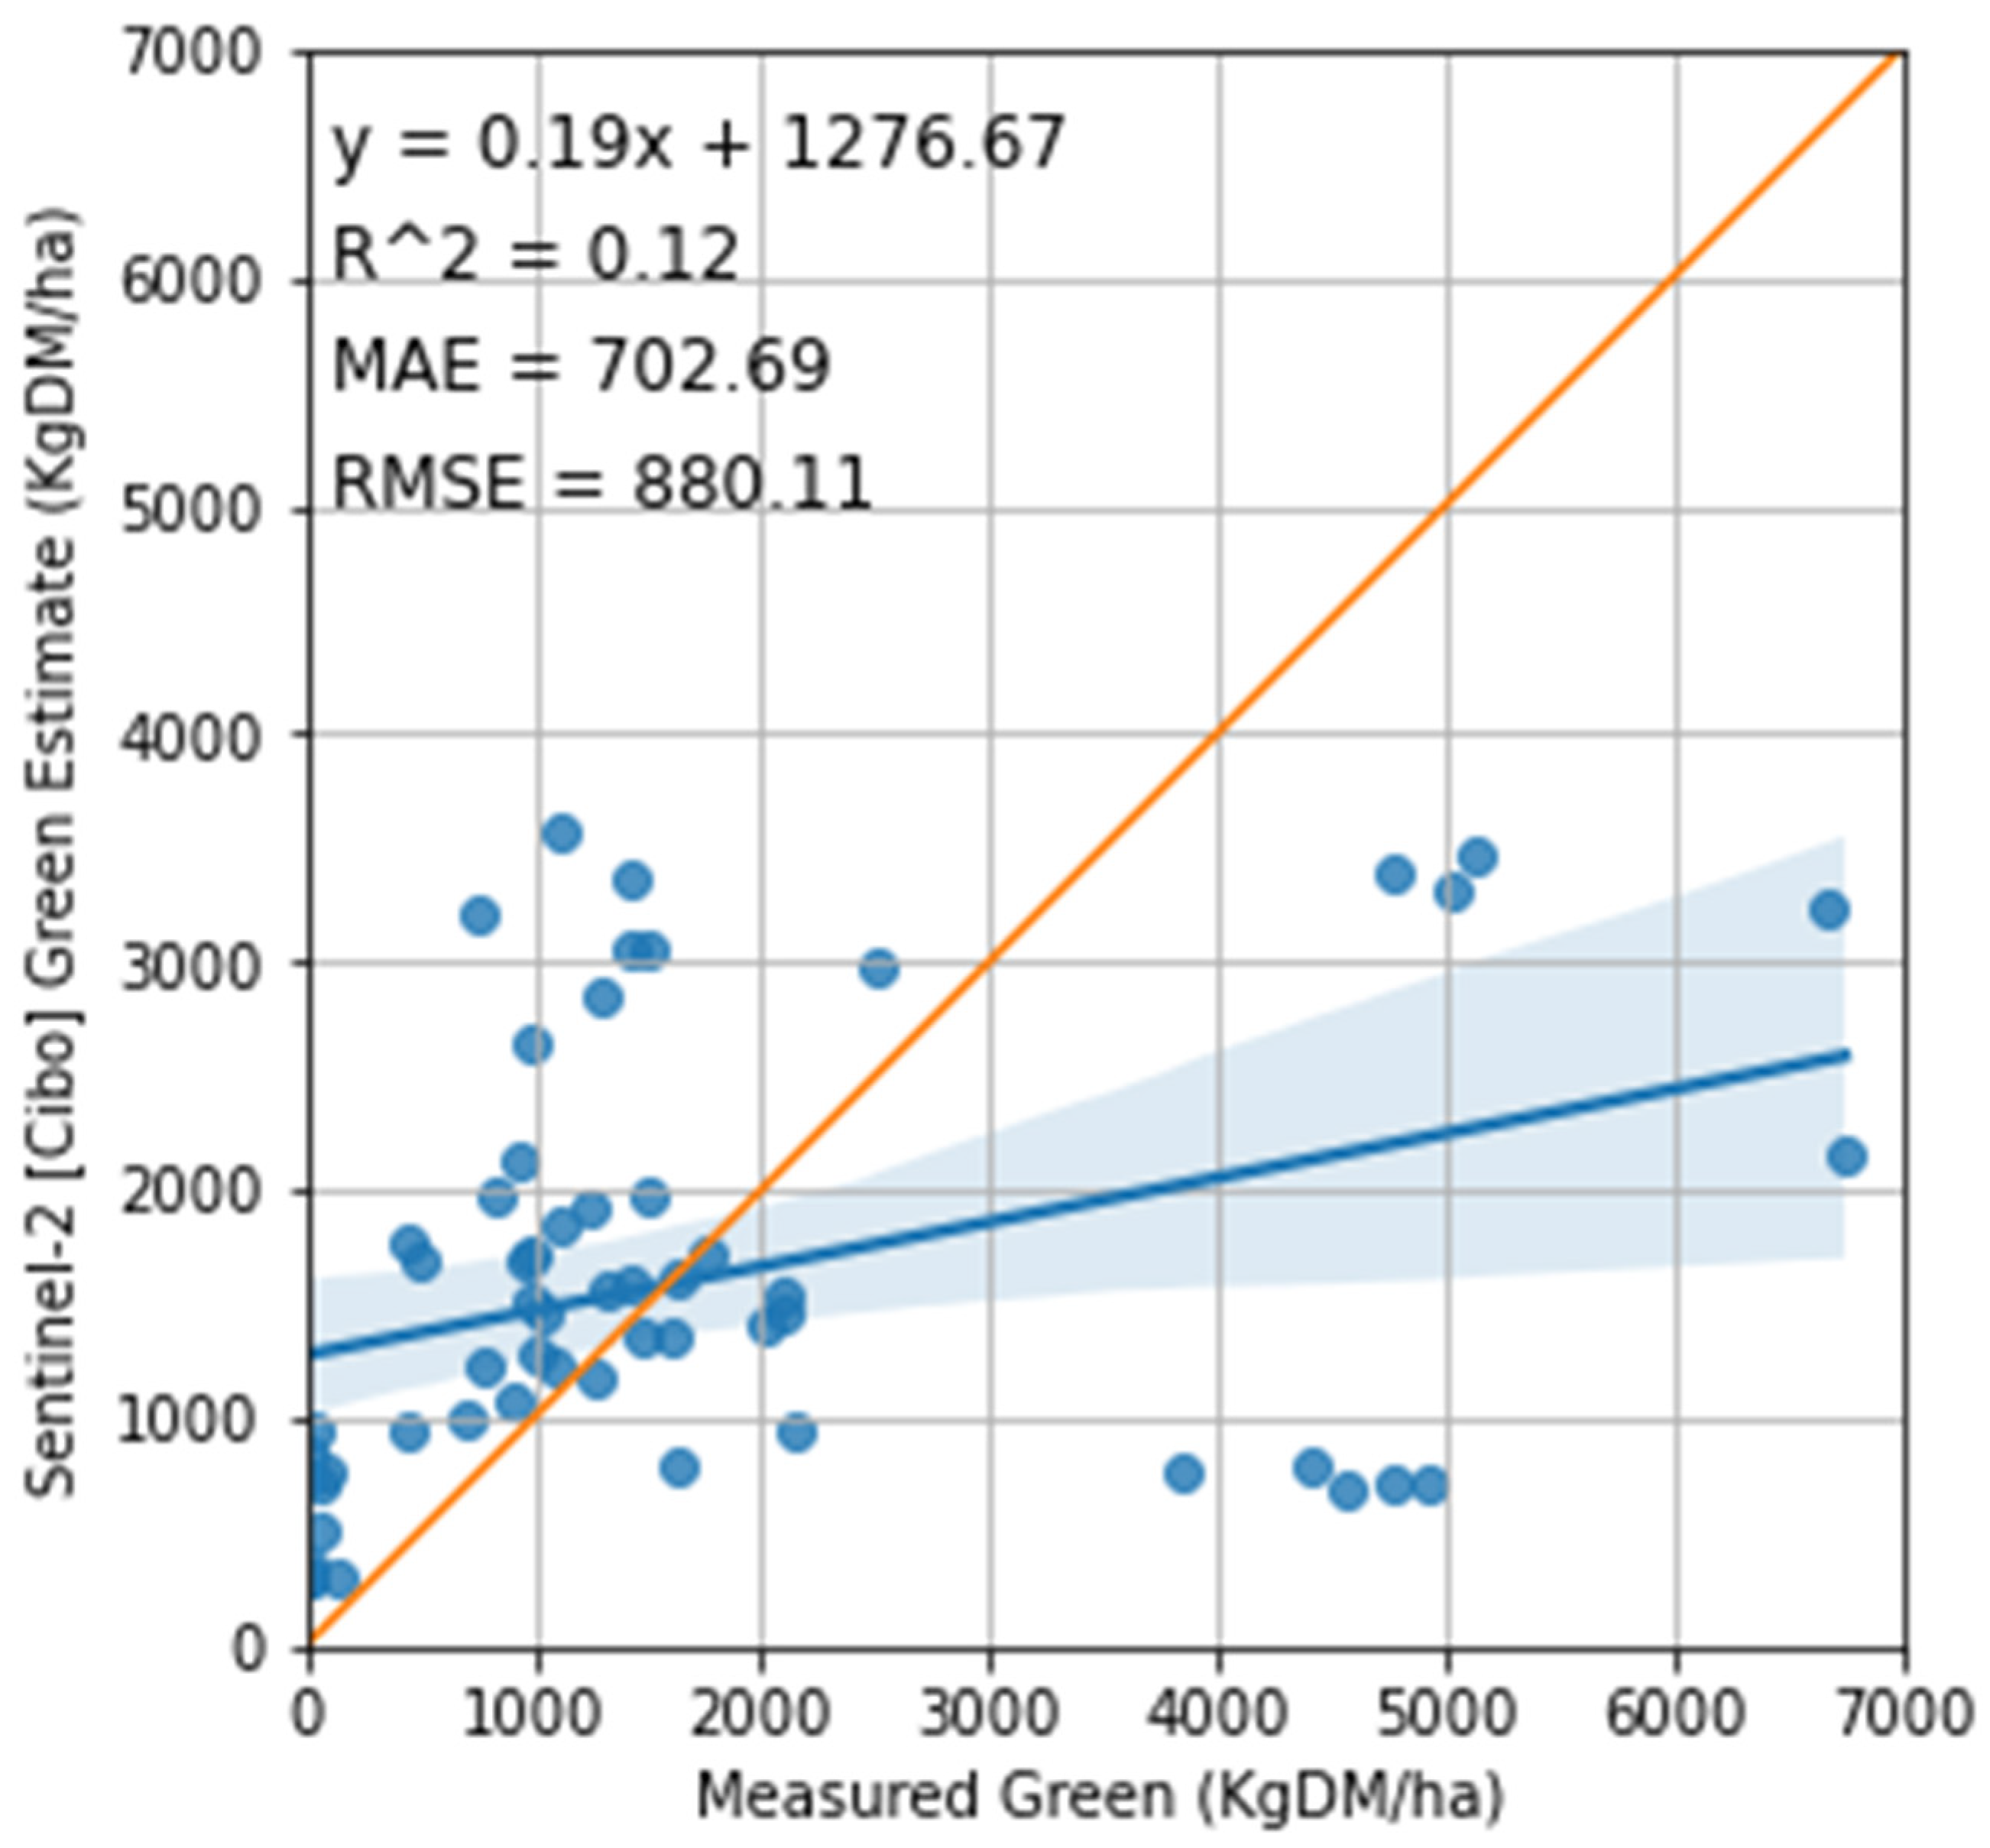
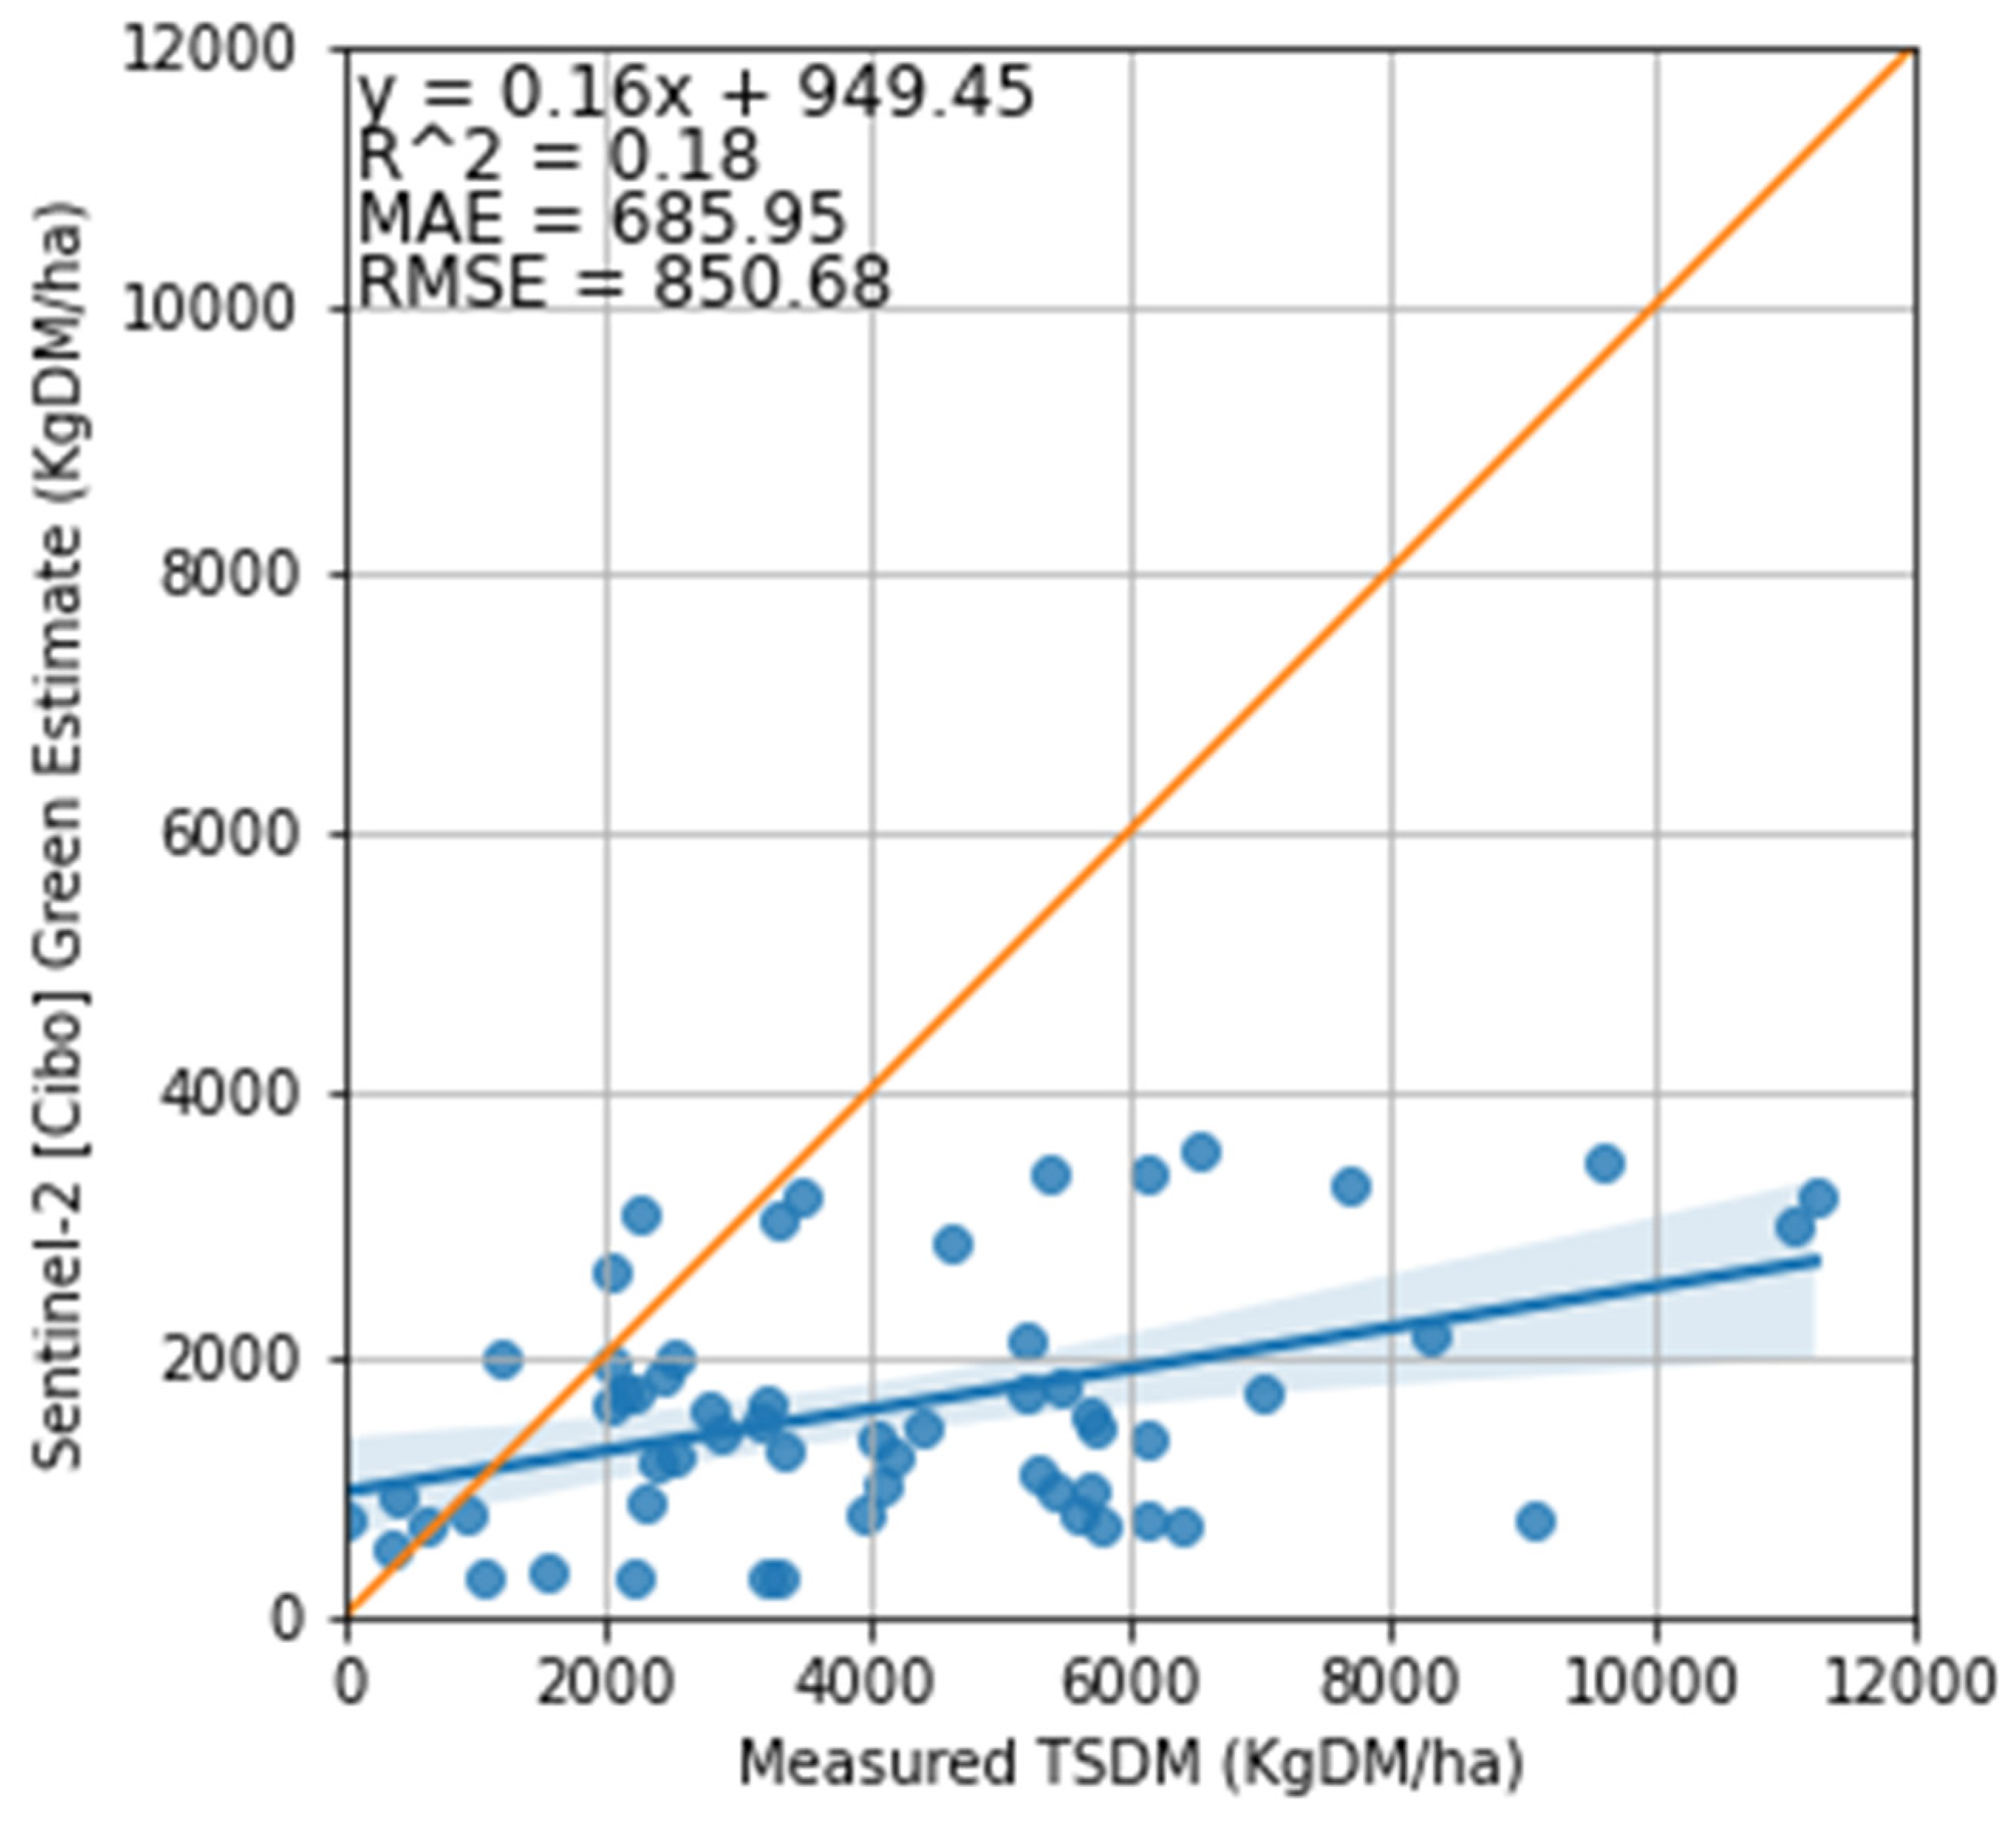
3.2. Satellite Estimate of Pasture Biomass

Cibo Labs (PastureKey application) utilises Sentinel-2 imagery to estimate TSDM, standing green DM, and standing dry DM in all the treatment plots, pre- and post-grazing (Figure 7 and Figure 8). The matchup of Sentinel-2 imagery with the measured biomass measurements ranges from 2 to 40 days. In the summer (5 December 2021 to 13 January 2022), six plots (Upper Bougainville, Vault 1 to 5) had a lag of 40 days between Sentinel-2 imagery and the measured data. A two-day difference was experienced in autumn (between 3 and 5 July 2022).
Cibo Labs accounted for the variability in the TSDM in the treatment plots (between and within) but underestimated this value, compared with the measured TSDM (Figure 9). There are instances (phases 1–4) where the satellite estimated TSDM values closely (Bougainville 1, 2, and 4 and Vaults 1, 3, and 4) matched the measured points. For all the treatment plots excluding Upper Bougainville and Lower Bougainville which went through conventional grazing (control), the Cibo Labs passes through one or more error bars, indicating it is within an acceptable variability of the measured biomass. The plot (Vault 4) which went through repeated grazing treatment every three months is more closely associated with the measured variability than Vault 1 which was grazed only once, or Vault 5 with 15 months of rest (Figure 7). The Vault 5 treatment plot has the highest variance.
The measured TSDM collected for the post-grazing event in Vault 5 on 27 January 2022 shows the total trampled residual (trampled green DM and trampled dry DM) was zero which implies that biomass in this plot was lying on the surface due to the effect of the high-density of sheep (Figure 7). In this treatment, the biomass utilised was 355 kg DM/ha for one day of grazing [Total standing dry matter (TSDM) before grazing − Total trampled dry matter (TTDM) after grazing, (11,076–10,721 = 355 kg DM/ha]. The unutilised trampled residual (green and dry) that was measured, 10,721 kg DM/ha has a corresponding estimate of 1004 kg DM/ha from the Cibo Labs. It, therefore, implies that although Cibo Labs underestimates the TSDM, it can account for the trampled residual that is of high volume.
Sentinel-2 imagery integrated with the Cibo labs model has a better capability of estimating standing green DM than standing dry DM (Figure 8). Although estimates are within the variability of the measured data points, in phase 1 (except Vaults 1 and 2 and Bougainville 1 and 2) and phase 2 of the experiment, Cibo Lab overestimated standing green DM (Figure 8). No clear relationship exists between the measured and estimates (Figure 7) for the 7 November 2022 (phase 4), similar to Figure 7. There is no correlation between the measured standing dry DM and Cibo Labs estimates. Cibo Labs underestimated standing dry DM—estimates are barely above ground level (Figure 8).
The correlation between the measured standing biomass and Cibo Labs estimates and their respective linear regression plots with R2, mean absolute error (MAE) and root mean squared error (RMSE) are shown in Figure 9, Figure 10, Figure 11 and Figure 12.

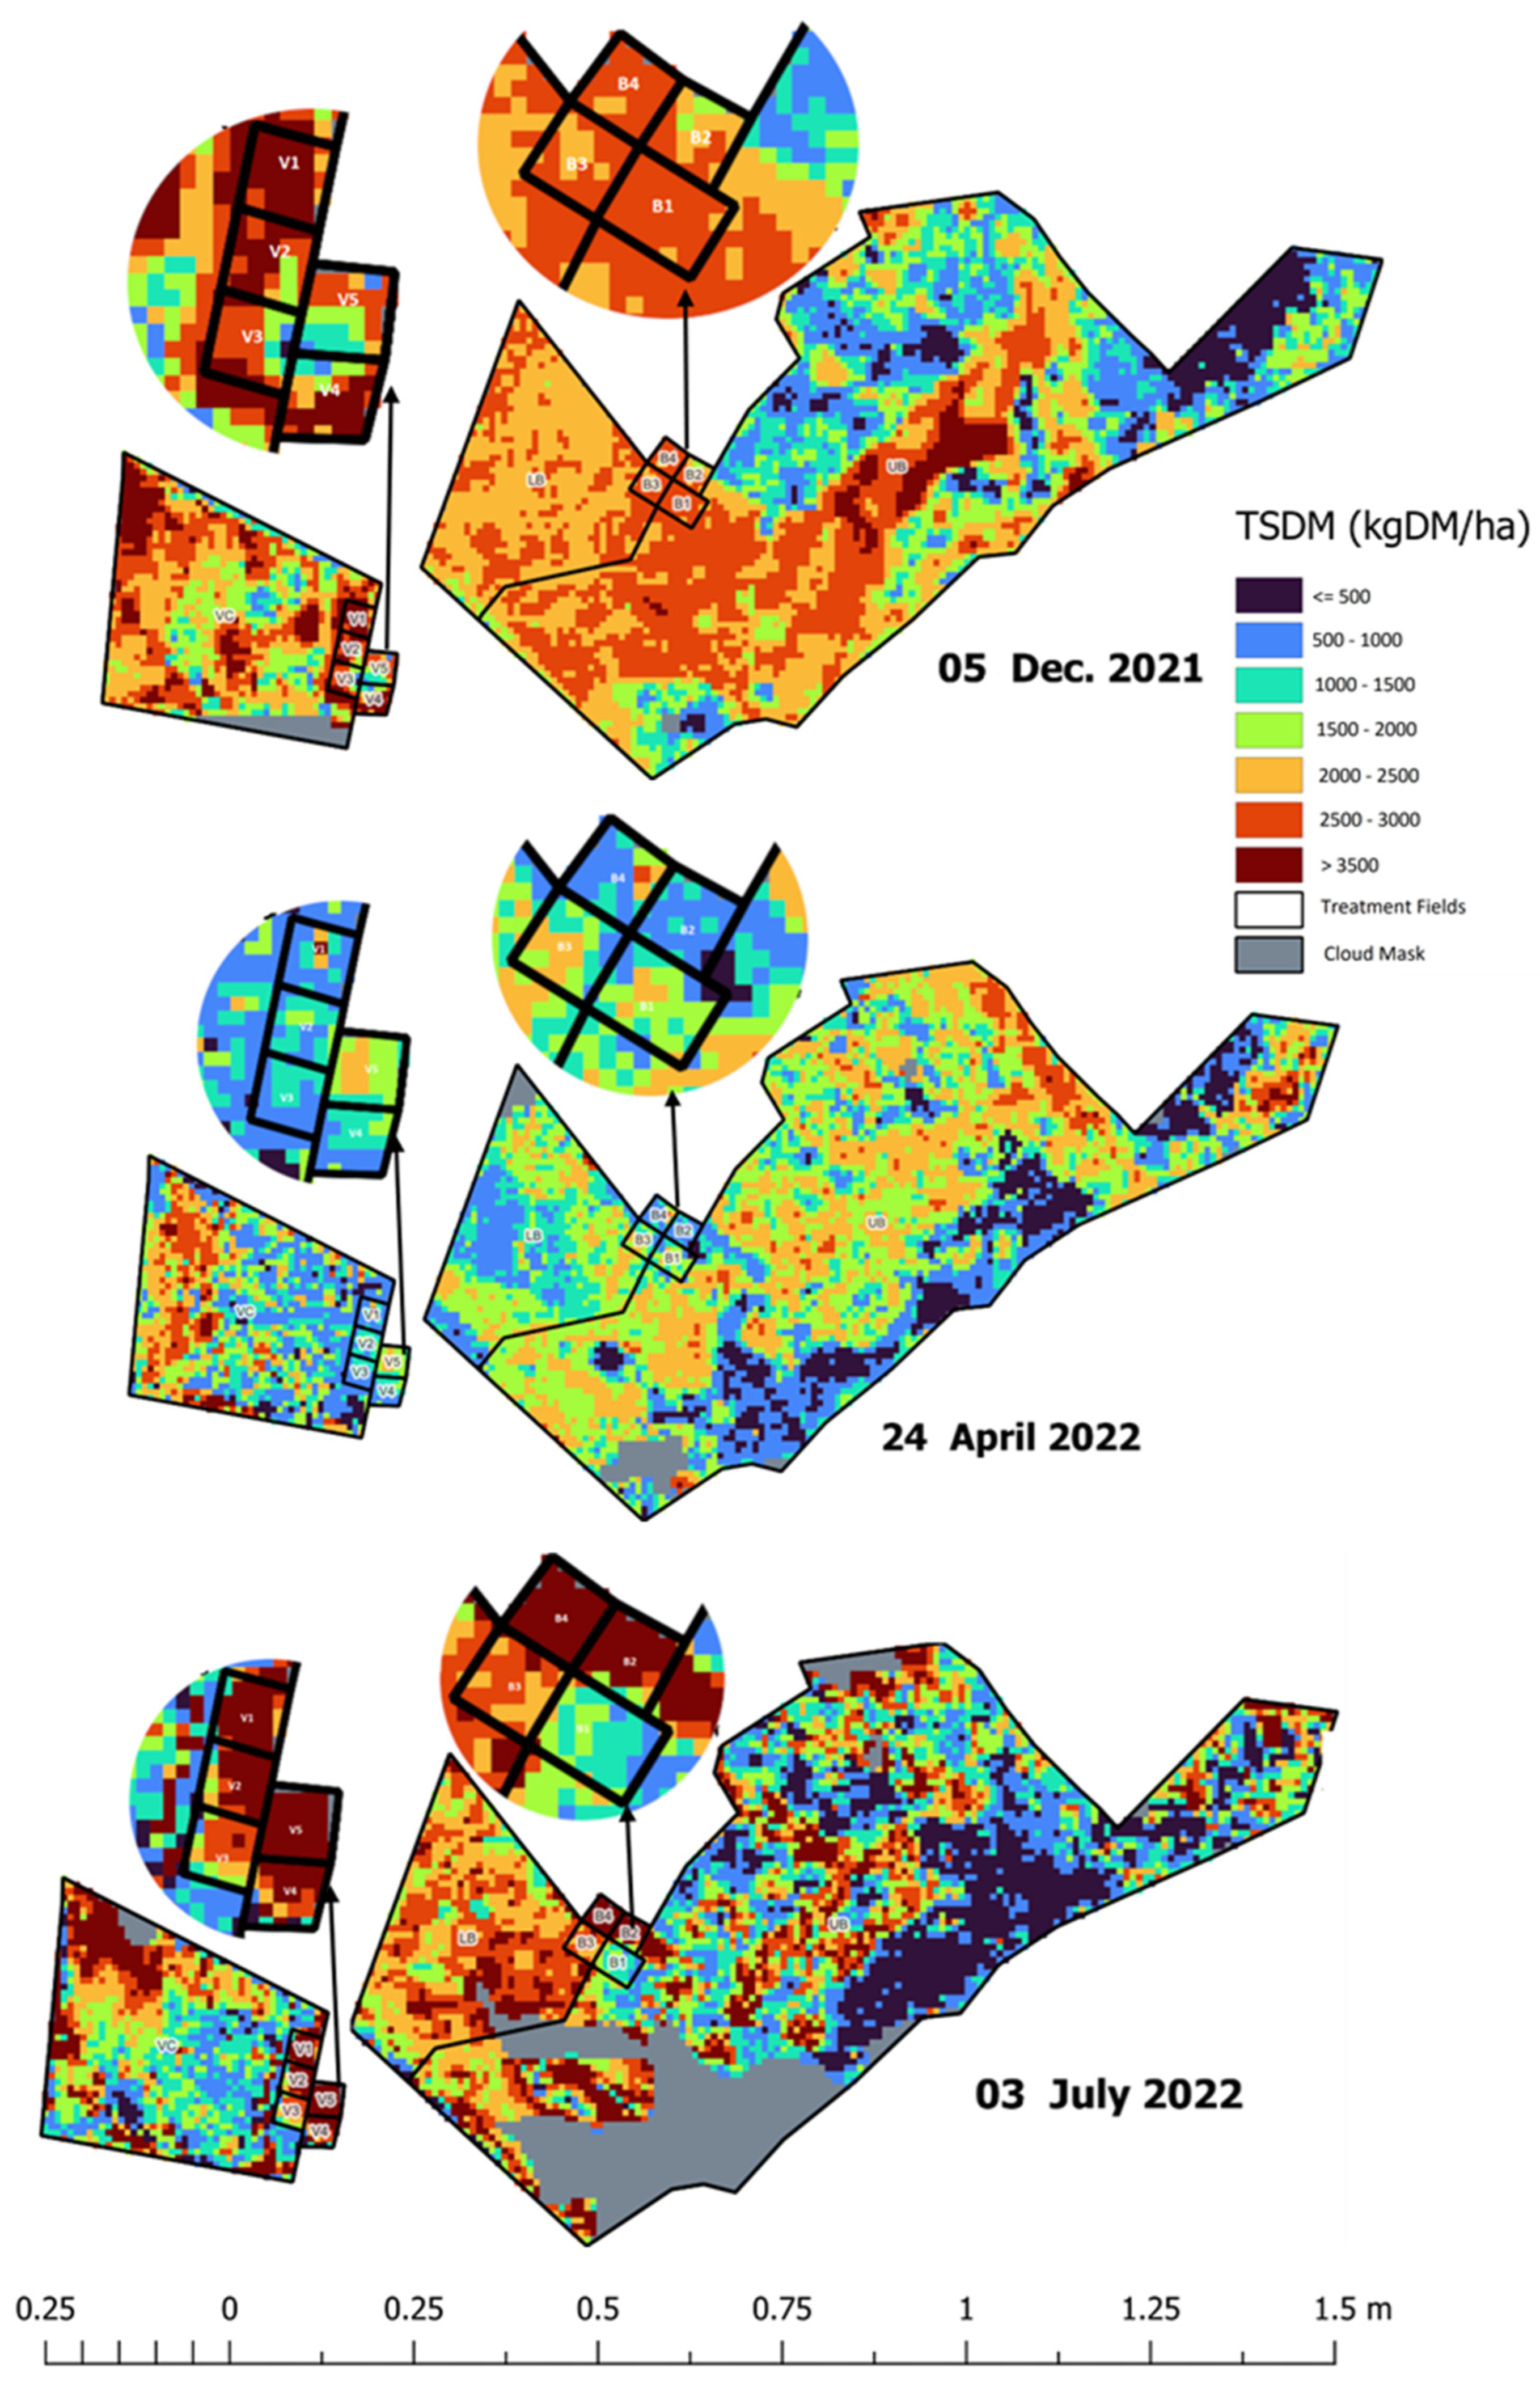
3.3. Spatial Maps Derived from Sentinel—2 Imagery and Cibo Labs Model

Cibo Labs derived Sentinel-2 maps for the treatment plots at Okehampton, Triabunna, Tasmania show spatiotemporal changes and the variability (within and across) in pasture biomass levels in all the treatment plots including control for pre-grazing and post-grazing activities such as the time series plot discussed in Figure 7. Cloud-free Sentinel-2 imagery to quantify the available pasture biomass against the ground measurement collected on 13 January 2022 before grazing the fields (paddocks) was on 5 December 2021. This makes a lag of 40 days between the available cloud-free satellite imagery and the ground measurement. All treatment plots started with more pasture biomass before grazing. All fields were grazed in phase 1 and left to rest for three months. All fields were grazed in phase 1 and left to rest for three months. After rest, the ground measurement collected on 26 April indicates the treatment plots have not recovered in autumn (proximal Sentinel-2 imagery available on 24 July). However, satellite imagery available on 3rd July against the measured pasture biomass collected on 5th July shows the plots (Vault and Bougainville) show increasing TSDM during winter. The map indicates Bougainville 1 (bottom) is the least-performing treatment plot with reference to phase 3 of the experiment. The maps correspond to Figure 3 and Figure 4 and the modelling time series in Figure 7. As shown earlier (Figure 3 and Figure 4), the map confirmed that Bougainville 1 is the least-performing plot.

4. Discussion

4.1. The Effects of Regenerative Grazing on Pasture Biomass Productivity, Consumption and Trampling

This study examined the effect of regenerative grazing treatments (i.e., short, intense grazing and rest periods) with smaller plots (less than 1 ha) on pasture productivity, consumption, and trampling. In the treatment plots examined, regenerative grazing did not influence pasture biomass productivity in the wet year of 2022. All treatment plots, including the ones used for conventional grazing (control), have similar results (Figure 3, Figure 4, Figure 5 and Figure 6). ANOVA and generalized linear models (GLM) showed no significant association between treatment plots and pasture biomass productivity (TSDM). However, there were significant differences when the date of grazing was used as an effect of treatment (Section 3.1). GLM model shows a strong statistical significance exists only with the treatment plots (i.e., Vault 1, Vault 2, Vault 3, Vault 4, Vault 5, Bougainville 2, and Bougainville 4) associated with the post-grazing event of 27 January 2022 (Section 3.1). Therefore, this study concluded that the variability in the TSDM can only be explained by the treatment plots associated with the post-grazing regime in phase 1 of the experiment. The time series charts in Figure 3, Figure 4, Figure 5 and Figure 6 confirm that although all treatment plots exhibited similar results, Vaults 4 and 5 showed significant variability with pasture biomass productivity. Similarly, the Bougainville 2, 3, and 4 plots benefited from rainfall to produce more biomass in the spring [53].
The effect of resting interval (3, 6, 9, 12, and 15 months) for TSDM to recover in the plots did not contribute to biomass variability (Figure 3 and Figure 4). The main effect of treatment in the plots is associated with the high stocking rate, which resulted in a high volume of trampling residual (i.e., 27 January 2022). This implies that the actual biomass utilised (i.e., TSDM minus trampling residual) for grazing in the treatment plots was significantly low (Figure 3). In all treatment plots (including the BAU), the recovery or productivity of TSDM from summer through spring due to increasing rainfall followed a similar pattern (Figure 4). This showed that the influence of weather contributed to biomass recovery in a similar way, thereby confounding the effect of other treatments. For example, there was no significant difference between the Vault 4 treatment, which was grazed every three months, and Vault 5 with 15 months of rest. Similarly, there was no significant difference between Vault 1 treatment with 12 months grazing plan and the Vault 4 plot (Figure 3 and Figure 4).
The present study has shown that although grazing through an intensive or conventional approach reduces pasture biomass [13], intensively grazed paddocks/fields through a regenerative strategy provide pastures with adaptive management for quick biomass recovery and reduction in bare ground. The plot (Vault 4) subjected to three months of resting interval utilised residual biomass from the trampling effects of grazing and optimum weather conditions to produce the highest volume of standing green DM over other treatment plots (Figure 5). Therefore, we conclude that Vault 4 is the treatment plot with the best pasture biomass productivity. In contrast, the Vault 5 treatment plot with 15 months of resting interval produced the highest standing dry DM compared to other plots (Figure 6). The pasture biomass produced is actively senescing from a lack of utilisation.
We emphasise that the impact of favourable weather confounded the effect of treatments on pasture biomass variability or biomass recovery. Hence, the resilience of pasture biomass to drought could not be established. A longer resting interval is not recommended in a situation such as this with good weather conditions. An earlier study under a simulated environment of rainfall and other treatment variables considered a 30-day resting period insufficient to recover soil samples from trampling caused by intensive grazing rotation [54]. Although this and few other studies approached regenerative grazing in the sense of soil recovery [54,55,56,57], the same principle as the strategy employed here (pasture biomass utilisation) is used to stimulate microbial activities and soil functions. However, this study is the first to use an approach where the experiment conditions followed natural processes with no farm inputs (fertilizer, irrigation etc.) and a simulated environment. Our results indicate that post-grazing data provides an incentive to determine the effect of trampling, which according to the analysis in this study, is limited. Trampling residual data provides information about the actual biomass utilised by the grazing livestock, which in turn gives insight into liveweight gain [54]. Furthermore, the actual biomass utilised for grazing is negligible compared to the trampled residual. Therefore, to minimise biomass wastage through trampling while achieving regenerative grazing sustainability [8], future work will focus on adjusting the stocking density to accommodate more grazing days (3 to 5 days). This is because, in practice, one day of grazing may be infeasible [54] with limited land resources and logistical constraints. In addition, having 3 to 5 days of adjustable stocking rate instead of 1-day grazing would support a more effective intensive rotational grazing regime within a multi-paddock system. Future research opportunities exist in understanding the resting period that will be sustainable to recover pasture from the trampling effect.

4.2. Satellite Estimates of Pasture Biomass

In this study, we examined the usefulness and accuracy of PastureKey, an application from the Cibo Labs, and derived from 10 m resolution Sentinel-2 imagery estimates of total standing dry matter to support regenerative grazing at the farm level. The usefulness of the tool was examined with respect to capturing TSDM (standing green DM and standing dry DM) variability in the treatment and business-usual plots, similar to the one obtained by the destructive sampling approach. The accuracy of the Cibo Labs (used instead of PastureKey for convenience) was then examined by performing regression analysis on the interacting variables (standing green DM, standing dry DM, and total standing dry matter) with the sampled biomass.
Satellite estimates derived from the Cibo Labs model are within the sampled biomass’s variability for all treatment plots except the control (Figure 7). There is a closer correlation and high variability in TSDM with the Vault 4 plot, which has three months of resting interval and grazing treatment than other treatment plots. The standard error bars show that the measure of variability with the sampled biomass (Figure 7) correlates with the post-grazing event of 27 January 2022 for treatment plots Vault 3, Vault 4, Vault 5, Bougainville 2, and Bougainville 4, similar to the statistical (GML model) result obtained in Section 3.1. Therefore, Cibo Labs derived from Sentinel-2 imagery can monitor the spatiotemporal variability associated with TSDM for all post-grazing events and the plot (Vault 4) with a regular regenerative grazing plan at the farm level. The Vault 5 plot with the 15-month resting interval has the highest degree of uncertainty compared with other plots. In addition, our findings reveal that Sentinel-2 imagery can account for the trampled residual as in Vault 5, where the TSDM is zero against the trampled biomass (high volume of lying biomass) for the post-grazing event on 27 January (Figure 7). The total trampled residual in this plot was 11,072 kg DM/ha compared to 1,004 kg DM/ha of Cibo Labs estimated as TSDM. While the Cibo Labs Sentinel-2-derived model could provide useful information about regenerative grazing for the treatment plots the plots used for conventional grazing (BAU) (Lower Bougainville, Upper Bougainville, and Vault Control) are challenging to estimate (Figure 7).
Regarding the accuracy of the Cibo Labs estimates, the model underestimated the total TSDM in all treatment plots with MAE of 745 kg DM/ha and RMSE of 903 kg DM/ha (Figure 7 and Figure 9) and overestimated the standing green DM (Figure 8 and Figure 10). In addition, the model significantly underestimated the standing dry DM. (Figure 8, Figure 11 and Figure 12). The overestimation of the standing green DM and underestimation of the standing dry DM by the Cibo Lab model reveals that the model calibration is too sensitive to green vegetation and less to dry vegetation. In spring, when biomass growth reached optimum, the model underestimated TSDM in all plots but performed better in the Bougainville plots. The performance of the Cibo Lab model in Bougainville 2, 3, and 4 plots in spring is associated with the slopy hill, which influences the vegetation growth, distribution, and variations in biomass and productivity [58]. In the same way, the underestimation of TSDM in all plots in spring was caused by environmental conditions [16,59] (excess rainfall and soil type), which were not considered during model calibration. In general, the confounding influence of rainfall discussed in Section 3.1 and Section 4.1 hardly substantiated any variability in the treatment plots [60]. The fact that there was no statistical interaction between the treatment plots themselves and TSDM except with the grazing dates where we found strong evidence of significant difference with 27 January 2022, shows that there would have been a better correlation between satellite estimates and measured biomass with more post-grazing events. However, the time series charts (Figure 7 and Figure 8) show Sentinel-2 imagery and predictive machine learning model can provide estimates of pasture biomass in monitoring regenerative grazing at the farm level. Such estimates are available as a spatial map providing management decisions per plot as an indication of available pasture biomass. Previous work has demonstrated the capability of machine learning to derive pasture estimates from Sentinel-2 imagery at the farm level [16,28], though not applied to regenerative grazing schemes.

4.3. The Feasibility of Using Sentinel-2 Imagery to Estimate Total Standing Dry Matter

Here, we demonstrated that Sentinel-2 imagery could be used to retrieve TSDM, standing green DM, and standing dry DM through a simple but powerful predictive machine learning to support regenerative grazing that considers a regular grazing and recovery period. To the best of our knowledge, this study is the first to examine this approach at the farm level. However, cloud constraints are one of the major limitations to model performance accuracy in this study. Tasmania is considered a medium-high latitude environment [45]. Despite using smaller fields of less than 1 ha, clouds over Tasmania hindered the consistent availability of Sentinel-2 imagery to feed the predictive machine-learning model used in this study. The lag effect between the available Sentinel-2 imagery and the sampling date ranges from 2 to 40 days (Figure 12). Earlier work supports the argument that time lag effects between field sampling and data from the satellite are a potential source of error to model performance [61,62,63].
Although the model could retrieve TSDM through inherent Sentinel-2 SWIR band inclusion [19], the association between Cibo Labs TSDM and standing dry DM shows a weak relationship (Figure 11 and Figure 12). Summer is characterised by a high concentration of senescence (Figure 7, Figure 8 and Figure 12) intermixed with green vegetation. Hence, it is challenging to distinguish senesced from healthy vegetation despite the high spatial resolution of Sentinel-2 satellite [64].
A future optimisation study on estimating TSDM with a similar predictive machine learning model will consider more robust ground/field samples that will complement observation satellite data to improve accuracy. In the present study, the number of data available was limited to the summer of 2021 through the spring of 2022 on one farm. The review of [22] suggests that the accuracy of machine learning approaches in estimating aboveground biomass depends on the data source, the number of ground/field samples, pasture species composition, and addressing the errors associated with the algorithms. The improvement of pasture biomass prediction with the ANN algorithm from a similar study on five farms in Tasmania was based on the inclusion of more input parameters (meteorological data) to achieve 0.60 [16]. Sentinel-1 imagery, a synthetic aperture radar, may help address cloud constraints and saturation of optical instruments in cases where limited field datasets are available to estimate pasture biomass [65]. In addition, the frequency of Sentinel-2 imagery can be enhanced by interpolating a daily revisit high resolution of Planet Lab to account for missing data [64,66].

5. Conclusions

We conclude that regenerative grazing with short recovery periods (3–6 months) was most conducive to increasing pasture production under high rainfall conditions. In the one-day grazing treatment, sheep could not exploit selective grazing, but rather the trampling of pasture biomass, which is caused by the disturbance from the high stocking density in the treatment plots. The trampled residual from the post-grazing event was found to be statistically significant, thus, providing an insight into the source of variability in the treatment plots. In the one-day grazing, an insignificant biomass volume was utilised. Therefore, being one of the pioneering studies in this field, there is an opportunity for future research to understand the effect of regenerative grazing in drought or in a year with moderate rainfall. More work is needed to understand the effects of more grazing days (3 to 5) to make regenerative grazing sustainable. Additionally, more robust data on post-grazing should be considered since it is the main effect in the current study.
This study demonstrated that a predictive machine learning model could be developed using Sentinel-2 time-series imagery to estimate TSDM, standing green DM, and standing dry DM to support regenerative grazing at the farm scale. Although the model underestimated TSDM in all the plots, it is within the variability of the measured biomass. Specifically, the model could explain the variability in biomass for the plot (Vault 4) with a regular grazing and recovery period. Furthermore, the model could show the treatment plot (Vault 5) with the highest level of variance. Our subsequent study will use more timely imagery (PlanetScope) with radar imagery (Sentinel-1) with the aim of overcoming some of the limitations associated with the present study, including less frequent satellite pass-overs, as well as a lack of cloud-free images.
We conclude regenerative grazing with shorter recovery periods in wet seasons is more likely to improve grassland productivity, however, this result remains to be seen in drier seasons (e.g., El Nino). We also showed promise in machine learning with satellite imagery at very small field sizes, and we encourage further research into this area.

Author Contributions

Conceptualization, Methodology, Formal Analysis, Investigation, Writing-Original Draft Preparation, M.G.O.; Visualisation, M.G.O., M.T.H. and J.P.G.; Review and Editing, J.P.G.; Review and Editing, A.M.F.; Review and Editing, R.A.C.; Review and Editing, C.M.; Review and Editing; P.S.; Review and Editing, P.T.; Sampling design and field data collection, J.W. and M.T.H.; Review and Editing, M.T.H. All authors have read and agreed to the published version of the manuscript.

Funding

Funding for this work was provided from the Australian Government’s Future Drought Fund and the University of Tasmania (Project Number 4-G37I1PA).

Data Availability Statement

All data is available upon request from the corresponding author.

Acknowledgments

Funding support for the Tasmanian Institute of Agriculture was provided through funding from the Australian Government’s Future Drought Fund and the University of Tasmania. The authors acknowledge project delivery and infrastructure from the Cape Herbert Pty Ltd., Australia. Special acknowledgment to Peter Ball, who collected the measured data and made it available.

Conflicts of Interest

The authors declare no conflict of interest.

References

  1. Harrison, M.T.; Cullen, B.R.; Mayberry, D.E.; Cowie, A.L.; Bilotto, F.; Badgery, W.B.; Liu, K.; Davison, T.; Christie, K.M.; Muleke, A.; et al. Carbon myopia: The urgent need for integrated social, economic and environmental action in the livestock sector. Glob. Chang. Biol. 2021, 27, 5726–5761. [Google Scholar] [CrossRef] [PubMed]
  2. Christie, K.M.; Smith, A.P.; Rawnsley, R.P.; Harrison, M.T.; Eckard, R.J. Simulated seasonal responses of grazed dairy pastures to nitrogen fertilizer in SE Australia: N loss and recovery. Agric. Syst. 2020, 182, 102847. [Google Scholar] [CrossRef]
  3. Thornton, P.K. Livestock production: Recent trends, future prospects. Philos. Trans. R. Soc. London. Ser. B Biol. Sci. 2010, 365, 2853–2867. [Google Scholar] [CrossRef]
  4. Abberton, M. Grassland carbon sequestration: Management. In Proceedings of the Workshop on the Role of Grassland Carbon Sequestration in the Mitigation Of Climate Change; Food and Agriculture Organisation: Rome, Italy, 2010; Volume 11. [Google Scholar]
  5. Franzluebbers, A.J. Soil organic carbon in managed pastures of the southeastern United States of America. In Grassland Carbon Sequestration: Management, Policy and Economics. Integrated Crop Manage; Food and Agriculture Organisation: Rome, Italy, 2010; pp. 163–175. [Google Scholar]
  6. Henry, B.; Dalal, R.; Harrison, M.T.; Keating, B. Creating frameworks to foster soil carbon sequestration. In Burleigh Dodds Series in Agricultural Science; Burleigh Dodds Science Publishing: Cambridge, UK, 2022. [Google Scholar]
  7. Sándor, R.; Ehrhardt, F.; Grace, P.; Recous, S.; Smith, P.; Snow, V.; Soussana, J.-F.; Basso, B.; Bhatia, A.; Brilli, L.; et al. Ensemble modelling of carbon fluxes in grasslands and croplands. F. Crop. Res. 2020, 252, 107791. [Google Scholar] [CrossRef]
  8. Teague, R.; Kreuter, U. Managing Grazing to Restore Soil Health, Ecosystem Function, and Ecosystem Services. Front. Sustain. Food Syst. 2020, 4, 534187. [Google Scholar] [CrossRef]
  9. Rawnsley, R.P.; Smith, A.P.; Christie, K.M.; Harrison, M.T.; Eckard, R.J. Current and future direction of nitrogen fertiliser use in Australian grazing systems. Crop Pasture Sci. 2019, 70, 1034–1043. [Google Scholar] [CrossRef]
  10. Díaz de Otálora, X.; Epelde, L.; Arranz, J.; Garbisu, C.; Ruiz, R.; Mandaluniz, N. Regenerative rotational grazing management of dairy sheep increases springtime grass production and topsoil carbon storage. Ecol. Indic. 2021, 125, 107484. [Google Scholar] [CrossRef]
  11. Teague, R.; Barnes, M. Grazing management that regenerates ecosystem function and grazingland livelihoods. Afr. J. Range Forage Sci. 2017, 34, 77–86. [Google Scholar] [CrossRef]
  12. Spratt, E.; Jordan, J.; Winsten, J.; Huff, P.; van Schaik, C.; Jewett, J.G.; Filbert, M.; Luhman, J.; Meier, E.; Paine, L. Accelerating regenerative grazing to tackle farm, environmental, and societal challenges in the upper Midwest. J. Soil Water Conserv. 2021, 76, 15A–23A. [Google Scholar] [CrossRef]
  13. Öllerer, K.; Varga, A.; Kirby, K.; Demeter, L.; Biró, M.; Bölöni, J.; Molnár, Z. Beyond the obvious impact of domestic livestock grazing on temperate forest vegetation—A global review. Biol. Conserv. 2019, 237, 209–219. [Google Scholar] [CrossRef]
  14. Harrison, M.; Evans, J.; Moore, A.D. Using a mathematical framework to examine physiological changes in winter wheat after livestock grazing 2. Model validation and effects of grazing management. Field Crop. Res. 2012, 136, 127–137. [Google Scholar] [CrossRef]
  15. Harrison, M.T.; Evans, J.R.; Moore, A.D. Using a mathematical framework to examine physiological changes in winter wheat after livestock grazing 1. Model derivation and coefficient calibration. Field Crop. Res. 2012, 136, 116–126. [Google Scholar] [CrossRef]
  16. Chen, Y.; Guerschman, J.; Shendryk, Y.; Henry, D.; Harrison, M.T. Estimating pasture biomass using sentinel-2 imagery and machine learning. Remote Sens. 2021, 13, 603. [Google Scholar] [CrossRef]
  17. Hudson, T.D.; Reeves, M.C.; Hall, S.A.; Yorgey, G.G.; Neibergs, J.S. Big landscapes meet big data: Informing grazing management in a variable and changing world. Rangelands 2021, 43, 17–28. [Google Scholar] [CrossRef]
  18. Trotter, M.G.; Lamb, D.W.; Donald, G.E.; Schneider, D.A. Evaluating an active optical sensor for quantifying and mapping green herbage mass and growth in a perennial grass pasture. Crop Pasture Sci. 2010, 61, 389–398. [Google Scholar] [CrossRef]
  19. Punalekar, S.M.; Verhoef, A.; Quaife, T.L.; Humphries, D.; Bermingham, L.; Reynolds, C.K. Application of Sentinel-2A data for pasture biomass monitoring using a physically based radiative transfer model. Remote Sens. Environ. 2018, 218, 207–220. [Google Scholar] [CrossRef]
  20. Edirisinghe, A.; Clark, D.; Waugh, D. Spatio-temporal modelling of biomass of intensively grazed perennial dairy pastures using multispectral remote sensing. Int. J. Appl. Earth Obs. Geoinf. 2012, 16, 5–16. [Google Scholar] [CrossRef]
  21. Wang, J.; Xiao, X.; Bajgain, R.; Starks, P.; Steiner, J.; Doughty, R.B.; Chang, Q. Estimating leaf area index and aboveground biomass of grazing pastures using Sentinel-1, Sentinel-2 and Landsat images. ISPRS J. Photogramm. Remote Sens. 2019, 154, 189–201. [Google Scholar] [CrossRef]
  22. Morais, T.G.; Teixeira, R.F.M.; Figueiredo, M.; Domingos, T. The use of machine learning methods to estimate aboveground biomass of grasslands: A review. Ecol. Indic. 2021, 130, 108081. [Google Scholar] [CrossRef]
  23. Harrison, M.T.; Roggero, P.P.; Zavattaro, L. Simple, efficient and robust techniques for automatic multi-objective function parameterisation: Case studies of local and global optimisation using APSIM. Environ. Model. Softw. 2019, 117, 109–133. [Google Scholar] [CrossRef]
  24. Ali, I.; Greifeneder, F.; Stamenkovic, J.; Neumann, M.; Notarnicola, C. Review of Machine Learning Approaches for Biomass and Soil Moisture Retrievals from Remote Sensing Data. Remote Sens. 2015, 7, 16398–16421. [Google Scholar] [CrossRef]
  25. Gitelson, A.A.; Gamon, J.A. The need for a common basis for defining light-use efficiency: Implications for productivity estimation. Remote Sens. Environ. 2015, 156, 196–201. [Google Scholar] [CrossRef]
  26. Delegido, J.; Verrelst, J.; Rivera, J.P.; Ruiz-Verdú, A.; Moreno, J. Brown and green LAI mapping through spectral indices. Int. J. Appl. Earth Obs. Geoinf. 2015, 35, 350–358. [Google Scholar] [CrossRef]
  27. Bsaibes, A.; Courault, D.; Baret, F.; Weiss, M.; Olioso, A.; Jacob, F.; Hagolle, O.; Marloie, O.; Bertrand, N.; Desfond, V.; et al. Albedo and LAI estimates from FORMOSAT-2 data for crop monitoring. Remote Sens. Environ. 2009, 113, 716–729. [Google Scholar] [CrossRef]
  28. De Rosa, D.; Basso, B.; Fasiolo, M.; Friedl, J.; Fulkerson, B.; Grace, P.R.; Rowlings, D.W. Predicting pasture biomass using a statistical model and machine learning algorithm implemented with remotely sensed imagery. Comput. Electron. Agric. 2021, 180, 105880. [Google Scholar] [CrossRef]
  29. Ibrahim, A.; Harrison, M.T.; Meinke, H.; Zhou, M. Examining the yield potential of barley near-isogenic lines using a genotype by environment by management analysis. Eur. J. Agron. 2019, 105, 41–51. [Google Scholar] [CrossRef]
  30. Zhai, Z.; Martínez, J.F.; Beltran, V.; Martínez, N.L. Decision support systems for agriculture 4.0: Survey and challenges. Comput. Electron. Agric. 2020, 170, 105256. [Google Scholar] [CrossRef]
  31. Ara, I.; Turner, L.; Harrison, M.T.; Monjardino, M.; deVoil, P.; Rodriguez, D. Application, adoption and opportunities for improving decision support systems in irrigated agriculture: A review. Agric. Water Manag. 2021, 257, 107161. [Google Scholar] [CrossRef]
  32. Ge, Y.; Thomasson, J.A.; Sui, R. Remote sensing of soil properties in precision agriculture: A review. Front. Earth Sci. 2011, 5, 229–238. [Google Scholar] [CrossRef]
  33. Bilotto, F.; Harrison, M.T.; Migliorati, M.D.A.; Christie, K.M.; Rowlings, D.W.; Grace, P.R.; Smith, A.P.; Rawnsley, R.P.; Thorburn, P.J.; Eckard, R.J. Can seasonal soil N mineralisation trends be leveraged to enhance pasture growth? Sci. Total Environ. 2021, 772, 145031. [Google Scholar] [CrossRef]
  34. Ali, I.; Cawkwell, F.; Dwyer, E.; Barrett, B.; Green, S. Satellite remote sensing of grasslands: From observation to management. J. Plant Ecol. 2016, 9, 649–671. [Google Scholar] [CrossRef]
  35. Smith, R.C.G.; Adams, M.; Gittins, S.; Gherardi, S.; Wood, D.; Maier, S.; Stovold, R.; Donald, G.; Khohkar, S.; Allen, A. Near real-time Feed On Offer (FOO) from MODIS for early season grazing management of Mediterranean annual pastures. Int. J. Remote Sens. 2011, 32, 4445–4460. [Google Scholar] [CrossRef]
  36. Dingaan, M.N.V.; Tsubo, M. Improved assessment of pasture availability in semi-arid grassland of South Africa. Environ. Monit. Assess. 2019, 191, 1–12. [Google Scholar] [CrossRef] [PubMed]
  37. Guerschman, J.P.; Hill, M.J.; Renzullo, L.J.; Barrett, D.J.; Marks, A.S.; Botha, E.J. Estimating fractional cover of photosynthetic vegetation, non-photosynthetic vegetation and bare soil in the Australian tropical savanna region upscaling the EO-1 Hyperion and MODIS sensors. Remote Sens. Environ. 2009, 113, 928–945. [Google Scholar] [CrossRef]
  38. Zhang, B.; Carter, J. FORAGE—An online system for generating and delivering property-scale decision support information for grazing land and environmental management. Comput. Electron. Agric. 2018, 150, 302–311. [Google Scholar] [CrossRef]
  39. Dong, S.; Shang, Z.; Gao, J.; Boone, R.B. Enhancing sustainability of grassland ecosystems through ecological restoration and grazing management in an era of climate change on Qinghai-Tibetan Plateau. Agric. Ecosyst. Environ. 2020, 287, 106684. [Google Scholar] [CrossRef]
  40. Donnelly, J.R.; Moore, A.D.; Freer, M. GRAZPLAN: Decision support systems for Australian grazing enterprises—I. Overview of the GRAZPLAN project, and a description of the MetAccess and LambAlive DSS. Agric. Syst. 1997, 54, 57–76. [Google Scholar] [CrossRef]
  41. Srivastava, N.; Hinton, G.; Krizhevsky, A.; Sutskever, I.; Salakhutdinov, R. Dropout: A simple way to prevent neural networks from overfitting. J. Mach. Learn. Res. 2014, 15, 1929–1958. [Google Scholar]
  42. Verrelst, J.; Malenovský, Z.; Van der Tol, C.; Camps-Valls, G.; Gastellu-Etchegorry, J.-P.; Lewis, P.; North, P.; Moreno, J. Quantifying Vegetation Biophysical Variables from Imaging Spectroscopy Data: A Review on Retrieval Methods. Surv. Geophys. 2019, 40, 589–629. [Google Scholar] [CrossRef]
  43. Earth Observation: Data, Processing and Applications. Volume 1A: Data—Basics and Acquisition; CRCSI: Melbourne, VIC, Australia, 2018.
  44. Scarth, P.; Armston, J.; Flood, N.; Denham, R.; Collett, L.; Watson, F.; Trevithick, B.; Muir, J.; Goodwin, N.; Tindalla, D.; et al. Operation application of the Landsat tineseries to address large area landcover understanding. Int. Arch. Photogramm. Remote Sens. Spat. Inf. Sci. 2015, XL-3-W3, 571–575. [Google Scholar] [CrossRef]
  45. Roberts, D.; Mueller, N.; Mcintyre, A. High-Dimensional Pixel Composites From Earth Observation Time Series. IEEE Trans. Geosci. Remote Sens. 2017, 55, 6254–6264. [Google Scholar] [CrossRef]
  46. Ara, I.; Harrison, M.T.; Whitehead, J.; Waldner, F.; Bridle, K.; Gilfedder, L.; Marques Da Silva, J.; Marques, F.; Rawnsley, R. Modelling seasonal pasture growth and botanical composition at the paddock scale with satellite imagery. Silico Plants 2021, 3, 1–15. [Google Scholar] [CrossRef]
  47. BoM Australia Government. Bureau of Meteorology. Available online: http://www.bom.gov.au/climate/averages/tables/cw_092027.shtml (accessed on 25 October 2022).
  48. Franklin, M. Okehampton—Optimising Management of Production and Biodiversity Assets; Devonport TAS; University of Tasmania: Tasmania, Australia, 2019. [Google Scholar]
  49. Phelan, D.C.; Harrison, M.T.; McLean, G.; Cox, H.; Pembleton, K.G.; Dean, G.J.; Parsons, D.; do Amaral Richter, M.E.; Pengilley, G.; Hinton, S.J.; et al. Advancing a farmer decision support tool for agronomic decisions on rainfed and irrigated wheat cropping in Tasmania. Agric. Syst. 2018, 167, 113–124. [Google Scholar] [CrossRef]
  50. Langworthy, A.D.; Rawnsley, R.P.; Freeman, M.J.; Pembleton, K.G.; Corkrey, R.; Harrison, M.T.; Lane, P.A.; Henry, D.A. Potential of summer-active temperate (C3) perennial forages to mitigate the detrimental effects of supraoptimal temperatures on summer home-grown feed production in south-eastern Australian dairying regions. Crop Pasture Sci. 2018, 69, 808–820. [Google Scholar] [CrossRef]
  51. Zhu, Z.; Wang, S.; Woodcock, C.E. Improvement and expansion of the Fmask algorithm: Cloud, cloud shadow, and snow detection for Landsats 4–7, 8, and Sentinel 2 images. Remote Sens. Environ. 2015, 159, 269–277. [Google Scholar] [CrossRef]
  52. Piñeiro, G.; Perelman, S.; Guerschman, J.P.; Paruelo, J.M. How to evaluate models: Observed vs. predicted or predicted vs. observed? Ecol. Modell. 2008, 216, 316–322. [Google Scholar] [CrossRef]
  53. Zhu, Q.; Lin, H. Influences of soil, terrain, and crop growth on soil moisture variation from transect to farm scales. Geoderma 2011, 163, 45–54. [Google Scholar] [CrossRef]
  54. Warren, S.D.; Thurow, T.L.; Blackburn, W.H.; Garza, N.E. The influence of livestock trampling under intensive rotation grazing on soil hydrologic characteristics. Rangel. Ecol. Manag. Range Manag. Arch. 1986, 39, 491–495. [Google Scholar] [CrossRef]
  55. Khatri-Chhetri, U.; Thompson, K.A.; Quideau, S.A.; Boyce, M.S.; Chang, S.X.; Kaliaskar, D.; Bork, E.W.; Carlyle, C.N. Adaptive multi-paddock grazing increases soil nutrient availability and bacteria to fungi ratio in grassland soils. Appl. Soil Ecol. 2022, 179, 104590. [Google Scholar] [CrossRef]
  56. van Eekeren, N.; Jongejans, E.; van Agtmaal, M.; Guo, Y.; van der Velden, M.; Versteeg, C.; Siepel, H. Microarthropod communities and their ecosystem services restore when permanent grassland with mowing or low-intensity grazing is installed. Agric. Ecosyst. Environ. 2022, 323, 107682. [Google Scholar] [CrossRef]
  57. Zwerts, J.A.; Prins, H.H.T.; Bomhoff, D.; Verhagen, I.; Swart, J.M.; de Boer, W.F. Competition between a Lawn-Forming Cynodon dactylon and a Tufted Grass Species Hyparrhenia hirta on a South-African Dystrophic Savanna. PLoS ONE 2015, 10, e0140789. [Google Scholar] [CrossRef] [PubMed]
  58. Ivanov, V.Y.; Bras, R.L.; Vivoni, E.R. Vegetation-hydrology dynamics in complex terrain of semiarid areas: 2. Energy-water controls of vegetation spatiotemporal dynamics and topographic niches of favorability. Water Resour. Res. 2008, 44, 5595. [Google Scholar] [CrossRef]
  59. Barrachina, M.; Cristóbal, J.; Tulla, A.F. Estimating above-ground biomass on mountain meadows and pastures through remote sensing. Int. J. Appl. Earth Obs. Geoinf. 2015, 38, 184–192. [Google Scholar] [CrossRef]
  60. Andresen, J.A.; Alagarswamy, G.; Rotz, C.A.; Ritchie, J.T.; LeBaron, A.W. Weather Impacts on Maize, Soybean, and Alfalfa Production in the Great Lakes Region, 1895–1996. Agron. J. 2001, 93, 1059–1070. [Google Scholar] [CrossRef]
  61. Edirisinghe, A.; Hill, M.J.; Donald, G.E.; Hyder, M. Quantitative mapping of pasture biomass using satellite imagery. Int. J. Remote Sens. 2011, 32, 2699–2724. [Google Scholar] [CrossRef]
  62. Myrgiotis, V.; Harris, P.; Revill, A.; Sint, H.; Williams, M. Inferring management and predicting sub-field scale C dynamics in UK grasslands using biogeochemical modelling and satellite-derived leaf area data. Agric. For. Meteorol. 2021, 307, 108466. [Google Scholar] [CrossRef]
  63. Moore, C.E.; Beringer, J.; Donohue, R.J.; Evans, B.; Exbrayat, J.-F.; Hutley, L.B.; Tapper, N.J. Seasonal, interannual and decadal drivers of tree and grass productivity in an Australian tropical savanna. Glob. Chang. Biol. 2018, 24, 2530–2544. [Google Scholar] [CrossRef]
  64. Segarra, J.; Buchaillot, M.L.; Araus, J.L.; Kefauver, S.C. Remote Sensing for Precision Agriculture: Sentinel-2 Improved Features and Applications. Agronomy 2020, 10, 50641. [Google Scholar] [CrossRef]
  65. Crabbe, R.A.; Lamb, D.W.; Edwards, C.; Andersson, K.; Schneider, D. A Preliminary Investigation of the Potential of Sentinel-1 Radar to Estimate Pasture Biomass in a Grazed Pasture Landscape. Remote Sens. 2019, 11, 70872. [Google Scholar] [CrossRef]
  66. Sadeh, Y.; Zhu, X.; Dunkerley, D.; Walker, J.P.; Zhang, Y.; Rozenstein, O.; Manivasagam, V.S.; Chenu, K. Fusion of Sentinel-2 and PlanetScope time-series data into daily 3 m surface reflectance and wheat LAI monitoring. Int. J. Appl. Earth Obs. Geoinf. 2021, 96, 102260. [Google Scholar] [CrossRef]
Figure 1. Study site (a) land use for Tasmania, (b) farm property, comprising 52 paddocks, and (c) subplots used for field sampling, [three larger plots (10 ha, 14 ha and 54 ha) were used as controls, while treatment plots had sizes of 0.2–0.4 ha]. The first six plots were located on a paddock called “Bougainville” on a hill. Land use data in (a) was obtained from the Australian Government, Department of Agriculture, Fisheries and Forestry, land use and management (accessed 10 October 2022).
Land 12 01142 g001
Figure 2. Pasture biomass categories enumerated using destructive harvests at Okehampton, Tasmania, Australia. We measured (a) standing green biomass and (b) standing dry biomass prior to grazing; post-grazing we also measured (c) trampled green biomass and (d) trampled dry biomass. Photographs (a) and (b) were taken in autumn, (c) in winter and (d) in summer. We refer to destructive sampling data herein as ‘measured’ data. Total standing dry matter (TSDM) was computed as the summation of green and dry standing biomass.
Land 12 01142 g002
Figure 3. Effects of grazing treatment on total standing dry matter (TSDM), computed as the sum of standing green DM, standing dry DM and trampled residual. Small dot points show measurements obtained from five quadrats in each treatment plot; large dots show means for each plot.
Land 12 01142 g003
Figure 4. Effects of treatment on the total standing dry matter. TSDM was computed as the sum of standing green DM and standing dry DM, excluding trampled residual.
Land 12 01142 g004
Figure 5. Effects of treatment on standing green biomass.
Land 12 01142 g005
Figure 6. Effects of treatment on standing dry biomass.
Land 12 01142 g006
Figure 7. Measured and modelled TSDM data at Okehampton, Triabunna, Tasmania. Trampled material is vegetation pushed against the ground surface by grazing that was measured in phase 1 (Table 1) post-grazing. Broken lines represent measured TSDM; blue solid line represents Cibo Labs modelled TSDM. Bougainville 1 and 3 treatment plots were grazed as BAU at the start of the experiment before subsequently being closed to grazing. Error bars represent standard error of the mean.
Land 12 01142 g007aLand 12 01142 g007b
Figure 8. Measured standing green and dry pasture biomass compared with the Cibo Labs simulated values. Broken lines represent measured green DM and dry DM, while blue solid line represents Cibo Labs estimated green DM and dry DM. Error bars represent standard error of the mean.
Land 12 01142 g008aLand 12 01142 g008b
Figure 9. Relationship between measured total standing dry matter and Cibo Labs modelled values. Orange line is 1:1 and blue regression is line of best fit. Mean absolute error was 745 kg DM/ha and root mean square error was 904 kg DM/ha.
Land 12 01142 g009
Figure 10. Relationship between the measured standing green and Cibo Labs estimate. Orange line is 1:1 and blue regression is line of best fit. Mean absolute error was 703 kg DM/ha and root mean square error was 880 kg DM/ha.
Land 12 01142 g010
Figure 11. Relationship between measured total standing dry matter and Cibo Labs standing green estimates. Orange line is 1:1 and blue regression is line of best fit. Mean absolute error was 686 kg DM/ha and root mean square error was 851 kg DM/ha.
Land 12 01142 g011
Figure 12. Spatiotemporal variability in pasture biomass across Okehampton. Smaller plots (expanded) represent regenerative grazing treatments, while the larger plots were conventional (business-as-usual) grazing treatments. Vaults plots 1 to 5 are shown in the lower-left expanded view, while Bougainville plots 1 to 4 plots are at the upper-right expanded view.
Land 12 01142 g012
Table 1. Experimental treatments and business-as-usual plots (controls). All plots were sampled and grazed in phase 1. Trampled residual was collected only post-grazing. Bougainville plots 1, 2, 3, and 4 were conducted with different treatments to Vault treatments. At the outset, Bougainville plots 2 and 4 were subjected to intense grazing, similar to the Vault treatments, whereas Bougainville 1 and 3 plots were grazed in accordance with BAU. After phase 1, all four plots were closed grazed no further. Asterisk (*) DSE represents “dry sheep equivalent”, a standardised grazing unit representing one dry, non-lactating 45 kg castrated male (wether) consuming 7.6 MJ/day.
TreatmentsPlot Phase 1Phase 2Phase 3Phase 4
Size (ha)December 2021 & January 2022April 2022July 2022November 2022
Grazing PrePostPrePrePre
Trampled after
post-grazing
V4
Stocking rate (DSE/ha) * 8000600088008800
BAU &
Regenerative
Bougainville (B1) 0.4
RegenerativeBougainville (B2) 0.2
BAU &
Regenerative
Bougainville (B3) 0.3
RegenerativeBougainville (B4) 0.2
ControlUpper Bougainville (UB)54Business as usual
ControlLower Bougainville (LB)10 Business as usual
RegenerativeVault 1 [12 months]0.3
Vault 2 [9 months]0.3
Vault 3 [6 months]0.3
Vault 4 [3 months]0.3
Vault 5 [15 months]0.3
ControlVault Control14Business as usual
The method was developed by the authors.
Disclaimer/Publisher’s Note: The statements, opinions and data contained in all publications are solely those of the individual author(s) and contributor(s) and not of MDPI and/or the editor(s). MDPI and/or the editor(s) disclaim responsibility for any injury to people or property resulting from any ideas, methods, instructions or products referred to in the content.

