Appendix A
Figure A1.
Residuals graph of the linear mixed effect model analyzing the carabid beetle activity density.
Figure A1.
Residuals graph of the linear mixed effect model analyzing the carabid beetle activity density.
Table A1.
Full species list of all caught ground beetles in total, and separated by the season they were caught in (May/June and September).
Table A1.
Full species list of all caught ground beetles in total, and separated by the season they were caught in (May/June and September).
| Carabidae | Carabid Individuals, Total | Carabid Individuals May–June | Carabid Individuals September |
|---|
| Abax parallelepipedus (Pill. and Mitt., 1783) | 1 | 1 | 0 |
| Acupalpus meridianus (L., 1761) | 184 | 181 | 3 |
| Agonum emarginatum (Gyll., 1827) | 2 | 2 | 0 |
| Agonum fuliginosum (Panzer, 1809) | 1 | 1 | 0 |
| Agonum muelleri (Herbst, 1784) | 830 | 823 | 7 |
| Agonum viduum (Panzer, 1796) | 1 | 1 | 0 |
| Amara aenea (De Geer, 1774) | 147 | 146 | 1 |
| Amara apricaria (Payk., 1790) | 3 | 0 | 3 |
| Amara eurynota (Panzer, 1796) | 24 | 24 | 0 |
| Amara familiaris (Duft., 1812) | 27 | 27 | 0 |
| Amara ovata (F., 1792) | 3 | 3 | 0 |
| Amara similata (Gyll., 1810) | 56 | 55 | 1 |
| Amara spreta Dejean, 1831 | 2 | 2 | 0 |
| Anchomenus dorsalis (Pont., 1763) | 389 | 388 | 1 |
| Badister bullatus (Schrank, 1798) | 9 | 9 | 0 |
| Bembidion aeneum Germar, 1824 | 25 | 25 | 0 |
| Bembidion guttula (Fabricius, 1792) | 3 | 3 | 0 |
| Bembidion lampros (Herbst, 1784) | 2860 | 2774 | 86 |
| Bembidion lunatum (Duftschmid, 1812) | 17 | 388 | 1 |
| Bembidion mannerheimii Sahlb., 1827 | 17 | 17 | 0 |
| Bembidion obtusum Aud.-Serv., 1821 | 56 | 54 | 2 |
| Bembidion properans (Steph., 1828) | 238 | 226 | 12 |
| Bembidion quadrimaculatum (L., 1761) | 30 | 30 | 0 |
| Bembidion tetracolum Say, 1823 | 731 | 724 | 7 |
| Blemus discus (F., 1792) | 10 | 2 | 8 |
| Calathus erratus (Sahlb., 1827) | 4 | 0 | 4 |
| Calathus fuscipes (Goeze, 1777) | 257 | 13 | 244 |
| Carabus convexus F., 1775 | 2 | 2 | 0 |
| Carabus coriaceus L., 1758 | 2 | 1 | 4 |
| Carabus auratus L., 1761 | 197 | 196 | 1 |
| Carabus granulatus L., 1758 | 71 | 70 | 1 |
| Carabus hortensis L., 1758 | 2 | 2 | 0 |
| Carabus nemoralis Müller, 1764 | 19 | 19 | 0 |
| Carabus violaceus L., 1758 | 14 | 1 | 13 |
| Chlaenius nigricornis (F., 1787) | 14 | 14 | 0 |
| Clivina fossor (L., 1758) | 474 | 459 | 15 |
| Demetrias atricapillus (L., 1758) | 5 | 5 | 0 |
| Dyschirius globosus (Herbst, 1784) | 1 | 1 | 0 |
| Epaphius secalis (Paykull, 1790) | 1 | 1 | 0 |
| Harpalus affinis (Schrank, 1781) | 131 | 127 | 4 |
| Harpalus calceatus (Duft. 1812) | 3 | 3 | 0 |
| Harpalus griseus (Panzer, 1796) | 3 | 3 | 0 |
| Harpalus rubripes (Duft., 1812) | 3 | 3 | 0 |
| Harpalus rufipes (De Geer, 1774) | 10 | 5 | 5 |
| Harpalus marginellus (Gyllenhal, 1827) | 1 | 1 | 0 |
| Leistus rufomarginatus (Duft., 1812) | 1 | 1 | 0 |
| Loricera pilicornis (F., 1775) | 90 | 76 | 14 |
| Microlestes minutulus (Goeze, 1777) | 1 | 1 | 0 |
| Nebria brevicollis (F., 1792) | 1812 | 1422 | 390 |
| Nebria salina (Fairm. and Lab., 1854) | 708 | 511 | 197 |
| Notiophilus biguttatus (F., 1779) | 5 | 4 | 1 |
| Notiophilus substriatus (G. R. Waterhouse, 1833) | 66 | 65 | 1 |
| Paranchus albipes (Fabricius, 1796) | 1 | 1 | 0 |
| Paradromius linearis (Ol., 1795) | 1 | 1 | 0 |
| Poecilus cupreus (L., 1758) | 373 | 361 | 12 |
| Poecilus lepidus (Leske, 1785) | 7 | 7 | 0 |
| Poecilus versicolor (Sturm, 1824) | 165 | 156 | 9 |
| Pterostichus melanarius (Ill., 1798) | 888 | 404 | 484 |
| Pterostichus nigrita (Payk., 1790) | 53 | 13 | 40 |
| Pterustichus strenuus (Panzer, 1796) | 23 | 23 | 0 |
| Pterostichus quadrifoveolatus (Letzner, 1852) | 1 | 1 | 0 |
| Pterostichus vernalis (Panzer, 1796) | 13 | 11 | 2 |
| Stomis pumicatus (Panzer, 1796) | 8 | 8 | 0 |
| Synuchus vivalis (Ill., 1798) | 1 | 1 | 0 |
| Trechoblemus micros (Herbst, 1784) | 17 | 17 | 0 |
| Trechus quadristriatus (Schrank, 1781) | 230 | 16 | 214 |
| Total | 11.347 | 9.561 | 1.786 |
Table A2.
Results of the indicator species analysis in May and June (CM: conventional maize, GC: grass–clover, GCH: grass–clover herbs, PG: permanent grasslands).
Table A2.
Results of the indicator species analysis in May and June (CM: conventional maize, GC: grass–clover, GCH: grass–clover herbs, PG: permanent grasslands).
| Species | Group | Indicator Value | p |
|---|
| Abax parallelepipedus | CM | 2.0 | 0.4009 |
| Acumenus meridianus | GC, ungrazed | 15.9 | 0.0034 |
| Agonum emarginatum | GCH, ungrazed | 2.6 | 0.1696 |
| Agonum fuliginosum | GCH, grazed | 0.9 | 1.000 |
| Agonum muelleri | PG | 21.5 | 0.0030 |
| Agonum viduum | GCH, ungrazed | 2.6 | 0.1712 |
| Amara aenea | PG | 44.8 | 0.0002 |
| Amara eurynota | GCH, ungrazed | 7.3 | 0.0122 |
| Amara familiaris | PG | 4.9 | 0.1154 |
| Amara ovata | CM | 1.6 | 0.5709 |
| Amara similata | GC, ungrazed | 6.2 | 0.1136 |
| Amara spreta | PG | 3.0 | 0.1294 |
| Anchomenus dorsalis | GC, ungrazed | 20.1 | 0.0022 |
| Badister bullatus | GC, grazed | 1.6 | 0.5853 |
| Bembidion aeneum | GCH, ungrazed | 6.9 | 0.0250 |
| Bembidion guttula | GCH, grazed | 1.1 | 0.7572 |
| Bembidion lampros | PG | 18.7 | 0.2517 |
| Bembidion lunatum | CM | 3.3 | 0.1464 |
| Bembidion mannerheimii | GCH, grazed | 3.0 | 0.2731 |
| Bembidion obtusum | GCH, ungrazed | 6.8 | 0.0706 |
| Bembidion properans | PG | 29.4 | 0.0002 |
| Bembidion quadrimaculatum | CM | 30.9 | 0.0002 |
| Bembidion tetracolum | CM | 40.1 | 0.0002 |
| Blemus discus | GCH, ungrazed | 1.9 | 0.3037 |
| Calathus fuscipes | GCH, grazed | 4.6 | 0.0536 |
| Carabus convexus | GC, ungrazed | 1.7 | 0.4227 |
| Carabus coriaceus | GC, ungrazed | 2.4 | 0.2701 |
| Carabus auratus | GC, grazed | 7.4 | 0.2478 |
| Carabus granulatus | GCH, ungrazed | 8.0 | 0.0750 |
| Carabus hortensis | GCH, grazed | 1.7 | 0.5859 |
| Carabus nemoralis | GCH, ungrazed | 2.7 | 0.4153 |
| Carabus violaceus | GC, grazed | 0.9 | 0.6991 |
| Chlaenius nigricornis | GCH, ungrazed | 2.6 | 0.3369 |
| Clivina fossor | CM | 20.9 | 0.0022 |
| Demetrias atricapillus | GCH, ungrazed | 0.8 | 0.9628 |
| Dyschirius globosus | GC, grazed | 0.9 | 0.6891 |
| Epaphius secalis | GCH, grazed | 0.9 | 1.0000 |
| Harpalus affinis | GC, ungrazed | 5.9 | 0.7057 |
| Harpalus calceatus | GCH, grazed | 0.9 | 1.0000 |
| Harpalus griseus | GCH, grazed | 1.1 | 0.7590 |
| Harpalus rubripes | GC, grazed | 0.6 | 0.9162 |
| Harpalus rufipes | CM | 2.4 | 0.2318 |
| Harpalus marginatus | PG | 3.7 | 0.0678 |
| Leistus rufomarginatus | GC, grazed | 0.9 | 0.7019 |
| Loricera pilicornis | GC, grazed | 5.7 | 0.2134 |
| Micros minutulus | GC, ungrazed | 2.4 | 0.2757 |
| Nebria brevicollis | GC, ungrazed | 17.4 | 0.2360 |
| Nebria salina | GC, grazed | 14.0 | 0.1676 |
| Notiophilus bigutattus | GC, ungrazed | 0.9 | 0.8370 |
| Notiophilus substratius | GC, grazed | 9.8 | 0.0200 |
| Paranchus albipes | GCH, grazed | 0.9 | 1.0000 |
| Paradromius linearis | GCH, grazed | 0.9 | 1.0000 |
| Poecilus cupreus | GCH, grazed | 14.5 | 0.0180 |
| Poecilus versicolor | PG | 49.7 | 0.0002 |
| Poecilus Lepidus | GCH, grazed | 1.7 | 0.5449 |
| Pterostichus melanarius | CM | 33.4 | 0.0002 |
| Pterostichus nigrita | GCH, ungrazed | 6.5 | 0.0182 |
| Pterostichus strenuus | PG | 10.7 | 0.0026 |
| Pterostichus quadrifoveolatus | GCH, grazed | 0.9 | 1.0000 |
| Pterostichus vernalis | GCH, ungrazed | 4.7 | 0.0724 |
| Stomis pumicollis | GC, grazed | 0.6 | 0.9844 |
| Synuchus vivalis | GCH, ungrazed | 2.6 | 0.1620 |
| Trechus micros | PG | 3.5 | 0.1856 |
| Trechus quadristriatus | CM | 11.1 | 0.0008 |
Table A3.
Results of indicator species analysis in September (CM: conventional maize, GC: grass–clover, GCH: grass–clover herbs, PG: permanent grasslands).
Table A3.
Results of indicator species analysis in September (CM: conventional maize, GC: grass–clover, GCH: grass–clover herbs, PG: permanent grasslands).
| Species | Group | Indicator Value | p |
|---|
| Acupalpus meridianus | CM | 16.7 | 0.0064 |
| Agonum muelleri | GCH, ungrazed | 12.2 | 0.0404 |
| Amara aenea | GCH, grazed | 2.2 | 1.0000 |
| Amara apricaria | GCH, ungrazed | 11.5 | 0.0274 |
| Amara similata | GCH, ungrazed | 6.7 | 0.1688 |
| Anchomenus dorsalis | CM | 8.3 | 0.0808 |
| Bembidion lampros | GCH, ungrazed | 24.7 | 0.0102 |
| Bembidion obtusum | CM | 16.7 | 0.0048 |
| Bembidion properans | GCH, ungrazed | 6.7 | 0.2763 |
| Bembidion tetracolum | CM | 13.4 | 0.0210 |
| Blemus discus | GCH, grazed | 13.0 | 0.0296 |
| Calathus erraticus | GCH, ungrazed | 5.0 | 0.2334 |
| Calathus fuscipes | PG | 51.2 | 0.0002 |
| Carabus coriaceus | GCH, ungrazed | 10.0 | 0.0582 |
| Carabus auratus | GCH, grazed | 2.2 | 1.0000 |
| Carabus granulatus | GCH, grazed | 2.2 | 1.0000 |
| Carabus violaceus | GC, grazed | 6.8 | 0.3025 |
| Clivina fossor | GCH, ungrazed | 7.8 | 0.2418 |
| Harpalus affinis | CM | 9.4 | 0.0638 |
| Harpalus rufipes | CM | 10.2 | 0.0566 |
| Loricera pilicornis | GCH, grazed | 12.1 | 0.0606 |
| Nebria brevicollis | CM | 29.5 | 0.0144 |
| Nebria salina | CM | 46.5 | 0.0002 |
| Notiophilus bigutattus | GC, ungrazed | 6.2 | 0.3963 |
| Notiophilus substratius | GCH, grazed | 2.2 | 1.0000 |
| Poecilus cupreus | CM | 5.9 | 0.3547 |
| Poecilus versicolor | PG | 17.7 | 0.0054 |
| Pterostichus melanarius | CM | 49.0 | 0.0002 |
| Pterostichus nigrita | CM | 10.7 | 0.1972 |
| Pterostichus vernalis | PG | 4.6 | 0.4217 |
| Trechus quadristriatus | CM | 49.1 | 0.0002 |
Table A4.
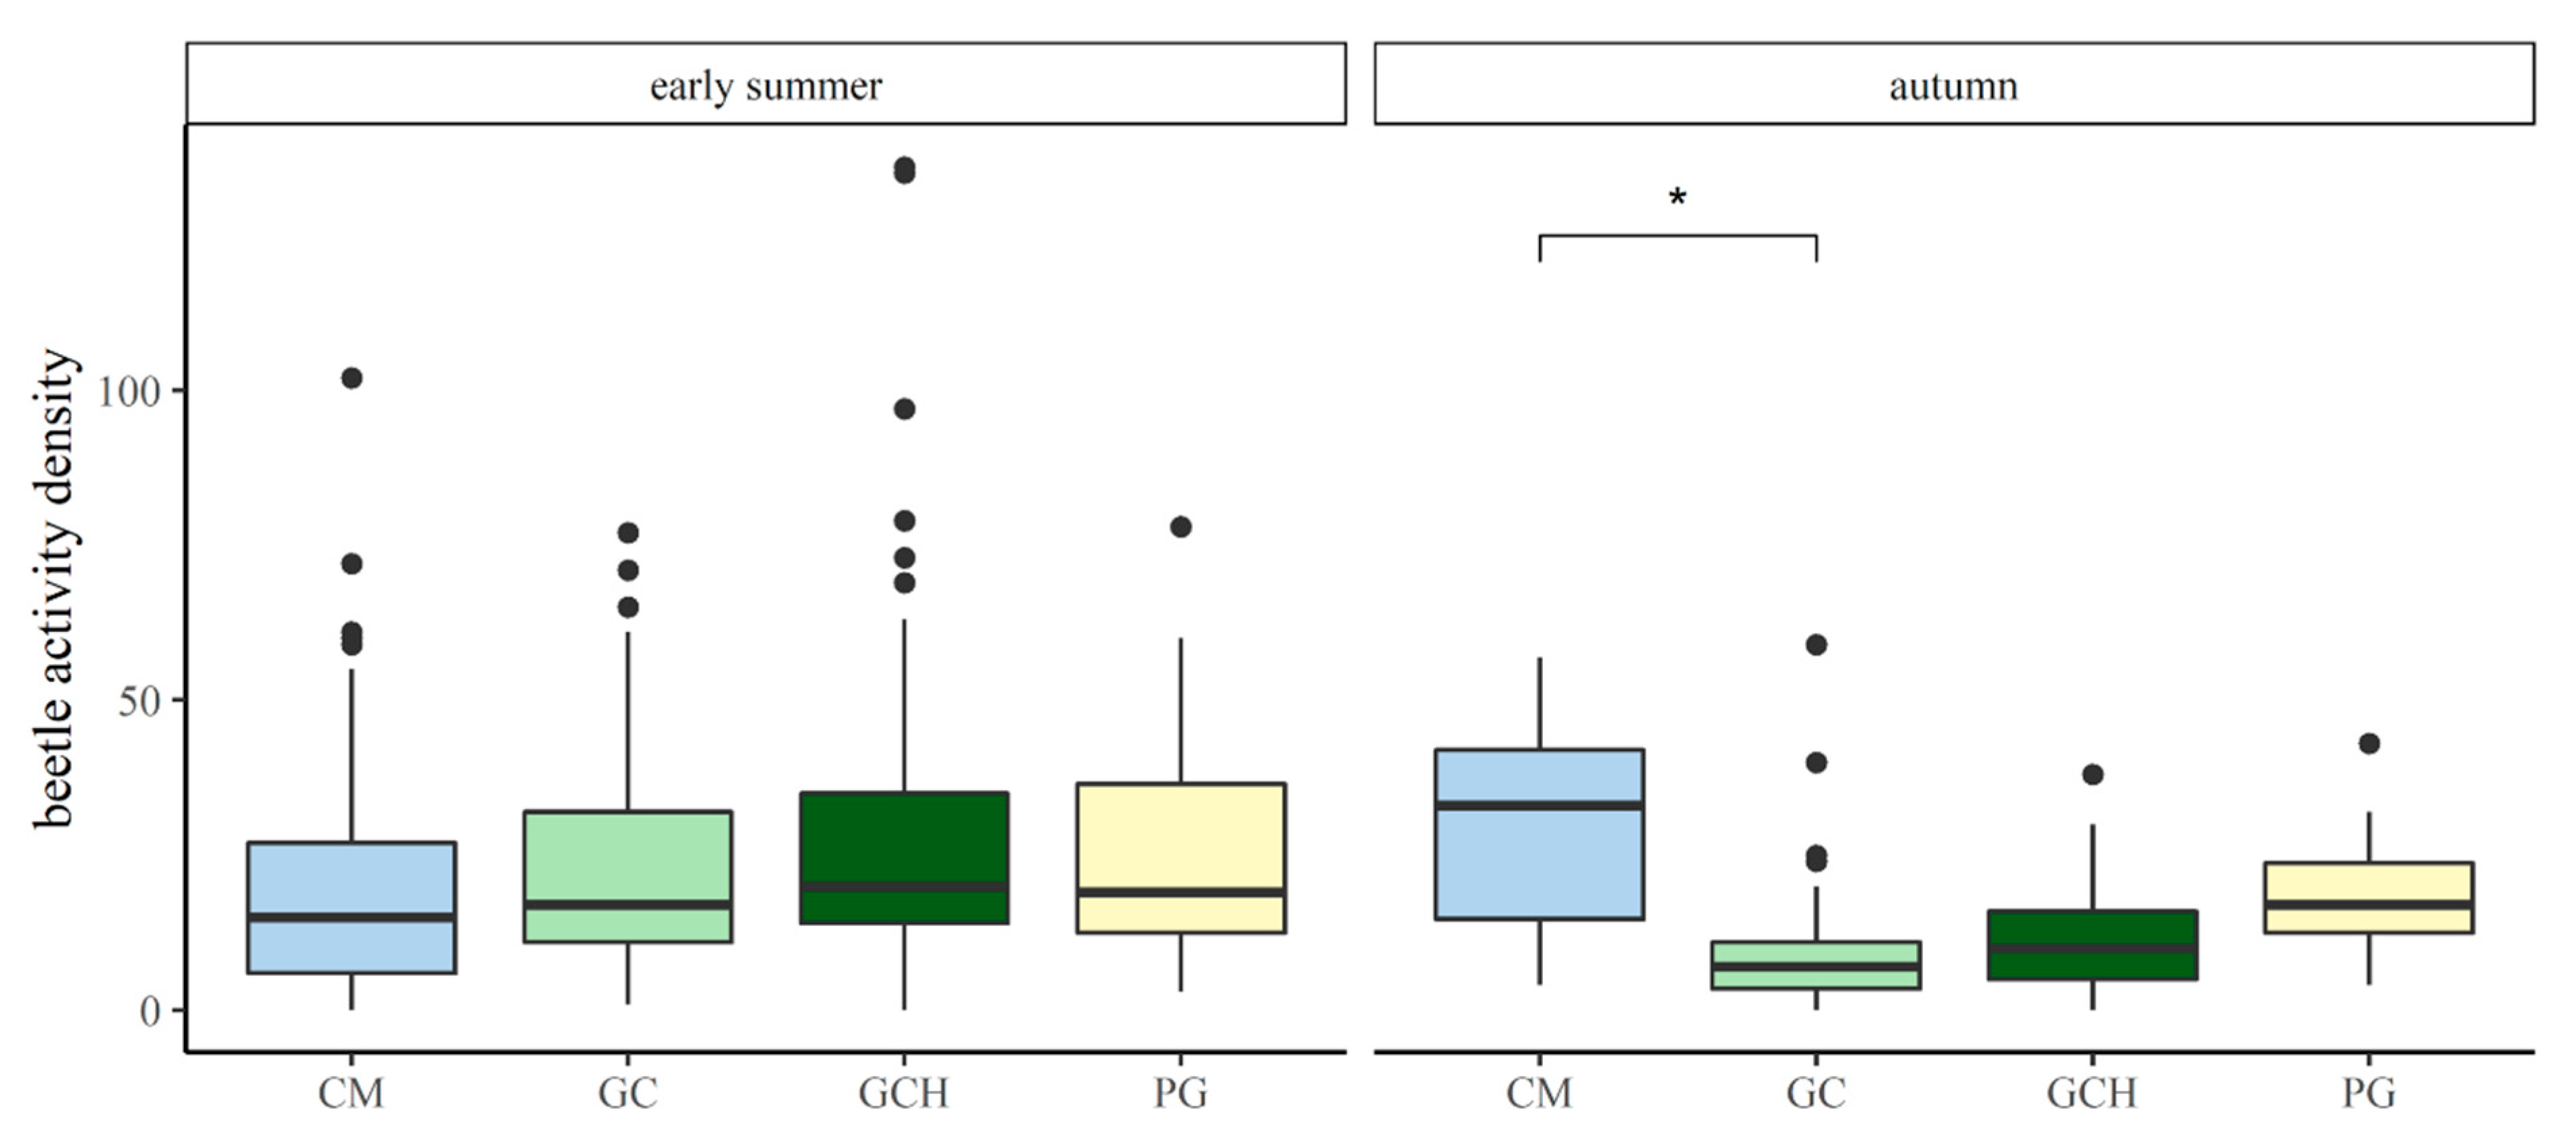
Differences in the activity densities of carabid beetles, comparing grass–clover (GC) and grass–clover herbs (GCH) with each other, and in comparison to conventional maize (CM) and permanent grasslands (PG) in May/June and September.
Table A4.
Differences in the activity densities of carabid beetles, comparing grass–clover (GC) and grass–clover herbs (GCH) with each other, and in comparison to conventional maize (CM) and permanent grasslands (PG) in May/June and September.
| | Estimate | SE | z-Value | p-Value |
|---|
| GCH–GC (September) | 2.437 | 5.045 | 0.483 | 0.995 |
| CM–GC (September) | 20.577 | 6.213 | 3.312 | 0.041 |
| PG–GC (September) | 9.852 | 5.37 | 1.688 | 0.497 |
| CM–GCH (September) | 18.14 | 6.208 | 2.922 | 0.08 |
| PG–GCH (September) | 7.415 | 5.832 | 1.271 | 0.744 |
| GCH–GC (May) | 4.03 | 5.374 | 0.750 | 0.963 |
| CM–GC (May) | −0.27 | 6.032 | −0.045 | 1.0 |
| PG–GC (May) | 3.437 | 6.278 | 0.547 | 0.991 |
| CM–GCH (May) | −4.303 | 6.112 | −0.704 | 0.972 |
| PG–GCH (May) | −0.594 | 6.355 | −0.093 | 1.0 |
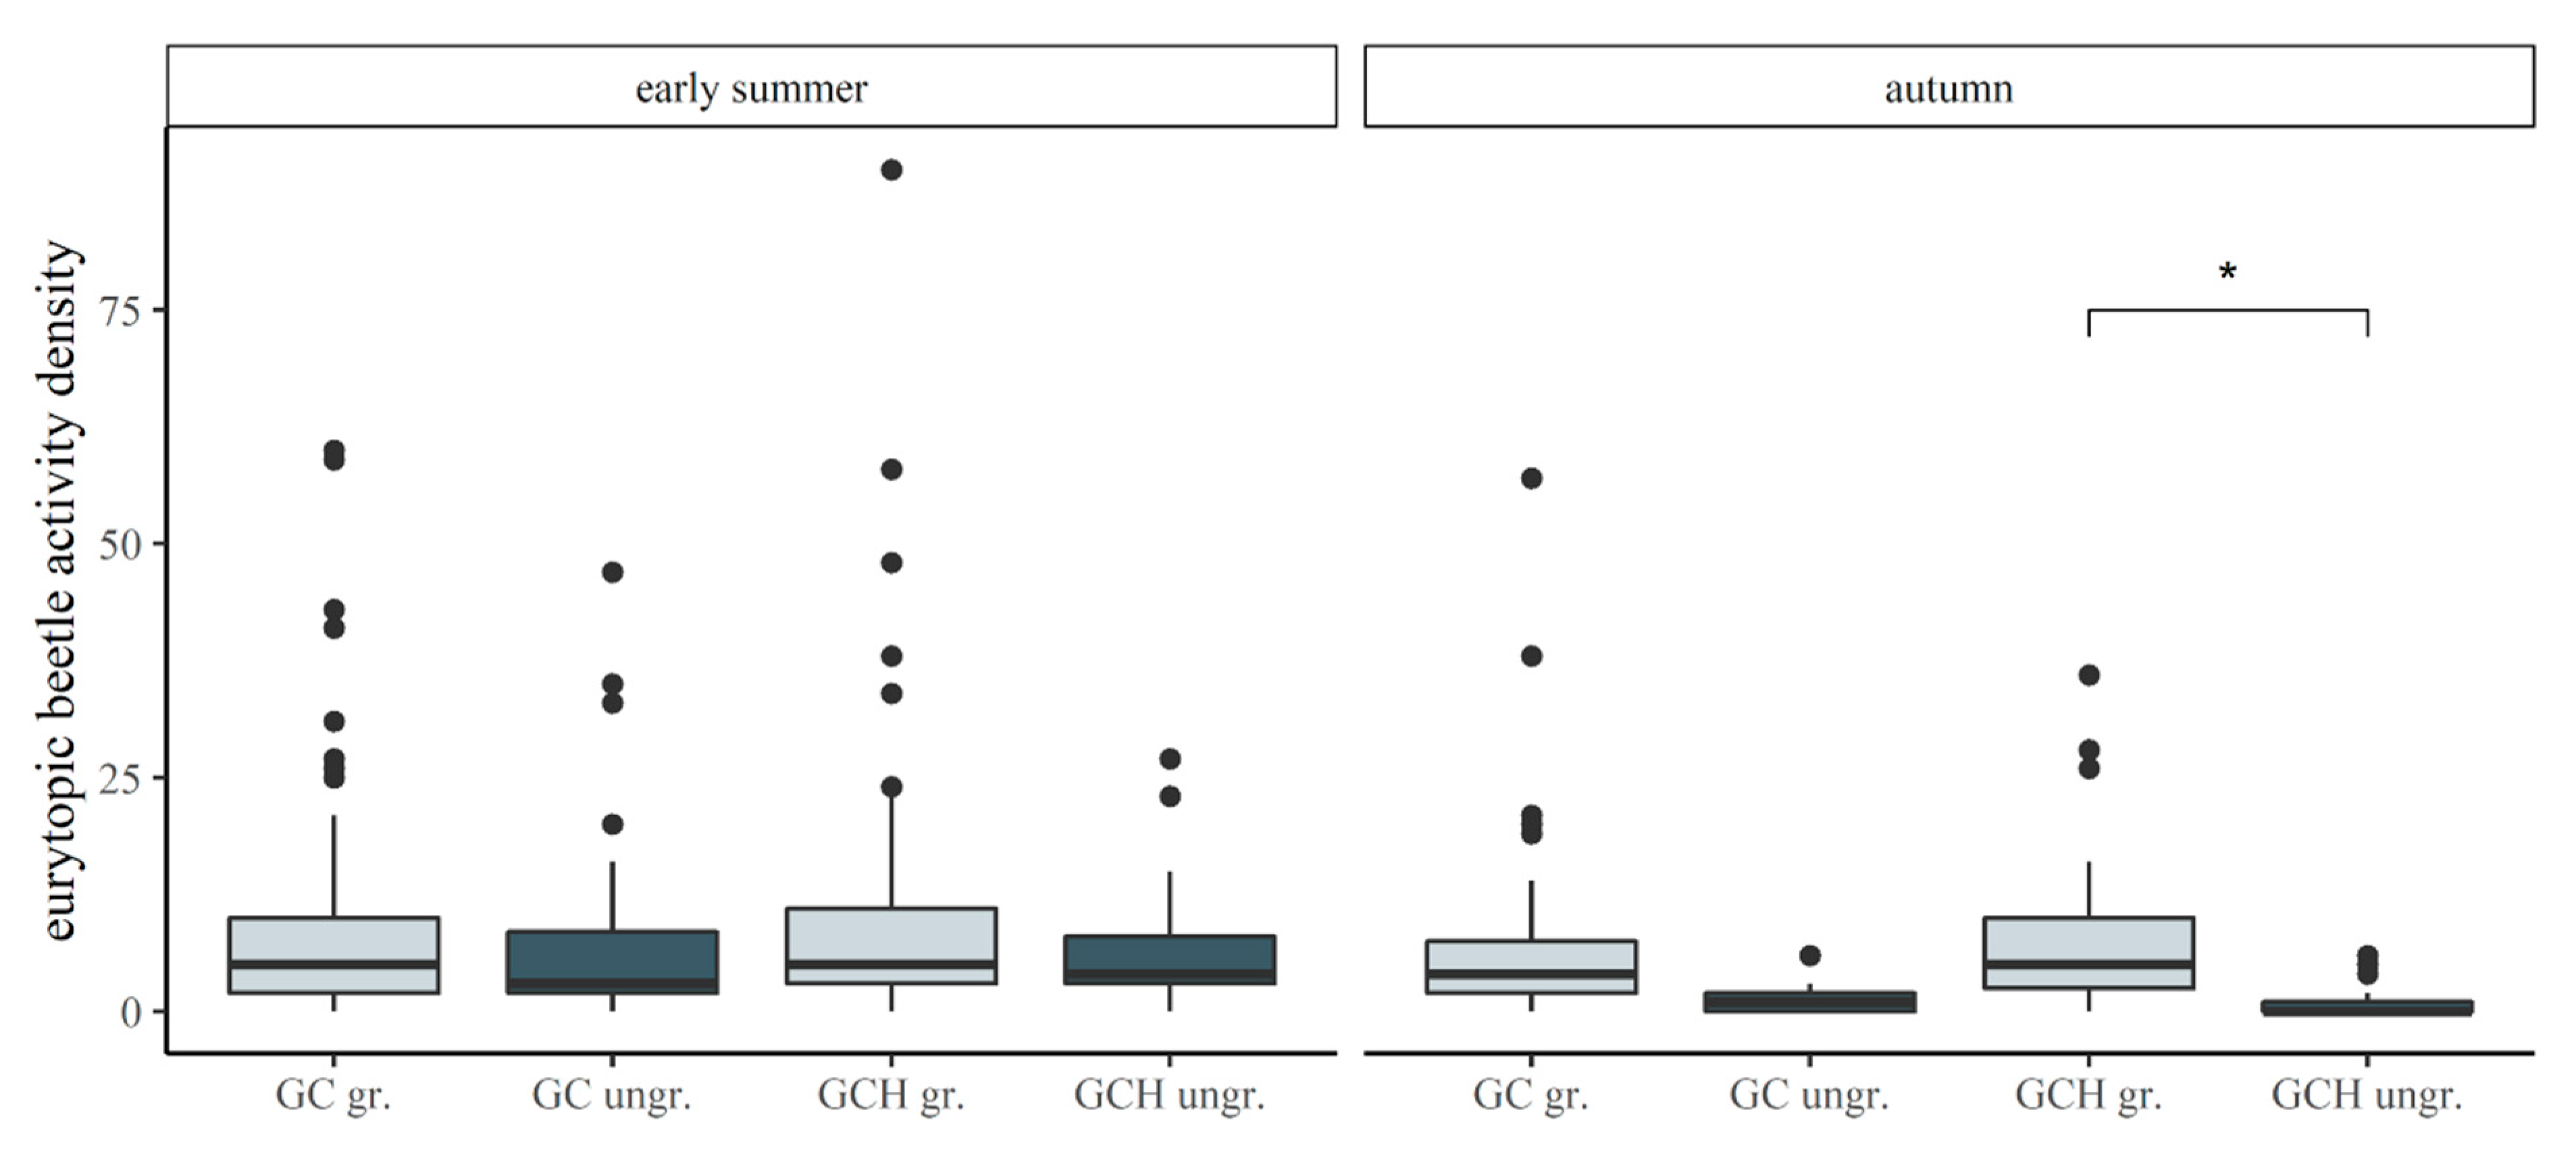
Table A5.
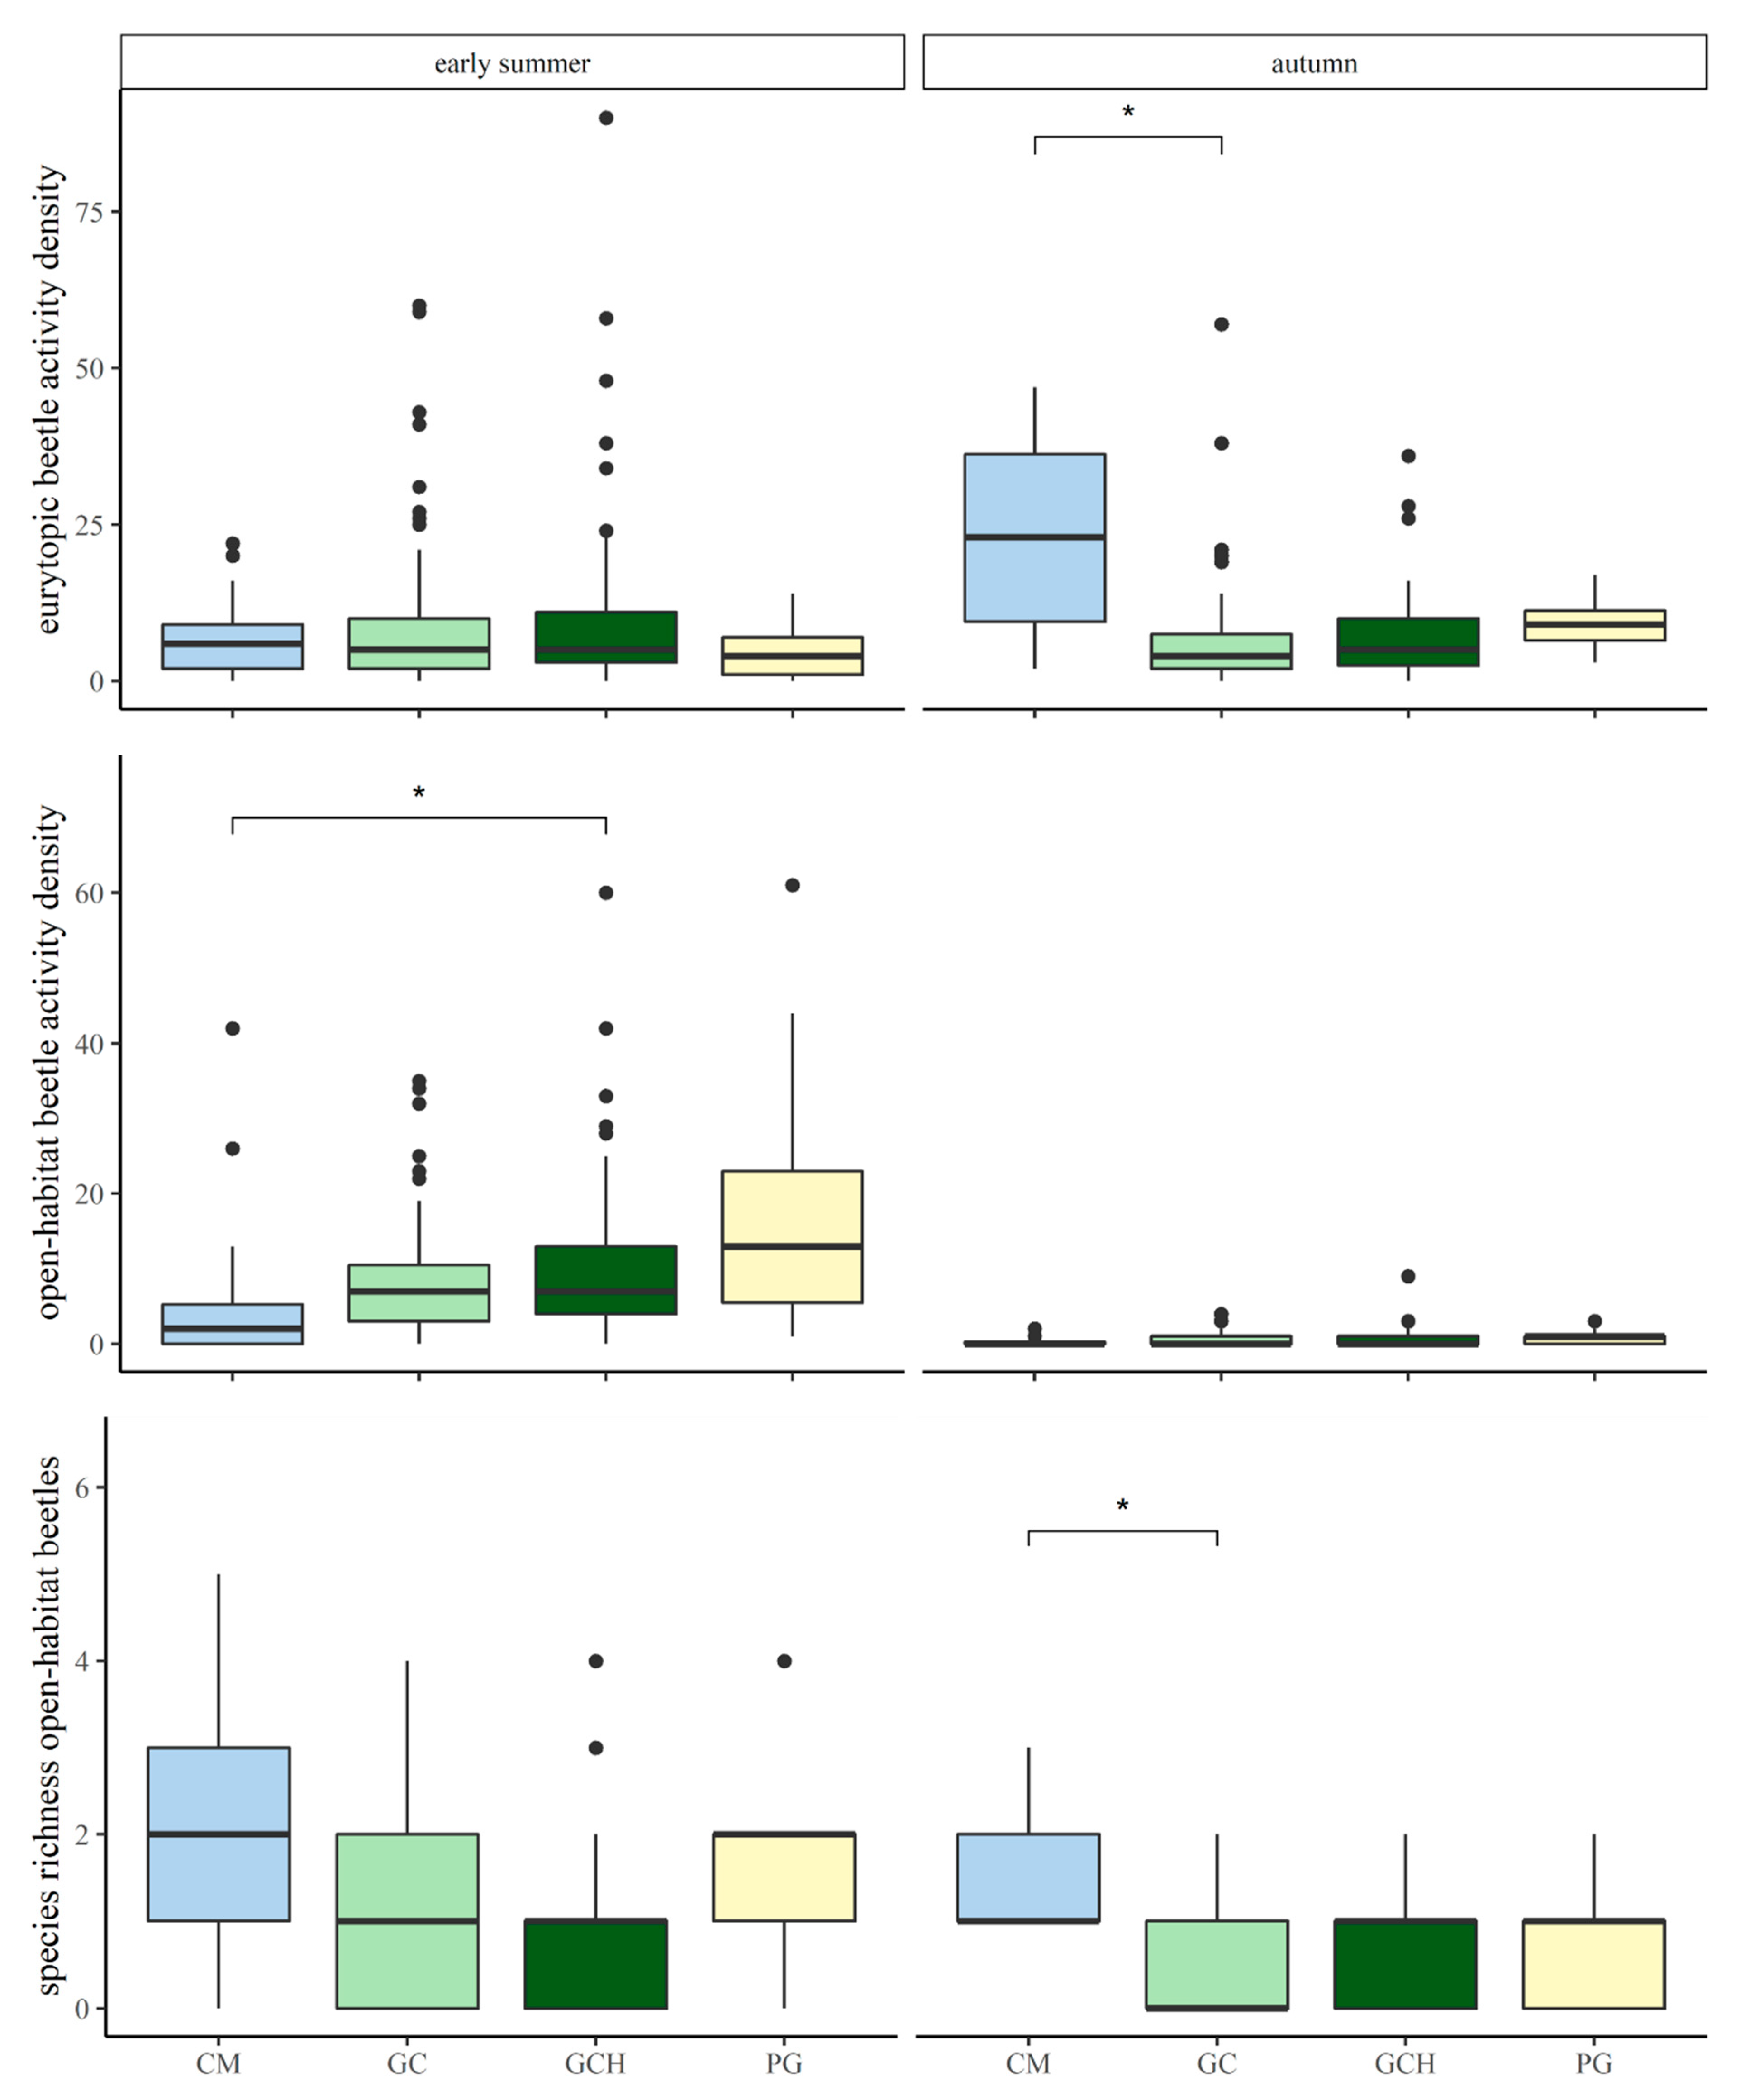
Differences in the activity densities of eurytopic carabid beetles, comparing grass–clover (GC) and grass–clover herbs (GCH) with each other, and in comparison to conventional maize (CM) and permanent grasslands (PG) in May/June and September. p-values are indicated as * p < 0.05.
Table A5.
Differences in the activity densities of eurytopic carabid beetles, comparing grass–clover (GC) and grass–clover herbs (GCH) with each other, and in comparison to conventional maize (CM) and permanent grasslands (PG) in May/June and September. p-values are indicated as * p < 0.05.
| | Estimate | SE | z-Value | p-Value |
|---|
| GCH–GC (September) | 1.11 | 2.657 | 0.418 | 0.998 |
| CM–GC (September) | 16.71 | 4.850 | 3.445 | 0.033 * |
| PG–GC (September) | 2.086 | 2.730 | 0.758 | 0.964 |
| CM–GCH (September) | 15.6 | 4.732 | 3.297 | 0.043 * |
| PG–GCH (September) | 0.958 | 2.515 | 0.381 | 1.0 |
| GCH–GC (May) | 0.63 | 2.327 | 0.271 | 1.0 |
| CM–GC (May) | −1.4489 | 2.299 | −0.630 | 0.985 |
| PG–GC (May) | −3.653 | 2.23 | −1.638 | 0.535 |
| CM–GCH (May) | −2.079 | 2.323 | −0.895 | 0.928 |
| PG–GCH (May) | −4.283 | 2.255 | −1.899 | 0.39 |
Table A6.
Differences in the activity densities of open-habitat carabid beetles, comparing grass–clover (GC) and grass–clover herbs (GCH) with each other, and in comparison to conventional maize (CM) and permanent grasslands (PG) in May/June and September. p-values are indicated as * p < 0.05.
Table A6.
Differences in the activity densities of open-habitat carabid beetles, comparing grass–clover (GC) and grass–clover herbs (GCH) with each other, and in comparison to conventional maize (CM) and permanent grasslands (PG) in May/June and September. p-values are indicated as * p < 0.05.
| | Estimate | SE | z-Value | p-Value |
|---|
| GCH–GC (September) | 0.123 | 0.535 | 0.229 | 1.0 |
| CM–GC (September) | −0.216 | 0.558 | −0.386 | 0.999 |
| PG–GC (September) | 0.395 | 0.557 | 0.71 | 0.98 |
| CM–GCH (September) | −0.338 | 0.577 | −0.587 | 0.992 |
| PG–GCH (September) | 0.273 | 0.575 | 0.474 | 0.998 |
| GCH–GC (May) | 1.449 | 1.182 | 1.225 | 0.805 |
| CM–GC (May) | −3.853 | 1.289 | −2.989 | 0.076 |
| PG–GC (May) | 8.526 | 3.005 | 2.837 | 0.099 |
| CM–GCH (May) | −5.301 | 1.393 | −3.805 | 0.019 * |
| PG–GCH (May) | 7.077 | 3.051 | 2.319 | 0.227 |
Table A7.
Differences in the species richness of open-habitat carabid beetles, comparing grass–clover (GC) and grass–clover herbs (GCH) with each other, and in comparison to conventional maize (CM) and permanent grasslands (PG) in May/June and September. p-values are indicated as * p < 0.05.
Table A7.
Differences in the species richness of open-habitat carabid beetles, comparing grass–clover (GC) and grass–clover herbs (GCH) with each other, and in comparison to conventional maize (CM) and permanent grasslands (PG) in May/June and September. p-values are indicated as * p < 0.05.
| | Estimate | SE | z-Value | p-Value |
|---|
| GCH–GC (September) | 0.163 | 0.159 | 1.027 | 0.903 |
| CM–GC (September) | 0.897 | 0.239 | 3.745 | 0.021 * |
| PG–GC (September) | 0.157 | 0.208 | 0.753 | 0.975 |
| CM–GCH (September) | 0.734 | 0.239 | 3.074 | 0.068 |
| PG–GCH (September) | −0.007 | 0.207 | −0.032 | 1.0 |
| GCH–GC (May) | 0.008 | 0.155 | 0.054 | 1.0 |
| CM–GC (May) | 0.944 | 0.238 | 3.964 | 0.014 * |
| PG–GC (May) | 0.532 | 0.212 | 2.508 | 0.173 |
| CM–GCH (May) | 0.936 | 0.236 | 3.973 | 0.014 * |
| PG–GCH (May) | 0.524 | 0.209 | 2.504 | 0.174 |
Table A8.
Differences in activity densities of agrotopic carabid beetles, comparing grass–clover (GC) and grass–clover herbs (GCH) with each other, and in comparison to conventional maize (CM) and permanent grasslands (PG) in May/June and September.
Table A8.
Differences in activity densities of agrotopic carabid beetles, comparing grass–clover (GC) and grass–clover herbs (GCH) with each other, and in comparison to conventional maize (CM) and permanent grasslands (PG) in May/June and September.
| | Estimate | SE | z-Value | p-Value |
|---|
| GCH–GC (September) | 0.499 | 0.672 | 0.742 | 0.974 |
| CM–GC (September) | −0.123 | 0.781 | −0.157 | 1.0 |
| PG–GC (September) | 7.161 | 2.748 | 2.606 | 0.141 |
| CM–GCH (September) | −0.622 | 0.766 | −0.811 | 0.96 |
| PG–GCH (September) | 6.662 | 2.744 | 2.428 | 0.188 |
| GCH–GC (May) | 1.751 | 0.896 | 1.955 | 0.375 |
| CM–GC (May) | 0.017 | 1.542 | 0.011 | 1.0 |
| PG–GC (May) | −0.489 | 1.068 | −0.458 | 0.998 |
| CM–GCH (May) | −1.734 | 1.579 | −1.098 | 0.863 |
| PG–GCH (May) | −2.24 | 1.122 | −1.996 | 0.355 |
Table A9.
Differences in the species richness of agrotopic carabid beetles, comparing grass–clover (GC) and grass–clover herbs (GCH) with each other, and in comparison to conventional maize (CM) and permanent grasslands (PG) in May/June and September.
Table A9.
Differences in the species richness of agrotopic carabid beetles, comparing grass–clover (GC) and grass–clover herbs (GCH) with each other, and in comparison to conventional maize (CM) and permanent grasslands (PG) in May/June and September.
| | Estimate | SE | z-Value | p-Value |
|---|
| GCH–GC (September) | 0.136 | 0.42 | 0.323 | 1.0 |
| CM–GC (September) | 0.359 | 0.482 | 0.745 | 0.958 |
| PG–GC (September) | 0.195 | 0.461 | 0.422 | 0.997 |
| CM–GCH (September) | 0.223 | 0.485 | 0.460 | 0.996 |
| PG–GCH (September) | 0.059 | 0.465 | 0.127 | 1.0 |
| GCH–GC (May) | 0.076 | 0.438 | 0.174 | 1.0 |
| CM–GC (May) | −1.102 | 0.455 | −2.425 | 0.173 |
| PG–GC (May) | 0.354 | 0.458 | 0.773 | 0.951 |
| CM–GCH (May) | −1.178 | 0.456 | −2.581 | 0.135 |
| PG–GCH (May) | 0.278 | 0.460 | 0.605 | 0.983 |
Table A10.
Differences in the species richness of eurytopic carabid beetles, comparing grass–clover (GC) and grass–clover herbs (GCH) with each other, and in comparison to conventional maize (CM) and permanent grasslands (PG) in May/June and September.
Table A10.
Differences in the species richness of eurytopic carabid beetles, comparing grass–clover (GC) and grass–clover herbs (GCH) with each other, and in comparison to conventional maize (CM) and permanent grasslands (PG) in May/June and September.
| | Estimate | SE | z-Value | p-Value |
|---|
| GCH–GC (September) | 0.126 | 0.459 | 0.275 | 1.0 |
| CM–GC (September) | 1.097 | 0.485 | 2.262 | 0.216 |
| PG–GC (September) | −0.008 | 0.473 | −0.016 | 1.0 |
| CM–GCH (September) | 0.97 | 0.486 | 1.997 | 0.317 |
| PG–GCH (September) | −0.134 | 0.475 | −0.283 | 1.0 |
| GCH–GC (May) | 0.119 | 0.437 | 0.273 | 1.0 |
| CM–GC (May) | −0.301 | 0.452 | −0.666 | 0.97 |
| PG–GC (May) | −0.177 | 0.484 | −0.365 | 0.998 |
| CM–GCH (May) | −0.42 | 0.452 | −0.931 | 0.891 |
| PG–GCH (May) | −0.296 | 0.484 | −0.612 | 0.98 |
Table A11.
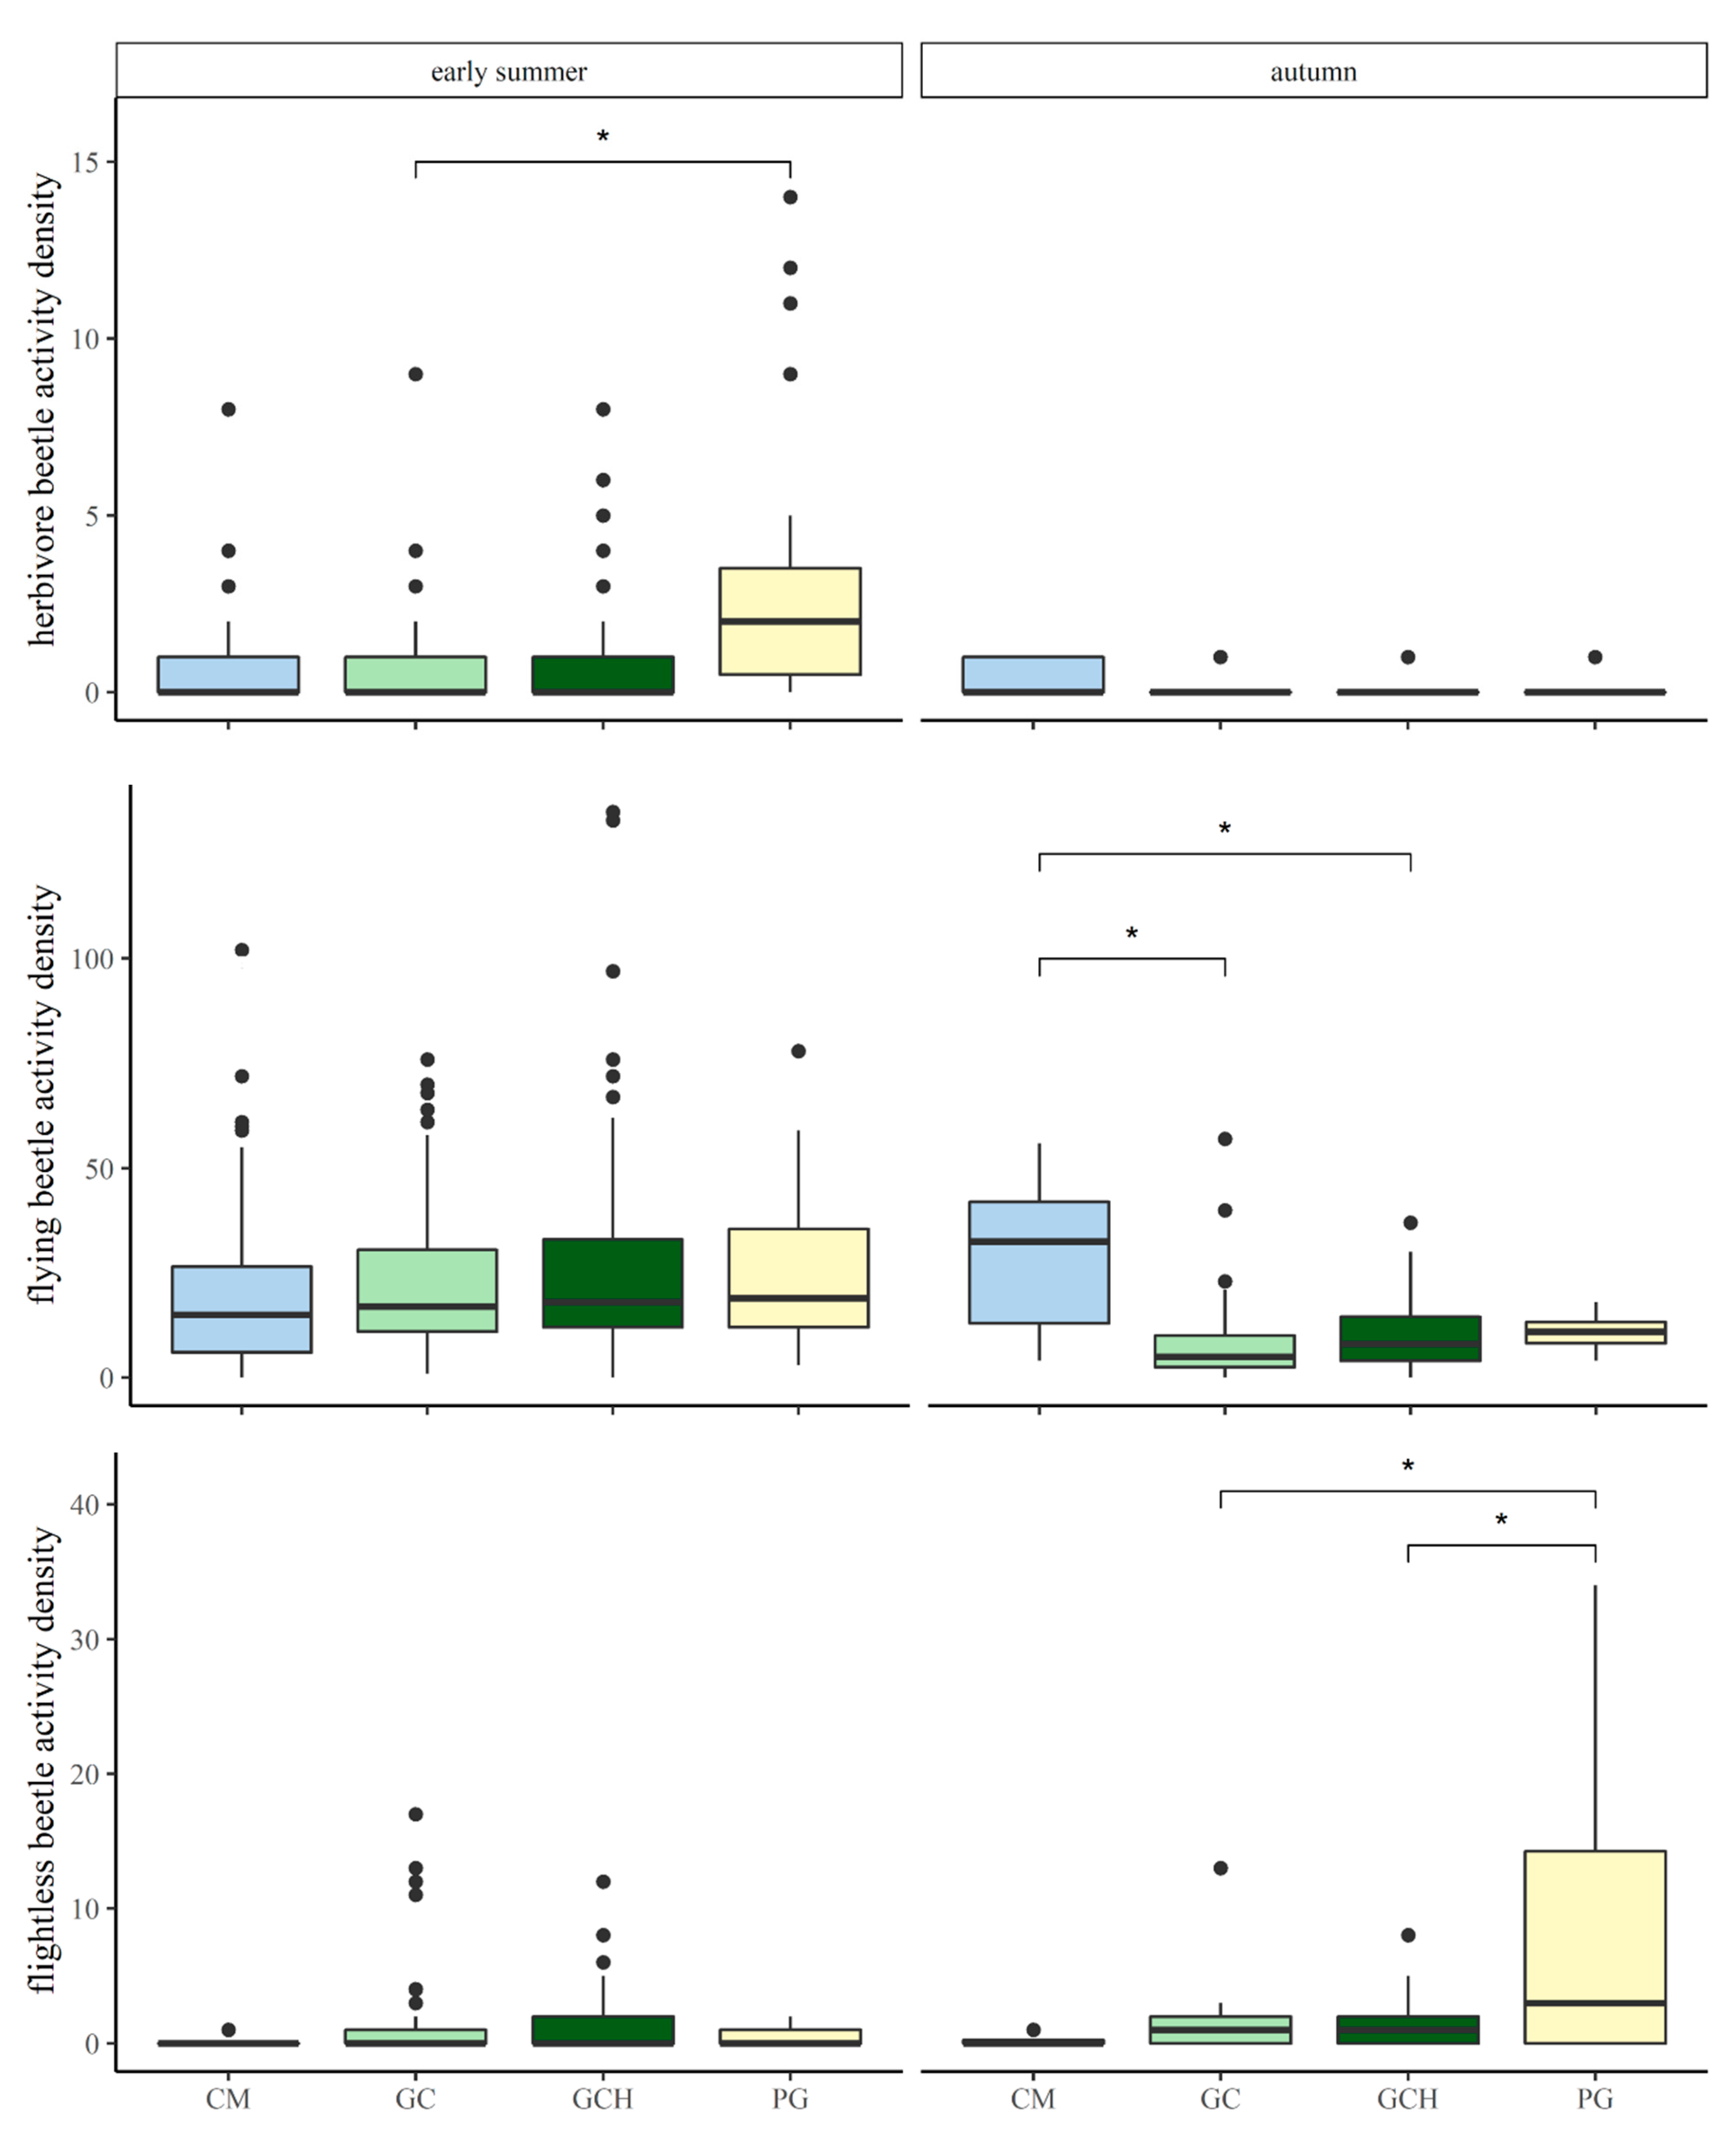
Differences in activity densities of herbivore carabid beetles, comparing grass–clover (GC) and grass–clover herbs (GCH) with each other, and in comparison to conventional maize (CM) and permanent grasslands (PG) in May/June and September. p-values are indicated as * p < 0.05.
Table A11.
Differences in activity densities of herbivore carabid beetles, comparing grass–clover (GC) and grass–clover herbs (GCH) with each other, and in comparison to conventional maize (CM) and permanent grasslands (PG) in May/June and September. p-values are indicated as * p < 0.05.
| | Estimate | SE | z-Value | p-Value |
|---|
| GCH–GC (September) | −0.0001 | 0.445 | 0.000 | 1.0 |
| CM–GC (September) | 0.214 | 0.595 | 0.36 | 0.999 |
| PG–GC (September) | 0.117 | 0.856 | 0.136 | 1.0 |
| CM–GCH (September) | 0.215 | 0.601 | 0.357 | 0.999 |
| PG–GCH (September) | 0.117 | 0.86 | 0.136 | 1.0 |
| GCH–GC (May) | 0.267 | 0.411 | 0.65 | 0.982 |
| CM–GC (May) | 0.11 | 0.452 | 0.243 | 1.0 |
| PG–GC (May) | 2.472 | 0.698 | 3.543 | 0.028 * |
| CM–GCH (May) | −0.157 | 0.454 | −0.347 | 0.999 |
| PG–GCH (May) | 2.205 | 0.699 | 3.153 | 0.055 |
Table A12.
Differences in activity densities of flightless/immobile carabid beetles, comparing grass–clover (GC) and grass–clover herbs (GCH) with each other, and in comparison to conventional maize (CM) and permanent grasslands (PG) in May/June and September. p-values are indicated as * p < 0.05.
Table A12.
Differences in activity densities of flightless/immobile carabid beetles, comparing grass–clover (GC) and grass–clover herbs (GCH) with each other, and in comparison to conventional maize (CM) and permanent grasslands (PG) in May/June and September. p-values are indicated as * p < 0.05.
| | Estimate | SE | z-Value | p-Value |
|---|
| GCH–GC (September) | 0.234 | 0.570 | 0.41 | 0.998 |
| CM–GC (September) | −0.999 | 0.517 | −1.931 | 0.37 |
| PG–GC (September) | 6.837 | 1.682 | 4.065 | 0.011 * |
| CM–GCH (September) | −1.232 | 0.47 | −2.623 | 0.13 |
| PG–GCH (September) | 6.603 | 1.668 | 3.959 | 0.013 * |
| GCH–GC (May) | 0.069 | 0.467 | 0.148 | 1.0 |
| CM–GC (May) | −0.964 | 0.439 | −2.194 | 0.255 |
| PG–GC (May) | −0.496 | 1.309 | −0.379 | 0.999 |
| CM–GCH (May) | −1.033 | 0.416 | −2.482 | 0.163 |
| PG–GCH (May) | −0.595 | 1.301 | −0.434 | 0.998 |
Table A13.
Differences in activity densities of flying/mobile carabid beetles, comparing grass–clover (GC) and grass–clover herbs (GCH) with each other, and in comparison to conventional maize (CM) and permanent grasslands (PG) in May/June and September. p-values are indicated as * p < 0.05.
Table A13.
Differences in activity densities of flying/mobile carabid beetles, comparing grass–clover (GC) and grass–clover herbs (GCH) with each other, and in comparison to conventional maize (CM) and permanent grasslands (PG) in May/June and September. p-values are indicated as * p < 0.05.
| | Estimate | SE | z-Value | p-Value |
|---|
| GCH–GC (September) | 2.327 | 4.677 | 0.5 | 0.995 |
| CM–GC (September) | 21.521 | 5.906 | 3.644 | 0.023 * |
| PG–GC (September) | 3.356 | 5.296 | 0.634 | 0.983 |
| CM–GCH (September) | 19.194 | 5.901 | 3.252 | 0.046 * |
| PG–GCH (September) | 1.029 | 5.291 | 0.194 | 1.0 |
| GCH–GC (May) | 3.784 | 5.020 | 0.754 | 0.963 |
| CM–GC (May) | 0.509 | 5.681 | 0.09 | 1.0 |
| PG–GC (May) | 3.85 | 5.954 | 0.647 | 0.982 |
| CM–GCH (May) | −3.275 | 5.781 | −0.566 | 0.99 |
| PG–GCH (May) | 0.066 | 6.049 | −0.011 | 1.0 |
Table A14.
Differences in the biomasses of carabid beetles, comparing grass–clover (GC) and grass–clover herbs (GCH) with each other, and in comparison to conventional maize (CM) and permanent grasslands (PG) in May/June and September.
Table A14.
Differences in the biomasses of carabid beetles, comparing grass–clover (GC) and grass–clover herbs (GCH) with each other, and in comparison to conventional maize (CM) and permanent grasslands (PG) in May/June and September.
| | Estimate | SE | z-Value | p-Value |
|---|
| GCH–GC (September) | 19.1 | 85.34 | 0.224 | 1.0 |
| CM–GC (September) | 407.78 | 128.9 | 3.163 | 0.054 |
| PG–GC (September) | 150.94 | 92.7 | 1.628 | 0.538 |
| CM–GCH (September) | 388.67 | 126.76 | 3.066 | 0.064 |
| PG–GCH (September) | 131.84 | 89.69 | 1.47 | 0.633 |
| GCH–GC (May) | 29.8 | 86.74 | 0.344 | 0.999 |
| CM–GC (May) | −139.31 | 86.29 | −1.615 | 0.546 |
| PG–GC (May) | −95.7 | 87.86 | −1.089 | 0.848 |
| CM–GCH (May) | −169.12 | 81.22 | −2.082 | 0.303 |
| PG–GCH (May) | −125.5 | 82.89 | −1.514 | 0.606 |
Table A15.
Differences in the Chao diversity index of carabid beetles, comparing grass–clover (GC) and grass–clover herbs (GCH) with each other, and in comparison to conventional maize (CM) and permanent grasslands (PG) in May/June and September.
Table A15.
Differences in the Chao diversity index of carabid beetles, comparing grass–clover (GC) and grass–clover herbs (GCH) with each other, and in comparison to conventional maize (CM) and permanent grasslands (PG) in May/June and September.
| | Estimate | SE | z-Value | p-Value |
|---|
| GCH–GC (September) | −0.337 | 0.460 | −0.733 | 0.978 |
| CM–GC (September) | 1.031 | 1.203 | 0.857 | 0.955 |
| PG–GC (September) | −0.803 | 0.476 | −1.685 | 0.541 |
| CM–GCH (September) | 1.369 | 1.18 | 1.16 | 0.846 |
| PG–GCH (September) | −0.465 | 0.416 | −1.117 | 0.866 |
| GCH–GC (May) | 0.401 | 0.452 | 0.887 | 0.948 |
| CM–GC (May) | −0.533 | 0.46 | −1.159 | 0.846 |
| PG–GC (May) | 0.275 | 0.697 | 0.395 | 0.999 |
| CM–GCH (May) | −0.934 | 0.501 | −1.863 | 0.438 |
| PG–GCH (May) | −0.125 | 0.725 | −0.173 | 1.0 |
Table A16.
Differences in activity densities of red list carabid beetles, comparing grass–clover (GC) and grass–clover herbs (GCH) with each other, and in comparison to conventional maize (CM) and permanent grasslands (PG) in May/June and September.
Table A16.
Differences in activity densities of red list carabid beetles, comparing grass–clover (GC) and grass–clover herbs (GCH) with each other, and in comparison to conventional maize (CM) and permanent grasslands (PG) in May/June and September.
| | Estimate | SE | z-Value | p-Value |
|---|
| GCH–GC (September) | −0.065 | 0.586 | −0.111 | 1.0 |
| CM–GC (September) | 0.017 | 0.553 | 0.03 | 1.0 |
| PG–GC (September) | −0.033 | 0.563 | −0.059 | 1.0 |
| CM–GCH (September) | 0.081 | 0.515 | 0.158 | 1.0 |
| PG–GCH (September) | 0.032 | 0.526 | 0.06 | 1.0 |
| GCH–GC (May) | −0.048 | 0.52 | −0.092 | 1.0 |
| CM–GC (May) | −0.823 | 0.506 | −1.627 | 0.485 |
| PG–GC (May) | −0.526 | 0.512 | −1.027 | 0.829 |
| CM–GCH (May) | −0.775 | 0.489 | −1.586 | 0.508 |
| PG–GCH (May) | −0.478 | 0.495 | −0.966 | 0.858 |
Table A17.
Differences in activity densities of carnivore carabid beetles, comparing grass–clover (GC) and grass–clover herbs (GCH) with each other, and in comparison to conventional maize (CM) and permanent grasslands (PG) in May/June and September.
Table A17.
Differences in activity densities of carnivore carabid beetles, comparing grass–clover (GC) and grass–clover herbs (GCH) with each other, and in comparison to conventional maize (CM) and permanent grasslands (PG) in May/June and September.
| | Estimate | SE | z-Value | p-Value |
|---|
| GCH–GC (September) | 0.176 | 4.136 | 0.042 | 1.0 |
| CM–GC (September) | 9.871 | 5.105 | 1.934 | 0.377 |
| PG–GC (September) | 4.609 | 5.09 | 0.905 | 0.927 |
| CM–GCH (September) | 9.695 | 5.08 | 1.907 | 0.39 |
| PG–GCH (September) | 4.433 | 5.07 | 0.874 | 0.936 |
| GCH–GC (May) | 3.152 | 4.549 | 0.693 | 0.977 |
| CM–GC (May) | −2.343 | 5.067 | −0.462 | 0.997 |
| PG–GC (May) | 1.503 | 5.487 | 0.274 | 1.0 |
| CM–GCH (May) | −5.494 | 5.178 | −1.061 | 0.866 |
| PG–GCH (May) | −1.648 | 5.589 | −0.295 | 1.0 |
Table A18.
Differences in activity densities of eurytopic carabid beetles, comparing the grazed pastures and ungrazed strips of the grass–clover (GC) and the grass–clover herbs (GCH) in May/June and September. p-values are indicated as * p < 0.05.
Table A18.
Differences in activity densities of eurytopic carabid beetles, comparing the grazed pastures and ungrazed strips of the grass–clover (GC) and the grass–clover herbs (GCH) in May/June and September. p-values are indicated as * p < 0.05.
| | Estimate | SE | z-Value | p-Value |
|---|
| GC ungr.–GC gr. (September) | −5.675 | 2.632 | −2.157 | 0.156 |
| GCH ungr.–GCH gr. (September) | −6.8 | 2.407 | −2.825 | 0.0495 * |
| GC ungr.–GC gr. (May) | −0.824 | 2.776 | −0.297 | 0.994 |
| GCH ungr.–GCH gr. (May) | −2.484 | 2.456 | −1.013 | 0.715 |
Table A19.
Differences in beetle activity densities, comparing the grazed pastures and ungrazed strips of the grass–clover (GC) and the grass–clover herbs (GCH) in May/June and September.
Table A19.
Differences in beetle activity densities, comparing the grazed pastures and ungrazed strips of the grass–clover (GC) and the grass–clover herbs (GCH) in May/June and September.
| | Estimate | SE | z-Value | p-Value |
|---|
| GC ungr.–GC gr. (September) | −6.017 | 5.656 | −1.064 | 0.677 |
| GCH ungr.–GCH gr. (September) | −7.619 | 5.674 | −1.343 | 0.502 |
| GC ungr.–GC gr. (May) | 1.941 | 6.054 | 0.321 | 0.991 |
| GCH ungr.–GCH gr. (May) | −4.186 | 6.076 | −0.689 | 0.891 |
Table A20.
Differences in biomasses, comparing the grazed pastures and ungrazed strips of the grass–clover (GC) and the grass–clover herbs (GCH) in May/June and September.
Table A20.
Differences in biomasses, comparing the grazed pastures and ungrazed strips of the grass–clover (GC) and the grass–clover herbs (GCH) in May/June and September.
| | Estimate | SE | z-Value | p-Value |
|---|
| GC ungr.–GC gr. (September) | −193.86 | 84.52 | −2.294 | 0.126 |
| GCH ungr.–GCH gr. (September) | −155.67 | 90.12 | −1.727 | 0.308 |
| GC ungr.–GC gr. (May) | −45.96 | 106.03 | −0.433 | 0.977 |
| GCH ungr.–GCH gr. (May) | −158.67 | 84.67 | −1.874 | 0.248 |
Table A21.
Differences in activity densities of open-habitat carabid beetles, comparing the grazed pastures and ungrazed strips of the grass–clover (GC) and the grass–clover herbs (GCH) in May/June and September.
Table A21.
Differences in activity densities of open-habitat carabid beetles, comparing the grazed pastures and ungrazed strips of the grass–clover (GC) and the grass–clover herbs (GCH) in May/June and September.
| | Estimate | SE | z-Value | p-Value |
|---|
| GC ungr.–GC gr. (September) | 0.468 | 0.603 | 0.776 | 0.889 |
| GCH ungr.–GCH gr. (September) | 0.738 | 0.586 | 1.259 | 0.612 |
| GC ungr.–GC gr. (May) | 1.375 | 1.521 | 0.904 | 0.827 |
| GCH ungr.–GCH gr. (May) | −1.392 | 1.385 | −1.005 | 0.77 |
Table A22.
Differences in activity densities of agrotopic carabid beetles, comparing the grazed pastures and ungrazed strips of the grass–clover (GC) and the grass–clover herbs (GCH) in May/June and September.
Table A22.
Differences in activity densities of agrotopic carabid beetles, comparing the grazed pastures and ungrazed strips of the grass–clover (GC) and the grass–clover herbs (GCH) in May/June and September.
| | Estimate | SE | z-Value | p-Value |
|---|
| GC ungr.–GC gr. (September) | −0.971 | 0.73 | −1.330 | 0.543 |
| GCH ungr.–GCH gr. (September) | −1.306 | 0.717 | −1.821 | 0.282 |
| GC ungr.–GC gr. (May) | 1.135 | 1.098 | 1.034 | 0.73 |
| GCH ungr.–GCH gr. (May) | −1.313 | 1.161 | −1.131 | 0.669 |
Table A23.
Differences in species richness of eurytopic carabid beetles, comparing the grazed pastures and ungrazed strips of the grass–clover (GC) and the grass–clover herbs (GCH) in May/June and September.
Table A23.
Differences in species richness of eurytopic carabid beetles, comparing the grazed pastures and ungrazed strips of the grass–clover (GC) and the grass–clover herbs (GCH) in May/June and September.
| | Estimate | SE | z-Value | p-Value |
|---|
| GC ungr.–GC gr. (September) | −1.128 | 0.481 | −2.343 | 0.11 |
| GCH ungr.–GCH gr. (September) | −1.253 | 0.484 | −2.59 | 0.072 |
| GC ungr.–GC gr. (May) | −0.534 | 0.472 | −1.131 | 0.621 |
| GCH ungr.–GCH gr. (May) | −0.064 | 0.488 | −0.131 | 1.0 |
Table A24.
Differences in species richness of open-habitat carabid beetles, comparing the grazed pastures and ungrazed strips of the grass–clover (GC) and the grass–clover herbs (GCH) in May/June and September.
Table A24.
Differences in species richness of open-habitat carabid beetles, comparing the grazed pastures and ungrazed strips of the grass–clover (GC) and the grass–clover herbs (GCH) in May/June and September.
| | Estimate | SE | z-Value | p-Value |
|---|
| GC ungr.–GC gr. (September) | 0.042 | 0.228 | 0.186 | 1.0 |
| GCH ungr.–GCH gr. (September) | 0.264 | 0.243 | 1.085 | 0.728 |
| GC ungr.–GC gr. (May) | 0.007 | 0.197 | 0.035 | 1.0 |
| GCH ungr.–GCH gr. (May) | −0.022 | 0.176 | −0.126 | 1.0 |
Table A25.
Differences in species richness of agrotopic carabid beetles, comparing the grazed pastures and ungrazed strips of the grass–clover (GC) and the grass–clover herbs (GCH) in May/June and September.
Table A25.
Differences in species richness of agrotopic carabid beetles, comparing the grazed pastures and ungrazed strips of the grass–clover (GC) and the grass–clover herbs (GCH) in May/June and September.
| | Estimate | SE | z-Value | p-Value |
|---|
| GC ungr.–GC gr. (September) | 0.132 | 0.441 | 0.298 | 0.994 |
| GCH ungr.–GCH gr. (September) | 0.388 | 0.456 | 0.851 | 0.81 |
| GC ungr.–GC gr. (May) | 0.107 | 0.472 | 0.226 | 0.998 |
| GCH ungr.–GCH gr. (May) | −0.172 | 0.469 | −0.366 | 0.987 |
Table A26.
Differences in Chao diversity index, comparing the grazed pastures and ungrazed strips of the grass–clover (GC) and the grass–clover herbs (GCH) in May/June and September.
Table A26.
Differences in Chao diversity index, comparing the grazed pastures and ungrazed strips of the grass–clover (GC) and the grass–clover herbs (GCH) in May/June and September.
| | Estimate | SE | z-Value | p-Value |
|---|
| GC ungr.–GC gr. (September) | −0.5775 | 0.6324 | −0.913 | 0.83 |
| GCH ungr.–GCH gr. (September) | 0.2566 | 0.7578 | 0.339 | 0.994 |
| GC ungr.–GC gr. (May) | −0.4892 | 0.5385 | −0.908 | 0.832 |
| GCH ungr.–GCH gr. (May) | −0.3111 | 0.6663 | −0.467 | 0.981 |
Table A27.
Differences in activity densities of red list carabid beetles, comparing the grazed pastures and ungrazed strips of the grass–clover (GC) and the grass–clover herbs (GCH) in May/June and September.
Table A27.
Differences in activity densities of red list carabid beetles, comparing the grazed pastures and ungrazed strips of the grass–clover (GC) and the grass–clover herbs (GCH) in May/June and September.
| | Estimate | SE | z-Value | p-Value |
|---|
| GC ungr.–GC gr. (September) | 0.002 | 0.667 | 0.004 | 1.0 |
| GCH ungr.–GCH gr. (September) | 0.047 | 0.568 | 0.083 | 1.0 |
| GC ungr.–GC gr. (May) | −0.148 | 0.557 | −0.265 | 0.996 |
| GCH ungr.–GCH gr. (May) | −0.217 | 0.517 | −0.420 | 0.979 |
Table A28.
Differences in activity densities of herbivore carabid beetles, comparing the grazed pastures and ungrazed strips of the grass–clover (GC) and the grass–clover herbs (GCH) in May/June and September.
Table A28.
Differences in activity densities of herbivore carabid beetles, comparing the grazed pastures and ungrazed strips of the grass–clover (GC) and the grass–clover herbs (GCH) in May/June and September.
| | Estimate | SE | z-Value | p-Value |
|---|
| GC ungr.–GC gr. (September) | −0.043 | 0.538 | −0.079 | 1.0 |
| GCH ungr.–GCH gr. (September) | 0.183 | 0.508 | 0.359 | 0.989 |
| GC ungr.–GC gr. (May) | 0.314 | 0.465 | 0.676 | 0.904 |
| GCH ungr.–GCH gr. (May) | −0.045 | 0.458 | −0.098 | 1.0 |
Table A29.
Differences in activity densities of herbivore carabid beetles, comparing the grazed pastures and ungrazed strips of the grass–clover (GC) and the grass–clover herbs (GCH) in May/June and September.
Table A29.
Differences in activity densities of herbivore carabid beetles, comparing the grazed pastures and ungrazed strips of the grass–clover (GC) and the grass–clover herbs (GCH) in May/June and September.
| | Estimate | SE | z-Value | p-Value |
|---|
| GC ungr.–GC gr. (September) | −5.179 | 4.710 | −1.1 | 0.672 |
| GCH ungr.–GCH gr. (September) | −4.742 | 4.711 | −1.006 | 0.731 |
| GC ungr.–GC gr. (May) | 2.302 | 5.191 | 0.443 | 0.977 |
| GCH ungr.–GCH gr. (May) | −3.073 | 5.233 | −0.587 | 0.94 |
Table A30.
Differences in activity densities of flightless/immobile carabid beetles, comparing the grazed pastures and ungrazed strips of the grass–clover (GC) and the grass–clover herbs (GCH) in May/June and September.
Table A30.
Differences in activity densities of flightless/immobile carabid beetles, comparing the grazed pastures and ungrazed strips of the grass–clover (GC) and the grass–clover herbs (GCH) in May/June and September.
| | Estimate | SE | z-Value | p-Value |
|---|
| GC ungr.–GC gr. (September) | −1.037 | 0.652 | −1.591 | 0.387 |
| GCH ungr.–GCH gr. (September) | −1.359 | 0.503 | −2.701 | 0.065 |
| GC ungr.–GC gr. (May) | −0.215 | 0.505 | −0.425 | 0.982 |
| GCH ungr.–GCH gr. (May) | −0.467 | 0.436 | −1.069 | 0.703 |
Table A31.
Differences in activity densities of flying/mobile carabid beetles, comparing the grazed pastures and ungrazed strips of the grass–clover (GC) and the grass–clover herbs (GCH) in May/June and September.
Table A31.
Differences in activity densities of flying/mobile carabid beetles, comparing the grazed pastures and ungrazed strips of the grass–clover (GC) and the grass–clover herbs (GCH) in May/June and September.
| | Estimate | SE | z-Value | p-Value |
|---|
| GC ungr.–GC gr. (September) | −4.83 | 5.275 | −0.196 | 0.773 |
| GCH ungr.–GCH gr. (September) | −6.375 | 5.275 | −1.208 | 0.589 |
| GC ungr.–GC gr. (May) | 1.9 | 5.657 | 0.336 | 0.99 |
| GCH ungr.–GCH gr. (May) | −3.834 | 5.708 | −0.672 | 0.901 |


