Article

Side-Deep Fertilization Stabilizes Double-Cropping Rice Yield, Increases N and P Utilization, and Reduces N and P Losses

1
College of Resources and Environmental, Hunan Agricultural University, Changsha 410128, China
2
National Engineering Research Center for Efficient Utilization of Soil and Fertilizer Resources, Changsha 410128, China
*
Author to whom correspondence should be addressed.
Land 2023, 12(3), 724; https://doi.org/10.3390/land12030724
Submission received: 17 November 2022 / Revised: 14 March 2023 / Accepted: 14 March 2023 / Published: 22 March 2023
(This article belongs to the Special Issue Status in Agricultural Soil Pollution and Its Controls)

Abstract

:
(1) Background: the broadcast is an outdated fertilization method with a low fertilizer-utilization rate and environmental problems, which seriously restricts the development of agriculture. (2) Methods: Under a machine-transplanted rice with side-deep fertilization (MRSF) mode, five treatments were applied: 0 cm (D0), 5 cm (D5), 7.5 cm (D7.5), and 10 cm (D10), comprising four different depths of fertilization, and no fertilization (CK). The yield, the accumulation of N and P in the straw and in grains of rice, concentrations of N and P in the surface water, ammonia (NH3) volatilization, and soil nutrients were measured in rice fields. (3) Results: In rice yields, compared with the D0 treatment, only the D7.5 treatment significantly increased by 7.84% in late rice, while the other treatments showed no significant difference between early and late rice. The N- and P-use efficiency of D10 increased by 5.30–24.73% and 0.84–17.75%, respectively, compared with the D0-D7.5 treatments. In surface water, compared with the D0 treatment, D5, D7.5, and D10, the total N (TN), total P (TP) concentration, and NH3 volatilization decreased by 10.24–60.76%, 16.30–31.01%, and 34.78–86.08%, respectively; the D10 treatment had the best inhibition effect on the TN, TP concentration, and NH3 volatilization, which were 58.48–60.76%, 22.04–31.01%, and 77.21–86.08%, respectively. (4) Conclusions: The optimized depth for side-deep fertilization was 10 cm. We would like to emphasize the impact of the paddy on various deep fertilizations and provide an important reference for developing precise fertilization in rice fields in this area.

1. Introduction

Rice (Oryza sativa L.) is the world’s most important food crop and is eaten by half of the world’s population [1]. In order to cater to the population’s need for food, a large amount of fertilizer is widely used to increase rice yield in many countries [2,3]. However, at present, the utilization rate of chemical fertilizer in developing countries is generally lower than 50%, while in developed countries, it can reach 60–70% [4,5]. Inappropriate fertilization methods, like spreading, not only lead to a low fertilizer-utilization rate but also lead to a series of environmental problems such as water eutrophication, soil acidification, and groundwater pollution [6,7,8]. Improving the utilization rate of fertilizer and reducing improper fertilization have become environmental issues that have garnered global attention. Meanwhile, with the advancement of urbanization and the development of society, the shortage of a rural labor force is becoming increasingly severe [9]. We need to establish a simple, low-cost, clean, and efficient rice production mode to resolve the above two problems. Machine-transplanted rice with side-deep fertilization (MRSF) could solve the problem of labor shortages in a more environmentally friendly way.
MRSF is a new agronomic method of simultaneous side-deep fertilization and transplanting. Side-deep fertilization can be considered a way to reduce fertilizer loss and extend fertilizer efficiency, which better matches the N demand of rice plants and effectively enhances fertilizer-use efficiency and rice yield. Studies have shown that, under MRSF, the yield, nitrogen (N) accumulation, and N harvest index of rice increased by 11.8–19.6%, 10.3–13.1%, and 27.8–30.0%, respectively [10], and significantly reduced the concentrations of N in surface water and losses owing to NH3 volatilization compared with conventional fertilization [5,11,12]. MRSF increased the rice yield and reduced fertilizer nutrient loss, which makes it possible to reduce fertilizer application [13]. Zhong’s research shows that a 20% reduction in N can have better economic and environmental benefits [13]. However, the fertilizer application–reduction ratio varies depending on the soil, climate, and crop variety [14,15,16]. Phosphorus (P) has poor mobility and is easily fixed by cations in the soil. Especially in some red soil with high iron content in southern China, it is easy to form Fe-P (iron phosphate) and challenging for plants to use [17]. Under MRSF, P fertilizer was also applied deeply and intensively. P fertilizer’s deep placement reduced P loss and effectively improved a crop’s root growth [18,19]. At the same time, it has also been found that deep applications of nitrogen and phosphate fertilizer can make more effective use of P through plant roots and may induce lateral root proliferation [20]. A robust root system will lay the foundation for higher crop yields.
Although MRSF is an effective strategy for increasing rice yield and reducing environmental stress, there needs to be more research on the appropriate depth of fertilization in paddy fields. Currently, MRSF models mostly have a uniform fertilization depth of 5 cm. However, 5 cm is not the optimal depth for fertilization [21]. Soil-column simulations showed that the amount of NH3 lost to volatilization and the mean TN concentration in the surface water at a fertilization depth of 10 cm were consistent with those under non-fertilized treatments and significantly less than those at 5 cm [22]. This implies that a 10 cm treatment is more conducive to reducing N and P nutrient losses. Hence, we hypothesized that 10 cm deep fertilization could improve the field’s utilization rate of N and P fertilizer. Therefore, four different fertilization depths (0, 5, 7.5, and 10 cm) were used in this study to investigate the effects of different depths of fertilization on double-cropping rice yield, concentrations of N and P in the surface water, NH3 volatilization, fertilizer-use efficiency, and the amounts of N and P in the soil during the harvesting period, and furthermore, to reveal the optimal fertilization depth in a rice field under MRSF mode. This study will provide scientific guidance for mechanized agriculture to achieve sustainable and clean production.

2. Materials and Methods
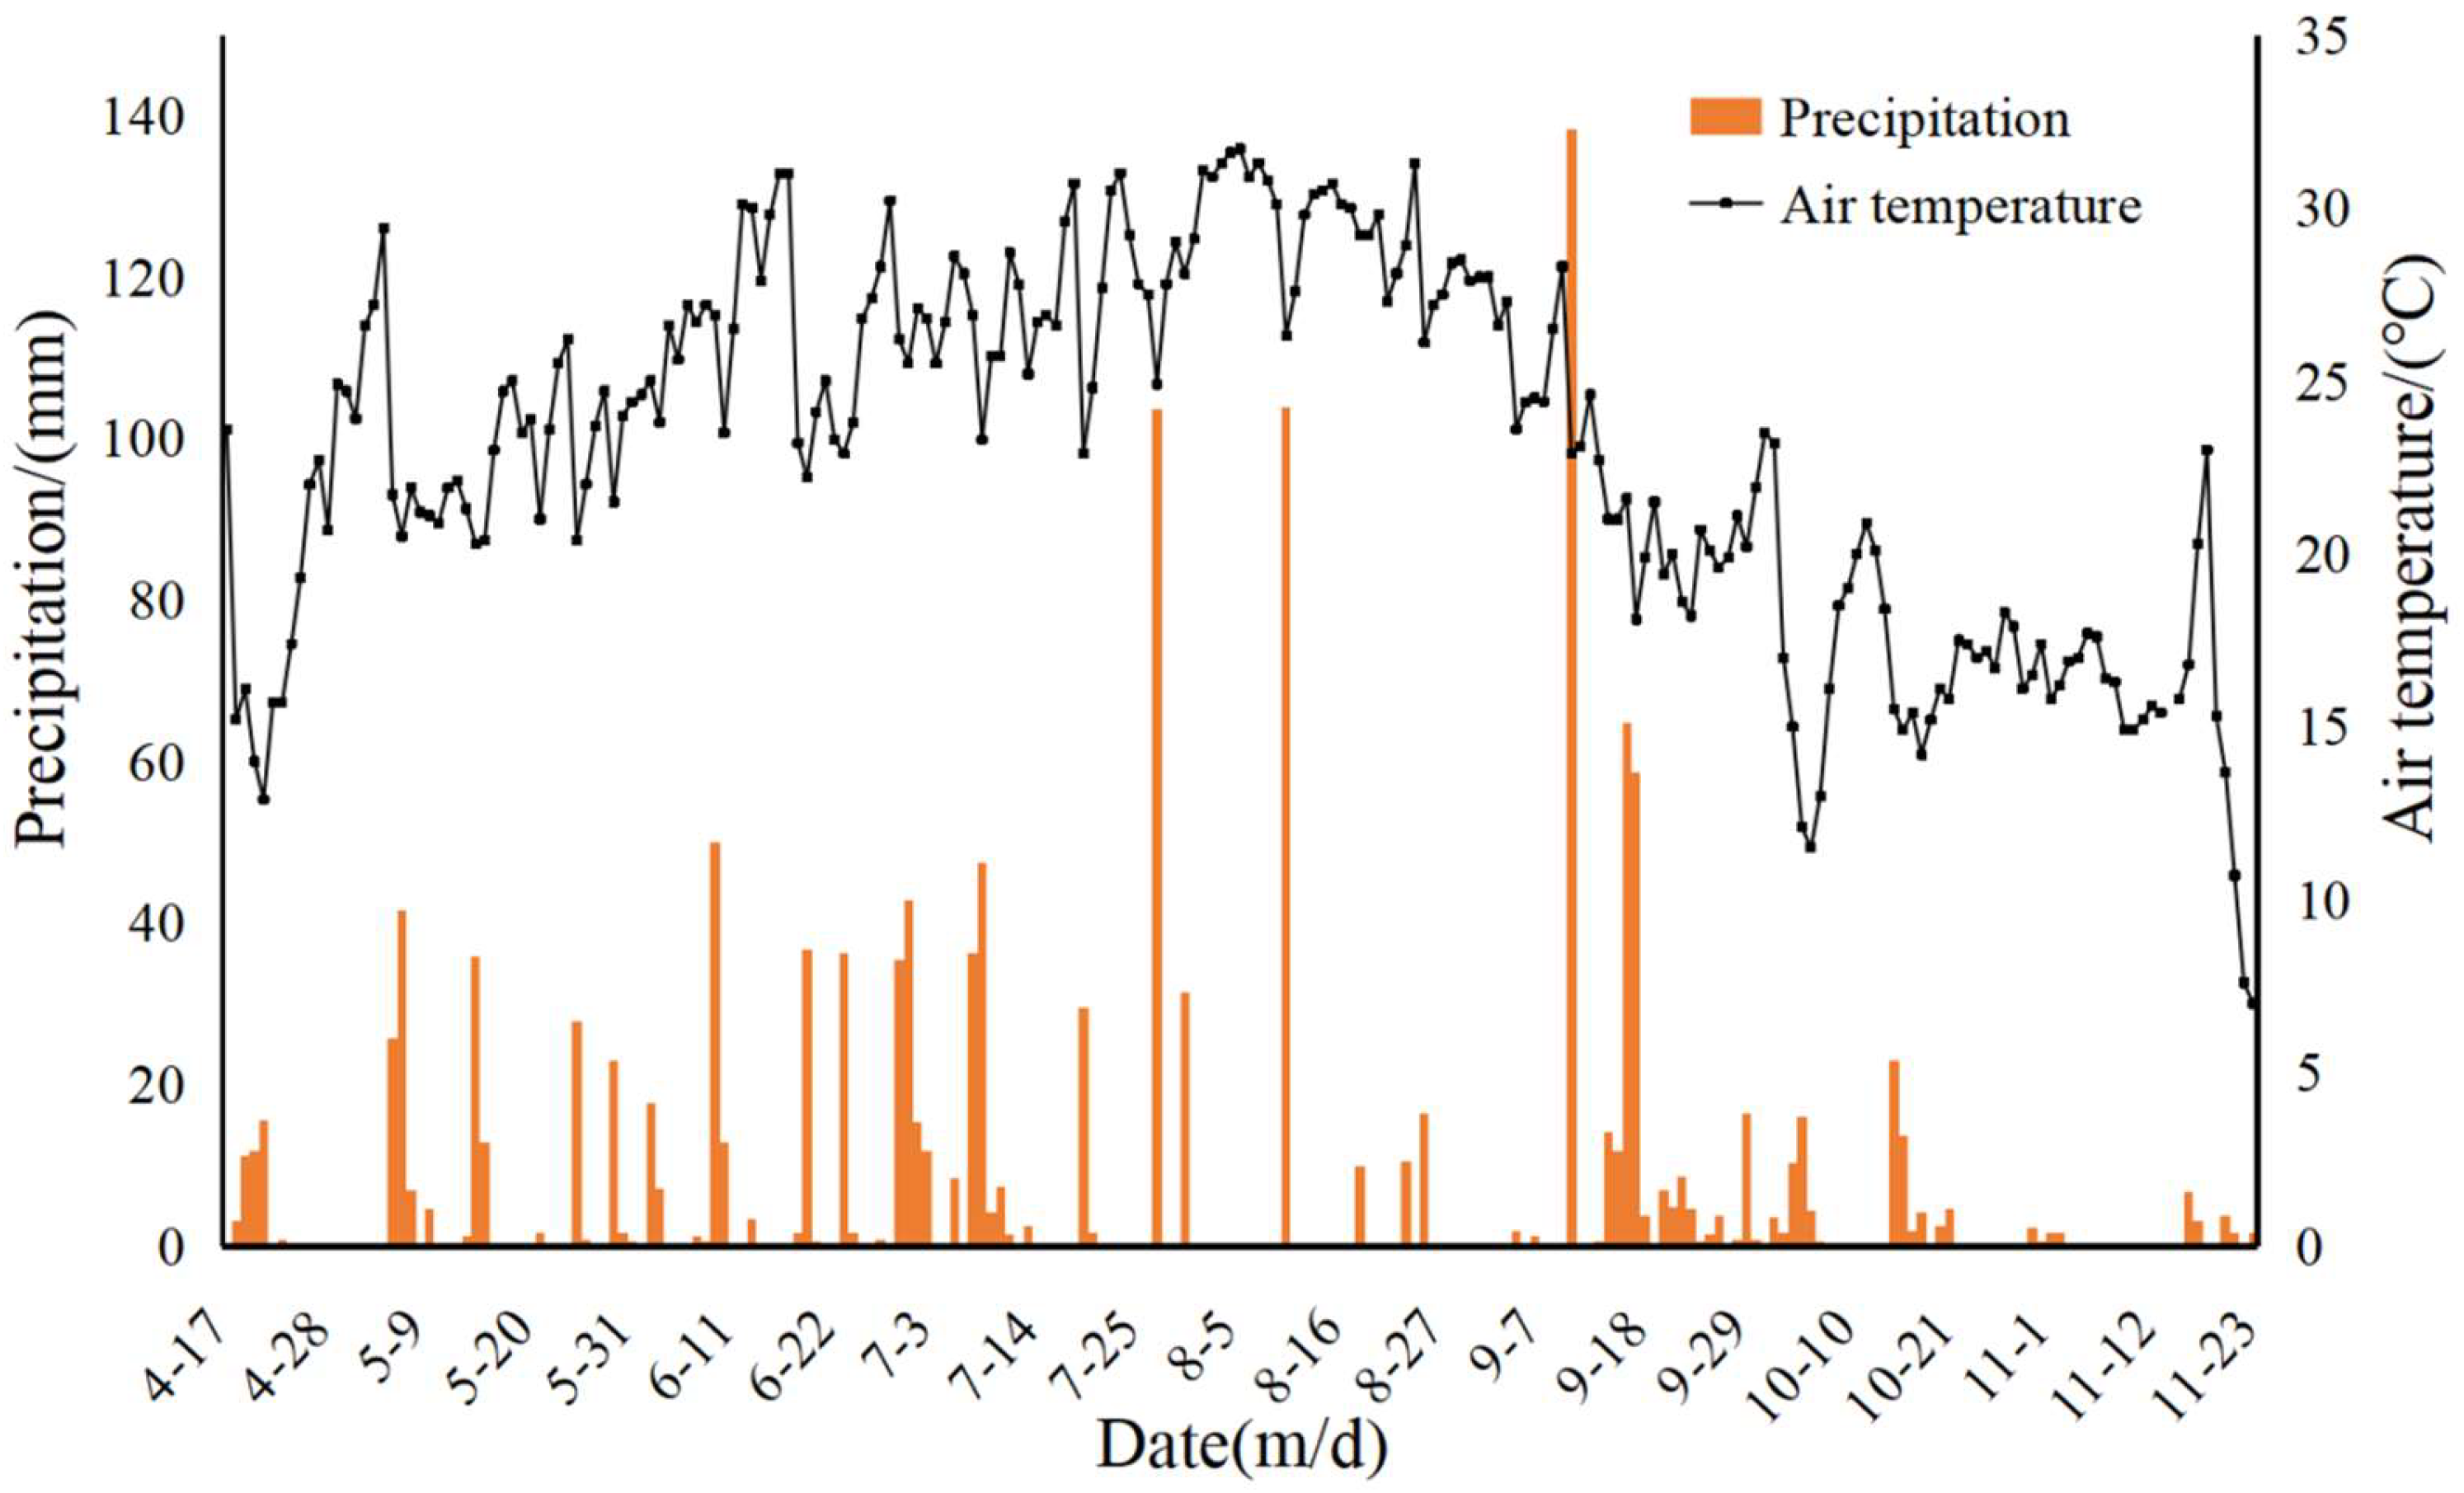
2.1. Site

The experiment was conducted in Qiaomaihu Village, Fenghuang Township, Miluo City, Hunan Province (28°55′ N, 112°56′ E, above sea level 39.6 m) from April to November 2020. The area has a typical humid subtropical climate with an average annual precipitation of 1353 mm and an annual sunshine duration of 1665.0 h. The climatic data on temperature (°C) and precipitation (mm) were provided by the Miluo meteorological bureau (Figure 1). The soil in the area was paddy soil developed from river alluvium, and the previous crop planted was rice. The results of the fundamental soil analysis at the beginning of the experiment for the tillage layer (0–20 cm) are shown in Table 1.

2.2. Materials

Early rice (ESR) and later rice (LSR) varieties were Lingliangyou 268 and Taoyou Xiangzhan, respectively. A special compound fertilizer (N-P2O5-K2O: 20–6.9–17.19 (ESR) and 25.14–6.86–17.14 (LSR)) used for MRSF was produced by Hunan Hualv Co., Ltd. (Xiangtan, China). Machine transplantation was performed using a 2FH-8 rice transplanter with precision fertilization, developed by the Hunan Dragon Boat Agricultural Machinery Co., Ltd. (Yueyang, China).

2.3. Experimental Design

The experiment was established with no fertilization (CK) and surface spreading (D0), and side–deep fertilization at 5 cm (D5), 7.5 cm (D7.5), and 10 cm (D10). The fertilization rates for each treatment were 105/132 kg ha−1 N, 45/36 kg ha−1 P2O5, and 90/90 kg ha−1 K2O in ESR and LSR. The MRSF fertilized D5, D7.5, and D10 treatments, and all of the fertilizers were applied as base fertilizers at once. The planting densities of ESR and LSR were 12 cm × 25 cm and 16 cm × 25 cm, respectively. The ESR seedlings were transplanted on 19 April 2020 and harvested on 17 July 2020. The LSR seedlings were transplanted on 28 July 2020 and harvested on 24 October 2020. Each treatment was conducted in triplicate in a completely randomized arrangement over 120 m2 (20 m × 6 m).

2.4. Sampling and Measurement

2.4.1. Determination of NH3 Volatilization

The NH3 volatilization in rice fields was determined by the closed acid-absorption method [23]. The device consisted of a rigid PVC tube base and cap with an inner diameter of 18 cm and a height of 28 cm. The device was fixed in the gap of rice plants within 24 h after fertilization, inserted into the soil at a depth of 5 cm, and kept in a fixed position throughout the growth period. During the measurement, an iron stand with a height of 20 cm was placed in the device, and a beaker that contained 50 mL of 2% HBO3 solution was placed on the stand. The mouth of the tube was sealed with plastic wrap, and the PVC cap was tightened to ensure no air leakage and to create a completely closed environment for the absorption of NH3. After 24 h, the tube cap was opened to extract the HBO3 absorption solution and titrated with 0.01 mol L−1 H2SO4.
The loss of NH3 volatilization in field soils was calculated as follows:
F = 14 × C × V × 10−2/S
In Equation (1), where F is the NH3 volatilization flux [NH3-N, kg ha−2 d−1]; C is the titration concentration of standard dilute sulfuric acid (mol L−1); V is the volume of dilute sulfuric acid consumed by titration (mL); 14 is the mass number of N per mole of NH3 (g mol−1); and S is the cross-sectional area of the capture-device area (m2). Total emissions of NH3 were calculated based on the accumulation of daily emissions during the early-growth stage of rice [24].

2.4.2. Sampling and Analysis of Surface Water

Field water samples were collected on days 1,2,3, 5, 7, 9, 11, 13, 20, 28, 35, and 42 for ESR and on days 1,2,3, 5, 7, 9, 11, 19, and 26 for LSR. A 100 mL medical syringe was used to sample mixed water in each plot using the 5-point method without disturbing the soil layer. After sampling, the samples were immediately transferred to the laboratory for further analysis, and water samples that were not directly measured were stored in a refrigerator at 4 °C. The NH4+-N, NO3-N, and TN content of water samples were measured by following the methods reported by He [25]. The TN concentrations of water samples were measured using ultraviolet spectroscopy based on basic K2S2O8 digestion (GB11894-89). The NH4+-N and NO3-N concentrations of water samples were measured by vacuum filtering the water samples using a filter membrane with a pore size of 0.45 μm, following which, the concentrations of NH4+-N and NO3-N in the filtrate were measured by an Auto Discrete Analyzer (Smart chem200, Marcon, Italy). The TP and DP content of water samples were measured by following the methods reported by Qi [26]. The TP concentrations of water samples were measured using a visible spectrophotometer based on the basic K2S2O8 digestion. The DP concentrations of water samples were measured by vacuum filtering the water samples using a filter membrane with a pore size of 0.45 μm, following which, the concentrations of DP in the filtrate were measured using a visible spectrophotometer.
The particulate phosphorus (PP) concentration in field water was calculated as follows:
CPP = CTP − CDP
In Equation (2), CPP is the particulate phosphorus concentration in field water, CTP is total phosphorus concentration in field water, CDP is dissolved phosphorus concentration in field water.
The average of the TN concentration in field water was calculated as follows:
Average   of   TN = ( i = 0 n C i ) / n
In Equation (3), C is the TN concentration of water sample, and n is the number of sampling times.
The average of the TN, TP, DP, NH4+-N, and NO3-N concentrations in field water were calculated using the same method as TN.

2.4.3. Soil Sampling and Analysis

For each treatment, 0–20 cm of soil from the plow layer was taken by a 5-point sampling method, mixed, air-dried, and passed through 20 and 100-mesh sieves for chemical determination. Following the methods described by Bao [26], the TN (TNs), TP(TPs), AN, and AP of soil were determined.

2.4.4. Sampling and Analysis of Plant Samples

Crops used a five-point sampling method to take the above-ground parts of rice at the stage of maturity, and the crops were dried to a constant weight using the Thermostatic drier box. The grain and straw were manually separated, crushed, and mixed separately. The N and P contents of grain and straw were measured following the methods described by Bao [27,28]. The above-ground plant’s N and P accumulation was composed of the total N and P of straw plus the total N and P of grain. The utilization-rate efficiency, physiological-use efficiency, and harvest index of N and P were also calculated by Liu [24]. NRE was calculated as the ratio of the increase in plant N accumulation at harvest that resulted from N fertilizer application to the fertilizer N rate; NPE was calculated as the ratio of the grain (or biomass) dry-matter weight at harvest to the above-ground plant N accumulation. NHI was calculated as the ratio of the grain N accumulation to the plant N accumulation at harvesting. PRE, PPE, and PHI were calculated in the same way as nitrogen.

2.5. Statistical Analysis

Excel 2016 and DPS (V7.05) software were used for statistical analysis of data. Differences of all parameters were compared for significance using the LSD tests. All significance tests were conducted at the 0.05 level (p < 0.05). Graph Pad Prism 7 (V7.04) was used for plotting.

3. Results

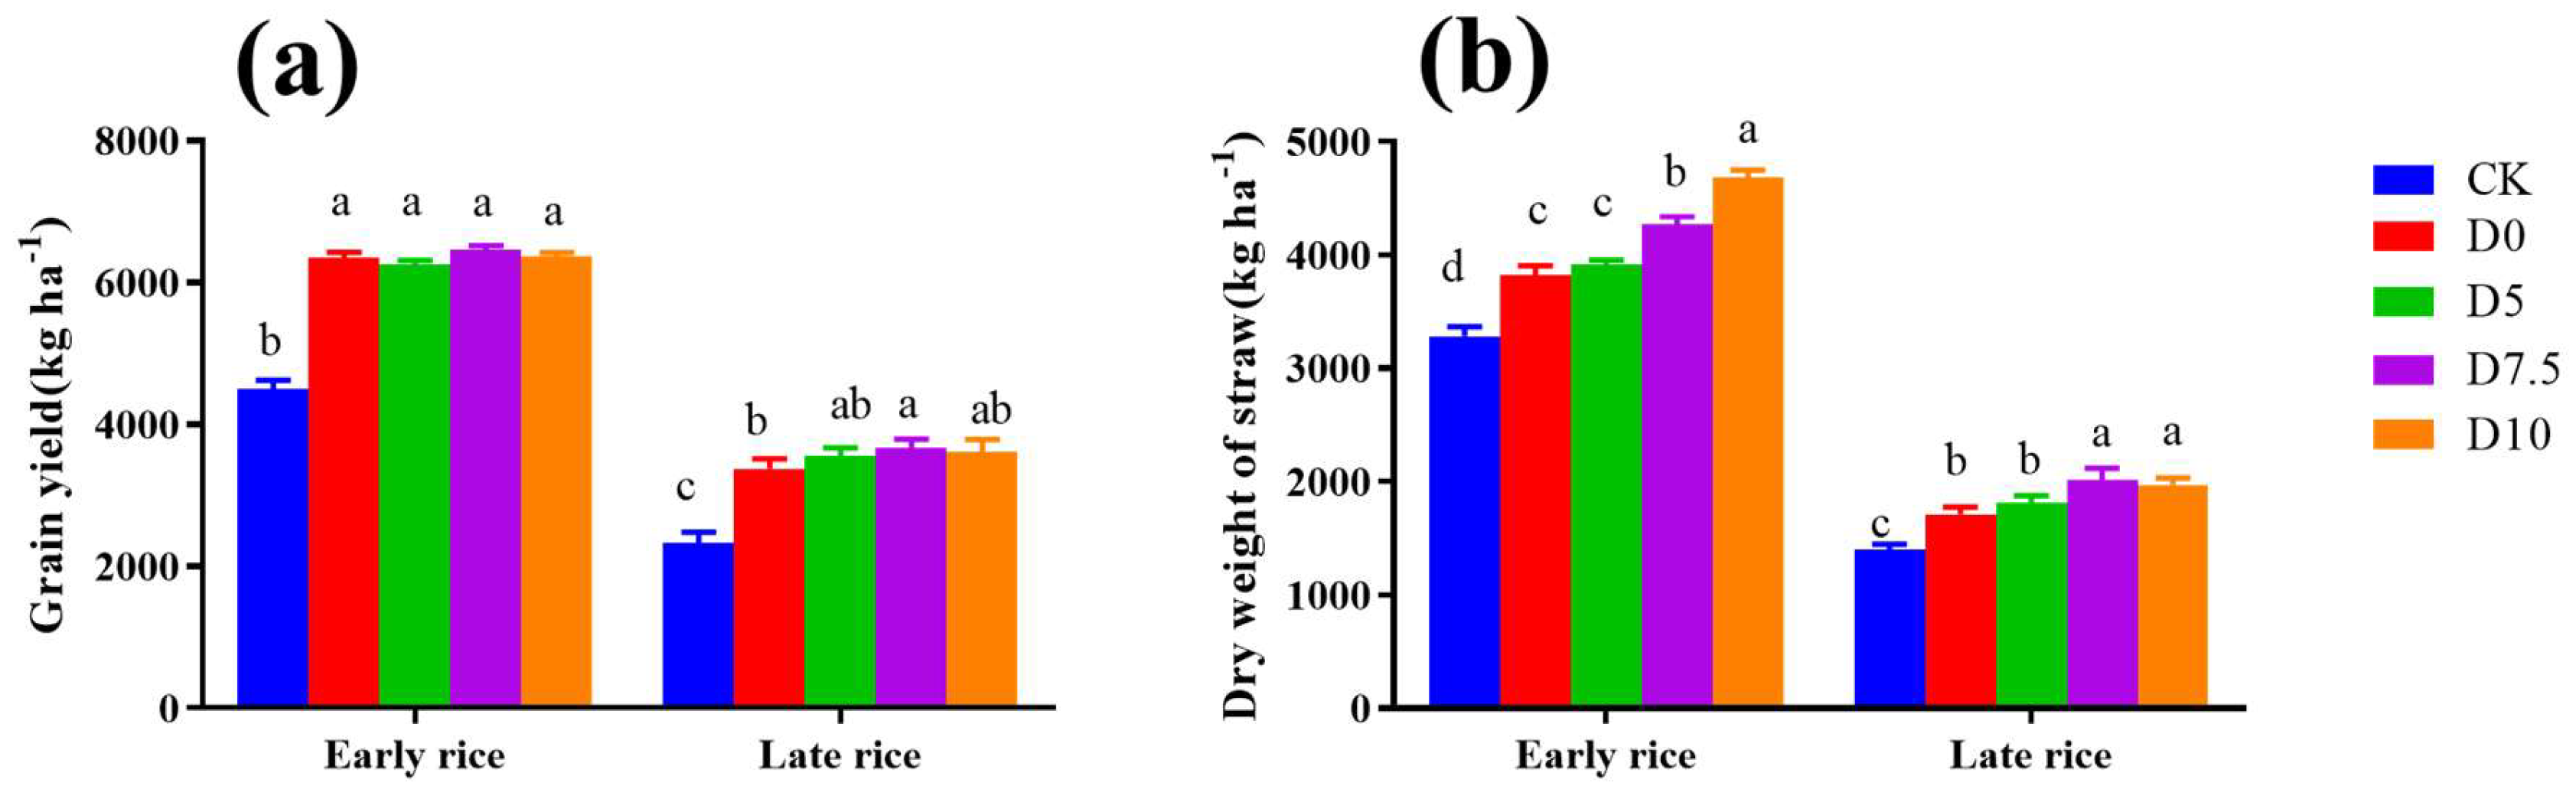
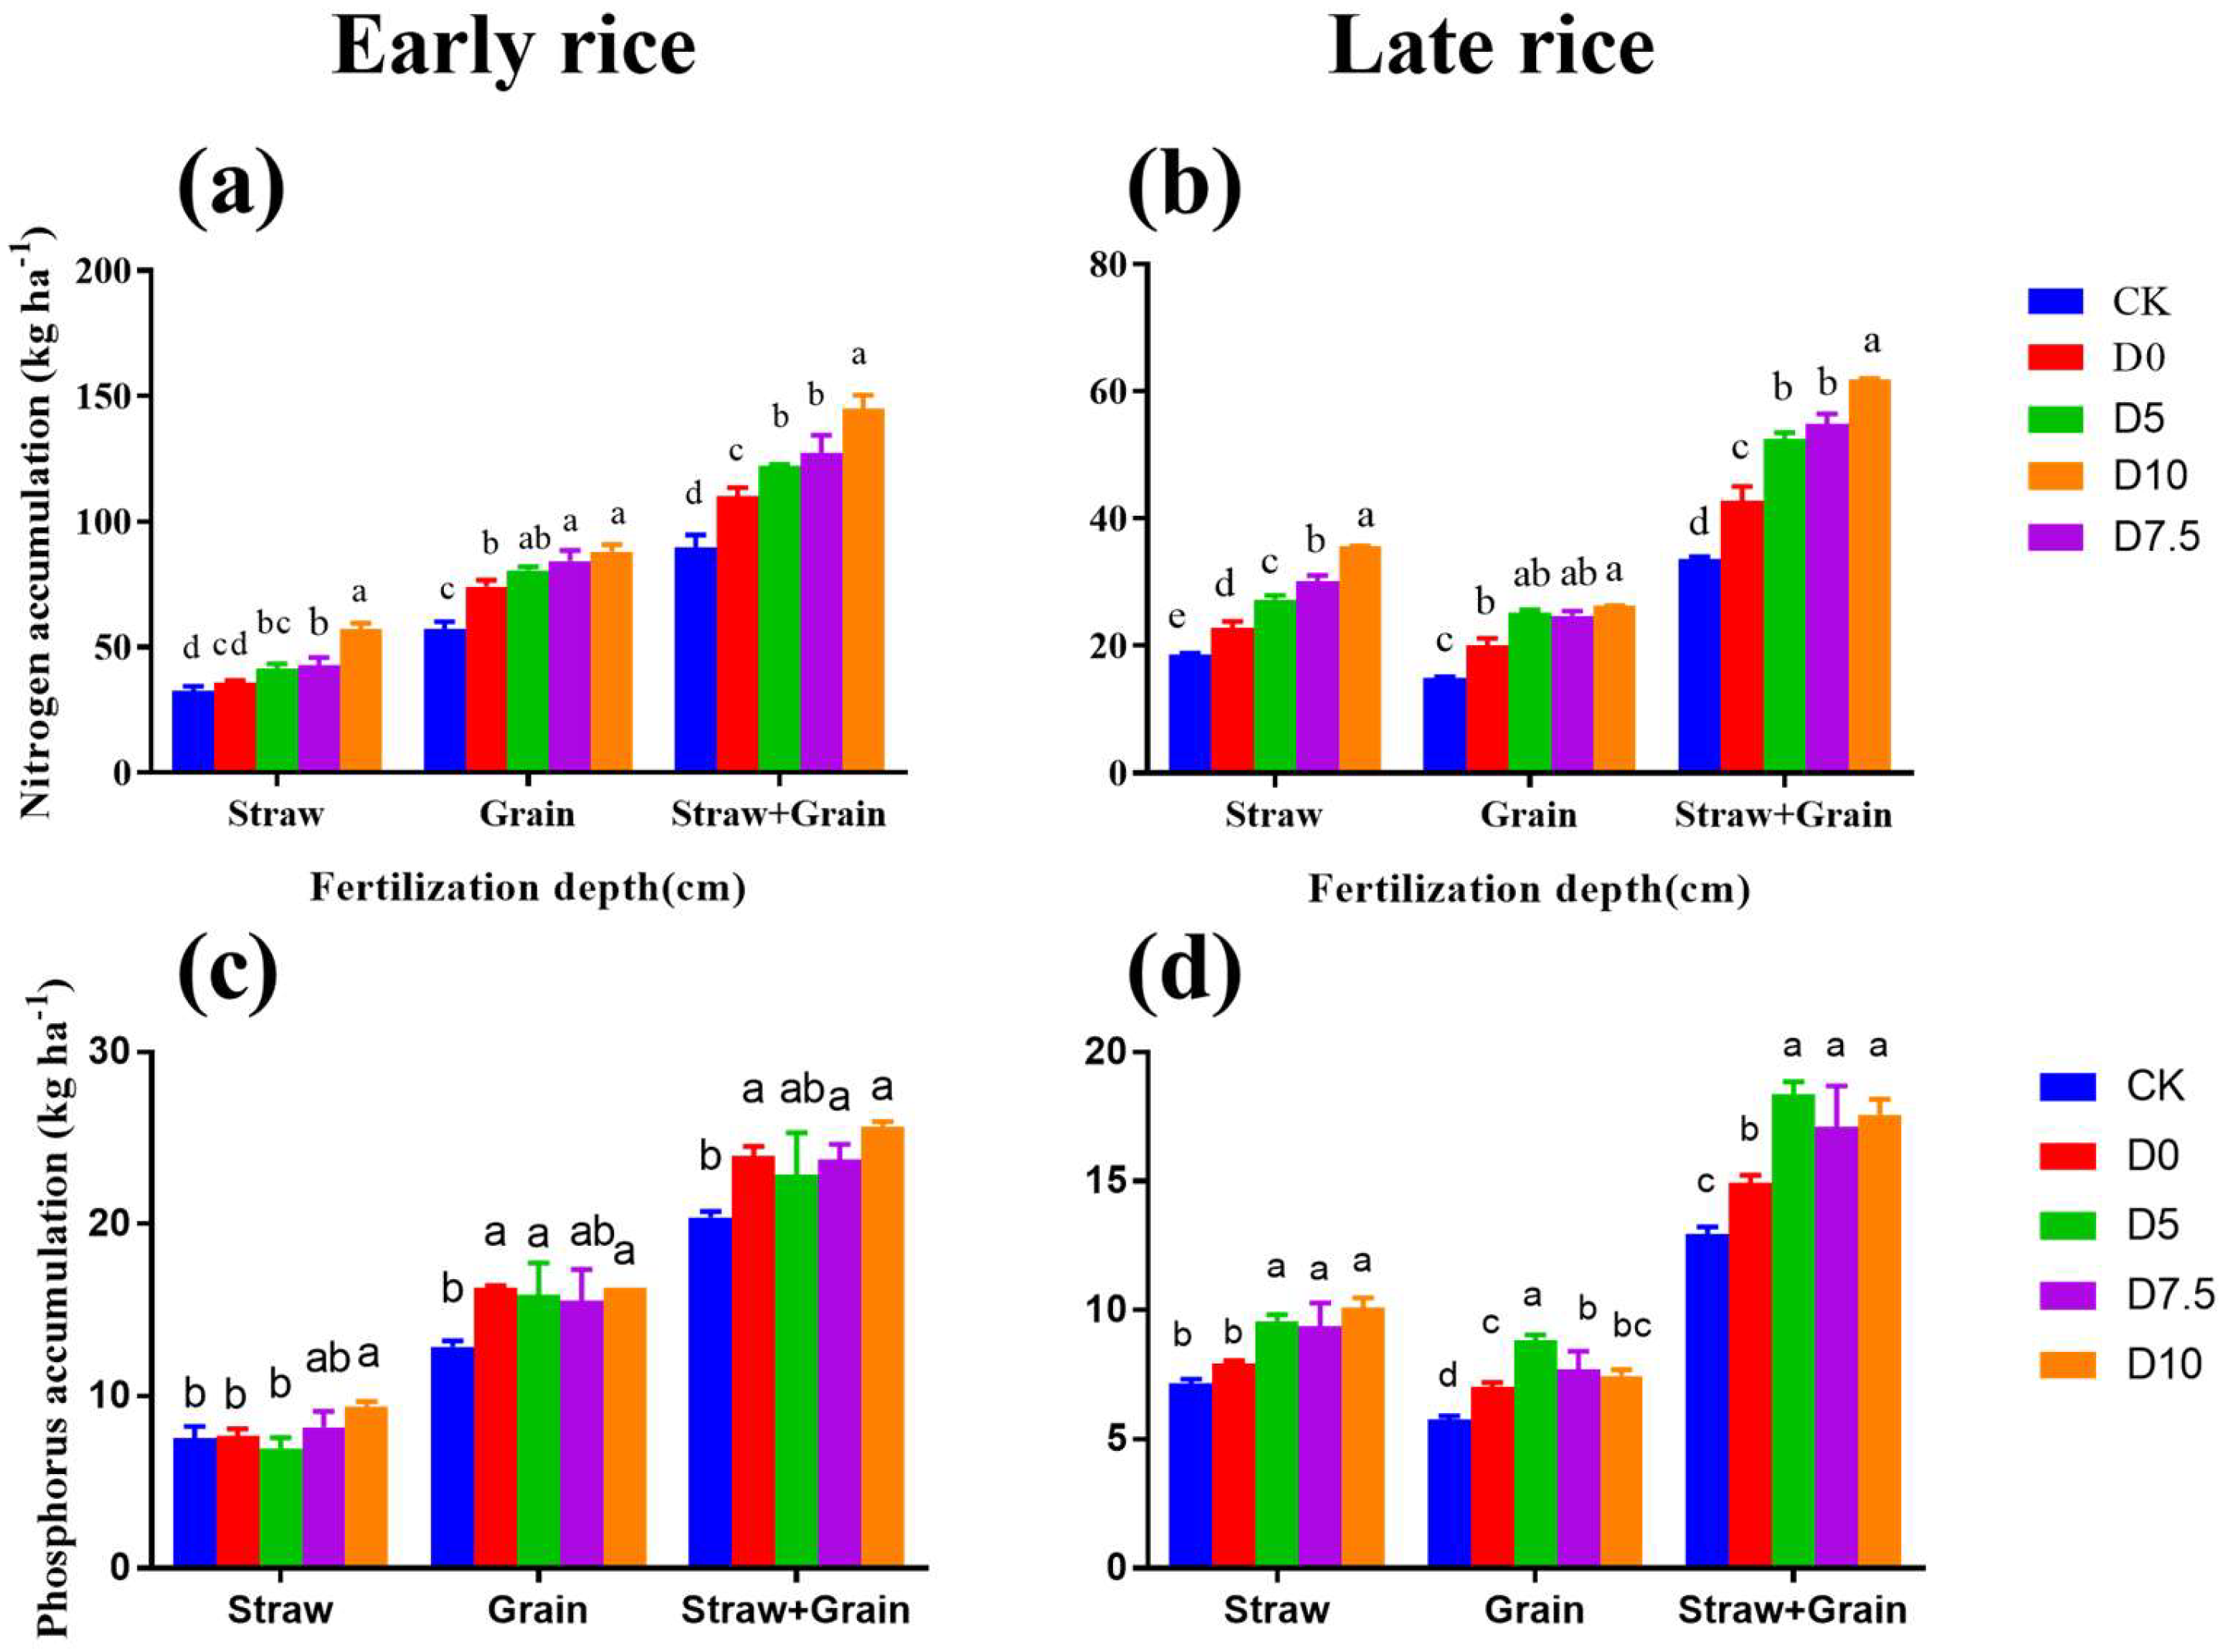
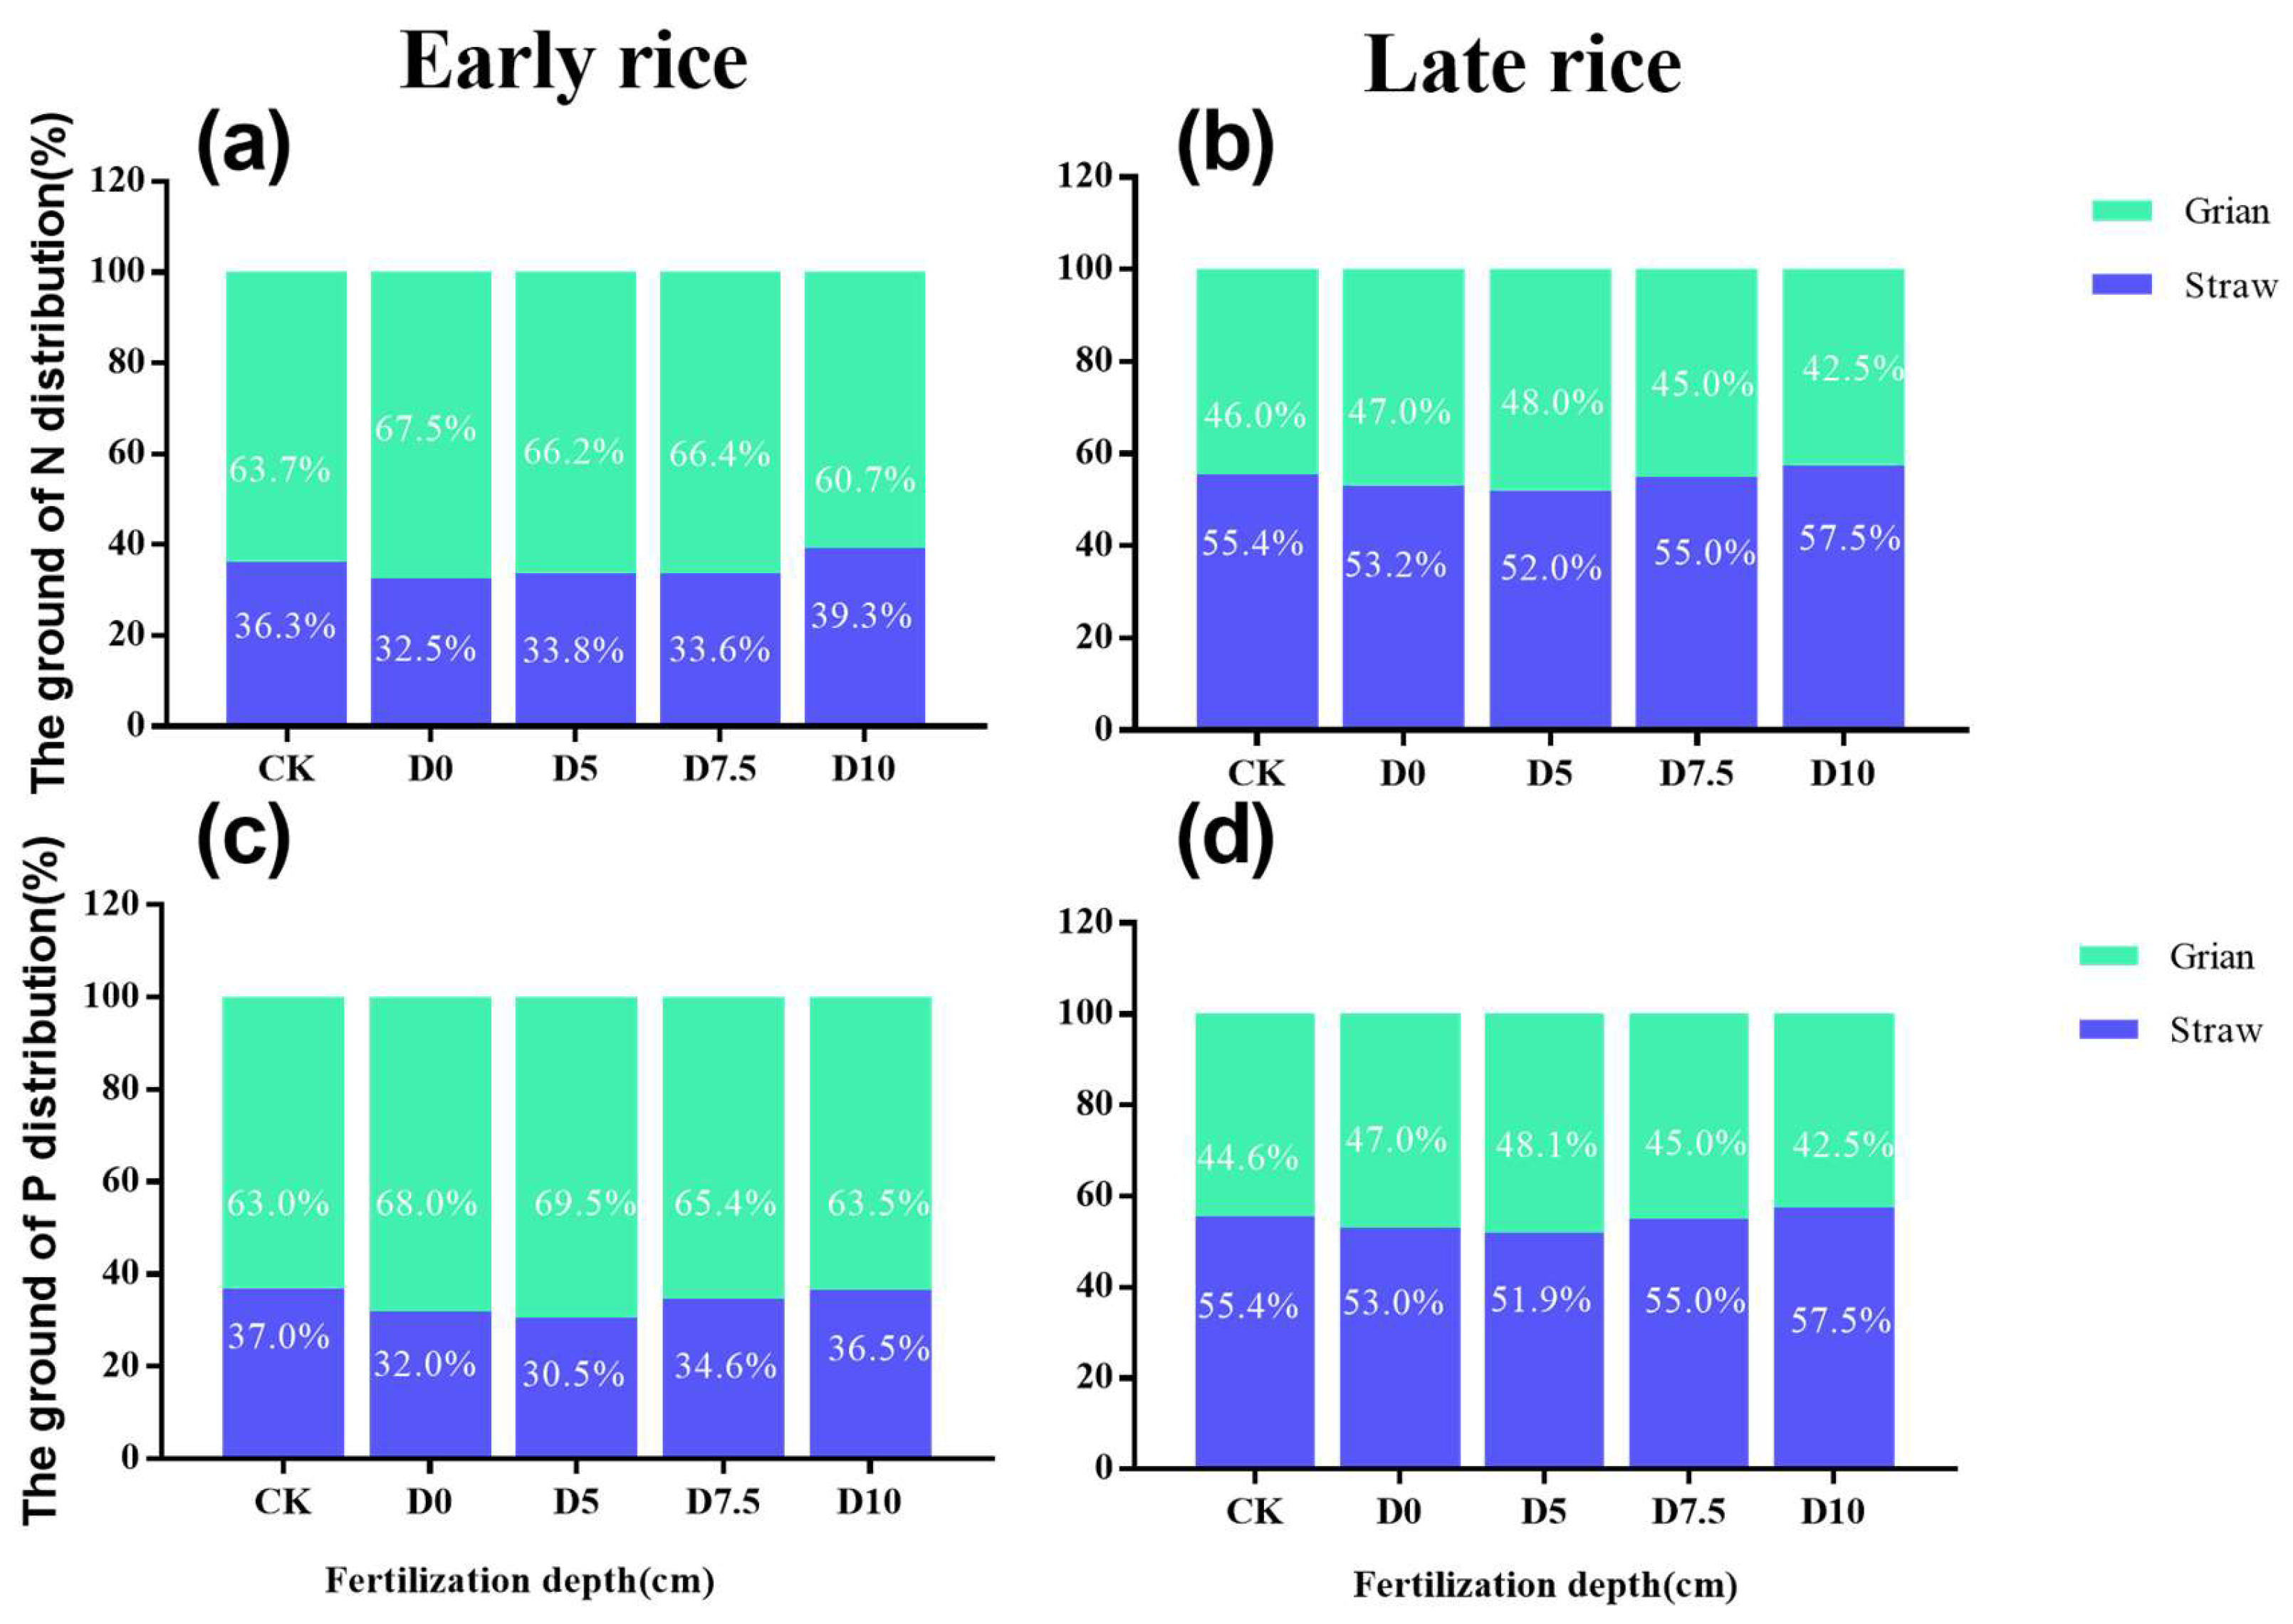
3.1. Effects of Different Fertilization Depths on the Double-Cropping Rice Yield and Dry-Matter Accumulation

In ESR, the fertilization treatments’ grain yields were significantly higher than those of the CK, the difference in grain yield among the fertilization treatments was not significant (Figure 2a). The dry-matter weight of straw under the D7.5 and D10 treatments was significantly higher than that of the D0 and D5 treatments, with a significant increase of 11.60% and 22.60% compared with the D0 treatment.
In the LSR, the grain yield of the D7.5 treatment was significantly higher than that of the D0 treatment, but there was no significant difference in the D5, D7.5, or D10 productions. In the dry-matter weight of the straw, the D7.5 and D10 treatments were significantly higher than those of D0 and D5 (Figure 2b).

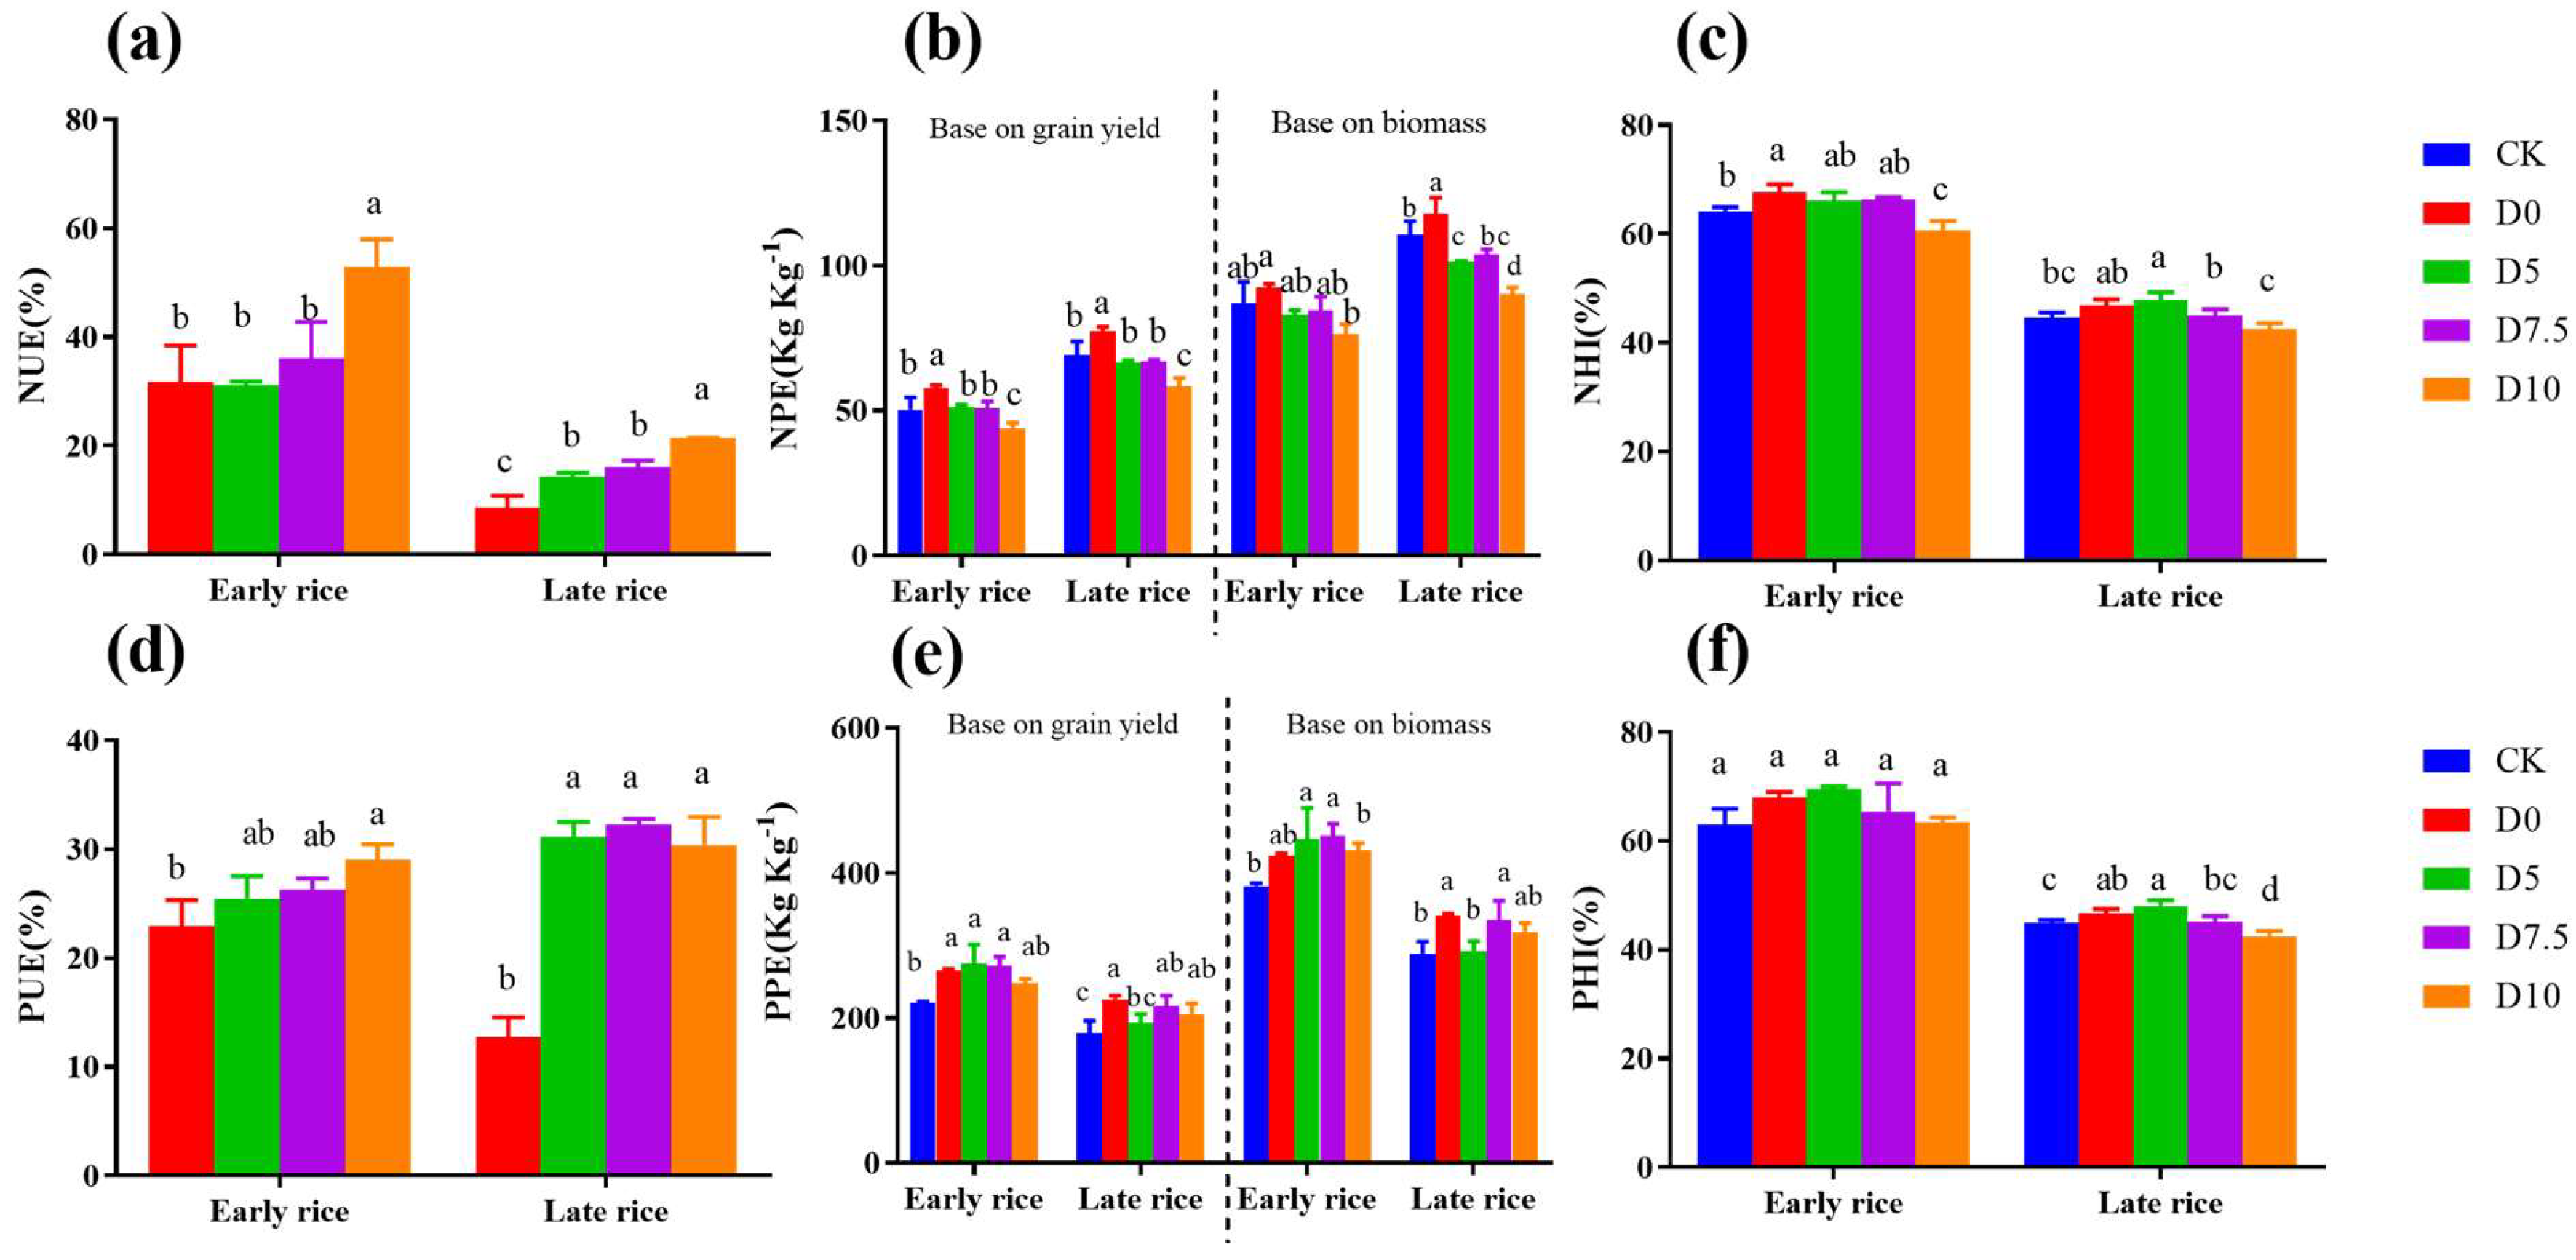
3.2. Effects of Different Fertilization Depths on the Double-Cropping Fertilizer-Use Efficiency

In this study, the MRSF mode could effectively improve the uptake of N by the plant. The above−ground N accumulation (TNr) of the D5-D10 treatments increased by 10.80–31.60% (ESR) and 22.60–44.58% (LSR) compared with the D0 treatment. The increase in above-ground N accumulation came from grain N (GN) and straw N (SN) accumulation. The GN accumulation increased by 8.00–18.50% (ESR) and 23.30–31.20% (LSR), and the SN accumulation increased by 15.10–58.90% (ESR) and 20.10–56.50% (LSR) compared with the D0 treatment. The GN, SN, and TNr in the D10 treatment were higher than in other deep-fertilization treatments (Figure 3a,b). From the proportion of the GN and SN in TNr, it can be seen that the GN was higher than the SN in the ESR, while the LSR was the opposite (Figure 4a,b). This may have been caused by inappropriate cooling during the late-rice season.
The nitrogen-use efficiency (NUE) increased as the depth of fertilization increased in ESR and LSR, and the D10 treatment had a significantly higher NUE than those of the other depth treatments (Figure 5a). An analysis of the distribution of N in rice plants indicated that both the nitrogen physiological efficiency (NPE) and nitrogen harvest index (NHI) decreased at fertilization depths, which were significantly lower in the D10 treatment compared with the D0 treatment. The trends of ESR and LSR were consistent (Figure 5c,d).
The uptake of P differed from that of N. There was no significant difference in the P accumulation of above-ground plants (TPr) and grain P (GP) among fertilizer treatments in ESR. Among the P accumulation in straw (SP), the D10 treatment was the highest and was significantly higher than the D0 and D5 treatments, but it did not differ significantly from the D7.5 treatment (Figure 3c,d). In LSR, the accumulation of TPr and SP treated by deep fertilization was markedly higher than that of the D0 treatment. However, the GP was the highest in the D5 treatment and decreased with increasing fertilization depth. In summary, the TPr at different application depths did not increase in parallel with the increase in fertilization depth.
In terms of the P utilization rate, the differences in the phosphorus-use efficiency (PUE), physiological phosphorus efficiency (PPE), and phosphorus harvest index (PHI) of the ESR treated by deep fertilization were not significant. The differences in the PRE of the LSR treated by deep fertilization were also insignificant. However, the PHI of LSR treated by deep fertilization tended to decrease, and the D7.5 and D10 treatments were significantly lower than the D5 treatment (Figure 5d,c,f).

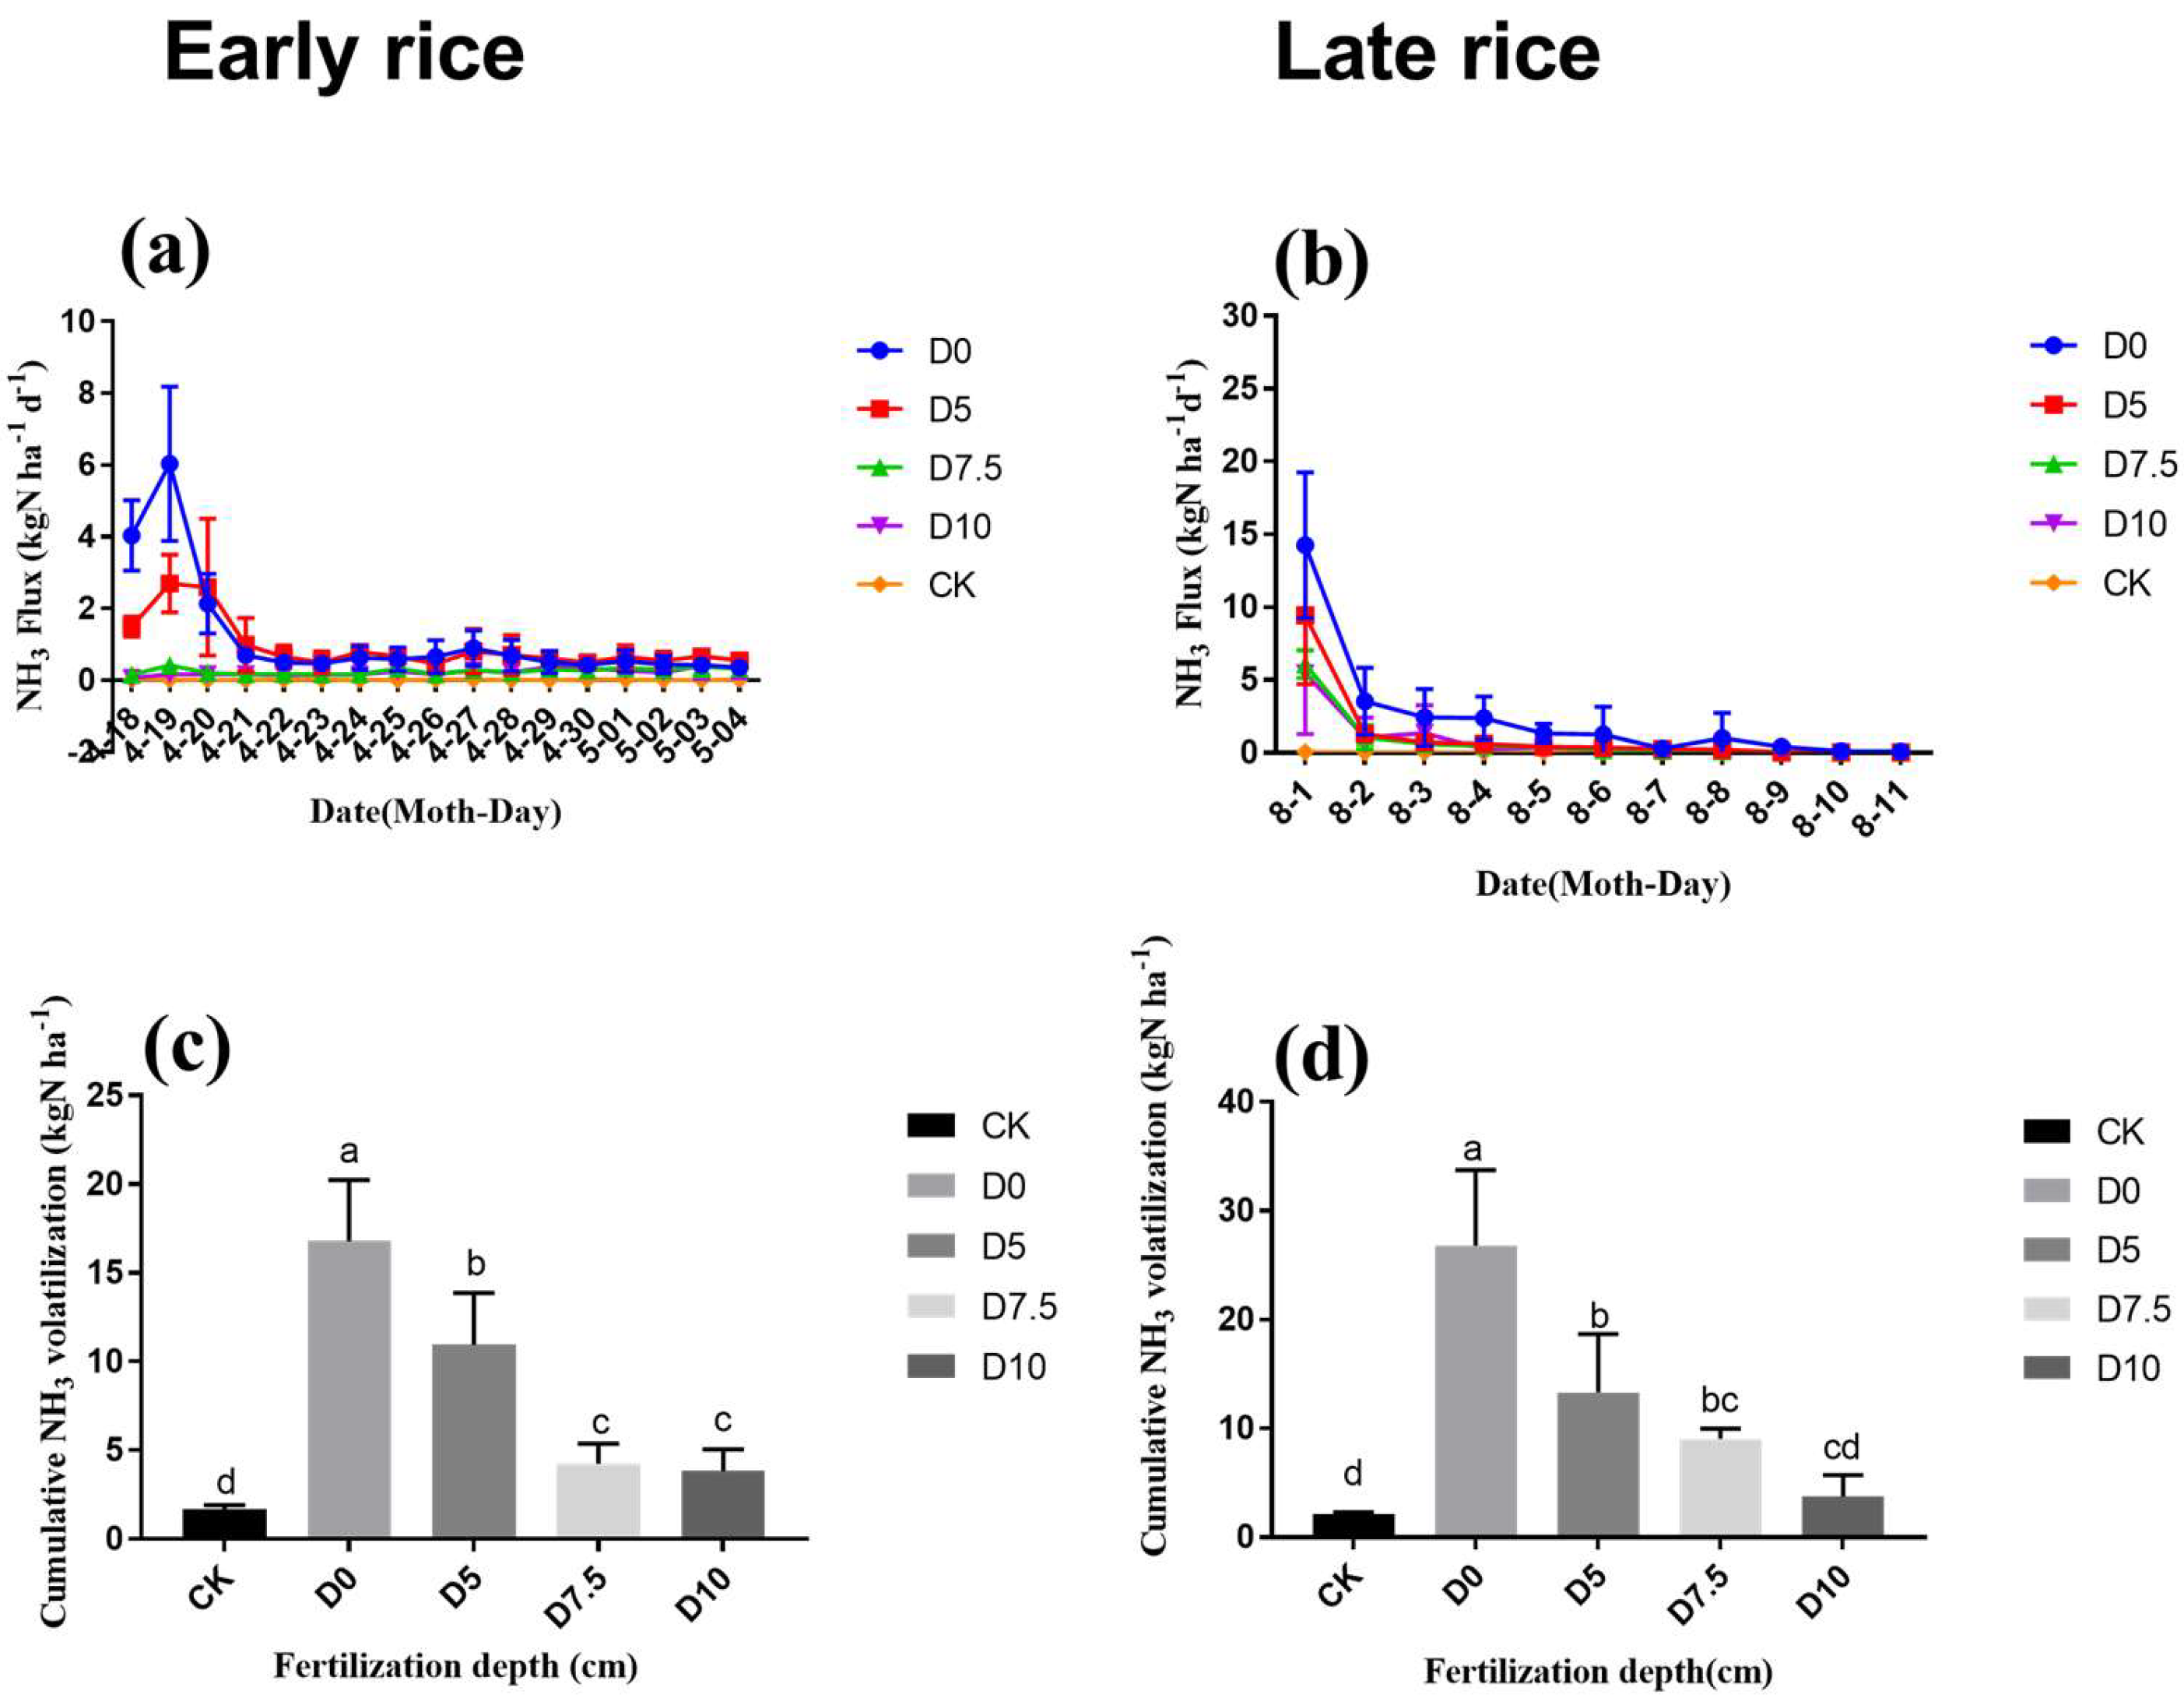
3.3. Effects of Fertilization Depth on NH3 Volatilization in Rice Fields

In ESR, as time passed, the NH3 volatilization fluxes of treatments D0 and D5 presented a trend of increasing first and then decreasing. Both reached their maximum values at 6.03 and 2.69 (kg N ha−1 d−1) on the second day after fertilization, then declined rapidly and remained constant after the fifth day. In contrast, the NH3 volatilization fluxes in treatments D7.5 and D10 remained similar to those of the CK and had no peak value. However, the trend in the LSR season was highest on the first day and then decreased rapidly. The accumulation of volatilized NH3 gradually reduced with the increase in fertilizer depth. The accumulation of NH3 volatilized in samples treated by deep fertilization decreased by 34.80–77.2% (ESR) and 50.40–86.10% (LSR) compared with the D0 treatment (Figure 6); D10 decreased the most, indicating that the depth of fertilization could effectively reduce the loss of N due to NH3 volatilization and that the NH3 volatilization would be further reduced with an increase in the depth of fertilization.

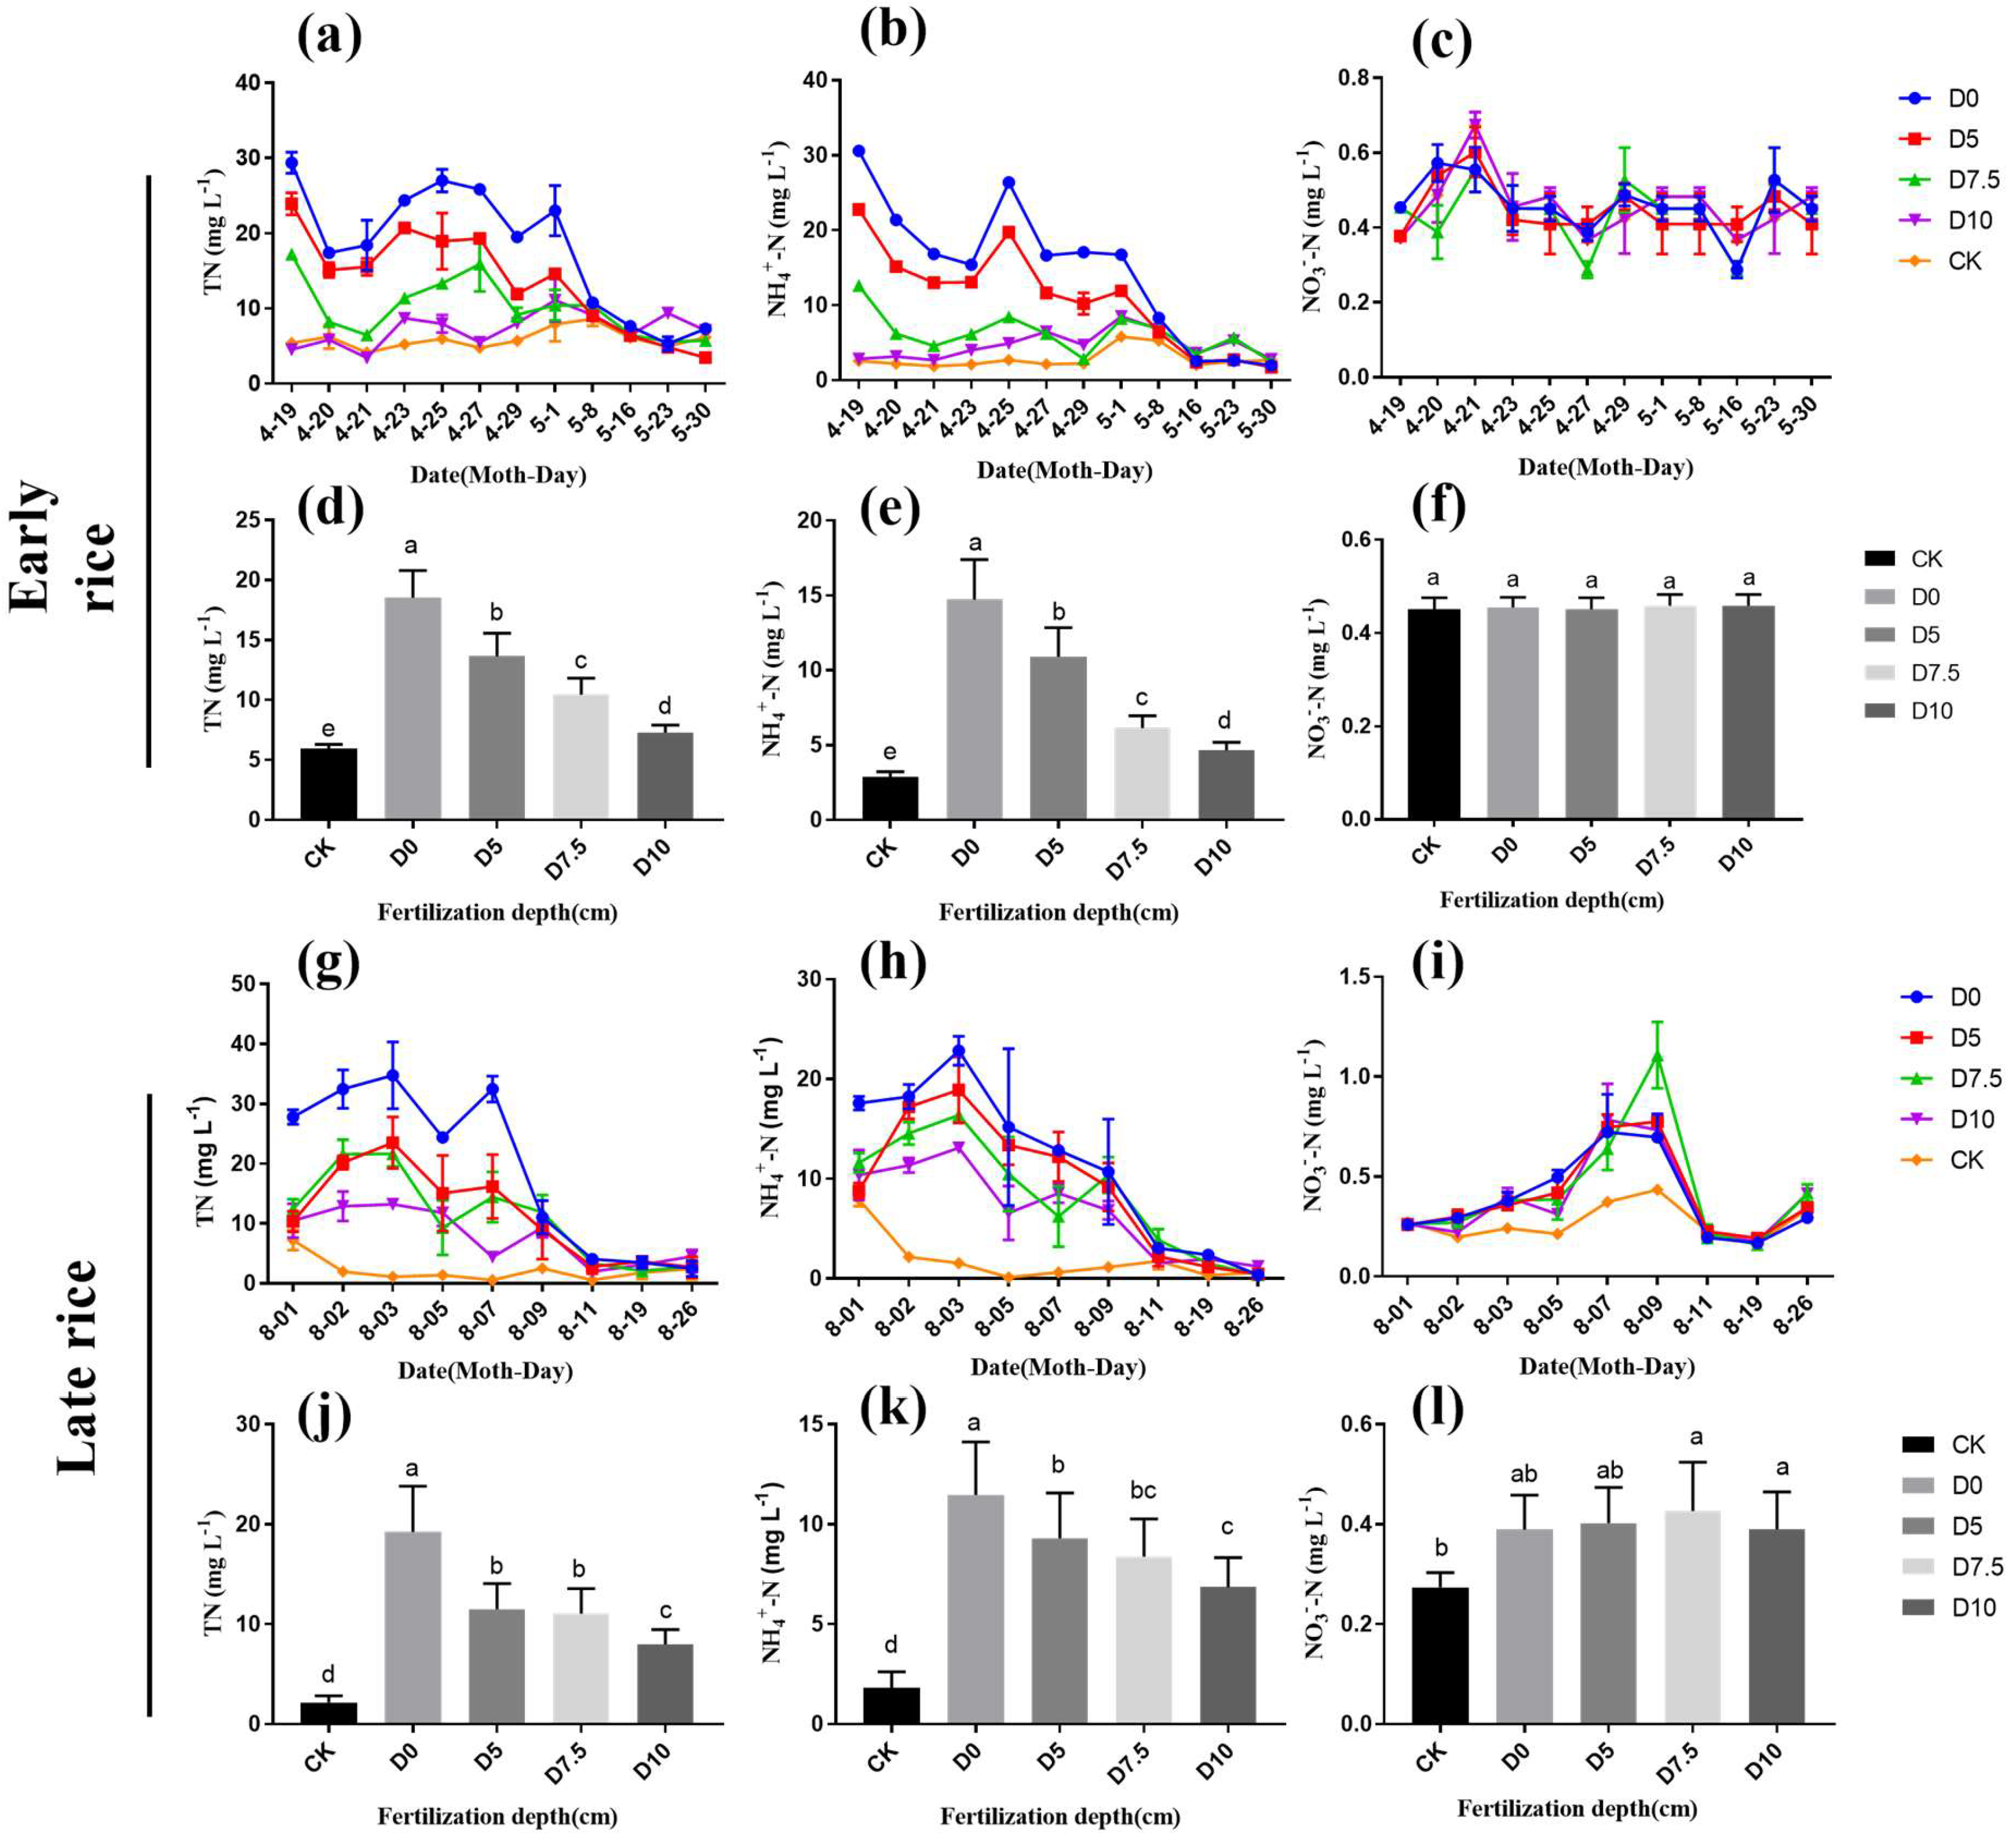
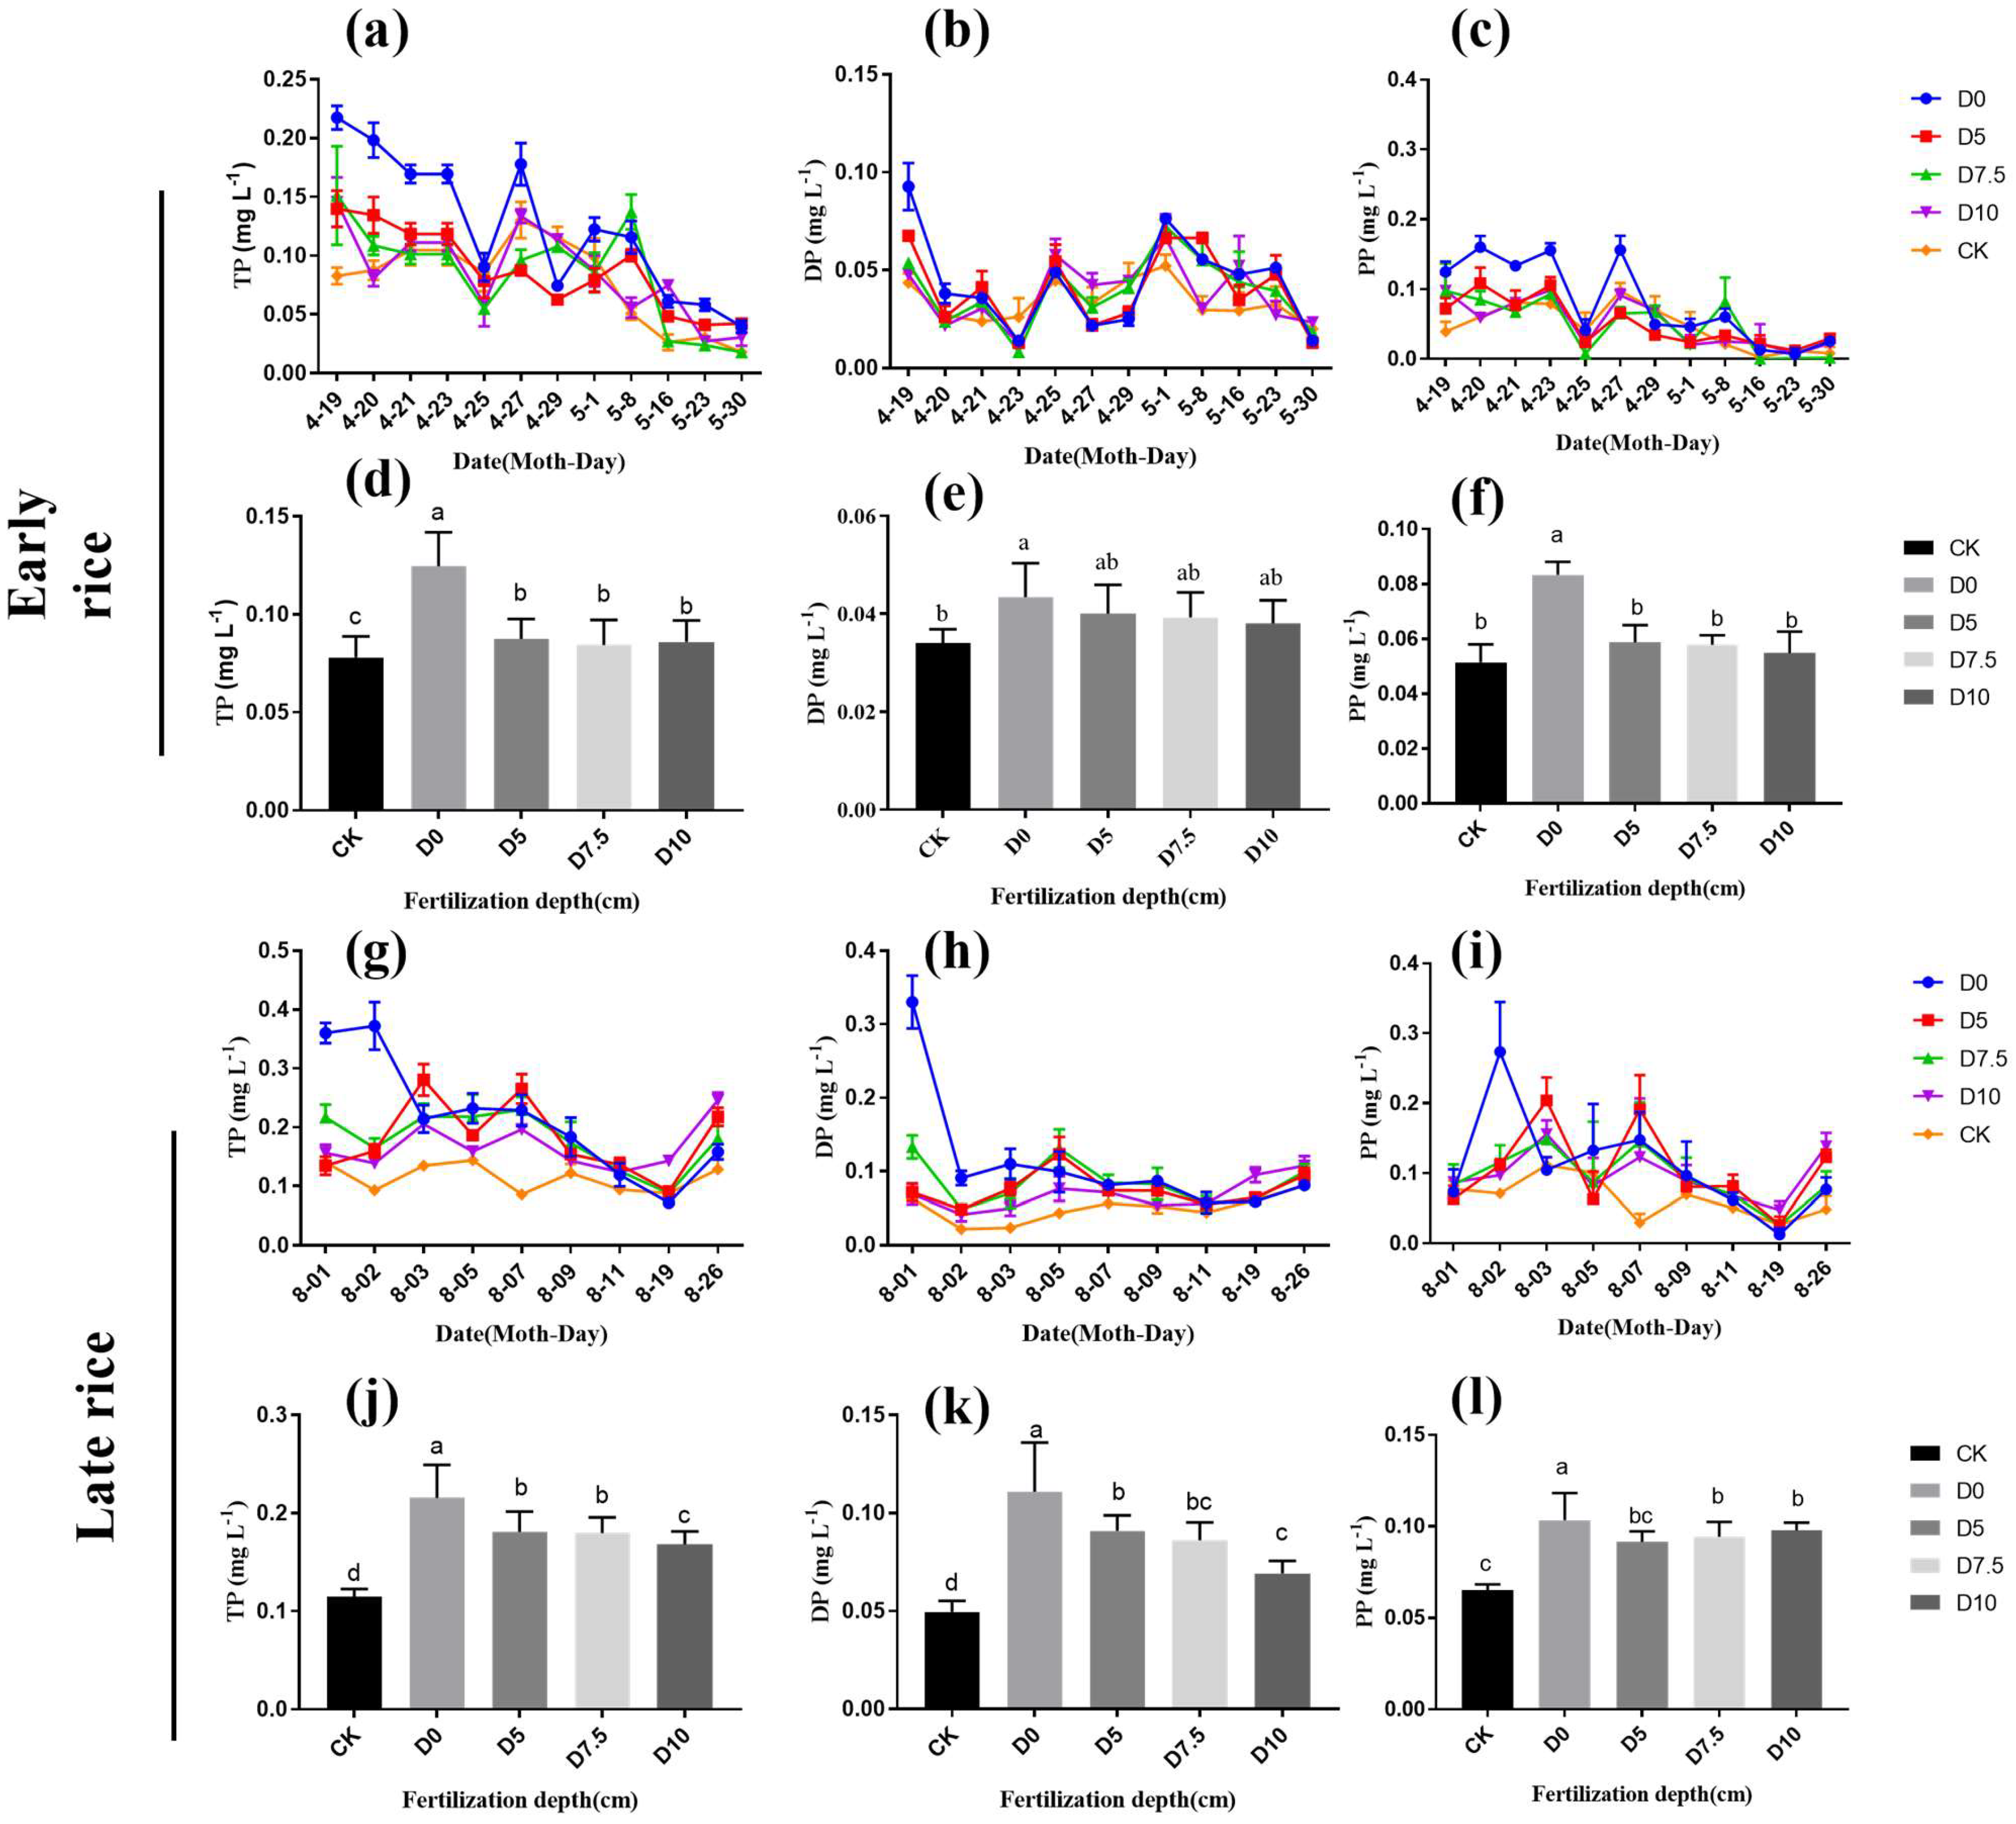
3.4. Effects of Fertilization Depth on the Concentrations of N and P in Surface Water

The dynamic trends of TN and NH4+-N at different fertilization depths were the same. For 10 to 18 days, the values of fertilization treatments reached the same level as the non-fertilization treatment. The deep-fertilization treatments of D5, D7.5, and D10 significantly reduced the average concentrations of TN and NH4+-N. Compared with the D0 treatment, the average concentrations of TN and NH4+-N in the D5-D10 treatment decreased by 26.35–60.76% and 6.34–25.88% (ESR), respectively, and 10.24–58.5% and 19.00–40.27% (LSR), respectively, and decreased with the increased fertilization depth (Figure 7). The effect of deep fertilization on the average concentration of NO3-N was not significant.
The content of TP was the highest on the first day of fertilization and then decreased rapidly. The concentration of P decreased more slowly in the deep-fertilization treatment than in treatment D0, in both ESR and LSR, and deep fertilization reduced the P content of surface water. The mean of TP, DP, and PP content decreased by 29.8–32.2%, 6.9–11.6%, and 41.3–44.3%, respectively, for ESR and by 16.3–21.8%, 17.2–37.2%, and 1.0–9.1%, respectively, for LSR (Figure 8), compared with the D0 treatment. There was no significant correlation between fertilization depth and P concentration at different depths of fertilization. The reason could be that P was easily fixed by soil and had poor mobility.
The PCA analysis shows that the fertilization depth significantly affected the N and P concentration and NH3 volatilization in the surface water (Figure 9), thus, reducing the risk of nitrogen and phosphorus loss in agriculture.

3.5. Changes in Soil Nutrients during the Harvest Period for Different Depth Treatments

There were differences in the N and P content of the soil at different treatment depths during the harvest period after one season of rice growth. Compared with the D0 treatment, the content of the total N (TNs) and alkali hydrolyzed N (AN) in the soil during the harvest period increased by 0.61–7.30% and −0.96–11.6% for ESR, respectively, and by −1.50–5.81% and 2.31–8.30% for LSR, respectively, while the contents of the total P (TPs) and available P (AP) did not differ significantly from the D0 treatment. However, the N and P contents of the D10 treatment did not differ significantly from those of the D0 treatment. As fertilization deepened, the N content in the soil first increased and then decreased. In the LSR season, the differences between treatments were not significant for TPs, AP, and AN during the harvest period, but the TNs content was the highest in the D10 treatment, significantly higher than in the other fertilization treatments, while the differences between treatments D0, D5, and D7.5 were not significant (Table 2).

4. Discussion

4.1. Yield and Fertilizer-Use Efficiency

Research has shown that deep fertilization could increase the yield of crops and improve fertilizer efficiency [29,30]. In this study, there was no significant difference in outcome between fertilization treatments in ESR. Interestingly, with the increase in fertilization depth, above-ground dry−matter weight increased significantly (Figure 2b). Furthermore, the NPE and NHI of early and late rice deep-fertilization treatments showed a decreasing trend with increasing depth (Figure 5b,c). This change indicates that in the deep-fertilization treatment, the presence of nutrients in large amounts with the straw did not create a rice yield. Therefore, this may be why the straw dry-matter weight was higher, but the grain yield was not significantly different. However, the yield of late rice under deep fertilization was higher than that under the D0 treatment. This is consistent with previous studies [31]. In addition, the yield of ESR was significantly higher than that of LSR, which may be due to the temperature suddenly dropping during the booting and filling stages (Figure 1), which affected the yield of LSR [32,33]. The yield of LSR decrease was evident by the low yield and an increase in the proportion of SN to the plants’ N accumulation (Figure 3a,b). Some studies suggest that proper fertilizer management can improve rice stress resistance and reduce the effects of extreme weather on rice growth and yield [34,35,36]. Therefore, the increased yield of late rice in this study may also be related to the fact that deep fertilization is a suitable nitrogen management mode, which can be paid attention to in future research.
Compared to the D0 treatment, the NUEs of the D7.5 and D10 treatments were improved (Figure 5a), which is consistent with the results of previous studies [37,38]. This is because the deep-fertilization treatment increases the accumulation of above-ground dry matter. The PUE, PPE, and PHI trends of the deep fertilization of P were generally consistent with those of N in the ESR (Figure 5), which could be related to the enhanced biomass of deep fertilization. Low temperatures could also explain the difference in P uptake and utilization in LSR.

4.2. NH3 Volatilization and Risk of N and P Losses

The rise in fertilizer-use rates is due to increased plant absorption on the one hand and fertilizer nutrient loss on the other.
NH3 volatilization leads to the quantity of nitrogen lost in China’s major rice production zones [39,40,41]. In this study, as the depth of fertilization increases, cumulative NH3 losses will be significantly lower (Figure 6c,d). These losses accounted for 2.82–20.30% of seasonally applied fertilizer N, which is lower than the results in Liu et al. (22–36%) [24] but is confirmed by Min et al. (6.3–17.6%) [42] and other workers who measured NH3 volatilization in typical Chinese rice paddy fields [43,44].
The NH3 volatilization was significantly correlated with the pH and concentrations of NH4+-N in surface water [45,46]. In this study, compared with D0, the NH4+-N in surface water decreased by 6.34–40.27%, and there was a significant negative correlation between the depths of side-deep fertilization. This may be because, in deep-fertilization treatment, the soil particles absorb the NH4+-N produced during the urea hydrolysis process. Thus, the NH4+-N flow from the urea placement site was slow and restricted by a limited soil volume [47]. With the deepening of fertilization depth, this effect was strengthened. This may be the main reason that the cumulative loss of ammonia volatilization decreases with the increase of fertilization depth. Moreover, side-deep fertilization also positively affected the reduction of greenhouse gases, such as CH4 and N2O [48,49].
The concentration of TN and TP in surface water directly affects the N and P runoff losses. In this study, compared with the D0 treatment, the average concentration of TN and TP in the surface water under deep fertilization decreased by 10.24–60.76% and 16.3–32.2%, respectively. This indicated that deep fertilization could effectively reduce surface water’s TN and TP content, as consistent with the study [43,50]. Many studies have shown that frequent rainfall events after fertilization lead to N and P losses in paddy fields [51,52]. In contrast, deep-fertilization treatment reduces the direct erosion of fertilizer due to frequent draining and heavy rainfall and thus reduces the risk of nitrogen and phosphorus runoff and loss. In addition, we observed that the trend of N and P concentrations was inconsistent with the increase in fertilization depth. This may be related to the chemical properties of N and P. Unlike N, P is easily fixed by soil and has poor mobility [17]. In this study, the average P content of surface water did not decrease significantly with an increase in depth (Figure 8), which indicated that as long as the deep application is possible, it can substantially reduce the TP content of surface water. Finally, N and P should monitor the runoff better to explain the nitrogen and phosphorus loss [53,54]. They are using actual data to calculate the environmental benefits of deep fertilization.
Different experiments showed that the appropriate depth of fertilization varied in other regions. In the Taihu Lake region, fertilization depths of 7.5 and 10 cm were found to be more effective than 5 cm in reducing the concentrations of N in surface water [16]. Although side-deep fertilization could reduce the runoff of N and P losses, with the deepening of fertilization depth, the risk of N and P leakage losses has increased [22,55]. But the appropriate depth of fertilization varies depending on the soil type. The adsorption capacity of nitrogen and phosphorus in different soils and the migration mechanism of water in soil are other factors, and the amount of nitrogen and phosphorus loss through seepage is different [56]. In rice, it was concluded that a depth of 6–10 cm was more effective [57,58,59]. This is consistent with the results of this study. At the same time, different crops should be considered. The same pattern exists in corn; the reasonable depth to fertilize corn is currently approximately 15 cm [60,61]. In this study, 10 cm of fertilization was better than the depths of 5 and 7.5 cm in reducing N and P losses in a Dongting double-cropping rice area. However, further research is needed to determine whether fertilization depths greater than 10 cm in this area will increase the risk of nutrient leakage.

4.3. Soil Nutrients

The impact of fertilizer application on the soil is two-sided. Proper application can ensure soil fertility and improve crop yields. However, excessive application can lead to soil-quality degradation, such as soil acidification and compaction, among other issues, which could be more conducive to sustainable agricultural development [62,63].
Deep fertilization can increase nutrient uptake and fixation in the soil while reducing nutrient loss, which can lay the foundation for high crop yields. Herein, the TNs and AN in the ESR harvest period varied significantly with the depth of fertilization, and deep fertilization increased the soil’s nitrogen content. Simultaneously, in LSR, the TNs under the D10 treatment tended to decrease compared with D5 and D7.5, which could be attributed to (1) nitrogen in the soil being absorbed for N uptake in the D10 treatment (Figure 2); or (2) the downward migration of N nutrients with the water flow [22].
However, the effects on the P content were not significant (Table 2). Side-deep fertilization also changes the distribution of fertilizer nutrients in the soil. As the roots of the plant grow toward a place where there is fertilizer, deep fertilization promotes the growth of rice roots into deeper soil layers to obtain more nutrients [64]. Additionally, deep fertilization can reduce weed species and numbers. Studies showed that the precise deep fertilization of P fertilizer at 15–20 cm in low P soils improved the competitiveness of crops against the widely distributed barnyard grass (Echinochloa crus-galli), whose growth was severely hindered because its roots did not reach the depth required for easy access to P fertilizer [65,66]. This suggests that deep fertilization could further reduce the cost of weed control and increase the economic benefits.
In addition, the trend of soil nitrogen and phosphorus content under different treatments in the early rice and late rice harvesting periods could have been more consistent, which may be due to the short experiment time. Hence, the effects on the soil need to be monitored over time.

5. Conclusions

The proper fertilization depth for side-deep fertilization in the Dongting Lake double-cropping rice area was 10 cm. A fertilization depth of 10 cm can effectively reduce the risk of nitrogen and phosphorus loss and improve the utilization rate of fertilizer, which will provide a scientific theoretical basis for further reducing nitrogen and phosphorus fertilizer and promoting agricultural mechanized fertilization.

Author Contributions

K.H., Y.H. and L.Z. conceptualized the project and investigated, collected, and analyzed the original draft of data; Y.H., C.T., J.P., Y.Z. and X.R. administrated and supervised; K.H. edited the graphs; K.H., Y.H. and L.Z., reviewed and edited; P.L. and S.H. assisted with field and lab work. All authors have read and agreed to the published version of the manuscript.

Funding

The present study was financially supported by the National Natural Science Foundation of China: U19A2050. Natural Science Foundation of Hunan Province: 2019JJ50233. Scientific Research Foundation of Hunan Provincial Education Department: 19K046.

Informed Consent Statement

Informed consent was obtained from all subjects involved in the study.

Data Availability Statement

All data generated or analyzed during this study are included in this published article.

Acknowledgments

Special thanks to the Hunan Provincial Key Laboratory of Farmland Pollution Control and Agricultural Resources Use, Hunan Provincial Key Laboratory of Nutrition in Common University, and National Engineering Laboratory on Soil and Fertilizer Resources Efficient Utilization for providing experimental platform. We thank all participants in sample collection and analysis.

Conflicts of Interest

The authors declare no conflict of interest.

References

  1. Zhu, C.; Kobayashi, K.; Loladze, I.; Zhu, J.; Jiang, Q.; Xu, X.; Liu, G.; Seneweera, S.; Ebi, K.L.; Drewnowski, A.; et al. Carbon dioxide (CO2) levels this century will alter the protein, micronutrients, and vitamin content of rice grains with potential health consequences for the poorest rice-dependent countries. Sci. Adv. 2018, 4, eaaq1012. [Google Scholar] [CrossRef] [PubMed] [Green Version]
  2. Nkebiwe, P.M.; Weinmann, M.; Bar-Tal, A.; Müller, T. Fertilizer placement to improve crop nutrient acquisition and yield: A review and meta-analysis. Field Crop. Res. 2016, 196, 389–401. [Google Scholar] [CrossRef]
  3. Peng, S.; Buresh, R.J.; Huang, J.; Zhong, X.; Zou, Y.; Yang, J.; Wang, G.; Liu, Y.; Hu, R.; Tang, Q.; et al. Improving nitrogen fertilization in rice by sitespecific N management. A review. Agron. Sustain. Dev. 2010, 30, 649–656. [Google Scholar] [CrossRef]
  4. Kumar, D.; Devakumar, C.; Kumar, R.; Das, A.; Panneerselvam, P.; Shivay, Y.S. Effect of neem-oil coated prilled urea with varying thickness of neem-oil coating and nitrogen rates on productivity and nitrogen-use efficiency of lowland irrigated rice under indo-gangetic plains. J. Plant Nutr. 2010, 33, 1939–1959. [Google Scholar] [CrossRef]
  5. Aleminew, A.; Alemayehu, G.; Adgo, E.; Tadesse, T. Influence of nitrogen on the growth and use efficiency of rainfed lowland rice in northwest Ethiopia. J. Plant Nutr. 2020, 43, 2243–2258. [Google Scholar] [CrossRef]
  6. Behera, S.N.; Sharma, M.; Aneja, V.P.; Balasubramanian, R. Ammonia in the atmosphere: A review on emission sources, atmospheric chemistry and deposition on terrestrial bodies. Environ. Sci. Pollut. Res. 2013, 20, 8092–8131. [Google Scholar] [CrossRef]
  7. Gu, B.; Sutton, M.A.; Chang, S.X.; Ge, Y.; Chang, J. Agricultural ammonia emissions contribute to China’s urban air pollution. Front. Ecol. Environ. 2014, 12, 265–266. [Google Scholar] [CrossRef]
  8. Wang, J.; Zhao, Q.; Pang, Y.; Hu, K. Research on nutrient pollution load in Lake Taihu, China. Environ. Sci. Pollut. Res. 2017, 24, 17829–17838. [Google Scholar] [CrossRef]
  9. Liu, Z.; Liu, S.; Jin, H.; Qi, W. Rural population change in China: Spatial differences, driving forces and policy implications. J. Rural. Stud. 2017, 51, 189–197. [Google Scholar] [CrossRef]
  10. Li, L.; Tian, H.; Zhang, M.; Fan, P.; Ashraf, U.; Liu, H.; Chen, X.; Duan, M.; Tang, X.; Wang, Z.; et al. Deep placement of nitrogen fertilizer increases rice yield and nitrogen use efficiency with fewer greenhouse gas emissions in a mechanical direct-seeded cropping system. Crop. J. 2021, 9, 1386–1396. [Google Scholar] [CrossRef]
  11. Huda, A.; Gaihre, Y.K.; Islam, M.R.; Singh, U.; Islam, R.; Sanabria, J.; Satter, M.A.; Afroz, H.; Halder, A.; Jahiruddin, M. Floodwater ammonium, nitrogen use efficiency and rice yields with fertilizer deep placement and alternate wetting and drying under triple rice cropping systems. Nutr. Cycl. Agroecosyst. 2016, 104, 53–66. [Google Scholar] [CrossRef]
  12. Huijsmans, J.; Hol, J.; Vermeulen, G. Effect of application method, manure characteristics, weather and field conditions on ammonia volatilization from manure applied to arable land. Atmos. Environ. 2003, 37, 3669–3680. [Google Scholar] [CrossRef]
  13. Cheng, Y.; Wang, H.-Q.; Liu, P.; Dong, S.-T.; Zhang, J.-W.; Zhao, B.; Ren, B.-Z. Nitrogen placement at sowing affects root growth, grain yield formation, N use efficiency in maize. Plant Soil 2020, 457, 355–373. [Google Scholar] [CrossRef]
  14. Zhong, X.M.; Huang, T.P.; Peng, J.W.; Lu, W.L.; Kang, X.R.; Sun, M.F.; Song, S.M.; Tang, Q.Y.; Chen, Y.X.; Zhan, D.Z.; et al. Effects of machine-transplanting synchronized with one-time precision fertilization on nutrient uptake and use efficiency of double cropping rice. Chin. J. Rice Sci. 2019, 33, 436–446, (In Chinese with English abstract). [Google Scholar]
  15. Yang, Z.P.; Turner, D.A.; Zhang, J.J.; Wang, Y.L.; Chen, M.C.; Zhang, Q.; Denmead, O.T.; Chen, D.; Freney, J.R. Loss of nitrogen by ammonia volatilisation and denitrification after application of urea to maize in Shanxi Province, China. Soil Res. 2011, 49, 462–469. [Google Scholar] [CrossRef]
  16. Yao, Y.; Zhang, M.; Tian, Y.; Zhao, M.; Zhang, B.; Zhao, M.; Zeng, K.; Yin, B. Urea deep placement for minimizing NH3 loss in an intensive rice cropping system. Field Crop. Res. 2018, 218, 254–266. [Google Scholar] [CrossRef]
  17. Maroušek, J.; Maroušková, A.; Zoubek, T.; Bartoš, P. Economic impacts of soil fertility degradation by traces of iron from drinking water treatment. Environ. Dev. Sustain. 2022, 24, 4835–4844. [Google Scholar] [CrossRef]
  18. Chen, X.; Liu, P.; Zhao, B.; Zhang, J.; Ren, B.; Li, Z.; Wang, Z. Root physiological adaptations that enhance the grain yield and nutrient use efficiency of maize (Zea mays L) and their dependency on phosphorus placement depth. Field Crop. Res. 2021, 276, 108378. [Google Scholar] [CrossRef]
  19. Vejchasarn, P.; Lynch, J.P.; Brown, K.M. Genetic Variability in Phosphorus Responses of Rice Root Phenotypes. Rice 2016, 9, 29. [Google Scholar] [CrossRef] [Green Version]
  20. Ma, N.; Dong, L.; Lü, W.; Lü, J.; Meng, Q.; Liu, P. Transcriptome analysis of maize seedling roots in response to nitrogen-, phosphorus-, and potassium deficiency. Plant Soil 2020, 447, 637–658. [Google Scholar] [CrossRef]
  21. Khalil, M.I.; Buegger, F.; Schraml, M.; Gutser, R.; Richards, K.; Schmidhalter, U. Gaseous Nitrogen Losses from a Cambisol Cropped to Spring Wheat with Urea Sizes and Placement Depths. Soil Sci. Soc. Am. J. 2009, 73, 1335–1344. [Google Scholar] [CrossRef]
  22. Hou, K.; Huang, Y.; Rong, X.; Peng, J.; Tian, C.; Han, Y. The effects of the depth of fertilization on losses of nitrogen and phosphorus and soil fertility in the red paddy soil of China. PeerJ 2021, 9, e11347. [Google Scholar] [CrossRef] [PubMed]
  23. Van der Stelt, B.; Temminghoff, E.J.M.; Van Vliet, P.C.J.; Van Riemsdijk, W.H. Volatilization of ammonia from manure as affected by manure additives, temperature and mixing. Bioresour. Technol. 2007, 98, 3449–3455. [Google Scholar] [CrossRef] [PubMed]
  24. Liu, T.; Fan, D.; Zhang, X.; Chen, J.; Li, C.; Cao, C. Deep placement of nitrogen fertilizers reduces ammonia volatilization and increases nitrogen utilization efficiency in no-tillage paddy fields in central China. Field Crop. Res. 2015, 184, 80–90. [Google Scholar] [CrossRef]
  25. He, S.; Li, Y.; Yang, W.; Huang, J.; Hou, K.; Zhang, L.; Song, H.; Yang, L.; Tian, C.; Rong, X.; et al. A comparison of the mechanisms and performances of Acorus calamus, Pontederia cordata and Alisma plantagoaquatica in removing nitrogen from farmland wastewater. Bioresour. Technol. 2021, 332, 125105. [Google Scholar] [CrossRef]
  26. Qi, D.; Yan, J.; Zhu, J. Effect of a reduced fertilizer rate on the water quality of paddy fields and rice yields under fishpond effluent irrigation. Agric. Water Manag. 2020, 231, 105999. [Google Scholar] [CrossRef]
  27. Bao, S.D. Soil and Agro-Chemistry Analysis, 3rd ed.; China Agricultural Press: Beijing, China, 2000. [Google Scholar]
  28. Marouek, J.; Kolá, L.; Struneck, O.; Kopeck, M.; Vrbka, J. Modified biochars present an economic challenge to phosphate management in wastewater treatment plants. J. Clean. Prod. 2020, 272, 123015. [Google Scholar] [CrossRef]
  29. Chen, Y.; Fan, P.; Mo, Z.; Kong, L.; Tian, H.; Duan, M.; Li, L.; Wu, L.; Wang, Z.; Tang, X.; et al. Deep Placement of Nitrogen Fertilizer Affects Grain Yield, Nitrogen Recovery Efficiency, and Root Characteristics in Direct-Seeded Rice in South China. J. Plant Growth Regul. 2020, 40, 379–387. [Google Scholar] [CrossRef]
  30. Khalofah, A.; Khan, M.I.; Arif, M.; Hussain, A.; Ullah, R.; Irfan, M.; Mahpara, S.; Shah, R.U.; Ansari, M.J.; Kintl, A.; et al. Deep placement of nitrogen fertilizer improves yield, nitrogen use efficiency and economic returns of transplanted fine rice. PLoS ONE 2021, 16, e0247529. [Google Scholar] [CrossRef]
  31. Wu, M.; Li, G.; Li, W.; Liu, J.; Liu, M.; Jiang, C.; Li, Z. Nitrogen Fertilizer Deep Placement for Increased Grain Yield and Nitrogen Recovery Efficiency in Rice Grown in Subtropical China. Front. Plant Sci. 2017, 8, 1227. [Google Scholar] [CrossRef]
  32. Weng, F.; Zhang, W.; Wu, X.; Xu, X.; Ding, Y.; Li, G.; Liu, Z.; Wang, S. Impact of low-temperature, overcast and rainy weather during the reproductive growth stage on lodging resistance of rice. Sci. Rep. 2017, 7, 46596. [Google Scholar] [CrossRef] [PubMed] [Green Version]
  33. Zeng, Y.; Zhang, Y.; Xiang, J.; Uphoff, N.T.; Pan, X.; Zhu, D. Effects of Low Temperature Stress on Spikelet-Related Parameters during Anthesis in Indica–Japonica Hybrid Rice. Front. Plant Sci. 2017, 8, 1350. [Google Scholar] [CrossRef] [PubMed] [Green Version]
  34. Liu, Z.; Tao, L.; Liu, T.; Zhang, X.; Wang, W.; Song, J.; Yu, C.; Peng, X. Nitrogen application after low-temperature exposure alleviates tiller decrease in rice. Environ. Exp. Bot. 2018, 158, 205–214. [Google Scholar] [CrossRef]
  35. Akinbile, C.O.; Ogunmola, O.O.; Abolude, A.T.; Akande, S.O. Trends and spatial analysis of temperature and rainfall patterns on rice yields in Nigeria. Atmos. Sci. Lett. 2020, 21, e944. [Google Scholar] [CrossRef]
  36. Siddik, M.A.; Zhang, J.; Chen, J.; Qian, H.; Jiang, Y.; Kareem Raheem, A.; Deng, A.; Song, Z.; Zheng, C.; Zhang, W. Responses of indica rice yield and quality to extreme high and low temperatures during the reproductive period. Eur. J. Agron. 2019, 106, 30–38. [Google Scholar] [CrossRef]
  37. De Datta, S.K. Improving nitrogen fertilizer efficiency in lowland rice in tropical Asia. In Nitrogen Economy of Flooded Rice Soils; Nijhoff: Dordrecht, The Netherlands, 1986; Volume 9, pp. 171–186. [Google Scholar] [CrossRef]
  38. Qiao, J.; Yang, L.; Yan, T.; Xue, F.; Zhao, D. Nitrogen fertilizer reduction in rice production for two consecutive years in the Taihu Lake area. Agric. Ecosyst. Environ. 2012, 146, 103–112. [Google Scholar] [CrossRef]
  39. Li, J.; Sang, C.; Yang, J.; Qu, L.; Xia, Z.; Sun, H.; Jiang, P.; Wang, X.; He, H.; Wang, C. Stoichiometric imbalance and microbial community regulate microbial elements use efficiencies under nitrogen addition. Soil Biol. Biochem. 2021, 156, 108207. [Google Scholar] [CrossRef]
  40. Soares, J.R.; Cantarella, H.; Menegale, M.L.D.C. Ammonia volatilization losses from surface-applied urea with urease and nitrification inhibitors. Soil Biol. Biochem. 2012, 52, 82–89. [Google Scholar] [CrossRef]
  41. Liang, X.-Q.; Chen, Y.-X.; Li, H.; Tian, G.-M.; Zhang, Z.-J.; NI, W.-Z.; He, M.-M. Nitrogen interception in floodwater of rice field in Taihu region of China. J. Environ. Sci. 2007, 19, 1474–1481. [Google Scholar] [CrossRef]
  42. Min, J.; Sun, H.; Wang, Y.; Pan, Y.; Kronzucker, H.J.; Zhao, D.; Shi, W. Mechanical side-deep fertilization mitigates ammonia volatilization and nitrogen runoff and increases profitability in rice production independent of fertilizer type and split ratio. J. Clean. Prod. 2021, 316, 128370. [Google Scholar] [CrossRef]
  43. Zhang, J.S.; Zhang, F.P.; Yang, J.H.; Wang, J.P.; Cai, M.L.; Li, C.F.; Cao, C.G. Emissions of N2O and NH3, and nitrogen leaching from direct seeded rice under different tillage practices in central China. Agric. Ecosyst. Environ. 2011, 140, 164–173. [Google Scholar]
  44. Xu, J.Z.; Peng, S.Z.; Yang, S.H.; Wang, W.G. Ammonia volatilization losses from a rice paddy with different irrigation and nitrogen man-agements. Agric. Water Manag. 2012, 104, 184–192. [Google Scholar] [CrossRef]
  45. Zhong, X.; Zhou, X.; Fei, J.; Huang, Y.; Wang, G.; Kang, X.; Hu, W.; Zhang, H.; Rong, X.; Peng, J. Reducing ammonia volatilization and increasing nitrogen use efficiency in machine-transplanted rice with side-deep fertilization in a double-cropping rice system in Southern China. Agric. Ecosyst. Environ. 2020, 306, 107183. [Google Scholar] [CrossRef]
  46. Cao, Y.; Tian, Y.; Yin, B.; Zhu, Z. Assessment of ammonia volatilization from paddy fields under crop management practices aimed to increase grain yield and N efficiency. Field Crop. Res. 2013, 147, 23–31. [Google Scholar] [CrossRef]
  47. Yao, Y.; Zhang, M.; Tian, Y.; Zhao, M.; Zhang, B.; Zeng, K.; Zhao, M.; Yin, B. Urea deep placement in combination with Azolla for reducing nitrogen loss and improving fertilizer nitrogen recovery in rice field. Field Crop. Res. 2018, 218, 141–149. [Google Scholar] [CrossRef]
  48. Mikkelsen, D.S.; Jayaweera, G.R.; Rolston, D.E. Nitrogen fertilization practices of lowland rice culture. In Nitrogen Fertilization and the Environment; Marcel Dekker, Inc.: New York, NY, USA, 1995; pp. 171–223. [Google Scholar]
  49. Peng, W.; Fu, L.; Hui, L.; Tcab, C.; Peng, Z.; Zjab, C. Suitable fertilizer application depth can increase nitrogen use efficiency and maize yield by reducing gaseous nitrogen losses. Sci. Total Environ. 2021, 781, 146787. [Google Scholar]
  50. Yuan, M.; Fernández, F.G.; Pittelkow, C.M.; Greer, K.D.; Schaefer, D. Tillage and Fertilizer Management Effects on Phosphorus Runoff from Minimal Slope Fields. J. Environ. Qual. 2018, 47, 462–470. [Google Scholar] [CrossRef]
  51. Zeng, F.; Zuo, Z.; Mo, J.; Chen, C.; Yang, X.; Wang, J.; Wang, Y.; Zhao, Z.; Chen, T.; Li, Y.; et al. Runoff Losses in Nitrogen and Phosphorus from Paddy and Maize Cropping Systems: A Field Study in Dongjiang Basin, South China. Front. Plant Sci. 2021, 12, 675121. [Google Scholar] [CrossRef]
  52. Cao, D.; Cao, W.; Fang, J.; Cai, L. Nitrogen and phosphorus losses from agricultural systems in China: A meta-analysis. Mar. Pollut. Bull. 2014, 85, 727–732. [Google Scholar] [CrossRef]
  53. Arisanty, D.; Jędrasiak, K.; Rajiani, I.; Grabara, J. The Destructive Impact of Burned Peatlands to Physical and Chemical Properties of Soil. Acta Montan. Slovaca 2020, 25, 213–223. [Google Scholar]
  54. Zelenakova, M.; Repel, A.; Elkhier, Z.; Kaposztasova, D.; Abd-Elhamid, H.F. Impact of land use changes on surface runoff in urban areas—Case study of Myslavsky Creek Basin in Slovakia. Acta Montan. Slovaca 2019, 24, 129–139. [Google Scholar]
  55. Meyer, G.; Bell, M.J.; Kopittke, P.M.; Lombi, E.; Doolette, C.L.; Brunetti, G.; Klysubun, W.; Janke, C.K. Mobility and lability of phosphorus from highly concentrated fertiliser bands. Geoderma 2023, 429, 116248. [Google Scholar] [CrossRef]
  56. Djodjic, F.; Börling, K.; Bergström, L. Phosphorus leaching in relation to soil type and soil phosphorus content. J. Environ. Qual. 2004, 33, 678–684. [Google Scholar] [CrossRef] [PubMed]
  57. Ke, J.; Xing, X.; Li, G.; Ding, Y.; Dou, F.; Wang, S.; Liu, Z.; Tang, S.; Ding, C.; Chen, L. Effects of different controlled-release nitrogen fertilisers on ammonia volatilisation, nitrogen use efficiency and yield of blanket-seedling machine-transplanted rice. Field Crop. Res. 2017, 205, 147–156. [Google Scholar] [CrossRef]
  58. Ke, J.; He, R.; Hou, P.; Ding, C.; Ding, Y.; Wang, S.; Liu, Z.; Tang, S.; Ding, C.; Chen, L.; et al. Combined controlled-released nitrogen fertilizers and deep placement effects of N leaching, rice yield and N recovery in machine-transplanted rice. Agric. Ecosyst. Environ. 2018, 265, 402–412. [Google Scholar] [CrossRef]
  59. Zhang, M.; Yao, Y.; Zhao, M.; Zhang, B.; Tian, Y.; Yin, B.; Zhu, Z. Integration of urea deep placement and organic addition for improving yield and soil properties and decreasing N loss in paddy field. Agric. Ecosyst. Environ. 2017, 247, 236–245. [Google Scholar] [CrossRef]
  60. Liu, T.; Li, S.; Guo, L.; Cao, C.; Li, C.; Zhai, Z.; Zhou, J.; Mei, Y.; Ke, H. Advantages of nitrogen fertilizer deep placement in greenhouse gas emissions and net ecosystem economic benefits from no-tillage paddy fields. J. Clean. Prod. 2020, 263, 121322. [Google Scholar] [CrossRef]
  61. Rychel, K.; Meurer, K.H.E.; Börjesson, G.; Strömgren, M.; Getahun, G.T.; Kirchmann, H.; Kätterer, T. Deep N fertilizer placement mitigated N2O emissions in a Swedish field trial with cereals. Nutr. Cycl. Agroecosyst. 2020, 118, 133–148. [Google Scholar] [CrossRef]
  62. Wang, L.; Gao, F.; Reddy, G.V.P.; Zhao, Z. Optimization of Nitrogen Fertilizer Application Enhances Biocontrol Function and Net Income. J. Econ. Èntomol. 2020, 113, 2035–2038. [Google Scholar] [CrossRef]
  63. Ahmed, M.; Rauf, M.; Mukhtar, Z.; Saeed, N.A. Excessive use of nitrogenous fertilizers: An unawareness causing serious threats to environment and human health. Environ. Sci. Pollut. Res. 2017, 24, 26983–26987. [Google Scholar] [CrossRef]
  64. Lin, L.; Zheng, Z.; Hua, T.; Ashraf, U.; Hamoud, Y.A.; Alaa, A.A.; Xiangru, T.; Meiyang, D.; Zaiman, W.; Shenggang, P. Nitrogen Deep Placement Combined with Straw Mulch Cultivation Enhances Physiological Traits, Grain Yield and Nitrogen Use Efficiency in Mechanical Pot-Seedling Transplanting Rice. Rice Sci. 2022, 29, 89–100. [Google Scholar] [CrossRef]
  65. Gealy, D.R.; Rohila, J.S.; Boykin, D.L. Genetic potential of rice under alternate-wetting-and-drying irrigation management for barnyardgrass (Echinochloa crus-galli) suppression and grain yield production. Weed Sci. 2019, 67, 453–462. [Google Scholar] [CrossRef]
  66. Gealy, D.R. Deep phosphorus fertiliser placement and reduced irrigation methods for rice (Oryza sativa L.) combine to knock-out competition from its nemesis, barnyard grass (Echinochloa crus-galli (L.) P. Beauv). Plant Soil 2015, 391, 427–431. [Google Scholar] [CrossRef]
Figure 1. Dynamic changes of temperature and rainfall in the experimental area during double-cropping rice planting.
Land 12 00724 g001
Figure 2. The grain yield and straw dry-matter weight of double-cropping rice. (a): The grain yield of early rice and late rice under different fertilization depths. (b): Straw dry-matter weight of early rice and late rice under different fertilization depths. Bars represent the standard deviations (n = 3). CK: no fertilizer; D0: surface spreading; D5: 5 cm side-deep fertilization; D7.5: 7.5 cm side-deep fertilization; D10: 10 cm side-deep fertilization. Different lowercase letters in the figure indicate significant difference among treatments at p = 0.05 (LSD).
Land 12 00724 g002
Figure 3. Nitrogen and phosphorus accumulation in different parts of early rice and late rice under different fertilization depths. (a): Nitrogen accumulation in different parts of early rice; (b): Nitrogen accumulation in different parts of late rice; (c): Phosphorus accumulation in different parts of early rice; (d): Phosphorus accumulation in different parts of late rice. CK: no fertilizer; D0: surface spreading; D5: 5 cm side-deep fertilization; D7.5: 7.5 cm side-deep fertilization; D10: 10 cm side-deep fertilization. Different lowercase letters in the figure indicate significant difference among treatments at p = 0.05 (LSD).
Land 12 00724 g003
Figure 4. Nitrogen and phosphorus accumulation ratios in different parts of rice at harvest stage. (a): Nitrogen accumulation ratio in different parts of rice in early rice. (b): Nitrogen accumulation ratio in different parts of rice in late rice. (c): Phosphorus accumulation ratio in different parts of rice in early rice. (d): Phosphorus accumulation ratio in different parts of rice in late rice. CK: no fertilizer; D0: surface spreading; D5: 5 cm side-deep fertilization; D7.5: 7.5 cm side-deep fertilization; D10: 10 cm side-deep fertilization.
Land 12 00724 g004
Figure 5. Early rice and late rice fertilizer-utilization rates under different depth fertilization treatments. (a): Nitrogen-use efficiency; (b): Nitrogen physiological efficiency; (c): Nitrogen harvest index; (d): Phosphorus-use efficiency; (e): Phosphorus physiological efficiency; (f): Phosphorus harvest index. CK: no fertilizer; D0: surface spreading; D5: 5 cm side-deep fertilization; D7.5: 7.5 cm side-deep fertilization; D10: 10 cm side-deep fertilization. Different lowercase letters in the figure indicate significant difference among treatments at p = 0.05 (LSD).
Land 12 00724 g005
Figure 6. NH3 flux and accumulation of early rice and late rice under different fertilization depths. (a): Dynamic change of NH3 flux in early rice; (b): Dynamic change of NH3 flux in late rice; (c): Accumulation of NH3 volatilization in early rice; (d): Accumulation of NH3 volatilization in late rice. CK: no fertilizer; D0: surface spreading; D5: 5 cm side-deep fertilization; D7.5: 7.5 cm side-deep fertilization; D10: 10 cm side-deep fertilization. Different lowercase letters in the figure indicate significant difference among treatments at p = 0.05 (LSD).
Land 12 00724 g006
Figure 7. Variation in nitrogen concentrations of different forms in surface water under different fertilization-depth treatments. CK: no fertilizer; D0: surface spreading; D5: 5 cm side-deep fertilization; D7.5: 7.5 cm side-deep fertilization; D10: 10 cm side-deep fertilization. Different lowercase letters in the figure indicate significant difference among treatments at p = 0.05 (LSD). (ac): Dynamic change of different nitrogen forms in early rice; (df): Average concentration of different nitrogen forms in early rice; (gi): Dynamic change of different nitrogen forms in late rice; (jl): Average concentration of different nitrogen forms in early rice.
Land 12 00724 g007
Figure 8. Concentration changes of different forms of phosphorus in surface water under different fertilization-depth treatments. CK: no fertilizer; D0: surface spreading; D5: 5 cm side-deep fertilization; D7.5: 7.5 cm side-deep fertilization; D10: 10 cm side-deep fertilization. Different lowercase letters in the figure indicate significant difference among treatments at p = 0.05 (LSD). (ac): Dynamic change of different nitrogen forms in early rice; (df): Average concentration of different nitrogen forms in early rice; (gi): Dynamic change of different nitrogen forms in late rice; (jl): Average concentration of different nitrogen forms in early rice.
Land 12 00724 g008
Figure 9. PCA analysis for grain yield and concentration of N and P in surface water in double-cropping rice. (a): early rice; (b): later rice. Samples are shown by colorful solid circle (treatment: CK, D0, D5, D7.5, and D10 were red, blue, green, brown, and orange, respectively).
Land 12 00724 g009
Table 1. The original soil characteristics (0–20 cm).
pHOM/g kg−1TN/g kg−1TP/g kg−1TK/g kg−1AN/ mg kg−1AP/ mg kg−1AK/ mg kg−1
4.6130.032.400.2015.35205.910.4205
Note: OM: Organic matter; TN: Total nitrogen; TP: Total phosphorus; TK: Total potassium; AN: Available nitrogen; AP: Available phosphorus; AK: Available potassium.
Table 2. Changes of nitrogen and phosphorus nutrients in soil under different fertilization-depth treatments at harvest stage.
SeasonTreatmentTNs (g kg−1)TPs (g kg−1)AN (mg kg−1)AP (mg kg−1)
Early riceCK2.425 ± 0.03 b0.193 ± 0.02 ab185.733 ± 0.933 d9.394 ± 0.038 a
D02.455 ± 0.023 b0.192 ± 0.03 ab193.2 ± 1.617 c9.081 ± 0.135 a
D52.635 ± 0.024 a0.20 ± 0.09 a215.6 ± 3.233 a9.172 ± 0.049 a
D7.52.572 ± 0.018 a0.192 ± 0.01 ab208.133 ± 0.933 b10.404 ± 1.374 a
D102.47 ± 0.029 b0.184 ± 0.02 b191.333 ± 2.469 cd10.15 ± 0.03 a
Late riceCK2.376 ± 0.014 c0.18 ± 0.02 a209.4 ± 13.4 a10.447 ± 0.332 a
D02.476 ± 0.038 b0.188 ± 0.01 a201.6 ± 6.466 a9.922 ± 0.064 a
D52.438 ± 0.06 bc0.191 ± 0.03 a208.133 ± 3.733 a10.134 ± 0.165 a
D7.52.451 ± 0.028 b0.185 ± 0.01 a206.267 ± 3.365 a10.106 ± 0.125 a
D102.62 ± 0.015 a0.194 ± 0.06 a218.4 ± 3.233 a10.01 ± 0.165 a
Note: TNs: total nitrogen content in soil; TPs: total phosphorus content in soil; AN: available nitrogen content; AP: available phosphorus content. CK: no fertilizer; D0: surface spreading; D5: 5 cm side-deep fertilization; D7.5: 7.5 cm side-deep fertilization; D10: 10 cm side-deep fertilization. Different lowercase letters in the table indicate significant difference among treatments at p = 0.05 (LSD).
Disclaimer/Publisher’s Note: The statements, opinions and data contained in all publications are solely those of the individual author(s) and contributor(s) and not of MDPI and/or the editor(s). MDPI and/or the editor(s) disclaim responsibility for any injury to people or property resulting from any ideas, methods, instructions or products referred to in the content.

