Article

Provincial Inclusive Green Growth Efficiency in China: Spatial Correlation Network Investigation and Its Influence Factors

1
School of Management, Tianjin University of Technology, Tianjin 300384, China
2
College of Management and Economics, Tianjin University, Tianjin 300372, China
3
China Shanghai Architectural Design & Research Institute. Co., Ltd., Shanghai 200063, China
*
Author to whom correspondence should be addressed.
Land 2023, 12(3), 692; https://doi.org/10.3390/land12030692
Submission received: 10 February 2023 / Revised: 6 March 2023 / Accepted: 13 March 2023 / Published: 16 March 2023
(This article belongs to the Special Issue Supporting Assessment and Planning Processes for a Good Anthropocene)

Abstract

:
Inclusive green growth efficiency (IGGE) analysis is an effective tool for improving coordinated economic, social, and environmental development. This study incorporated the game cross-efficiency DEA to measure the IGGE of 30 provinces in China. Then, the modified spatial gravity model and social network analysis model were applied to construct and analyze the spatial correlation network structure of the IGGE. The quadratic assignment procedure was used to mine the influencing factors that affect the formation and evolution of the spatial correlation network of the IGGE. The results are as follows. (1) During the study period, there were significant differences in the IGGE among the 31 provinces, among which the eastern provinces were higher than the central and western provinces. (2) The spatial correlation of the IGGE presented a complex and multi-threaded network structure, indicating that the IGGE has a noticeable cross-regional spillover effect. Beijing, Tianjin, Zhejiang, Shanghai, Jiangsu, and Guangdong played the role of the “net spillover” block. Qinghai, Guizhou, Guangxi, and the surrounding provinces played the role of the “primary beneficial”. The Yangtze delta and Pearl River Delta economic zone (primarily including Shanghai and Guangdong) acted as a “bridge” to the Yunnan–Guizhou region and the surrounding provinces. (3) The spatial adjacency, degree of openness, economic development, and environmental governance were the prominent factors influencing the formation and evolution of the IGGE spatial correlation network. This work provides an example of constructing an IGGE correlation network while considering various factors, such as the economy, population, and distance. It also could help policymakers clarify the IGGE spatial correlation pattern and the provinces’ roles and potential for IGGE synergic improvement.

1. Introduction

Due to the past 40 years of reform and opening-up, China has achieved remarkable economic growth under the previous factor and resource-driven model, which also led to threats, such as the exhaustion of resources, environmental pollution, and income gaps. Economic growth means gaining economic development [1], while the aim is to benefit human society [2]. Given the pursuit of high-quality development that was first proposed at the 19th National Congress of the Communist Party of China and the loss of people’s well-being caused by coronavirus pandemic, economic growth alone is no longer consistent with the goal. It is important to find a path that is environmentally sustainable and socially equitable [3,4,5]. Therefore, similar to the ideological connotation of “carbon reduction, pollution reduction, green expansion, and growth” advocated by the 20th National Congress, we must adopt a greener and more inclusive growth model to accelerate the transforming development from extensive to intensive. Inclusive green growth (IGG) is an integrated concept of economic growth, social equity, and green development. It is the priority for this transformation, which emphasizes a social economy that is progressive and environmentally sustainable [6,7].
Improving the inclusive green growth efficiency (IGGE) is the precondition for accelerating the IGG. In other words, it is necessary to ensure that those inputs, including the labor force, capital stock, energy, and other resources, transform into inclusive green outputs, including green GDP and social well-being, that could gain efficiency [8]. In addition, improving the IGGE is helpful for the efficient use of resources and socio-economic coordinated development [9]. Thus, it is important to accurately evaluate the IGGE. However, there is no unified measurement of the IGGE. The prevailing approaches can be sorted into two categories. One is SFA, which is unsuitable for solving multi-input and multi-output problems [10]. The other one is traditional DEA, which cannot deal with undesired outputs or further compare the case with the same efficiency of 1. Thus, the improved DEA models, such as the super-efficiency DEA model [11], super-EBM model [12], and two-stage DEA model [13], have been used in many studies to evaluate the efficiency. Nevertheless, all the above methods ignore the competition between local governments, resulting in measurement deviation when calculating the IGGE.
Furthermore, there are significant differences between the different provinces or municipalities in the economic developing model, technological developing level, and innovation capability [14,15,16]. Meanwhile, due to the flowing of people, finance, and materials among the provinces, each province’s IGGE will be affected by the other provinces, thereby forming an inter-provincial IGGE spatial association network [17,18,19,20]. This indicates that the IGGE of each province in China can influence each other. Thus, each province also needs to consider the inter-provincial IGGE correlation when improving their IGGE. In other words, it is necessary for policymakers to accurately grasp the spatial correlation and spatial structure of the IGGE among the provinces, thereby formulating practical overall IGGE improvement measures and achieving synergistic IGGE improvement in China. However, existing studies have verified the spillover effect of the IGGE from the perspective of its geographical proximity, ignoring the IGGE’s cross-regional relationship. Therefore, it is necessary to investigate the correlation of the IGGE in the 30 Chinese provinces and municipalities from the perspective of a spatial correlation network, so as to improve its synergistic growth ability.
Driven by the above gaps, this work aims to investigate the following questions: What are the outcomes of the IGGE in the 30 provinces in China? What is the inter-province IGGE correlation network structure? What factors will affect the change of the IGGE correlation network? Following these questions, this work firstly establishes an evaluation indicator system of China’s IGGE from a three dimensional perspective of “economic development, social well-being, and environmental transformation”, and measures the IGGE with the panel data from 2006 to 2020. Additionally, the game cross-efficiency DEA (GCE-DEA) model, which considers the competition between the provinces, is used to calculate the IGGE in China. Finally, a combination of an improved gravity model and social network analysis (SNA) is used to construct a social correlation network of the IGGE in China and analyze the factors that influence the formation and evolution of the networks. This work aims to fully reveal the spatio-temporal evolution trend and spatial correlation characteristics of China’s IGGE, thereby clarifying the status and role of each region in the IGGE spatial correlation network. This will contribute to providing specific suggestions for government decision-making, so as to enhance the collaborative growth capacity of China’s IGGE and promote China’s green and sustainable development.
The innovations can be summarized as follows:
(1)
This paper constructs the IGGE evaluation indicator system from the perspective of “economic development, social well-being, and environmental transformation” based on the ideological connotation of inclusive green growth and using the game cross-efficiency DEA method to measure the IGGE in China. It overcomes the shortcoming of ignoring the competition between the regions and will conform more to reality.
(2)
Establishing the IGGE correlation network among the 30 provinces in China, identifying the role of different regions in the network, and clearing the synergistic capacity as a whole will, thereby, help policymakers implement different policies suitable for the different regions.
(3)
Mining and quantifying the factors that influence the formation and evolution of the IGGE correlation network will, furthermore, enhance the ability of the IGGE synergistic improvement and promote sustainable development in China.
The rest of the paper is organized as follows. A literature review is presented in Section 2. The “Methods and Data” exposits the empirical methods and the data resources are presented in Section 3. Section 4 presents the empirical results. The discussion of the findings is presented in Section 5, and the conclusions are provided in Section 6.

2. Literature Review

2.1. The Conceptual Evolution of IGG

IGG is a combined conception of green growth and inclusive growth [21]. Green growth focuses on the coordination of the economy and the environment, and the related terms include “sustainable development”, “green economy”, and “low-carbon economy” [22,23]. The mainstream view is that economic growth and green growth are mutually reinforcing [24,25]. Anyhow, green growth puts more emphasis on the relationship between the economy and the environment. With the attention paid to the current worldwide problem of income gaps and poverty, there is a growing sense that green growth should be integrated with inclusive growth [26]. In this context, the IGG formed by the combination of inclusive growth advocating for non-discrimination, better equality, and pro-poor and fair opportunity growth [27,28] and green growth advocating for clean and sustainable economic development [29] becomes the worldwide final choice.
Specifically, the main idea of IGG is coupling and coordinating the relationship between society, the economy, and the environment [30]. In terms of society, IGG aims at improving livelihood welfare, reducing social inequalities, and achieving an equitable distribution of economic and environmental benefits [31]. In terms of the economy, it is more inclined to pursue a green economy, which is an indicator of continuous improvement of the innovation ability and a gradual improvement of environmental pollution, and social and economic equality [32]. In terms of the environment, it advocates for resource conservation and environmental protection.

2.2. Evaluation Method of IGGE Indicator System

Quantifying the IGGE is the first step to see the IGGE development level of the region, thereby helping policymakers to formulate strategies to promote sustainable development. The current mainstream method in the research field for the IGGE estimation is the data envelopment analysis (DEA), which was first introduced by Charnes, Cooper, and Rhodesis [33] and is also named the CCR-DEA or traditional DEA. To date, the basic CCR-DEA model and its improved model have started to be employed to investigate the IGGE [34,35]. In the study by Wang et al, 2021, Malmquist–Luenberger index was employed to analyze the inclusive green total factor productivity in China’s provinces from 1995 to 2017 [36]. Guan et al., 2022, used a super-SBM to evaluate 286 cities’ inclusive green total factor productivity and investigate their convergence features [37]. Although the above literature applied different DEA-modified models to measure the efficiency, they all self-examined every decision-making unit (DMU), resulting in an overestimation of the DMUs’ weight and the acquisition of multiple effective DMUs which could not be further ranked. Sexton et al., 1986, introduced the cross-efficiency DEA model (CE-DEA) to improve this problem [38]. This method considered both “self-assessment” and “peer assessment”, thereby objectively assessing the IGGE. However, due to the non-uniqueness of the optimal weights calculated by the traditional DEA model, the results of the CE-DEA model might not have been unique [39,40]. Furthermore, Liang et al., 2008, improved this problem by introducing the game cross-efficiency DEA model (GCE-DEA). Researchers hold the view that the DMUs always depend on others to make their own decisions in practice, thus, competitive relationships exist between them [41]. Therefore, the GCE-DEA fully considers the competition and obtains a unique and stable result in a pairwise game between the DMUs through an iterative algorithm. Thereafter, researchers increasingly use the GCE-DEA model in varied research fields, such as for supplier selection problems [42,43,44], allocating cost problems [45], portfolio selection [46], Olympic rankings [47], and efficiency measurement [48]. Nevertheless, the GCE-DEA model has not been fully utilized in inclusive green growth research. Actually, the GCE-DEA can maximize the economic output to minimize the undesired output on the basis of considering regional competitive relations, laying the foundation for the calculation of inclusive green growth [49]. Zhao and Yang (2019) also employed the GCE-DEA to measure the green growth efficiency and further reveal the regional differences [50]. Wang et al., 2021 used the GCE-DEA to assess the energy efficiency of the construction industry and investigate the spatial-temporal difference [51]. On the basis of the previous studies, we applied the GCE-DEA method to measure the IGGE.

2.3. Spatial Characteristics of IGGE

The IGGE has a significant spatial effect, which could be attributed to the inter-regional overflow by various factors, including technology innovation, transportation, economy, labor, and others. Many scholars have demonstrated the existence of the spatial spillover effects of the IGGE. Shen et al., 2022, applied the DEA and exploratory spatial data analysis to measure and analyze the spatio-temporal pattern and found that the spatial agglomeration of China’s IGGE have been enhanced from 2006 to 2019 [52]. Liu et al., 2021, investigated the present IGGE characteristics of the aggregation and found that the gap between the regions was increasing, suggesting a closer cooperation between the regions would break up the gaps [53]. The existing literature have begun to investigate the spatial effects of the IGGE but mainly focused on the correlations of the proximity areas based on “attribute data” [54]. It is remarkable that rare studies pay attention to the inter-regional or cross-regional relationship of the IGGE from the perspective of a network correlation. To enrich the related research, SNAs based on “relational data” could be used to investigate the spatial relationships among the regions [55]. This method can avoid the limitation of the proximity areas of the spatial measurement methods, which cannot characterize the complex network correlation. In conclusion, it is necessary to explore how to improve the IGGE of the region as a whole from the perspective of a spatial correlation network.

2.4. Summary of Literature and Research Gap

Considerable research has focused in-depth on the measurement and spatial distribution of the IGGE. However, the previous literature measured the IGGE using the traditional DEA model, which obtained multiple effective DMUs and could not be ranked effectively. Meanwhile, because the traditional DEA methods ignore the competition relationships among the DMUs, the efficiency measurement was always overestimated. In addition, a few studies proved that the IGGE had a spatial correlation, but most of them were limited to using “attribute data” to investigate the correlation of the adjacent regions. There is insufficient research on further exploring the multi-thread and complex cross-regional IGGE network structure based on regional “relational data”, and there is a lack of research on the influencing factors of the network’s formation and evolution.
To solve these problems, this work attempts to enrich and deepen the existing research in the following aspects: (1) Taking consideration of the competition to measure the IGGE of the 30 provinces using the GCE-DEA model. (2) Mapping the spatial correlation network of the IGGE in the 30 Chinese provinces and discussing the development status of the IGGE in the different regions. (3) Mining the factors that influence the formation and evolution of the IGGE spatial correlation network, thereby providing policy implications for strengthening environmental protection, improving human welfare, and accelerating economic development.

3. Materials and Methods

3.1. Research Area and Data Sources

There are 34 province-level administration regions in China. Due to the data availability, this work selected 30 provinces and municipalities (except Tibet, Hong Kong, Macau, and Taiwan) as the study units to analyze the IGGE during the period of 2006 to 2020. Furthermore, according to the study of Wang [56], based on the location conditions, this work divides the 30 provinces into four groups: eastern, northeastern, central, and western (Figure 1). Specifically, Beijing, Shanghai, Tianjin, Fujian, Guangdong, Hainan, Hebei, Jiangsu, Shandong, and Zhejiang belong to the eastern region. Heilongjiang, Jilin, and Liaoning belong to the northeastern region. Anhui, Henan, Hubei, Hunan, Jiangxi, and Shanxi belong to the central region. Chongqing, Guangxi, Inner Mongolia, Ningxia, Xinjiang, Gansu, Guizhou, Qinghai, Shaanxi, Sichuan, and Yunnan belong to the western region.

3.2. Evaluation Indicator System and Data Explanation

This work follows the principles of scientificity, objectivity, systematisms, and data accessibility. Following the connotation of “economic growth, social harmony and environmental protection” and referring to the relevant research [57,58,59,60,61], this work selected the indexes and established the evaluation indicator system of the IGGE in China (Table 1).
The essence of IGG is to pursue the coordination of economic growth, social welfare, and environmental protection. In other words, IGG is an activity to consume the input factors, such as labor, material resources, and capital, to create tangible and intangible substances. Thus, this work selected capital stock, labor input, and energy as the input indicators. Through the process of the inclusive green growth activities, all the inputs will be transformed into goods and services to generate economy, environment, and social welfare. This work selected the GDP, the per capita consumption expenditure and green coverage rate of the built-up areas, as the desirable outputs, which could disclose the improvement of the regional socio-economic development and environmental improvement. Specifically, GDP is used to evaluate the province’s ability to create economic wealth. The per capita consumption expenditure is employed to reflect the residents’ living standard. The green coverage ratio of the built-up areas can reflect the citizens’ quality of life [62]. However, due to the large consumption of energy and resources, environmental problems have increasingly become the main factor restricting sustainable development. Thus, wastewater, sulfur dioxide, and industrial soot were selected as the undesirable output indicators to evaluate the impact of regional production and living on the regional environment. The relevant variables and data for the IGGE evaluation indicator system are shown in Table 1.

3.3. Methodology

3.3.1. DEA Game Cross-Efficiency Model

The game cross-efficiency DEA model (GCE-DEA) introduced by Liang et al., 2008, combined the CE-DEA model and game theory [63]. In the framework of CE-DEA, supposing that there are n DMUs, and each DMU’s efficiency needs to be calculated n times using the optimal weights evaluated by the n linear programming. Then the results need to be averaged to get an average CE-DEA result. Based on the optimal weights and the averaged results, the CE-DEA model can avoid the problem of the traditional DEA models which only use self-evaluation to get weights. However, a non-uniqueness still exists. The GCE-DEA model solves this problem by considering the competition relationships between the DMUs. In addition, this model uses the initial value given by the average original CE-DEA iterative operation, ultimately making each DMU converge on the optimal value. Equation (1) provides the detail for the GCE-DEA.
max r = 1 s u r j d y r j
s . t .   i = 1 m v i j d x i l r = 1 s u r j d y r l 0 , l = 1 , 2 , , n
i = 1 m v i j d x i j = 1
e d i = 1 m v i j d x i d r = 1 s u r j d y r d 0
v i j d 0 , i = 1,2 , , m
u r j d 0 , r = 1,2 , , s
Therein, x is the input vector, y is the output vector, v i j d is the weight of the ith input, and u r j d is the weight of the rth output. e d is a parameter whose initial value is the original average cross-efficiency value of DMUd. The d-cross-efficiency value of the GCE-DEA of DMUj relative to DMUd can be obtained using Equation (2).
e d j = r = 1 s U r j d y r j i = 1 m v i j d x i j , d = 1,2 , , n
Then, by averaging all e d j (d = 1, …, n), the average game cross-efficiency value e j of DMUj (j = 1, …, n) can be obtained using Equation (3).
e j = 1 n d = 1 n d = 1 n U r j d * ( e d ) y r j
Furthermore, wastewater, sulfur dioxide, and industrial soot are the undesired outputs, thus, the GCE-DEA model should minimize the emissions of the undesired outputs while maximizing the desired output. In order to consider wastewater, sulfur dioxide, and industrial soot as the undesired output in the framework of the GCE-DEA, this paper refers to the methods of Xie (2012) [64]. In their research, the undesirable output was transformed into the CE-DEA model by applying the conversion function f U = U , as detailed in Equation (4).
max r = 1 s u r j d y r j k = 1 q w k j d b k j
s . t .   i = 1 m v i j d x i l ( r = 1 s u r j d y r l k = 1 q w k j d b k j ) 0 , l = 1 , 2 , , n
max i = 1 m v i j d x i j = 1
e d i = 1 m v i j d x i d ( r = 1 s u r j d y r d k = 1 q w k j d b k d ) 0
v i j d 0 , i = 1,2 , , m
u r j d 0 , r = 1,2 , , s
w k j d 0 , k = 1,2 , , q
Therein, b k j is the kth undesirable output in DMUj and w k j d is the weight. The other explanations are the same as those for Equation (1). In this case, the game cross-efficiency is defined as follows.
e d j = r = 1 s u r j d y r j k = 1 q w k j d b k j i = 1 m v i j d x i j , d = 1,2 , , n
The average game-cross energy efficiency of DMUj can be calculated using Equation (6).
e j = 1 n d = 1 n ( r = 1 s u r j d * ( e d ) y r j k = 1 q w k j d * ( e d ) b k j )

3.3.2. Social Network Analysis

Social network analysis (SNA) is one of the important research methods in sociology and economics. Theoretically, the method focuses on the relationships and network structures formed by the internal connections of the different actors. In this work, China is considered as the overall network, and each province within her is considered an actor or a node. Meanwhile, the connections between the provinces are viewed as the edges. Therefore, the nodes, edges, and network characteristics of the IGGE networks will be quantified. This work first establishes the IGGE network of China’s 30 provinces and municipalities, thereby using the forgoing indicators to explore the correlation and synergistic improvement potential of the IGGE among the regions.

Modified Gravity Model

The construction of the association network is the first step of the social network analysis. In this work, the nodes represent the provinces, and the edges represent the IGGE connections between the provinces. Considering that the gravity model can comprehensively take the economy, distance, and efficiency into consideration, this work uses an improved gravity model to construct the inter-provincial IGGE spatial correlation. The modified gravity model is as follows.
R i j = k i j G i E i G j E j [ d i j / ( g i g j ) ] 2   ,   k = E i E i + E j
where i and j represent province i and province j; Rij is the IGGE correlation strength between province i and province j, E is the IGGE, G is the GDP of each province, d is the distance between two provinces, and g is the per capita GDP. We assume the number of provinces is k, then i = 1, 2, …, k and j = 1, 2, …, k.
In order to facilitate the network characterization, the IGGE gravity matrix was binarized in this work. Given that a limited number of provinces can have a significant impact on a province, we took the average of each row in the matrix as the threshold. When the gravity value was greater than the average value of the row, it was denoted as 1, indicating that the correlation is significant, and the provinces in this column affect the IGGE of the provinces in this row.

Network Characteristics

After constructing the network of associations, the overall and centrality network characteristics could be used to quantify the characteristics of the IGGE correlation network. Those two kinds of network characteristics include several sub-items, which are shown in Table 2. Specifically, this work uses the overall network characteristics to explore the synergistic improvement status and the potential of the 30 provinces’ IGGE in China. The centrality network characteristic is used to indicate the role of the provinces in the synergistic improvement of the IGGE. The Handbook of Social Network Analysis: A Handbook by Scott (2012) can supply more detailed information [65].

3.3.3. Quadratic Assignment Procedure Method

The IGGE correlation network will be affected by many socio-economic factors, and the identification of these factors will be helpful for decision-making. Economic development, industrial structure, technological progress, and environmental governance are the important factors that affect the IGGE [66]. Regional cooperation for inclusive economy, green technology, and other areas is the driving factor promoting the IGGE [67], while the geographical factors will influence the spillover effect [68]. Therefore, this paper selected the spatial adjacency, economic development, environmental governance, technological progress, industrial structure, and degree of openness as the influence factors of the IGGE correlation network. The specific information is shown in Table 3.
Based on the above analysis, we can set up the model as follows.
N = f (D, G, E, T, I, O)
where N represents the spatial correlation matrix of the IGGE, and D represents the spatial adjacency matrix. The value is 1 if the provinces are adjacent, and 0 if the provinces are not. G represents the GDP difference matrix. E represents that the investment in industrial pollution control has been completed per unit of value added for the secondary industry difference matrix. T, I, and O represent the research and R&D funding, the secondary industry, and the total export–import volume per unit of the GDP difference matrix, respectively.

4. Results

4.1. Estimation and Spatio-temporal Characteristic of IGGE

This work used China’s 30 provinces as the DMUs. The GCE-DEA was used to calculate the IGGE of these regions (Table 4). In order to ensure the consistency of the classification criteria for the IGGE values in the different periods, this work classified them according to Jenks optimal natural fracture method in ArcGIS 10.2.
Generally, as shown in Figure 2, China’s overall IGGE level was not high, but the development potential was great. Specially, the average IGGE in 2006, 2011, 2016, and 2020 was 0.73, 0.68, 0.69, and 0.64, respectively, showing a downward trend of fluctuation. This indicates that despite the increase in the various resource inputs in recent years, the performance of coupling the coordination benefits of the economic, social, and environmental output indicators did not continuously increase.
In addition, from the tendency perspective, there were some differences between the eastern, central, western, and northeastern regions. The IGGE in the northeastern and western regions showed an inverted U-shape, and the peak occurred around 2013. On the contrary, the IGGE in the central region showed a U-shape, reaching a trough around 2015. This may be because the northeast and northwest regions, as the old industrial base and natural resource-rich area, benefited from a better economic foundation and resource endowment during the early stage of the industrial upgrade and energy transformation, resulting in a higher input–output efficiency of the IGGE.
The changing trend of the IGGE in central China was mainly attributed to a series of strategies for the rise of Central China, leading to improvements in its economy, environment, and social welfare. Meanwhile, the eastern region always obtained the highest IGGE, which may be related to the fact that the eastern region dominates inclusive green development with a reasonable and efficient environmental regulation system and income distribution.
Furthermore, a significant spatial difference in the IGGE of the 30 Chinese provinces is shown in Figure 3. In 2020, six provinces and municipalities had an IGGE above the medium–high value (0.76–0.85). These provinces and municipalities were mainly located in the eastern and northwestern regions, such as Shanghai, Beijing, Tianjin, Hainan, Qinghai, and Ningxia, indicating that the IGGE level in those regions achieved an appropriate level. Meanwhile, the provinces and municipalities of the southwest region (e.g., Yunnan, Guizhou, and Sichuan) and the central region remained at low levels of the IGGE (0.00−0.55). Notably, these were also areas with high rates of poverty.

4.2. Social Network Analysis of the IGGE in China

4.2.1. Overall Network Analysis

Using the UCINET software, this work analyzed the overall network characteristics of the IGGE in China and visualized the correlation network. As shown in Figure 4, the IGGE correlation network presented a typical form of network structure with multithreading, thickening, and complexity. The network structure gradually developed from the center-edge structure to the center-subcenter-edge structure. For example, in 2006, Shanghai, Beijing, Tianjin, Zhejiang, Guangdong, and Jiangsu were the center regions and the others were the edge regions. The center regions spilled over directly to the edge regions. Then, in 2020, Tianjin, Zhejiang, and Jiangsu gradually moved from the center position to the subcenter position, and subcenter regions received the overflow from the central region. Meanwhile, the subcenter region directly overflowed to the edge region. This indicated, to some extent, that the dominant provinces’ control over the network was gradually averaging and dispersing. Figure 4 also shows that the connection between the center regions and the edge regions of the IGGE correlation network was dense, while the connection between the edge regions was relatively weak despite the increase during the study period. Furthermore, based on the spatial correlation matrix, this work measured the network density, connection, and hierarchy, thereby quantitatively analyzing the network structural characteristics.
(1)
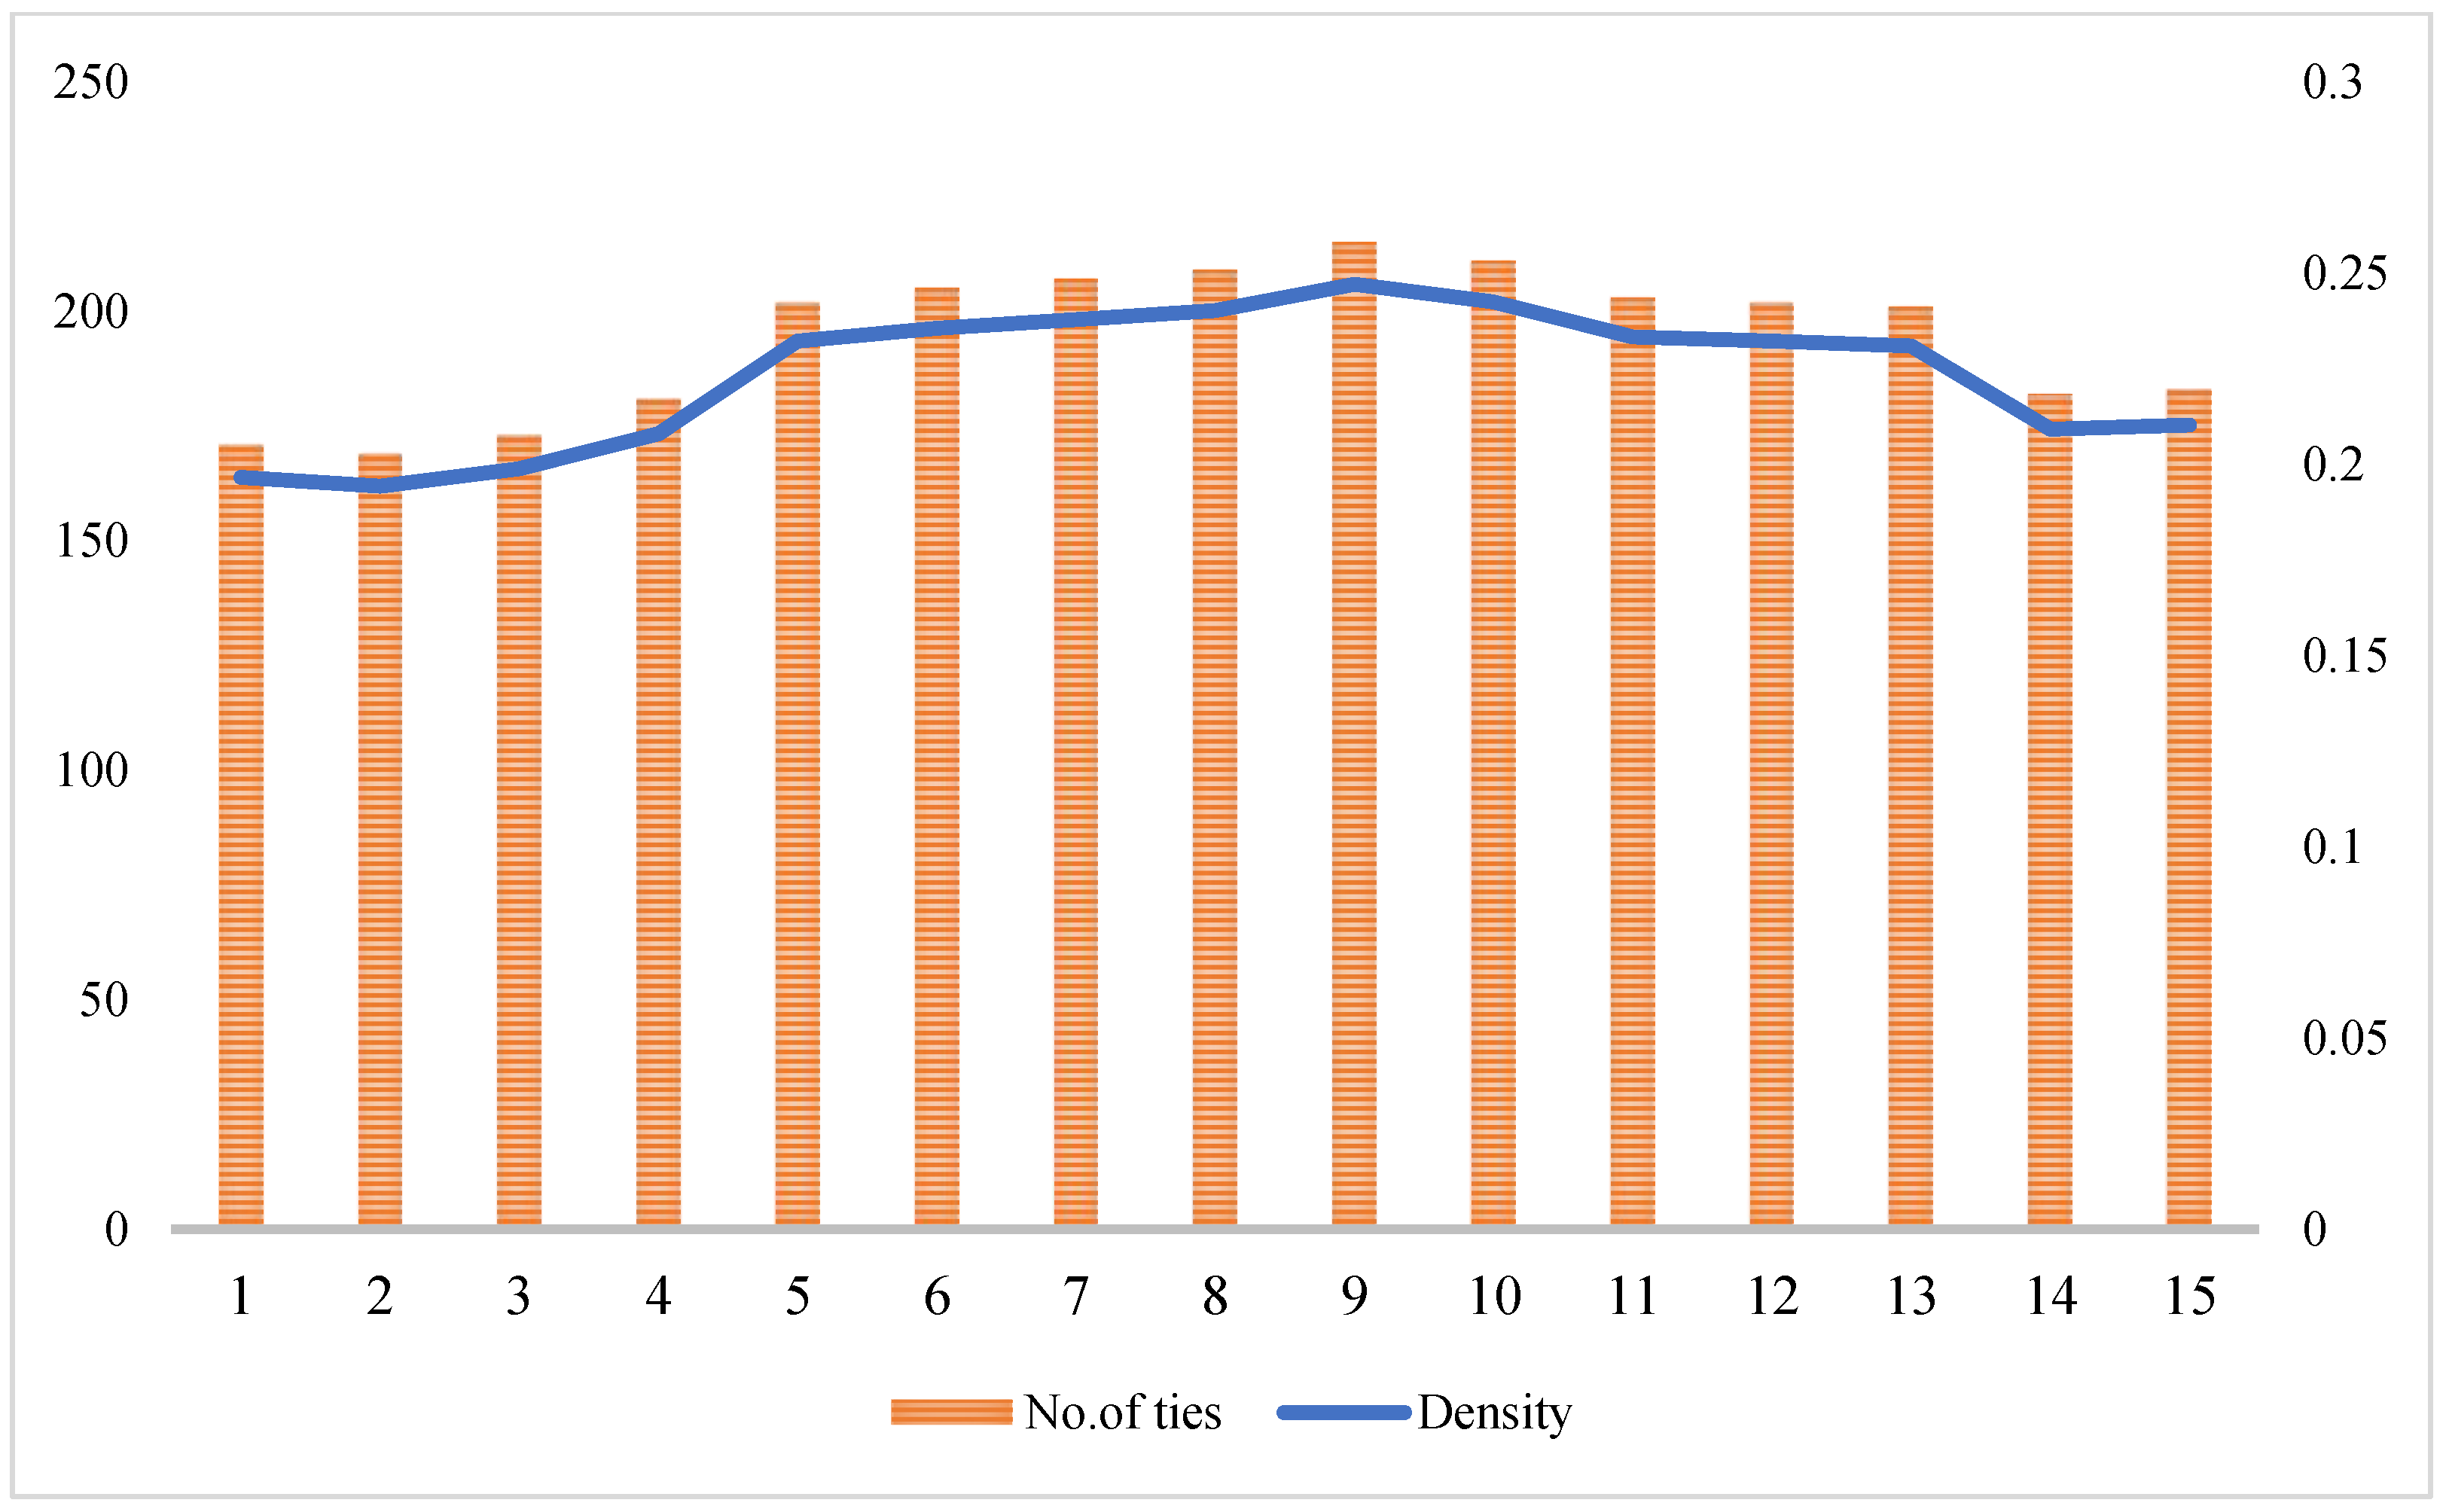
Network density. Figure 5 shows the number of spatial correlation ties and the network density of the IGGE in China from 2006 to 2020, which could reflect the linkage intensity of the IGGE correlation network. Both of them witnessed a rising, steady, and then downward trend. Specifically, the number of spatial correlation ties increased from 171 in 2006 to 215 in 2014. Meanwhile, the network density increased from 0.1966 in 2006 to 0.2471 in 2017. This indicates that the overall network correlation of the IGGE in the 30 Chinese provinces improved significantly during this period. However, both indicators experienced a decreased trend and fell to 183 and 0.2103 in 2020, respectively. This shows that the overall network correlation of the IGGE in the 30 Chinese provinces has weakened in recent years. Furthermore, the maximum correlation number of China’s IGGE correlation network was 870, which shows that there is still an obvious gap between the current status and the ideal status. Actually, the overall network structure of the IGGE in China is loose, and the inter-regional linkage of the IGGE still has much room for improvement.
(2)
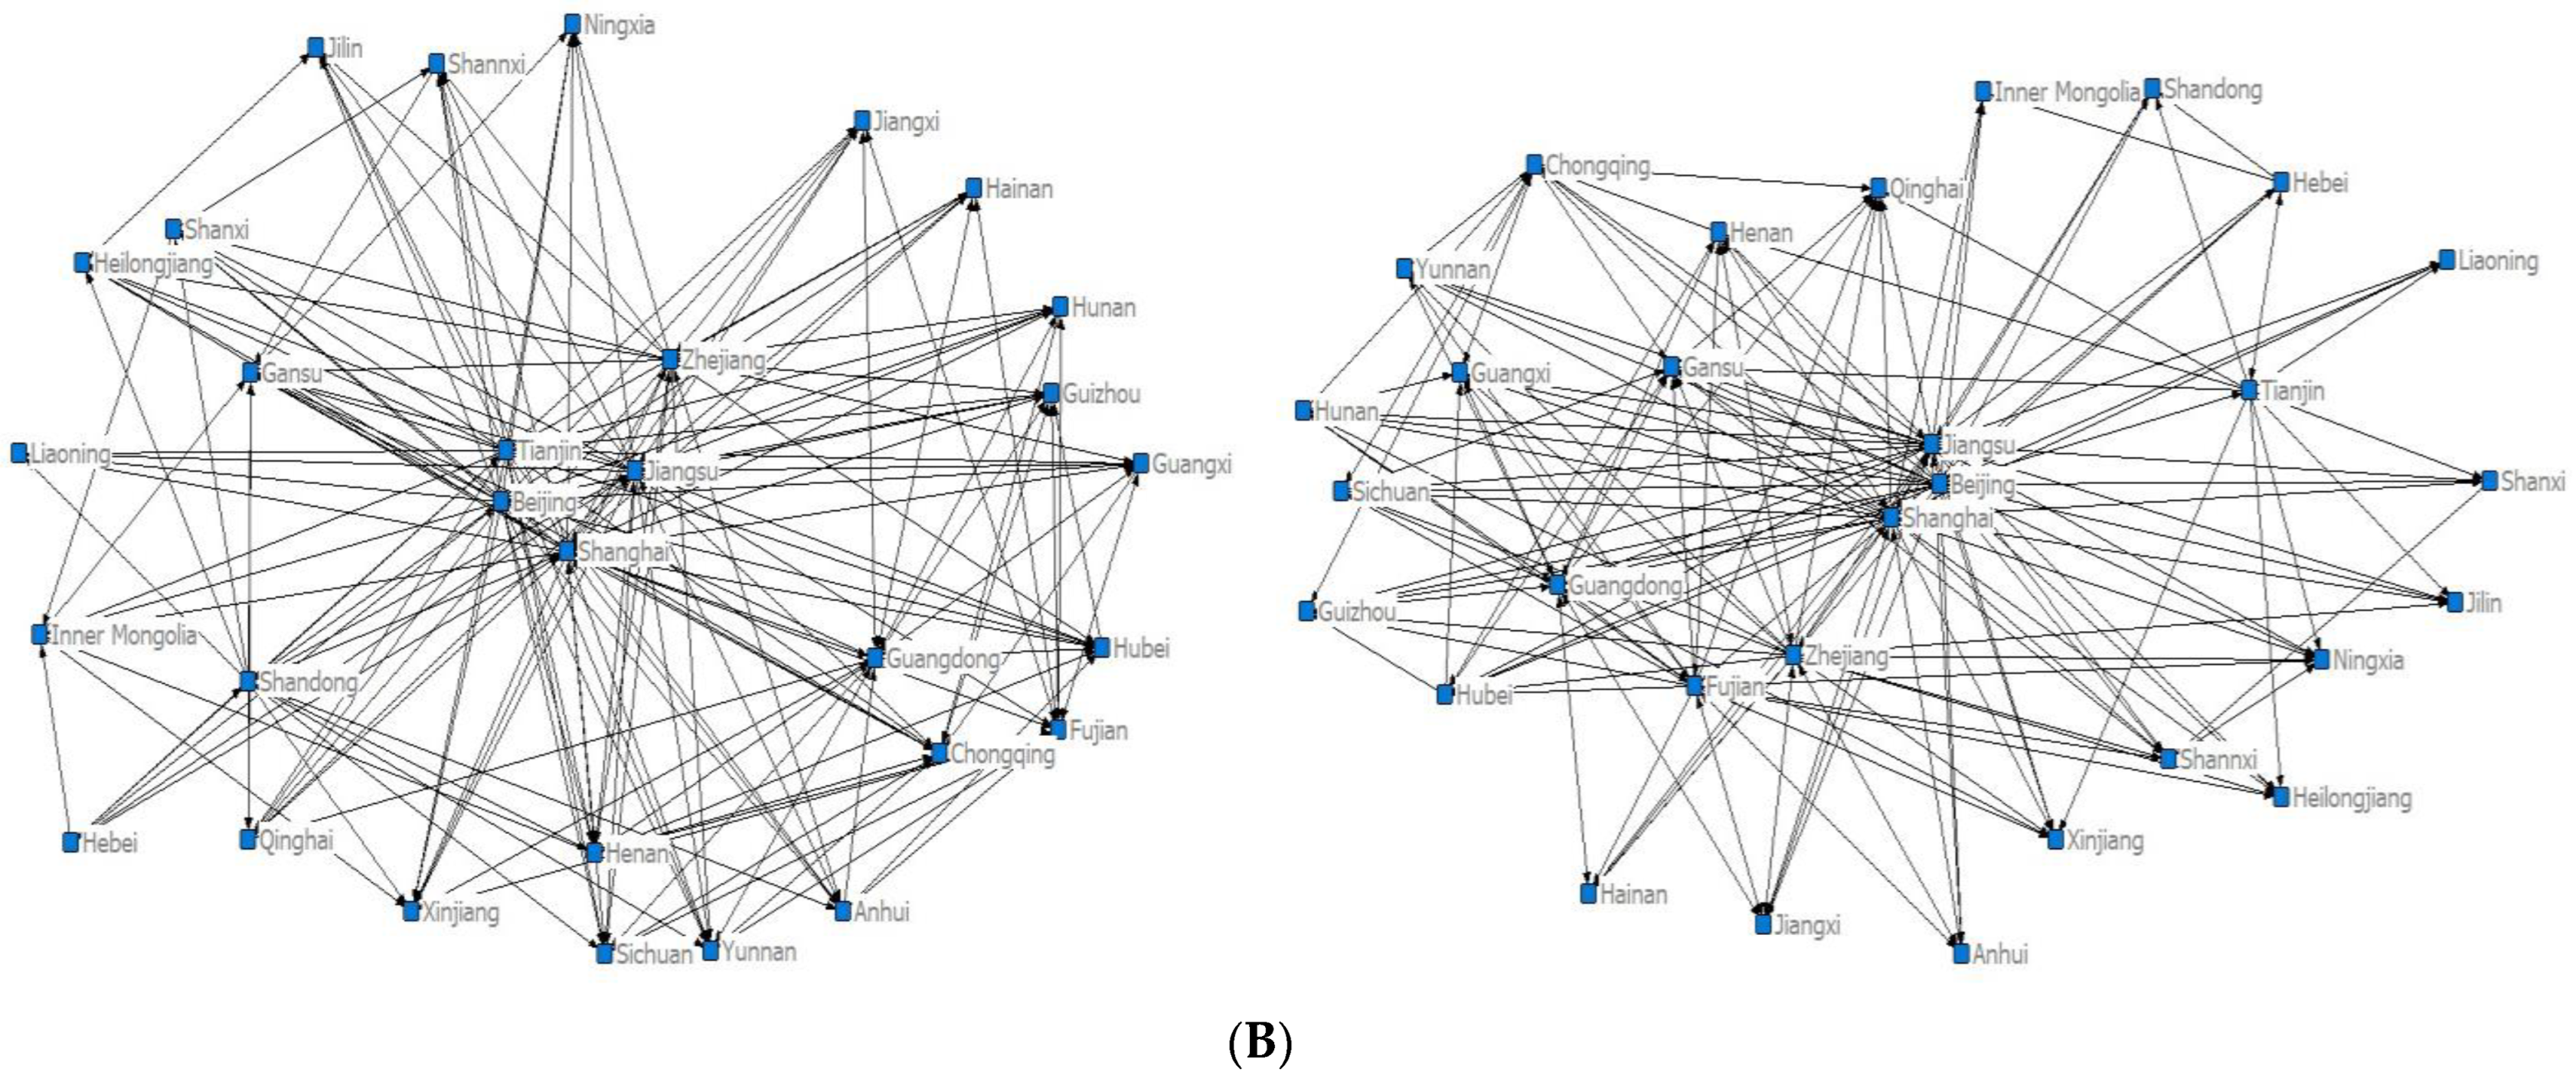
Network connection. The network connectedness was always 1 during the study period of 2006 to 2020, which suggests that the IGGEs among all the provinces were connected. In other words, all the provinces were within the IGGE correlation network. The network structure has significant spatial correlation and spillover effects.
(3)
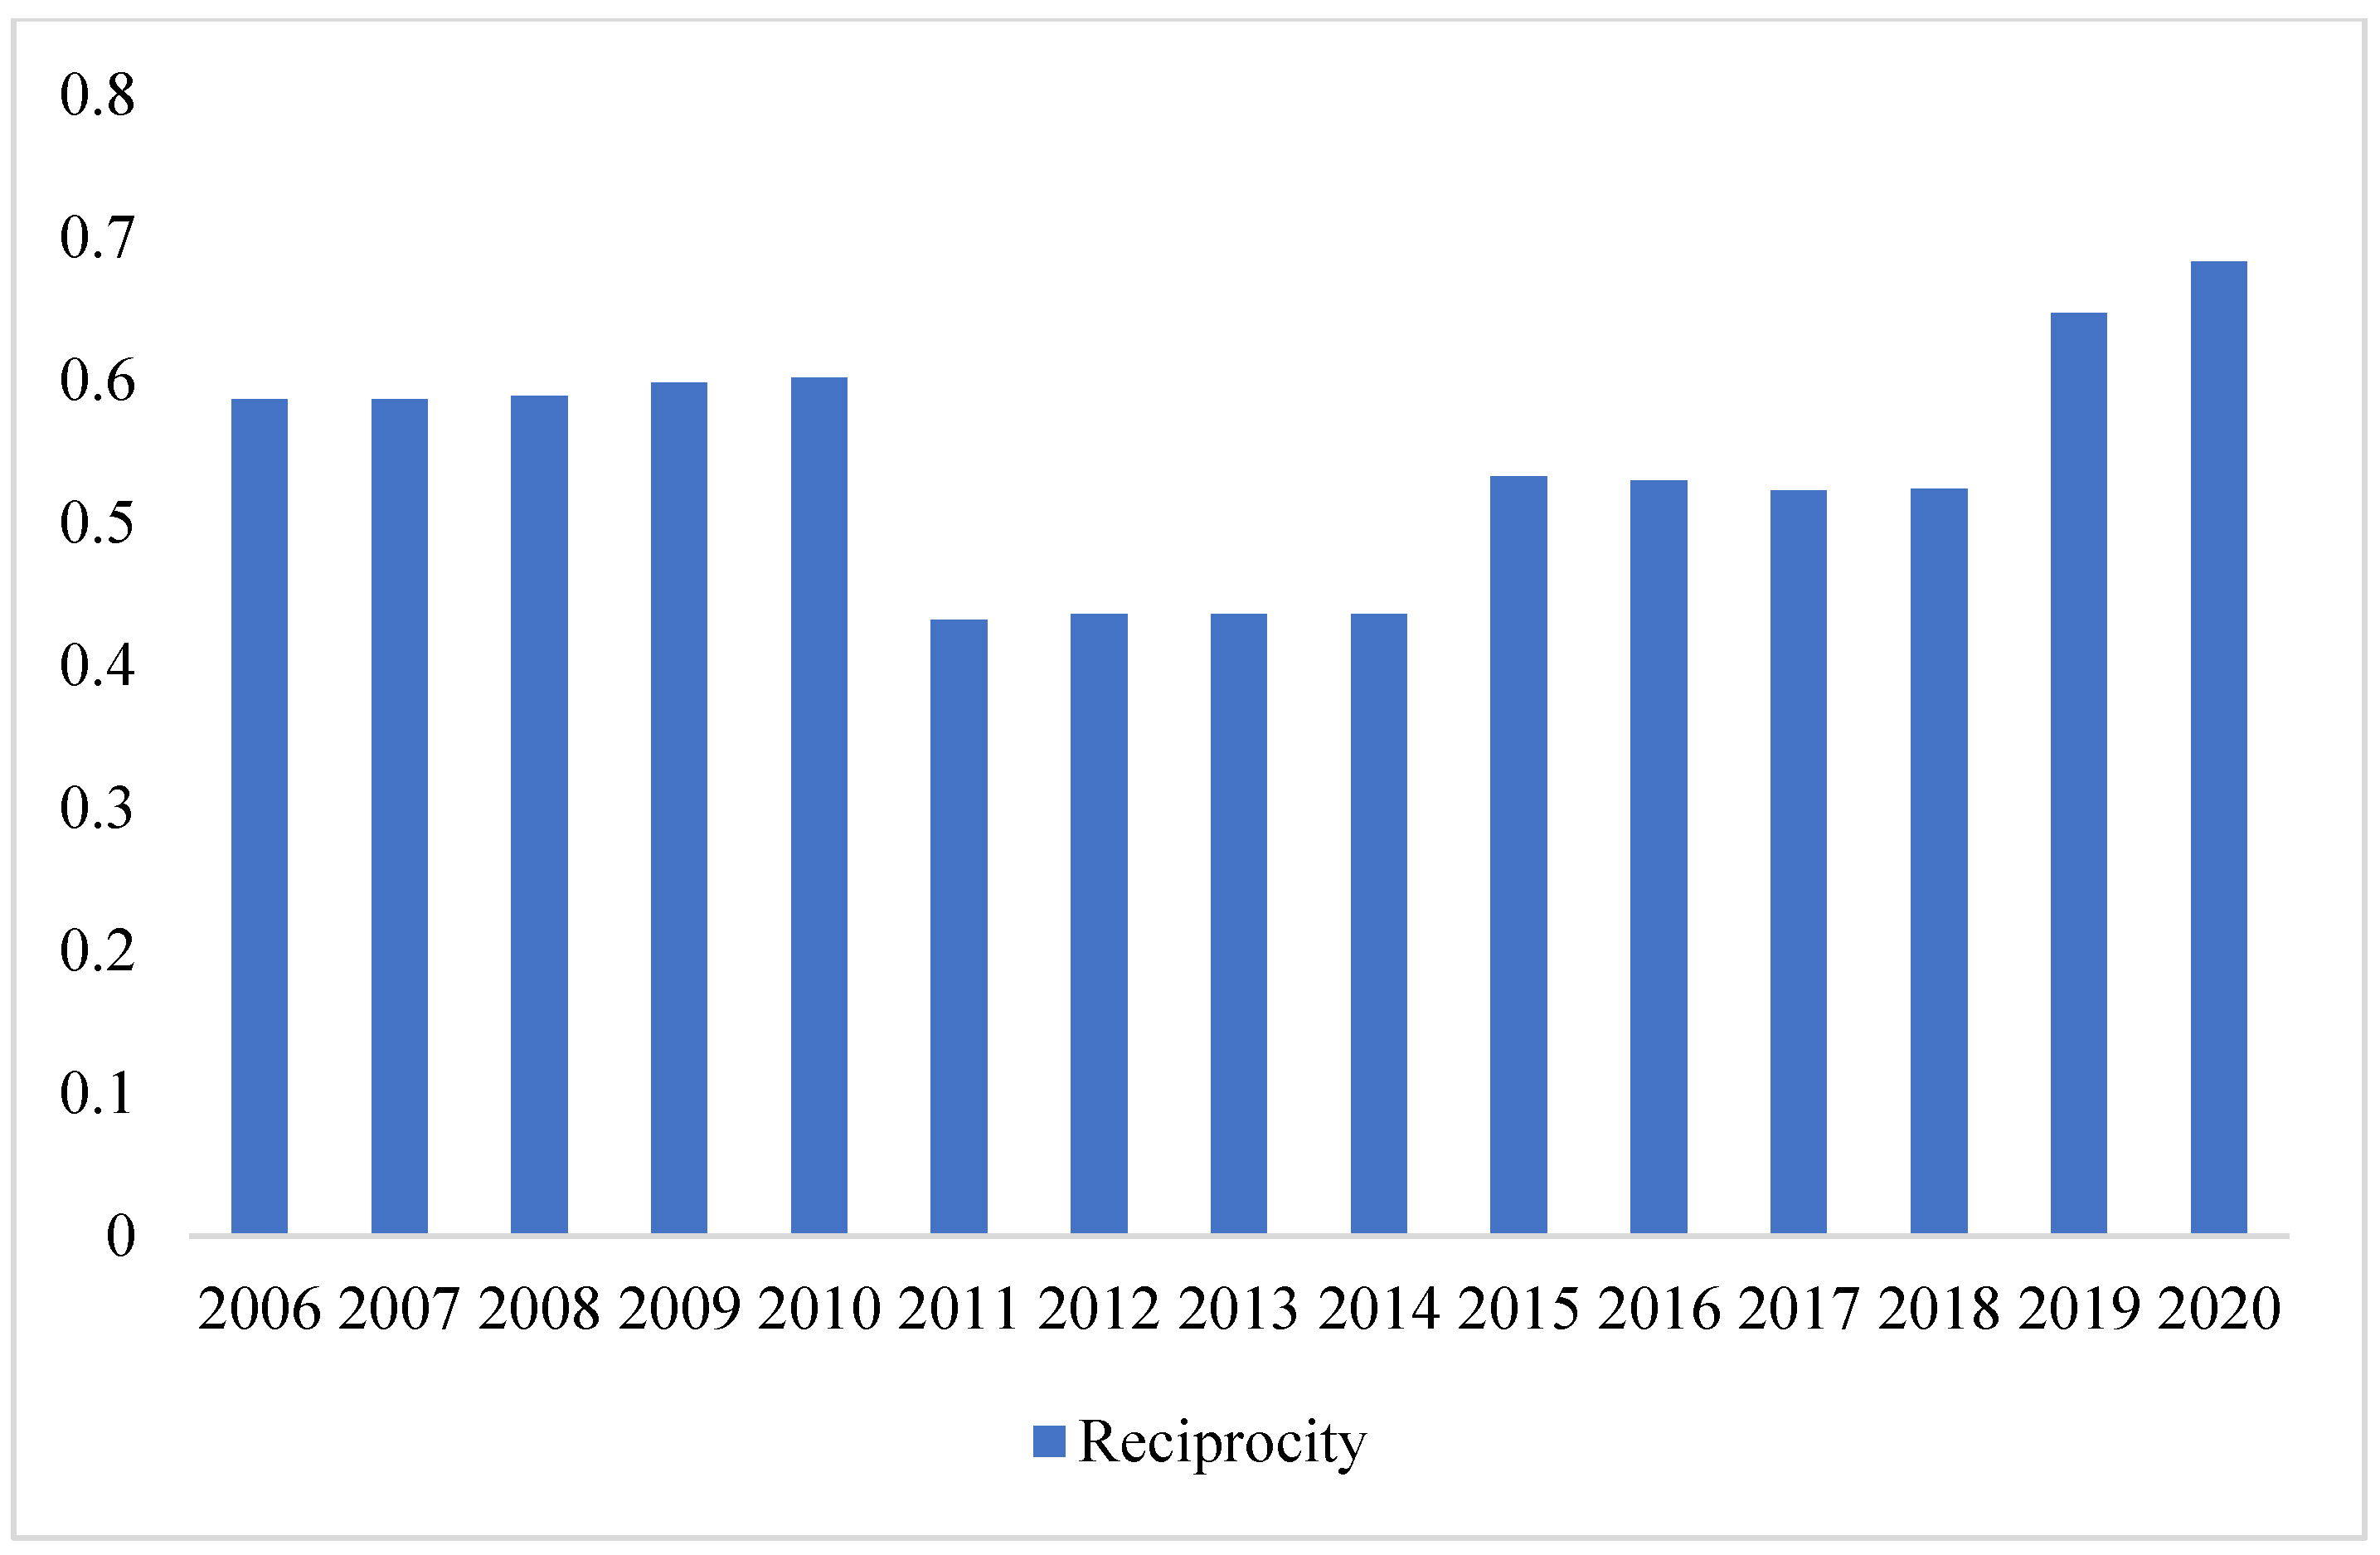
Network reciprocity. As shown in Figure 6, the network of the IGGE in China showed a fluctuant increase in the network reciprocity, which increased from 0.587 in 2006 to 0.683 in 2020. This indicates that the existing relationships in China’s 30 provinces are becoming more stable. Specifically, the reason for the increasing network reciprocity is that the two-way connections were gradually established through the strengthening of regional association, leading to a decrease in one-way connections and an increase in two-way connections in the proportion of the whole network, which makes the network more reciprocal. Briefly, with the expansion and diffusion of the network, the coverage of symmetric relations of the IGGE network continues to expand, which makes the network more stable.

4.2.2. Individual Network Analysis

To judge the role of each province and municipality in the IGGE correlation network, this work analyzed the centrality. Figure 7 shows the comparison between the 2006 and 2020 individual centrality analyses on the 30 Chinese provinces’ IGGE correlation network.
(1)
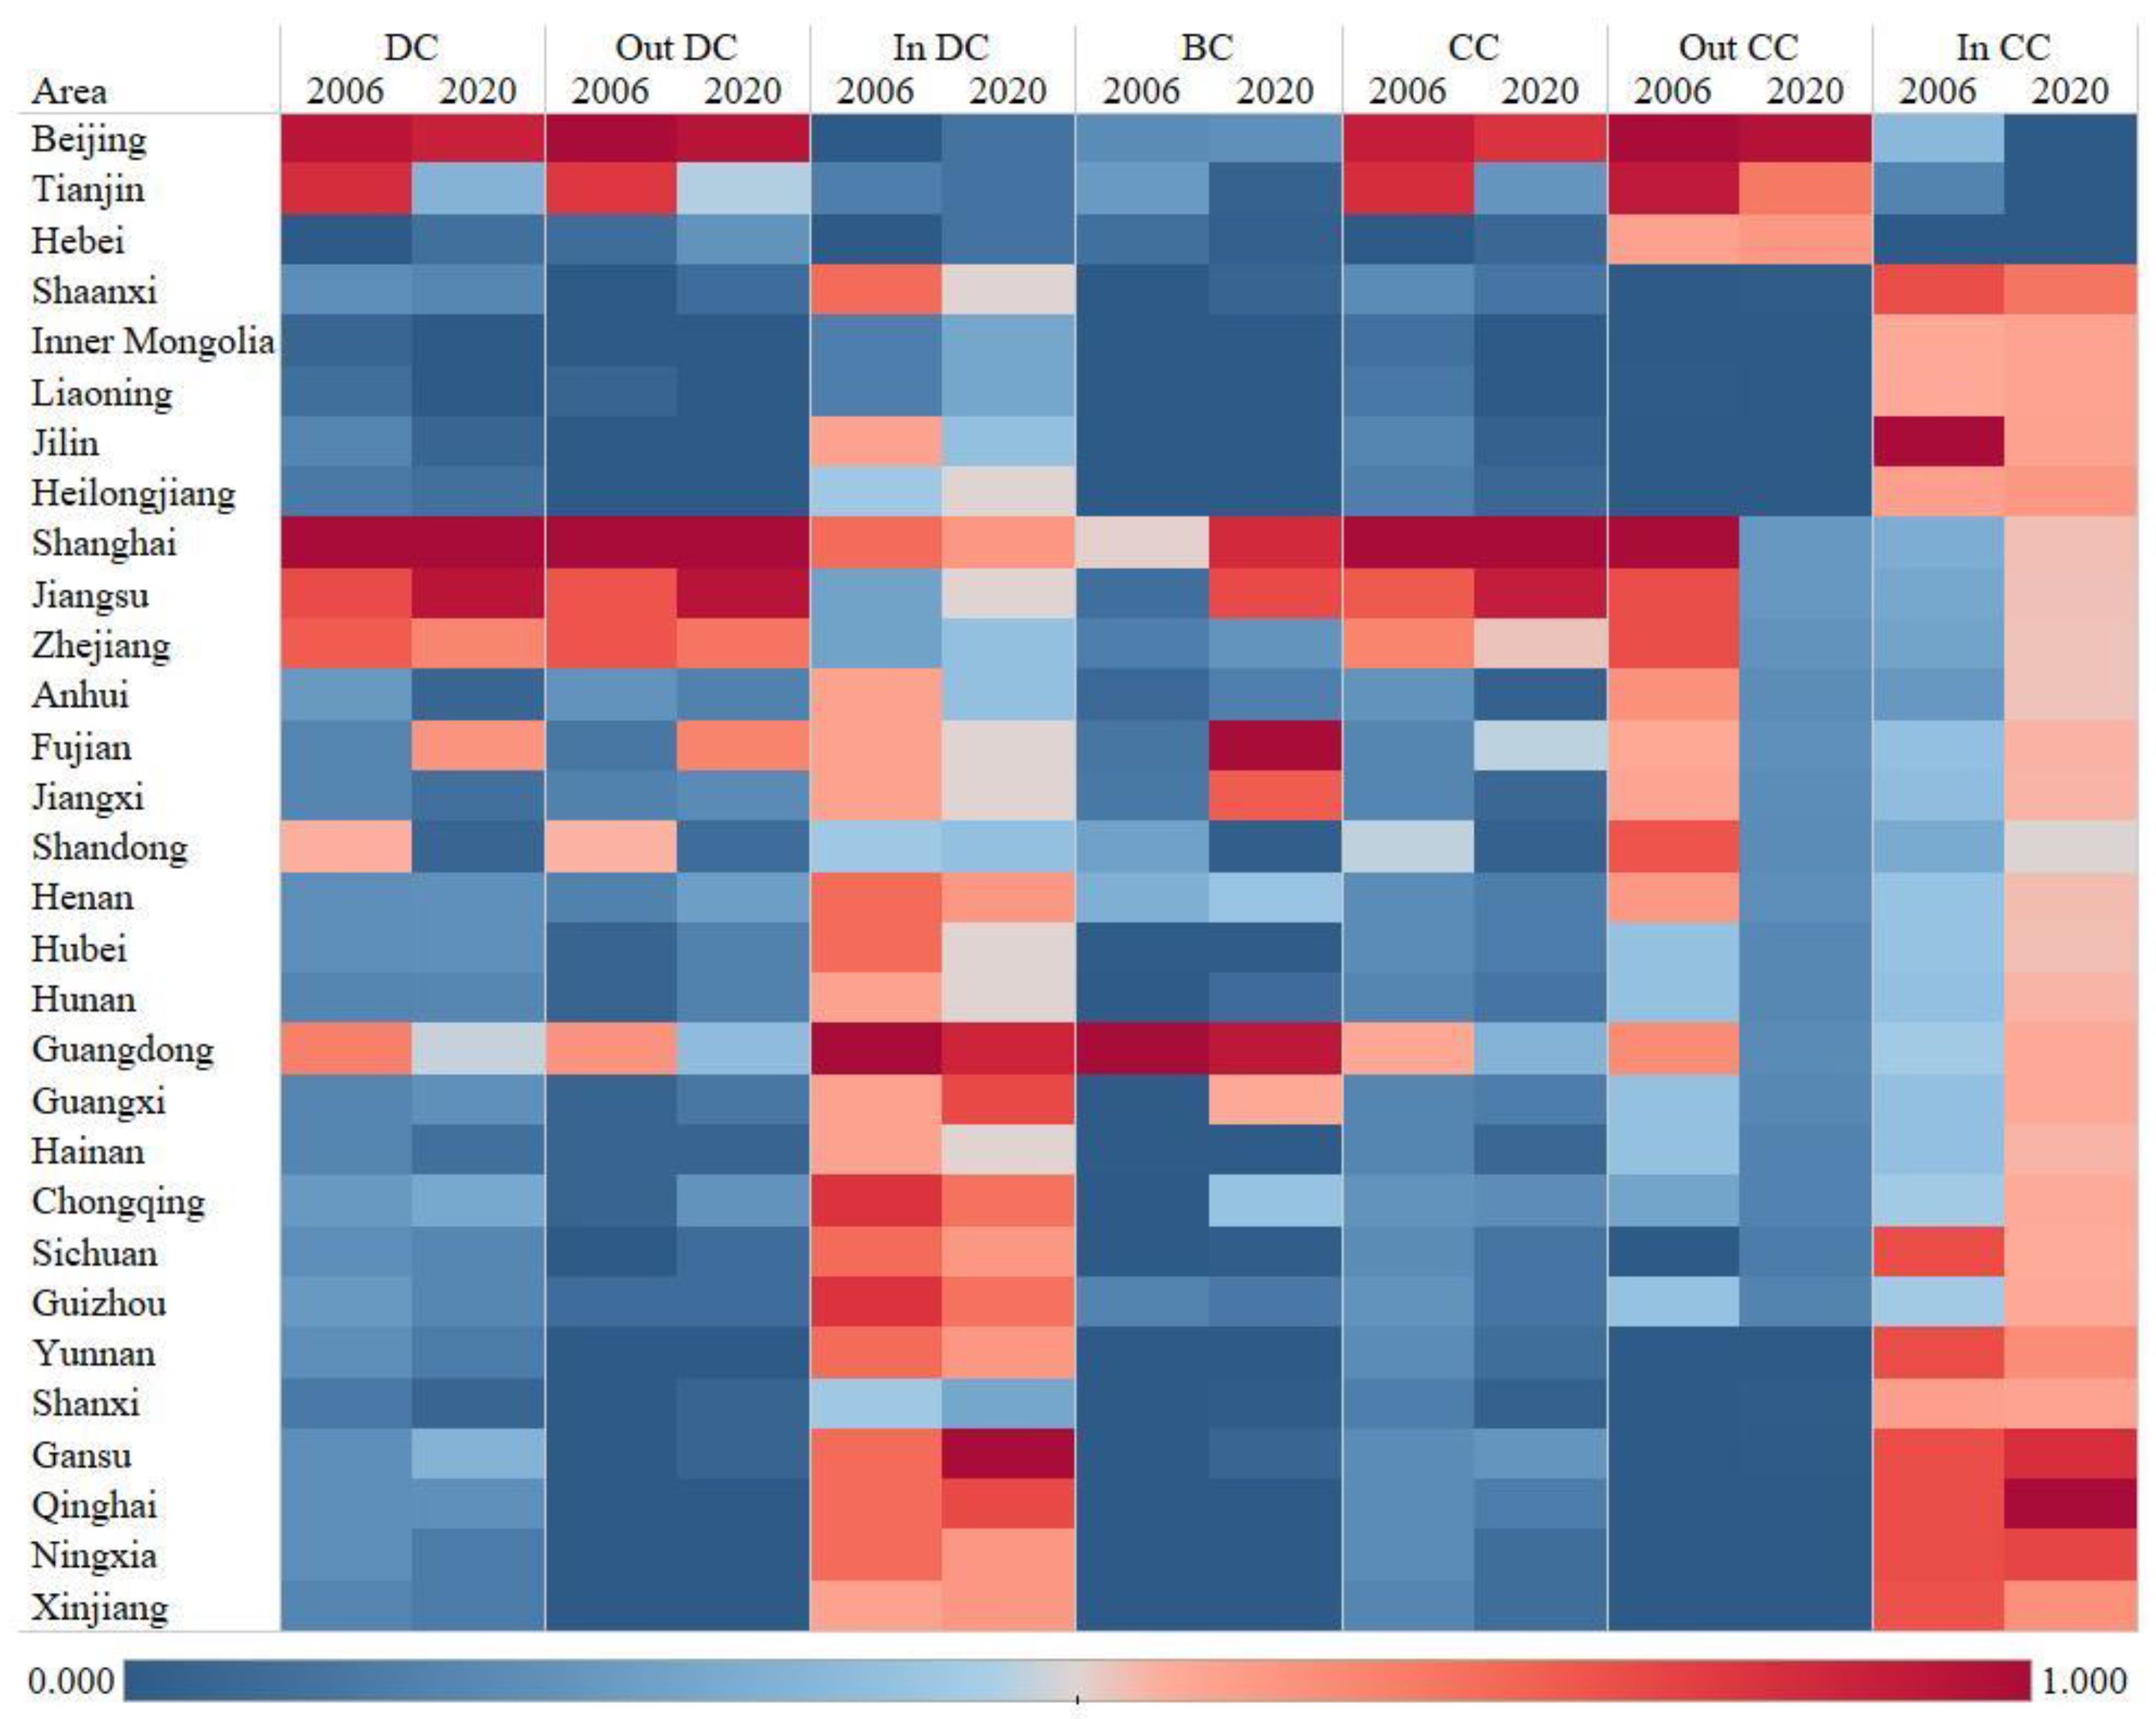
Degree centrality. From 2006 to 2020, the average degree increased from 9.6 to 10.2, and the value field increased from 2–26 to 4–27, which indicates that the regional association aggregation was strengthening. Specifically, in 2006, there were seven regions’ with a higher degree than the average, including Zhejiang, Shandong, Beijing, Tianjin, Shanghai, Jiangsu, and Guangdong. In 2020, nine regions had an above average degree. Compared to 2006, Shandong was excluded, and Gansu, Fujian, and Chongqing were added. Apart from Gansu, the other regions were located in the Yangtze Delta, Pearl River Delta, Beijing–Tianjin–Hebei, and other economically developed areas. The reason was that these regions had a strong economic foundation, innovation ability, and a high attention to clean production, so they stayed at the center of the IGGE correlation network. Whereas, in both years, Shanxi, Inner Mongolia, Hebei, Liaoning, Jilin, and Heilongjiang had lower degrees, indicating that the northeast, northwest and central regions in China stayed at the edge of the network and had less impact on other region’s IGGE. In addition, Qinghai, Guizhou, Guangxi, and Gansu had higher indegrees. In other words, these regions always received green resource spillovers from the other regions. Zhejiang, Beijing, Tianjin, Fujian, Shanghai, Jiangsu, and Guangdong had higher outdegrees, indicating that the regions with a better capital, manpower, and innovation foundation have stronger spillover effects.
(2)
Betweenness centrality. The betweenness centrality represents the degree to which a node acts as the bridge to control the relationship between two other nodes. The higher the value, the stronger the control. From 2006 to 2020, the betweenness centrality decreased from 19.3 to 17.4, with the individual provinces witnessing different trends. Specifically, in 2006, the top five regions in China for the betweenness centrality were Tianjin, Shanghai, Shandong, Henan, and Guangdong, while the top five were Shanghai, Jiangsu, Fujian, Jiangxi, and Guangdong in 2020. The intermediary provinces controlling the flow of resources between the non-adjacent provinces changed during the study period. Specifically, Tianjin and Shandong had the most obvious decline in the betweenness centrality, while Shanghai, Jiangsu, Fujian, Jiangxi, and Guangxi had a reverse trend. The latter regions gradually acted as the “bridge” in the IGGE correlation network, redistributing the resources absorbed from the central region, and gradually becoming the network’s subcenter to overflow to the edge region, which further verified the overall evolution trend in 4.2.1. In addition, the low-ranking regions were Yunnan, Xinjiang, Qinghai, Ningxia, Inner Mongolia, Liaoning, Jilin, and Heilongjiang, and they were all distributed in northwestern and northeastern China. The reason for their low betweenness value could be attributed to geographical remoteness, slow economic development, and weak awareness of environmental protection. Therefore, on the one hand, the government should strengthen the investment in pollution regulation and social welfare in these regions, and on the other hand, promote cooperation between these regions and the sub-central region.
(3)
Closeness centrality. The closeness centrality represents the proximity of a node to all the other nodes in the network. From 2006 to 2020, the out-closeness increased from 7.58 to 7.96 and the in-closeness decreased from 33.15 to 18.97. This trend could be attributed to narrow differences in the regional IGGE. Specifically, in 2020, Zhejiang, Beijing, Tianjin, Jiangsu, and Hebei had a higher out-closeness, indicating that their solid economic foundation, strong innovation ability, good cooperative consciousness, and high green attention could directly affect the other regions. Meanwhile, Shaanxi, Qinghai, Ningxia, and Gansu had a higher in-closeness. In other words, compared to the other provinces, they will be easily impacted by the regions with a higher IGGE. Therefore, further strengthening the partnership between the regions with a higher in-closeness and the regions with a higher out-closeness could improve the IGGE more quickly.

4.2.3. Spatial Distribution Patterns of the IGGE in China

The foregoing analysis of the network manifested that there were significant differences in the network characteristics during the study period.
In order to further analyze and visualize the macro pattern and spatial organization details of the IGGE-related networks, considering the proportion of the provinces at different levels in the total number of provinces, this study divided the IGGE correlation intensity, IGGE, and centrality into four levels according to the order of strength. Meanwhile, in order to further analyze and visualize the distribution pattern and spatial correlation details of the IGGE correlation network, giving consideration to the proportion of the provinces at different levels to the total number of provinces, this work divided the IGGE correlation strength, IGGE, and centrality into four levels according to the order of strength. Then, using the ArcGIS software to visualize the IGGE correlation network, this study further explored the path to improve the IGGE. Figure 8 exhibits the network patterns in 2006 and 2020.
In 2006, most provinces had an above average IGGE, while the correlation strength was low. As the major economic provinces along the eastern coast, Tianjin, Beijing, Shandong, Shanghai, Zhejiang, Jiangsu, Fujian, and Guangdong occupied a dominant position in the network. They were closely related to each other and several central provinces. However, the other provinces were marginal and showed the “isolated island phenomenon”. Figure 8 shows that there was a significant imbalance situation in the network. It was obvious that the eastern coastal area, with a relatively developed economy, rich labor resources, and a high attention to the environment, played a crucial role in the network.
In 2020, compared to 2006, the relative IGGE of each province obviously decreased, while the correlation strength saw a significant boost. Improving the IGGE is still critical, but it is worth noting that cross-regional features are prominent, which means that geographical distance is no longer a determining factor and the spread of the IGGE is no longer confined to the proximity areas. The correlation strength is increased, and the “isolated island” status of the marginal provinces is broken. Some provinces located in the central and western region, such as Henan, Guizhou, Guangxi, Hunan, and Ningxia, are beginning to dominate the IGGE correlation network. In other words, the whole network presents a “multi-center” complex network connection mode, and the IGGE bidirectional flow is obvious. In addition to the eastern provinces, such as Beijing, Shanghai, Jiangsu, Guangdong, and Zhejiang, which have developed economies, rich labor resources, and a strong environmental awareness, the provinces located in the central and western regions, such as Henan, Guangxi, Guizhou, and Ningxia, have also begun to jointly support the radiation effects of the network. Overall, the clustering characteristics of the network are weakened, and the trickle-down effect is enhanced.
In conclusion, the spatial pattern changed significantly between 2006 and 2020. The transformation from the network centered on the eastern coastal provinces to the “multi-center” complex network also conforms to the overall network characteristics of 4.2.1. Hunan, Guizhou, Guangxi, Ningxia, and Henan have broken out of the “isolated islands” state. The IGGE correlation network is developing towards balance. However, there is still a noticeable imbalance among the provinces according to the spatial distribution pattern of the IGGE in 2020. Thus, it is critical to stimulate synergetic development and form a “multi-center, multi-node” spatial pattern.

4.3. Factors Affecting the Spatial Correlations Network

4.3.1. QAP Correlation Analysis

Using 5000 random permutations, this work obtained a correlation analysis between the IGGE correlation matrix and the influencing factors. As presented in Table 5, D was significant at the 1% level and the correlation coefficient was positive, which indicates that there was a greater possibility of correlation between the neighboring provinces. The correlation coefficients of G, T, I, and O were negative, showing that the similarity of the economic, technological development, industrial structure, and opening degree could promote the spatial correlation of the IGGE. In other words, narrowing the forgoing parts of the inter-provincial differences is conducive to realizing the synergistic mechanism of the IGGE improvements among the provinces. The correlation coefficient of E was positive, reflecting that the differentiation of the environmental regulations would promote the spatial correlation of the IGGE, which could be attributed to a high-pollutant industrial transfer from the provinces with rigid environmental regulations to the provinces with loose regulations.
Table 6 shows the correlation between the different variables in this work. The other variables had relationships with the degree of openness under the different significance. O was significantly correlated with G and I at the 1% level. T and O were significant at the 5% level, and D and O were significant at the 5% level. There was a multicollinearity problem between the independent variables. In order to solve this problem, this work used the QAP method to study the following regression analysis.

4.3.2. QAP Regression Analysis

Table 7 presents the regression results of the spatial correlation between the IGGE correlation network and the different influencing factors. The adjusted R2 was 0.342, which indicates that a spatial adjacency relation, economic development, environmental regulation, and degree of openness could explain 34.2% of the spatial relation.
Therefore, the regression coefficients of D, G, and O were large. D and O were significant at the 1% level, which indicates that the network was affected by the geographical location and degree of openness. The regression coefficient of the degree of openness was negative at -0.386, indicating that the similarity of the openness promoted the spatial spillover of the IGGE. The regression coefficient of D was positive, indicating that the adjacent regions were inclined to generate the IGGE spillover. The regression coefficient of E was negative, indicating that differentiation of the environment regulations promoted the spatial spillover of the IGGE. Overall, with the increase in the inter-regional openness, the spatial correlation of the IGGE becomes closer. Meanwhile, the industrial transfer and geographical proximity could improve the spatial correlation effect. Therefore, it is necessary to strengthen the openness and promote domestic and foreign investment, thereby enhancing the synergistic effect of the IGGE among the provinces.

5. Discussion

This work analyzed the IGGE of 30 Chinese provinces and municipalities using the GCE-DEA. Furthermore, it constructed the IGGE correlation network and explored its characteristics and influencing factors in order to optimize the spatial pattern of the IGGE and promote cross-regional coordination.
First, from the perspective of “economic development, social well-being, and environmental transformation” and by establishing the IGGE indicator system and further measuring the IGGE using the GCE-DEA, the results showed a fluctuant and downward trend with significant regional differences. From the methodology used to evaluate the IGGE, Liu et al., 2021, used the GCE-DEA to assess the green growth efficiency [69]. Similar to the findings of Sun et al., 2020, the IGGE in the eastern coastal area was higher than that in the central and western areas [70]. Furthermore, the GCE-DEA used in this work was helpful for discriminating and comparing the multiple regions with an IGGE equal to 1, and the result generally showed that eastern > northeastern > western > central, and that the GCE-DEA model is rational in this work. The method could further be employed to urban scale research for efficiency measurements.
Second, the 30 Chinese provinces’ IGGE had a complex spatial correlation relationship, and the correlation strength saw a growing trend. The previous studies, to some extent, proved that the IGGE had a spatial spillover effect. For example, Zhao et al., 2022, used the super-epsilon-based measure DEA model and the spatial Durbin model to investigate the spatial spillover effect of the IGGE, which helped the provinces with low IGGE levels catch up to high IGGE levels [71]. Therefore, the IGGE of each region was not only influenced by itself, but also by the economic development, industrial structure, environment protection, and other characteristics of the surrounding regions. To some extent, it can explain why the IGGE relationship between the Chinese provinces is becoming increasingly close. However, traditional measurement methods can only reveal the spatial aggregation characteristics of the IGGE and focus on the spillover effect between the neighborhoods [72]. It is difficult to quantify the IGGE relationship between any two regions, especially the cross-region relationship. Therefore, this study failed to characterize the complex network structures of the IGGE. The SNA could solve the foregoing problems by mining each province’s characteristics and roles in the whole network [73]. Liu et al., 2022, used the SNA to explore 31 provinces’ correlation characteristics of their economic value of the green infrastructure spatial correlation network [74]. Yang et al., 2020, employed the SNA to explore the characteristics of a low-carbon innovation spatial correlation network [75]. This work adopted the SNA to investigate the spatial relationship of the IGGE and found that the presented network structure was complex and multi-centered. The points of Yang et al., 2022, could verify our investigation, which note that regional development will cover more isolated areas and gradually become a multi-core network [76]. In other words, with deeper information sharing and cooperation among the provinces, regional development differences would gradually narrow, and the provinces with different IGGE levels would benefit from the network.
Finally, the results showed that the spatial adjacency, economic development, environmental regulation, and degree of openness were the main factors affecting the formation and evolution of the IGGE correlation network. However, the different factors had different influence mechanisms on the network. The regions with a similar openness degree tended to have spatial spillovers on each other. Similarly, Can et al., 2021, confirmed that green openness can stimulate regional environmental sustainability by trading environment-friendly goods [77]. In addition, regarding the geographical proximity, this work agrees with the findings reported by He et al., 2022, who found that the IGGE had a positive spatial correlation [78]. This work also found that narrow economic gaps could promote a regional IGGE correlation. This investigation could be attributed to the characteristics of “a marriage between families of equal social rank”, which means that the regions with similar development conditions are inclined to form a spatial spillover and closer economic ties [79]. This work also confirmed that the differentiation of environmental regulation could enhance the IGGE spillover effects and facilitate more regions to enter the IGGE spatial association network. Huang et al. provided similar findings showing that when the local government introduced policies to develop green transformation, more resources from the other regions would be attracted to the local province [80]. Overall, from the perspective of the network, this work discussed the factors that contributed to the formation and evolution of the IGGE correlation network. By adjusting these factors, the density of the IGGE network can be enhanced, so as to improve the effect of cross-province cooperation.

6. Conclusions and Policy Implications

This work established an evaluation indicator system based on “economic development, social well-being, and environmental transformation” and employed the GCE-DEA to measure the IGGE in China’s 30 provinces for the period of 2006 to 2020. Then, it applied a modified gravity model and the SNA quantified the inter-provincial IGGE spatial spillover effects, revealing the role and status of each region. Finally, a QAP analysis was employed to mine the factors and mechanisms influencing the formation and evolution of the IGGE spatial correlations network. The main research conclusions, policy implications, and limitations are as follows.

6.1. Conclusions

First, the IGGE showed a fluctuating downward trend with a significant regional difference. The provinces located in the southeastern coast, northeastern, and northwestern regions tended to have a higher IGGE than the provinces located in the southern part of the northwest (e.g., Yunnan, Guizhou, and Sichuan) and central regions.
Second, the spatial correlation network of the IGGE in China was complex, multi-threaded, and multi-core. From the overall network structure, the network density increased from 0.197 in 2006 to 0.211 in 2020, indicating the close correlation between the regional IGGE. From the individual network characteristics, Beijing, Tianjin, Zhejiang, Shanghai, Jiangsu, and Guangdong played the role of the “net spillover” block. Qinghai, Guizhou, Guangxi, and the surrounding provinces played the role of “primary beneficial”. The Yangtze Delta and Pearl River Delta (primarily including Shanghai and Guangdong) were the “bridge” connecting the Yunnan–Guizhou region and the neighboring provinces.
Finally, the spatial adjacency relation, degree of openness, economic development, and environmental governance were significantly related to the IGGE spatial correlation network. Specifically, the geographical proximity, similarity in openness, and economic development stimulated the spatial spillover of the IGGE. On the contrary, the differentiation of environment regulations promoted the spatial spillover of IGGE.

6.2. Policy Implications

First, we must pay more attention to the spatial correlation characteristics of the IGGE. The precondition for governments to formulate an adaptive development policy is to accurately grasp the spatial spillover effect and spatial correlation of the regions’ IGGE. Meanwhile, it is necessary to improve China’s IGGE by strengthening the spatial correlation, which calls for every region to join the IGGE correlation network gradually. Furthermore, the provinces should actively establish cooperative relations and break regional administrative barriers, thereby improving the network’s robustness.
Second, local governments should fully recognize the status and role of the provinces in the IGGE correlation network. The “central provinces” could continuously improve their own IGGE level while driving the development of the other provinces. The “intermediary provinces” need to further strengthen their ability to absorb the resources from the spillover provinces, so as to continuously improve their own IGGE level and strive to improve the spillover capacity. Additionally, the mutual cooperative relationships between the “marginal provinces” and the “central provinces” must be strengthened, thereby improving the IGGE of the “marginal provinces”.
Finally, cooperation between the regions should be strengthened to enhance the IGGE network relevance and promote regional synergetic development. To realize the synergetic development of the IGGE, it is critical to ensure that every province participates in the IGGE correlation network and stimulates the synergy to promote the overall IGGE. Narrowing the economic gaps of the various regions, accelerating the improvement and development of the transport infrastructure, and enhancing openness will help improve the efficiency of the factor flows, expand the path of the international transport infrastructure spillover, and promote China’s balanced and coordinated development.

6.3. Limitations

There are some inevitable limitations to this study. In the future, we will carry out research using the following aspects. (1) More effort will be put into investigating the city-level IGGE network and combining the complex social network with economics to discuss inclusive green growth. (2) We could further decompose the time series into different subseries, study the evolution of the spatial networks during different time periods, and dynamically explore the impact mechanism of the different influencing factors on the IGGE spatial correlation network. (3) The robustness of the correlations of the IGGE between the provinces obtained using the modified gravity model needs further verification. We hope that better methods can be found to verify this in the future.

Author Contributions

B.L.: conceptualization, methodology, data curation, writing—original draft. J.L.: conceptualization, review, supervision. X.Y. and C.L.: review, visualization. J.D. and M.X.: resources, visualization. All authors have read and agreed to the published version of the manuscript.

Funding

This research was funded by Tianjin Science and Technology Planning Project of China, grant number 21ZLZKZF00290.

Institutional Review Board Statement

Not applicable.

Informed Consent Statement

Not applicable.

Data Availability Statement

All data and models generated or used in the research process of this paper are presented and explained in the body of the article.

Conflicts of Interest

The authors declare that they have no known competing financial interests or personal relationships that could have appeared to influence the work reported in this paper.

References

  1. World Bank. Inclusive Green Growth; World Bank Publications: Washington, DC, USA, 2012. [Google Scholar]
  2. Ofori, I.K.; Gbolonyo, E.Y.; Ojong, N. Towards inclusive green growth in Africa: Critical energy efficiency synergies and governance thresholds. J. Clean. Prod. 2022, 369, 132917. [Google Scholar] [CrossRef]
  3. Wang, D.; Hou, Y.; Li, X.; Xu, Y. Developing a functional index to dynamically examine the spatio-temporal disparities of China’s inclusive green growth. Ecol. Indic. 2022, 139, 108861. [Google Scholar] [CrossRef]
  4. Ghaffarpasand, O.; Talaie, M.R.; Ahmadikia, H.; TalaieKhozani, A.; Shalamzari, M.D.; Majidi, S. How does unsustainable urbanization affect driving behavior and vehicular emissions? Evidence from Iran. Sustain. Cities Soc. 2021, 72, 103065. [Google Scholar] [CrossRef]
  5. Kassouri, Y. Monitoring the spatial spillover effects of urbanization on water, built-up land and ecological footprints in sub-Saharan Africa. J. Environ. Manag. 2021, 300, 113690. [Google Scholar] [CrossRef] [PubMed]
  6. Albagoury, S. Inclusive Green Growth in Africa: Ethiopia Case Study; University Library of Munich: Munich, Germany, 2016. [Google Scholar]
  7. Rammelt, C.F.; Gupta, J. Inclusive is not an adjective, it transforms development: A post-growth interpretation of Inclusive Development. Environ. Sci. Policy 2021, 124, 144–155. [Google Scholar] [CrossRef]
  8. Kofi, E.B. Institutional quality, green innovation and energy efficiency. Energy Policy 2019, 135, 111002. [Google Scholar]
  9. Gu, K.; Dong, F.; Sun, H.; Zhou, Y. How economic policy uncertainty processes impact on inclusive green growth in emerging industrialized countries: A case study of China. J. Clean. Prod. 2021, 322, 128963. [Google Scholar] [CrossRef]
  10. Filippini, M.; Hunt, L.C. Energy Demand and Energy Efficiency in the OECD Countries: A Stochastic Demand Frontier Approach. Energy J. 2011, 32, 59–80. [Google Scholar] [CrossRef] [Green Version]
  11. Arabmaldar, A.; Jablonsky, J.; Hosseinzadeh Saljooghi, F. A new robust DEA model and super-efficiency measure. Optim. A J. Math. Program. Oper. Res. 2017, 131, 723–736. [Google Scholar] [CrossRef]
  12. Jin, P.; Peng, C.; Song, M. Macroeconomic uncertainty, high-level innovation, and urban green development performance in China. China Econ. Rev. 2019, 55, 1–18. [Google Scholar] [CrossRef]
  13. Henriques, I.C.; Sobreiro, V.A.; Kimura, H.; Mariano, E.B. Two-stage DEA in banks: Terminological controversies and future directions. Expert Syst. Appl. 2020, 161, 113632. [Google Scholar] [CrossRef] [PubMed]
  14. Zhao, X.; Ma, X.; Shang, Y.; Yang, Z.; Shahzad, U. Green economic growth and its inherent driving factors in Chinese cities: Based on the Metafrontier-global-SBM super-efficiency DEA model. Gondwana Res. 2022, 106, 315–328. [Google Scholar] [CrossRef]
  15. Dordmond, G.; de Oliveira, H.C.; Silva, I.R.; Swart, J. The complexity of green job creation: An analysis of green job development in Brazil. Environ. Dev. Sustain. 2020, 23, 723–746. [Google Scholar] [CrossRef]
  16. Liu, N.; Wang, Y. Urban Agglomeration Ecological Welfare Performance and Spatial Convergence Research in the Yellow River Basin. Land 2022, 11, 2073. [Google Scholar] [CrossRef]
  17. Xia, M.; Li, J. Assessment of ecological well-being performance and its spatial correlation analysis in the Beijing-Tianjin-Hebei urban agglomeration. J. Clean. Prod. 2022, 362, 132621. [Google Scholar] [CrossRef]
  18. Gibbs, D.; O’Neill, K. Future green economies and regional development: A research agenda. Reg. Stud. 2016, 51, 161–173. [Google Scholar] [CrossRef]
  19. Andrew, R.M.; Peters, G. A multi-region input–output table based on the global trade analysis project database (GTAP-MRIO). Econ. Syst. Res. 2013, 25, 99–121. [Google Scholar] [CrossRef]
  20. Nuss, P.; Chen, W.Q.; Ohno, H.; Graedel, T.E. Structural Investigation of Aluminum in the U.S. Economy using Network Analysis. Environ. Sci. Technol. 2016, 50, 4091–4101. [Google Scholar] [CrossRef]
  21. Cao, J. The dynamic coupling nexus among inclusive green growth: A case study in Anhui province, China. Environ. Sci. Pollut. Res. 2022, 29, 49194–49213. [Google Scholar] [CrossRef] [PubMed]
  22. Khoshnava, B.; Farahani, M.; Khanipour, H. Comparing the Impacts of Education, Feedback, and Hypocrisy Induction Intervention Methods on Electrical Energy Conservation Attitude, Intentions and Behavior. J. Appl. Psychol. Res. 2021, 12, 23–41. [Google Scholar]
  23. Sandberg, M.; Klockars Wilen, K. Green growth or degrowth? Assessing the normative justifications for environmental sustainability and economic growth through critical social theory. J. Clean. Prod. 2018, 206, 133–141. [Google Scholar] [CrossRef]
  24. Barbier, E.B.; Markandya, A. A New Blueprint for a Green Economy; Routledge: London, UK, 2013. [Google Scholar]
  25. Sterner, T.; Damon, M. Green growth in the post-Copenhagen climate. Energy Policy 2011, 39, 7165–7173. [Google Scholar] [CrossRef]
  26. Ali, I.; Zhuang, J. Inclusive Growth toward a Prosperous Asia: Policy Implications; Asian Development Bank: Manila, Philippines, 2007. [Google Scholar]
  27. Ianchovichina, E.; Lundstrom, S. Inclusive Growth Analytics: Framework and Application; The World Bank: Washington, DC, USA, 2009. [Google Scholar] [CrossRef]
  28. Whajah, J.; Bokpin, G.A.; Kuttu, S. Government size, public debt and inclusive growth in Africa. Res. Int. Bus. Financ. 2019, 49, 225–240. [Google Scholar] [CrossRef]
  29. Baniya, B.; Giurco, D.; Kelly, S. Green growth in Nepal and Bangladesh: Empirical analysis and future prospects. Energy Policy 2021, 149, 112049. [Google Scholar] [CrossRef]
  30. Sun, H.; Mao, W.; Dang, Y.; Luo, D. What inhibits regional inclusive green growth? Empirical evidence from China. Environ. Sci. Pollut. Res. 2022, 29, 39790–39806. [Google Scholar] [CrossRef] [PubMed]
  31. Wang, N.; Ullah, A.; Lin, X.; Zhang, T.; Mao, J. Dynamic Influence of Urbanization on Inclusive Green Growth in Belt and Road Countries: The Moderating Role of Governance. Sustainability 2022, 14, 11623. [Google Scholar] [CrossRef]
  32. Ojha, V.P.; Pohit, S.; Ghosh, J. Recycling carbon tax for inclusive green growth: A CGE analysis of India. Energy Policy 2020, 144, 111708. [Google Scholar] [CrossRef]
  33. Chames, A.; Cooper, W.; Phodes, E. Easuring the Efficiency of DMU. Eur. J. Oper. Res. 1978, 11, 429–444. [Google Scholar]
  34. Cui, Q.; Li, Y. An empirical study on the influencing factors of transportation carbon efficiency: Evidences from fifteen countries. Appl. Energy 2015, 141, 209–217. [Google Scholar] [CrossRef]
  35. Ignatius, J.; Ghasemi, M.-R.; Zhang, F.; Emrouznejad, A.; Hatami-Marbini, A. Carbon efficiency evaluation: An analytical framework using fuzzy DEA. Eur. J. Oper. Res. 2016, 253, 428–440. [Google Scholar] [CrossRef]
  36. Wang, F.; Wu, J.; Wu, M.; Zheng, W.; Huang, D. Has the Economic Structure Optimization in China’s Supply-Side Structural Reform Improved the Inclusive Green Total Factor Productivity? Sustainability 2021, 13, 12911. [Google Scholar] [CrossRef]
  37. Guan, Y.; Wang, H.; Guan, R.; Ding, L. Measuring inclusive green total factor productivity from urban level in China. Front. Environ. Sci. 2022, 10, 966246. [Google Scholar] [CrossRef]
  38. Sexton, T.R.; Silkman, R.H.; Hogan, A.J. Data envelopment analysis: Critique and extensions. New Dir. Program Eval. 1986, 1986, 73–105. [Google Scholar] [CrossRef]
  39. Cook, W.D.; Zhu, J. DEA Cobb–Douglas frontier and cross-efficiency. J. Oper. Res. Soc. 2014, 65, 265–268. [Google Scholar] [CrossRef]
  40. Amin, G.R.; Hajjami, M. Improving DEA cross-efficiency optimization in portfolio selection. Expert Syst. Appl. 2020, 168, 114280. [Google Scholar] [CrossRef]
  41. Liu, W.; Wang, Y.M.; Lv, S. An aggressive game cross-efficiency evaluation in data envelopment analysis. Ann. Oper. Res. 2017, 259, 241–258. [Google Scholar] [CrossRef]
  42. Dotoli, M.; Epicoco, N.; Falagario, M.; Sciancalepore, F. A stochastic cross-efficiency data envelopment analysis approach for supplier selection under uncertainty. Int. Trans. Oper. Res. 2015, 23, 725–748. [Google Scholar] [CrossRef]
  43. Wichapa, N.; Sodsoon, S. A Novel Multi-Objective Game IDEA Cross-Efficiency Method Based on Boolean Possibility Degree for Ranking Biomass Materials with Interval Data. IEEE Access 2022, 10, 96626–96642. [Google Scholar] [CrossRef]
  44. Machado, L.G.; de Mello, J.C.S.; Roboredo, M. Efficiency Evaluation of Brazilian Electrical Distributors Using DEA Game and Cluster Analysis. IEEE Lat. Am. Trans. 2016, 14, 4499–4505. [Google Scholar] [CrossRef]
  45. Li, F.; Zhu, Q.; Liang, L. Allocating a fixed cost based on a DEA-game cross efficiency approach. Expert Syst. Appl. 2018, 96, 196–207. [Google Scholar] [CrossRef]
  46. Essid, H.; Ganouati, J.; Vigeant, S. A mean-maverick game cross-efficiency approach to portfolio selection: An application to Paris stock exchange. Expert Syst. Appl. 2018, 113, 161–185. [Google Scholar] [CrossRef]
  47. Wu, J.; Liang, L.; Chen, Y. DEA game cross-efficiency approach to Olympic rankings. Omega 2009, 37, 909–918. [Google Scholar] [CrossRef]
  48. Wang, M.; Huang, Y.; Li, D. Assessing the performance of industrial water resource utilization systems in China based on a two-stage DEA approach with game cross efficiency. J. Clean. Prod. 2021, 312, 127722. [Google Scholar] [CrossRef]
  49. Chen, S.; Golley, J. Green’ productivity growth in China’s industrial economy. Energy Econ. 2014, 44, 89–98. [Google Scholar] [CrossRef]
  50. Yang, Z.; Wei, X. The measurement and influences of China’s urban total factor energy efficiency under environmental pollution: Based on the game cross-efficiency DEA. J. Clean. Prod. 2018, 209, 439–450. [Google Scholar] [CrossRef]
  51. Wang, L.; Song, X.; Song, X. Research on the measurement and spatial-temporal difference analysis of energy efficiency in China’s construction industry based on a game cross-efficiency model. J. Clean. Prod. 2020, 278, 123918. [Google Scholar] [CrossRef]
  52. Shen, Y.; Fan, S.; Liu, L. Study on Measurement and Drivers of Inclusive Green Efficiency in China. J. Sens. 2022, 2022, 3162465. [Google Scholar] [CrossRef]
  53. Liu, Z.; Li, R.; Zhang, X.T.; Shen, Y.; Yang, L.; Zhang, X. Inclusive Green Growth and Regional Disparities: Evidence from China. Sustainability 2021, 13, 11651. [Google Scholar] [CrossRef]
  54. Sun, L.; Han, Y. Spatial Correlation Network Structure and Influencing Factors of Two-Stage Green Innovation Efficiency: Evidence from China. Sustainability 2022, 14, 11584. [Google Scholar] [CrossRef]
  55. He, Y.-Y.; Wei, Z.-X.; Liu, G.-Q.; Zhou, P. Spatial network analysis of carbon emissions from the electricity sector in China. J. Clean. Prod. 2020, 262, 121193. [Google Scholar] [CrossRef]
  56. Yang, Z. Book review: The Geographical Transformation of China. Prog. Hum. Geogr. 2016, 41, 697–699. [Google Scholar] [CrossRef]
  57. Wang, J.; Bai, Y.; Wurihan, Y.; Li, Z.; Deng, X.; Islam, M.; Managi, S. Measuring inclusive wealth of China: Advances in sustainable use of resources. J. Environ. Manag. 2020, 264, 110328. [Google Scholar]
  58. Berkhout, E.; Bouma, J.; Terzidis, N.; Voors, M. Supporting local institutions for inclusive green growth: Developing an Evidence Gap Map. NJAS—Wagening. J. Life Sci. 2018, 84, 51–71. [Google Scholar] [CrossRef]
  59. Brand, U.; Boos, T.; Brad, A. Degrowth and post-extractivism: Two debates with suggestions for the inclusive development framework. Curr. Opin. Environ. Sustain. 2017, 24, 36–41. [Google Scholar] [CrossRef]
  60. Tarp, F.; Resnick, D.; Thurlow, J. The Political Economy of Green Growth: Illustrations from Southern Africa. WIDER Work. Pap. Ser. 2012, 32, 215–228. [Google Scholar]
  61. Ma, L.; Long, H.; Chen, K.; Tu, S.; Zhang, Y.; Liao, L. Green growth efficiency of Chinese cities and its spatio-temporal pattern. Resour. Conserv. Recycl. 2019, 146, 441–451. [Google Scholar] [CrossRef]
  62. Bolívar, M.P.R.; Galera, A.N.; Muñoz, L.A.; Subirés, M.D.L. Risk Factors and Drivers of Financial Sustainability in Local Government: An Empirical Study. Local Gov. Stud. 2015, 42, 29–51. [Google Scholar] [CrossRef]
  63. Liang, L.; Wu, J.; Cook, W.D.; Zhu, J. The DEA Game Cross-Efficiency Model and Its Nash Equilibrium. Oper. Res. J. Oper. Res. Soc. Am. 2008, 56, 1278–1288. [Google Scholar] [CrossRef] [Green Version]
  64. Xie, Z.; Wu, R.; Wang, S. How technological progress affects the carbon emission efficiency? Evidence from national panel quantile regression. J. Clean. Prod. 2021, 307, 127133. [Google Scholar] [CrossRef]
  65. Scott, J. What is Social Network Analysis? Bloomsbury Academic: New York, NY, USA, 2012; p. 114. [Google Scholar]
  66. Zeng, W.; Li, L.; Huang, Y. Industrial collaborative agglomeration, marketization, and green innovation: Evidence from China's provincial panel data. J. Clean. Prod. 2020, 279, 123598. [Google Scholar] [CrossRef]
  67. Liu, Y.; Shao, X.; Tang, M.; Lan, H. Spatio-temporal evolution of green innovation network and its multidimensional proximity analysis: Empirical evidence from China. J. Clean. Prod. 2020, 283, 124649. [Google Scholar] [CrossRef]
  68. Liu, S.; Xiao, Q. An empirical analysis on spatial correlation investigation of industrial carbon emissions using SNA-ICE model. Energy 2021, 224, 120183. [Google Scholar] [CrossRef]
  69. Liu, Y.; Dong, F. How technological innovation impacts urban green economy efficiency in emerging economies: A case study of 278 Chinese cities. Resour. Conserv. Recycl. 2021, 169, 105534. [Google Scholar] [CrossRef]
  70. Sun, Y.; Ding, W.; Yang, Z.; Yang, G.; Du, J. Measuring China’s regional inclusive green growth. Sci. Total Environ. 2020, 713, 136367. [Google Scholar] [CrossRef] [PubMed]
  71. Zhao, L.; Gao, X.; Jia, J.; Zhang, Y. Analyzing inclusive green growth in China: A perspective of relative efficiency. Environ. Sci. Pollut. Res. 2022, 30, 16017–16035. [Google Scholar] [CrossRef]
  72. Fan, S.; Huang, H.; Mbanyele, W.; Guo, Z.; Zhang, C. Inclusive green growth for sustainable development of cities in China: Spatiotemporal differences and influencing factors. Environ. Sci. Pollut. Res. 2022, 30, 11025–11045. [Google Scholar] [CrossRef]
  73. Chen, X.; Wang, T.; Zheng, X.; Han, F.; Yang, Z. The Structure and Evolution of the Tourism Economic Network of the Tibetan Plateau and Its Driving Factors. Land 2022, 11, 241. [Google Scholar] [CrossRef]
  74. Liu, S.; Wang, Y.; Yang, P.; Chevallier, J.; Xiao, Q. Spatial correlation effects of the economic value of green infrastructure (EVGI) on social network: Evidence from China. J. Clean. Prod. 2022, 338, 130620. [Google Scholar] [CrossRef]
  75. Yang, C.; Liu, S. Spatial correlation analysis of low-carbon innovation: A case study of manufacturing patents in China. J. Clean. Prod. 2020, 273, 122893. [Google Scholar] [CrossRef]
  76. Yang, L.; Wang, J.; Yang, Y. Spatial evolution and growth mechanism of urban networks in western China: A multi-scale perspective. J. Geogr. Sci. 2022, 32, 517–536. [Google Scholar] [CrossRef]
  77. Can, M.; Ahmed, Z.; Mercan, M.; Kalugina, O.A. The role of trading environment-friendly goods in environmental sustainability: Does green openness matter for OECD countries? J. Environ. Manag. 2021, 295, 113038. [Google Scholar] [CrossRef] [PubMed]
  78. He, Q.; Du, J. The impact of urban land misallocation on inclusive green growth efficiency: Evidence from China. Environ. Sci. Pollut. Res. 2022, 29, 3575–3586. [Google Scholar] [CrossRef] [PubMed]
  79. Li, J.; Chen, S.; Wan, G.H.; Fu, C.M. Study on the spatial correlation and explanation of regional economic growth in China-based on analytic network process. Econ. Res. J. 2014, 11, 4–16. [Google Scholar]
  80. Huang, Z.; He, C.; Li, H. Local government intervention, firm–government connection, and industrial land expansion in China. J. Urban Aff. 2017, 41, 206–222. [Google Scholar] [CrossRef]
Figure 1. Geographical distribution of the four regions in China.
Land 12 00692 g001
Figure 2. The evaluation trend of the IGGE in national and four regions, 2006–2020.
Land 12 00692 g002
Figure 3. Distribution of China’s provincial IGGE. (A) China’s provincial IGGE in 2006 and China’s provincial IGGE in 2011. (B) China’s provincial IGGE in 2016 and China’s provincial IGGE in 2020.
Land 12 00692 g003
Figure 4. Spatial correlation network of China’s provincial IGGE, 2006–2020. (A) Spatial correlation network in 2006 and spatial correlation network in 2011. (B) Spatial correlation network in 2016 and spatial correlation network in 2020.
Land 12 00692 g004aLand 12 00692 g004b
Figure 5. Linkage intensity of the IGGE spatial correlation network, 2006–2020.
Land 12 00692 g005
Figure 6. Reciprocity of the IGGE spatial correlation network, 2006–2020.
Land 12 00692 g006
Figure 7. Individual centrality analysis of the IGGE correlation network. Note that DC represents the degree centrality, BC represents the betweenness centrality, and CC represents the closeness centrality. All the indicators are standardized.
Land 12 00692 g007
Figure 8. Spatial distribution pattern of the IGGE in 2006 (A) and 2020 (B).
Land 12 00692 g008
Table 1. Evaluation indicator system of the IGGE in China.
TypeVariableData Explanation
Input indexesCapital (10,000 Yuan)The total investment in fixed assets of the whole society. Eliminated price factors are based on 2003.
Labor (10,000 people)All employed persons of the whole society at the end of the period.
Energy (10,000 tons of standard coal)Eight primary energy consumptions (coal, coke, crude oil, gasoline, diesel, kerosene, fuel oil and natural gas) are converted into 10,000 t of standard coal to calculate the energy input.
Desirable Output indexesRegional GDP (10,000 Yuan)The constant price GDP was obtained with 2003 as the base year.
Per capita consumption expenditure (10,000 Yuan)The per capita consumption expenditure of the residents.
Green coverage ratio (%)Green covered area as % of the completed area.
Undesirable outputWastewater (10,000 tons)The total discharge of the industrial and domestic wastewater.
Sulfur Dioxide (tons)The total amount of sulfur dioxide emissions.
Industrial Soot (tons)The total amount of industrial smoke (dust) emissions.
Table 2. Calculation methods of the social network characteristics.
Network CharacteristicsDescription
Overall network characteristicNetwork density D = M / N ( N 1 ) , M is the sum of all actual network connections, N is the number of nodes in the network.
The higher the density, the closer the IGGE network, and the stronger the overall coordination state of the network.
Network reciprocityThe number of bidirectional connections as a percentage of all connections. The higher the network reciprocity, the more stable the IGGE correlation network.
CentralityDegree centrality D e = L / [ N ( N 1 ) 1 ] , L is the number of nodes directly associated with the node.
A province with a higher degree centrality has more connections to other provinces and is more likely to become the center of the network.
Betweenness centrality C b = j n k n b j k ( i ) , j ≠ k ≠ i, j < k, b j k ( i ) is the ability of node i to control
the connection between nodes j and k.
The higher the betweenness centrality of a province, the stronger the province’s influence on inter-provincial IGGE interaction and the stronger the synergistic effect on inter-provincial development.
Closeness centrality C c = j = 1 n d i j / N 1 , dij is the distance between nodes i and j.
Closeness centrality reflects the degree to which each province in the network is not controlled by the others.
Table 3. Variables and indicators.
VariableIndicatorsVariable Description
Dependent variableIGGE correlation network (N)Spatial correlation matrix of the IGGE
IndependentvariablesSpatial adjacency (D)Spatial adjacency matrix
Economic development (G)GDP difference matrix
Environmental regulation (E)Investment in industrial pollution control has been completed per unit of value added for the secondary industry difference matrix
Technological progress (T)Research and R&D funding per unit for the GDP difference matrix
Industrial structure (I)Secondary industry per unit for the GDP difference matrix
Degree of openness (O)Total export–import volume per unit for the GDP difference matrix
Table 4. The IGGE in China from 2006 to 2020.
Province200620072008200920102011201220132014201520162017201820192020
Beijing0.980.980.991.001.001.001.001.001.001.001.001.001.001.001.00
Tianjin0.900.890.880.940.960.960.980.980.990.980.990.970.820.710.88
Hebei0.660.620.570.490.470.520.530.540.530.520.510.510.580.420.41
Shanxi0.630.610.610.480.450.510.500.500.480.460.460.590.650.560.57
Inner Mongolia0.600.620.700.670.640.830.850.880.850.840.830.770.680.710.74
Liaoning0.600.570.570.630.650.730.760.750.750.770.640.670.610.610.59
Jilin0.680.660.660.770.780.800.860.880.870.850.870.830.680.620.62
Heilongjiang0.950.860.780.720.720.710.720.700.680.680.650.630.600.520.53
Shanghai0.990.990.990.960.960.970.960.930.930.930.950.970.920.980.98
Jiangsu0.740.710.670.670.670.710.730.760.780.800.800.820.880.750.76
Zhejiang0.710.720.700.680.660.640.640.660.650.640.630.630.830.580.57
Anhui0.630.560.550.560.550.500.480.460.450.430.440.440.660.460.52
Fujian0.830.730.690.700.670.640.670.680.690.690.700.720.720.760.75
Jiangxi0.700.710.670.660.650.590.600.590.570.550.570.550.750.530.51
Shandong0.720.720.690.700.680.700.720.730.740.740.710.700.710.550.55
Henan0.680.620.570.560.540.550.560.560.550.540.520.510.520.490.48
Hubei0.760.720.670.670.660.670.700.700.700.710.700.680.710.670.61
Hunan0.830.780.750.730.710.640.660.660.670.680.690.680.740.620.59
Guangdong1.000.970.920.860.790.720.690.700.660.640.630.630.780.580.57
Guangxi0.710.660.620.580.620.670.670.660.640.620.610.550.550.470.45
Hainan1.001.001.001.001.001.001.001.000.970.960.960.940.950.930.92
Chongqing0.660.630.720.700.690.680.710.690.670.680.720.710.750.670.67
Sichuan0.680.650.610.580.580.550.570.560.560.550.550.560.720.520.50
Guizhou0.610.600.600.500.500.510.520.550.550.530.520.520.590.470.46
Yunnan0.600.570.550.480.470.470.490.500.470.490.500.490.480.520.52
Shaanxi0.670.620.610.630.630.630.940.950.930.850.820.820.770.660.59
Gansu0.650.590.560.460.430.500.530.560.570.540.570.590.730.590.54
Qinghai0.600.650.750.620.550.620.640.690.670.670.770.830.760.860.88
Ningxia0.520.560.640.550.510.630.650.710.690.660.750.820.800.840.88
Xinjiang0.710.700.670.640.630.730.720.700.630.590.580.600.640.600.59
Table 5. Results of the QAP correlation analysis of the matrix Q and influencing factors (2020).
VariableValueSignificanceAverageStd. DevMinMaxp ≥ 0p ≤ 0
D0.134 ***0.0000.0010.037−0.1280.1340.0001.000
G−0.456 **0.0000.0010.124−0.4380.3341.0000.000
E0.159 **0.090−0.0020.119−0.4410.3200.0900.918
T−0.307 ***0.007−0.0020.125−0.4100.3810.9950.007
I−0.335 ***0.0070.0010.125−0.5090.2710.9950.007
O−0.537 ***0.0000.0010.125−0.460.2981.0000.000
Notes: ** Significance at 5% level; *** Significance at 1% level.
Table 6. Results of the QAP correlation analysis for each influencing factor (2020).
VariableDGETIO
D1.000 ***0.015−0.019−0.0250.0470.061 **
G0.0151.000 ***−0.0320.536 ***0.398 **0.636 ***
E−0.019−0.0321.000 ***0.066−0.114−0.159
T−0.0250.536 ***0.0661.000 ***0.2740.494 **
I0.0470.398 **−0.1140.2741.000 ***0.558 ***
O0.061 **0.636 ***−0.1590.494 **0.558 ***1.000 ***
Notes: ** Significance at 5% level; *** Significance at 1% level.
Table 7. Results of the regression analysis between the influencing factors and IGGE (2020).
IndependentUn-Stdized CoefficientStdized CoefficientSignificanceProportion as LargeProportion as Small
Intercept0.5320.000
D0.1880.164 ***0.0000.0001.000
G−0.161−0.191 **0.0220.9780.022
E0.0750.090 *0.0890.0890.912
T−0.006−0.0070.4780.5220.478
I−0.038−0.0390.3200.6810.320
O−0.356−0.386 ***0.0010.9990.001
Notes: * Significance at 10% level. ** Significance at 5% level; *** Significance at 1% level.
Disclaimer/Publisher’s Note: The statements, opinions and data contained in all publications are solely those of the individual author(s) and contributor(s) and not of MDPI and/or the editor(s). MDPI and/or the editor(s) disclaim responsibility for any injury to people or property resulting from any ideas, methods, instructions or products referred to in the content.

