


Filling the Gaps in Biophysical Knowledge of Urban Ecosystems: Flooding Mitigation and Stormwater Retention


Lab PPTE, Department of Architecture and Urban Studies (DAStU), Politecnico di Milano, 20133 Milan, Italy
Land 2023, 12(3), 702; https://doi.org/10.3390/land12030702
Submission received: 24 February 2023
/
Revised: 15 March 2023
/
Accepted: 16 March 2023
/
Published: 17 March 2023
(This article belongs to the Special Issue Supporting Assessment and Planning Processes for a Good Anthropocene)
Abstract
:Urban flooding is one of the most recognized problems cities must tackle in the coming decades due to climate change conditions. Nevertheless, the empirical knowledge of the biophysical capacity of cities to absorb, store or retain and release water after rainfall events is limited, partly due to the gaps that modeling has in terms of representing the complexity of urban systems. This limit, in turn, affects the decision-making process related to the system’s adaptation. This work aims to integrate two types of alternative spatial ecosystem modeling and see how results can be combined, evaluated and used in view of a more holistic comprehension of flooding phenomena while reaching a deeper understanding of the vulnerability to multiple types of rain events: flash floods versus annual precipitation. The results of the two modeling sessions will be analyzed and compared. They will be further used to gather a greater understanding of the biophysical complexity of Izmir’s Metropolitan City in Turkey: one of the most dynamic but climatically threatened urban areas in the Mediterranean basin. The findings confirm the extent to which empirical knowledge of the urban system is partial and uncertain, thus requiring continuous progress through ecosystem modeling to support an evolutive interpretation of biophysical performances based on trial and error.
1. Introduction
The increased utilization of ecosystem modeling to aid the decision-making phase of urban planning is currently recognized as a strategic support to performance-based adaptive design [1,2,3]. The climate is changing at a fast rate while requiring immediate and tangible actions, thus asking experts and analysts to build a solid spatial knowledge of risk and vulnerability [4,5]. Recent studies have shown that the temperature and the extreme rainfall events in the Mediterranean region might increase, leading to more frequent flash floods [6,7,8].
Nevertheless, as many authors well recognize, the spatial investigation of vulnerability to multiple hazards is a tricky and delicate issue since it requires a sound knowledge of the local sites but, most of all, clever utilization of spatial multilayer analysis by using Geographic Information Systems [9,10,11,12,13].
It is worth mentioning that critiques and limits that lie in the technical utilization of modeling to describe, support and guide the decision-making for climate change adaptation are numerous [14,15,16]. However, objections can be mainly grouped into two macro-categories. The first can be set in the theoretical sphere and critique the “modeling” as a solely technological practice [17,18,19]. This position is represented by the experts who blame the booming of modeling as a re-introduction of a purely “technocratic” approach to planning, leaving aside its socio-political dimension. The second point, on the other hand, is set in the practical sphere and concerns the limits that the action of “modeling” itself has; in short, this limit can be fairly synthesized by a famous quote by George E. P. Box (1979): “All models are wrong, but some are useful” [20,21].
The two critiques are equally important, as they directly or indirectly affect the utilization of modeling for solving practical and complicated problems in highly complex systems such as urban areas [22]. In addition, despite the type of critique, the utilization of modeling in adaptive plans is not even an argument of debate since all major cities are trying to cope with climate change issues while targeting their adaptation with a solid, spatially explicit knowledge of the biophysical functioning of urban areas [23,24,25]. This, in turn, is triggering the production of a technically sound knowledge around modeling both in academia and elsewhere, as it has been demonstrated that adaptive, resilient or antifragile approaches are all “umbrella” concepts that include, but are not limited to, the multidimensional concept of vulnerability [26,27,28].
This work assumes that utilizing ecosystem models for adaptive planning is not even a negotiable issue as it already constitutes an essential part of adaptation [29]. Models are tools designed to precisely define the problem, articulate relevant concepts and provide empirical results to communicate [30]. By definition, they simplify reality, but at the same time, they help to predict logical outcomes of how we think a system works. Moreover, their interpretation helps to form the conditions for adaptive planning, which can vary in time and space and under different socio-cultural and political circumstances [31].
In any case, it is not the intention of this work to consider modeling as an action that substitutes the decision, which solidly remains wrapped in the hands of human rationality (or fallacy). Nevertheless, it is well demonstrated how findings are much more consistent when they are based on a grounded, empirical knowledge of reality with a sharp definition of the problem to solve [3,32,33].
Having clarified this premise, the following work deals with some practical limits of modeling: the quantitative and qualitative knowledge built by models is always partial, incomplete and mostly wrong (second type of critique). All the data to create a reliable and robust model are rarely completely available; thus, models should be employed to explore the hypothesis of transformations instead of exactly representing the structure of a system [10,17,34].
Copenhagen, New York and Rotterdam are some of the most recognized and quoted pioneering experiences in which the design of antifloodable plans is set through site-specific modeling knowledge built on sound technical geomatic techniques [35].
Accordingly, the Covenant of Mayor’s initiative has promoted and subsidized many adhesions in the European Union framework, leading to the fast and immediate transition to a more climatically resilient urban system [36]. As recently as 2022, 15 new metropolitan areas with more than 250 thousand inhabitants led to the formal acquisition of an adaptation plan based on sound, site-specific knowledge of the biophysical characteristics of their urban environment: Eskişehir (Turkey), Kadikoy (Turkey), Karşıyaka-İzmir (Turkey), Münster (Germany), Murcia (Spain), Palma (Spain), Region Zuid-West-Vlaanderen (Belgium), Şişli, (Turkey), Verona (Italy), Waasland Klimaatland (Belgium), Bağcılar-Istanbul (Turkey), Métropole de Lyon (France), München (Germany), Sakarya Metropolitan Municipality (Turkey) and Sofia (Bulgaria) [37]. In all these areas, local action plans are focused on performance-based solutions to cope with site-specific problems of flooding [38], urban heat islands [39], biodiversity reduction [40], drought [41], etc. Not surprisingly, 5 out of 15 initiatives in the last year have been located in Turkey. As demonstrated in a study by the Basque Center for Climate Change (2017), Turkey is set to be one of the most climatically impacted areas of the Mediterranean basin, along with Morocco, Bosnia-Herzegovina and Greece. In the same report, Istanbul is classified as Europe’s most vulnerable coastal city and Izmir ranks third in terms of vulnerability to climate change [42].
Here, two recently released versions of freely accessible models (pluvial flooding mitigation and stormwater retention) are compared and analyzed in the same catchment: the Metropolitan City of Izmir (Turkey) [43]. These models are retrieved by the open-access software Integrated Evaluation of Ecosystem Services and Tradeoffs (InVEST) built by the Natural Capital Project (Stanford University) [44].
While the first model is dedicated to estimating the biophysical effect of a single flash rain (cloudburst) in an urban catchment (temporary runoff) [45], the second is specifically designed to gain a more accurate hydraulic balance over the entire year (yearly runoff), while including the transpiration, evapotranspiration and the interception by the sewage system in the urban context [46].
The two models are evaluated in a complementary manner to see how their combined assessment can furnish a site-specific problematization of Izmir’s vulnerability to hydraulic-related problems. While doing so, it will be pointed out how the combination of different spatially detailed models can be interpreted and used to generate a biophysical knowledge of areas vulnerable to different types of flooding and, in turn, help to gather tangible benefits in terms of solutions that can be considered [38,47].
The findings aim to confirm that even if limited, partial or even wrong, modeling is mindful when carefully used to build knowledge around decision-making as it provides a more complex view of the characteristics of urban systems. Finally, conclusions infer how knowledge and decisions are strictly connected. It is almost impossible to precisely blame modeling as the driver of a new “technocracy” as it deals, in any case, with human-related decisions.
2. Materials and Methods
2.1. The Area of Interest
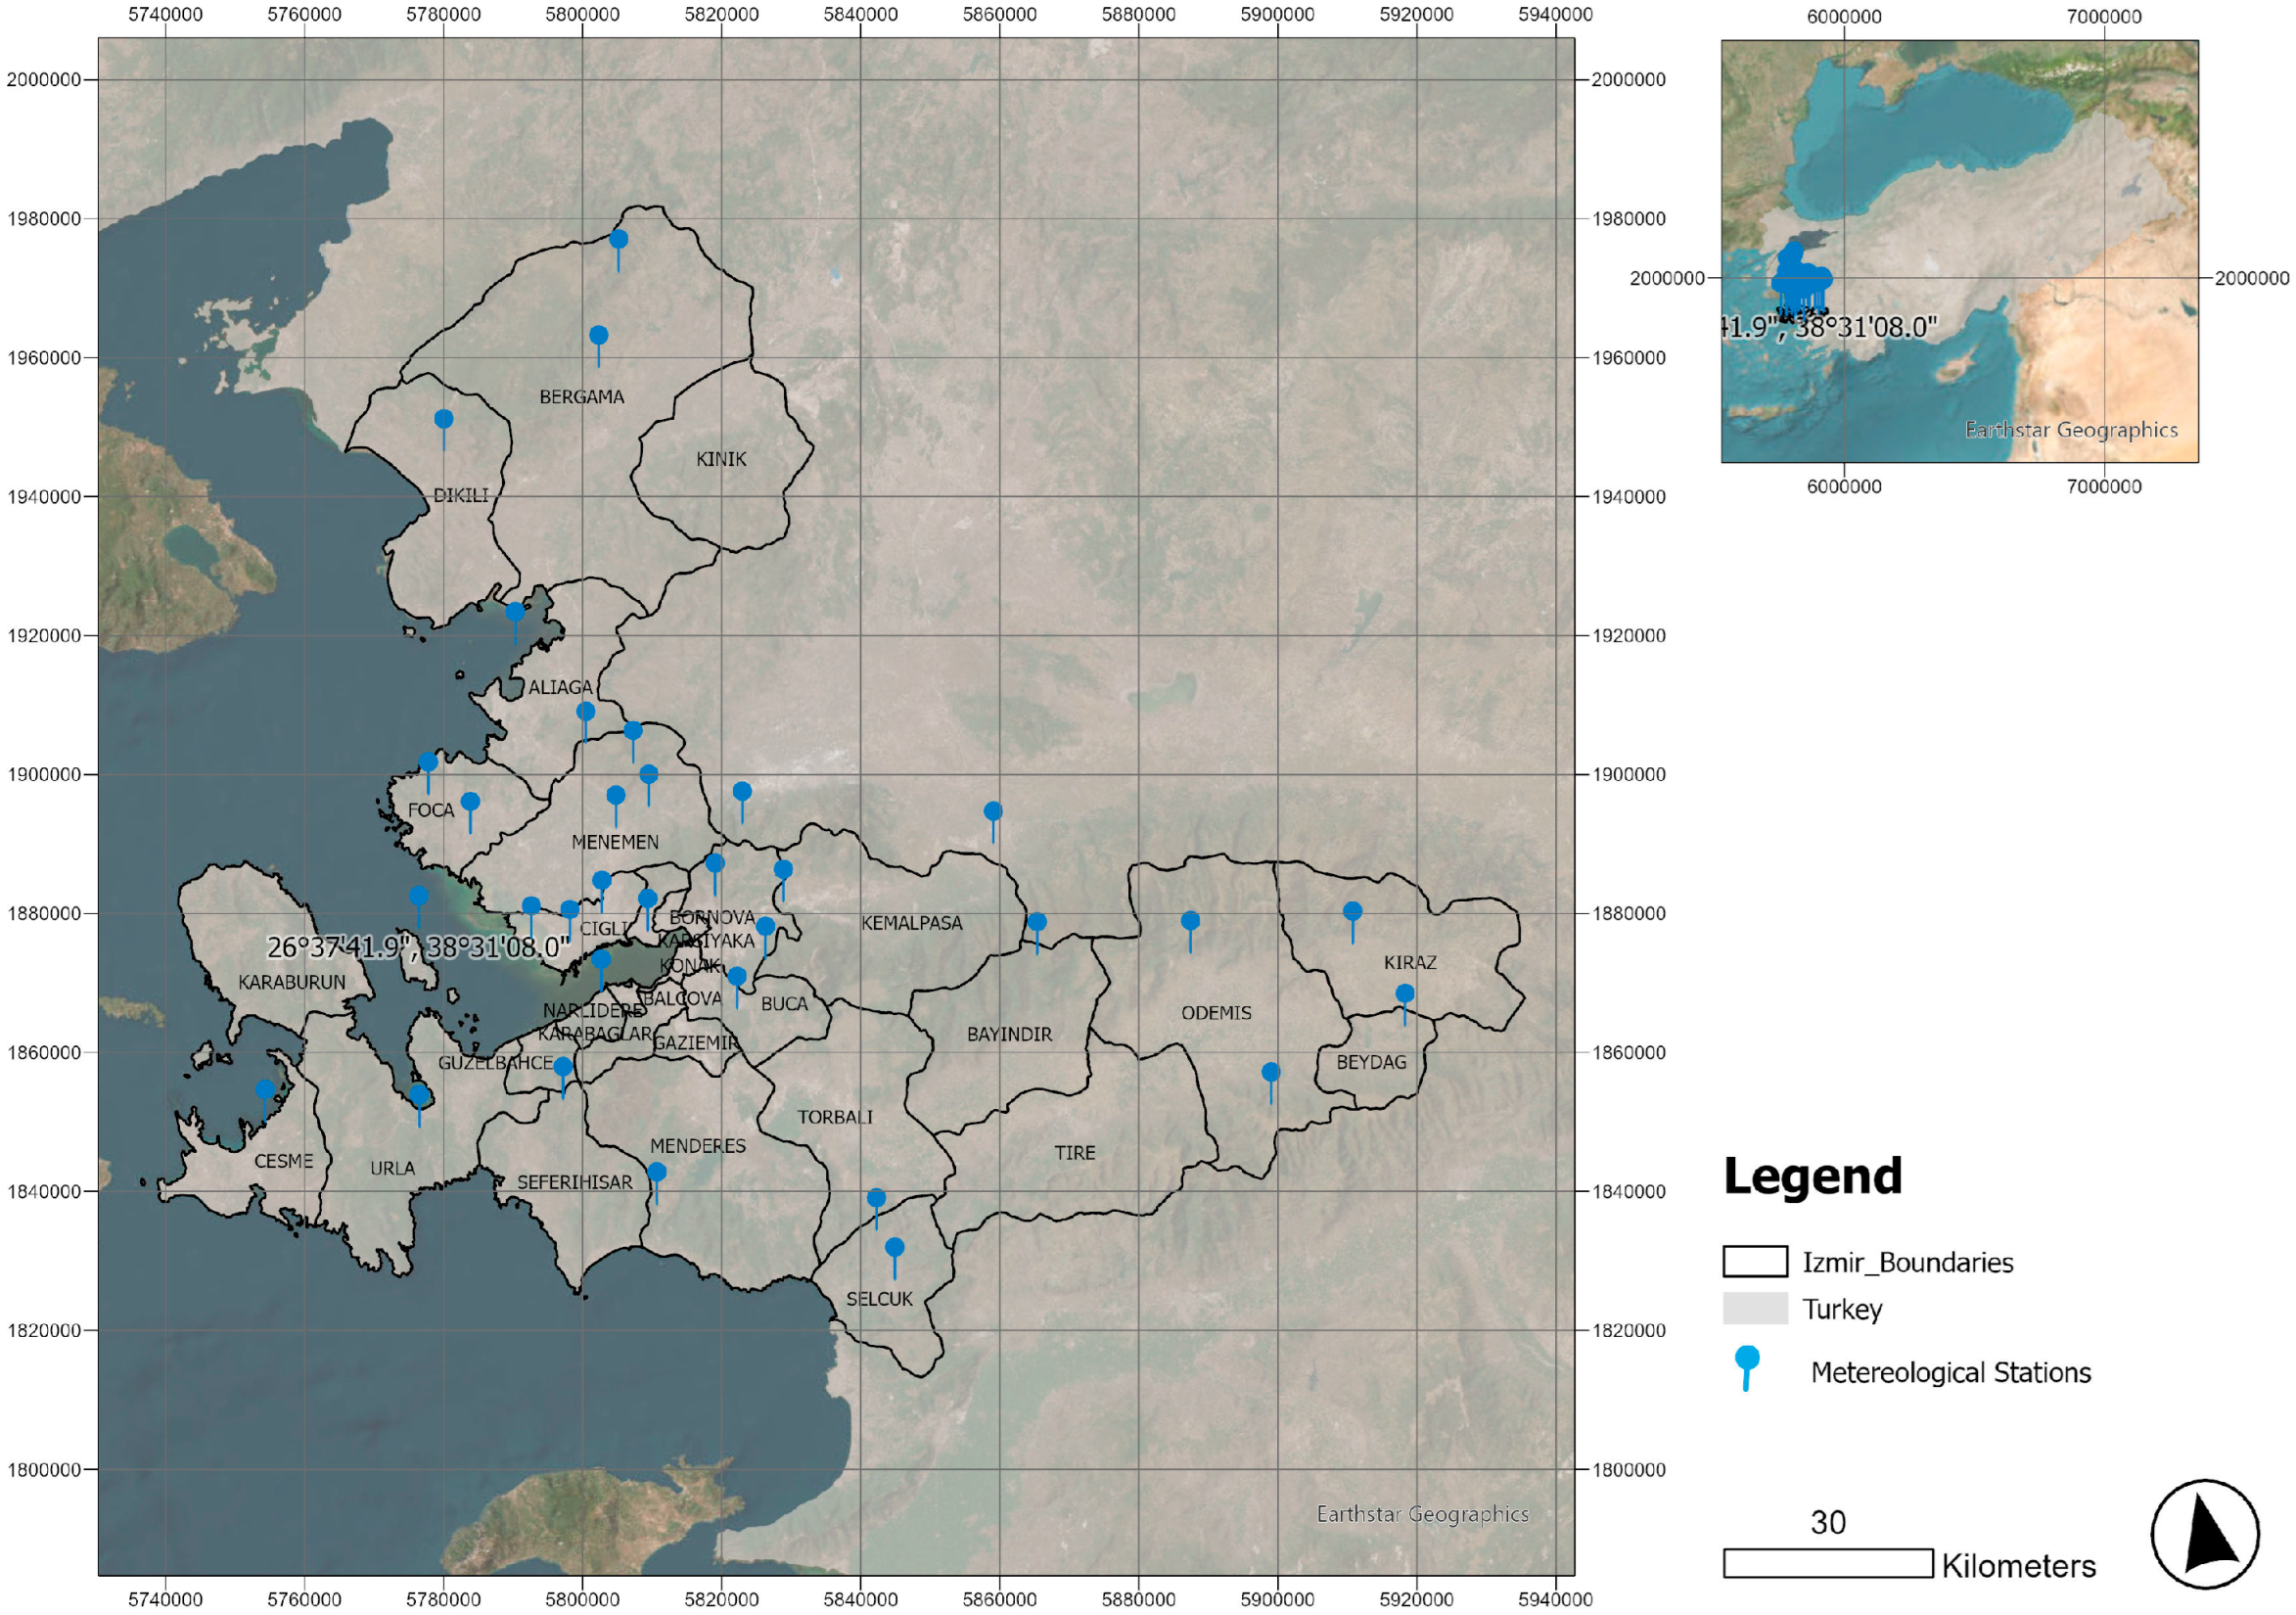
The metropolitan city of Izmir, or “İzmir Büyükşehir Belediyesi”, is a vast and heterogeneous metropolitan area located in the western promontory of Anatolia (38.42° N 27.14° E, see Figure 1) [48]. The metropolitan city replaced the former Province while including 29 urban districts and more than 1200 neighborhoods [49]. The metropolitan area is the third most populated urban agglomeration in Turkey and one of the most dynamic, extended and populated cities of the Aegean Sea. It includes the densest agglomeration of the main city (Izmir), but it stretches all over the fourth cardinal directions while touching Balikeshir, Manisa and Aydin, forming an extended promontory (Cesme/Karaburun) on the western side. All included, the administrative land spans 12,012 km2, while counting more than 4,677,292 inhabitants, with a prediction to hold more than two million citizens by 2030 [50].
The metropolitan area is quite heterogeneous in terms of landform: the average altitude of the districts is 239 m a.s.l., ranging from 1462 to 2 m.
According to Corine Land Cover data, the intensively cultivated agricultural areas are placed on the alluvial soils along the riverbanks, occupying 40% of the total surface. However, the site is characterized by a mixed distribution of typical Mediterranean densely vegetated cover, with a diffuse presence of the forested regions along the hillslopes (more than 53% according to Corine Land Cover data). The average presence of natural features is also visible by the district’s average tree cover density (Copernicus, Land monitoring service), which reaches 16% [51].
Unfortunately, the recent urbanization process has happened quickly, causing several environmental problems (see Table 1). Especially in the densely inhabited part of the metropolitan area, Izmir’s city center is booming in terms of new construction, occupying mainly the urban fringe and filling almost all the gaps of the urban basin. In 2018, 5% of the metropolitan area was occupied by urban features. Still, urban areas nearly doubled between 1990 and 2018 and some districts reached an incredible peak of imperviousness rate (98%) while consuming almost all the available land for construction [52].
Needless to say, the city suffers from chronic problems related to flood management. Every rain event can determine different problems while exposing the citizens to various risks [53]. In fact, the climate in this part of the Aegean Sea is typically seasonal, with a hot and dry summer and a rainy winter [54,55]. Even though the average yearly precipitation recorded between 1991 and 2000 amounts to 675 mm, which does not differ much from more continental climates, the rain events are mostly concentrated during the wet, fall season. The average monthly temperature ranges from 3.8 degrees (°C) in January and 20.8 degrees (°C) in July and August.
According to official data, the city’s water management agency (IZSU) classifies a 70 mm single rain event with a return period of 200 years. However, as Turkey’s meteorological agency (Meteoroloji Genel Müdürlü-MGM) has reported, between 13 and 14 November 2020, 42.1 mm of rain fell in the town of Menderes during a single rain event that lasted less than 3 h. In Karabaglar, situated about 10 km to the north, rainfall of 77.3 mm was recorded in the same timeframe. Elsewhere in the province, the service notified a depth between 147 mm (Urla) and 103.4 mm (Karaburun) on the same days. Between 2 and 3 February 2021, MGM reported that 123.9 mm of rain fell in 24 h in the Konak district of Izmir, while on 3 February, a rainfall of 130.9 mm was observed in the Menderes district [56]. Heavy rain and rainwater management generally become urgent issues the city must face [57].
To empirically analyze the flooding problem, this work employed two similar but different ecosystem service models by InVEST: the urban flood risk mitigation model and the urban stormwater retention model. The models are designed to estimate the biophysical capacity of a catchment to retain the water of a single rain event (cloudburst) or of the entire year’s water balance.
2.2. Flash Floods Versus Annual Precipitation
The hydraulic vulnerability of a city can be of various forms and causes, especially in a densely inhabited coastal city such as Izmir. In the literature, three different typologies of flooding are investigated: (i) pluvial flooding, (ii) riverine flooding and (iii) sea overflowing.
Sometimes, the three phenomena can occur simultaneously or partially simultaneously. As has already been experienced, recent extreme floodings happened with a concomitant interference between different hydraulic phenomena, thus rendering the prediction and the exact knowledge of the relationship between causes and consequences incredibly intricate. In addition, the spatial distribution of the various phenomena can vary in time and space. Floods can occur even far over the traditional riverine buffer zones that are mainly studied and protected by conventional set-back areas.
Within this work, pluvial flooding will be analyzed through two different lenses (models): the first is the typical single rain event of a massive flash flood, while the second deals with the yearly stormwater management. To cut down and oversimplify, one model uses as input the single rain event quantity (in the literature, the threshold to consider a cloudburst is set at 50 mm of rain per hour [58]) and returns as output the retained and the runoff volume (and indexes), while the second requires the total year rainfall volume (in mm) and returns as output the retained and released (runoff) volumes (and indexes), the infiltrated and the polluted amount of water. Therefore, as will be detailed, the models are not comparable since they respond to two different hydraulic conditions and, moreover, their algorithms differ when considering different inputs.
2.3. The Urban Flood Risk Mitigation Model
This model calculates the total runoff and its reduction compared to the storm volume. The algorithm that produces the spatial evaluation is relatively simple since it associates with each land use land cover (LULC) category a specific runoff curve number. Runoff curve numbers are four parametric values typically associated with a different typology of hydraulic conductibility in the literature. Porous soil is more conductive, thus having good infiltration and limiting the runoff, while clay soils are poorly conductible, thus favoring the surface flow accumulation. The model assumes that these runoff parametric values are valid for already saturated soils. The overlap between the LULC and the hydraulic conductibility classification (two raster maps) produces an overlay feature: the runoff value and its retention (infiltration). The urban flood risk mitigation model has been employed for this study setting a 100 mm single rain volume. A total of 100 mm has been used according to the abovementioned meteorological reports of MGM, while assuming as a reasonable prediction to expect rainfall volumes similar to that recorded between 2020 and 2021.
Flash Flood Balance (single rain event):
- Precipitation = Retention + Runoff;
- Retention = Precipitation − Runoff;
- Runoff = Precipitation − Retention;
- Runoff Coefficient = Runoff/Precipitation;
- Retention Coefficient = 1 − Runoff Coefficient
2.4. The Urban Stormwater Retention Model
The Urban Stormwater retention model is slightly different from the previous one, not only because it accounts for a yearly water balance instead of a single rain event (the input for this model was 700 mm) but also because it does not simply calculate the runoff as the plain result of the storm volume less the retention. Indeed, the algorithm includes infiltration, groundwater recharge and surface runoff as affected by interception and evapotranspiration in an annual time scale rather than a single storm event.
Therefore, the model spatially produces a more detailed water balance in the landscape in response to a year’s precipitation. Primary planning concerns are related to surface water quality and water supply. When compared to the flash flood balance (single rain event), the annual water balance (multiple rain events) has the following improvements:
- Retention = Interception + Infiltration + Evaporation + Transpiration;
- Potential Aquifer Recharge = Infiltration − Transpiration;
- Percolation Ration = Potential Aquifer Recharge/Precipitation.
2.5. Inputs
2.5.1. Land Use Land Cover
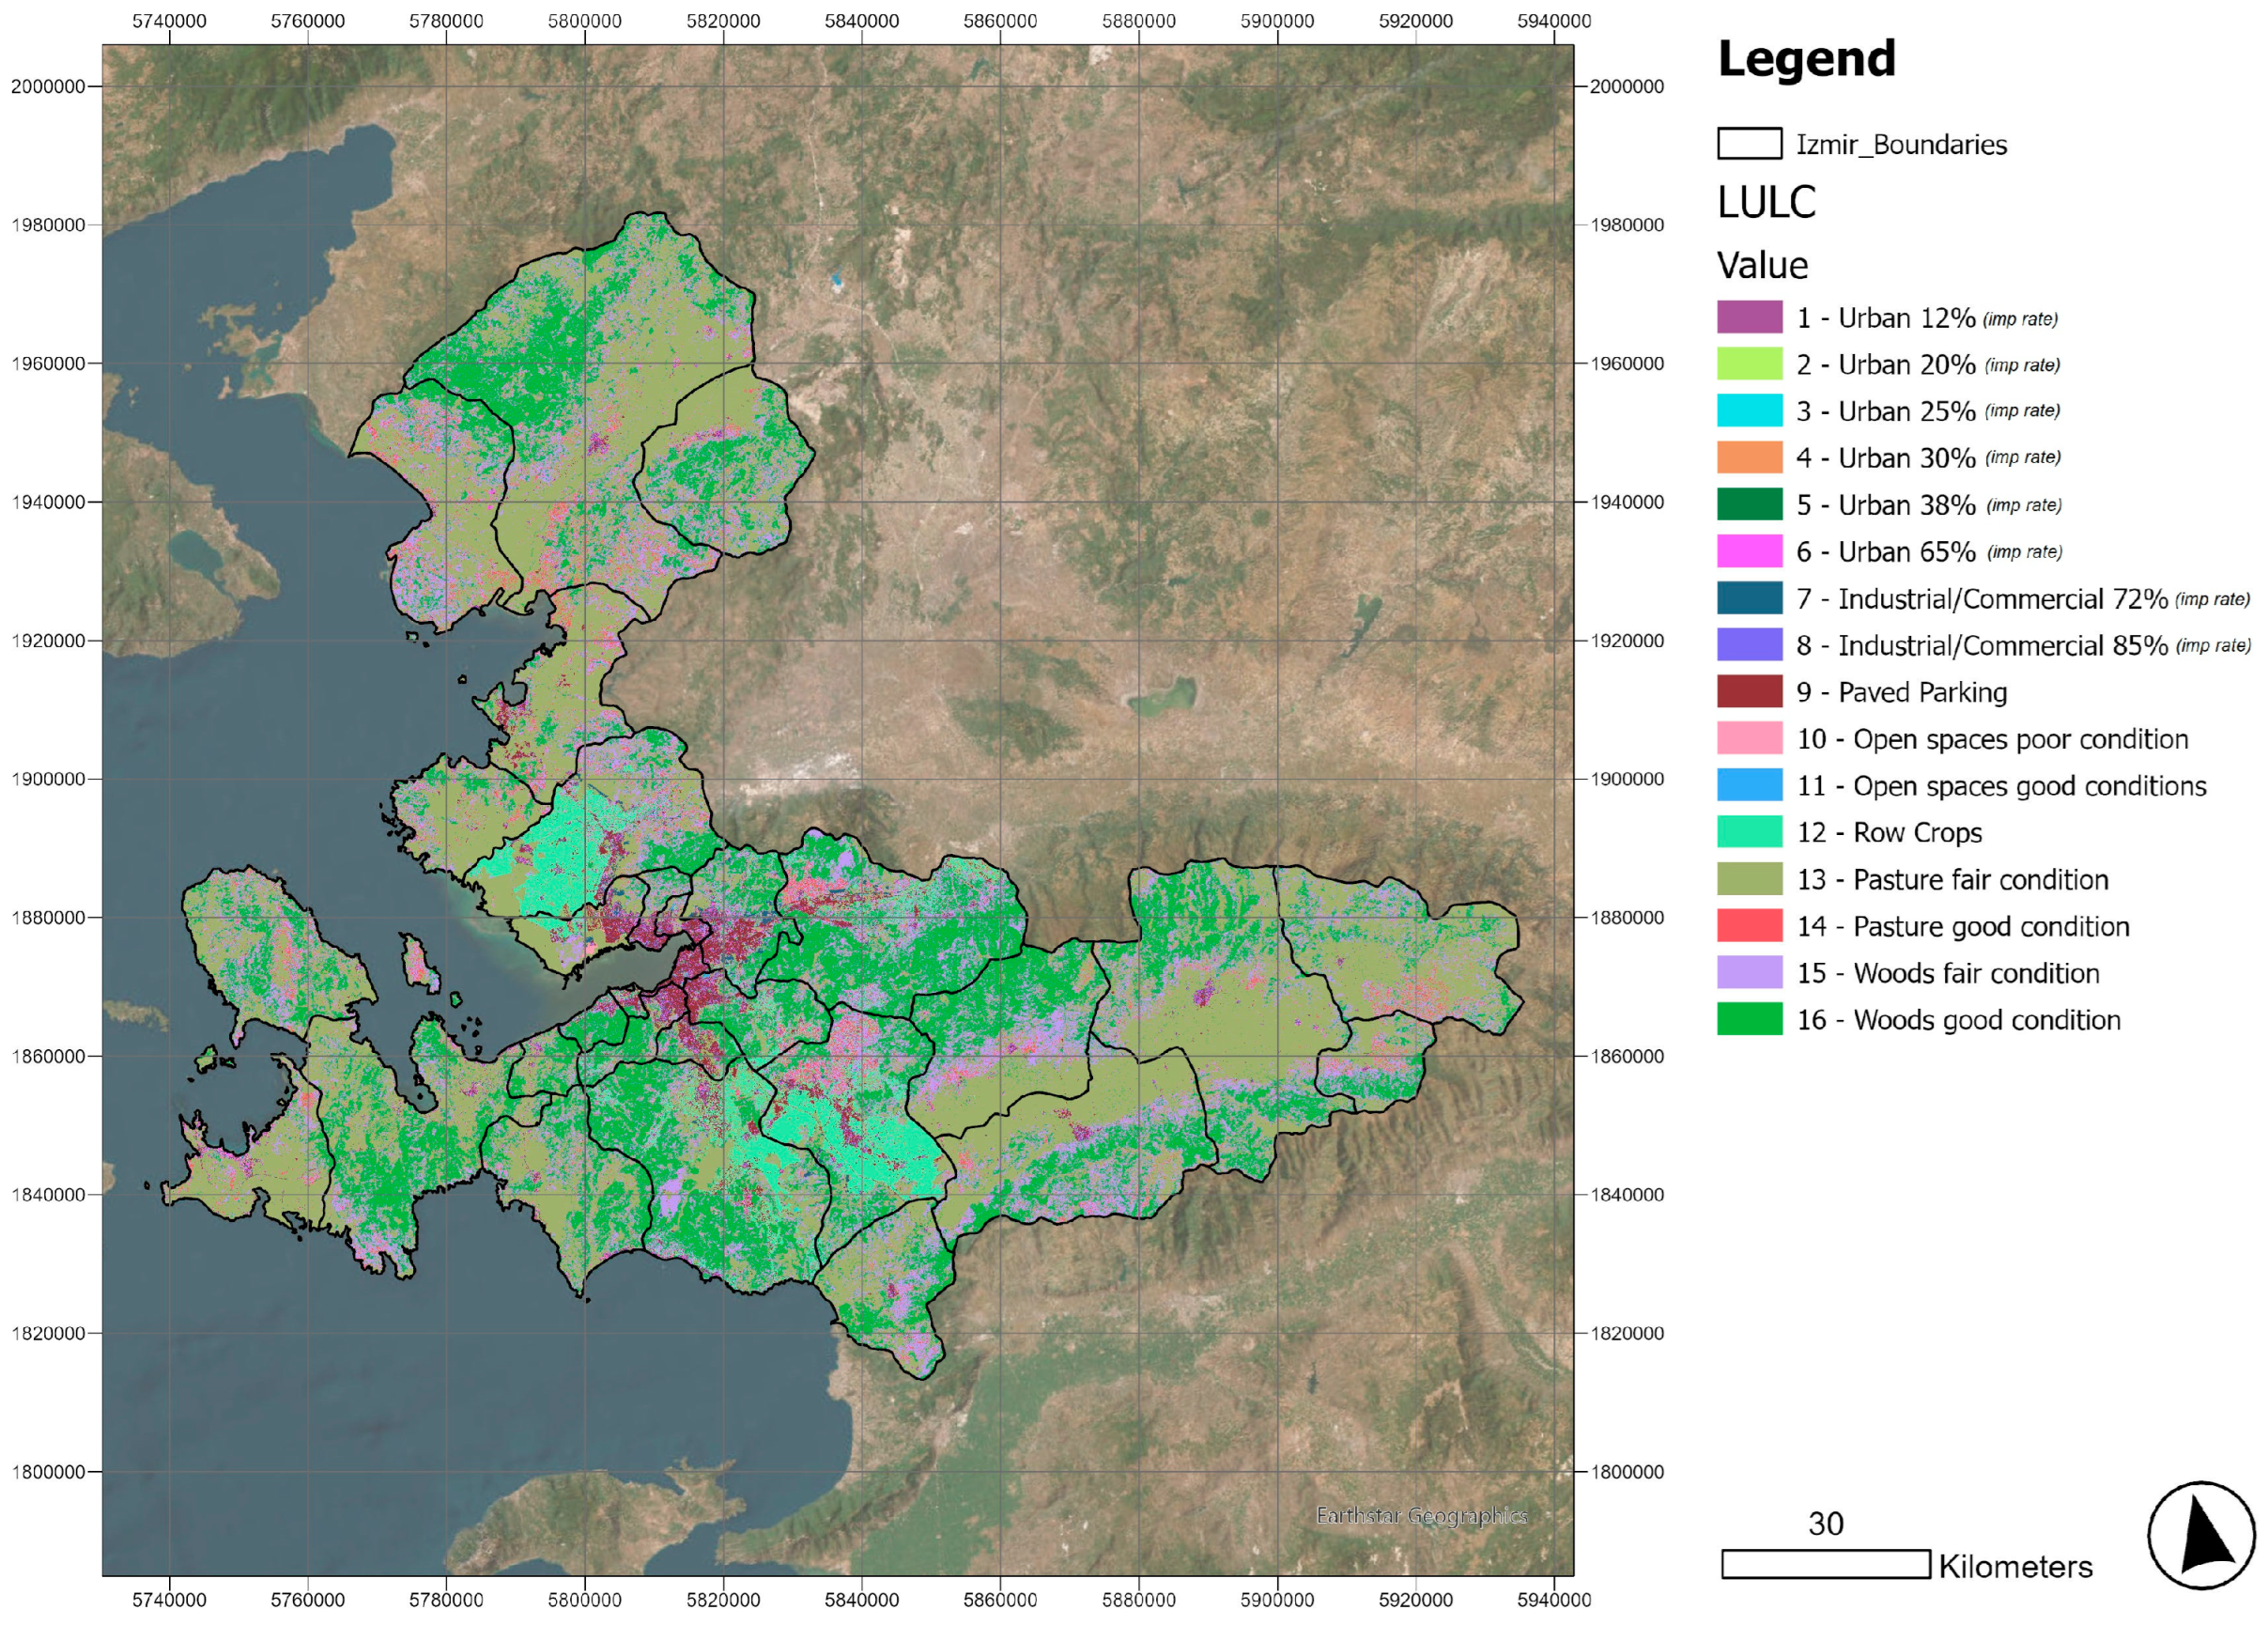
The LULC is the basic input of the model. A raster map of the land constitutes its uses in the catchment, where each pixel has an integer code valid to assign other biophysical parameters (runoff curve number and percolation coefficients). The LULC was entirely designed around the United States Department of Agriculture (USDA) runoff curve number classes employing the three Copernicus products (see Figure 2):
- Imperviousness High-Resolution Layer 2018 (HRL);
- Tree Cover Density 2018 (TCD);
- Urban Atlas 2018.
2.5.2. Soil Hydrologic Group
The second model input is the map of saturated hydraulic conductibility (Ksat, mm/h,), defined as the soil’s saturated ability to be vertically crossed by fluids. Soils with good porosity allow a significant quantity of water infiltration quickly, thus limiting the runoff (see Table 2). On the contrary, clay soils or soils with low porosity cannot facilitate rapid infiltration during rain events.
Soil hydrologic group’s raster map has pixel values ranging from 1, 2, 3 or 4, corresponding to soil hydrologic groups A, B, C or D, respectively. The map has been created while making a parametric association between the geological units map of Izmir and the hydrological classification (see Table 3 and Figure 3).
In typical Mediterranean catchments, the traditional four-class hydrological classification has many limits in representing the real complexity of infiltration processes. Izmir’s metropolitan area is only partially composed of “soils” (alluvium) while covered mainly by other typologies of geological units (rocks), where the infiltration can be significantly affected by the hill’s pedogenesis: volcanic, morainic, structural, or tectonic.
2.5.3. The Biophysical Table
Lastly and most importantly is the biophysical table that associates every single pixel’s iteration between LULC and the soil hydrologic group with another series of parameters (see Table 4):
- Runoff coefficient for soil group A (0–100);
- Runoff coefficient for soil group B (0–100);
- Runoff coefficient for soil group C (0–100);
- Runoff coefficient for soil group D (0–100);
- Percolation coefficient for soil group A (0–100);
- Percolation coefficient for soil group B (0–100);
- Percolation coefficient for soil group C (0–100);
- Percolation coefficient for soil group D (0–100);
- Connection to an impervious surface (0–1) (it is generally assumed that urban land use categories would likely be fully connected to storm sewer systems, thus conveying the runoff along street lines);
- emc_nitrates and phosphorous (mg/L). The mean concentration of the pollutant in stormwater.
2.6. Ancillary Data
The modeling results were evaluated in light of another ancillary dataset that was intersected with the area of interest (AOI): the Digital Elevation Model, downloaded by the Copernicus Land Monitoring Service-EU-DEM (2017, 10 m ground resolution), the Tree Cover Density 2018 by Copernicus Land Monitoring Service (product consists of the status layers showing the level of tree cover density in a range from 0–100%), the High-Resolution Imperviousness Degree 2018 by Copernicus Land Monitoring Service (product consists of the status layers showing the level of impervious surfaces in a range from 0–100%), the Land Capability Classification (which has been obtained by the Metropolitan City of Izmir, within the soil characteristic map. Reference scale 1:50.000) and the density of infrastructure that has been autoproduced by calculating the density of the road network (downloaded on Open Street Map Catalogue of Izmir) in each neighborhood.
3. Results
3.1. Modeling Results
As anticipated, even though the results are synthesized in two comprehensive tables, the numbers cannot be truly “compared” as they are the product of different algorithms. Thus, the scope is to analyze the results as they can furnish a more holistic and integrated comprehension of how the catchment works under different hydrologic conditions (see Table 5).
The estimated yearly surface runoff is the portion of yearly water not retained by the landscape and exported along with associated nutrients or pollutants, offering an elaborated balance.
Overall, in the entire catchment, the yearly water balance is equally distributed between retention and runoff (4 billion cube meters of water are retained by the landscape, of which only 254 million infiltrates for groundwater recharge, while the remaining are intercepted by vegetation, or they transpire/evaporate). More than 496 million kg of phosphorous flows in the stream water yearly, while the yearly kilograms of nitrates amount to 2.7 billion. According to these general results, the runoff generated by a cloudburst of 100 mm of water corresponds to 9.8% of the total yearly runoff in the entire catchment. In the Konak district (one of the most central and impervious), this share amounts to 12.7% of the yearly stormwater volume, while Selçuk corresponds to 9.8%. Therefore, the yearly stormwater retention capacity and the flood risk mitigation results are complementary but different in every neighborhood (see Figure 4).
The most remarkable difference is that the stormwater retention index uses an adjusted retention capacity, assuming that no additional retention is provided by surrounding land if land use is considered directly connected (or less than 20 m close) to a drainage network. In this case, open spaces, impervious areas and urban districts were considered directly connected (see Table 4), thus not having any additional infiltration capacity (while augmenting the runoff).
This assumption is much more “realistic” on a yearly timeframe as it adjusts the pixel’s retention coefficient proportionally to the runoff provided by its neighboring pixels directly connected to the drainage network by ditches or subsurface pipes. On the other hand, within this correction, it is assumed that the runoff quantity will be higher when compared to the cloudburst runoff since it is the flow dispatched by the existing stormwater network in a year’s precipitation (water retained, released and quality).
The urban flood risk mitigation model aims to assess the response to a single, extreme storm event while not accounting for any potential interception, evaporation or transpiration process that usually occurs within a more extended timeframe (indeed, not during a single cloudburst event). For this reason, the general retention index is higher during a cloudburst since the abovementioned biophysical processes of the soil (interception, infiltration, evaporation and transpiration) are not at work. More retention means more water infiltration and, paradoxically, less surface runoff. At the same time, even though a higher infiltration rate seems to be a positive fact, more pollutants reach the aquifers while causing several collateral problems beyond the temporary flooding.
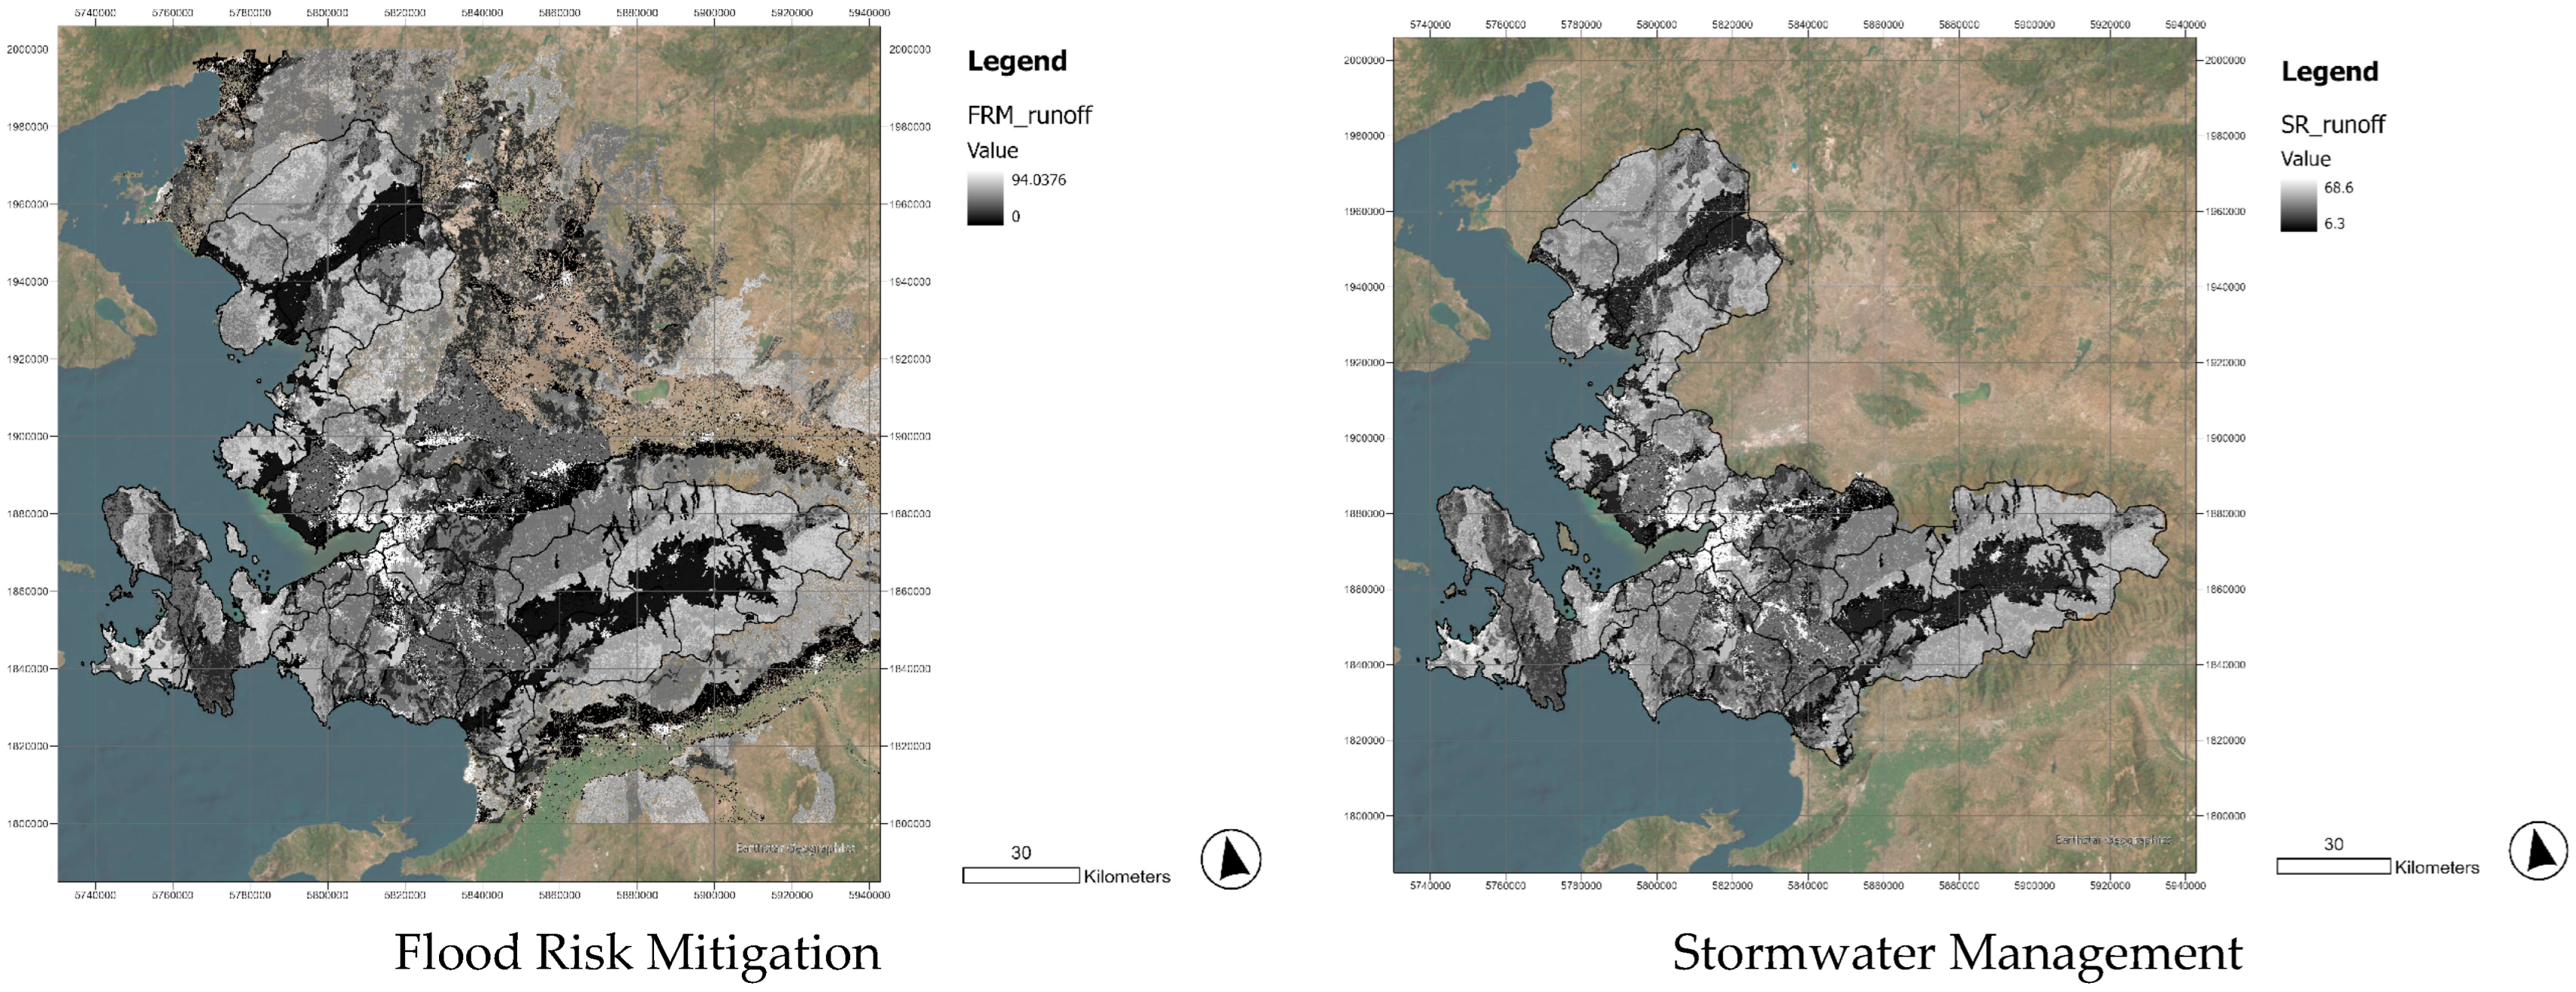
Since absolute values cannot be checked against any field measure, the two models’ runoff and retention capacity relative indexes were observed to see how the catchments perform under different conditions (seasonal rain and flash rain, see Table 6). In addition, the absolute data were transformed into runoff volumes (cm/s) while discovering that, on average, in the districts of Izmir’s metropolitan city, a 100 mm flash rain can generate a rain volume of 3780 m3/s. In contrast, the same average for the year is 4.42 m3/s. That measure can give an idea of the tremendous impact that a flash rain can have on the system, bearing in mind that the Danube River in Vienna has an average volume of 2237 m3/s.
On average, the runoff retention during a cloudburst and yearly rainfall volume differs by 16%. As previously mentioned, retention is higher during a cloudburst, even though this does not mean the system is more efficient (higher infiltration, higher pollution, less water quality, see Figure 5). At any rate, the biophysical performance of the landscape slightly differs when the rain is concentrated in a single flash flood event or yearly precipitation. Looking at Table 6, in some neighborhoods, this difference is much higher (Guzelbahce), while in others it is much reduced (Konak). Indeed, Guzelbahce has a temporary estimated runoff that, during a cloudburst, amounts to 0.32, becoming 0.53 if evaluated in the yearly stormwater management.
The difference between the two water retention indexes is 0.21. On the contrary, the difference is less (0.10) in Konak, where the estimated runoff index is 0.82 during a cloudburst and 0.92 during yearly stormwater management. Therefore, while in Konak there is not much difference in terms of biophysical performance when the rain falls in a short amount of time or if the rain is averagely distributed throughout the year, in Guzelbahce, the situation is quite different: the runoff is relatively contained during cloudburst but considerably higher during the yearly timeframe.
What happens in these two neighborhoods? Why do these two neighborhoods perform so differently? Hereafter, the modeling results are analyzed in light of the land characteristics.
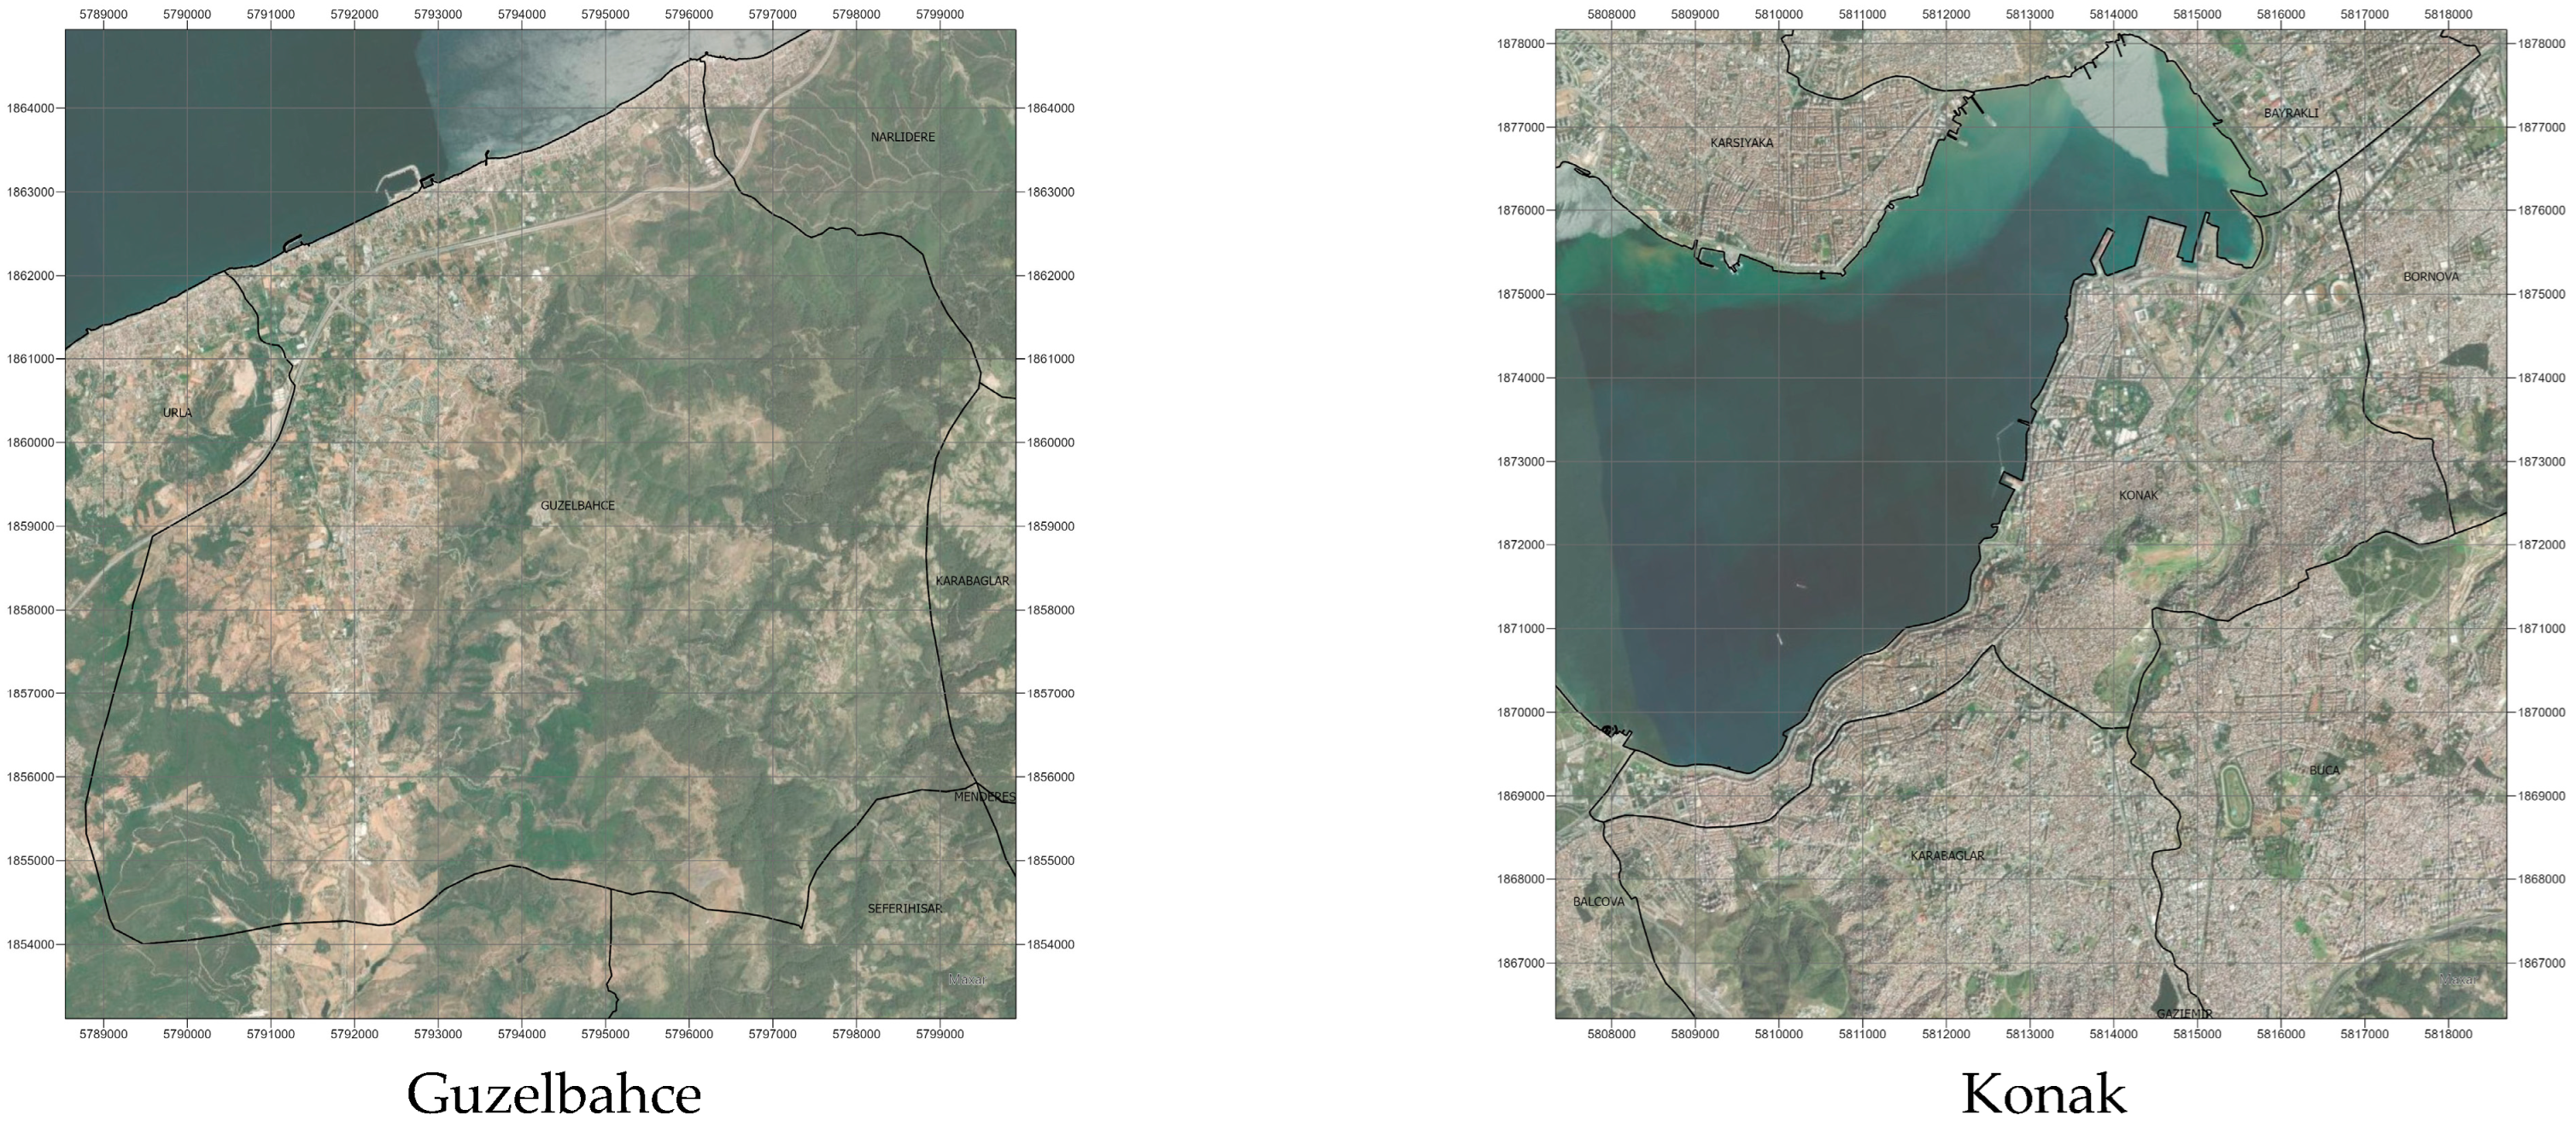
3.2. Guzelbahce and Konak
The analysis of Guzelbahce and Konak with ancillary datasets reveals that even though these two neighborhoods are both located on the southern coast of Izmir’s Gulf, directly facing the sea and relatively close to each other (less than 10 km separate the two districts), these contexts present several asymmetries (see Figure 6).
Guzelbahce is four times bigger than Konak and much more heterogeneous regarding the landform, soil and land cover characteristics (see Table 7). Guzelbahce is located at an average altitude of 127 m a.s.l., spanning from Izmir’s sloppy southern mountainous crown to the flat waterfront. The average sealing of the district is 12% (21% is the mean of the entire metropolitan area), while the tree cover density index is 22% (16% is the mean of the entire metropolitan area). This means that, even though the area is densely inhabited (counting a population of 28 thousand inhabitants), the district has some essential positive characteristics in terms of sensitivity to rainwater: the sealing is relatively contained and, at the same time, the tree cover density is above the average. the land capability classification is averagely medium-low (scoring 5.6 out of 9 classes where 1 means perfect soil for agricultural uses and 9 means urban soil with complete incompatibility with agriculture), with some limitations due to typical Mediterranean soil’s capabilities for farming uses. Nevertheless, the hydraulic conductibility is on average good, scoring 2 (the mean of the entire metropolitan area is 2.5), which means generally soils have good drainage. The infrastructure density, on average, scores 0.11 km of roads for each hectare of land (0.11 Km/ha is exactly the mean of the entire metropolitan area), which means less land fragmentation for water streams and horizontal water transmissivity in general.
On the other hand, Konak is one of the smallest but most densely inhabited (390 thousand citizens), central and completely settled neighborhoods of Izmir. Even though it is mainly located in the ancient harbor site of the city, its altitude spans from 1 to 120 m. a.s.l. with an average altitude of 60 m. The mean sealing index is 71%, while the tree cover density index is 3%, which means the district is almost impermeable without a densely vegetated continuous green system. The average land capability score is 9, which means that 100% of the neighborhood is urbanized and there is no space for fertile agriculture in this catchment. Its conductibility is 3, which can be considered a middle-low performance and the infrastructure density is high: In total, there are 0.36 Km of roads for each hectare (more than three times more than Guzelbahce). If, on the one hand, more roads mean less infiltration and less horizontal water transmissivity, on the other, it means more interception by road channels, pipes and stormwater harvesting systems. In fact, this neighborhood reaches the highest value of yearly runoff, scoring 0.92 (92% of the annual rainfall volume does not infiltrate and flow on the land surface).
4. Discussion
4.1. Integrating Modeling, Interpreting Results
The above-presented results clarify some key points that hereafter will be discussed:
- the two models are broadly different. Annual stormwater management displays runoff values that are not comparable with flash floods;
- it is not true that if a system is more “resilient” to cloudbursts it can also be efficient in annual stormwater management;
- topography, soil condition, landform and the anthropic footprint significantly affect rainwater management.
Flash floods and annual stormwater management are two broadly different functions. Even though both are related to the rainwater retention function, the potential capacity of a district to absorb stormwater under different typologies of hazards is different [46,59]. As mentioned before, the scope of this analysis was not to test one model against the other since it is pretty evident that they work under different assumptions. The scope was indeed to see how much their concomitant utilization can be of any help to reach a deeper understanding of the biophysical performance of the system. Therefore, these models are helpful when employed in a complementary manner and their results can be used to answer different questions. Moreover, utilizing one model does not exclude the need to use the other since their results relate to two different ecosystem services.
Moreover, on fast and intuitive evaluation, the systems are generally expected to be affected by higher runoff and less retention capacity during a cloudburst compared to yearly stormwater management. At the same time, the models showed the contrary, which means the retention index is, in all cases, consistently higher during a cloudburst and less performant during the yearly rainwater management. During the annual rainwater management, the retention function is less developed because the model considers that rainwater collectors convey capacity in the street pipes or open channels: the artificial stream network intercepts almost all the water while generating higher runoff volumes and limiting the infiltration, evaporation and transpiration.
However, this consideration should be analyzed considering that even though the models quantify the runoff in absolute (m3) and relative terms (index), the values are related in one case to the entire year, while in the second case, to a single rain event. If we convert the modeling results into runoff volumes per second (assuming a 1 h, 100 mm rain event for the flood risk mitigation model), we discover that cloudbursts can be tremendously dangerous in some neighborhoods: 493 m3/s is the runoff quantity in Konak, 779 m3/s is the quantity in Guzelbahce, while the annual is, from the same districts, 0.44 and 0.95 m3/s, respectively. These quantities should be checked against the stormwater network while obtaining a deficit analysis [60].
As for the second point, the comparison between Guzelbahce and Konak sheds essential light on this matter. Konak is a neighborhood where the retention capacity is always poor, both in case of cloudbursts or during the yearly rainfall volume. The system is, therefore, sensitive to seasonal and flash flood phenomena and the difference between the biophysical performance remains poor in both cases. That is the worst case, where independently of the kind of hazard, the system will be, in any case, inefficient and highly affected by potential damages. That is an example where modeling can only partially support the definition of customized and tailor-made nature-based solutions. Whatever the type and location, the system will surely benefit from any typology of greening ranging from green rooftop interception to rain gardens.
On the other hand, the case of Guzelbahce is radically different. In fact, this neighborhood displays a medium-high water retention potential during a cloudburst, while it seems much less efficient during the annual stormwater management. This means that a system with scarcely efficient ordinary rainwater management can be, paradoxically, better performing during a cloudburst. While on the other hand, it appears that a system in which the biophysical capacity to retain water is inefficient during a cloudburst will be even less efficient during the yearly rainwater management. Even though empirically evident by results, this statement is counterintuitive and potentially fuels the debate around the fundamental question: “Resilience to What? Resilience for Whom?” [61]. It is indeed evident that the adaptation process through NBS strictly depends on the site-specific knowledge of the biophysical functioning of the system [62,63].
These findings confirm that the local conditions of a catchment play a crucial role in the ecosystem performance. Once more, the spatial modeling shows remarkably different results, which depend on the location and the morphological specificity of the area of investigation. The third point mentions that topography, soil condition, landform and anthropic footprint significantly affect rainwater management [59,64,65]. According to the results, other districts such as Narlidere, Torbali and Urla (which have almost similar characteristics to Guzelbahce) have wide gaps between ordinary (yearly) end extraordinary (single event) water management, which means that where the system grows in size, complexity and heterogeneity, the estimation of biophysical performances in water management gets trickier [38,66,67]. In that case, modeling can be a crucial tool to facilitate the decision-making process for the system’s adaptation.
4.2. What Kind of NBS and Where?
Despite many studies pointing out the numerous benefits of tailor-made NBS for runoff mitigation [65,68,69], limited knowledge is available on the comprehensive spatial analysis of the performance of NBS for stormwater management in urban areas [70]. Plant-based technologies related to NBS, bioretention systems, green roofs and constructed wetlands are commonly used [71,72]. However, these NBS can only achieve partial advantages if not biophysically assessed. Their size, spatial boundaries and ecological compatibility affect their efficacy and location in the urban space [73].
Some empirical results in Veneto (Italy) [74] show that some typology of rain gardens, even with a small drainage area (10%), can reduce the runoff by more than 90% throughout infiltration and evapotranspiration. Other studies showed that green roofs made by a well-designed stratigraphy and abundant vegetation could reduce the yearly runoff by more than 60%. Vegetated roofs with a thin substrate layer (depth: < 15 cm) are called extensive roofs [75], while intensive roofs have a thicker substrate layer (depth: 20–200 cm) [59,76].
Other studies used i-Tree Hydro to simulate the impact of nature-based solutions on runoff control while demonstrating that after the combined implementation of rain gardens, permeable pavements and green rooftops, the average runoff mitigation can be, respectively, 45%, 42% and 35% [77]. The same study demonstrated that even though the rain gardens seem to be the best performing solution when only the urbanized area is considered, the porous pavements allow for the most significant control of runoff volumes. The reduction rises to 62% in the urban catchment while demonstrating, once again, that the permeability of urban areas seems to be the critical aspect of stormwater management.
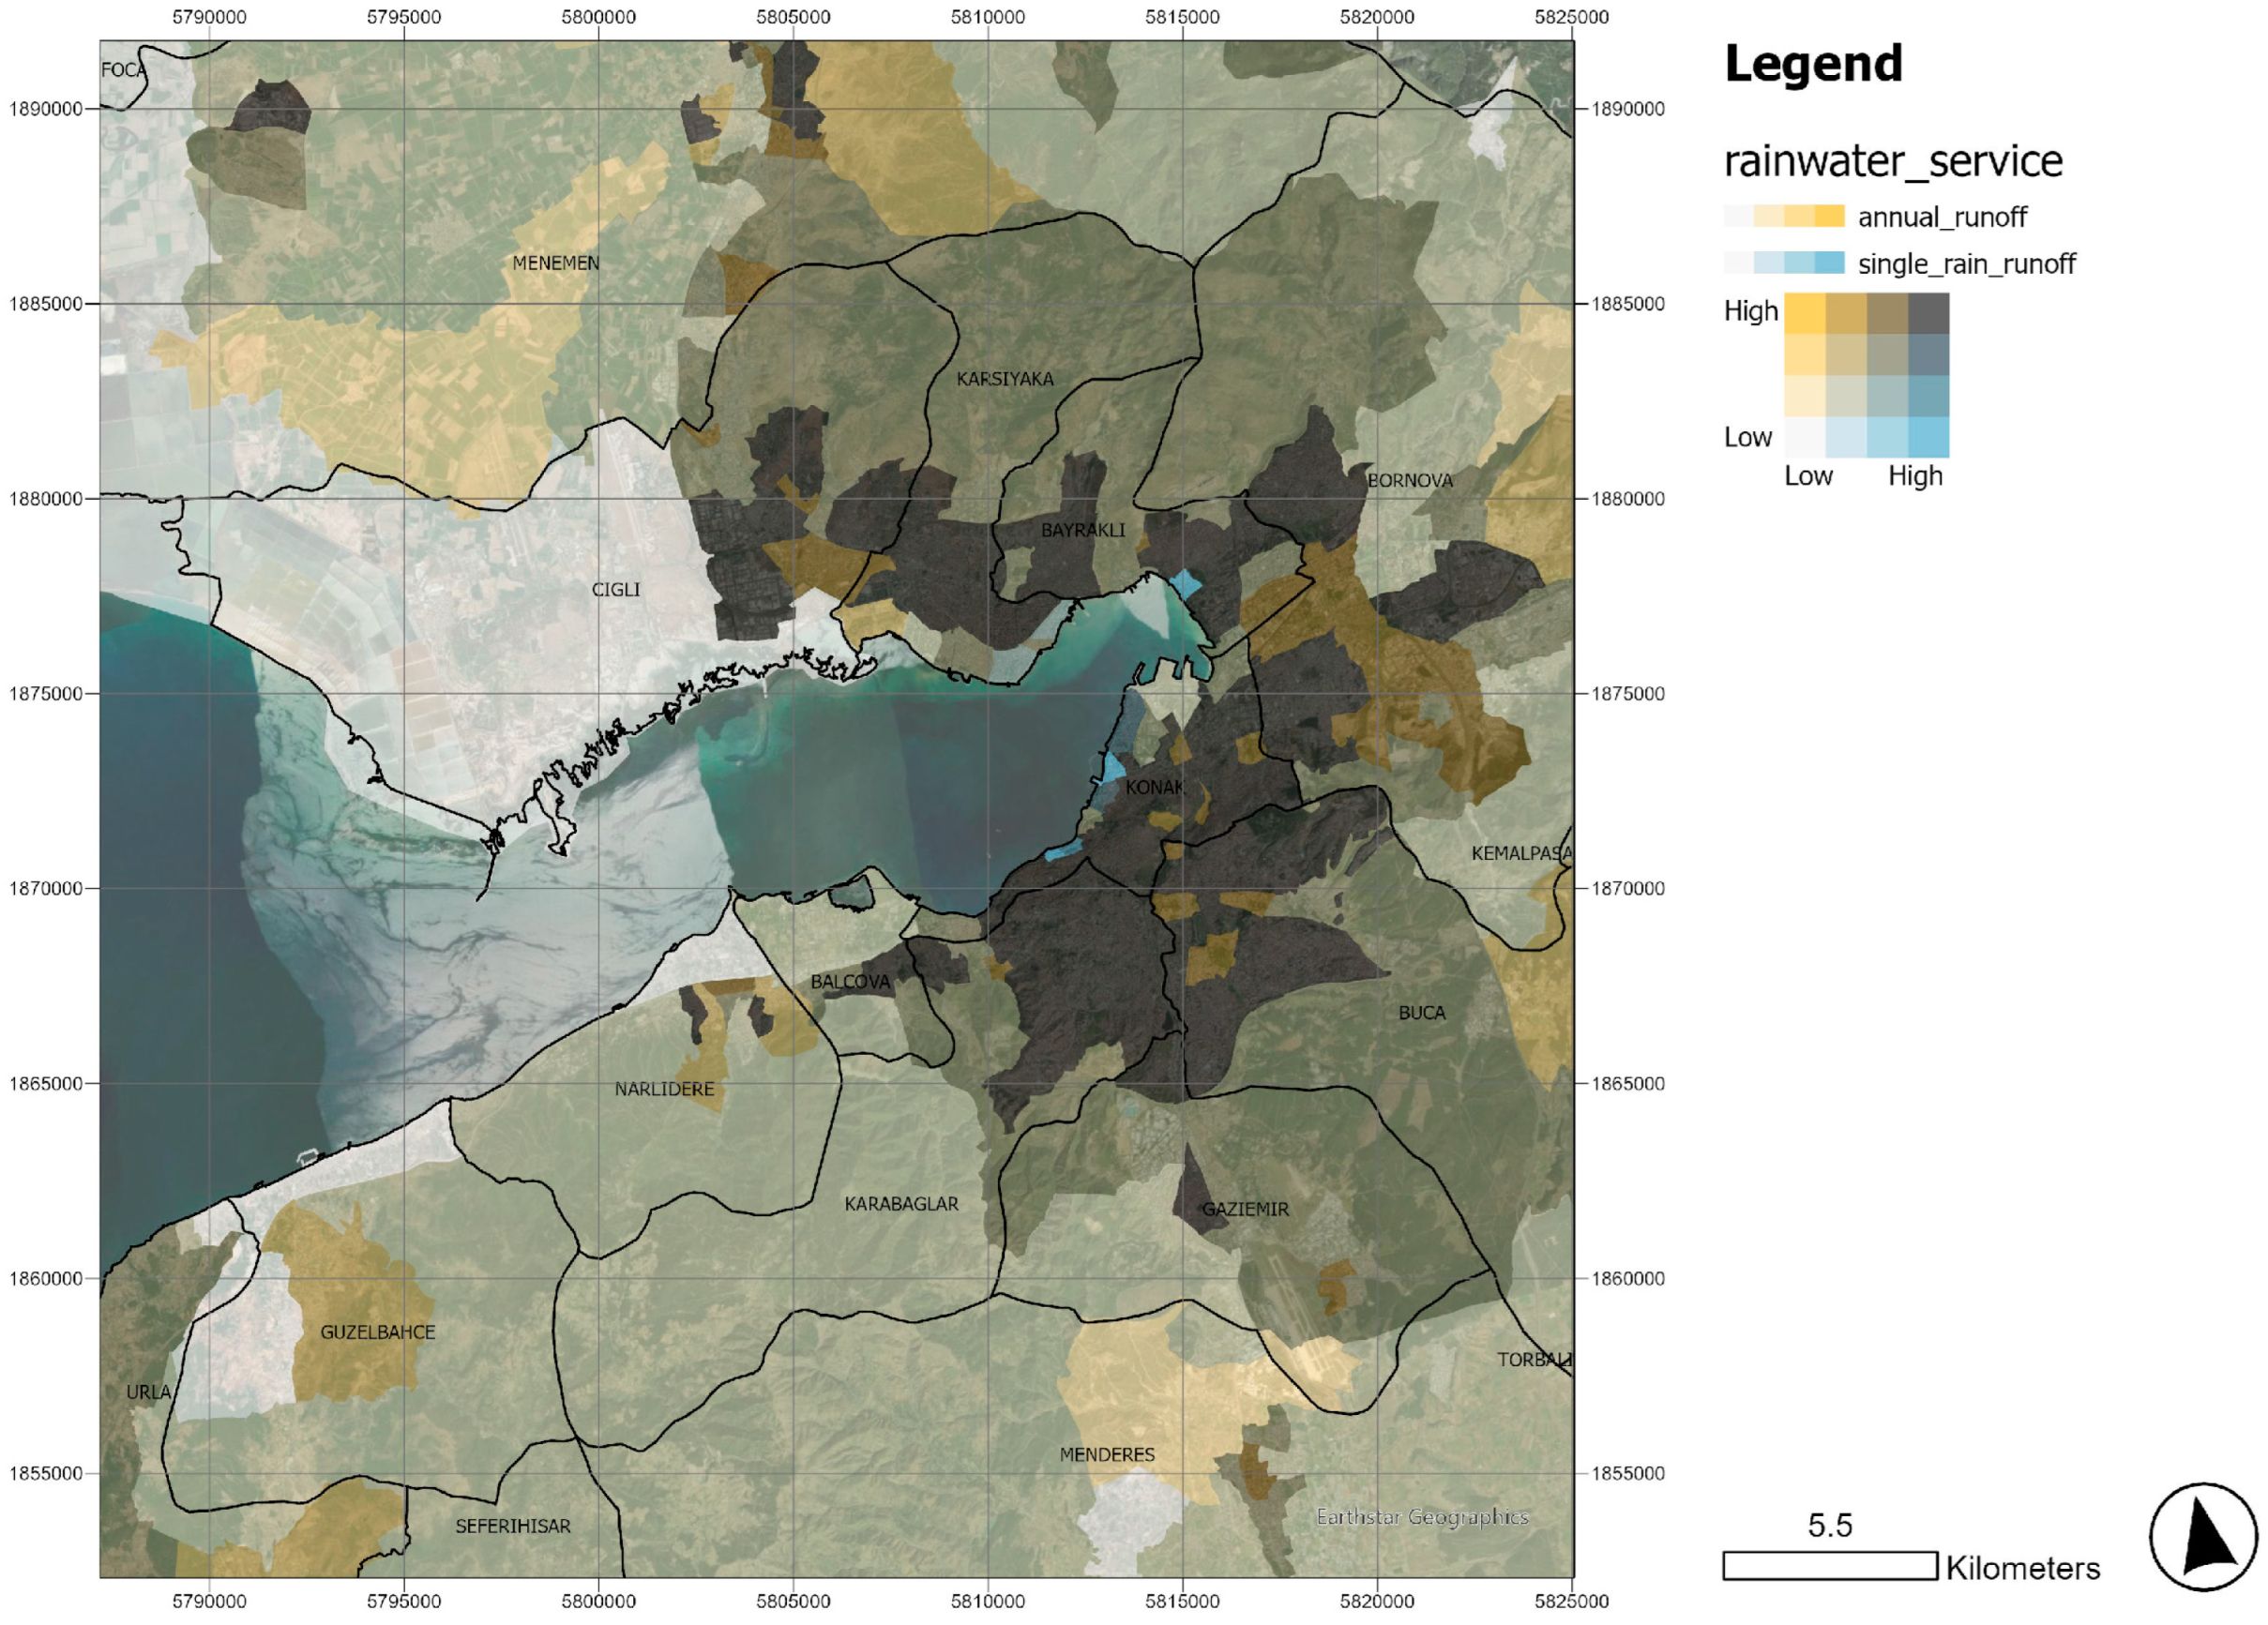
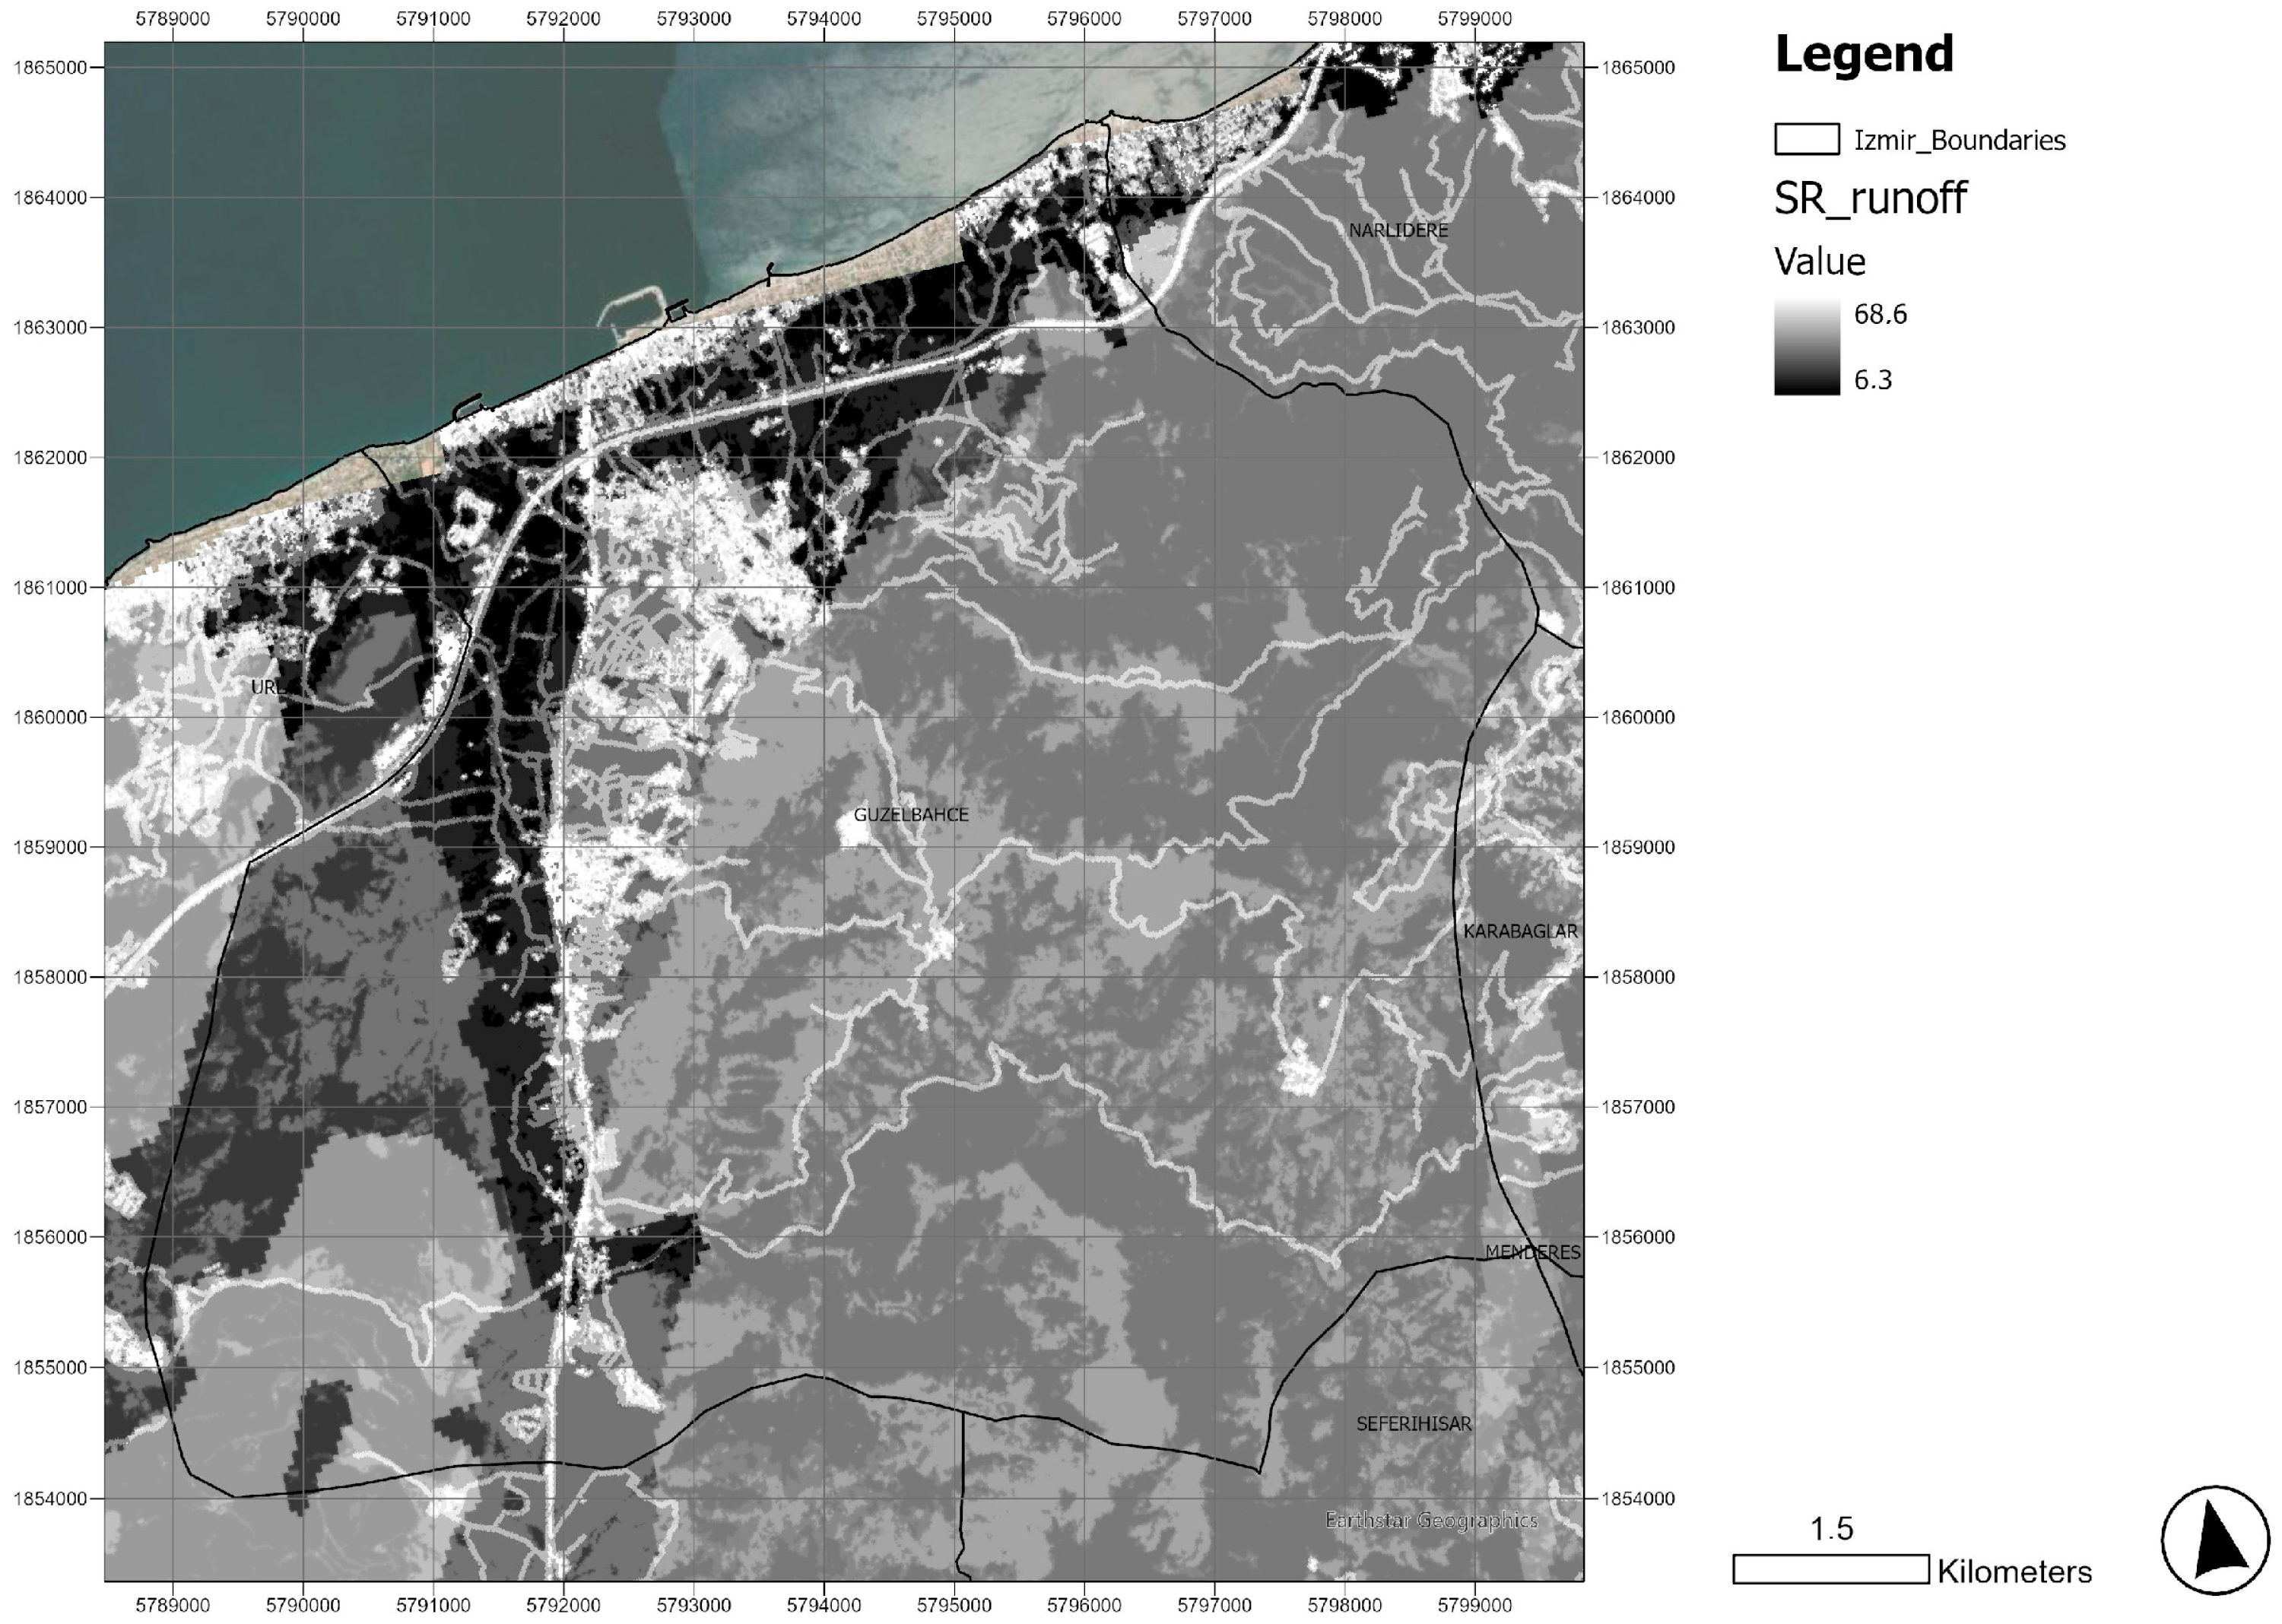
As is well known, creating a more porous, permeable, waterproof urban system is the key to coping with water management. However, the models demonstrated that the same quantity of NBS, if placed in the right spots, can achieve far more efficient water drainage than other solutions [78]. In the case of Guzelbahce, higher benefits can be achieved along the direction of Seferihisar, where the recent massive urban expansion of the neighborhood has been built on hydraulically compatible soils, thus generating a massive runoff problem in the city. The depermeabilization through different kinds of NBS in this area can be specifically targeted to decrease the yearly runoff while improving ordinary stormwater management. In addition, installing bioretention facilities on this neighborhood’s upstream side would help increase runoff biofiltration before it reaches the coastline while achieving a good performance over the long term.
Bioretention facilities can reduce runoff volumes by 54–98% and their hydrological performance (reduction of hydrologic instantaneous peak flow and delay in peak/lag time) depends on their size and location [79]. Having an average residential block size of 0.53 ha, Guzelbahce can prioritize the NBS interventions while targeting within the local building regulation the need to locate bioretention cells both in public or private areas, with a surface of at least 150 m2 (which, if placed in highly conductible soil can reduce runoff from 64% to 90%) [47,60,80].
Furthermore, the advancement of settlements from the coast to inland, particularly between the old road and the motorway, is saturating the most hydraulically compatible soils while rendering it highly critical to cope with stormwater management. Adopting semipermeable solutions for streets, public spaces or private gardens can achieve significantly higher benefits than other locations, as these settlements are placed on sedimentary soils with optimal drainage capacity. In these specific areas along the coastline, the attention to creating a more permeable and porous settlement system will generate significant benefits both for ordinary (yearly stormwater regulation) and extraordinary (cloudburst) rainwater management (see Figure 7).
Here, the limit is that if a waterproof approach is not adopted in ordinary planning, reaching a systematic and efficient approach to runoff reduction is almost impossible. Especially in Turkey, creating a solid regulatory legal environment around sustainable and resilient planning is far from being reached. Unfortunately, most current regulatory and legal environments for water management rely on grey infrastructure: construction sites invade uphill and downhill land while intercepting the upstream flows with pipes or concrete channels, the implementation of which creates several concomitant effects on stormwater management. Therefore, promoting this empirical approach as the base to build an NBS-efficient design framework can often be challenging. At any rate, rather than fostering drastic changes in the existing regulatory regimes, much can be achieved by promoting some common rules that can be adapted into the current regulatory framework:
- depermeabilization should be prioritized where soils are highly conductible. Otherwise, runoff retention will be scarce;
- annual stormwater management can be significantly improved by favoring evapotranspiration, even with minor interventions such as green roofs or even small water retention areas in private units;
- roads play a great role as surface interceptors; thus, their redesign with small infiltration tranches can significantly reduce both annual and temporary runoff;
- flash flood phenomena can be drastically limited while reducing the urban footprint in neighborhoods with barely adequate retention capacity. Here, the coupled integration of green and grey infrastructure can help to reduce the instantaneous flood peak.
In all cases, the biophysical knowledge of the retention capacity can significantly increase the rate of success for each intervention. In fact, as it is well recognized, both in the case of public and private intervention, the NBS implementation has high costs, it is time-consuming and has a limited possibility of being implemented everywhere, thus limiting its efficacy. That is why modeling can support the decision-making process around selecting the areas where the NBS should be prioritized.
4.3. Limits and Potentialities
Many limitations affect this research. The first and most evident is that the two analyzed ecosystem models are not comparable; thus, it is not with that lens that this work can inspire future research. Moreover, their results are always far from representing a real situation even if used in an integrative, not comparative, way. The problem with runoff management is that no field measures can cover big catchments while comprehensively quantifying the potential rainwater surface movement during yearly or short-term rain events. Peak flows can be measured on the stream network, but these volumes do not represent the runoff quantity.
Apropos, the assumption that modeling can represent reality is wrong, even in the case of highly complex models. Nevertheless, instead of expecting models to quantify the biophysical performance of a system exactly, their added value is, in any case, the possibility to (i) obtain a spatial assessment of the performance, thus understanding the location of vulnerable areas and (ii) use the model to evaluate land use alternatives for simulated NBS implementation and understand at least the range of benefits that the system can achieve. As for the second point mentioned here, it has to be claimed that another substantial limitation of this research was not having evaluated the potential benefits of NBS application in some selected catchments (Guzelbahce and Konak). At any rate, it was not the original intention of this initial work to further inquiry in this direction.
Lastly, the high degree of variation in the impacts of ecosystems on hydrology (depending on ecosystem type or subtype, location, condition, climate and management) determines the impossibility of reaching generalized assumptions about NBS. For example, green areas, rooftops, infiltration trenches or even single trees can increase or decrease groundwater recharge according to their type, density, location, size and age.
However, even though limited or partial, modeling is mindful when used to build knowledge around decision-making as it provides a holistic view of the characteristics of urban systems.
5. Conclusions
Adaptation to climate change requires a sound knowledge of the local urban vulnerabilities. Among various types of hazards, water-related hazards can be of various typologies: pluvial flooding, riverine flooding and sea overflowing. This work dealt with the first typology while selecting the catchment of Izmir as it is one of the Mediterranean basin’s most dynamic and water-sensitive cities.
In the selected AOI, two ecosystem service models were employed to check where and with what intensity the city is vulnerable to different water-related threats. The first employed model was the pluvial flooding mitigation, while the second was the stormwater retention. Respectively, the models calculate the biophysical capacity of the system to respond to flash rains (single events) versus long-term (annual) precipitation. The results were used to generate a comprehensive portrait of the water sensitivity for each Izmir neighborhood to different rainwater phenomena. Surprisingly, it has been found that the rainwater retention capacity can vary significantly if the runoff retention is considered in the single flash rain or in the annual rain. Thus, although positively related, the biophysical performance is not always equal.
To further analyze this aspect, the two most paradigmatic neighborhoods were deeply investigated in terms of the maximum and minimum difference between flash and annual rain retention. Konak and Guzelbahce were two districts, the peculiarities of which were used to define some specific, tailor-made NBS.
This work intends to demonstrate how modeling provides a chance to deepen the understanding of an urban system when correctly and not banally or pretentiously utilized. Unfortunately, the complete comprehension of the multiple interactions that can generate flooding in urban areas cannot be fully understood/predicted by modeling. At the same time, ignoring the potential associated with the technological utilization of modeling to support decision-making can be at high risk if adaptation is currently considered a non-negotiable action for densely inhabited urban areas.
In fact, the so-called adaptation is only a slippery, umbrella concept if there is no concrete spatial assessment of the type, topology, spatial distribution and intensity of the multiple vulnerabilities. The famous question “resilience for what and to whom” [61] can find a partial answer only if the spatial knowledge made by modeling creates a robust empirical assessment around the decision-making to suggest, indicate and elaborate real solutions.
Even though upon an initial, superficial glance, this process can be blamed for being technologically negative, impersonal or exclusive, as it cut out of debate the socio-political sphere of decision-making, upon an in-depth evaluation, modeling can be of crucial help when decisions should be made around highly complicated situations and especially under high uncertainty of knowledge and of potential results. Instead of “fixing” the outcomes as consolidated, this research brought even more contradictions, tensions and demands, even though dealing with numerical models. Questions about comparability, simplifications and potential utilizations were raised during the development of the research. This process can enormously enrich the basis for expert knowledge and build more awareness, bringing wiser and more informed participation in planning [81]. Modeling itself is not an “alternative” to human evaluation but creates the precondition to understanding uncertainties with a sharper view.
To conclude, the abovementioned considerations strengthen an old fashioned paradigm of urban planning: sound governance is rooted in empirical, staged knowledge. Dealing with climate change, especially in highly complex urban systems, requires cautious and prudent approaches, being careful in the solutions. Without offering anything revolutionary, this research contributed to paving the road along the process of adaptation. Undoubtedly, it constitutes only the first step to open up calls to further investigation into the same subject.
Funding
This research received no external funding.
Institutional Review Board Statement
Not applicable.
Informed Consent Statement
Not applicable.
Data Availability Statement
The output of the modeling process can be shared upon request.
Acknowledgments
I want to thank Silvia Ronchi and Andrea Benedini for having shared their thoughts with me during the manuscript preparation.
Conflicts of Interest
The author declares no conflict of interest.
References
- Kremer, P.; Hamstead, Z.A.; McPhearson, T. The Value of Urban Ecosystem Services in New York City: A Spatially Explicit Multicriteria Analysis of Landscape Scale Valuation Scenarios. Environ. Sci. Policy 2015, 62, 57–68. [Google Scholar] [CrossRef]
- Burkhard, B.; Kroll, F.; Nedkov, S.; Müller, F. Mapping Ecosystem Service Supply, Demand and Budgets. Ecol. Indic. 2012, 21, 17–29. [Google Scholar] [CrossRef]
- Duarte, G.T.; Ribeiro, M.C.; Paglia, A.P.; Csuti, B.; Fackler, P.; Lonsdorf, E. Ecosystem Services Modeling as a Tool for Defining Priority Areas for Conservation. PLoS ONE 2016, 11, e0154573. [Google Scholar] [CrossRef] [PubMed] [Green Version]
- Mueller, N.; Rojas-Rueda, D.; Khreis, H.; Cirach, M.; Andrés, D.; Ballester, J.; Bartoll, X.; Daher, C.; Deluca, A.; Echave, C.; et al. Changing the Urban Design of Cities for Health: The Superblock Model. Environ. Int. 2020, 134, 105132. [Google Scholar] [CrossRef] [PubMed]
- Pelorosso, R.; Gobattoni, F.; Leone, A. Increasing Hydrological Resilience Employing Nature-Based Solutions: A Modelling Approach to Support Spatial Planning. In Smart Planning: Sustainability and Mobility in the Age of Change; Papa, R., Fistola, R., Gargiulo, C., Eds.; Springer International Publishing: Cham, Switzerland, 2018; pp. 71–82. ISBN 978-3-319-77682-8. [Google Scholar]
- Kastridis, A.; Kamperidou, V.; Stathis, D. Dendroclimatological Analysis of Fir (A. Borisii-Regis) in Greece in the Frame of Climate Change Investigation. Forests 2022, 13, 879. [Google Scholar] [CrossRef]
- Todaro, V.; D’Oria, M.; Secci, D.; Zanini, A.; Tanda, M.G. Climate Change over the Mediterranean Region: Local Temperature and Precipitation Variations at Five Pilot Sites. Water 2022, 14, 2499. [Google Scholar] [CrossRef]
- Mersin, D.; Tayfur, G.; Vaheddoost, B.; Safari, M.J.S. Historical Trends Associated with Annual Temperature and Precipitation in Aegean Turkey, Where Are We Heading? Sustainability 2022, 14, 13380. [Google Scholar] [CrossRef]
- Maragno, D.; Dall’omo, C.F.; Pozzer, G.; Musco, F. Multi-Risk Climate Mapping for the Adaptation of the Venice Metropolitan Area. Sustainability 2021, 13, 1334. [Google Scholar] [CrossRef]
- Sala, S.; Ciuffo, B.; Nijkamp, P. A Systemic Framework for Sustainability Assessment. Ecol. Econ. 2015, 119, 314–325. [Google Scholar] [CrossRef]
- Demuzere, M.; Orru, K.; Heidrich, O.; Olazabal, E.; Geneletti, D.; Orru, H.; Bhave, A.G.; Mittal, N.; Feliu, E.; Faehnle, M. Mitigating and Adapting to Climate Change: Multi-Functional and Multi-Scale Assessment of Green Urban Infrastructure. J. Environ. Manag. 2014, 146, 107–115. [Google Scholar] [CrossRef]
- Tzioutzios, C.; Kastridis, A. Multi-Criteria Evaluation (MCE) Method for the Management of Woodland Plantations in Floodplain Areas. ISPRS Int. J. Geo-Inf. 2020, 9, 725. [Google Scholar] [CrossRef]
- Yin, J.; Yu, D.; Yin, Z.; Wang, J.; Xu, S. Modelling the Anthropogenic Impacts on Fluvial Flood Risks in a Coastal Mega-City: A Scenario-Based Case Study in Shanghai, China. Landsc. Urban Plan. 2015, 136, 144–155. [Google Scholar] [CrossRef]
- Stark, D. On Resilience. Soc. Sci. 2014, 3, 60–70. [Google Scholar] [CrossRef] [Green Version]
- Delattre, L.; Chanel, O.; Livenais, C.; Napoléone, C. Combining Discourse Analyses to Enrich Theory: The Case of Local Land-Use Policies in South Eastern France. Ecol. Econ. 2015, 113, 60–75. [Google Scholar] [CrossRef]
- Childers, D.L.; Pickett, S.T.A.; Grove, J.M.; Ogden, L.; Whitmer, A. Advancing Urban Sustainability Theory and Action: Challenges and Opportunities. Landsc. Urban Plan. 2014, 125, 320–328. [Google Scholar] [CrossRef]
- Richter, C. From Base Map to Inductive Mapping-Three Cases of GIS Implementation in Cities of Karnataka, India. Compr. Geogr. Inf. Syst. 2017, 3, 411–421. [Google Scholar] [CrossRef]
- Holling, C.S. Engineering Resilience versus Ecological Resilience. Eng. Ecol. Constraints 1996, 31, 32. [Google Scholar] [CrossRef]
- Gómez-Baggethun, E.; Barton, D.N. Classifying and Valuing Ecosystem Services for Urban Planning. Ecol. Econ. 2012, 86, 235–245. [Google Scholar] [CrossRef]
- Holling, C.S. Resilience and Stability of Ecological Systems. Annu. Rev. Ecol. Syst. 1973, 4, 1–23. [Google Scholar] [CrossRef] [Green Version]
- Box, G.E.P. Science and Statistics. J. Am. Stat. Assoc. 1976, 71, 791–799. [Google Scholar] [CrossRef]
- McPhearson, T.; Cook, E.M.; Berbés-Blázquez, M.; Cheng, C.; Grimm, N.B.; Andersson, E.; Barbosa, O.; Chandler, D.G.; Chang, H.; Chester, M.V.; et al. A Social-Ecological-Technological Systems Framework for Urban Ecosystem Services. One Earth 2022, 5, 505–518. [Google Scholar] [CrossRef]
- White, I.; O’Hare, P. From Rhetoric to Reality: Which Resilience, Why Resilience, and Whose Resilience in Spatial Planning? Environ. Plan. C Gov. Policy 2014, 32, 934–950. [Google Scholar] [CrossRef]
- Toparlar, Y. The Effect of an Urban Park on the Microclimate in Its Vicinity: A Case Study for Antwerp, Belgium. Int. J. Climatol. 2018, 38, e303–e322. [Google Scholar] [CrossRef] [Green Version]
- Zardo, L.; Geneletti, D.; Pérez-soba, M.; Eupen, M. Van Estimating the Cooling Capacity of Green Infrastructures to Support Urban Planning. Ecosyst. Serv. 2017, 26, 225–235. [Google Scholar] [CrossRef]
- Weichselgartner, J.; Kelman, I. Geographies of Resilience: Challenges and Opportunities of a Descriptive Concept. Prog. Hum. Geogr. 2015, 39, 249–267. [Google Scholar] [CrossRef] [Green Version]
- Cumming, G.S.; Peterson, G.D. Unifying Research on Social—Ecological Resilience and Collapse. Trends Ecol. Evol. 2017, 32, 695–713. [Google Scholar] [CrossRef]
- Towfiqul Islam, A.R.M.; Talukdar, S.; Mahato, S.; Kundu, S.; Eibek, K.U.; Pham, Q.B.; Kuriqi, A.; Linh, N.T.T. Flood Susceptibility Modelling Using Advanced Ensemble Machine Learning Models. Geosci. Front. 2021, 12, 101075. [Google Scholar] [CrossRef]
- Pickett, S.T.A.; Cadenasso, M.L.; Grove, J.M. Resilient Cities: Meaning, Models, and Metaphor for Integrating the Ecological, Socio-Economic, and Planning Realms. Landsc. Urban Plan. 2004, 69, 369–384. [Google Scholar] [CrossRef]
- Grillenzoni, C. Design of Blurring Mean-Shift Algorithms for Data Classification. J. Classif. 2016, 33, 262–281. [Google Scholar] [CrossRef]
- Moonen, P.; Defraeye, T.; Dorer, V.; Blocken, B.; Carmeliet, J. Urban Physics: Effect of the Micro-Climate on Comfort, Health and Energy Demand. Front. Archit. Res. 2012, 1, 197–228. [Google Scholar] [CrossRef] [Green Version]
- Bhaskaran, S.; Paramananda, S.; Ramnarayan, M. Per-Pixel and Object-Oriented Classification Methods for Mapping Urban Features Using Ikonos Satellite Data. Appl. Geogr. 2010, 30, 650–665. [Google Scholar] [CrossRef]
- Mekhaimr, S.A.; Abdel Wahab, M.M. Sources of Uncertainty in Atmospheric Dispersion Modeling in Support of Comprehensive Nuclear–Test–Ban Treaty Monitoring and Verification System. Atmos. Pollut. Res. 2019, 10, 1383–1395. [Google Scholar] [CrossRef]
- Mascarenhas, A.; Ramos, T.B.; Haase, D.; Santos, R. Ecosystem Services in Spatial Planning and Strategic Environmental Assessment-A European and Portuguese Profile. Land Use Policy 2015, 48, 158–169. [Google Scholar] [CrossRef]
- Rosenzweig, B.; Ruddell, B.L.; Mcphillips, L.; Hobbins, R.; Mcphearson, T.; Cheng, Z.; Chang, H.; Kim, Y. Developing Knowledge Systems for Urban Resilience to Cloudburst Rain Events. Environ. Sci. Policy 2019, 99, 150–159. [Google Scholar] [CrossRef]
- Mutani, G.; Casalengo, M.; Ramassotto, M.A. The Effect of Roof-Integrated Solar Technologies on the Energy Performance of Public Buildings: Tthe Case Study of the City of Turin (IT). In Proceedings of the INTELEC, International Telecommunications Energy Conference (Proceedings), Turin, Italy, 7–11 October 2018. [Google Scholar]
- European Commission Covenants of Mayors—Europe. Available online: https://eu-mayors.ec.europa.eu/en/home (accessed on 5 November 2022).
- Sjöman, J.D.; Gill, S.E. Residential Runoff—The Role of Spatial Density and Surface Cover, with a Case Study in the Höjeå River Catchment, Southern Sweden. Urban For. Urban Green. 2014, 13, 304–314. [Google Scholar] [CrossRef]
- Grilo, F.; Pinho, P.; Aleixo, C.; Catita, C.; Silva, P.; Lopes, N.; Freitas, C.; Santos-Reis, M.; McPhearson, T.; Branquinho, C. Using Green to Cool the Grey: Modelling the Cooling Effect of Green Spaces with a High Spatial Resolution. Sci. Total Environ. 2020, 724, 138182. [Google Scholar] [CrossRef] [PubMed]
- Venter, Z.S.; Barton, D.N.; Martinez-Izquierdo, L.; Langemeyer, J.; Baró, F.; McPhearson, T. Interactive Spatial Planning of Urban Green Infrastructure—Retrofitting Green Roofs Where Ecosystem Services Are most Needed in Oslo. Ecosyst. Serv. 2021, 50, 101314. [Google Scholar] [CrossRef]
- Lopes, C.M.; Costa, J.M.; Egipto, R.; Zarrouk, O.; Chaves, M.M. Can Mediterranean Terroirs Withstand Climate Change? Case Studies at the Alentejo Portuguese Winegrowing Region. E3S Web Conf. 2018, 50, 01004. [Google Scholar] [CrossRef]
- Ihobe Environmental Management Agency. Nature-Based Solutions for Local Climate Adaptation in the Basque Country; Ihobe Environmental Management Agency: Bilbao, Spain, 2017. [Google Scholar]
- Butsic, V.; Shapero, M.; Moanga, D.; Larson, S. Using InVEST to Assess Ecosystem Services on Conserved Properties in Sonoma County, CA. Calif. Agric. 2017, 71, 81–89. [Google Scholar] [CrossRef] [Green Version]
- Nelson, E.; Ennaanay, D.; Wolny, S.; Olwero, N.; Vigerstol, K.; Pennington, D.; Mendoza, G.; Aukema, J.; Foster, J.; Forrest, J.; et al. InVEST 2.0 Beta User’s Guide: Integrated Valuation of Ecosystem Services and Tradeoffs. Available online: http://data.naturalcapitalproject.org/nightly-build/invest-users-guide/html/ (accessed on 20 December 2022).
- Abdrabo, K.I.; Kantosh, S.A.; Saber, M.; Sumi, T.; Omar, M. The Role of Urban Planning Tools in Flash Flood Risk Reduction for The Urban Arid and Semi-Arid Regions. In Wadi Flash Floods. Natural Disaster Science and Mitigation Engineering: DPRI Reports; Sumi, T., Kantoush, S.A., Saber, M., Eds.; Springer: Singapore, 2022. [Google Scholar]
- Exall, K.; Vassos, T.D. Integrated Urban Water Management: Water Use and Reuse. In Metropolitan Sustainability: Understanding and Improving the Urban Environment; Elsevier Ltd.: Amsterdam, The Netherlands, 2012; pp. 319–349. ISBN 9780857090461. [Google Scholar]
- Dunnett, N.; Nagase, A.; Booth, R.; Grime, P. Influence of Vegetation Composition on Runoff in Two Simulated Green Roof Experiments. Urban Ecosyst. 2008, 11, 385–398. [Google Scholar] [CrossRef]
- Velibeyoğlu, K.; Özdemir, S.; Baba, A.; Arsan, Z.D.; Yazdani, H.; Hazar, D.; Kaplan, A.; Boyacı, M.; Kurucu, Y.; Erdoğan, N.; et al. ‘Urla-Çeşme-Karaburun’ Peninsula Sustainable Development Strategy 2014–2023; İZKA (İzmir Development Agency): Izmir, Turkey, 2014. [Google Scholar]
- Salata, S.; Özkavaf-Şenalp, S.; Velibeyoğlu, K. Integrating Ecosystem Vulnerability in the Environmental Regulation Plan of Izmir (Turkey) & What Are the Limits and Potentialities? Urban Sci. 2022, 6, 19. [Google Scholar] [CrossRef]
- TURKSTAT Turkish Statistical Institute. Address Based Population Registration System. Available online: https://www.tuik.gov.tr/Home/Index (accessed on 10 January 2023).
- Coskun Hepcan, C. Quantifying Landscape Pattern and Connectivity in a Mediterranean Coastal Settlement: The Case of the Urla District, Turkey. Environ. Monit. Assess. 2013, 185, 143–155. [Google Scholar] [CrossRef] [PubMed]
- Salata, S.; Couch, V.T. Monitoring Soil Degradation Processes for Ecological Compensation in the Izmir Institute of Technology Campus (Turkey). Eng 2022, 3, 325–342. [Google Scholar] [CrossRef]
- Ozkan, S.P.; Tarhan, C. Detection of Flood Hazard in Urban Areas Using GIS: Izmir Case. Procedia Technol. 2016, 22, 373–381. [Google Scholar] [CrossRef] [Green Version]
- Saraiva, A.; Presumido, P.; Silvestre, J.; Feliciano, M.; Rodrigues, G.; Oliveira e Silva, P.; Damásio, M.; Ribeiro, A.; Ramôa, S.; Ferreira, L.; et al. Water Footprint Sustainability as a Tool to Address Climate Change in the Wine Sector: A Methodological Approach Applied to a Portuguese Case Study. Atmosphere 2020, 11, 934. [Google Scholar] [CrossRef]
- Borrelli, P.; Lugato, E.; Montanarella, L.; Panagos, P. A New Assessment of Soil Loss Due to Wind Erosion in European Agricultural Soils Using a Quantitative Spatially Distributed Modelling Approach. Land Degrad. Dev. 2017, 28, 335–344. [Google Scholar] [CrossRef] [Green Version]
- Salata, S.; Velibeyoğlu, K.; Baba, A.; Saygın, N.; Couch, V.T.; Uzelli, T. Adapting Cities to Pluvial Flooding: The Case of Izmir (Türkiye). Sustainability 2022, 14, 16418. [Google Scholar] [CrossRef]
- Armson, D.; Stringer, P.; Ennos, A.R. The Effect of Street Trees and Amenity Grass on Urban Surface Water Runoff in Manchester, UK. Urban For. Urban Green. 2013, 12, 282–286. [Google Scholar] [CrossRef]
- City of Copenhagen Cloudburst Management Plan 2012; The Technical and Environmental Administration: Copenhagen, Denmark, 2012; pp. 1–28.
- Li, Y.; Huang, Y.; Ye, Q.; Zhang, W.; Meng, F.; Zhang, S. Multi-Objective Optimization Integrated with Life Cycle Assessment for Rainwater Harvesting Systems. J. Hydrol. 2018, 558, 659–666. [Google Scholar] [CrossRef]
- Asleson, B.C.; Nestingen, R.S.; Gulliver, J.S.; Hozalski, R.M.; Nieber, J.L. Performance Assessment of Rain Gardens. J. Am. Water Resour. Assoc. 2009, 45, 1019–1031. [Google Scholar] [CrossRef]
- Cutter, S.L. Resilience to What? Resilience for Whom? Geogr. J. 2016, 182, 110–113. [Google Scholar] [CrossRef]
- Hartkamp, A.D.; White, J.W.; Hoogenboom, G. Interfacing Geographic Information Systems with Agronomic Modeling: A Review. Agron. J. 1999, 91, 761–772. [Google Scholar] [CrossRef]
- Borrego, C.; Amorim, J.H.; Tchepel, O.; Dias, D.; Rafael, S.; Sá, E.; Pimentel, C.; Fontes, T.; Fernandes, P.; Pereira, S.R.; et al. Urban Scale Air Quality Modelling Using Detailed Traffic Emissions Estimates. Atmos. Environ. 2016, 131, 341–351. [Google Scholar] [CrossRef] [Green Version]
- David, T.S.; Gash, J.H.C.; Valente, F.; Pereira, J.S.; Ferreira, M.I.; David, J.S. Rainfall Interception by an Isolated Evergreen Oak Tree in a Mediterranean Savannah. Hydrol. Process. 2006, 20, 2713–2726. [Google Scholar] [CrossRef]
- Zölch, T.; Henze, L.; Keilholz, P.; Pauleit, S. Regulating Urban Surface Runoff through Nature-Based Solutions—An Assessment at the Micro-Scale. Environ. Res. 2017, 157, 135–144. [Google Scholar] [CrossRef] [PubMed]
- Zhang, S.; Fan, W.; Li, Y.; Yi, Y. The Influence of Changes in Land Use and Landscape Patterns on Soil Erosion in a Watershed. Sci. Total Environ. 2017, 574, 34–45. [Google Scholar] [CrossRef]
- Wang, C.; Hou, J.; Miller, D.; Brown, I.; Jiang, Y. Flood Risk Management in Sponge Cities: The Role of Integrated Simulation and 3D Visualization. Int. J. Disaster Risk Reduct. 2019, 39, 101139. [Google Scholar] [CrossRef] [Green Version]
- Ruangpan, L.; Vojinovic, Z.; Di Sabatino, S.; Leo, L.S.; Capobianco, V.; Oen, A.M.P.; McClain, M.E.; Lopez-Gunn, E. Nature-Based Solutions for Hydro-Meteorological Risk Reduction: A State-of-the-Art Review of the Research Area. Nat. Hazards Earth Syst. Sci. 2020, 20, 243–270. [Google Scholar] [CrossRef] [Green Version]
- Watkin, L.J.; Ruangpan, L.; Vojinovic, Z.; Weesakul, S.; Torres, A.S. A Framework for Assessing Benefits of Implemented Nature-Based Solutions. Sustainability 2019, 11, 6788. [Google Scholar] [CrossRef] [Green Version]
- Biswal, B.K.; Bolan, N.; Zhu, Y.G.; Balasubramanian, R. Nature-Based Systems (NbS) for Mitigation of Stormwater and Air Pollution in Urban Areas: A Review. Resour. Conserv. Recycl. 2022, 186, 106578. [Google Scholar] [CrossRef]
- Norton, B.A.; Coutts, A.M.; Livesley, S.J.; Harris, R.J.; Hunter, A.M.; Williams, N.S.G. Planning for Cooler Cities: A Framework to Prioritise Green Infrastructure to Mitigate High Temperatures in Urban Landscapes. Landsc. Urban Plan. 2015, 134, 127–138. [Google Scholar] [CrossRef]
- Vidal, D.G.; Barros, N.; Maia, R.L. Public and Green Spaces in the Context of Sustainable Development. In Sustainable Cities and Communities, Encyclopedia of the UN Sustainable Development Goals; Leal Filho, W., Azul, A.M., Brandli, L., Özuyar, P.G., Wall, T., Eds.; Springer Nature Switzerland AG: Cham, Switzerland, 2020; pp. 1–9. ISBN 978-3-319-95718-0. [Google Scholar]
- Calliari, E.; Castellari, S.; Davis, M.; Linnerooth-Bayer, J.; Martin, J.; Mysiak, J.; Pastor, T.; Ramieri, E.; Scolobig, A.; Sterk, M.; et al. Building Climate Resilience through Nature-Based Solutions in Europe: A Review of Enabling Knowledge, Finance and Governance Frameworks. Clim. Risk Manag. 2022, 37, 100450. [Google Scholar] [CrossRef]
- Vanderhaegen, S.; De Munter, K.; Canters, F. High resolution modelling and forecasting of soil sealing density at the regional scale. Landsc. Urban Plan. 2015, 133, 133–142. [Google Scholar] [CrossRef]
- Xie, P.; Wu, Z.; Sang, Y.F.; Gu, H.; Zhao, Y.; Singh, V.P. Evaluation of the Significance of Abrupt Changes in Precipitation and Runoff Process in China. J. Hydrol. 2018, 560, 451–460. [Google Scholar] [CrossRef]
- Li, H.; Wang, S.; Ji, G.; Zhang, L. Changes in Land Use and Ecosystem Service Values in Jinan, China. Energy Procedia 2011, 5, 1109–1115. [Google Scholar] [CrossRef] [Green Version]
- Bortolini, L.; Zanin, G. Hydrological Behaviour of Rain Gardens and Plant Suitability: A Study in the Veneto Plain (North-Eastern Italy) Conditions. Urban For. Urban Green. 2018, 34, 121–133. [Google Scholar] [CrossRef]
- Richards, P.J.; Williams, N.S.G.; Fletcher, T.D.; Farrell, C. Can Raingardens Produce Food and Retain Stormwater? Effects of Substrates and Stormwater Application Method on Plant Water Use, Stormwater Retention and Yield. Ecol. Eng. 2017, 100, 165–174. [Google Scholar] [CrossRef]
- Laurenson, G.; Laurenson, S.; Bolan, N.; Beecham, S.; Clark, I. Chapter Four—The Role of Bioretention Systems in the Treatment of Stormwater; Sparks, D.L., Ed.; Advances in Agronomy; Academic Press: Cambridge, MA, USA, 2013; Volume 120, pp. 223–274. [Google Scholar]
- Fletcher, T.D.; Andrieu, H.; Hamel, P. Understanding, Management and Modelling of Urban Hydrology and Its Consequences for Receiving Waters: A State of the Art. Adv. Water Resour. 2013, 51, 261–279. [Google Scholar] [CrossRef]
- Tapio, P. From Technocracy to Participation?: Positivist, Realist and Pragmatist Paradigms Applied to Traffic and Environmental Policy Futures Research in Finland. Futures 1996, 28, 453–470. [Google Scholar] [CrossRef]
Figure 1.
Area of interest. Izmir Metropolitan City (source: author’s elaboration on administrative boundary layers of European Environmental Agency).
Figure 1.
Area of interest. Izmir Metropolitan City (source: author’s elaboration on administrative boundary layers of European Environmental Agency).

Figure 2.
Raster map of land use land cover (LULC) with an indication of the imperviousness degree (imp_rate). Source: author’s elaboration based on EEA dataset: Imperviousness High-Resolution Layer 2018 (HRL); Tree Cover Density 2018 (TCD) and Urban Atlas 2018.
Figure 2.
Raster map of land use land cover (LULC) with an indication of the imperviousness degree (imp_rate). Source: author’s elaboration based on EEA dataset: Imperviousness High-Resolution Layer 2018 (HRL); Tree Cover Density 2018 (TCD) and Urban Atlas 2018.

Figure 3.
Raster map of soil hydrologic group. Source: group classification of geological units around İzmir made by Salata and Uzelli 2022.
Figure 3.
Raster map of soil hydrologic group. Source: group classification of geological units around İzmir made by Salata and Uzelli 2022.

Figure 4.
Map integration. flood risk mitigation and stormwater management performance. Source: author’s elaboration on InVEST output.
Figure 4.
Map integration. flood risk mitigation and stormwater management performance. Source: author’s elaboration on InVEST output.

Figure 5.
Runoff maps. flood risk mitigation (left) and stormwater management (right). Source: author’s elaboration elaborated by InVEST.
Figure 5.
Runoff maps. flood risk mitigation (left) and stormwater management (right). Source: author’s elaboration elaborated by InVEST.

Figure 6.
Izmir’s neighborhoods. Guzelbahce (left) and Konak (right). Source: Author’s elaboration.

Figure 7.
Guzelbahce’s annual runoff. Source: InVEST output.


Table 1.
Land use composition in the Izmir metropolitan area between 1990 and 2018. Acknowledgment or credit of the Copernicus Sentinel data collection acquired through the Sentinel Hub services. Originally downloaded from Copernicus Sentinel data processed by User.
Table 1.
Land use composition in the Izmir metropolitan area between 1990 and 2018. Acknowledgment or credit of the Copernicus Sentinel data collection acquired through the Sentinel Hub services. Originally downloaded from Copernicus Sentinel data processed by User.
| Land Use Composition (ha) | ||||||
|---|---|---|---|---|---|---|
| Urban | Green urban areas | Agriculture | Natural | Humid areas | Water bodies | |
| 1990 | 31,218 | 2159 | 501,798 | 644,080 | 6553 | 3079 |
| 2018 | 62,359 | 4160 | 475,692 | 633,802 | 6308 | 6566 |
Table 2.
Soil hydraulic conductivity parameters. Source: InVEST User’s Guide available at: https://invest-userguide.readthedocs.io/en/latest/urban_flood_mitigation.html accessed on 14 January 2023.
Table 2.
Soil hydraulic conductivity parameters. Source: InVEST User’s Guide available at: https://invest-userguide.readthedocs.io/en/latest/urban_flood_mitigation.html accessed on 14 January 2023.
| Group A | Group B | Group C | Group D | |
|---|---|---|---|---|
| Saturated hydraulic conductivity of the least transmissive (soil depth 50 and 100 cm) | >40 m/s | [40;10] m/s | [10;1] m/s | <1 m/s |
Table 3.
Hydrological soil group classification of geological units around İzmir.
| Geological Units | Hydrological Soil Groups | Infiltration Rate |
|---|---|---|
| Recent Alluvium Deposits | A | High |
| Continental Clastics | B | Moderate |
| Volcano-Sedimentary Units | C | Slow |
| Volcanic Units (andesite, dasite) | C | Slow |
| Flysch | D | Very Slow |
| Carbonates (Miocene) | B | Moderate |
| Carbonates (Cretaceous-Flysch Blocks) | B | Moderate |
| Carbonates (Cretaceous-Jurassic) | C | Slow |
Table 4.
Biophysical table for both models (the urban flood risk mitigation model uses only the curve numbers for the hydrologic soil group). The source of parameters for percolation and pollution can be found in: InVEST User’s Guide available at: https://invest-userguide.readthedocs.io/en/latest/urban_flood_mitigation.html (accessed on 14 January 2023).
| Cover Description | Curve Numbers for Hydrologic Soil Group | LULC CODE | Percolation Coefficient for Hydrologic Soil Group | Pollution | Connection to Sewage System | ||||||||
|---|---|---|---|---|---|---|---|---|---|---|---|---|---|
| A | B | C | D | A | B | C | D | EMC_P | EMC_N | Is_Connected | |||
| Open space (lawns, parks, golf courses, cemeteries, etc.) | Poor condition (grass cover <50%) | 68 | 79 | 86 | 89 | 10 | 7.50 | 3.30 | 1.70 | 0.50 | 296 | 285 | 1 |
| Good condition (grass cover >75%) | 39 | 61 | 74 | 80 | 11 | 10.72 | 4.71 | 2.43 | 0.71 | 296 | 285 | 1 | |
| Impervious areas | Paved parking lots, roofs, driveways, etc. (excluding right of way) | 98 | 98 | 98 | 98 | 9 | - | - | - | - | 275 | 233 | 1 |
| Urban districts | Commercial and business (85% imp.) | 89 | 92 | 94 | 95 | 8 | 0.40 | 0.20 | 0.10 | 0.05 | 275 | 233 | 1 |
| Industrial (72% imp.) | 81 | 88 | 91 | 93 | 7 | 0.80 | 0.40 | 0.20 | 0.10 | 275 | 233 | 1 | |
| Residential districts by average lot size | 1⁄8 acre or less (town houses) (65% imp.) | 77 | 85 | 90 | 92 | 6 | 0.80 | 0.40 | 0.20 | 0.10 | 275 | 233 | 1 |
| 1⁄4 acre (38% imp.) | 61 | 75 | 83 | 87 | 5 | 2.90 | 1.30 | 0.60 | 0.20 | 345 | 253 | 0 | |
| 1⁄3 acre (30% imp.) | 57 | 72 | 81 | 86 | 4 | 3.10 | 1.39 | 0.64 | 0.21 | 345 | 253 | 0 | |
| 1⁄2 acre (25% imp.) | 54 | 70 | 80 | 85 | 3 | 3.32 | 1.48 | 0.68 | 0.22 | 345 | 253 | 0 | |
| 1 acre (20% imp.) | 51 | 68 | 79 | 84 | 2 | 3.55 | 1.59 | 0.73 | 0.24 | 345 | 253 | 0 | |
| 2 acres (12% imp.) | 46 | 65 | 77 | 82 | 1 | 5.50 | 2.40 | 1.20 | 0.40 | 393 | 234 | 0 | |
| Row crops | Straight row (SR) | Poor | 72 | 81 | 88 | 12 | 8.40 | 3.60 | 1.70 | 0.60 | 506 | 344 | 0 |
| Pasture, grassland or range—continuous forage for grazing.A | Fair | 49 | 69 | 79 | 84 | 13 | 8.40 | 3.60 | 1.70 | 0.60 | 53 | 125 | 0 |
| Woods.E | Poor | 45 | 66 | 77 | 83 | 14 | 7.56 | 3.42 | 0.18 | 0.54 | 105 | 1228 | 0 |
| Fair | 36 | 60 | 73 | 79 | 15 | 8.40 | 3.80 | 0.20 | 0.60 | 105 | 1228 | 0 | |
| Good | 30 | 55 | 70 | 77 | 16 | 9.24 | 4.18 | 0.22 | 0.66 | 105 | 1228 | 0 | |
Table 5.
Modeling results (absolute values). Source: InVEST Output.
| Stormwater Retention Model | Flood Risk Mitigation | ||||||||
|---|---|---|---|---|---|---|---|---|---|
| Retention | Runoff | Percolation | Phosphorus | Nitrates | Retention | Runoff | Volume | ||
| Units | % | % | % | kg/year | kg/year | % | % | mc/s | mc/s |
| Districts | year | single rain | |||||||
| Aliağa | 43.70% | 56.30% | 2.82% | 12,326,009.77 | 65,180,749.63 | 59.97% | 40.03% | 4.52 | 4080.54 |
| Balçova | 38.54% | 61.46% | 2.51% | 1,686,718.91 | 4,508,443.93 | 57.07% | 42.93% | 0.27 | 24,297 |
| Bayındır | 55.35% | 44.65% | 3.05% | 17,520,153.61 | 153,721,792.14 | 71.72% | 28.28% | 5.51 | 4377.63 |
| Bayraklı | 25.05% | 74.95% | 1.38% | 3,622,642.32 | 7,042,990.21 | 40.88% | 59.12% | 0.56 | 56,120 |
| Bergama | 47.55% | 52.45% | 2.68% | 46,167,080.19 | 380,983,056.88 | 63.46% | 36.54% | 17.72 | 15,535.32 |
| Beydağ | 45.74% | 54.26% | 2.67% | 5,560,674.41 | 51,247,961.73 | 60.36% | 39.64% | 2.02 | 1866.02 |
| Bornova | 39.38% | 60.62% | 1.96% | 17,223,806.03 | 61,862,877.07 | 56.70% | 43.30% | 3.08 | 2773.16 |
| Buca | 42.51% | 57.49% | 2.20% | 14,849,722.61 | 62,185,635.59 | 59.47% | 40.53% | 2.62 | 2312.31 |
| Çeşme | 37.98% | 62.02% | 2.23% | 9,706,179.08 | 34,402,220.03 | 54.48% | 45.52% | 3.52 | 3328.78 |
| Çiğli | 49.86% | 50.14% | 5.12% | 9,062,602.95 | 15,024,673.88 | 67.63% | 32.37% | 1.48 | 1197.90 |
| Dikili | 46.35% | 53.65% | 2.25% | 16,800,167.29 | 136,558,640.65 | 62.98% | 37.02% | 6.39 | 5561.19 |
| Foça | 42.79% | 57.21% | 2,82% | 7,819,260.41 | 47,516,891.49 | 58.42% | 41.58% | 2.99 | 2750.34 |
| Gaziemir | 37.71% | 62.29% | 2.70% | 5,075,690.60 | 15,954,837.24 | 55.01% | 44.99% | 0.85 | 771.33 |
| Guzelbahce | 47.56% | 52.44% | 2.26% | 3,209,161.67 | 21,319,735.68 | 65.96% | 34.04% | 0.95 | 779.39 |
| Karabağlar | 36.77% | 63.23% | 0.69% | 7,346,983.14 | 32,532,219.75 | 53.32% | 46.68% | 1.39 | 1282.48 |
| Karaburun | 49.74% | 50.26% | 2.86% | 11,479,692.63 | 94,486,521.38 | 66.45% | 33.55% | 4.41 | 3730.71 |
| Karşıyaka | 30.55% | 69.45% | 0.86% | 3,966,521.86 | 15,234,580.94 | 46.42% | 53.58% | 0.77 | 747.97 |
| Kemalpaşa | 58.77% | 41.23% | 3.72% | 28,532,649.04 | 170,431,615.41 | 76.15% | 23.85% | 5.84 | 4256.25 |
| Kiraz | 42.55% | 57.45% | 2.41% | 16,156,455.63 | 117,634,778.11 | 57.02% | 42.98% | 6.93 | 6551.01 |
| Kınık | 52.30% | 47.70% | 3.30% | 13,648,680.30 | 113,928,223.06 | 68.73% | 31.27% | 5.15 | 4259.72 |
| Konak | 10.93% | 89.07% | 0.78% | 3,724,077.96 | 3,872,734.38 | 22.86% | 77.14% | 0.44 | 493.12 |
| Menderes | 51.39% | 48.61% | 3.22% | 47,639,743.83 | 190,123,139.98 | 68.92% | 31.08% | 8.47 | 6797.65 |
| Menemen | 49.13% | 50.87% | 4.41% | 45,365,260.70 | 109,810,385.90 | 66.15% | 33.85% | 6.44 | 5385.86 |
| Narlidere | 46.49% | 53.51% | 1.62% | 2,419,798.68 | 15,534,360.83 | 66.57% | 33.43% | 0.52 | 410.40 |
| Ödemiş | 50.81% | 49.19% | 3.53% | 29,434,675.79 | 233,572,899.03 | 66.33% | 33.67% | 10.97 | 9455.17 |
| Seferihisar | 46.94% | 53.06% | 2.10% | 12,552,662.40 | 95,053,987.37 | 63.65% | 36.35% | 4.51 | 3902.84 |
| Selçuk | 56.97% | 43.03% | 3.87% | 9,995,482.43 | 80,406,235.98 | 73.41% | 26.59% | 3.28 | 2559.02 |
| Tire | 52.37% | 47.63% | 3.66% | 22,458,306.48 | 187,566,213.20 | 68.00% | 32.00% | 8.02 | 6774.83 |
| Torbalı | 52.44% | 47.56% | 4.72% | 51,336,398.83 | 108,483,146.13 | 70.01% | 29.99% | 5.83 | 4598.75 |
| Urla | 50.51% | 49.49% | 2.93% | 19,916,438.70 | 148,691,091.60 | 67.49% | 32.51% | 7.25 | 6043.87 |
| Total | 49.05% | 50.95% | 3.10% | 496,603,698.27 | 2,774,872,639.24 | 65.47% | 34.53% | 132.70 | 113,387.70 |
Table 6.
Modeling results (relative values). Source: author’s elaboration on InVEST Output.
| District | Retention | Runoff | |||
|---|---|---|---|---|---|
| Urban Flood Risk Mitigation | Urban Stormwater Retention Model | Urban Flood Risk Mitigation | Urban Stormwater Retention Model | Diff Retention | |
| Aliağa | 0.58 | 0.41 | 0.42 | 0.59 | 0.17 |
| Balçova | 0.47 | 0.30 | 0.53 | 0.70 | 0.17 |
| Bayındır | 0.69 | 0.52 | 0.31 | 0.48 | 0.17 |
| Bayraklı | 0.31 | 0.17 | 0.69 | 0.83 | 0.14 |
| Bergama | 0.62 | 0.46 | 0.38 | 0.54 | 0.16 |
| Beydağ | 0.65 | 0.50 | 0.35 | 0.50 | 0.15 |
| Bornova | 0.40 | 0.25 | 0.60 | 0.75 | 0.15 |
| Buca | 0.30 | 0.17 | 0.70 | 0.83 | 0.13 |
| Çeşme | 0.48 | 0.29 | 0.52 | 0.71 | 0.18 |
| Çiğli | 0.37 | 0.21 | 0.63 | 0.79 | 0.16 |
| Dikili | 0.61 | 0.44 | 0.39 | 0.56 | 0.17 |
| Foça | 0.60 | 0.44 | 0.40 | 0.56 | 0.16 |
| Gaziemir | 0.45 | 0.29 | 0.55 | 0.71 | 0.16 |
| Guzelbahce | 0.68 | 0.47 | 0.32 | 0.53 | 0.21 |
| Karabağlar | 0.22 | 0.11 | 0.78 | 0.89 | 0.11 |
| Karaburun | 0.66 | 0.49 | 0.34 | 0.51 | 0.17 |
| Karşıyaka | 0.30 | 0.16 | 0.70 | 0.84 | 0.14 |
| Kemalpaşa | 0.75 | 0.58 | 0.25 | 0.42 | 0.17 |
| Kiraz | 0.61 | 0.46 | 0.39 | 0.54 | 0.15 |
| Kınık | 0.68 | 0.51 | 0.32 | 0.49 | 0.17 |
| Konak | 0.18 | 0.08 | 0.82 | 0.92 | 0.10 |
| Menderes | 0.66 | 0.48 | 0.34 | 0.52 | 0.19 |
| Menemen | 0.57 | 0.40 | 0.43 | 0.60 | 0.17 |
| Narlidere | 0.58 | 0.37 | 0.42 | 0.63 | 0.20 |
| Ödemiş | 0.67 | 0.50 | 0.33 | 0.50 | 0.16 |
| Seferihisar | 0.65 | 0.47 | 0.35 | 0.53 | 0.17 |
| Selçuk | 0.70 | 0.54 | 0.30 | 0.46 | 0.16 |
| Tire | 0.65 | 0.49 | 0.35 | 0.51 | 0.16 |
| Torbalı | 0.67 | 0.49 | 0.33 | 0.51 | 0.18 |
| Urla | 0.56 | 0.39 | 0.44 | 0.61 | 0.18 |
| Total | 0.54 | 0.38 | 0.46 | 0.62 | 0.16 |
Table 7.
Comparison between Guzelbahce and Konak.
| Neighborhoods | Sealing (0–100) | Altitude (m) | Forest (0–100) | Land Capability (1–9) | Soil Conductibility (1–4) | Infrastructure Density (km/ha) | Area (ha) |
|---|---|---|---|---|---|---|---|
| Guzelbahce | 12.40 | 127.03 | 22.65 | 5.64 | 2.02 | 0.11 | 8255.61 |
| Konak | 74.81 | 60.05 | 3.15 | 9.00 | 3.11 | 0.36 | 2435.98 |
Disclaimer/Publisher’s Note: The statements, opinions and data contained in all publications are solely those of the individual author(s) and contributor(s) and not of MDPI and/or the editor(s). MDPI and/or the editor(s) disclaim responsibility for any injury to people or property resulting from any ideas, methods, instructions or products referred to in the content. |
© 2023 by the author. Licensee MDPI, Basel, Switzerland. This article is an open access article distributed under the terms and conditions of the Creative Commons Attribution (CC BY) license (https://creativecommons.org/licenses/by/4.0/).
Share and Cite
MDPI and ACS Style
Salata, S. Filling the Gaps in Biophysical Knowledge of Urban Ecosystems: Flooding Mitigation and Stormwater Retention. Land 2023, 12, 702. https://doi.org/10.3390/land12030702
AMA Style
Salata S. Filling the Gaps in Biophysical Knowledge of Urban Ecosystems: Flooding Mitigation and Stormwater Retention. Land. 2023; 12(3):702. https://doi.org/10.3390/land12030702
Chicago/Turabian StyleSalata, Stefano. 2023. "Filling the Gaps in Biophysical Knowledge of Urban Ecosystems: Flooding Mitigation and Stormwater Retention" Land 12, no. 3: 702. https://doi.org/10.3390/land12030702
Note that from the first issue of 2016, this journal uses article numbers instead of page numbers. See further details here.