Article

Characterization and Mapping of Public and Private Green Areas in the Municipality of Forlì (NE Italy) Using High-Resolution Images

by
Mara Ottoboni
1,2,
Salvatore Eugenio Pappalardo
3,*,
Massimo De Marchi
3 and
Fabrizio Ungaro
1
1
Institute of BioEconomy CNR IBE, Via Madonna del Piano 10, 50019 Sesto Fiorentino, Italy
2
GIScience and Unmanned Systems for the Integrated Management of the Territory and the Natural Resources, University of Padua, 35100 Padua, Italy
3
Department of Civil, Environmental and Architectural Engineering ICEA, University of Padua, Via Loredan 20, 35131 Padua, Italy
*
Author to whom correspondence should be addressed.
Land 2023, 12(3), 660; https://doi.org/10.3390/land12030660
Submission received: 30 January 2023 / Revised: 6 March 2023 / Accepted: 7 March 2023 / Published: 11 March 2023

Abstract

:
Urban Green Spaces (UGS) contribute to the sustainable development of the urban ecosystem, positively impacting quality of life and providing ecosystem services and social benefits to inhabitants. For urban planning, mapping and quantification of UGS become crucial. So far, the contribution of private green spaces to ecosystem services in urban areas has yet to be studied. At the same time, in many Italian cities, they represent a considerable part of the urban green cover. This study utilises a methodological approach and provides insights into the contribution of urban public and private green spaces by the consideration of a case study area in Northeast Italy. To achieve this goal, the main steps were: (i) NDVI extraction from very high-resolution (20 cm) orthophotos, (ii) classification of property status and (iii) analysis of the degree of the greenness of land cover units. From our results, the total amount of the green spaces is 5.70 km2, of which 72.1% (4.11 km2) is private, and 28.9% (1.59 km2) is public. As for the land cover, three NDVI classes were identified, highlighting different degrees of homogeneity in NDVI reflectance response within each urban land cover unit. These results will support the planning of new green areas in the post-epidemic National Recovery and Resilience Plan.

1. Introduction

1.1. Urban Green Spaces at the Local and European Framework

The climate crisis poses new challenges for the resilience of cities both in Europe and worldwide. In the fragile Italian urban environment, often characterised by the historical development of compact cities with high population density, it is crucial to identify sustainable solutions to complement traditional urban planning (UP) practices. At this level, a thorough knowledge of the urban territory and its resources, such as urban green spaces (UGS), is necessary to provide reliable working tools to support UP. Active collaboration between research institutes, universities and stakeholders, such as urban planners, could resolve the aforementioned issue [1] and has been encouraged by the scientific community, especially in urban green space analysis and quality of knowledge in the Mediterranean areas [2]. There is a need to implement procedures that could be replicated from the local to regional and national scale through the use of data within public administration databases and geoportals, such as cadastral and topographic datasets, and orthophotos or any highly detailed imagery product [3,4].
The importance of urban green infrastructures (UGI) is quantitatively defined [5] and recognised [6] also in terms of perception and adequate provision of ecosystem services (ES) [2,7]. This function was also recognised by the European Union (EU) in 2013, with its communication on how networks of green areas, such as green infrastructures and Nature-based Solutions (NbS) could help achieve many of the European policy objectives [8]. The EU has established cooperation measures and guidelines for the improvement of the urban environment in The Urban Agenda for the EU [9]. These measures focus on the exchange of experience and dissemination of information at the most appropriate level for ensuring the effective implementation of legislation and to foster best practices by local authorities [4]. This strategy aims to improve the quality of the urban environment, making cities more attractive, inclusive and healthier places in which to live, work and invest [1] and, at the same time, reducing the negative impact of urban agglomerations on the environment, given that almost 70% of the world’s population is expected to live in cities by 2050 [10]. Land taken due to urbanisation is already among the major causes of severe environmental impacts at both local and global scales, although representing only 2% of the global land use [11].
At the European and national level, the National Recovery and Resilience Plan (NRRP) represents a unique opportunity to realise a strategic and operational evolution of cities that includes: (i) an integrated vision of cities as a system of systems, (ii) permanent promotion of socio-cultural initiatives to stimulate citizen awareness, (iii) introduction of both material and non-material incentives for the implementation of strategies consistent with the overall macro-goals, and (iv) periodic systematic analysis of risks and developments of synergies between different sectors [12]. In Italy, the NRRP foresees a series of actions mainly aimed at 14 metropolitan cities, which include, for example, the development of urban and peri-urban forests, planting at least 6.6 million trees for a total of about 6.6 km2 of urban forests. Within the abovementioned strategy, understanding the homogeneity and the degree of the greenness of existing urban green surfaces [13] would enhance planning in areas best suited to maximise certain ESs, such as carbon sequestration in plant biomass and soil, microclimate regulation and flood control.

1.2. Characterisation of Urban Green Spaces for Ecosystem Services Provision

Characteristics of UGSs, such as their abundance, spatial distribution, and species composition, play an essential role in UP and public health [14,15,16]. According to the World Health Organization [17], there is evidence of the beneficial effects of UGSs as a consequence of psychological relaxation and stress alleviation as well as the reduction in exposure to air pollutants. The concomitant COVID-19 pandemic situation of recent years, in particular during lockdowns, highlighted the importance of green areas inside and around cities [18], particularly concerning their socio-health and cultural and recreational value [19,20], along with the urgent need for managing these areas following integrated criteria and principles towards urban resilience [21]. Indeed, UGSs, such as parks, playgrounds, or vegetative systems in public and private spaces also provide a comprehensive source of ecosystem services, the so-called Urban Ecosystem Services (UES) [22]. These are chiefly provisioning and regulating services [23,24] and include: (i) carbon stock [25,26] and greenhouse gas (GHG) sequestration in vegetation biomass and soil, together with the mitigation of air pollution [27,28]; (ii) food production with urban agriculture [29,30]; (iii) microclimate thermoregulation by mitigation of urban heat islands [31,32]; (iv) biodiversity conservation [33]; and (v) flood regulation from the impact of extreme weather [34,35,36]. Since private green areas, such as gardens, agricultural fields and private parks are a substantial proportion of UGSs, they are essential for maintaining UES [7] and biodiversity [37]. Nevertheless, little importance is given to private green spaces, both at the management and governance levels [38]. The governance should define rules and decision-making processes for private stakeholders to support individual interests and collective benefits. What is needed regarding UGSs management is the inclusion of private green spaces and the acquisition of an integrated ecosystemic approach in UP, particularly the recognition of the city as an urban ecosystem in which people benefit from nature, either public or private [39]. Furthermore, some authors have investigated cultural UES [23,24], focusing on the differences between public and private green spaces. Analysing consumer preferences and local policies in some Western European countries, they emphasised that these green spaces are not simply substitutes for each other in terms of the living environment within an urbanized area [40]. In addition, as noted by [41], it appears that, at present, there are no valid national or European policy instruments aimed at compensating for the loss of private green space at the urban level by public green space provision. For the time being, there is only a suggestion to use models to study the welfare effects of applying for ecological compensation in cases where urban green spaces are at risk of being exploited [42].
Remote sensing and analytical techniques substantially contribute to the characterization and mapping of UGSs [14,43]. Based on recent advances such as high-resolution imagery and open access data policies [3,44], the production of detailed vegetation maps has become a crucial aid for assisting city planners in designing methods of optimising UES and climate change adaptation strategies [45,46]. Studies have demonstrated that urban vegetation dynamics within and across cities can be assessed through remote sensing by using satellite image analysis and proximal sensing in order for high-resolution assessment to be achieved [47]. For instance, the Normalized Difference Vegetation Index (NDVI) is the main indicator of photosynthetic activity [48], frequently employed in urban landscape ecology [49,50,51,52,53]. Such tools, connected to the internet of things, could become efficient monitoring tools in the future, especially since they are promoted by the guidelines in the Italian and European Recovery Plan as equipment for the Member States for monitoring and predicting possible hazards, promptly assessing their immediate impacts on systems (natural and infrastructures), and consequently defining optimal responses [54].
Novelty elements of this study include the detection and the quantification of the spatial degree of heterogeneity of urban green systems as a significant step for the ecological understanding of cities [55], also identifying areas of possible intervention. The flexibility of NDVI for this purpose is investigated as a good indicator describing land use and cover heterogeneity in urban landscapes [56].

1.3. Geographical Framework of the Study Area

Forlì is an Italian municipality located in Forlì-Cesena Province within the Po Valley in Emilia-Romagna Region (Northern Italy) at 34 m a.s.l. (Lat. 44.2227398, Long. 12.0407312), 5 km away from the foothills of the Tuscan-Romagnolo Pre-Apennines and about 26 km from the Adriatic coast. Its area is about 228.2 km2, of which 32.88 km is urbanised. The municipality counts 117,138 inhabitants [57] and a population density of 512.4 inhabitants km−2. The territory is divided into 21 districts, grouped as eight “Comitati Territoriali” (Territorial Committees). The present study focuses on the six core districts encompassing the historic urban centre (q6) and its surroundings (q1–q5, Figure 1) with a total area of 13.6 km2, representing the most urbanised, and the more densely populated districts in the entire municipal territory.
Forlì has a warm temperate climate, and is stably humid, with a hot summer (Köppen-Geiger Cfa classification). The coldest month (January) has an average temperature of 3.9 °C (1991–2020 period), while the hottest month (July) has an average temperature of 24.6 °C (1991–2020 period). The average annual cumulative precipitation is around 769 mm for the same reference period [58].

1.4. Aims of the Study

The municipality of Forlì used the EU-funded Life project SaveOurSoils4Life (2015–2019, https://www.sos4life.it/en/, accessed on 10 January 2022) focused on recording the ecosystem services of urban soils, within which this research aimed to fill some knowledge gaps in the provision of UES in the framework of the Forlì Green Space Plan.
The first aim of this study is to quantify and classify the contribution of private and public green spaces to understand the structure of UGI in the Municipality of Forlì better, resorting to very high-resolution images. Second, we assessed the degree of greenness and the heterogeneity of vegetation cover in specific land use and cover classes regarding NDVI spectral response, contributing further to the characterisation of municipal green spaces in Forlì.

2. Materials and Methods

2.1. Urban Green Spaces Detection and Classification

To achieve the aim of the study, spatial analyses were based on remotely-sensed data and GIS modelling by using different sources: the land use and land cover (LULC) data at the regional level, very high spatial resolution orthophotos (0.2 m pixel size) in visible spectral range (Red, Green and Blue, RGB) and near infrared (NIR), integrated with the cadastral maps for the Municipality of Forlì and the tree census as described here below (Table 1).

2.2. Land Use and Land Cover Database and Thematic Maps

Since the 1970s, LULC has been one of the most requested and used regional geographic databases by local governments and professionals. To fully respond to the demands being made by urban planners, especially regarding soil sealing and other land use changes, the Emilia-Romagna Regional Land Use Working Group created the most recent LULC database, as used in this study, with new features compared to the previous 2008 and 2014 releases. The most updated product is the 2017 Land Cover Database (edition 2020, Figure 2), covering the study area. It was derived via photo-interpretation of the Italian Agriculture Remote Sensing Consortium (TeA) 2017 orthophotos (reference scale 1:10,000, position accuracy 5 m) with 0.2 m spatial resolution, which were acquired during May 2017. The minimum mapping unit is 1600 m2 [59]; this results in acquiring greater detail compared to the CORINE Land Cover (CLC) products using a minimum mapping unit of 25,000 m2.
For the construction of the database, the European specifications of the CLC project from the Copernicus Program [60] were taken as a reference from which the first three levels of the LULC classification were derived [61]. The fourth level represents the categories of detail largely defined by the Emilia-Romagna Land Use Working Group that has operated in past years within the Interregional Centre for Geographic and Statistical Information Systems (CISIS, [62]). Polygons in the coverage are all defined by a four-digit numerical code (COD TOT) derived from CLC classification. The first number in the classification code corresponds to the highest hierarchical level, as 1 describes artificial surfaces; 2, agricultural lands; 3, forests and semi-natural areas; 4, wetlands and 5, water bodies. Polygons in categories where the fourth level is absent have the numerical code with the fourth digit set equal to zero.

2.3. Multispectral Orthophotos, Municipality Cadastral Map and Tree Census

Detection and classification of UGSs were performed by adopting the NDVI, modelled in an open-source GIS environment (QGIS v.3.x). Multispectral analyses were performed on aerial images (ortho-rectified photos) provided by the Agricultural Disbursement Agency (AGEA) and distributed for exclusive use to the Emilia-Romagna Region. Aerial image acquisition was completed in 2020 and currently represents the most up-to-date survey available at regional and national levels. Orthophotos are characterised by a very high spatial resolution (0.2 m pixel size), with four bands in the visible range (RGB) and near-infrared (NIR) using a minimum mapping unit of 1600 m2, and a cloudy cover of less than 5%. They are at 1:5000 nominal scale provided in the global reference system ETRS89 and then reprojected in the RND2008 reference system (EPSG: 6875). Images were shot from February to May 2020.
The cadastral layer, provided by the Forlì Municipality, was used to intersect the NDVI values according to cadastral parcels for each district. Each cell is identified by type (i.e., street, parcel, or water) but not by its ownership status (public or private). This layer was then overlaid with the urban green cadastral map, also provided by the municipality office, containing green space polygons managed by the municipal authority. This information was integrated with the official census of trees (updated to 2021), covering the entire municipality with a buffer of 1 m around the tree position point and including road trees (Figure 3). By using this method, it was possible to obtain a key to extract differences among the privately owned areas (Figure 4).
The NDVI was calculated, via QGIS Raster Calculator, for each district considered, using the following equation:
NDVI = NIR RED NIR + RED
where NIR represents the spectral reflectance recorded in the near-infrared region of the spectrum (from 780 nm to 2500 nm) and RED represents the spectral reflectance recorded in the red (visible) region (around 620 to 750 nm).
According to [63], the range of NDVI is between ±1, where higher values correspond to vegetation in better health conditions. Negative values generally indicate non-green areas such as built-up areas or water bodies. NDVI threshold values are not univocal, but according to [46,64], using thresholds provides valuable information as to the number of green areas in urban contexts. Values ≤ 0.1 represent absence or scarcity of vegetation, while moderate values identifying between 0.2 and 0.3 indicate shrubs and grassland [53]. After several tests, a threshold suitable for extracting green areas in the Forlì urban context was selected, and pixels with NDVI values greater than 0.15 were considered vegetated (similar thresholds have been selected by [46,65]). UGS which matched with the cadastral municipal urban green layer polygons (Figure 4) were selected, and the difference was calculated concerning the total NDVI layer, called “Cadastral NDVI urban green” (Figure 4), thus extracting areas designated in the records as privately owned (Private green areas in Figure 4). Visual analysis was then performed using very high-resolution satellite images available on Google Maps and ground photos from Google Street View; cases of doubtful ownership were cross-checked and corrected if required. In some areas, the ownership status was also directly requested from the municipality by checking with cadastral codes.

2.4. Statistical Analysis

Statistical analysis was carried out associating the rasterized NDVI values, sampled over a regular 1 m square grid, to the CLC class (Figure 5).
After vectorization of the NDVI raster layer, it was sampled with a 1 m regular point grid. Each point corresponded to the NDVI centroid value to which the x and y coordinates had been associated. The 1-m grid was selected after several tests and considering an adequate ratio between precision and computational availability. To avoid QGIS computation miscalculations due to the large data frames (for example, there are 1,874,650 sampling points in the q6 district), RStudio software v.4.x [66] was employed. NDVI sampled layers were imported and associated by coordinates through a “right join process” to the corresponding CLC classes. In each district, CLC classes were ranked based on three NDVI categories, and the median values (low ≤ 0.0, medium > 0 and <0.15, high ≥ 0.15). Each class corresponds to a different degree of greenery: low, medium and high. A one-way analysis of variance (ANOVA) test was carried out to assess the differences in NDVI reflectance within the same CLC units in the six districts of the study area. The Tukey-Kramer HSD test for unequal N was used to assess the statistical significance of differences, as expressed in mean values.

3. Results

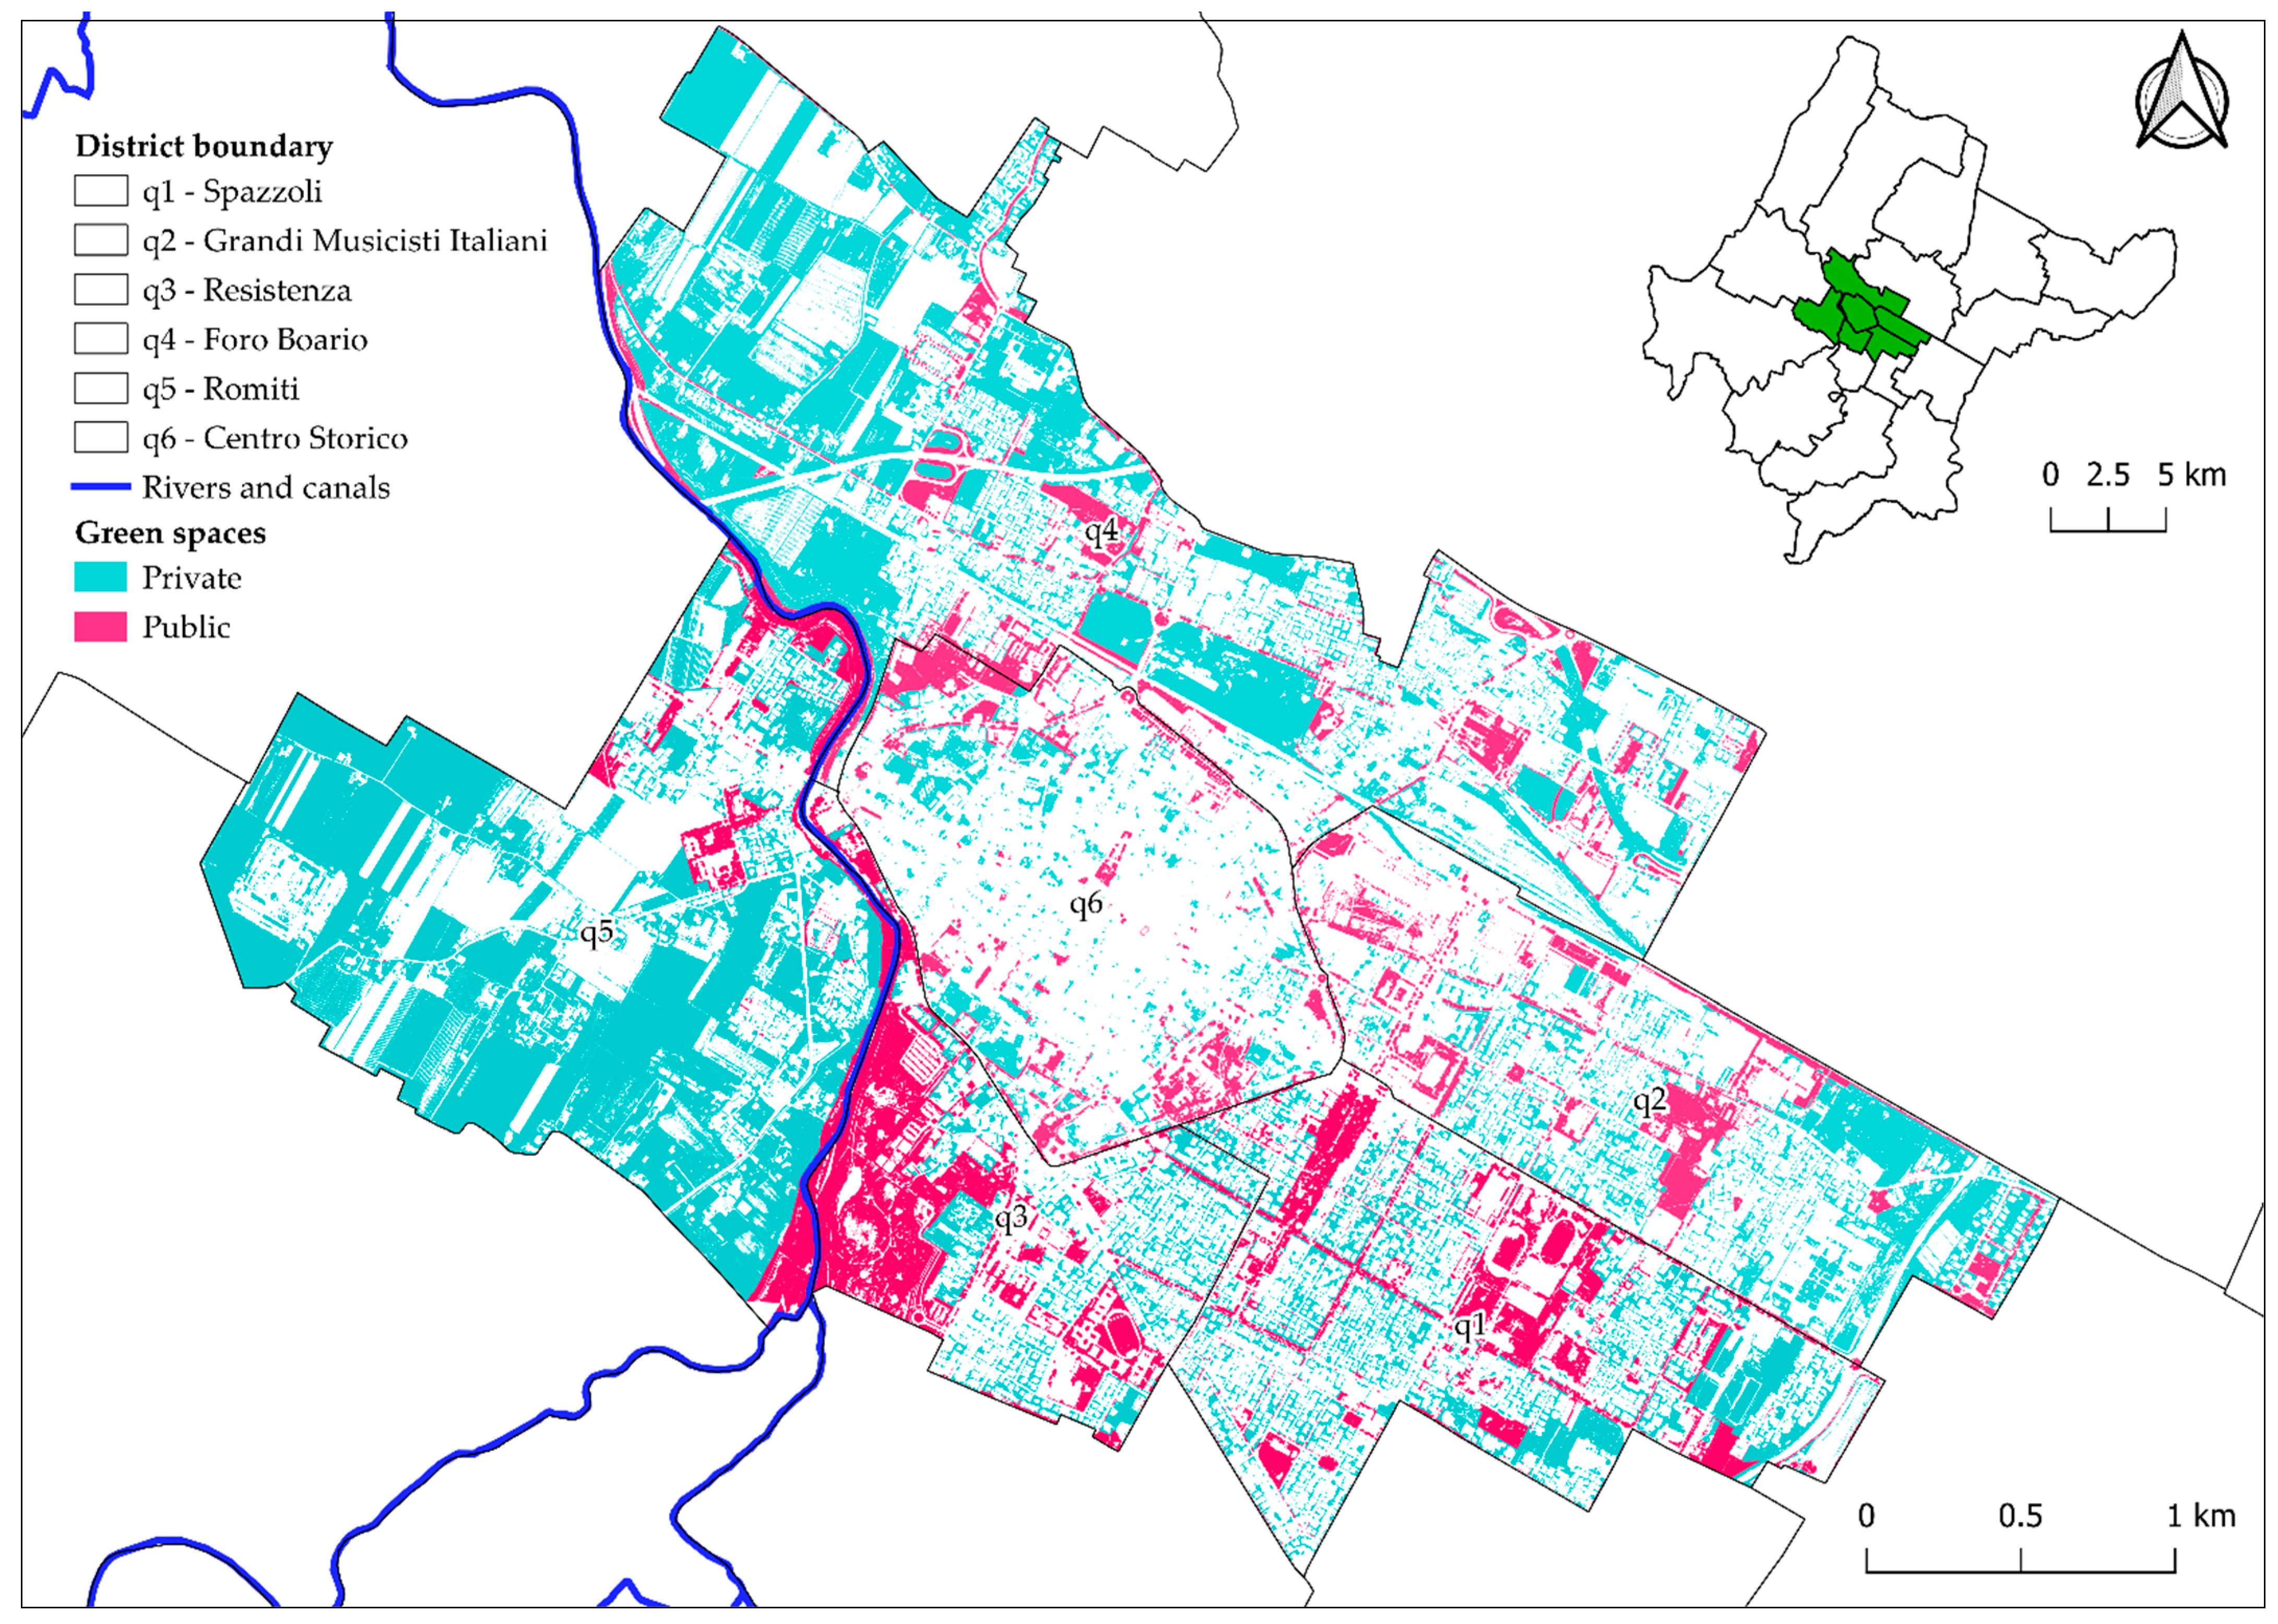
3.1. Public and Private Green Spaces Mapping

UGSs spatial distribution after NDVI analysis is shown in Figure 6. Higher NDVI values (≥0.15) correspond to areas covered by vegetation, while lower values (<0.15) are unvegetated artificial surfaces or water bodies. According to the map legend, areas that visually show higher values of NDVI are located in the north-western part of the study area, where large areas characterise districts q4 and q5 under agricultural land use. Orange and dark orange colours correspond to the more densely urbanised areas in the eastern districts (q1, q2 and q3). Areas in red, such as those in q3 district, represent natural and artificial water bodies.
Figure 7 presents the UGSs after the application of the threshold (0.15) of NDVI. Light grey parts represent urban and peri-urban spaces covered by unvegetated artificial surfaces or water.
Regarding the distribution of green spaces in the six selected districts, the total green area is 5.70 km2, corresponding to about 42% of the total area. Among the public green allotment, there are different urban parks. They include the “Resistenza” Park (0.45 km2) in the q1 north-western district, a historic park of the city of Forlì, established in the 1800s, with a further expansion during the 1930s, and the “Via Dragoni” Park in the q2 district, which represents a significant public green area (0.06 km2), occupying 3.2% of the total 12.1% public green area.
The district q6 ranks among those with the lowest presence of green (21.5%) due to its extremely dense urban fabric, with many roadside green areas of limited size, district gardens and private gardens. However, more green areas were recently created by urban regeneration projects as the University Campus Park (in the south-eastern part of the district) and the Museums Garden in front of the San Domenico Museum complex (in the western part), which were not visible in the 2020 AGEA orthophoto as they were completed in 2021.
As for the classification based on ownership, 72.1% of the total green area is private, and 28.9% is public. A detailed quantitative summary for each district is reported in Table 2, and the corresponding cartographical representation is shown in Figure 8.
In q6 (Centro Storico district, Figure 8), public and private areas are dimensionally comparable, with a total public green area of 0.18 km2 (10.3%) and a total private green area of 0.20 km2 (11.2%). The same situation is found in q1 (Spazzoli district), where private UGSs amount to 0.37 km2 (19.7%), whereas the public areas amount to 0.31 km2 (16.2%). Differences between publicly owned and private green areas are found in q4 (Foro Boario), with 1.44 km2 of private areas (37.3%) and 0.29 km2 of public green (7.6%), and in q2 (Grandi Musicisti Italiani district) where private green spaces are much larger than public ones, with 0.41 km2 for private areas (21.9%) and 0.22 km2 for public green (12.1%). The Romiti district, q5, characterised by a relevant share of agricultural land use, has much more private green spaces (1.53 km2, 51.7%) than public green spaces (0.19 km2, 6.6%), most of which are located along the Montone riverbanks.
The only case, among the districts analysed, in which the share of public green spaces is greater than the private one, is in q3 (Resistenza district), with 0.16 km2 of private green spaces (12.8%) vs. 0.38 km2 of public green spaces (31.1%), due to the presence of a large part of the “Franco Agosto” Park, which also covers a considerable share of the entire territory of the district, amounting to about 24% of total public green area.

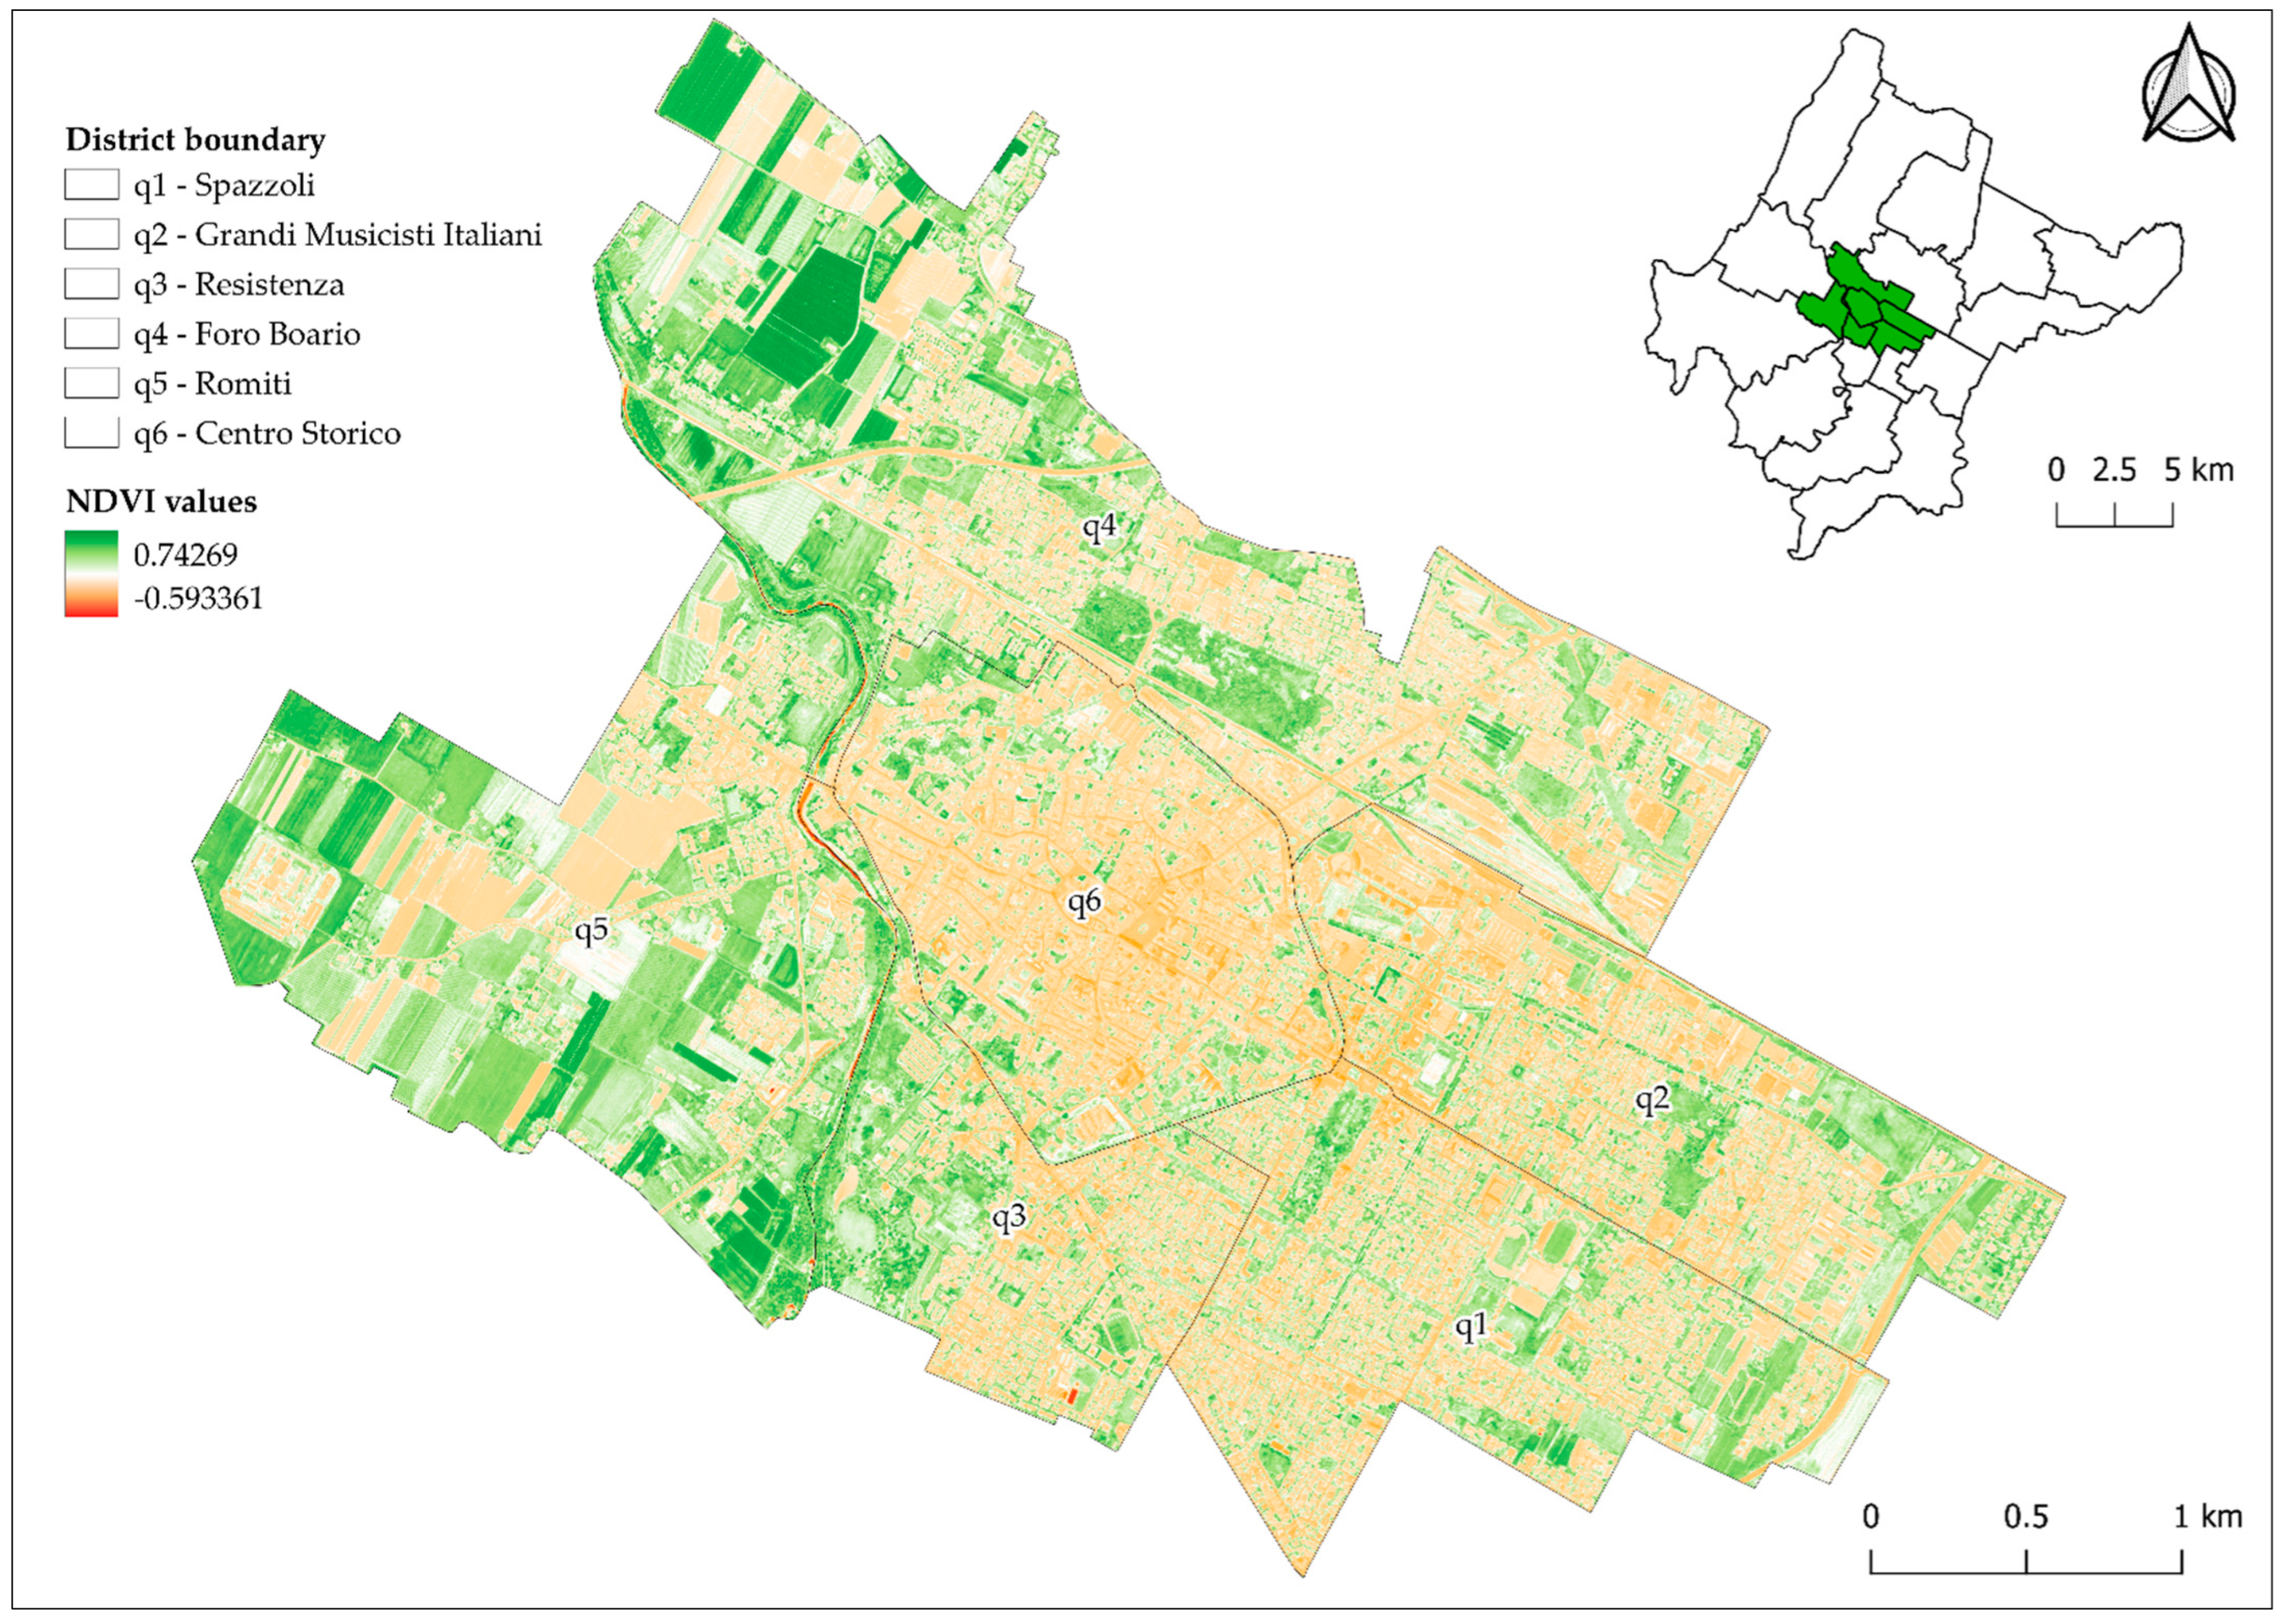
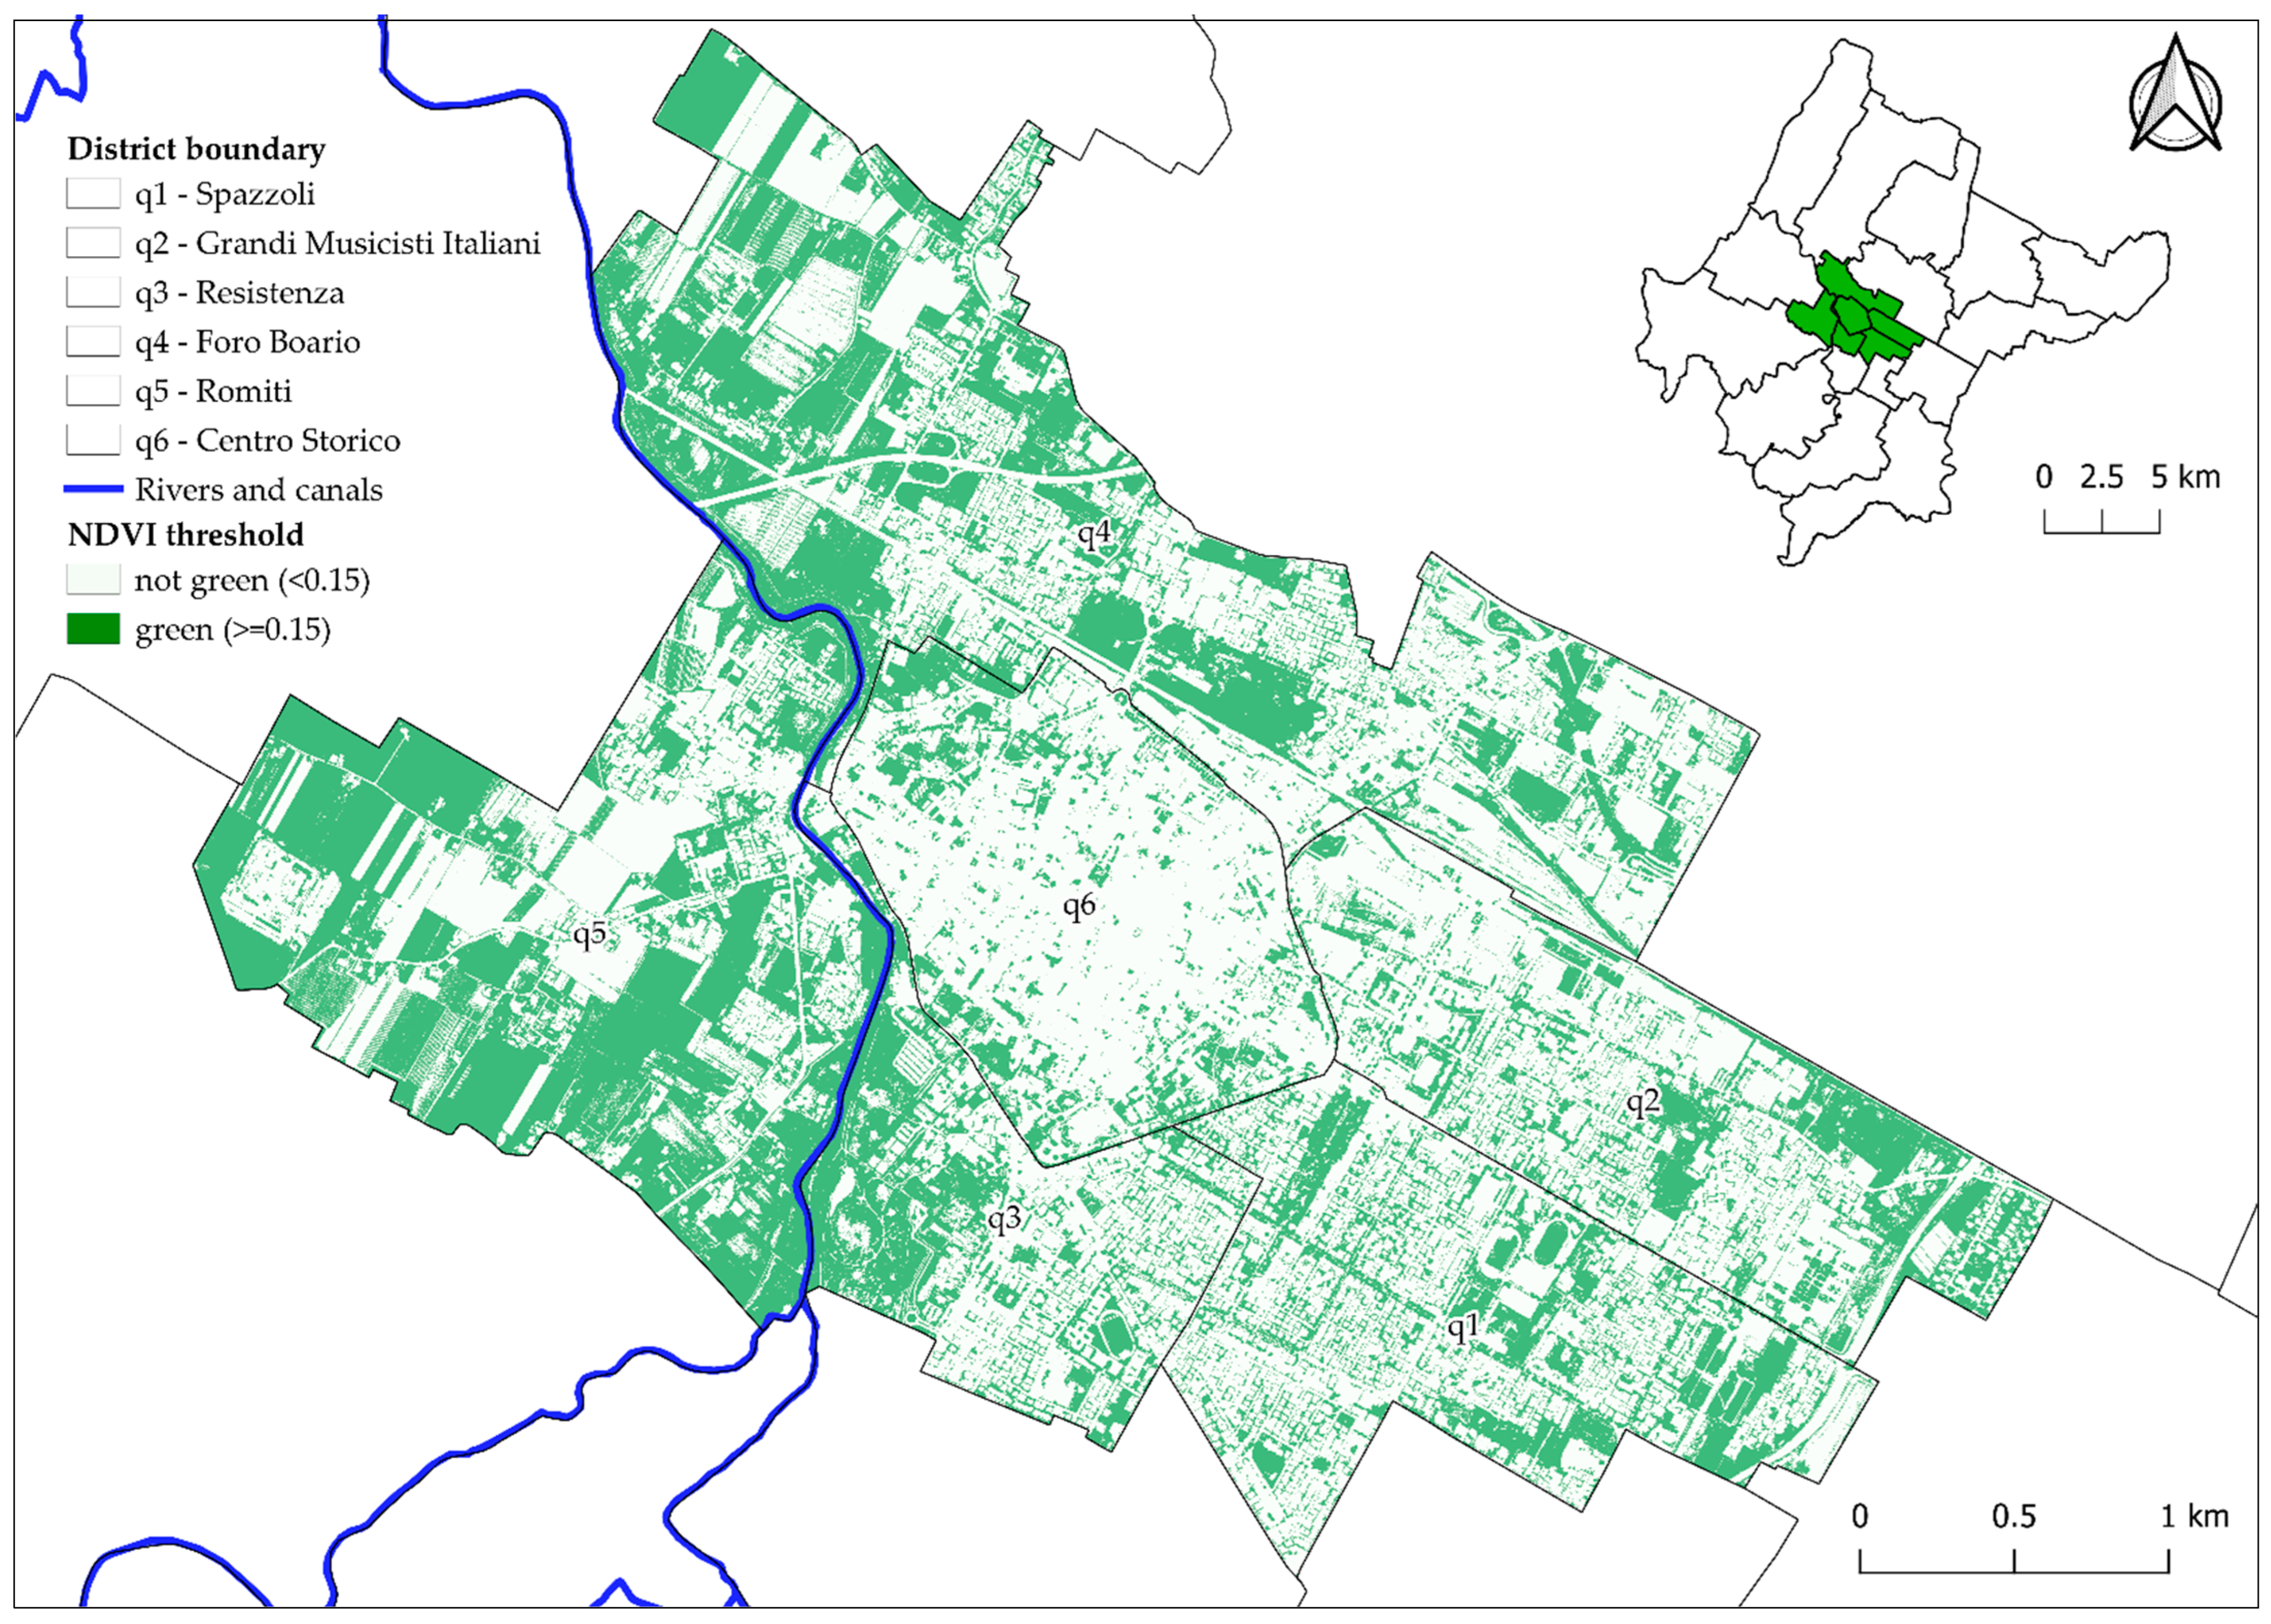
3.2. NDVI and Corine Land Cover Units

Mean NDVI values associated with different CLC units showed statistically significant differences (p < 0.05). For example, Figure 9 reports the “box and whiskers” plot for the q6 central district with the lowest number of CLC classes. All classes present statistically significant differences (red letters in Figure 9), with an overall mean NDVI value of 0.065. Supplementary Materials report the figures for the other five districts of the study area.
NDVI median values and interquartile ranges for each district are shown in Figure 10, grouped by CLC code. The lowest values are found in CLC classes with a high presence of sealed surfaces (e.g., 1112 sparse residential fabric and 1222 street networks). CLC classes 1121 (urban residential fabric) and 1214 (public and private service settlements) show different NDVI median values, ranging from −0.06 to 0.31 and from −0.08 to 0.25, respectively, resulting from the heterogenous composition of the urban landscape. As expected, the highest median NDVI values are found for CLC class 1411 (parks, >0.05).
In each district, all CLC classes were ranked according to three classes of NDVI (Figure 11) based on their median values (low ≤ 0.0, medium > 0 and <0.15, high ≥ 0.15). The correlation between the median value and the interquartile range resulted in two opposite trends: low and medium NDVI CLC classes exhibited statistically significant direct relationships (p < 0.05) between median values and interquartile ranges (r equal to 0.563 and 0.837 respectively, for low and medium NDVI), while the opposite was observed for the high NDVI class (r = −0.422). In the first case, an increase in NDVI was associated with an increase in the variability of the spectral response due to an increase in vegetated areas within a predominantly artificialized urban fabric. However, in the second case, the increase in vegetated areas reduced the variability of the spectral response as it occurred in an urban fabric already characterised by a significant number of green areas. The resulting spatial distribution of classed NDVI values for the CLC units is shown in Figure 11.
As expected, in all the districts, the CLC classes having the lowest levels of NDVI turn out to be: (i) sparse residential fabric (CLC class 1112, NDVI median range −0.049 to −0.085), (ii) road networks (CLC class 1222, NDVI median range −0.090 to −0.122), followed, where present, by (iii) areas with industrial, artisanal, and agricultural production settlements (CLC class 1211, NDVI median range −0.080 to −0.106), (iv) commercial settlements (CLC class 1213, NDVI median range −0.090 to −0.114), (v) highways and freeways (CLC class 1221, NDVI median range −0.117 to −0.145), (vi) rail networks and (vii) ancillary spaces (CLC class 1224, NDVI median range −0.058 to −0.101). The only district that has the CLC class 1111, which corresponds to the compact and dense residential fabric, is q6, the one with the lowest level of vegetation cover. In fact, the area is composed of a dense network of historic buildings with little free space for green areas, except for the street trees at the edges of the district or flowerbeds in the main squares. This results in NDVI values ranging from −0.12 to −0.03.
Uncultivated areas in the urban fabric (CLC class 1413), irrigated arable land (CLC class 2121), orchards and minor fruits (CLC class 2420) also have high levels of vegetation cover, with NDVI median values ranging from 0.158 to 0.422. Due to the high degree of inherent naturalness, areas with shrubs and/or herbaceous vegetation with scattered trees (CLC class 3231), ruderal thickets (CLC class 3116), rivers and stream beds with abundant vegetation (CLC class 5112), and embankments (CLC class 5113) also have high NDVI median values, ranging from 0.355 to 0.464.
It is worth noting the discrepancy between the NDVI values in vineyards (CLC class 2210) found in districts q4 and q5, which reflect the timing of the orthophotos: the low level of greenery in q4 is due to the lack of plantations because as seen in the orthophoto, there is no canopy cover and the soil is almost bare or only partially covered by grass (NDVI median value −0.024); while the high level of canopy cover (NDVI median value 0.224) in q5 is due to the remarkable planting beds.
Another example of discrepancies between different districts is found in CLC class 2123 (horticultural crops in open field, greenhouse and under plastic); specifically, in q4 and q5, the areas under this class show a low value of NDVI as compared to the same class in q3 district, due to coverage with artificial materials or the temporary absence of a crop.

4. Discussion

The NDVI-based approach, through high-resolution orthophotos, allowed the classification of UGSs [67] and links to their property status via cadastral data, whereas ancillary spatial data made it possible to analyse NDVI responses in terms of homogeneity of the reflectance response in land cover units.
Considering the outcomes of the first step of the analysis, in terms of ownership status, the prevalence of private UGS was significantly higher (72.1% covering 4.11 km2) than public ones (28.9% covering 1.59 km2). The authors of [46] reported similar results for the entire city of Padua (NE Italy), with a prevalence of private green, which adds up to ca. 80% of the total greenery surveyed within the municipality. In [68], the amount of urban private green spaces in Leipzig (NE Germany), resulting from back- and front-yard green space, is around 40% (20 km2) of the total amount of public green spaces, but in 25% of city districts, it prevails over public green areas. Other studies focused on quantifying private garden areas, for example, estimating between 22 and 36% of the total Dunedin urban area in New Zealand [69]. In line with these data, [35] found that about 23% (33 km2) of the urban area in Sheffield (UK) is covered by home gardens. Even if it is not a standardised measurement for all cities, it has been estimated that in Forlì, the total amount of public green space per capita is 32.1 m2 per inhabitant, slightly above the national average of 31.1 m2 per inhabitant, but lower than in other north-eastern Italian cities with an average of 50 m2 per capita [70]. This indicates an overall optimal UGS amount per-capita value, considering that the World Health Organization (WHO) has suggested that every city should have a minimum of 9 m2 of green space per capita, with an optimum between 10 and 15 m2 per capita.
At the district level, q4 and q5 are characterised by having the highest percentages in private UGSs due to the prevalence of agricultural land use and smaller dense residential units. On the contrary, in q3 district, the presence of the “Franco Agosto” Park, with a relevant extension (0.27 km2), increases the amount of public green spaces (31.1%) concerning, which represents only 12.8% of the total. More densely populated areas, such as the q6 district, show lower percentages of green coverage irrespective of ownership status. According to [46,68], the large number of private green spaces should be explicitly considered in UP, developing site-specific policies that consider their contribution to urban ecosystem services provision and allowing for a more complex ecosystem services-oriented UP.
The analysis conducted on NDVI values about LULC classes must consider the presence of numerous outliers in all investigated districts. For these, very low NDVI outliers indicate the presence of artificial surfaces in predominantly vegetated areas. In contrast, outliers at the distribution’s upper tail denote vegetation cover in predominantly artificial areas. More densely urbanized areas, such as q6 and adjacent areas, are generally covered by artificial surfaces with a high degree of imperviousness. On the other hand, according to [71], bare soil and agricultural land may be confused with impervious surfaces with low NDVI values when the same surfaces are dry or barely vegetated, as observed for vineyards in our case study area.

5. Conclusions

Mapping and characterization of UGSs is a crucial node in present and future UP at local, national and European levels for more efficient UP and green areas management. At local level, this study focuses on: (i) detecting and mapping UGS in the Municipality of Forlì, identifying private and public green surfaces, (ii) providing a reference framework for further research aimed at quantifying ecosystem services provided by urban green areas within the framework of the NRRP’s interventions, and (iii) characterizing the heterogeneity of the NDVI spectral responses within and among LULC classes in the urban fabric.
Our results show that the total amount of green spaces is 5.70 km2, of which 72.1% (4.11 km2) is private, and 28.9% (1.59 km2) is classified as public. As for the land cover, three NDVI classes were identified, highlighting different degrees of homogeneity in NDVI reflectance response within each urban land cover unit.
Deep understanding of the ownership status, type and distribution of UGS can be beneficial for public authorities and policymakers in developing site-specific policies and foster incentives aimed at encouraging sustainable urban green management practices [72].
In the future steps of this research, the use of specific and appropriately calibrated models, such as i-Tree (UFORE), will enable the estimation of the ecosystem services provided by the urban forest, such as reduction of water runoff, removal of air pollutants (particulate matter), carbon sequestration and its fixation within plant biomass, all based on an explicit knowledge of the structure and composition of the urban forest. The results of this study will also provide the inputs for the implementation of a prediction model of the accessibility to green areas by the public, based on lower-resolution satellite images. Further studies could also concentrate on differentiation between various types of green spaces, such as grasses, shrubs or bushes, as suggested by [73]. In addition, our results are of interest for further scientific and applied studies for city planners, as this might guide afforestation practices foreseen by the NRRP and encourage the ecosystem services provision of the urban forest.

Supplementary Materials

The following supporting information can be downloaded at: https://www.mdpi.com/article/10.3390/land12030660/s1, Figure S1: q1 (Spazzoli district) Box and Whiskers plot with HSD Tukey of NDVI spectral response on Land Cover database; Figure S2: q2 (Musicisti Grandi Italiani district) Box and Whiskers plot with HSD Tukey of NDVI spectral response on Land Cover database; Figure S3: q3 (Resistenza district) Box and Whiskers plot with HSD Tukey of NDVI spectral response on Land Cover database; Figure S4: q4 (Foro Boario district) Box and Whiskers plot with HSD Tukey of NDVI spectral response on Land Cover database; Figure S5: q5 (Romiti district) Box and Whiskers plot with HSD Tukey of NDVI spectral response on Land Cover database; Table S1: Summary table about greenery level and the Land use and cover by Corine revised classification, according to NDVI values in different districts of the study area.

Author Contributions

Conceptualization, M.O., F.U. and S.E.P.; methodology, M.O., F.U. and S.E.P.; software, M.O. and F.U.; validation, M.O. and F.U.; formal analysis, M.O. and F.U.; investigation, M.O. and F.U.; resources, M.O. and F.U.; data curation, M.O. and F.U.; writing—original draft preparation, M.O., F.U. and S.E.P.; writing—review and editing, M.O., F.U., S.E.P. and M.D.M.; visualization, M.O.; supervision, F.U. and S.E.P.; project administration, M.D.M.; funding acquisition, M.D.M. and S.E.P. All authors have read and agreed to the published version of the manuscript.

Funding

This research received no external funding.

Data Availability Statement

The land cover database can be freely accessed and downloaded from the Regional Emilia-Romagna Cartographic Geoportal, available online at: https://geoportale.regione.emilia-romagna.it/catalogo/dati-cartografici/pianificazione-e-catasto/uso-del-suolo/layer-9 (accessed on 10 February 2022). Processed data and derived maps are available upon request.

Acknowledgments

The authors would like to thank members of the Urban Planning Unit and Municipality of Forlì for providing the municipal cadastral maps, tree census and Urban Planning documentation for the entire municipality. Thanks go to Emilia-Romagna Region for the provision of the high-resolution orthophotos and the Land Use and Land Cover Map. Thanks also go to Francesca Ugolini (CNR-IBE) for critical reading of the manuscript and Katerina Charaktinioti for language revision. We also would thank the Advanced Master in GIScience and UAS, Department ICEA, University of Padua.

Conflicts of Interest

The authors declare no conflict of interest.

References

  1. Ahern, J. Green infrastructure for cities: The spatial dimension. In Cities of the Future: Towards Integrated Sustainable Water and Landscape Management; Novotny, V., Brown, P., Eds.; IWA Publishing: London, UK, 2007; pp. 267–283. [Google Scholar]
  2. Krajter, S.; Salbitano, F.; Borelli, S.; Verlič, A. Urban Forest research in the Mediterranean: A systematic review. Urban For. Urban Green 2018, 31, 185–196. [Google Scholar] [CrossRef]
  3. European Commission. INSPIRE Knowledge Base. Available online: https://inspire.ec.europa.eu/inspire-directive/2 (accessed on 16 January 2023).
  4. Zulian, G.; Marando, F.; Mentaschi, L.; Alzetta, C.; Wilk, B.; Maes, J. Green balance in urban areas as an indicator for policy support: A multi-level application. One Ecosyst. 2022, 7, e72685. [Google Scholar] [CrossRef]
  5. Nastran, M.; Pintar, M.; Železnikar, Š.; Cvejić, R. Stakeholders’ Perceptions on the Role of Urban Green Infrastructure in Providing Ecosystem Services for Human Well-Being. Land 2022, 11, 299. [Google Scholar] [CrossRef]
  6. La Notte, A.; Zulian, G. An Ecosystem Services-Based Approach to Frame NBS in Urban Context. In Nature-Based Solutions for More Sustainable Cities—A Framework Approach for Planning and Evaluation; Croci, E., Lucchitta, B., Eds.; Emerald Publishing Limited: Bingley, UK, 2021; pp. 47–65. [Google Scholar] [CrossRef]
  7. Slaev, A.D.; Alexander, E.R.; Zdravkov, Z.; Ivanov, V.; Georgieva, S. Market tools for the provision of urban green spaces in post-socialist Sofia. Land Use Policy 2022, 122, 106377. [Google Scholar] [CrossRef]
  8. European Commission. Green Infrastructure (GI)—Enhancing Europe’s Natural Capital. Communication from the Commission to the European Parliament, the Council, the European Economic and Social Committee and the Committees of the Regions. COM/2013/0249 Final. 2013. Available online: https://ec.europa.eu/environment/nature/ecosystems/docs/green_infrastructures/1_EN_ACT_part1_v5.pdf (accessed on 21 November 2022).
  9. European Commission. The Urban Agenda for the EU. 2021. Available online: https://ec.europa.eu/regional_policy/en/policy/themes/urban-development/agenda/, (accessed on 3 July 2022).
  10. United Nations. World Urbanization Prospects: The 2018 Revision; Department of Economic and Social Affairs, Population Division: New York, NY, USA. Available online: https://www.un.org/development/desa/pd/file/1942 (accessed on 22 July 2022).
  11. The World Bank. Urban Population. Available online: https://data.worldbank.org/indicator/SP.URB.TOTL.IN.ZS (accessed on 3 November 2022).
  12. D’Alfonso, A.; Italy’s National Recovery and Resilience Plan. Latest State of Play. European Parliamentary Research Service. Available online: https://www.europarl.europa.eu/thinktank/en/document/EPRS_BRI(2021)698847 (accessed on 18 November 2022).
  13. Steenberg, J.W.N. People or Place? An exploration of social and ecological drivers of urban forest species composition. Urban Ecosyst. 2018, 21, 887–901. [Google Scholar] [CrossRef]
  14. Shahtahmassebi, A.; Li, C.; Fan, Y.; Wu, Y.; Lin, Y.; Gan, M.; Wang, K.; Malik, A.; Blackburn, A. Remote sensing of urban green spaces: A review. Urban For. Urban Green. 2021, 57, 126946. [Google Scholar] [CrossRef]
  15. Christoforidi, I.; Kollaros, D.; Papadakaki, M.; Psaroudaki, A.; Antoniou, T.; Daliakopoulos, I.N. A novel index for assessing perceived availability and public demand for urban green space: Application in a Mediterranean island. Urban For. Urban Green 2022, 69, 127498. [Google Scholar] [CrossRef]
  16. Pouya, S.; Aghlmand, M. Evaluation of urban green space per capita with new remote sensing and geographic information system techniques and the importance of urban green space during the COVID-19 pandemic. Environ. Monit. Assess. 2022, 194, 633. [Google Scholar] [CrossRef]
  17. WHO (World Health Organization). Urban Green Spaces and Health; WHO Regional Office for Europe: Copenhagen, Danmark, 2016. Available online: https://www.euro.who.int/__data/assets/pdf_file/0005/321971/Urban-green-spaces-and-health-review-evidence.pdf (accessed on 4 July 2022).
  18. De Meo, I.; Becagli, C.; Cantiani, M.G.; Casagli, A.; Paletto, A. Citizens’ use of public urban green spaces at the time of the COVID-19 pandemic in Italy. Urban For. Urban Green. 2022, 77, 127739. [Google Scholar] [CrossRef]
  19. Ugolini, F.; Massetti, L.; Pearlmutter, D.; Sanesi, G. Usage of urban green spaces and related feelings of deprivation during the COVID-19 lockdown: Lesson learned from an Italian case study. Land Use Policy 2021, 105, 105437. [Google Scholar] [CrossRef]
  20. De Meo, I.; Alfano, A.; Cantiani, M.G.; Paletto, A. The Impact of the COVID-19 Pandemic on Citizens’ Attitude and Behaviours in the Use of Peri-Urban Forests: An Experience from Italy. Sustainability 2023, 15, 2852. [Google Scholar] [CrossRef]
  21. Pamukcu-Albers, P.; Ugolini, F.; La Rosa, D.; Gradinaru, S.R.; Azevedo, J.C.; Wu, J. Building green infrastructure to enhance urban resilience to climate change and pandemics. Landscape Ecol. 2021, 36, 665–673. [Google Scholar] [CrossRef] [PubMed]
  22. Sitzia, T.; Campagnaro, T.; Weir, R.G. Novel woodland patches in a small historical Mediterranean city: Padova, Northern Italy. Urban Ecosyst 2019, 19, 475–487. [Google Scholar] [CrossRef]
  23. Conceptual Framework Working Group of the Millennium Ecosystem Assessment. Ecosystems and Human Well-Being: A Framework for Assessment; Island Press: Washington, DC, USA, 2003; pp. 7–19. [Google Scholar]
  24. Haines-Young, R.; Potschin, M. Common International Classification of Ecosystem Services (CICES): Consultation on Version 4, August–December 2012; European Environment Agency: Copenhagen, Denmark, 2013. [Google Scholar]
  25. Choudhury, M.A.; Marcheggiani, E.; Despini, F.; Costanzini, S.; Rossi, P.; Galli, A.; Teggi, S. Urban Tree Species Identification and Carbon Stock Mapping for Urban Green and Management. Forest 2020, 11, 1226. [Google Scholar] [CrossRef]
  26. Cappucci, S.; Nappi, S.; Cappelli, A. Green Public Areas and Urban Open Spaces Management: New GreenCAL Tool Algorithms and Circular Economy Implications. Land 2022, 11, 886. [Google Scholar] [CrossRef]
  27. Page, J.; Karesdotter, E.; Destouni, G.; Pan, H.; Kalantari, Z. A more complete accounting of greenhouse gas emission and sequestration in the urban landscape. Anthropocene 2021, 34, 100296. [Google Scholar] [CrossRef]
  28. Pristeri, G.; Peroni, F.; Pappalardo, S.E.; Codato, D.; Castaldo, A.G.; Masi, A.; de Marchi, M. Mapping and assessing soil sealing in Padua municipality through biotope area factor index. Sustainability 2020, 12, 5167. [Google Scholar] [CrossRef]
  29. Gray, L.; Guzman, P.; Glowa, K.M.; Drevno, A.G. Can home gardens scale up into movements for social change? The role of home gardens in providing food security and community change in San Jose, California. Local Environ. Int. J. Justice Sustain. 2014, 19, 187–203. [Google Scholar] [CrossRef]
  30. Semeraro, T.; Scarano, A.; Buccolieri, R.; Santino, A.; Aarrevaara, E. Planning of Urban Green Spaces: An Ecological Perspective on Human Benefits. Land 2021, 10, 105. [Google Scholar] [CrossRef]
  31. Calzolari, C.; Tarocco, P.; Lombardo, N.; Marchi, N.; Ungaro, F. Assessing soil ecosystem services in urban and peri-urban areas: From urban soils survey to providing support tool for urban planning. Land Use Policy 2020, 99, 105037. [Google Scholar] [CrossRef]
  32. Reis, C.; Lopes, A. Evaluating the Cooling Potential of Urban Green Spaces to Tackle Urban Climate Change in Lisbon. Sustainability 2019, 11, 2480. [Google Scholar] [CrossRef] [Green Version]
  33. Aronson, M.; Lepczk, C.A.; Evans, K.L.; Goddard, M.A.; Lerman, S.B.; Maclvor, J.S.; Nilon, C.H.; Vargo, T. Biodiversity in the city: Key challenges for urban green space management. Front. Ecol. Environ. 2017, 15, 189–196. [Google Scholar] [CrossRef] [Green Version]
  34. Pistocchi, A.; Calzolari, C.; Malucelli, F.; Ungaro, F. Soil sealing and flood risks in the pains of Emilia-Romagna, Italy. J. Hydrol. Reg. Stud. 2015, 4, 398–409. [Google Scholar] [CrossRef]
  35. Ungaro, F.; Maienza, A.; Ugolini, F.; Lanini, G.M.; Baronti, S.; Calzolari, C. Assessment of joint soil ecosystem services supply in urban green spaces: A case study in Northern Italy. Urban For. Urban Green. 2022, 67, 127455. [Google Scholar] [CrossRef]
  36. Thanapura, P.; Helder, D.L.; Burckhard, S.; Warmath, E.; O’Neill, M.; Galster, D. Mapping urban land cover using Quickbird NDVI and GIS spatial modelling for runoff coefficient determination. Photogramm. Eng. Remote Sens. 2007, 73, 57–65. [Google Scholar] [CrossRef] [Green Version]
  37. Gaston, K.J.; Warren, P.H.; Thompson, K.; Smith, R.M. Urban Domestic Gardens (IV), The Extent of the Resource and its Associated Features. Biodivers. Conserv. 2005, 14, 3327–3349. [Google Scholar] [CrossRef]
  38. Clark, C.; Ordonez, C.; Livesley, S.J. Private tree removal, public loss: Valuing and enforcing existing tree protection mechanisms in the key to retaining urban trees on private land. Landsc. Urban Plan. 2020, 203, 103899. [Google Scholar] [CrossRef]
  39. Steenberg, J.W.N.; Duinker, P.N.; Nitoslawski, S.A. Ecosystem-based management revisited: Updating the concepts for urban forests. Landsc. Urban Plan. 2019, 186, 24–35. [Google Scholar] [CrossRef]
  40. Coolen, H.; Meesters, J. Private and public green spaces: Meaningful but different settings. J. Hous. Built Environ. 2012, 27, 49–67. [Google Scholar] [CrossRef] [Green Version]
  41. Haaland, C.; Bosch, C.K. Challenges and strategies for urban green-space planning in cities undergoing densification: A review. Urban For. Urban Green. 2015, 14, 25573. [Google Scholar] [CrossRef]
  42. Nordström, J.; Hammarlund, C. You Win Some, You Lose Some: Compensating the Loss of Green Space in Cities Considering Heterogeneous Population Characteristics. Land 2021, 10, 1156. [Google Scholar] [CrossRef]
  43. Qian, Y.; Zhou, W.; Nytch, C.J.; Han, L.; Li, Z. A new index to differentiate tree and grass based on high-resolution image and object-based methods. Urban For. Urban Green 2020, 53, 126661. [Google Scholar] [CrossRef]
  44. Emilia Romagna, R.D. Regional Administrative Act May, 1, 2021, n. 647 (in Italian: Delibera della Giunta Regionale 10 Maggio 2021, n. 674, seduta n. 23); Regione Emilia-Romagna: Bologna, Italy, 2021. [Google Scholar]
  45. Vatseva, R.; Kopecka, M.; Otahel, J.; Rosina, K.; Kitev, A.; Genchev, S. Mapping Urban Green Spaces Based on Remote Sensing data: Case studies in Bulgaria and Slovakia. In Proceedings of the 6th International Conference on Cartography and GIS, Albena, Bulgaria, 13–17 June 2016. [Google Scholar]
  46. Pristeri, G.; Peroni, F.; Pappalardo, S.E.; Codato, D.; Masi, A.; De Marchi, M. Whose Urban Green? Mapping and Classifying Public and Private Green Spaces in Padua for Spatial Planning Policies. ISPRS Int. J. Geo-Inf. 2021, 10, 538. [Google Scholar] [CrossRef]
  47. Ossola, A.; Hopton, M.E. Measuring urban tree loss dynamics across residential landscapes. Sci. Total Environ. 2018, 612, 940–949. [Google Scholar] [CrossRef]
  48. Xue, J.; Su, B. Significant remote sensing vegetation indices: A review of developments and applications. J. Sens. 2017, 1353691. [Google Scholar] [CrossRef] [Green Version]
  49. Huang, S.; Tang, L.; Hupy, J.P.; Wang, Y.; Shao, G. A commentary review on the use of normalized difference vegetation index (NDVI) in the era of popular remote sensing. J. For. Res. 2021, 32, 1–6. [Google Scholar] [CrossRef]
  50. Patón, D. Normalized Difference Vegetation Index Determination in Urban Areas by Full-Spectrum Photography. Ecologies 2020, 1, 22–35. [Google Scholar] [CrossRef]
  51. Ritchter, M.; Weiland, U. Applied Urban Ecology: A Global Framework; Blackwell Publishing: West Sussex, UK, 2012. [Google Scholar]
  52. Himan, S.; Baharin, B.A.; Mohammad, H.M.; Mohsen, A.Z. Detection of urban irregular development and green space destruction using normalized difference vegetation index (NDVI), principal component analysis (PCA) and post-classification methods: A case study of Saqqez city. Int. J. Phys. Sci. 2012, 7, 2587–2595. [Google Scholar]
  53. Moreno, R.; Ojeda, N.; Azòcar, J.; Venegas, C.; Inostroza, L. Application of NDVI for identify potentiality of the urban forest for the design of a green corridors system in intermediary cities of Latin America: Case study, Temuco, Chile. Urban For. Urban Green 2020, 55, 126821. [Google Scholar] [CrossRef]
  54. Governo della Repubblica Italiana. Piano Nazionale di Ripresa e Resilienza. Next Generation Italia. Available online: https://www.governo.it/sites/governo.it/files/PNRR.pdf (accessed on 21 November 2022).
  55. Zhou, W.; Cadenasso, M.L.; Schwarz, K.; Pickett, S.T.A. Quantifying Spatial Heterogeneity in Urban Landscapes: Integrating Visual Interpretation and Object-Based Classification. Remote Sens. 2014, 6, 3369–3386. [Google Scholar] [CrossRef] [Green Version]
  56. Martin, C.A.; Proulx, R.; Vellend, M.; Fahrig, L. How the relationship between vegetation cover and landcover variance constrains biodiversity in a human dominated world. Landsc. Ecol. 2021, 36, 3097–3104. [Google Scholar] [CrossRef]
  57. ISTAT (Nation Institute of Statistics). Population and Housing Census 2021 Edition. Available online: https://www.istat.it/it/archivio/265472 (accessed on 30 November 2022).
  58. ARPAE. Climatological Tables. Available online: https://www.arpae.it/it/temi-ambientali/clima/dati-e-indicatori/tabelle-climatiche (accessed on 5 July 2022).
  59. Regione Emilia-Romagna. 2017—Coperture Vettoriali Uso Del Suolo di Dettaglio, Edizione 2020. Statistics Service and Geographic Information Systems, 2020. Available online: http://www.regione.emilia-romagna.it (accessed on 4 April 2022).
  60. Copernicus Program. Updated CLC Illustrated Nomenclature Guidelines. Available online: https://land.copernicus.eu/user-corner/technical-library/corine-land-cover-nomenclature-guidelines/html/index-clc-141.html (accessed on 3 July 2022).
  61. EU (European Union)—European Environment Agency (EEA), Copernicus Land Monitoring Service. Corine Land Cover PRODUCTS user Manual (2020). Available online: https://land.copernicus.eu/user-corner/technical-library/clc-product-user-manual (accessed on 14 July 2022).
  62. Garberi, M.L.; Lenzi, D.; Mariani, M.C.; Masi, S.; Orlandi, F.; Vigilante, E. Database uso del suolo di dettaglio 2017, 2020, Servizio Statistica e Sistemi Informativi Geografici, Regione Emilia-Romagna. Available online: https://servizigis.regione.emilia-romagna.it/ctwmetadatiRER/metadatoISO.ejb?stato_FileIdentifier=iOrg01iEnP1fileIDr_emiro:2020-04-06T135318 (accessed on 10 April 2022).
  63. Aryal, J.; Sitaula, C.; Aryal, S. NDVI Threshold-Based Urban Green Space Mapping from Sentinel-2A at the Local Governmental Area (LGA) Level of Victoria, Australia. Land 2022, 11, 351. [Google Scholar] [CrossRef]
  64. Atasoy, M. Monitoring the urban green spaces and landscape fragmentation using remote sensing: A case study in Osmaniye, Turkey. Environ. Monit. Assess 2018, 190, 713. [Google Scholar] [CrossRef] [PubMed]
  65. Akbar, T.A.; Hassan, Q.K.; Ishaq, S.; Batool, M.; Butt, H.J.; Jabbar, H. Investigative Spatial Distribution and Modelling of Existing and Future Urban Land Changes and Its Impact on Urbanization and Economy. Remote Sens. 2019, 11, 105. [Google Scholar] [CrossRef] [Green Version]
  66. RStudio Team. RStudio: Integrated Development for R; RStudio: PBC, Boston, MA, USA. Available online: http://www.rstudio.com (accessed on 4 April 2022).
  67. Hashim, H.; Abd Latif, Z.; Adnan, N.A. Urban Vegetation Classification with NDVI Threshold Value Method with Very High Resolution (VHR) Pleidas imagery. Int. Arch. Photogramm. Remote Sens. Spat. Inf. Sci. 2019, XLII-4/W16, 237–240. [Google Scholar] [CrossRef] [Green Version]
  68. Haase, D.; Jänicke, C.; Wellmann, T. Front and back yard green analysis with subpixel vegetation fractions from earth observation data in a city. Landsc. Urban Plan. 2019, 182, 44–54. [Google Scholar] [CrossRef]
  69. Mathieu, R.; Freeman, C.; Aryal, J. Mapping private gardens in urban areas using object-oriented techniques and very high-resolution satellite imagery. Landsc. Urban Plan. 2007, 81, 179–192. [Google Scholar] [CrossRef]
  70. ISTAT (Nation Institute of Statistics). Urban Green Spaces. Available online: https://www.istat.it/it/archivio/186708 (accessed on 30 November 2022).
  71. Codemo, A.; Pianegonda, A.; Ciolli, M.; Favargiotti, S.; Albatici, R. Mapping Pervious Surfaces and Canopy Cover Using High-Resolution Airborne Imagery and Digital Elevation Models to Support Urban Planning. Sustainability 2022, 14, 6149. [Google Scholar] [CrossRef]
  72. Cameron, R.W.F.; Blanuša, T.; Taylor, J.E.; Salisbury, A.; Halstead, A.J.; Henricot, B.; Thompson, K. The domestic garden—Its contribution to urban green infrastructure. Urban For. Urban Green 2012, 11, 129–137. [Google Scholar] [CrossRef]
  73. Shekhar, S.; Aryal, J. Role of geospatial technology in understanding urban green spaces of Kalaburagi city for sustainable planning. Urban For. Urban Green 2019, 46, 126450. [Google Scholar] [CrossRef]
Figure 1. A geographical framework of the Municipality of Forlì in the eastern Emilia-Romagna Region, and zoomed-in images of different types of the urban fabric of the city: (a) roadside greenery in Foro Boario—q4 district; (b) Prefecture of Forlì Municipality and “Aurelio Saffi” Square in Centro Storico—q6 district; (c) rural area included in municipality texture in Romiti—q5 district; (d) “Via Dragoni” Park (0.06 km2 extension) in Grandi Musicisti Italiani—q2 district.
Land 12 00660 g001
Figure 2. Land cover map of study area 2017 (edition 2020). The legend presents the 4th-level CLC codes and relative descriptions in the study area.
Land 12 00660 g002
Figure 3. Municipal public green spaces in the q6 (Centro Storico) district and in the entire study area (left).
Land 12 00660 g003
Figure 4. Workflow showing main methodologies (white and blue boxes), data input (yellow box), and outputs (pink box) with the statistical analysis performed (orange box) for the extraction of private and public green surfaces.
Land 12 00660 g004
Figure 5. Workflow showing the statistical analysis: post-processing of NDVI spectral response data and BD ANOVA for Corine Land Cover units.
Land 12 00660 g005
Figure 6. Urban green spaces of the six core districts of Forlì by NDVI extraction, before integration with the cadastral public green database.
Land 12 00660 g006
Figure 7. Extraction of green areas after threshold application to NDVI results, considering values ≥ 0.15.
Land 12 00660 g007
Figure 8. Spatial distribution of private and public green spaces in the study area.
Land 12 00660 g008
Figure 9. Region q6 (Centro Storico) Box and Whiskers plot with HSD Tukey test letters in red on the top of the boxes. Different letters highlight significant differences among different groups (CLC units). Outliers are identified with black dots. Lower and upper whiskers represent the non-outlier minimum and maximum NDVI respectively. The box is delimited by the first and the third quartile, and the black bold line is the median, while the red dot is the mean value. The overall mean value is 0.065. The legend for CLC classes is given in the caption of Figure 2.
Land 12 00660 g009
Figure 10. Graphics of Corine Land Cover classes found in overall districts of the study area, and the NDVI classification based in classes of Table S1 in Supplementary Materials. In orange, are the NDVI median values and the interquartile range. Blue lines represent the limits of the median NDVI classes (low ≤ 0.0, medium > 0 and <0.15, high ≥ 0.15). The legend for CLC classes is given in the caption of Figure 2.
Land 12 00660 g010
Figure 11. Classes of urban greenery according to classed NDVI values for the LULC units. The three classes are based on NDVI median value: low (NDVI ≤ 0), medium (0 < NDVI < 0.15) and high (NDVI ≥ 0.15).
Land 12 00660 g011
Table 1. Main input spatial data and relative sources.
NameDescriptionUseSource
Orthophotos0.02 m/pixel resolution, multiband (RGB-NIR)NDVI extractionAGEA/Emilia-Romagna Region (2020)
Land cover databaseDigital land use and cover map (fourth-level classification)Integration for BD-ANOVA Statistical analysis Emilia-Romagna Region (edition 2017, 2020) [59]
Cadastral databaseCadastral database of municipal parcelsPublic and private green areas extractionMunicipality of Forlì
Cadastral public green databaseCadastral database of public green surfacesPublic and private green areas extraction Municipality of Forlì
Municipal tree censusMunicipal census of trees (2021) with species information Ancillary data for private and public green extractionMunicipality of Forlì
Table 2. Green surfaces in the study area from NDVI extraction and quantitative analysis. The number of inhabitants is related to the ISTAT census (May 2021).
District CodeDistrict NameTotal Surface [km2]Private Green Surface [km2]Public Green Space [km2]N InhabitantsPublic Green Per-Capita
[m2 Inhabitant−1]
Q1Spazzoli1.900.37 (19.7%)0.31 (16.2%)11,66726.5
Q2Grandi Musicisti Italiani1.880.41 (21.9%)0.23 (12.1%)724231.5
Q3Resistenza1.230.16 (12.8%)0.38 (31.1%)645959.1
Q4Foro Boario3.861.44 (37.3%)0.29 (7.6%)885133.0
Q5Romiti2.961.53 (51.7%)0.19 (6.6%)388750.3
Q6Centro Storico1.770.20 (11.2%)0.18 (10.3%)11,45716.0
Total13.614.11 (72.1%)1.59 (28.9%)49,56332.1
Disclaimer/Publisher’s Note: The statements, opinions and data contained in all publications are solely those of the individual author(s) and contributor(s) and not of MDPI and/or the editor(s). MDPI and/or the editor(s) disclaim responsibility for any injury to people or property resulting from any ideas, methods, instructions or products referred to in the content.

