Article

Land Use Change Net Removals Associated with Sugarcane in Brazil

by
Marjorie M. Guarenghi
1,*,
Danilo F. T. Garofalo
1,*,
Joaquim E. A. Seabra
2,
Marcelo M. R. Moreira
1,
Renan M. L. Novaes
3,
Nilza Patrícia Ramos
3,
Sandra F. Nogueira
3 and
Cristiano A. de Andrade
3
1
Agroicone, Avenida Angélica, 2447 Higienópolis, Sao Paulo 01227-200, Brazil
2
School of Mechanical Engineering, University of Campinas, 200 Mendeleyev, Campinas 13083-860, Brazil
3
Embrapa Meio Ambiente, Rodovia SP-340, Km 127.5, Jaguariuna 13918-110, Brazil
*
Authors to whom correspondence should be addressed.
Land 2023, 12(3), 584; https://doi.org/10.3390/land12030584
Submission received: 26 January 2023 / Revised: 17 February 2023 / Accepted: 23 February 2023 / Published: 28 February 2023
(This article belongs to the Special Issue Feature Papers for 'Land Socio-Economic and Political Issues' Section)

Abstract

:
This work brings a refined estimation of the land use change and derived CO2 emissions associated with sugarcane cultivation, including changes in management practices and refined land-use carbon stocks, over the last two decades for Brazil’s center–south and north regions. The analysis was carried out at the rural property level, considering spatially explicit land conversion data. With the refinements, we found a net carbon removal of 9.8 TgCO2∙yr−1 in sugarcane cultivation areas in the 2000–2020 period, which was due to the expansion of sugarcane over poor quality pastures (55% of the gross removals), croplands (15%) and mosaic (14%) areas, and the transition from the conventional burned harvesting to unburned (16%). Moreover, 98.4% of expansion was over existent agricultural areas. Considering all the land use changes within sugarcane-producing rural properties, the net removal is even larger, of 17 TgCO2∙yr−1, which is due to vegetation recovery. This suggests that public policies and private control mechanisms might have been effective not only to control deforestation but also to induce carbon removals associated with sugarcane cultivation. These results indicate sugarcane production system and derived products as contributors to net carbon removals in the land sector in Brazil and should be considered for both bioenergy and agricultural sustainability evaluation.

1. Introduction

Bioenergy is expected to become an important ally in the search for a low-carbon future [1,2,3]. Particularly in Brazil’s case, using modern biomass energy (e.g., liquid biofuels, bio-refineries which use feedstocks associated with energy plantations, bagasse, and industrial wood residues) is already consolidated, and ethanol will be one of the fundamental pillars for the country to fulfill the commitments set forth in its Nationally Determined Contribution (NDC) [4]. In this sense, the country instituted its new biofuels policy (known as RenovaBio—Law 13.576/2017), with a view to advancing an adequate expansion of biofuels in the energy matrix, ensuring predictability for the market while it induces gains in energy efficiency and in mitigating greenhouse gas (GHG) emissions in the production chain. Additionally to proposing policies, it is necessary to consider the effects of land use change (LUC) in these policies, notably, those associated with sugarcane cultivation and ethanol replacement of fossil fuels. Of all the sugarcane crushed in the mills in the last 20 years, on average, about 55% were destined for the production of ethanol and 45% were destined for sugar [5,6]; the other main product derived from sugarcane is the bioelectricity generated with the bagasse burning, and a small portion of sugarcane is used for animal feed, cachaça (sugarcane spirit), and sugarcane syrup production (in small factories).
LUC is one of the most relevant topics for sustainability in bioenergy [7] as well as for any other agricultural origin product. It is estimated that in 2020, emissions per LUC reached about 3.3 PgCO2, representing 9% of global CO2 emissions [8], and 66% in Brazil [9]. A series of tools were developed to provide LUC estimates to life cycle assessments [10], for example, the LUC Impact tool [11], geoFootprint [12], and BRLUC [13]. In general, LUC estimates are based on Intergovernmental Panel on Climate Change (IPCC) guidelines for national inventories [10,14]. However, the results of LUC emissions vary considerably depending on the LUC accounting methodology, the modeling choices, data source, and spatiotemporal level of analysis [10,15,16]. In Brazil, LUC emissions are very heterogeneous across the national territory, considering different crops, with a large range, from highly positive to negative values [10]. Many studies have addressed this issue with a focus on both direct LUC (dLUC) and indirect LUC (iLUC) associated with sugarcane in Brazil [17,18], and the results of GHG emission estimates also range widely (e.g., results emissions due to dLUC ranging from 8.4 to −2.6 MgCo2eq∙ha−1 from different versions of two models, as a consequence of different patterns of land transformation, geographical resolution, and sugarcane carbon stocks considered [18]). Many of them highlight the role that sustainable practices and public and private measures can have in mitigating associated LUC GHG emissions (e.g., Andrade- Junior et al. [19]; Follador et al. [20]).
To align the expansion of energy crops and agriculture, in general, with protecting natural areas and reducing GHG emissions, Brazil established a set of public policies and private control mechanisms. Of these, Picoli and Gerber [21] highlight the Low-Carbon Agriculture Plan (ABC Plan, 2010–2020 cycle, Law 12.167/2009), the new Forestry Code, including the Rural Environmental Registry (CAR in the Portuguese acronym), and the Environmental Compliance Program (PRA) (Law 12.651/2012). The ABC Plan provided rural credit to stimulate low-carbon agricultural practices or technologies focusing on thematics related, for example, to the recovery of degraded pastures, no-till farming systems, and adaptation to climate change. The new cycle of ABC Plan, ABC+ (2020–2030) launched in 2021, also proposes initiatives for an integrated approach to the landscape and provides funding for the recovery of legally protected areas [22,23]. The new Forestry Code, the main legal instrument for the protection of native vegetation in Brazil, establishes rules for safeguarding areas of permanent preservation and remaining native vegetation [24]. The monitoring unit of the Forestry Code is the CAR: a land registry in which the landowners declare the boundaries and the environmental information of their private properties. The PRA corresponds to a set of actions required of rural landowners to ensure compliance with the legislation (Forestry Code) [24]. The recently revoked Agroecological Zoning of Sugarcane (ZAE Cana, Decree 6.961/2009) is also relevant, as it established the regions in which sugarcane could expand in the country with the aid of public rural credit and excluded the Amazon from it.
In RenovaBio’s case, the issue of LUC is addressed by checking the eligibility of the rural property from which the raw material originates [25]. To take part in the program, the biomass cannot be supplied from any suppressed native vegetation after November 2018 nor can it have an inactive CAR [25]. However, other public policies and agreements established in the context of the sugarcane sector are also worth mentioning, such as São Paulo State Law 11,241/2002, and the voluntary agreements signed between São Paulo government and the Sugarcane Industry Association—Agri-Environment protocol in 2007, and the Green Ethanol Protocol in 2017—which target the progressive elimination of pre-harvest burning of sugarcane [26]. This represents an important change in sugarcane management with significant implications for land carbon stock [27,28].
In the last 20 years, the displacement of sugarcane crops over pastures was relevant in the dynamics of changes in land use in the country [29,30,31]. Changes in soil carbon stock in pasture areas converted to sugarcane will depend on soil texture and natural fertility [32,33,34] and sugarcane cultivation management (fertilization, raw harvest, maintenance of straw on the ground, and interval between reforms) [35,36,37]. Considering that in the year 2000, around 65% of Brazilian pastures were at some stage of degradation, the expansion of sugarcane has reintegrated degraded pastures into a more productive system, with increases in the carbon stock being reported in the ground [38,39] and biomass carbon [40].
To reduce uncertainties about LUC emissions estimates, the use of regional data, based on land use systems, climatic regions, local agriculture management practices, and spatially explicit data should be preferred to global or national parameters [14]. Some studies have been developed to better represent the LUC emissions estimates due to Brazilian agricultural products [10,12,13,41] that use evidence ranging from national and state-level data [13] to spatially explicit municipal-level data [10] for a set of crops in the country. However, improvements can be made by incorporating management practices and Tier 2 carbon stocks to provide more accurate results of LUC emission due to sugarcane cultivation including specific carbon stock values for different pasture quality levels, the dynamics of the use of mechanically harvested sugarcane, and updates of carbon stock from sugarcane and temporary annual crops. In the context of landowners and bioenergy producers, the CAR boundary can be a differential and an instrument of monitoring the LUC associated with their products’ cultivation system and with practices related to the preservation of natural vegetation or compliance with the legislation over time.
Given the importance of bioenergy for the low-carbon future and this regulatory context, this study aimed to quantify the land-use change and derived CO2 emissions associated with sugarcane cultivation, including changes in management practices and refined land-use carbon stocks factors, over the last two decades in Brazil’s center–south and north regions. We refined the parametrization of carbon stocks aiming to better represent the LUC associated with the Brazilian sugarcane expansion pattern, considering aspects such as (i) quality levels of pastures of the LUC, (ii) history of mechanized harvesting of sugarcane, and (iii) more accurate and regionalized estimates of carbon stocks in sugarcane biomass, based on recently available data, for Brazilian regions, besides the adoption of annual crops carbon stocks of the IPCC [14]. This analysis was performed considering two scopes: the sugarcane cultivation areas and the rural properties (i.e., CAR) with sugarcane production. It considered land use, land cover, and land conversion maps produced by the MapBiomas project. With this, we sought to evaluate the sugarcane LUC footprint after the implementation of policies and private mechanisms for GHG emissions control in the sector. These results are also intended to support international efforts for modeling land use so that they can more adequately reflect the conditions for expanding sugarcane ethanol production in Brazil.

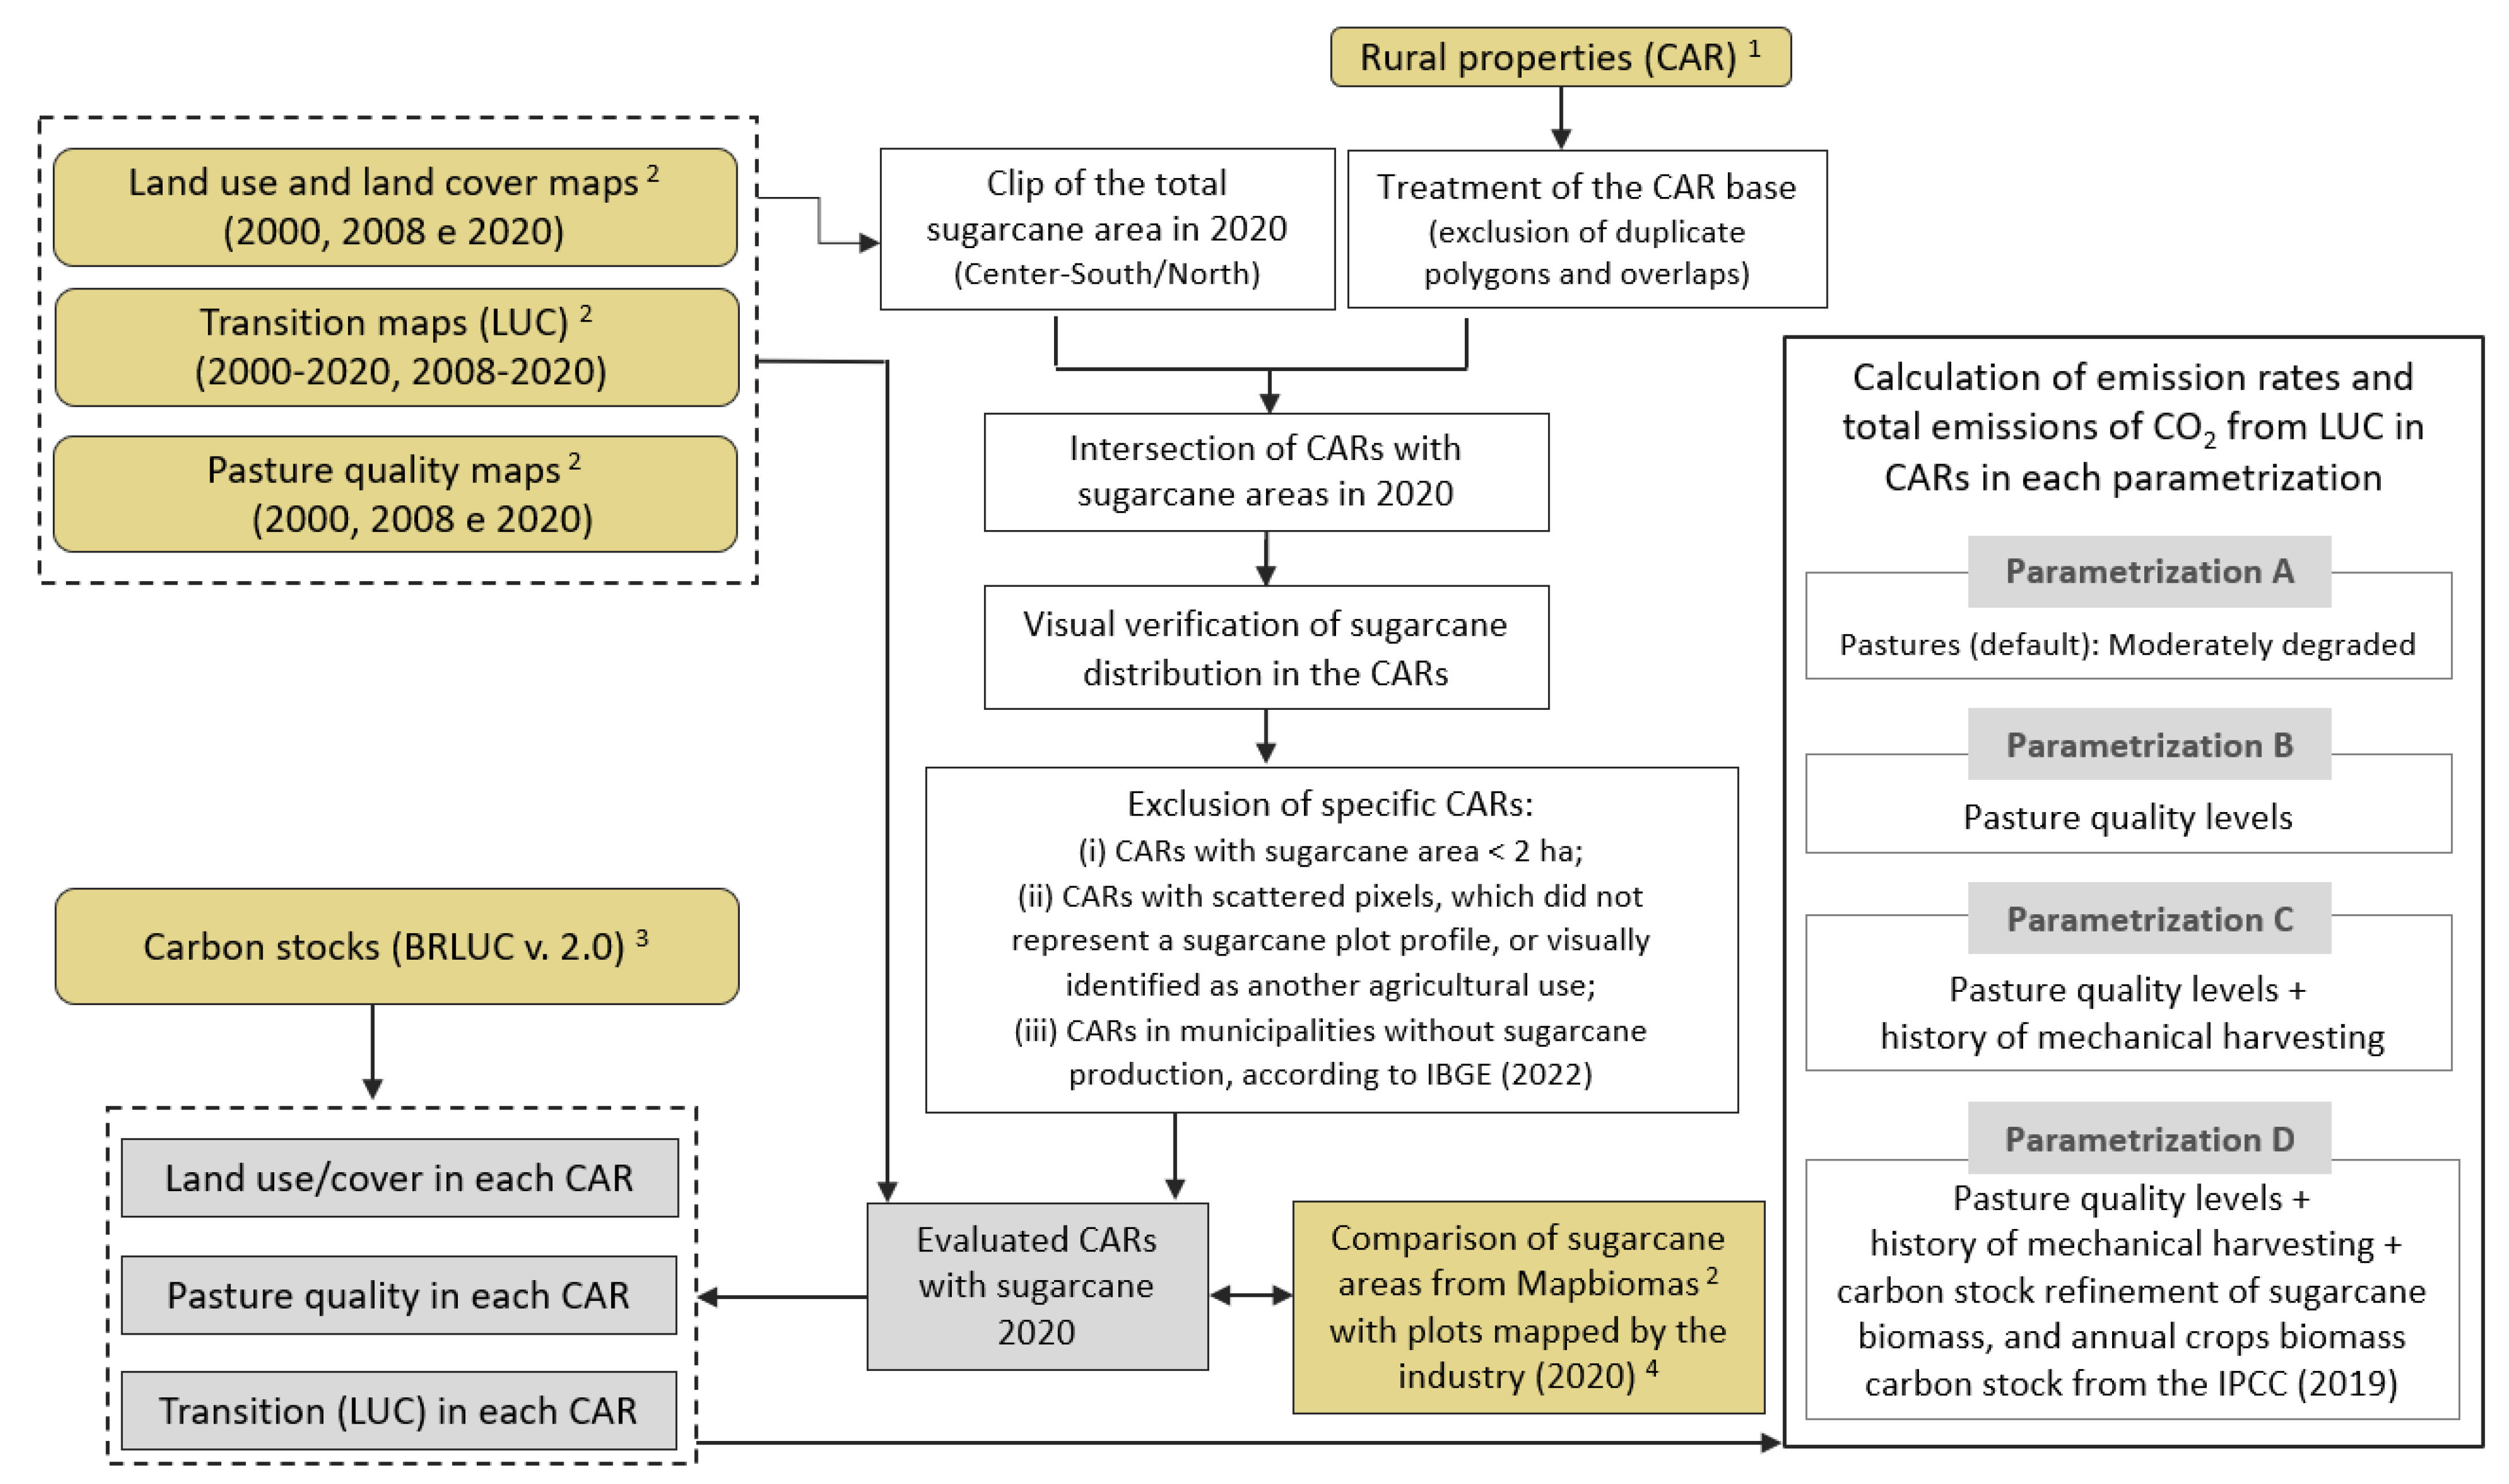
2. Materials and Methods

The adopted procedure is summarized in Figure 1.

2.1. Dynamics of Land Use Change

The dynamics of LUC due to sugarcane expansion was evaluated from land use and land cover maps for the years 2000, 2008, and 2020, and transition maps (2000–2020 and 2008–2020) produced by the Mapbiomas project (Coleção 6.0) [31]. Mapbiomas maps are produced from the pixel-per-pixel classification of images from the Landsat-5, Landsat-7, and Landsat-8 satellites, using machine learning algorithms through the Google Earth Engine platform, and they present an 87.4% global accuracy [31]. The 2000–2020 range allows estimating emissions due to LUC over a 20-year period, as suggested in IPCC guidelines [14,44] and major international protocols on bioenergy [45]. The year 2008 was selected for being a legal milestone within the main Brazilian environmental legislation—the law on native vegetation protection [24], and for being a baseline limit for deforestation according to criteria for the sustainable production of biofuels such as the Renewable Energy Directive (RED II) [46] and the Carbon Offsetting and Reduction Scheme for International Aviation (CORSIA) [47]. In addition to allowing an analysis of the effects of vegetation preservation policies on changes in land use in the CARs, the 2008–2020 evaluation also allows identifying the influence of changes in sugarcane management and the variation in the quality of pastures over time on LUC emission estimates.
Pasture quality maps [31] were also used for assessing pasture quality levels in each evaluated year. The available data characterize the pastures according to vegetative vigor index (NDVI) values, which reflect quality pastures in three levels: (i) Severely Degraded, (ii) Moderately Degraded, and (iii) Pasture with no Signs of Degradation [31,48,49]. These degradation levels are equivalent to those of the IPCC [44,50].

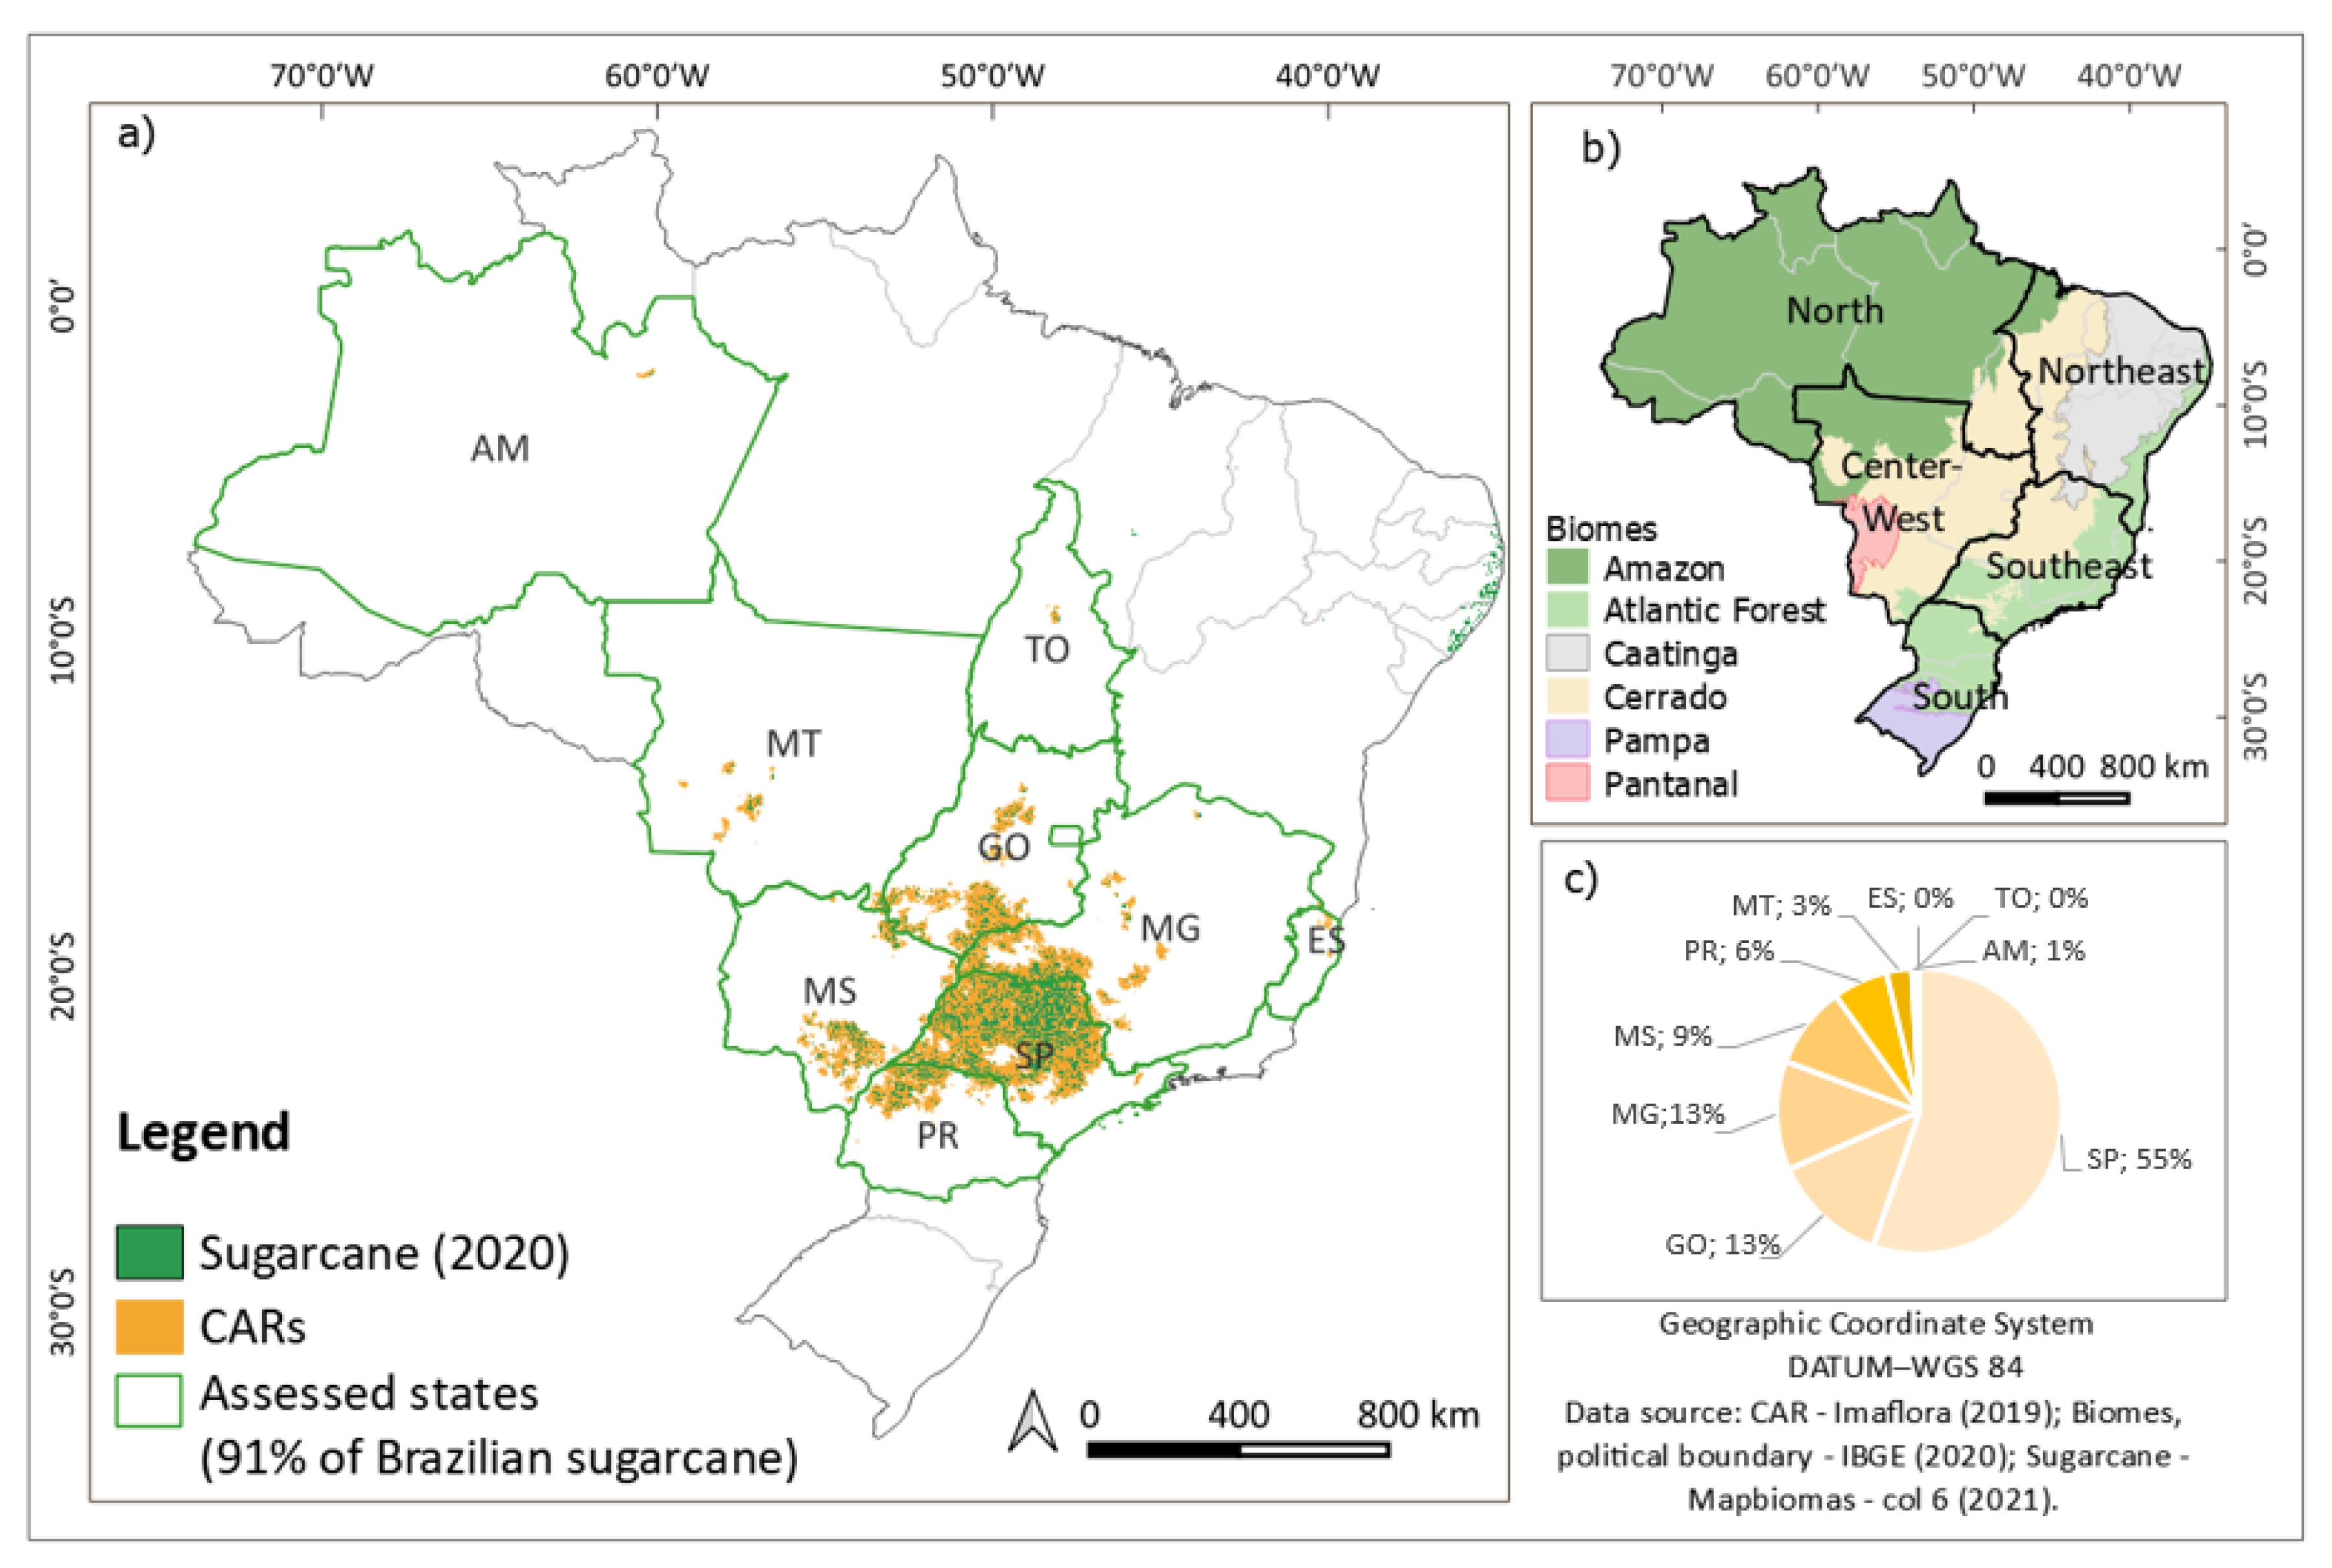
2.2. Selecting the Study Areas

The study area includes rural properties from the CAR with sugarcane cultivation in 2020, according to MapBiomas data, which are located in the Brazilian states in the center–south portion of the country, and in the two states in the north region with sugarcane cultivation in 2020. The center–south region represents 90.7% of the area covered by sugarcane in Brazil and accounts for 93% of the national sugarcane and ethanol production [51,52]. The north region, despite sugarcane occurrence, contributes only 0.5% of the national sugarcane area and production [51]. The states in the northeast region were not considered in the analysis, which despite having 8.8% of the area covered by sugarcane in the country is a crop retraction region with a 17% reduction in area in 2000–2020 [51].
The states assessed in the country’s center–south region are São Paulo (SP), Minas Gerais (MG), Paraná (PR), Espírito Santo (ES), Mato Grosso (MT), Mato Grosso do Sul (MS), Goiás (GO); and in the north region, Amazonas (AM) and Tocantins (TO) (Figure 2). The other states belonging to these regions and not mentioned here had no sugarcane areas in 2020, according to MapBiomas [31].
The spatial distribution of the CARs was obtained from Imaflora [42]. CAR, a geodatabase that represents the boundaries of each private property in Brazil, is a legal instrument for supporting environmental compliance of properties following the Brazilian Forest Law [53]. The CAR database was verified and treated by cleaning up duplicate polygons and excluding overlapping areas, prioritizing property records with the most recent approval date, according to Sicar [54].
CAR data were combined with the sugarcane area mapped in 2020 [31]. After crossing these, new CARs were excluded from the analysis according to the following criteria: (i) CARs with a mapped sugarcane area of less than 2 hectares; (ii) CARs whose area mapped with sugarcane, according to MapBiomas, was formed by small scattered pixels, which did not represent a sugarcane plot profile, or which, based on a visual assessment, were identified as mistakenly mapped as sugarcane by automatic land use classification; and (iii) CARs located in municipalities that have no sugarcane production, according to the official source for national agricultural production [51]. The excluded areas represent approximately 0.5% of the sugarcane area mapped by MapBiomas within the CARs in the considered states (see maps with the location of excluded CARs in Supplementary Material S1). In addition, around 1.5% of the areas mapped with sugarcane in the center–south did not have CARs associated with them and, therefore, they were not considered in the analysis. All procedures were performed using ArcGIS 10.8 and QGIS 3.22 software.
The total area of the evaluated CARs with sugarcane in 2020 is 16.7 Mha and comprises more than 108,000 rural properties located mainly in São Paulo (55%, in area), Minas Gerais and Goiás (13%), and Mato Grosso do Sul (9%) states, with predominance of the Atlantic Forest and Cerrado biomes. Figure 2 shows the location of the properties.
The MapBiomas sugarcane areas (in 2020) were compared with spatialized data of sugarcane plots provided by the industry for 2020, corresponding to 1,330,000 ha of sugarcane [43]. The MapBiomas LUC dynamics of the selected CARs was also compared with the LUC dynamics seen in the CARs provided by the company (an area of 2,246,000 ha, corresponding to 13% of the total analyzed area) [43].

2.3. Carbon Stocks Data

The carbon pools considered were the soil organic carbon stock (SOC) and the biomass carbon stocks (Cveg) (Equation (1)). Carbon stock data (SOC + Cveg) from the BRLUC method, version 2.0 [10] were used as a reference, which provides calculated carbon stocks for six categories of land use (Temporary crops; Permanent crops; Sugarcane; Pasture; Planted forests; Natural vegetation), for all 558 Brazilian micro-regions (administrative limits defined by the Brazilian Institute of Geography and Statistics, IBGE, in the Portuguese acronym, comprising a set of contiguous municipalities). To account for the carbon stock of the aforementioned land use categories, Garofalo et al. [10] point out that the BRLUC method employs data from the following sources: soil organic carbon stock reference (SOCref) under native vegetation by Bernoux et al. [55]; soil carbon stock change factors (land use factor—FLU, management factor—FMG, and input factor—FI) from the IPCC [14,44]; Cveg of crops and agricultural uses of the European Commission [56]; and Cveg of past vegetation (phytophysiognomies) of Brazilian biomes [57] (Equations (1) and (2)).
Total   carbon   stock   ( MgC · ha 1 ) = SOC + C veg
SOC   ( MgC · ha 1 ) = SOC ref × FLU × FMG × FI  
where
Cveg (MgC∙ha−1): biomass carbon stocks which includes above-ground biomass (AGB); below-ground biomass (BGB); and dead organic matter (DOM);
FLU (MgC∙ha−1): land use factor, which reflects changes in carbon stock associated with land use type;
FMG (MgC∙ha−1): management factor, which in agricultural land represents different types of tillage;
FI (MgC∙ha−1): input factor, which represents different levels of crop residue inputs.
Table 1 shows the correspondence between the classes in MapBiomas Collection 6 with the classes in BRLUC 2.0 together with the renamed classes for this study.
This way, the carbon stock data for the different land uses in the BRLUC 2.0 method were adopted for the land uses and land covers of the analyzed CARs, assuming for them the carbon stock of the respective microregion in which each CAR is registered in addition to the carbon stock calculated for the “Mosaic” and “Other” use classes, as described in the description of the Parametrization A below.

2.3.1. Refinement of carbon Stocks

Although Garofalo et al. [10] made several improvements to the BRLUC method in version 2.0 compared to the previous version (v. 1.3), the authors pointed out some limitations and possible improvements of the method, such as the incorporation of Tier 2 carbon stocks and management practices associated with crop and planted pasture areas.
In the case of planted pastures, the BRLUC 2.0 method assumes that both in the initial and final years of the analysis, all planted pastures in Brazil showed moderate degradation, assuming that this is the most common condition in Brazil based on studies by Brazil [57], Dias-Filho [58] and Ferreira et al. [59]. BRLUC 2.0 adopts the FMG factors of the IPCC [14,44] for calculating the SOC in moderately degraded pastures. However, according to data from MapBiomas’ Pasture Quality [31], in 2000, there were 150 Mha of cultivated pastures in Brazil (disregarding the Pampas Biome), with 35% classified as severely degraded, 40% classified as moderately degraded and 25% classified as not degraded. In 2020, cultivated pastures already covered 152 Mha, and the qualification percentages of pastures were 22%, 41%, and 37%, respectively [31].
Regarding sugarcane cultivation in Brazil, BRLUC 2.0 adopts the premise that except for Brazil’s northeast region, the entire sugarcane area is harvested mechanically, assuming this to be the most common condition in the country’s center–south, based on the work of Santos [60] and Santos et al. [61]. BRLUC 2.0 adopts the FI of the IPCC [14,44] referring to the high input of crop residues, without manure, both for the initial year and for the final year of the period. However, data from the National Supply Company [62] show that in 2007, only 28% of the sugarcane cultivated in Brazil’s center–south region was harvested mechanically, increasing this figure to 97% in 2020.
Another point to be highlighted regarding the assumptions adopted for sugarcane and temporary crops in BRLUC 2.0 refers to the adopted default values for Cveg of 5 MgC∙ha−1 for sugarcane and of 0 MgC∙ha−1 for temporary crops based on European Commission guidelines [56]. For sugarcane, Nogueira et al. [40] obtained high values of carbon stock biomass based on stalks fresh yield (SFY, equivalent to sugarcane productivity), which were refined in the present study.
In view of the above notes, four different carbon stocks parametrization were considered in the analyses of this study:
  • Parametrization A—Default for pastures: Moderately degraded pastures;
  • Parametrization B—Pasture quality levels;
  • Parametrization C—Pasture quality levels and history of mechanized harvesting;
  • Parametrization D—Pasture quality levels, history of mechanized harvesting, refinement of sugarcane biomass carbon stock, and adoption of annual crops biomass carbon stock from the IPCC [14].
Thus, carbon stock refinements made only for pasture, sugarcane, and annual crop uses are justified by the fact that these uses correspond to more than 80% of the area analyzed in the years 2000, 2008 and 2020. On the other hand, natural vegetation corresponds to 15%. In addition, vegetation’s carbon stocks in the BRLUC 2.0 method have already undergone a thorough refinement, considering the weighted average of the carbon stock of the different Phyto-physiognomies by biome for each of the 558 Brazilian microregions [10].

Parametrization A—Default for Pastures: Moderately Degraded Pastures

In this parametrization, the original carbon stock values from six different land uses of the BRLUC 2.0 method are adopted [10].
For the Mosaic of Agriculture and Pastureland use classes, the BRLUC method does not have carbon stock data. The Mosaic class of MapBiomas corresponds to areas where it was not possible to distinguish whether the area corresponded to agriculture or pasture. For this class, an estimate of the carbon stock was made. The estimate of the carbon stock of the Mosaic class of each CAR considered the area covered by the temporary crop, perennial crop, sugarcane and pasture classes in each CAR, and the carbon stock of these classes in the micro-region where the CAR is located. Thus, the weighted average of stock was calculated, using (i) the percentage of area covered by the temporary crop, perennial crop, sugarcane and pasture classes in each CAR, comparing the combined area of these four classes together in the respective CAR, and (ii) the carbon stock value of each of these four land use classes in the micro-region where the CAR is located (Supplementary Material S3). If the CAR did not indicate any of these classes, but only the Mosaic class, the average carbon stock of these four classes of the corresponding CAR was assigned. For the Other Uses class, referring to the grouping of the “Urbanized Infrastructure”, “Mining”, “Other Non-Vegetated Areas” and “River, Lake, and Ocean” MapBiomas classes, a stock value of carbon equal to 0 (zero) was assigned based on chapter 9 (Other Land) of volume 4 of the IPCC Guidelines [14,44]. The total carbon stock for all parametrizations is shown in Supplementary Material S3.

Parametrization B—Pasture Quality Levels

In this parametrization, pasture quality levels [31] were considered for calculating a new pasture carbon stock value. To this end, based on the carbon stock sheet of the BRLUC 2.0 method, the carbon stock values for “non-degraded” and “severely degraded” pastures were calculated, adopting the FMG factors of the IPCC [14,44] regarding management options classified as non-degraded and severely degraded, respectively (Supplementary Material S2, and Equation (2)). Then, the percentage covered by each of the three pasture quality levels was analyzed against the total pasture area in each CAR for the years 2000, 2008 and 2020. Subsequently, the carbon stock of pastures in each CAR was calculated based on the weighted average between (i) the percentage covered by each pasture quality level in each CAR and (ii) the carbon stock value for each pasture quality level of the micro-region where the CAR is located.

Parametrization C—Pasture Quality Levels and History of Mechanized Harvesting

In this parametrization, the same assumptions as in the previous parametrization are adopted, including the assumption that the dynamics of the use of mechanically harvested sugarcane is variable in the analyzed years (2000–2008–2020) and among Brazilian states. For this purpose, the soil carbon stock values of mechanically harvested (raw sugarcane) and manually harvested (burned sugarcane) soil were calculated, adopting IPCC FI factors [14,44] related to input options classified as High (without manure) and Low, respectively (Supplementary Material S2, and Equation (2)). For this purpose, percentage data referring to the harvesting system by the federative unit from Conab’s Sugarcane Harvest Bulletin [62] were used for the years 2008 and 2020. For the year 2000, the values presented by Packer et al. [63] in the Reference Report—Agricultural Sector, Agricultural Waste Burning, from the Third Brazilian Inventory of Anthropogenic Emissions and Removals of Greenhouse Gases, were incorporated. Subsequently, the calculation of the sugarcane carbon stock in each CAR was made based on the weighted average between (i) the percentage harvested by each harvesting system in each CAR, based on state values, and (ii) the value of the average carbon stock for each harvesting system in the micro-region where the CAR is located.

Parametrization D—Pasture Quality Levels, History of Mechanized Harvesting, Refinement of Sugarcane Biomass Carbon Stock, and Adoption of Annual Crops Biomass Carbon Stock from the IPCC [14]

For composing parametrization D, in addition to the assumptions adopted in parametrization C, an update of carbon stock from sugarcane biomass was included, and the temporary annual crops carbon stock was also assumed from the IPCC [14]. The carbon stock of sugarcane biomass (CBsugarcane), calculated in MgC∙ha−1∙yr−1, was based on the study by Embrapa Environment, using IPCC [14], Carré et al. [64] and Nogueira et al. [40] guidelines, according to the following equation:
CB sugarcane = [ ( AGB   × C AGB ) + ( BGB   × C BGB ) ] × 0.5 + ( DOM   ×   C DOM × 0.65 )
where
AGB = 0.36 (±0,003) ∗ SFY, based on Gava et al. [65]; Franco et al. [66]; Franco et al. [67]; Franco et al. [68]; Cherubin et al. [69] and Cabral et al. [70];
CAGB (AGB carbon content) = 46.0%, considering Embrapa Environment laboratorial database;
BGB = 0.14 (±0.011) ∗ AGB, based on Franco et al. [66]; Franco et al. [67]; Cabral et al. [71]; Otto et al. [72]; Vieira-Megda et al. [73] and Melo et al. [74];
CBGB (BGB carbon content) = 40.3%, considering Embrapa Environment laboratorial database;
DOM = 0.15 (±0.002) ∗ SFY, based on Gava et al. [65]; Franco et al. [66]; Franco et al. [67]; Carvalho et al. [75]; Landell et al. [76]; Menandro et al. [77]; Bordonal et al. [78]; Castioni et al. [79]; Cabral et al. [70]; Melo et al. [74] and Castro et al. [80];
CDOM (DOM carbon content) = 46.7%, considering Embrapa Environment laboratorial database;
0.50 = the factor that’ represents the sugarcane growth curve, using the logistic model [81].
0.65 = the factor that represents DOM’s continuity on the soil surface [40].
SFY values were estimated for each of the 558 micro-regions in Brazil based on sugarcane information for the years 2011 to 2020, according to the IBGE [51].
The carbon stock values for annual temporary crop biomass for the Brazilian regions were updated according to the default value of 4.7 MgC∙ha−1, according to the IPCC [14].

2.3.2. Carbon Stock Balance

The carbon stock balance was calculated following the IPCC’s stock-difference method [14] and default 20-year amortization period [45]. It was performed to the LUC that occurred in the 20-year period (2000–2020) and after 2008 (2008–2020) for each CAR and with the four different parametrizations. The equations adopted were retrieved from RED II [46] and based on IPCC 2006 general guidelines [44],
Te = ( CSR CSA ) × ( 44 12 ) × ( 1 20 )
Et = Te × A
where
Te (MgCO2∙ha−1∙yr−1): annual CO2 emission rate from changes in carbon stock due to LUC within each CAR and at the state level;
Et (MgCO2∙yr−1): absolute annual CO2 emissions from changes in carbon stock due to LUC within each CAR and at the state level;
CSR: carbon stock associated with land use in the initial year of the analysis period (MgC∙ha−1, including soil and biomass);
CSA: carbon stock associated with land use in the final year of the analysis period (MgC∙ha−1, including soil and biomass);
A: land use class area in the final year of the analyzed period (e.g., sugarcane area in 2020);
44/12 = the fraction corresponding to the molecular weight of CO2 (44 g∙mol−1) divided by the molecular weight of carbon (12 g∙mol−1), used for converting emission into CO2.
1/20 = annualization by IPCC’s default 20-year amortization period [45].

2.4. Direct LUC Contribution to the Ethanol Carbon Footprint

Based on the emission/removal carbon exclusively associated with sugarcane dLUC in the CARs, for each parametrization, we estimated the contribution of the dLUC to the ethanol carbon footprint, based on an average emission between anhydrous and hydrated ethanol, which was quantified according to the following equation:
dLUC   contribution   to   ethanol   carbon   footprint ( gCO 2 eq MJ ethanol ) = [ Emission / removal   C LUC _ sugarcane × 55.78 % ( Prod AN × LHV AN ) + ( Prod HY × LHV HY ) ] × 10 6
where
Emission/removal CLUC_sugarcane (MgCO2): emission/removal carbon exclusively associated with sugarcane LUC in the CARs in each parametrization;
55.78%: percentage of sugarcane destinated to ethanol production during 2000/2001 and 2020/2021 harvest seasons (estimated based on the total sugar production (of 584,854,015,000 kg) and ethanol production in the states evaluated during 2000–2021 [5], and ATR values (for anhydrous ethanol, ATRAN: 1.7651 (kgATR∙LAN −1); for hydrated ethanol, ATRHY: 1.6913 (kgATR∙LHY −1); for sugar, ATRsugar: 1.0495 (kgATR∙kg −1) [6]);
ProdAN (l): total production of anhydrous ethanol during 2000/2001 and 2020/2021 harvest seasons in the states evaluated (174,585,481,000 L) [5];
ProdHY (l): total production of hydrated ethanol during 2000/2001 and 2020/2021 harvest seasons in the states evaluated (275,533,102,000 L) [5];
LHVAN (MJ∙L−1) = 22.35, considering the low heating value of anhydrous ethanol (28.26 MJ∙kg−1) and the specific mass of anhydrous ethanol (0.791 kg∙L−1) [82];
LHVHY (MJ∙L−1) = 21.34, considering the low heating value of hydrated ethanol (26.38 MJ∙kg−1) and the specific mass of hydrated ethanol (0.809 kg∙L−1) [82].
The production of electricity by the sector was disregarded in this calculation.
For the estimation of ethanol mitigation compared to gasoline substitute, we also considered the typical carbon intensity (CI) for RenovaBio’s initial decarbonization certificates (CBios) targets (for anhydrous ethanol, CIAN: 20.51(gCO2eq∙MJ−1), for hydrated ethanol, CIHY: 20.79 (gCO2eq∙MJ−1) [83]); the gasoline emission of 87.4 (gCO2eeq∙MJ−1) [82]; and the ethanol production (2020/2021) in the states considered in this study (9.77 million liters of anhydrous and 19.87 million liters of hydrated) [5].

3. Results and Discussions

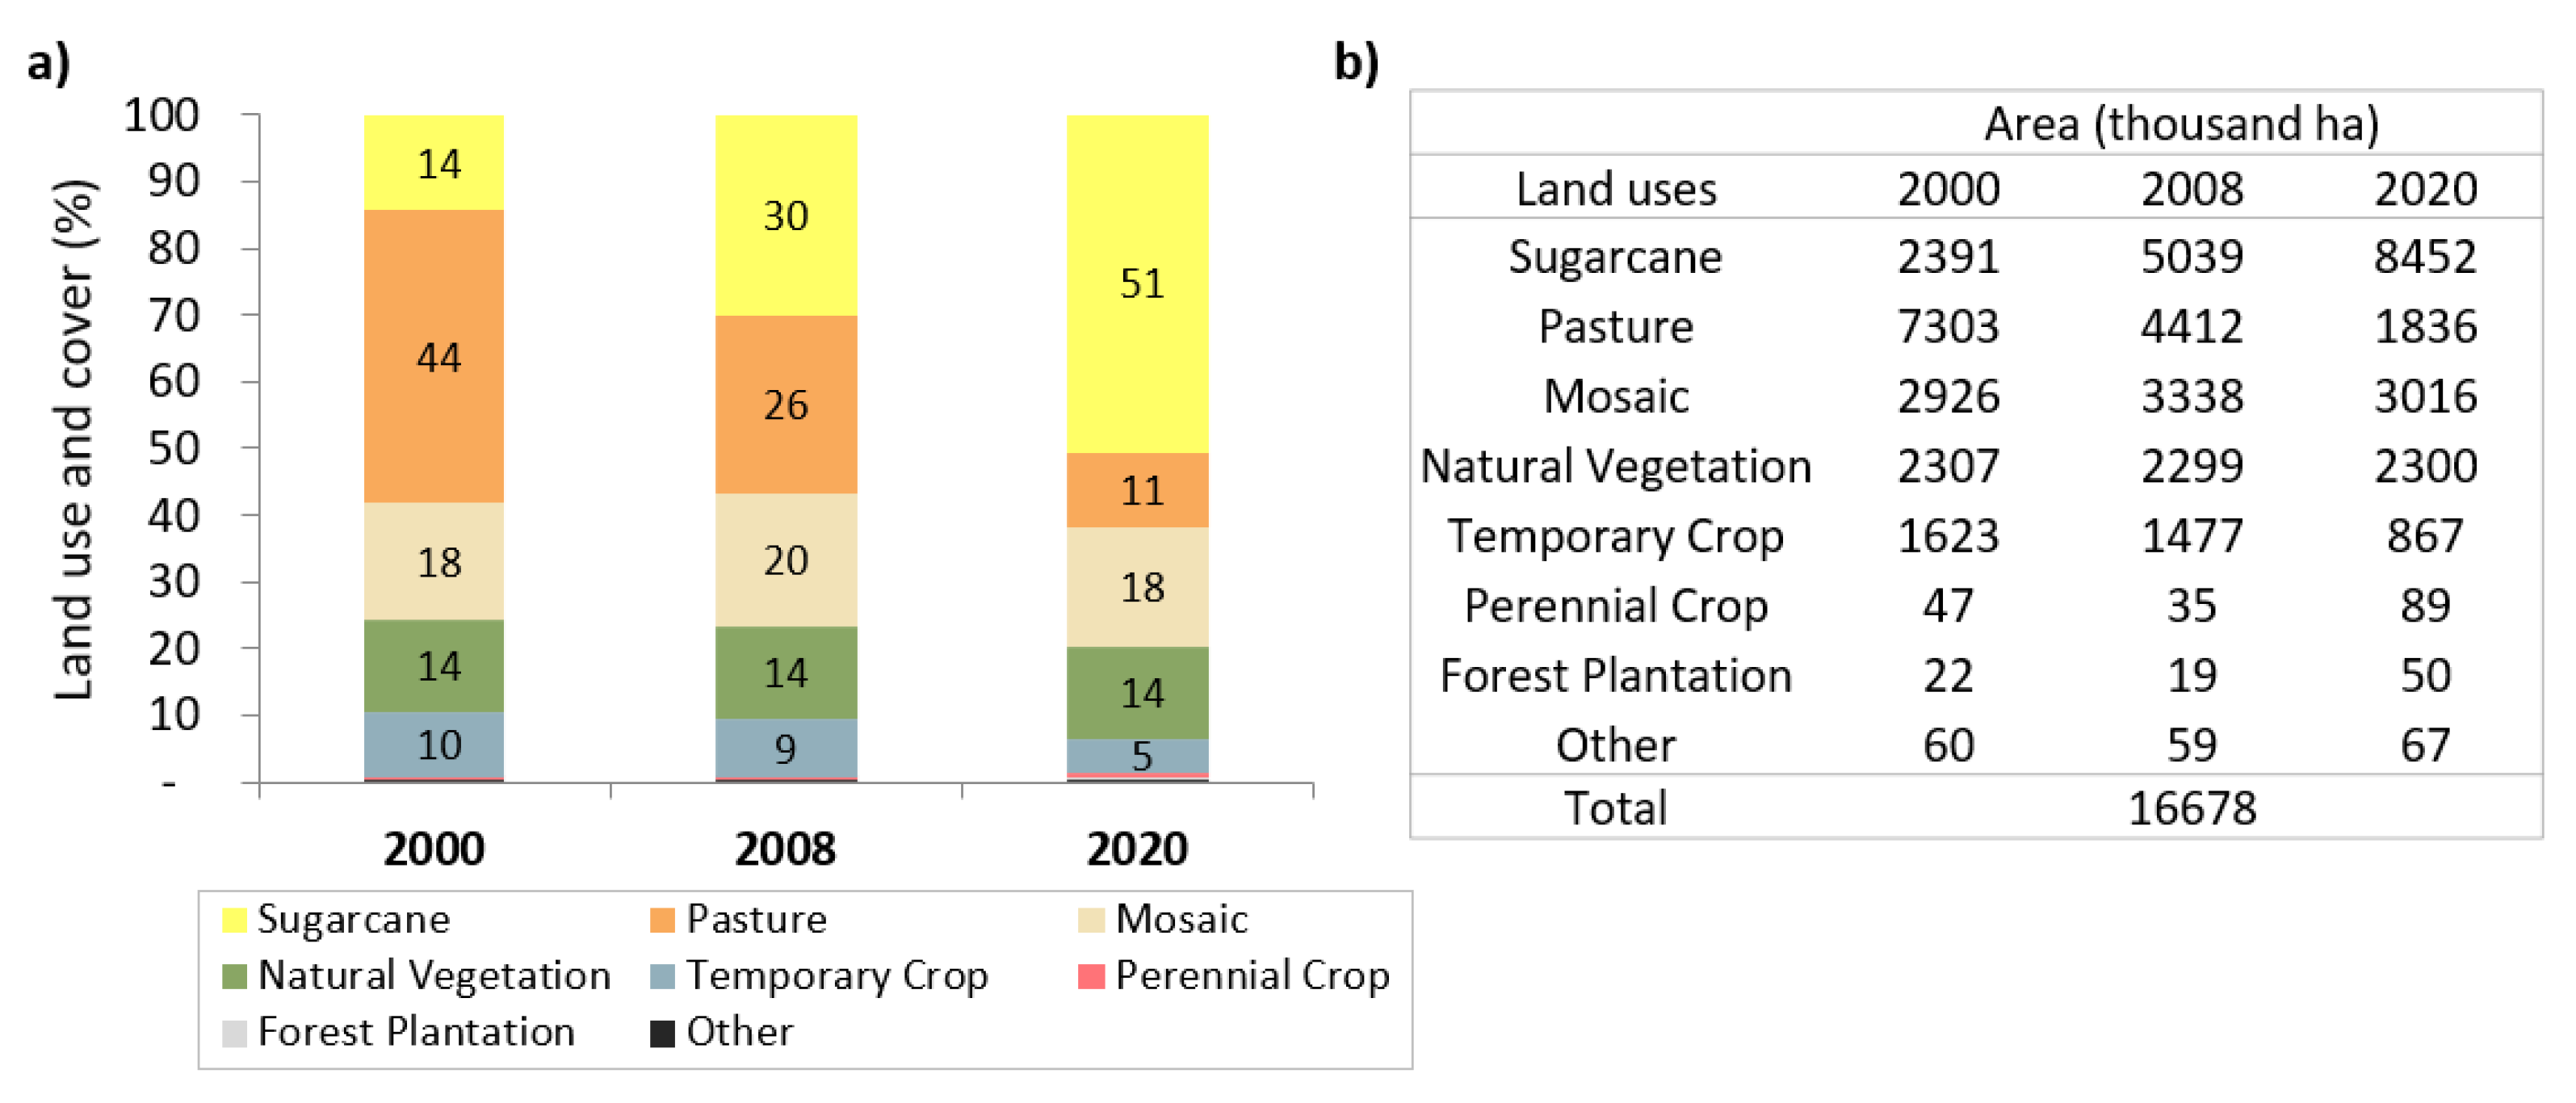
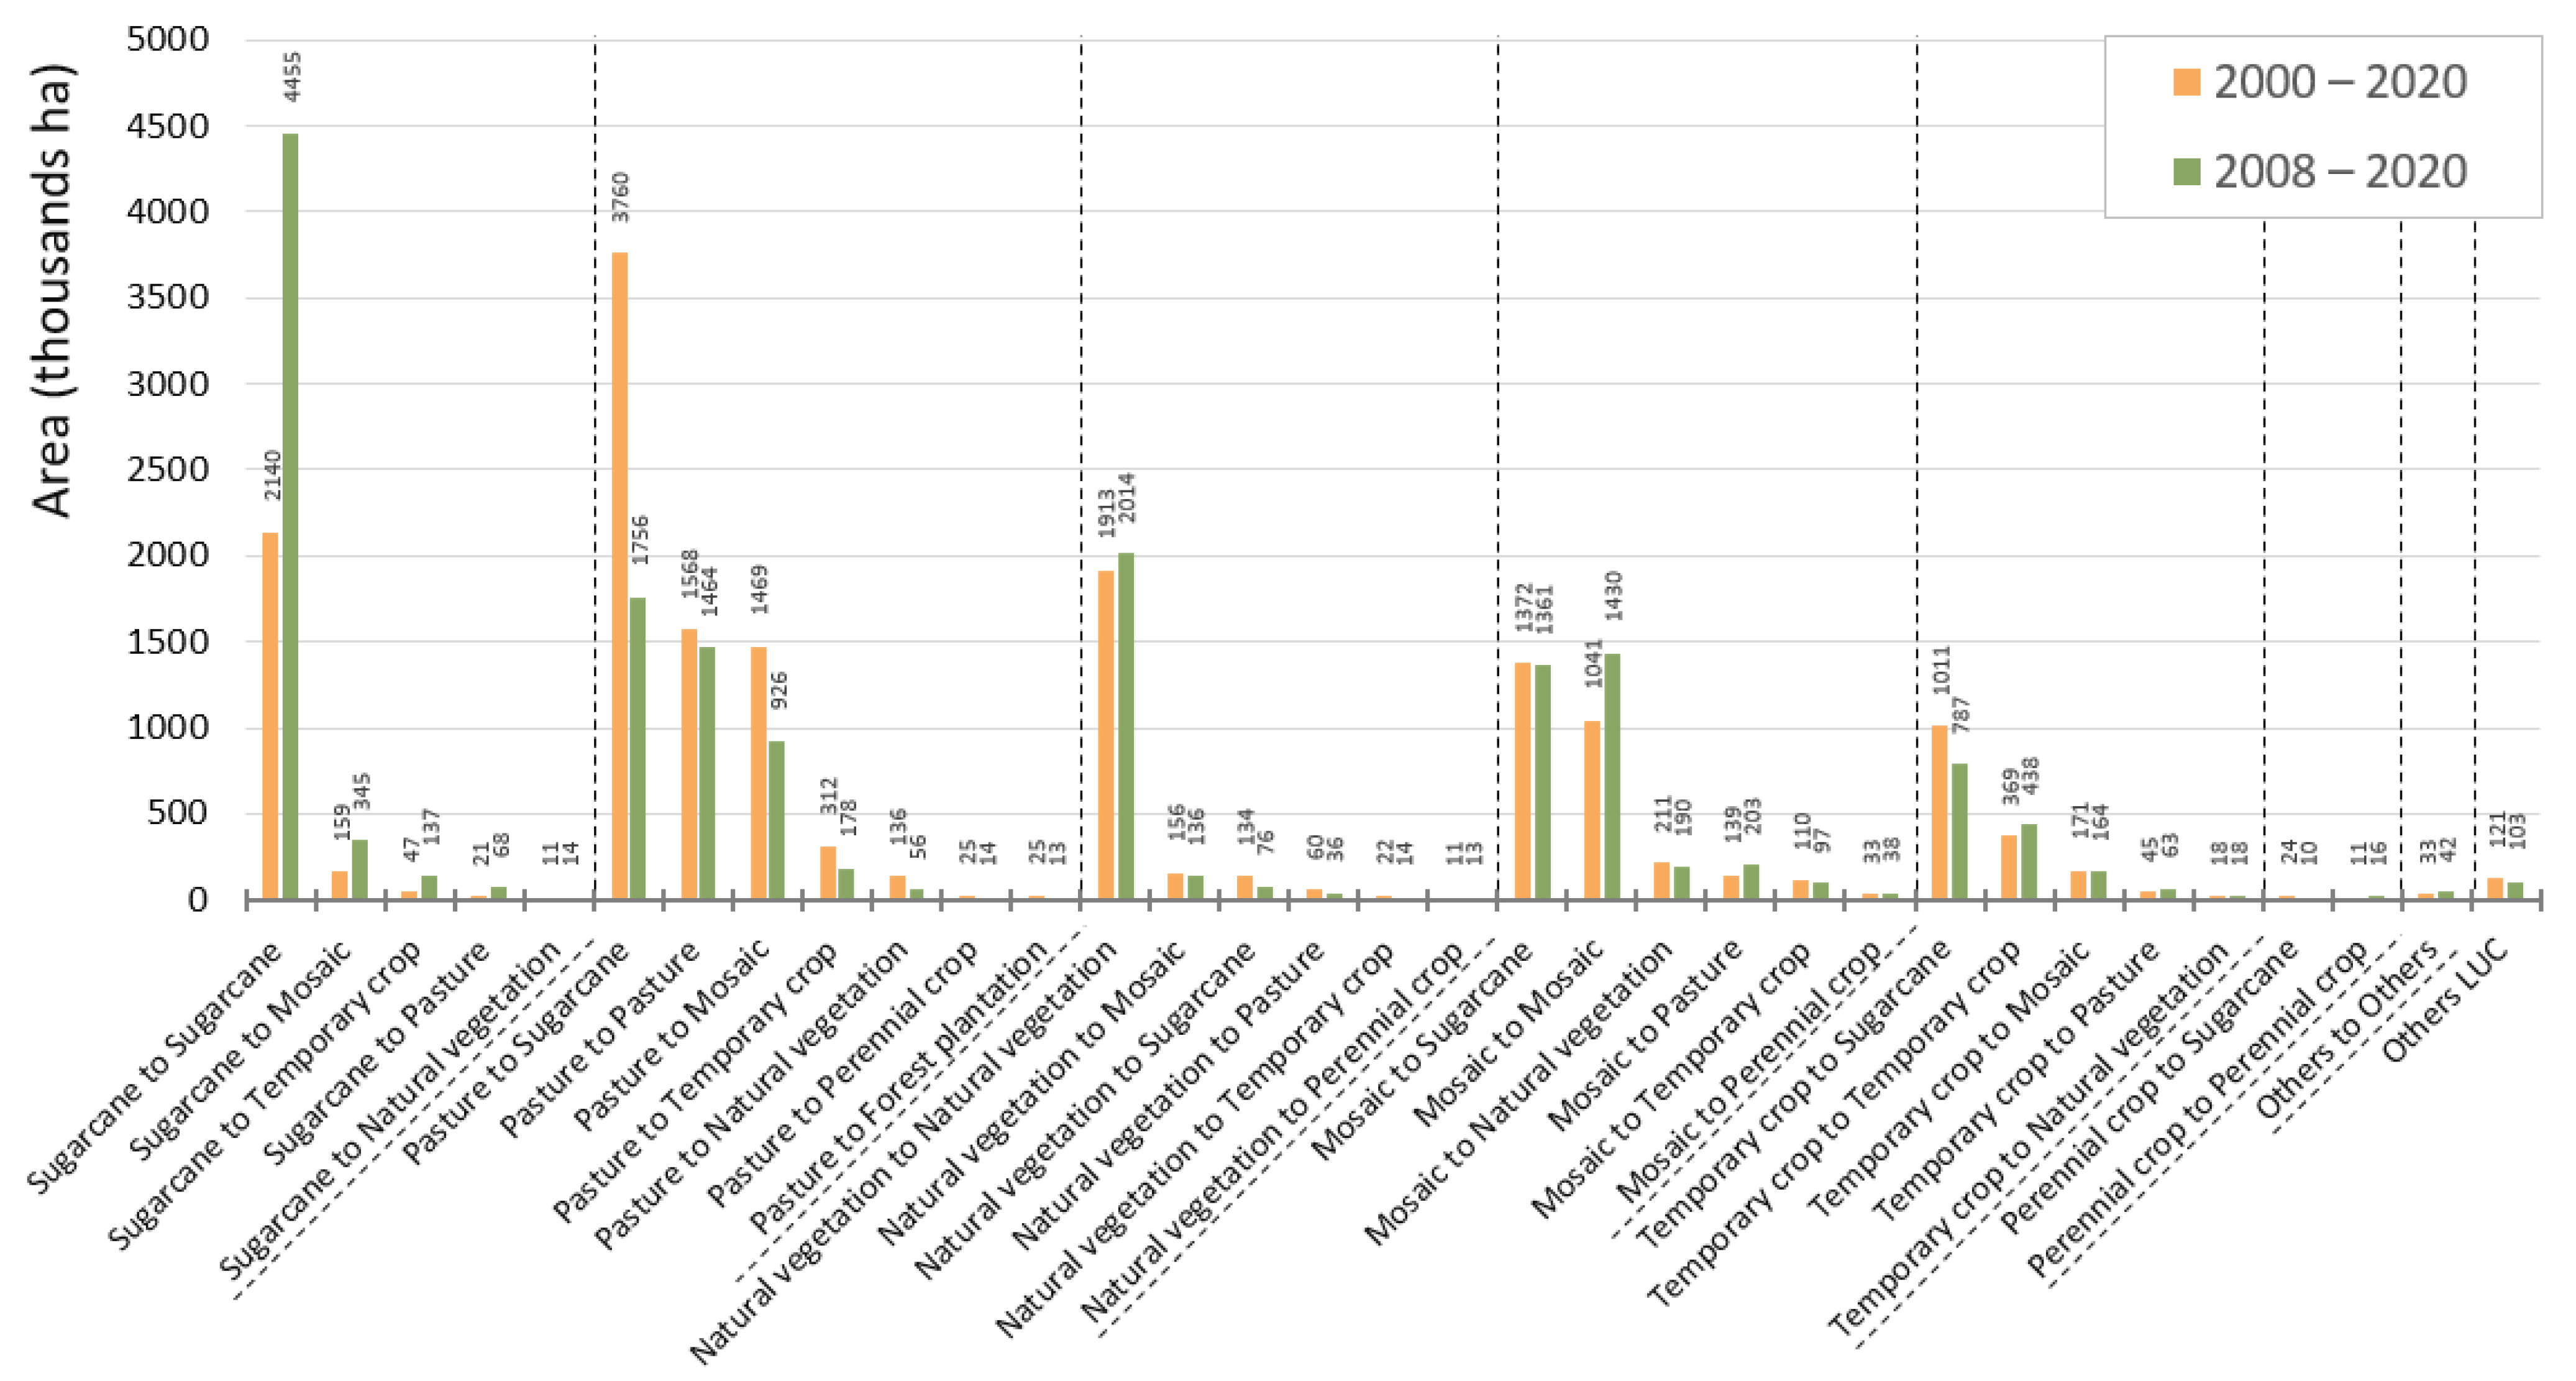
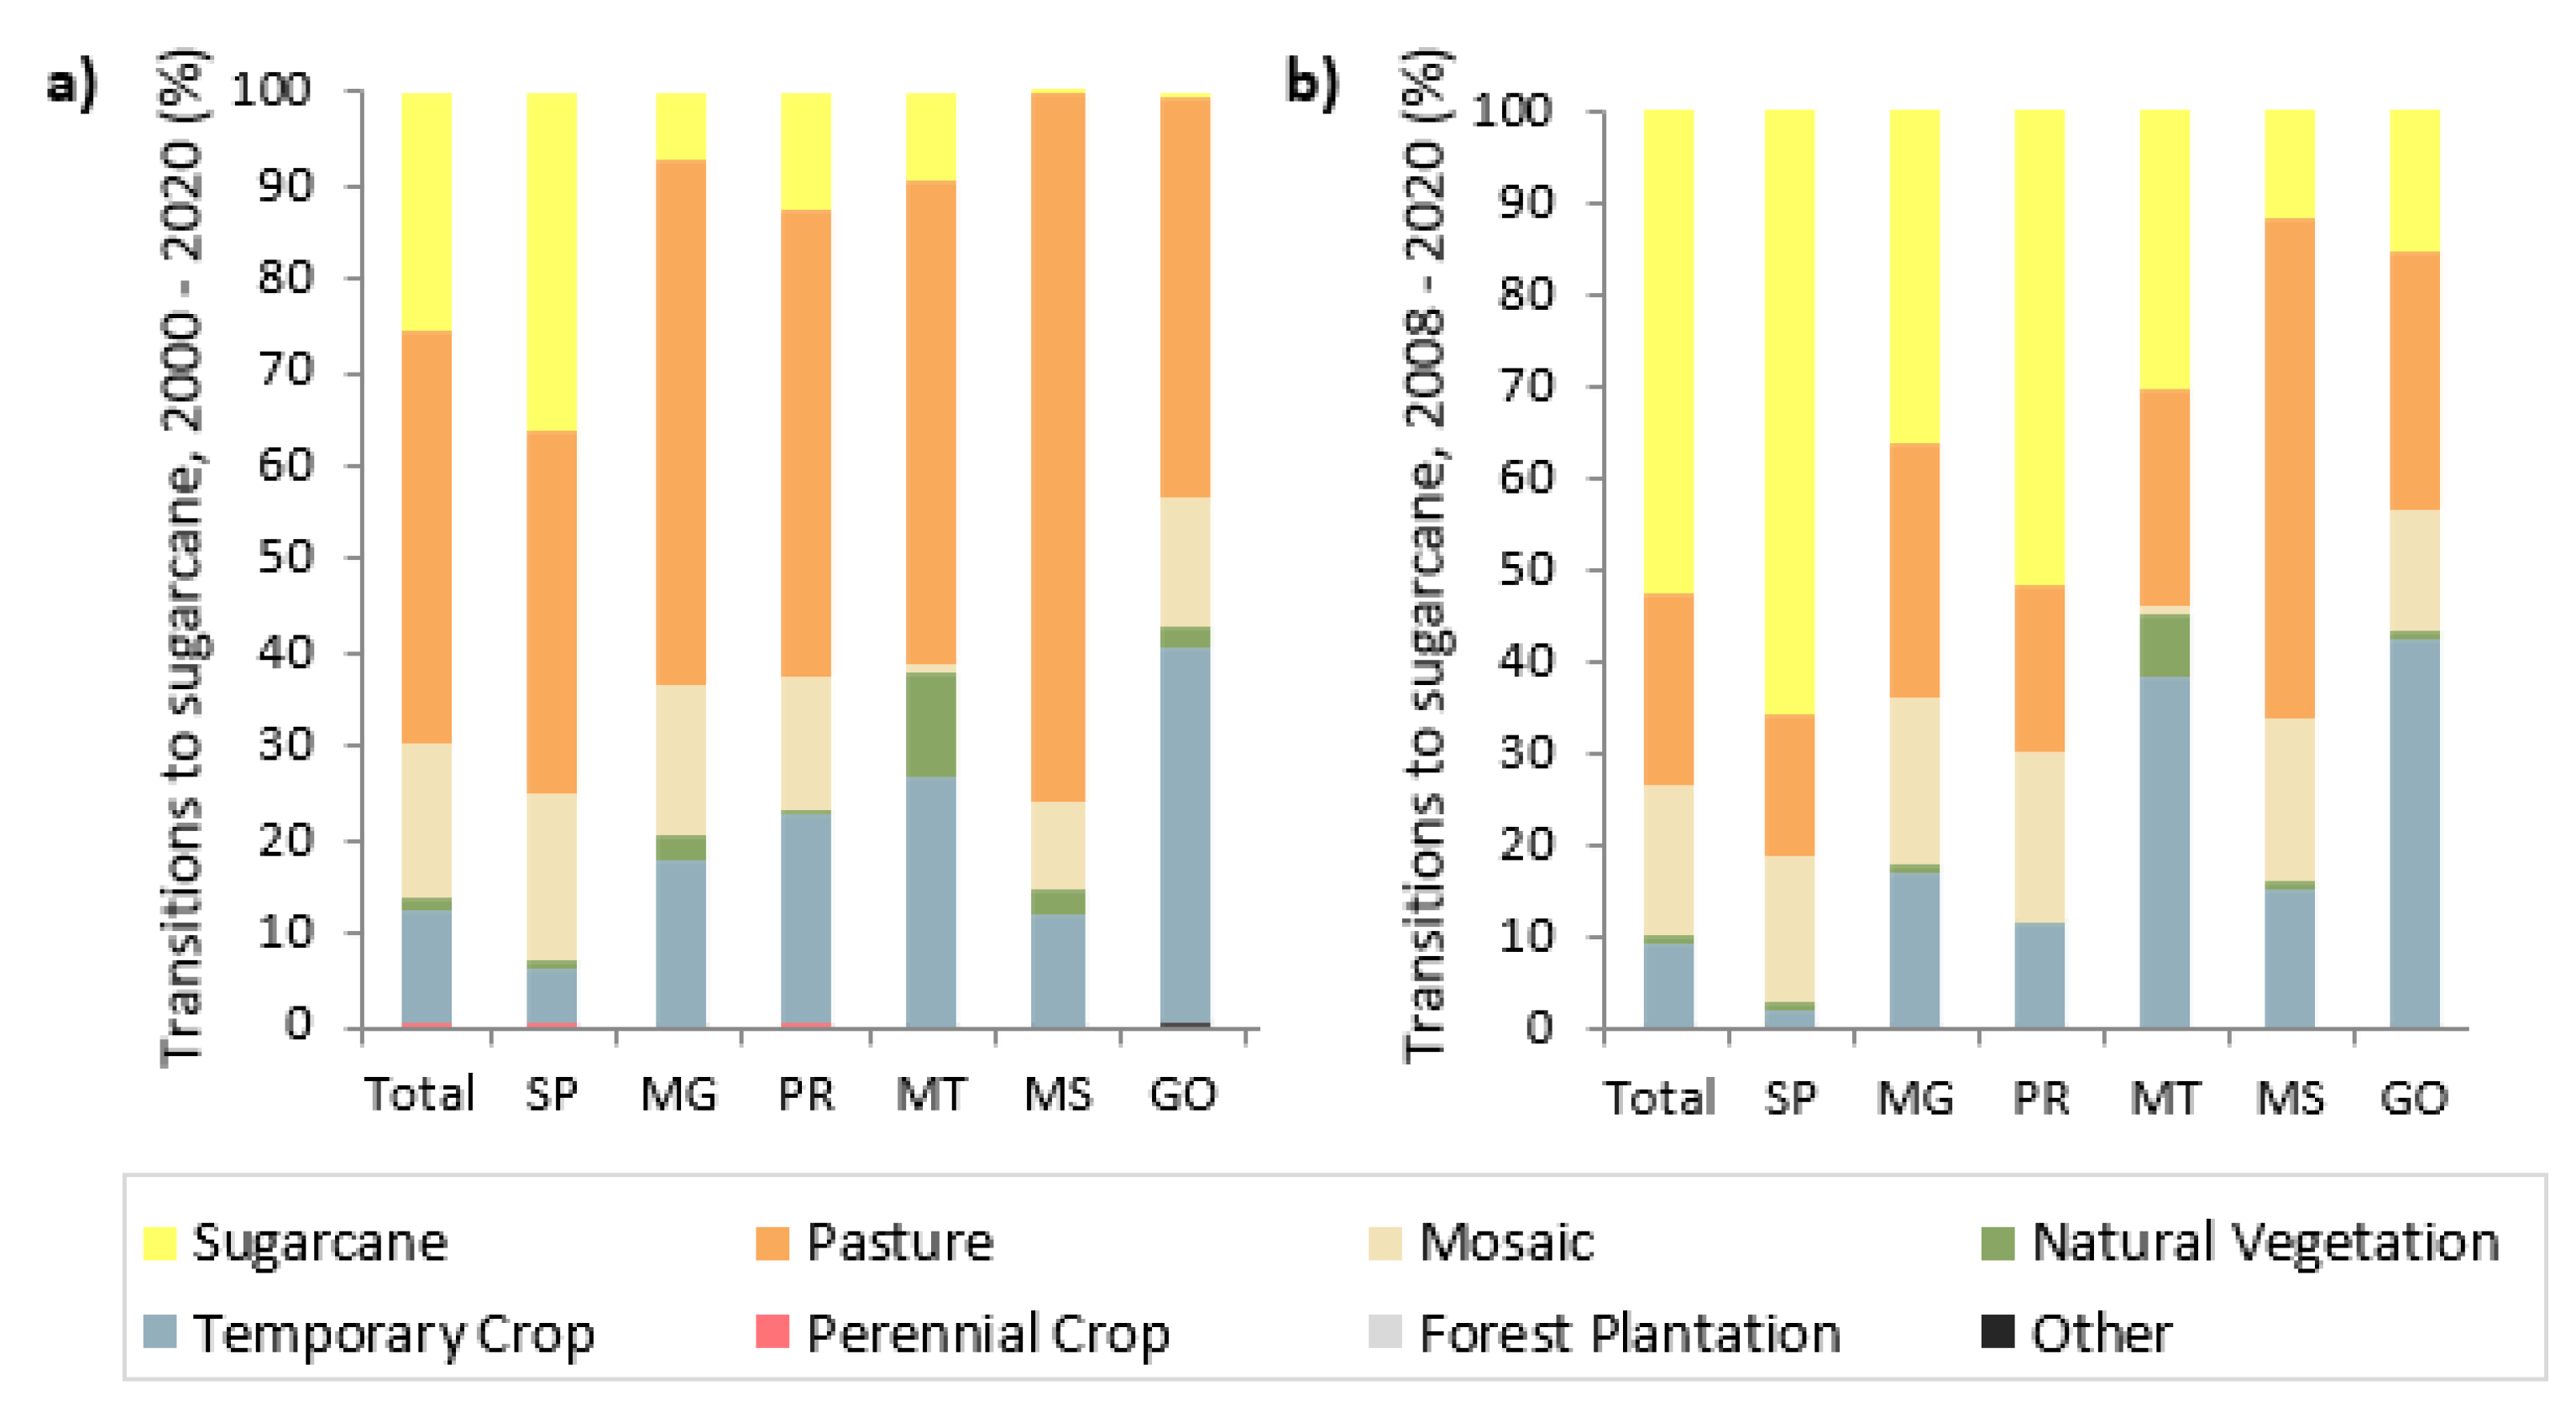
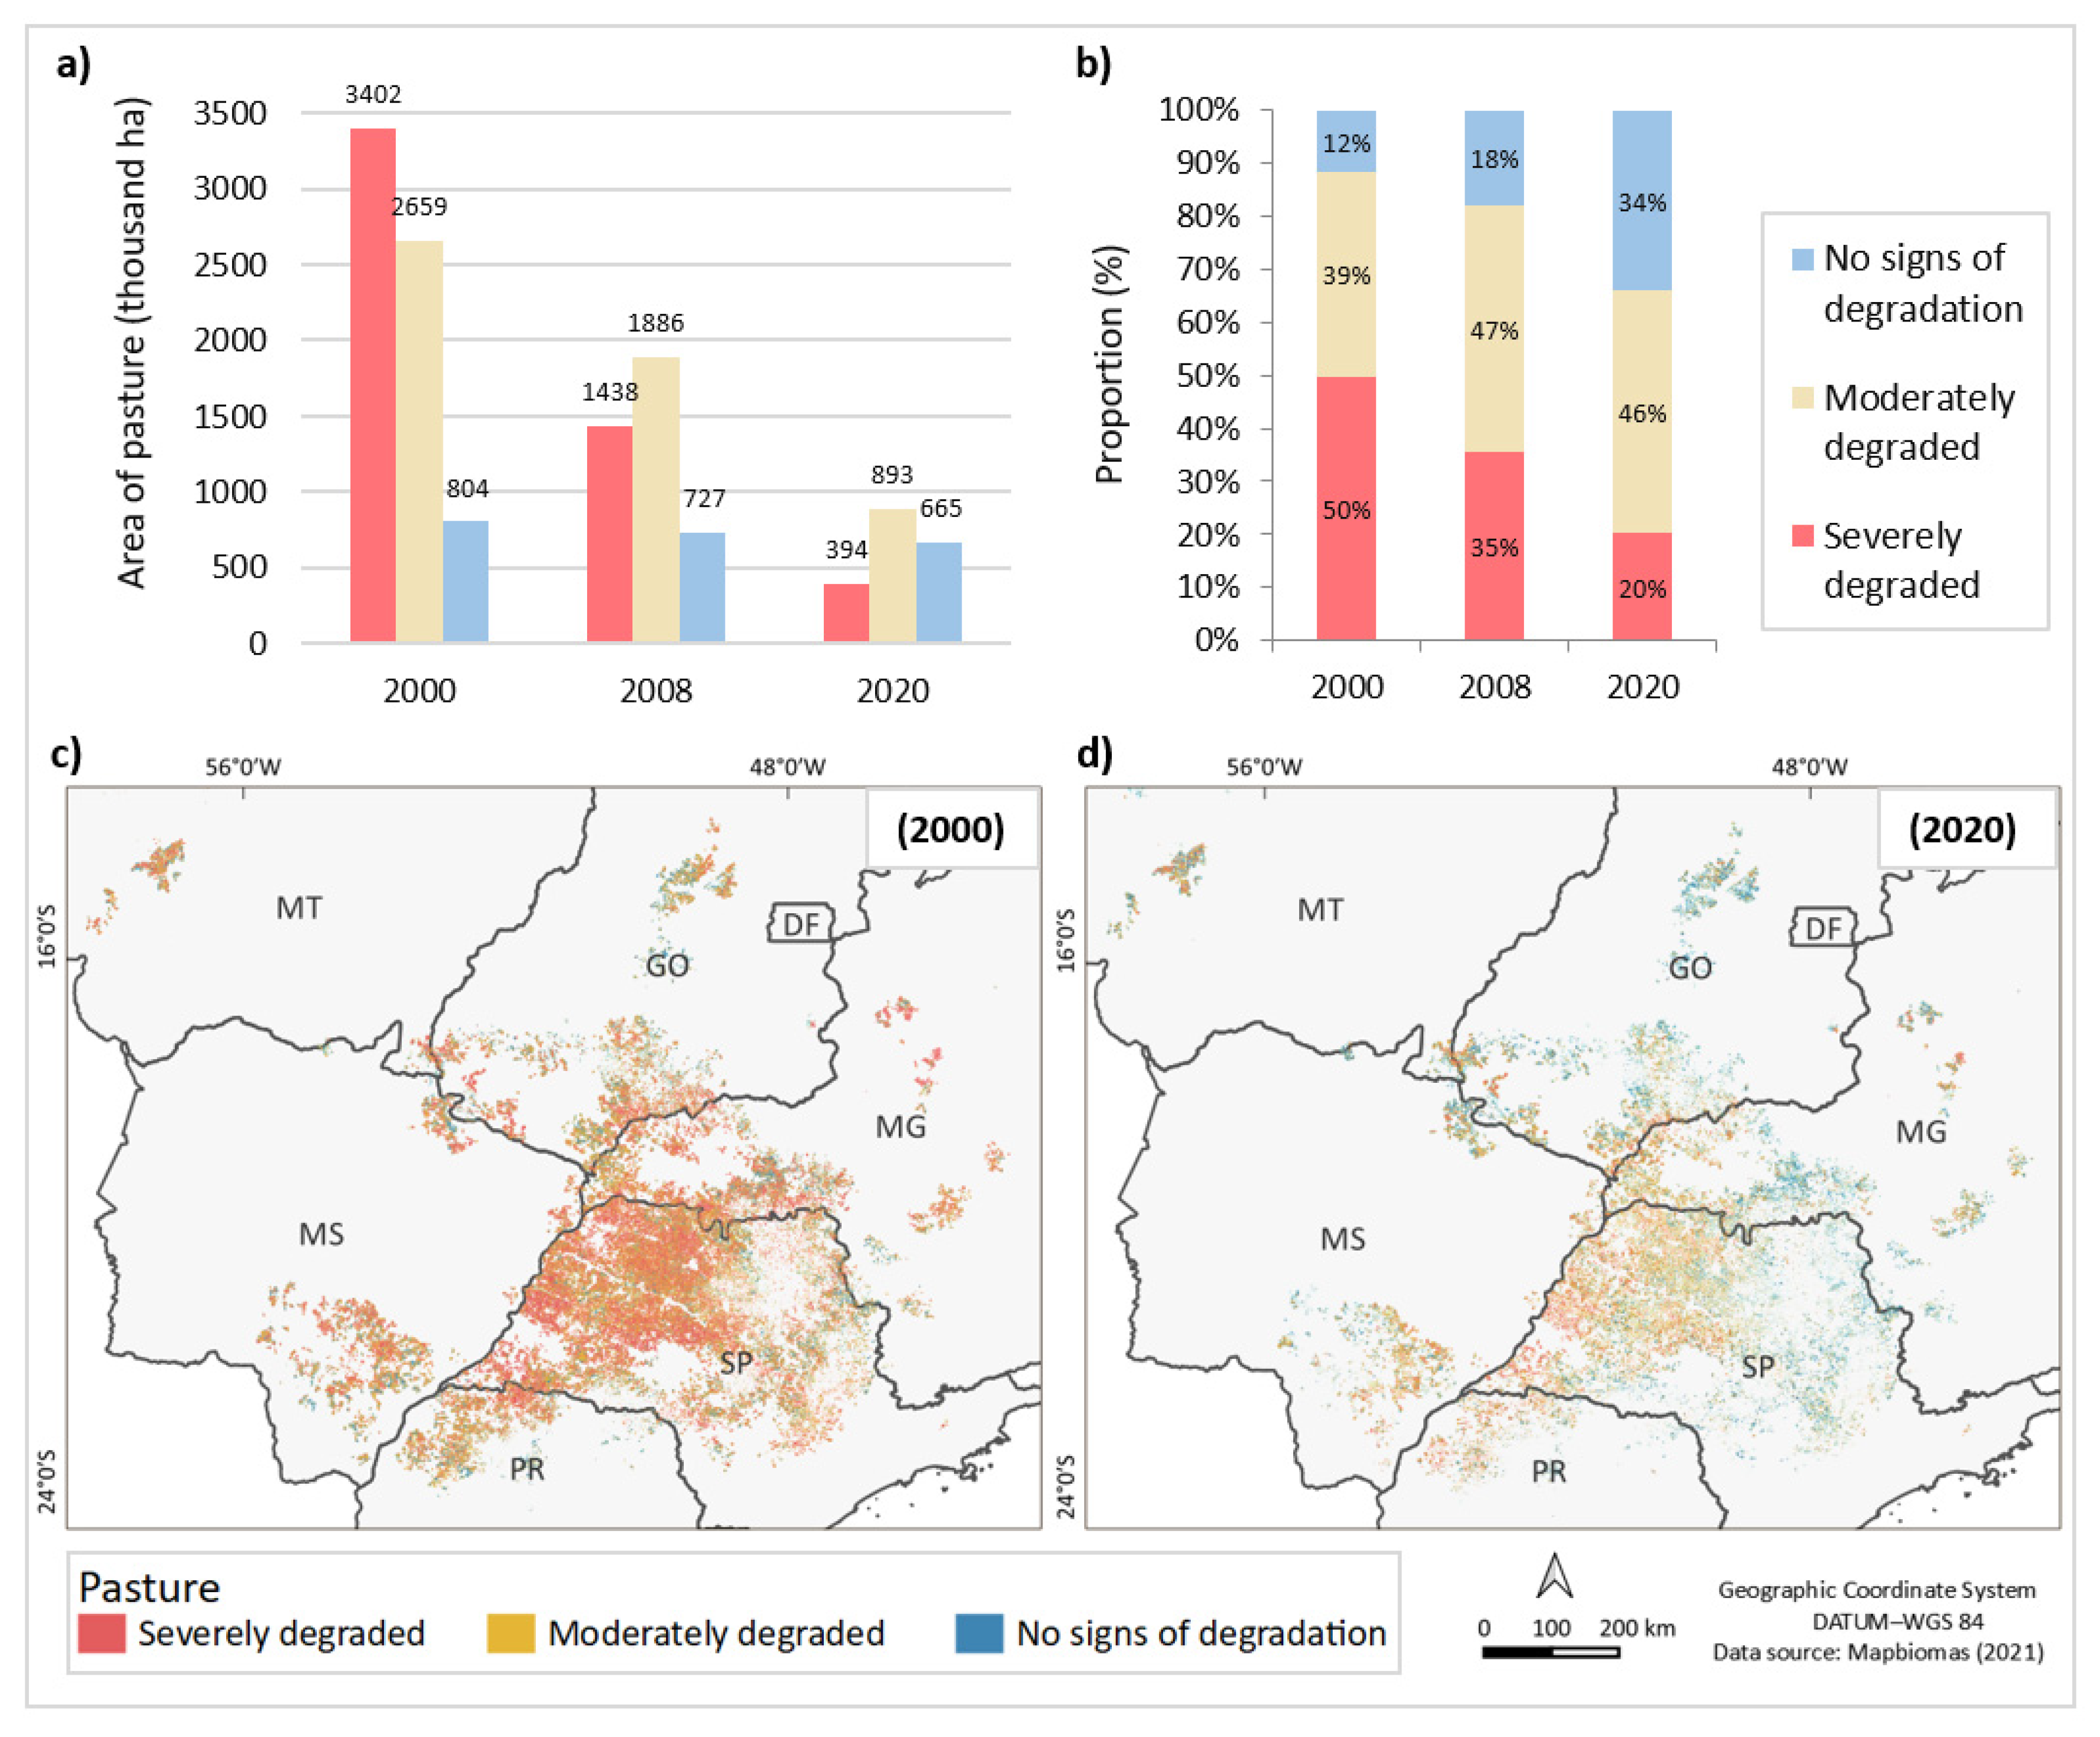
3.1. History of Land Use, LUC, and Pasture Quality

From 2000 to 2020, sugarcane expanded by over 6.06 Mha in the center–south and north regions of Brazil, totaling 8.45 Mha in 2020 (Figure 3). A correspondence of 84.7% was observed between the areas mapped as “sugarcane” according to Mapbiomas, in 2020, and the spatialized sugarcane data provided by the industry [43], which was in accordance with the accuracy of the MapBiomas mapping (accuracies of 75% and 85.5% in the Cerrado and Atlantic Forest biomes [31], respectively, where the spatialized sugarcane data provided by the industry [43] are inserted); the other sugarcane areas provided by the industry were predominantly classified as Mosaic by MapBiomas (see Supplementary Material S1, Figure S4, for more information). In 2000, 92% of the crop area was concentrated in São Paulo state and, over the period, participation of the remaining states increased, with Minas Gerais, Mato Grosso do Sul, and Goiás accounting for 27% of the sugarcane area seen in 2020. Figure 3 shows the LUC dynamics for the entire evaluated area (see Supplementary Material S1 for details of land uses by state and discretized according to MapBiomas classes). Concomitantly with sugarcane expansion (6.06 Mha), a reduction of 5.47 Mha of pasture areas and 756,000 ha of temporary crops was observed in the total area of the rural properties with sugarcane cultivation (Figure 3b); the cultivation of perennial crops and forest plantation increased in the evaluated CARs, although it was less representative in terms of area than the dynamics of other land uses observed (Figure 3b).
The natural vegetation (forest and savanna formation, grassland, and wetland) area totaled 2.3 Mha in the CARs, showing a slight variation throughout (−0.3%) the entire period (see Table S4). However, the profile varied according to vegetation formation, with a 124,000 ha increase in the Forest formation, and a reduction in the savanna (−120,000 ha), grassland (−3.4), and wetland (−6.7) formations. The suppression of natural vegetation occurred mainly between 2000 and 2008: a period which preceded public policies and mechanisms for protecting vegetation such as the Atlantic Forest Law (2006), the ZAE-Cana (2009), and the new Forestry Code (2012). According to current environmental legislation (Law 12.651/2012), properties must maintain an area covered by native vegetation as a Legal Reserve (RL, in the Portuguese acronym) that corresponds to 20% of the area of properties located outside the Legal Amazon (as is the case of 97% of the analyzed area). In the evaluated CARs, the total percentage of natural vegetation was 13.8%. It is noteworthy that the minimum legal requirement for restoring vegetation depends on factors such as the size of the property and the date on which deforestation occurred. It is estimated that around 70% of the CARs evaluated, which correspond to around 15% of the total area, are small properties and, for these cases, if the property did not meet the lower limit stipulated for RL already in 2008, the owner is exempt from having to recover the RL liability and is obliged only to meet the requirements regarding Permanent Protection Areas (riparian forests, hilltops, springs), while any new deforestation is prohibited. For larger properties, which it is estimated to comprise around 85% of the total area evaluated), in addition to producers being able to choose to recompose the RL within the property itself, there are also options to fulfill the RL liability in other properties located in the same biome, or, when possible, allow the vegetation’s natural regeneration. That is, even if there is an environmental liability, there may be adaptation processes in progress that are not necessarily captured by the assessment of the LUC found in the CARs. The federal law must also be complemented by state regulations that establish deadlines for adaptation, indicating that the recovery process of the areas may be in progress and there is still room for recovery of additional areas.
Figure 4 shows the LUC seen within the rural properties (CARs) with sugarcane cultivation (including areas currently not covered by sugarcane), while Figure 5 informs the distribution of LUC associated only with the areas covered by sugarcane in 2020 by state. The main LUC seen in the CARs was the transition from pasture and mosaic to sugarcane and from pasture to mosaic (Figure 4). The share of areas that remained covered with sugarcane was 25% in the 2000–2020 period and 53% in 2008–2020 (Figure 5, see Supplementary Material S1, Tables S6 and S7). As of 2008, the maintenance and regeneration of natural vegetation areas in the CARs area were observed (Figure 4). Less than 1.6% of the areas currently covered by sugarcane were natural vegetation in 2000, and less than 0.9% were natural in 2008 (Table S5); 43% of these dynamics (sugarcane to natural vegetation) occurred before 2008 (Figure 4), and it is not possible to discriminate between legal or illegal. The transition from sugarcane areas to natural vegetation was also observed, mainly from 2008 onwards (Figure 4, Table S5). This indicates that producers might have progressively been concerned with their properties’ environmental adequacy. The concern regarding compliance with the Forest Code, the adoption of measures to offset legal deficits, and the maintenance of vegetation areas in accordance with the standards required by the law on sugarcane-producing farms have been reported in other regional studies [84,85,86]. Consequently, such results also indicate that regulatory mechanisms have possibly contributed to turning sugarcane production increasingly sustainable. Although the RenovaBio policy was established from 2018, which is a timeframe that was not evaluated in this work, it is expected that the trend toward reducing suppression and increasing natural forest vegetation recovery seen after 2008 is intensifying in view of the need to produce the raw material only in areas without native vegetation suppression after 2018 and from CARs complying with the new Forest Code for the biofuel to be eligible [25].
In both periods, the advance of sugarcane over pasture areas was predominant, although it has decreased over time from 60% in 2000–2020 to 44% in 2008–2020 (percentage excluding areas that remained as sugarcane). On the other hand, in addition to the increase in mosaic areas in general, in states such as Mato Grosso, Goiás, and Tocantins, there is also a transition from temporary crops to sugarcane (more than 30% of LUC) mainly during the 2008–2020 period (Figure 5). Minas Gerais, Goiás, and Mato Grosso do Sul states represent new frontiers for expanding bioenergy crops, and they have pasture and annual crop areas suitable for sugarcane production as well as for corn and soybeans [87,88].
Sugarcane cultivation areas and associated CARs also showed a large expansion over pasture areas with severe and moderate degradation. There is also a relative increase in non-degraded pastures within the CARs compared with the other levels of quality (Figure 6). The area of degraded pastures in the first periods, 2000 and 2008, was much greater than in 2020. Figure 6c,d spatially represent the pasture quality level in the years 2000 and 2020 in the CARs in the states with the greatest sugarcane expansion. In 2020, not only did the remaining pastures without degradation exceed the severely degraded pastures but also some pastures with signs of degradation had their quality recovered mainly in states such as Goiás, Minas Gerais, and Mato Grosso; in São Paulo state, pasture recovery took place mainly in 2000–2008.
The practice of burning sugarcane for harvest has considerably reduced over time. It went from 84.2 to 10.6% in 2000–2020 in Brazil [62,63], which is an 87.4% reduction (Supplementary material S1, Table S8). Since 2009/2010, the green harvest corresponds to more than 50% of the sugarcane harvest in the center–south of Brazil, achieving levels of 98.47% in 2022/2023 [62]. An important factor associated with that is the implementation of legislation and voluntary agreements signed in São Paulo state (São Paulo State Law 11,241/2002, the Agri-Environment protocol, in 2007, and the Green Ethanol Protocol, in 2017, as previously mentioned). Based on this legislation, it is expected that the practice of burning keep reducing to 100% in the future.

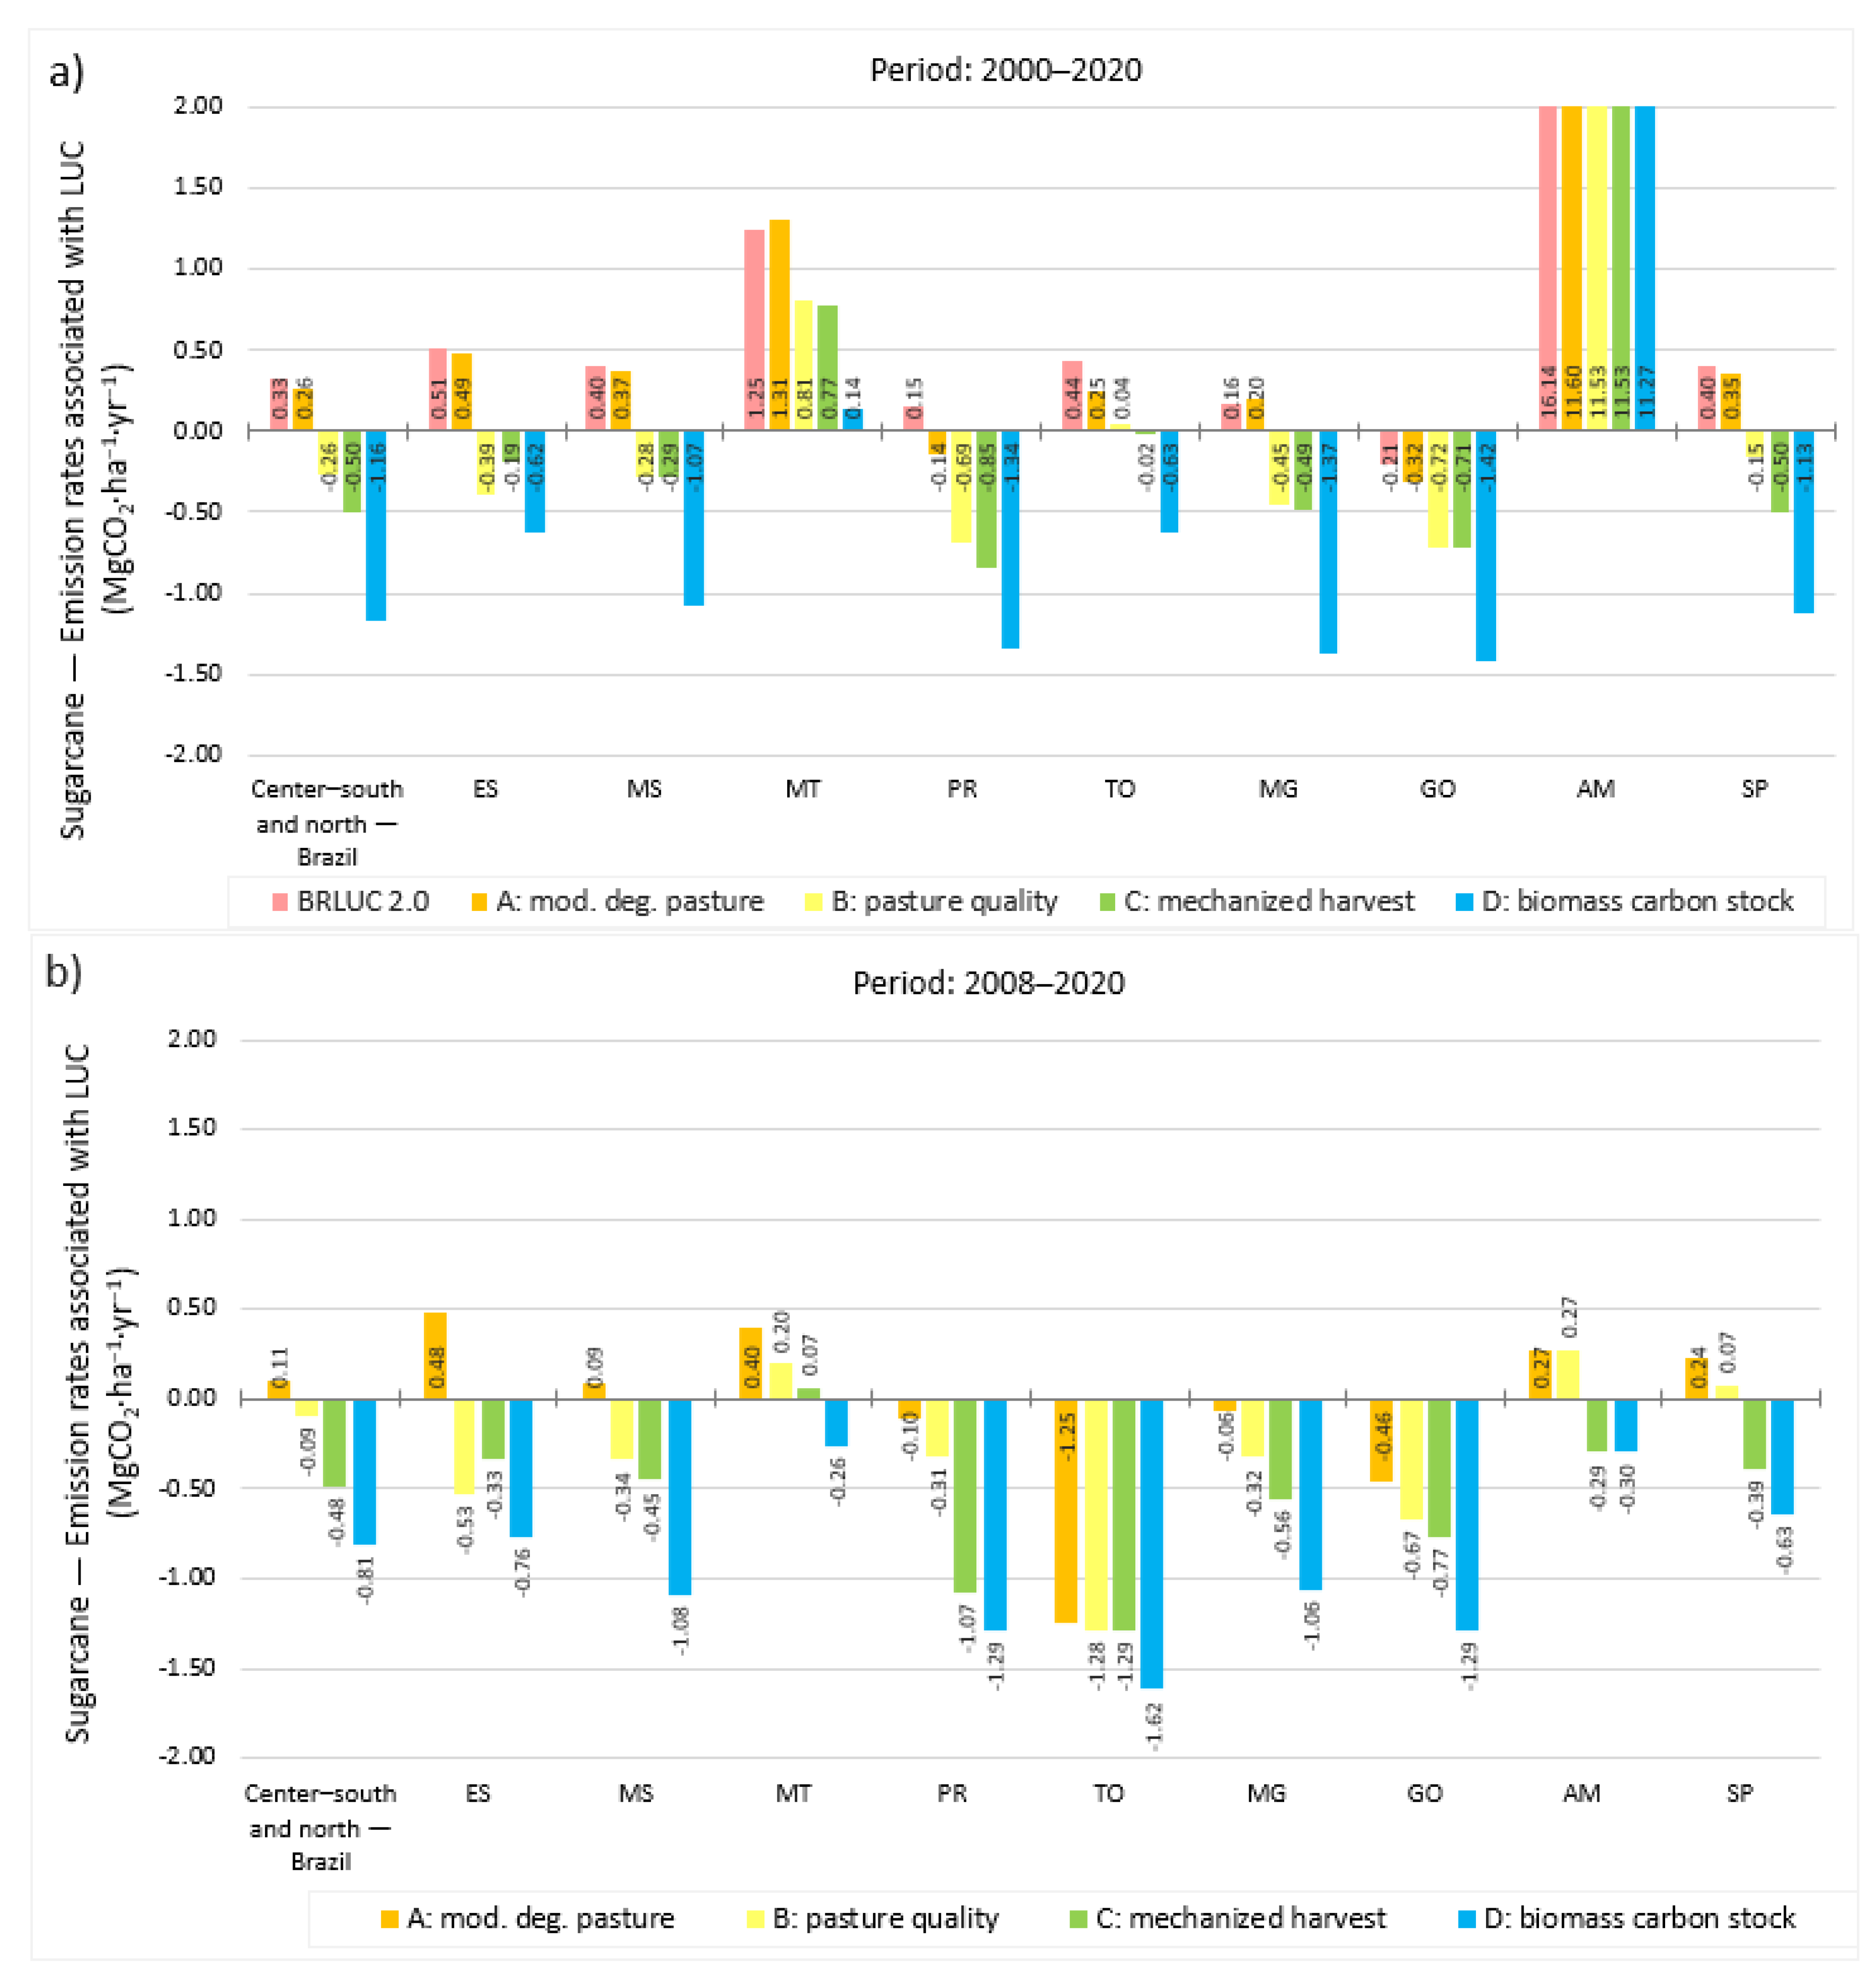
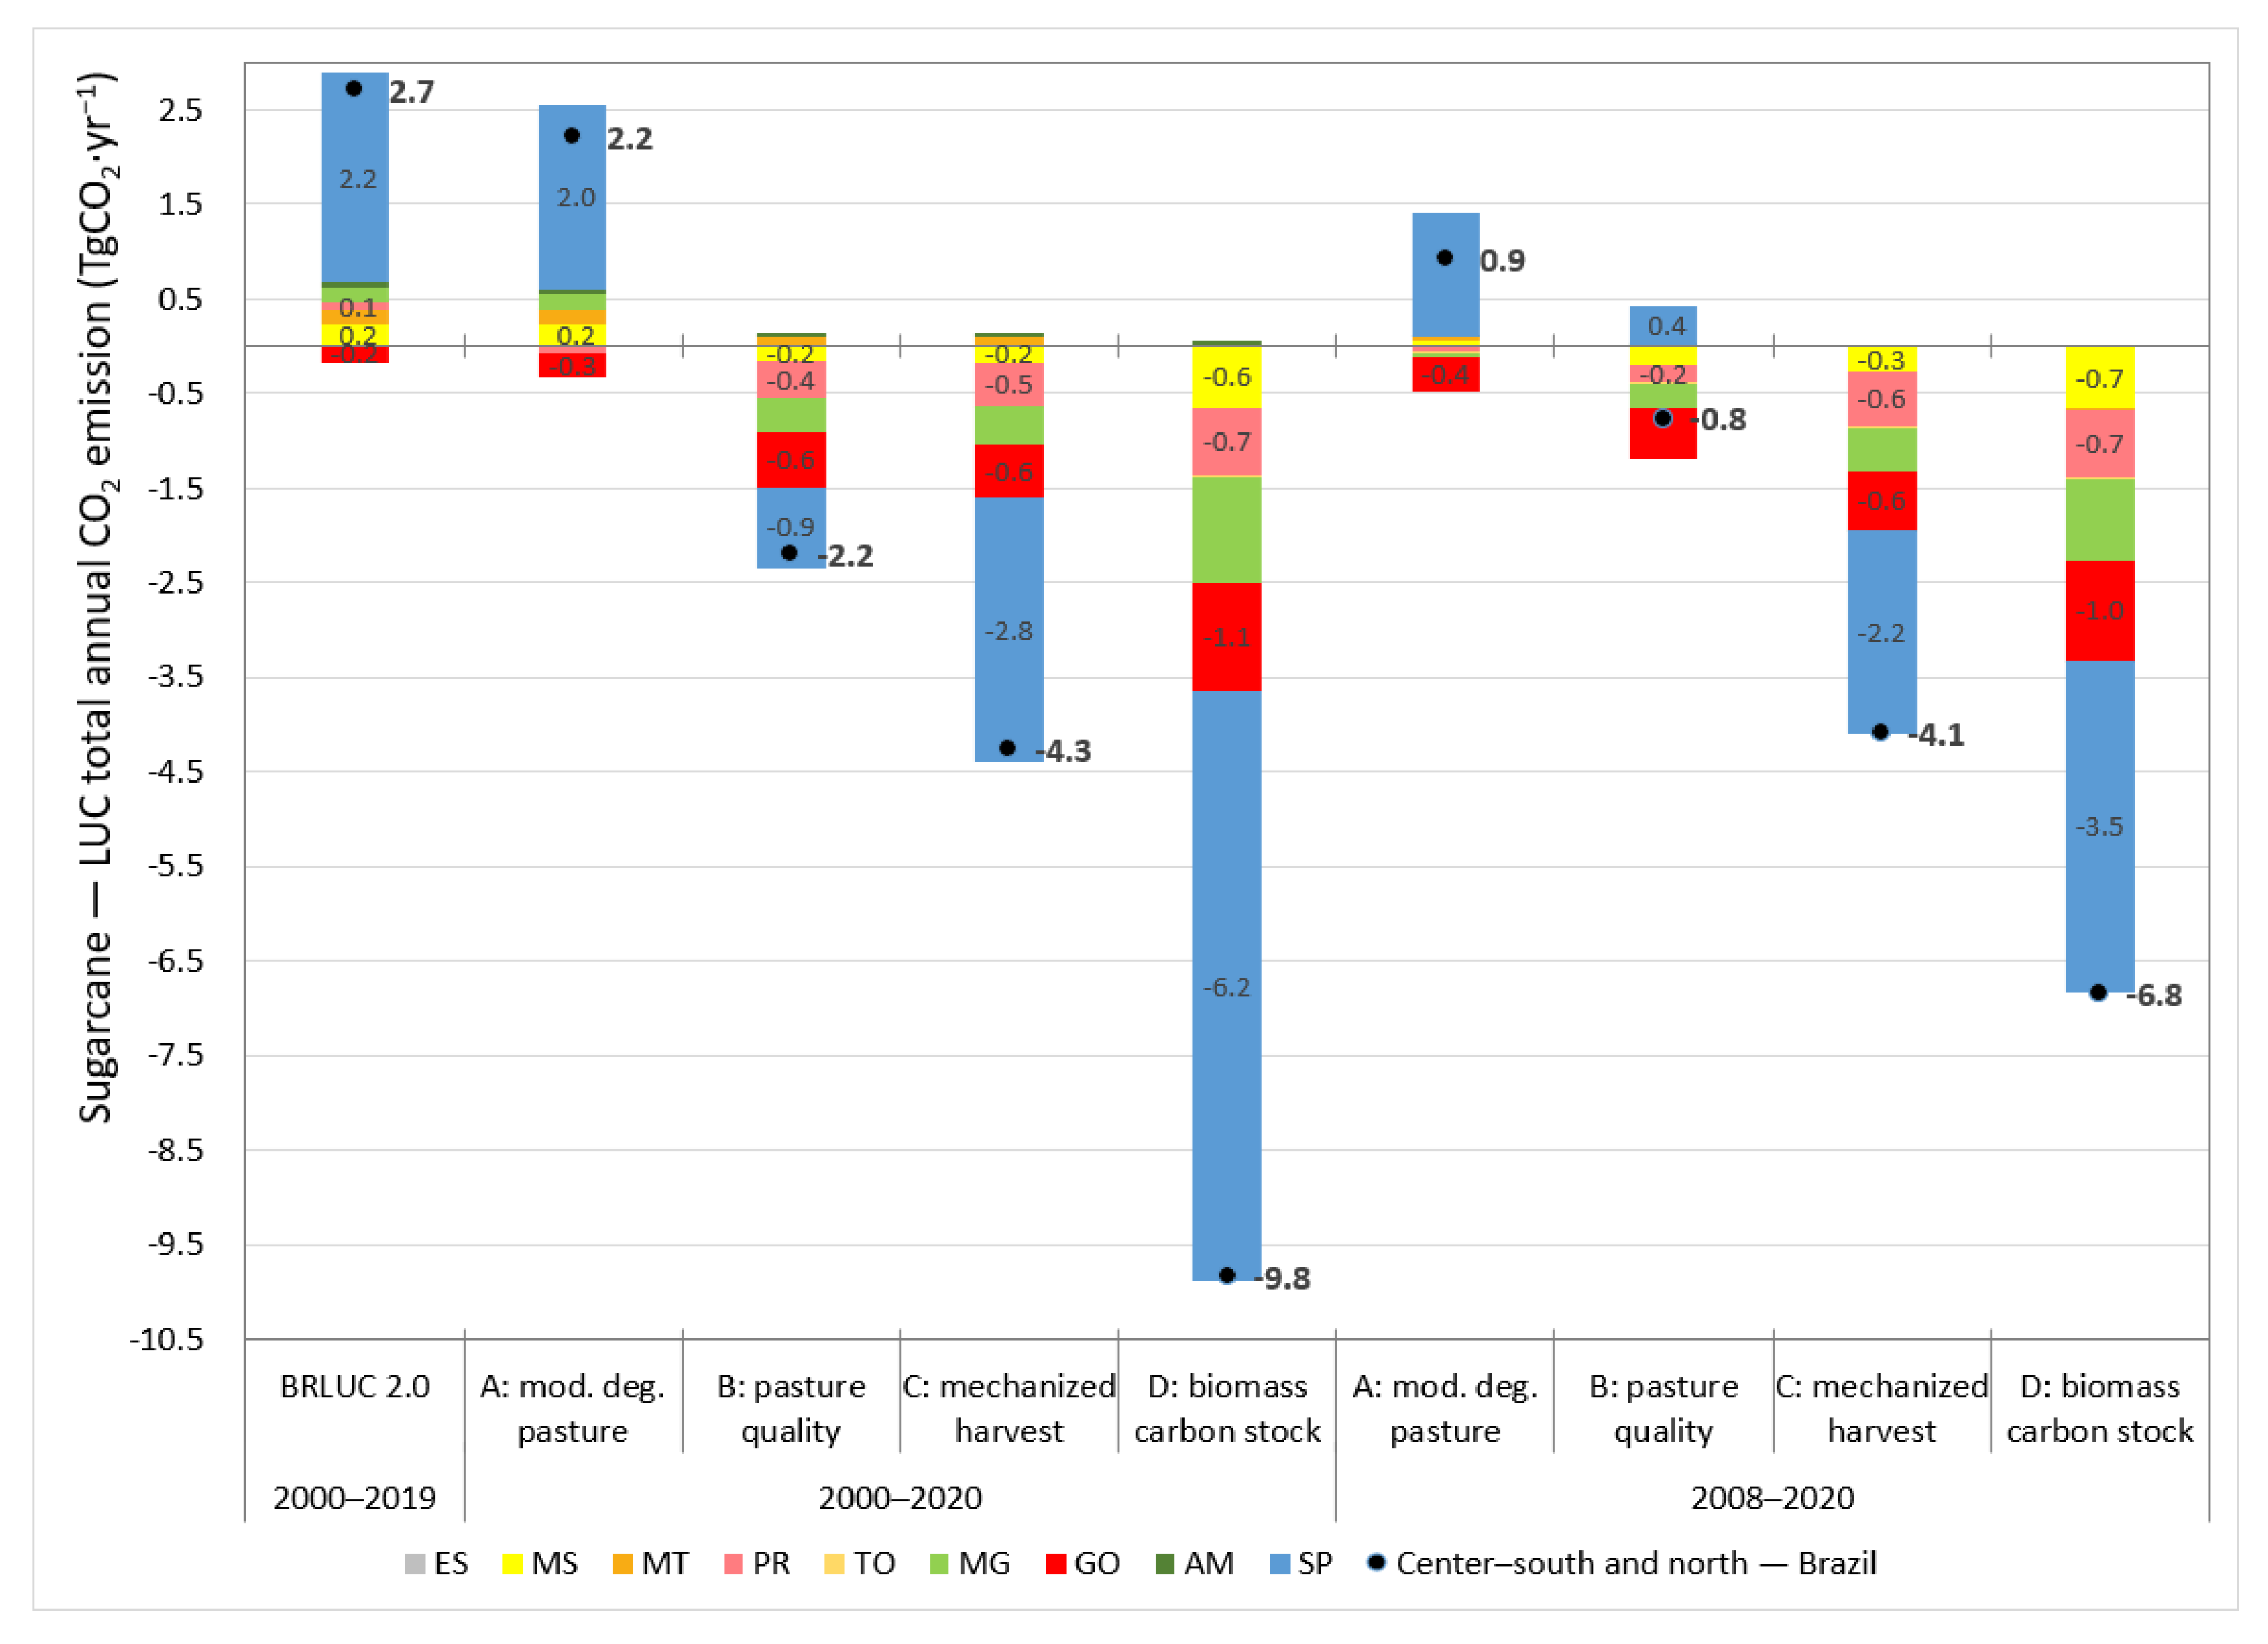
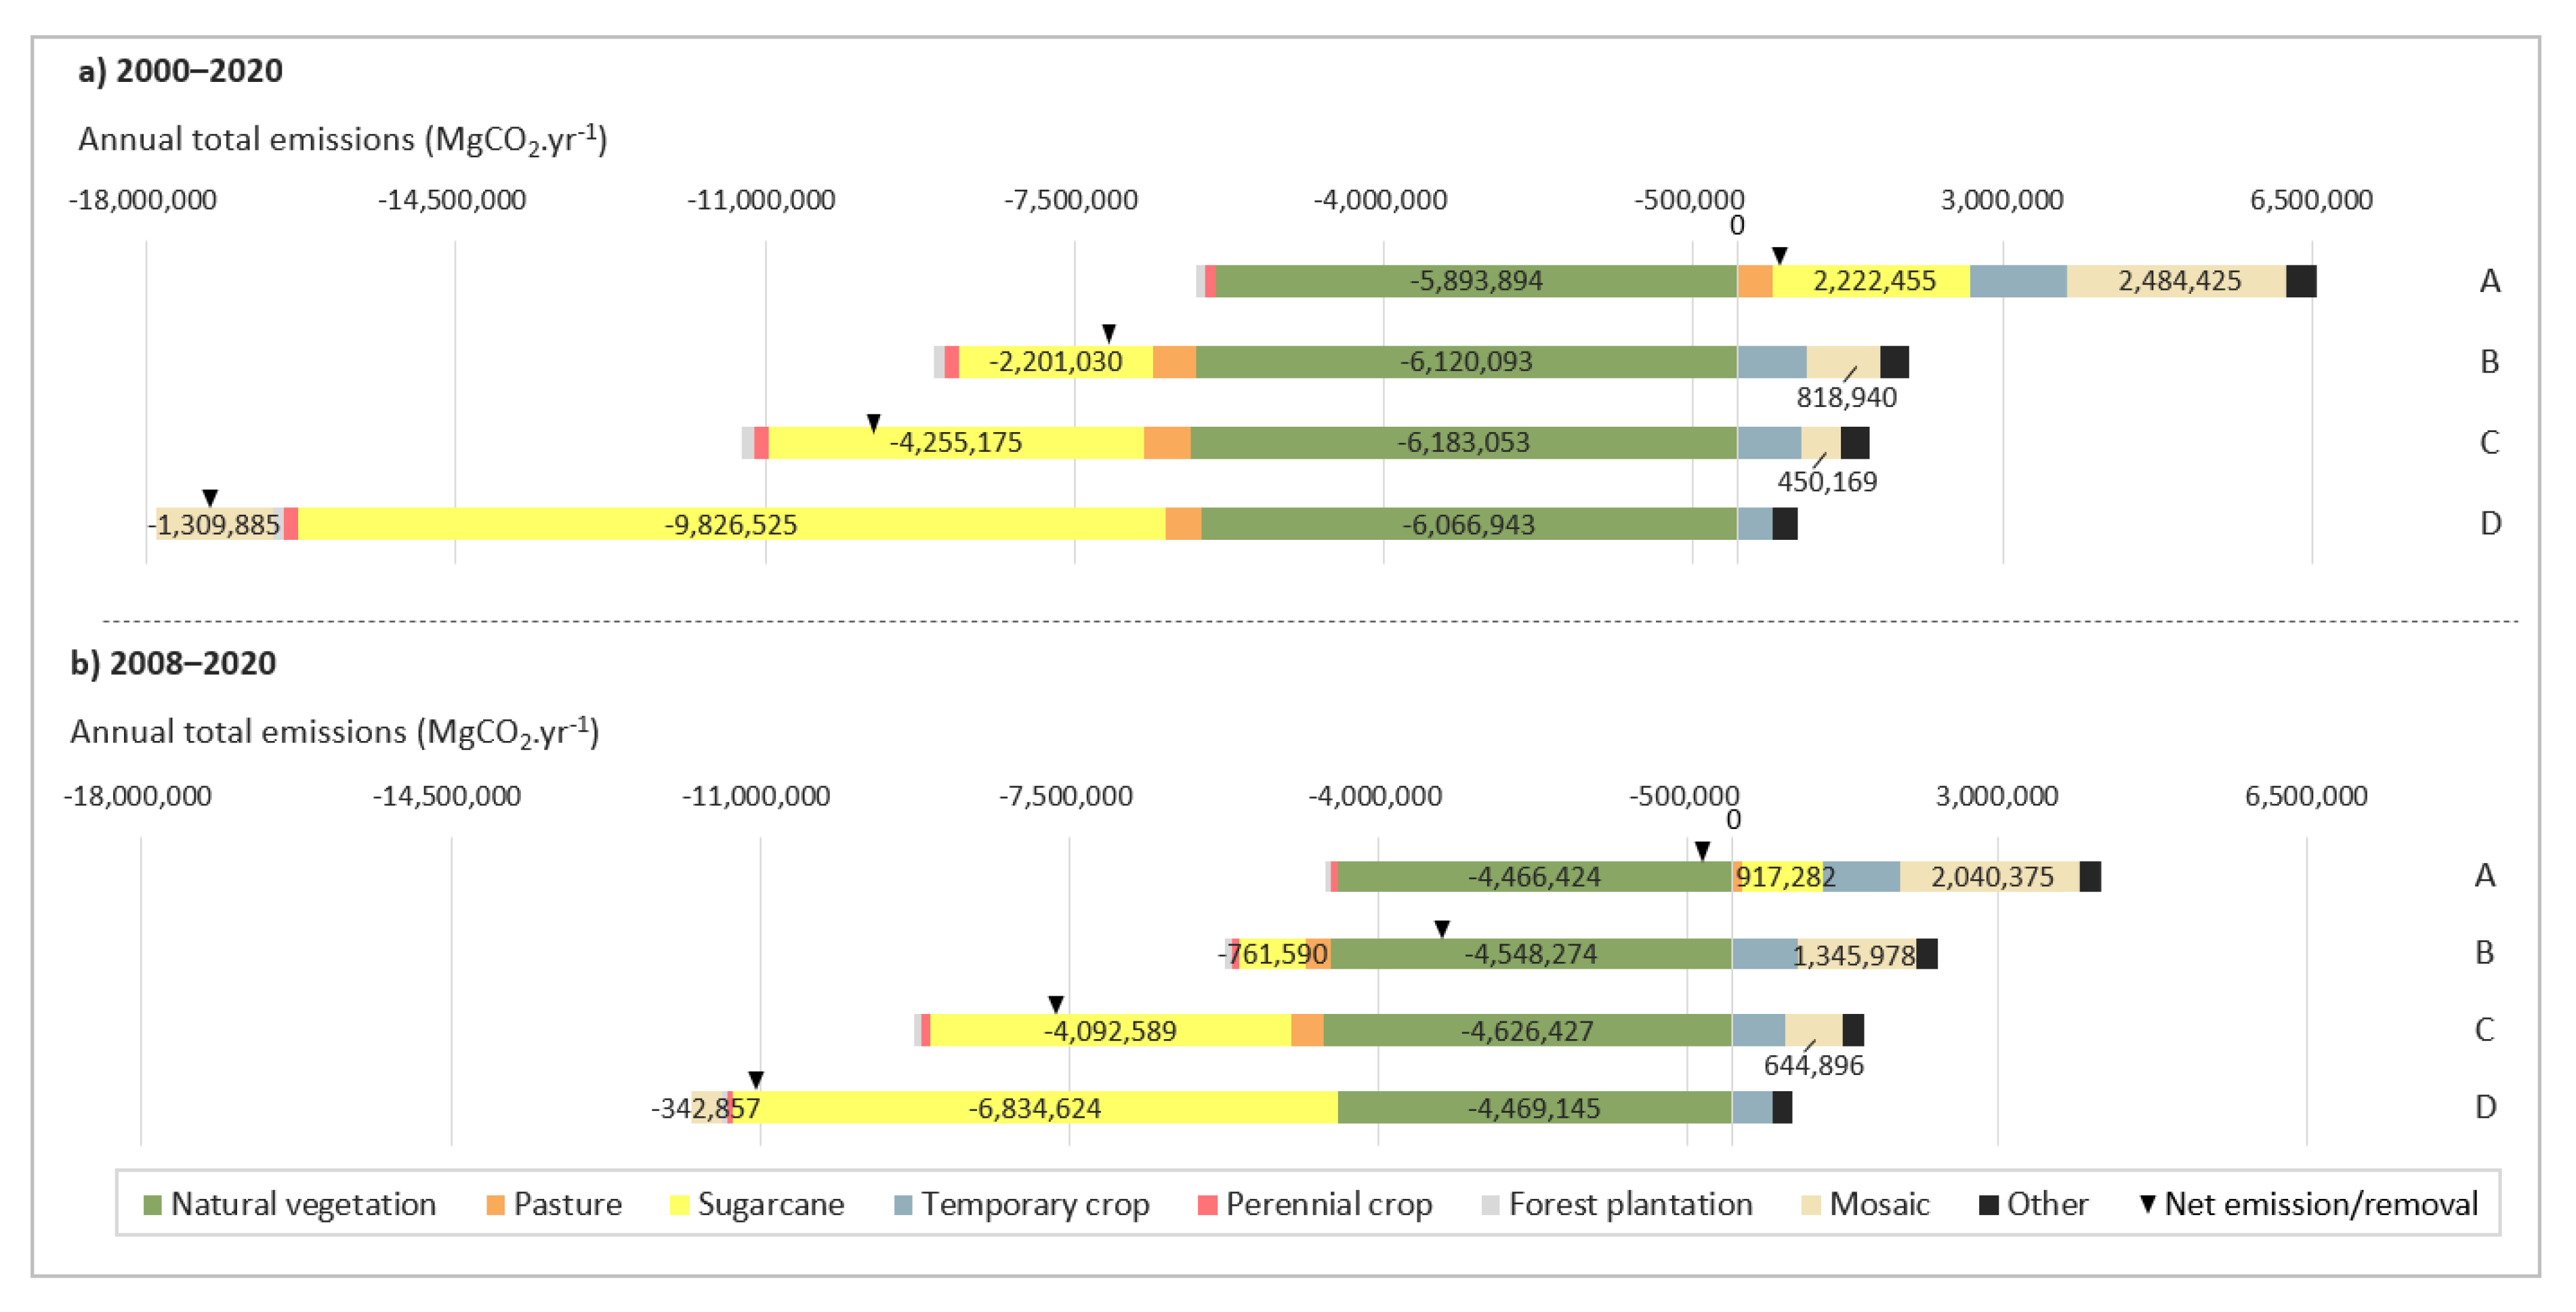
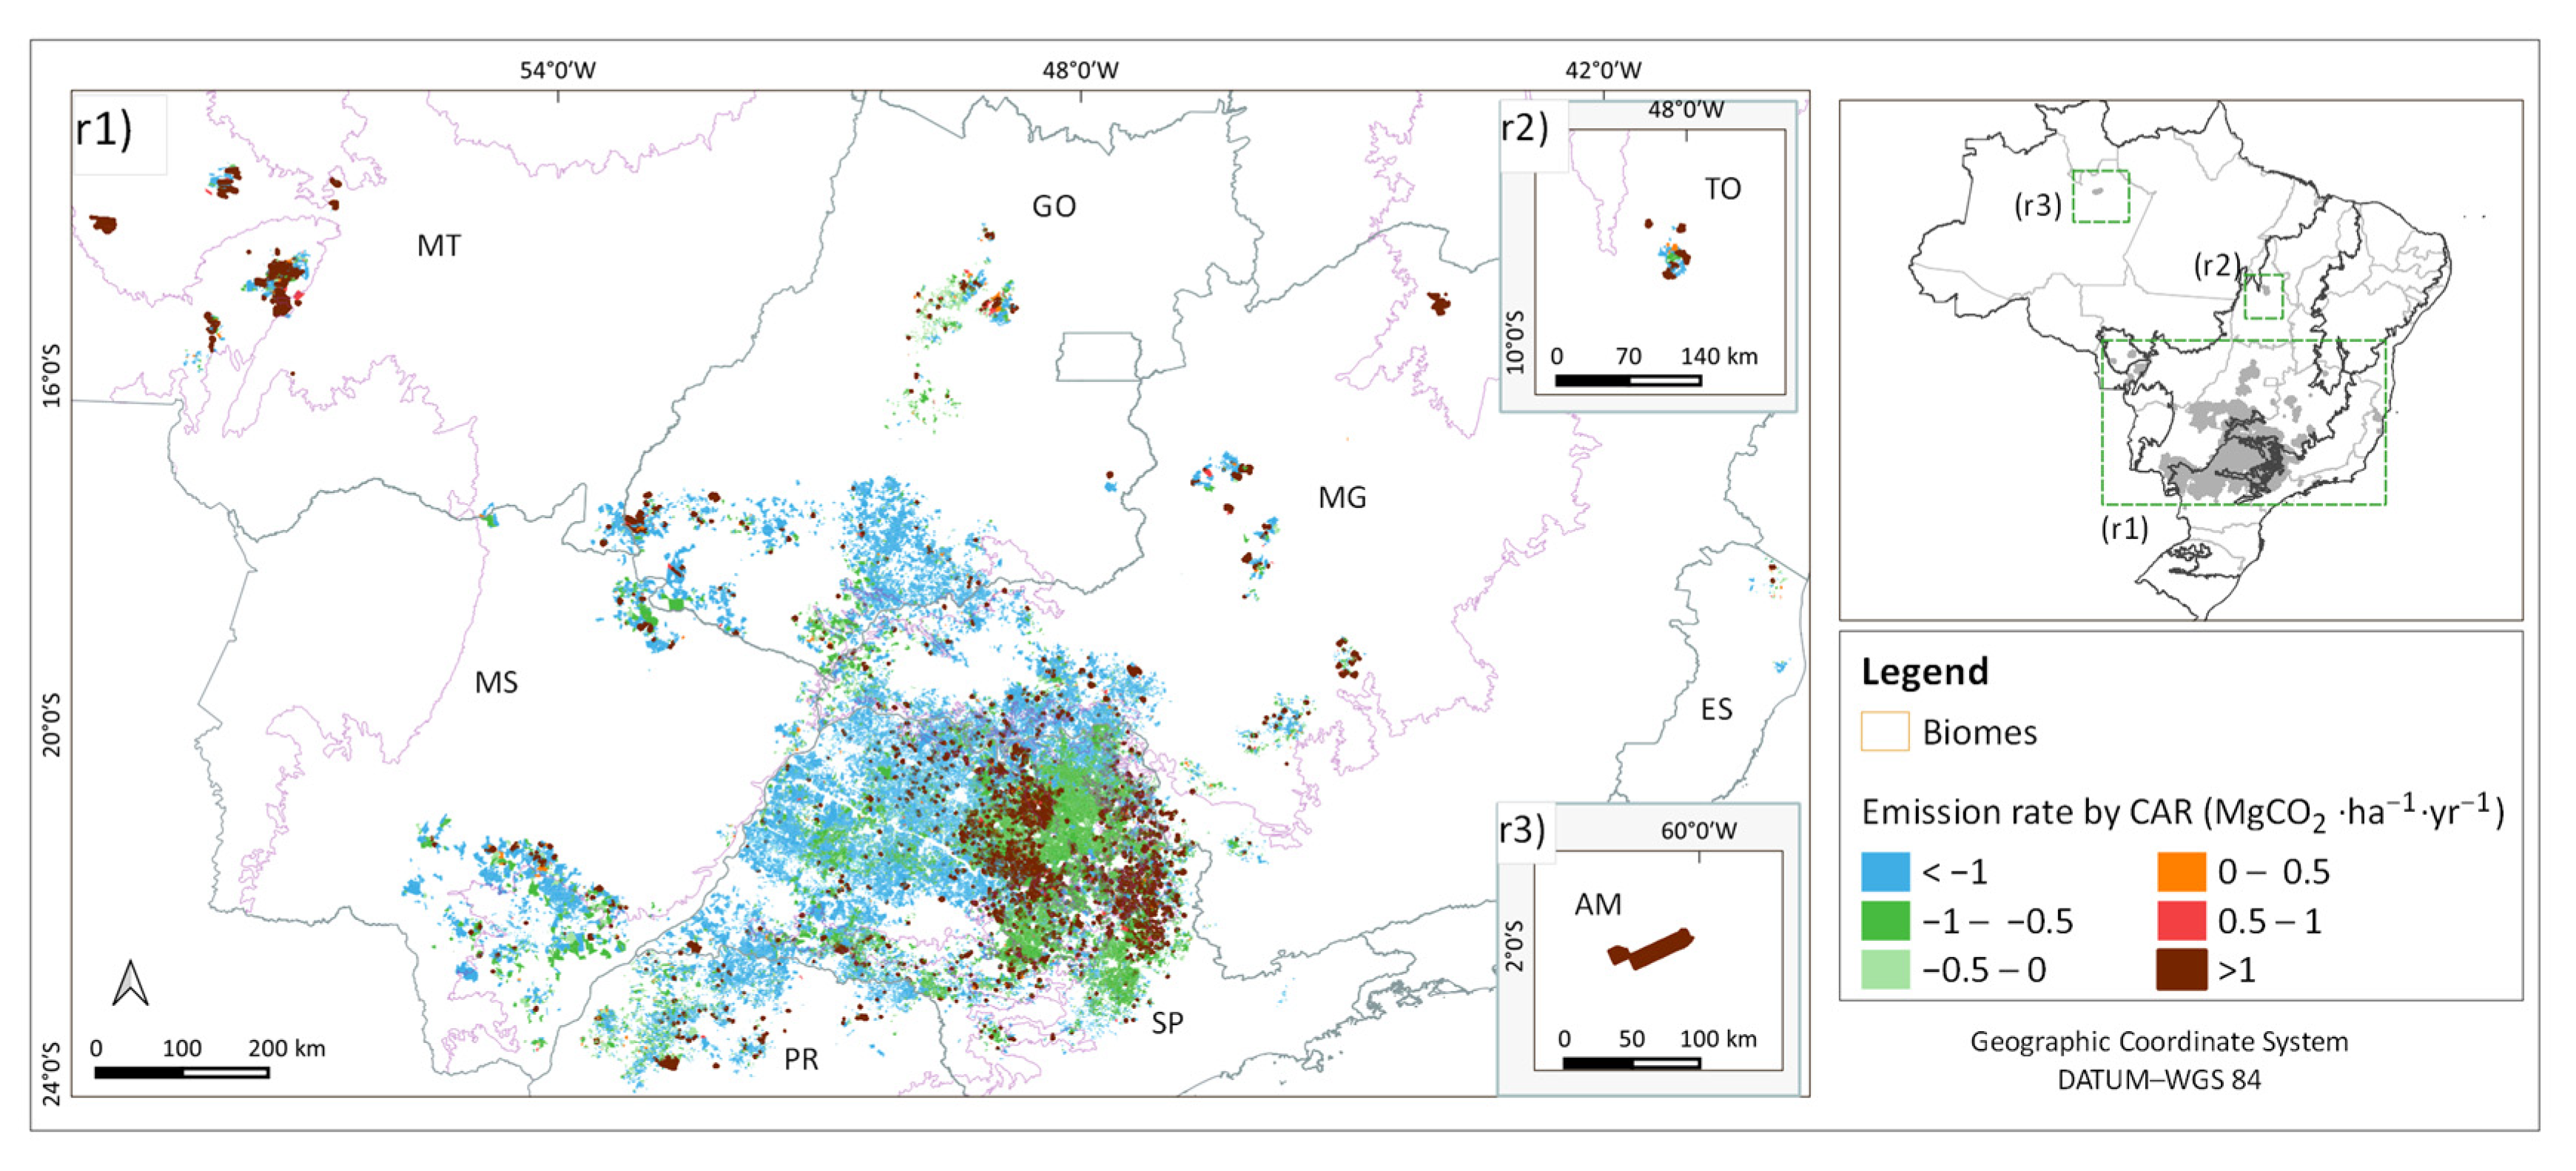
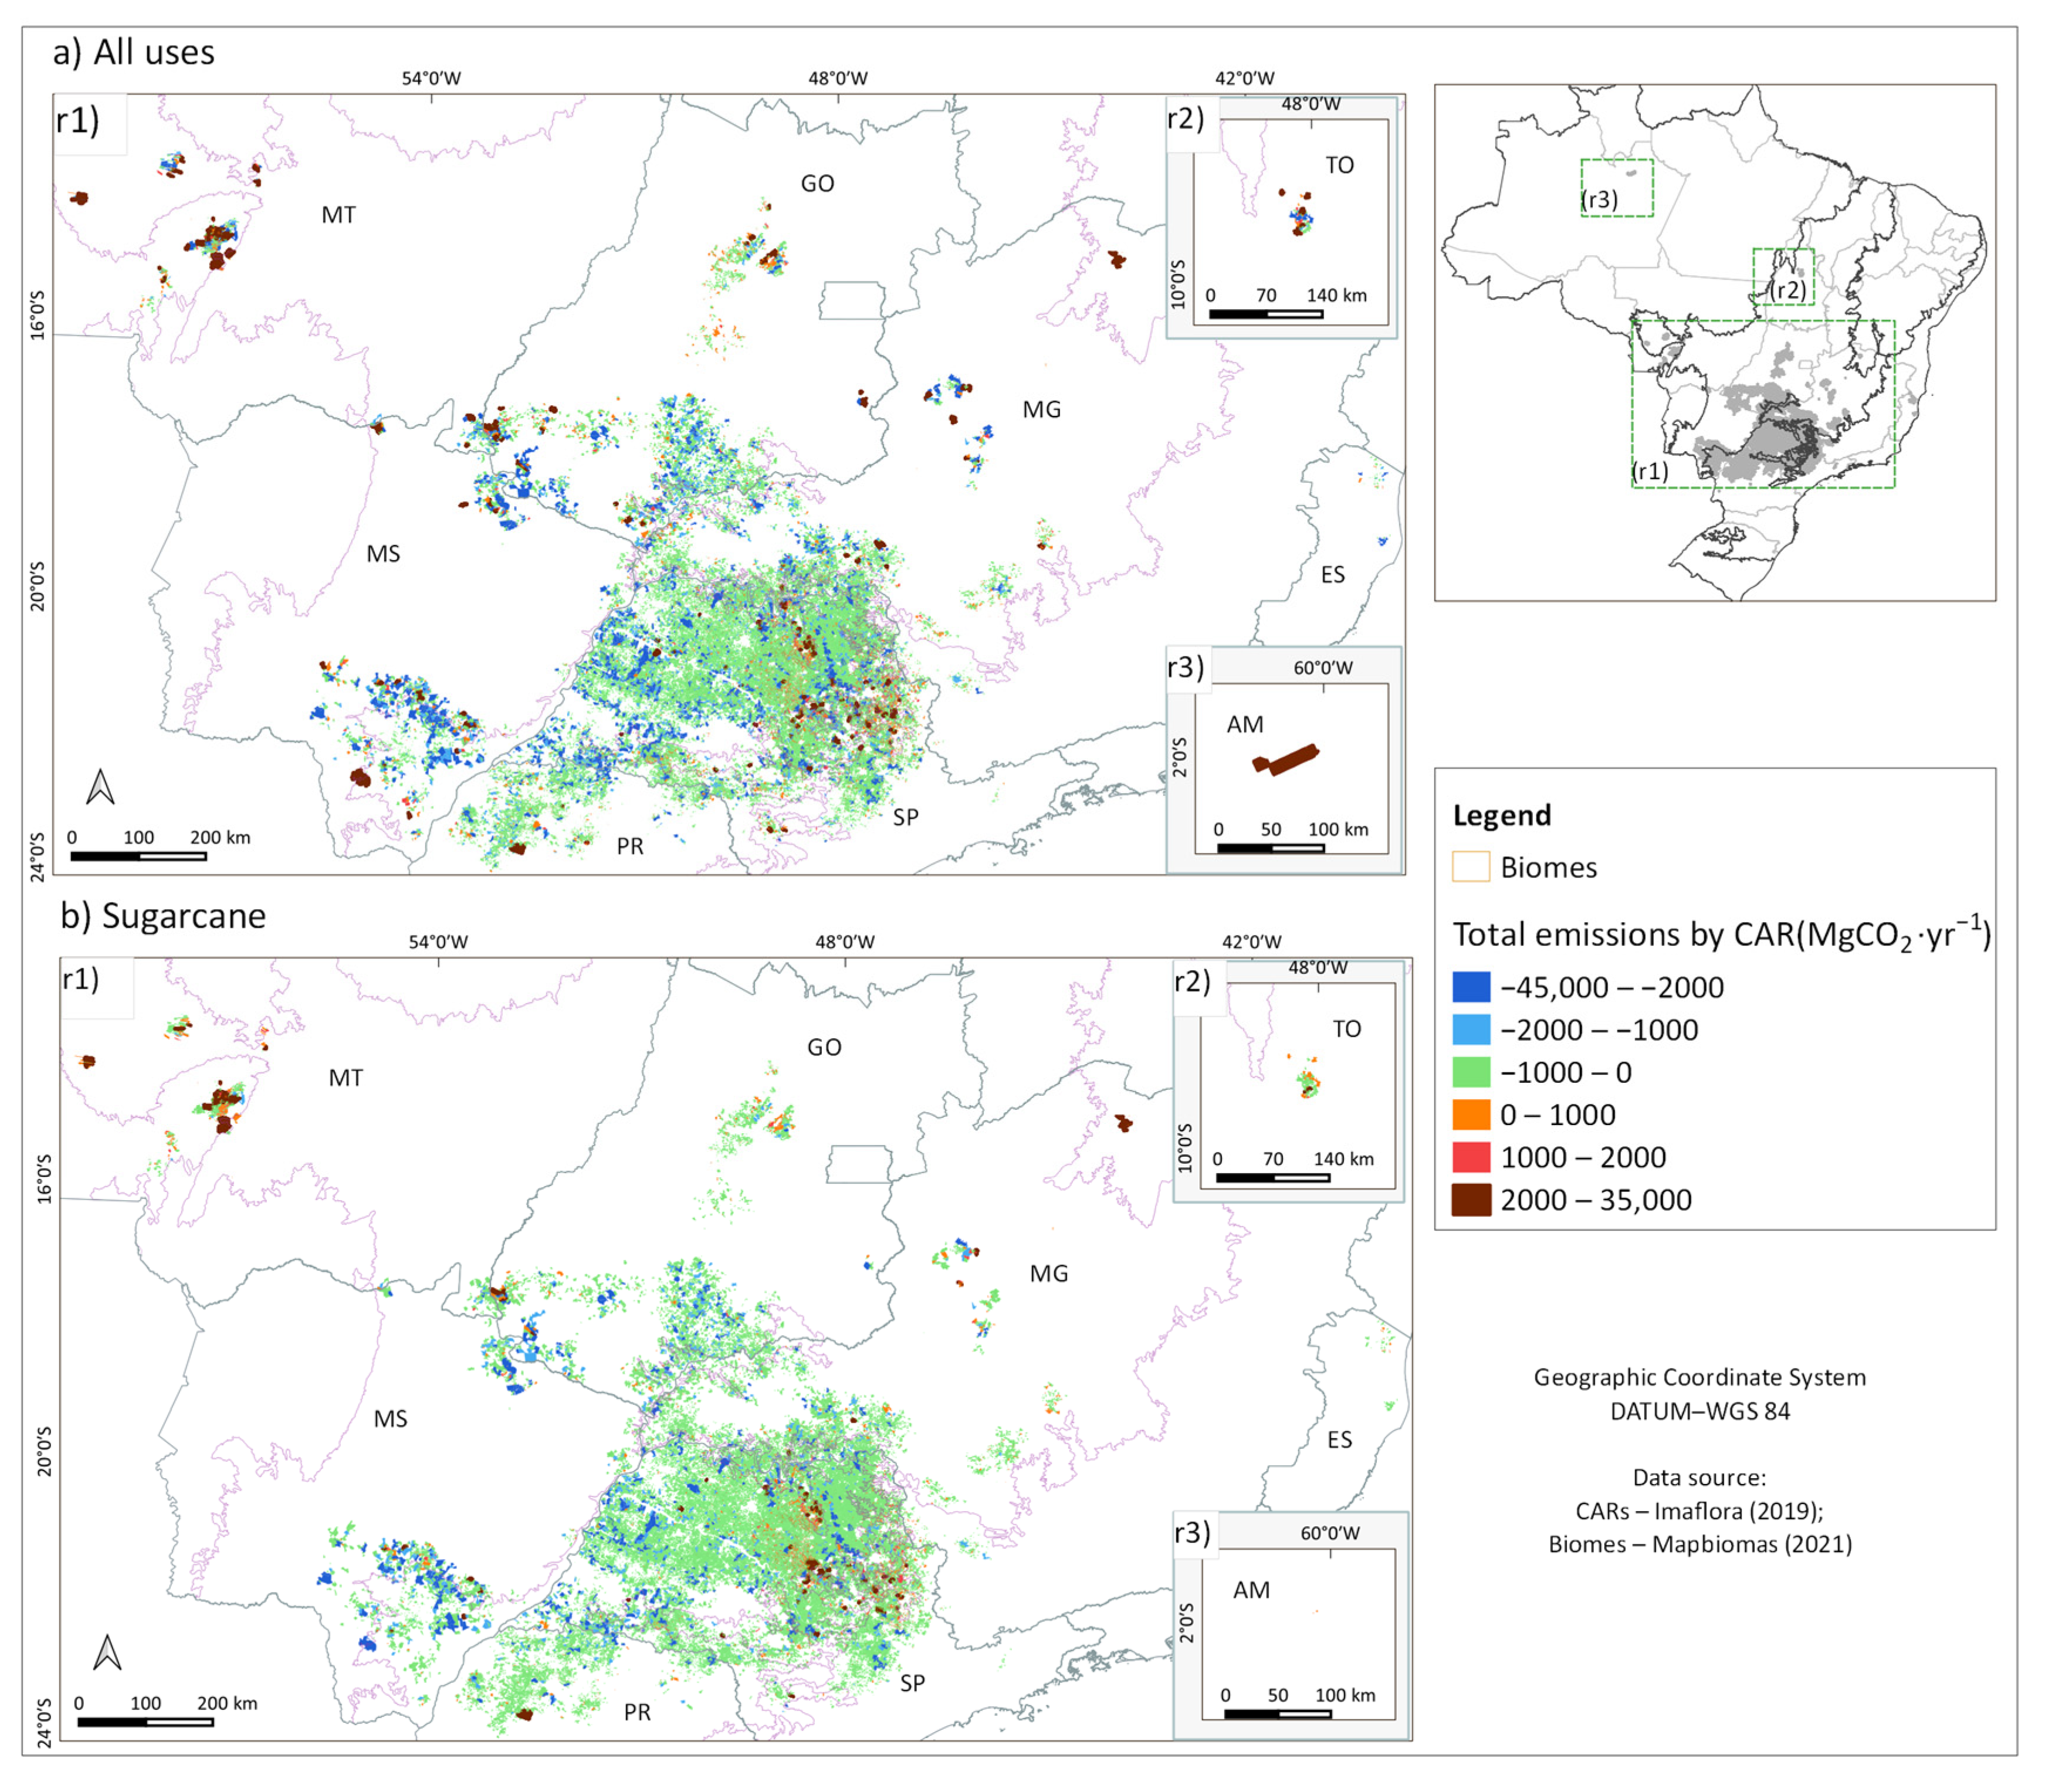
3.2. CO2 Emissions Associated with Direct Land Use Change

CO2 emissions were estimated also considering the two scopes: first, exclusively to the sugarcane cultivation areas and second, to all land uses and land covers present in the sugarcane-producing CARs in the center–south and north regions of Brazil. Refining the management practices and carbon stocks of the pasture, sugarcane and temporary crop classes had significant impacts on the estimates of CO2 emissions from LUC associated with sugarcane. Actually, they went from emission (parametrization A) to carbon removal (parametrizations B–D) during both evaluated periods.
Figure 7 and Figure 8 show, respectively, the effects on relative and absolute CO2 emissions associated with LUCs due to sugarcane cultivation within CARs for parametrizations A to D, both for the center–south and north regions, when broken down by state. For comparison, the results for the LUC due to sugarcane cultivation all over Brazil and in the selected states according to the BRLUC 2.0 [10] are also presented, and they were similar to the values obtained for the parametrization A in the CARs.
Between parametrizations A and D, in relative terms, the variation in the amplitude of the annual emission rate of LUC from sugarcane in Brazil’s center–south/north was −1.42 MgCO2∙ha−1∙yr−1 (from 0.26 to −1.16) in 2000–2020 and −0.92 MgCO2∙ha−1∙yr−1 in 2008–2020 (Figure 7 and Table 2). For the full period (2000–2020), the refinement in biomass stock and pasture quality had the greatest influence on the results. The exclusive effect of biomass stock (parametrization D) was responsible for 46% of the reductions and pasture quality level (parametrization B) was responsible for 37%. The gradual consolidation of mechanized harvest (parametrization C) contributed to 17% of carbon removal in the whole period. After 2008, the mechanization profile became the greatest contributor to reducing emission rates (43%), which was followed by biomass carbon stock refinement (35%; Table 2). The reduction in pastures with some degree of degradation from 2000 to 2008 minimizes the effect of this parametrization in the 2008–2020 period.
The refinement of management practices and carbon stocks is preconized by the main carbon accounting guidelines (e.g., IPCC [14]; WRI [89]), as it can lead to more accurate and higher resolution estimates of GHG emissions. The expansion of cropland over poor quality pastures [90] and the mechanization of sugarcane harvesting [78,91,92,93] have been long shown as promising solutions to reduce the carbon footprint of Brazilian agriculture. However, these management improvements have been rarely accounted for in sugarcane (e.g., Garofalo et al. [10]) and Brazil (e.g., Brazil [57]) LUC emissions. In addition, biomass carbon stocks associated with sugarcane are commonly based on oversimplifications, for example, by using the European Commission [56] value of 5 tC∙ha−1 or carbon stocks for perennial cropland (e.g., Donke et al. [18]).
After all refined parametrizations, the emission of dLUC per hectare per year for sugarcane, for the center–south/north region of Brazil, estimated by parametrization D for the period 2000–2020 was −1.16 (MgCO2∙ha−1∙yr−1). This value is much lower than those of the LUC Impact tool [11], geoFootprint [12], and BRLUC 2.0, which present dLUC emission values for Brazil for sugarcane of 8.58 (period 1999–2018), 1.3 (period 2000–2016) and 0.33 (period 2000–2019), respectively. Given that this study is based on more refined management practices and carbon stocks, we suggest that these methods be reevaluated to incorporate such refinements and thus to represent more accurately the LUC emissions profile associated with sugarcane in Brazil and the globe. In absolute terms (Figure 8), for the 2000–2020 period, differences between the values of the LUC emission rates caused the sugarcane cultivated in this region to go from a total annual LUC emission of 2.2 TgCO2∙yr−1 in parametrization A (2.3 TgCO2∙yr−1 with BRLUC 2.0) to −9.8 in parametrization D (Figure 8). In the results observed for parametrization D in this period (−9.8 TgCO2∙.yr−1), the increases in carbon stocks in areas with sugarcane cultivation were essentially due to the advance of sugarcane over pasture areas, responsible for 54.6% of gross removals, which was followed by the contribution of transition to raw sugarcane (16.4%), temporary crops (15.0%), and mosaic (13.7%) (the net removal −9.8 corresponds to the sum of the gross removals (−11.5) with gross emissions (1.7) due to LUC related to sugarcane cultivation between 2000–2020; the percentages showed above were calculated in relation to the gross removals −11.5 TgCO2∙yr−1), see Table S9 in the Supplementary Material S1 for details). As for the 2008–2020 period, the total annual CO2 emission from sugarcane LUC changed from 0.9 to −6.8 Tg. In parametrization A, São Paulo was the state with the highest CO2 emissions from LUC associated with sugarcane cultivation, and in parametrization D, it became the state with the highest removal (Figure 8).
When considering all land use changes that occurred in the CARs as a whole and not just in the current sugarcane areas, we can see the impact of all LUCs on sugarcane-producing properties (Figure 9). The carbon removal due to maintaining natural vegetation areas and their increase over the mosaic, sugarcane and pasture classes offset emissions resulting from the advancement of agricultural classes over natural vegetation (Figure 9). It is also important to note that changes in parametrization almost did not affect estimates of carbon removals associated with native vegetation (Figure 9). Thus, even covering around 15% of the total assessed area, maintaining or recovering natural vegetation areas represent significant gains in terms of carbon removal. With the still existing opportunities for restoring areas in the CARs, gains in terms of removal can be even greater in the future.
Garofalo et al. [10] estimated a total emission of 911 TgCO2 associated with Brazilian agriculture in 2019, which is a value similar to that reported by the Greenhouse Gas Emission and Removal Estimating System 9 (SEEG) for the year 2020 of 922 TgCO2 from LUC associated with the agricultural area in Brazil [9]. Considering the areas of all CARs analyzed in this study and based on parametrization D, the removal of 344 TgCO2 was observed for the period 2000 to 2020. Divided by 20 years, this would represent an annual removal of 17 TgCO2∙yr−1, which would offset approximately 1.9% of Brazilian LUC emissions reported in the aforementioned studies.
Figure 10 and Figure 11 show, respectively, the geographical distribution of the absolute and annual net CO2 emissions/removals rates from LUC associated with the sugarcane areas for each CAR in 2000–2020. Adopting the CAR as a territorial unit for analyzing LUC emissions leads to higher levels of resolution than when adopting territorial units such as states or municipalities. In an analysis that adopts the state level as a territorial unit, for example, the emission profile of all producers in the state will be the same, so that both producers who deforested natural vegetation and those who recovered it will have the same emission rate. When analyzing emissions by CAR, it is found that even in states where a certain use shows negative emissions in parametrization D, this same use can show positive emissions in specific CARs and vice versa (Figure 10 and Figure 11). In Figure 10, the highest concentration of positive values of the annual emission rates associated with sugarcane occurs in the CARs located in the central portion of São Paulo and in the western portion of Mato Grosso, which are areas where sugarcane advanced over natural vegetation in the analyzed period. However, when considering all the direct land use changes that occurred in the CARs (Figure 11a), the carbon removals end up offsetting sugarcane emissions in several CARs (Figure 11b). In the short term, there is an expected increase in carbon removals due to areas of natural vegetation in the CARs, since the need of complying with legal requirements for protecting natural vegetation and the properties’ environmental adequacy (increasing around 6% to achieve 20% of RL) is likely to result in the reduction in suppression and increasing natural forest vegetation recovery. Another factor to increase carbon removal would be the increase in sugarcane yields due to future improvements in management practices, with the adoption of updated genetic material, care for soil quality, plant health and even water supplementation in opportune areas [94]. The biomass stocks are based on stalk productivity; the average yield in the center–south was 74.5 t∙ha−1 over the last ten years [51], and sugarcane can exceed values of 80 t∙ha−1, with the potential to achieve three digits [95].
Based on the net emission/removal carbon associated with sugarcane areas in the CARs, during 2000–2020, the dLUC effect on ethanol’s carbon footprint represents the removal of −11.21 gCO2eq∙MJ−1 (parametrization D) (Table 3). Therefore, if dLUC is incorporated into ethanol’s carbon footprint (21 gCO2eq∙MJ−1 [83]), a net mitigation of almost 90% can be obtained when displacing gasoline.
As for iLUC, a combined factor, composed of direct and indirect land use changes, is commonly used in bioenergy programs. However, iLUC cannot be measured but only estimated through complex theoretical models [96,97]. The Low Carbon Fuel Standard (LCFS) currently holds the iLUC value for sugarcane (about 11.8 gCO2eq∙MJ−1) [98]. However, this value does not consider important elements explored in this paper, such as more accurate values of biomass carbon stocks, an increase in carbon stocks due to the mechanization of sugarcane harvesting and expansion over different pasture degradation levels. Our study indicates that using geographical information system (GIS) data and refinements in carbon stock estimations can reduce emissions by about 13 gCO2eq∙MJ−1 (from 2.53, parametrization A, to −11.21 gCO2eq∙MJ−1, parametrization D, Table 3) for Brazil. This indicates that maybe more precise carbon metrics could counterbalance the LUC emissions estimated within the LCFS, for example. Furthermore, considering the whole carbon dynamics within the CAR significantly enhances the carbon storage that is under farmers’ control (mostly because of the increase in forest area within farms).
In its last NDC, in 2022, Brazil committed to reducing its GHG by 37% (in 2025) and 50% (in 2030), compared with 2005, in addition to achieving climate neutrality by 2050 [4]. The specific goals presented in 2015 include increasing the share of sustainable biofuels in the Brazilian energy mix to approximately 18% by 2030, strengthening and enforcing the implementation of the Forest Code and ABC Plan, and restoring an additional 15 million hectares of degraded pasturelands by 2030 [4]. In contrast to Picoli and Machado [21], our results suggest that sugarcane expansion during 2000–2020 occurred in synergy or as a consequence of these policies, which ultimately might have contributed to incentivizing the control of natural vegetation suppression and inducing carbon stock removals in the CARs. We suggest that sustainability studies concerned with sugarcane sustainability (e.g., Picoli and Machado [21]) be re-evaluated in face of the findings reported here.
Of the 357 plants authorized to produce ethanol, 80% are certified by Renovabio [99] and, consequently, comply with requirements that their sugarcane areas are not associated with direct deforestation since 2018. The availability of extensive areas of pastures is also a promising scenario for the expansion of sugarcane/bioenergy in Brazil [28,87], and 3.1% of its area would be enough to double the production of ethanol in Brazil [100]. This could provide an increase in the carbon budget in both soil and biomass [28,38,39], improve the soil health and soil-related ecosystem services [84,85], and ultimately contribute to meeting the Brazilian’ goals established in the NDC.
The present results have some limitations that, once overcome, could enhance the accuracy of the carbon emissions/removals estimates. This study does not include the areas of sugarcane production in the northeast region, which presents significant differences between the Brazilian center–south production in terms of the technology level [101]. However, it is reinforced that sugarcane cultivation has suffered a reduction in northeast states (17% during 2000–2020) and currently contributes with 8.8% of the area covered by sugarcane in Brazil [51]. It also does not include 1.5% of sugarcane areas that were out of CARs and sugarcane areas reported by IBGE surveys in center–south and north states but absent in MapBiomas data (e.g., PA (14,906 in 2020 ha [51]) and RS (14,526 ha) but with a retraction of 55% during 2000–2020 [51]), as they could not be analyzed with the paper’s framework. These limitations left 7% of sugarcane production out of the analyses, according to IBGE data. Another important limitation is the absence of quantification of the total uncertainty associated with the estimates. Uncertainties can range from a 12.6% global inaccuracy associated with MapBiomas land use data [31] to a ±75% error associated with pastures biomass carbon stocks [44]. However, the quantification of all cumulative errors would require a much more complex framework that could be implemented in future improvements of this work. The emissions due to other management practices (e.g., use of fertilization), and the emissions of GHG such as N2O and CH4 [14] were not considered and can be included in future analyses to improve the estimates, although in work carried out by Donke et al. [18], these gases accounted for less than 3% of LUC emissions.

4. Conclusions

This work brings a refined estimation of the land-use change and derived CO2 emissions associated with sugarcane cultivation, including changes in management practices and refined land use carbon stocks over the last two decades for Brazil’s center–south and north regions. The analysis was carried out at the rural property (CAR) level, considering spatially explicit land conversion data.
The results indicate that refining management practices and carbon stock parameters for pastures, sugarcane and temporary crop classes had significant impacts on the estimates of CO2 emissions from LUC, which switched from emissions (2.2 TgCO2∙yr−1 in parametrization A) to carbon removals (up to −9.8 TgCO2∙yr−1 in parametrization D) in the 2000–2020 period. Considering all the LUC within sugarcane-producing CARs, the net removal is even larger, of −17 TgCO2∙yr−1. In this sense, our work shows the relevance of a refined parametrization for estimating the behavior of carbon stocks in Brazil, as more precise carbon metrics can significantly change the conclusions on LUC emissions obtained in the context of different international sustainability schemes.
Increases in carbon stocks were possible mainly due to the expansion of sugarcane over degraded pastures and other agricultural land uses, the transition from conventional burned harvesting to unburned sugarcane harvesting, and a reduced expansion over native vegetation. This suggests that the policies and private control mechanisms currently in place might have been adequate not only to control deforestation in the assessed areas but also to induce a net increase in carbon stocks. Yet, CARs are expected to feature a carbon surplus in the short-medium term if reforestation requirements are met (in the case of larger CARs). Furthermore, there are still plenty of degraded pastures suitable for sugarcane expansion, which could lead to additional carbon removals while also limiting the risk of iLUC emissions. These results have important repercussions for both modeling the sustainability of sugarcane production systems and derived products as well as for policy designing toward sustainable bioenergy and agricultural production.

Supplementary Materials

The following supporting information can be downloaded at: https://www.mdpi.com/article/10.3390/land12030584/s1, Supplementary Material S1_Figure S1. Distribution of evaluated CARs and excluded CARs in the rural properties database verification stage; Figure S2. Location of evaluated CARs and excluded CARs in the database verification stage of rural properties, combined with the occurrence of suppression of natural vegetation that occurred between 2000 and 2020, in the evaluated states with the highest concentration of CARs; Figure S3. Details of the main regions where CARs were excluded in the database verification stage of rural properties; Figure S4. Comparisons between MapBiomas land use and land cover mapping (based on Landsat satellite images) and the location of sugarcane fields provided by the industry; Table S1. Areas of land uses and land covers in all CARs of the analyzed region, in 2000, by state; Table S2. Areas of land uses and land covers in all CARs of the analyzed region, in 2008, by state; Table S3. Areas of land uses and land covers in all CARs of the analyzed region, in 2020, by state; Figure S5. Area of land use and land cover in all CARs of the analyzed region, in the years 2000, 2008 and 2000; Table S4. Dynamics of native vegetation cover in all CARs; Table S5. Dynamics of changes between natural vegetation and sugarcane classes; Table S6. Sugarcane expansion (2020) over land uses as of 2000; Table S7. Sugarcane expansion (2020) over land uses as of 2008; Figure S6. LUC between 2000–2020 and 2008–2020 in the CARs; Table S8. History of mechanized harvesting of sugarcane in 2000s harvest seasons (%); Table S9. Total, net and gross emission/removal due to all LUCs in the CARs (2000–2020), and the percentual of gross removals/emissions due to LUC related to sugarcane cultivation; Supplementary Material S2_Carbon stock factors; Supplementary Material S3_Total Carbon Stocks for Parametrization A–D.

Author Contributions

Conceptualization, M.M.R.M., J.E.A.S., M.M.G., D.F.T.G.; methodology, M.M.G., D.F.T.G., M.M.R.M., J.E.A.S., R.M.L.N., S.F.N., N.P.R. and C.A.d.A.; validation, M.M.G., D.F.T.G., R.M.L.N., S.F.N., N.P.R. and C.A.d.A.; formal analysis, D.F.T.G., M.M.G., M.M.R.M., J.E.A.S. and R.M.L.N.; investigation, M.M.G., D.F.T.G., M.M.R.M., J.E.A.S. and R.M.L.N.; writing—original draft preparation, M.M.G., D.F.T.G., J.E.A.S. and M.M.R.M.; writing—review and editing, J.E.A.S., R.M.L.N., M.M.R.M., S.F.N., N.P.R. and C.A.d.A.; supervision, M.M.R.M., J.E.A.S.; project administration, M.M.R.M.; funding acquisition, M.M.R.M. All authors have read and agreed to the published version of the manuscript.

Funding

The research was the result of a collaboration between Agroicone, the University of Campinas (Unicamp) and Embrapa Meio Ambiente. Agroicone and Unicamp participations were funded by Raízen. Embrapa participation was cofunded by public resources from the Brazilian Ministry of Mines and Energy (project nº 20.20.00.060.00.00) and FINEP (project nº 1088/20).

Data Availability Statement

Not applicable.

Acknowledgments

The authors are grateful to Raízen for the financial support to the project of Agroicone; Ricardo A. A. Pazianotto and Elizabethe de Campos Ravagnani for technical support to the projects of Embrapa Meio Ambiente; the IEA Bioenergy Technology Collaboration Program Task 45 for supporting some of the authors of this project.

Conflicts of Interest

The authors declare that there was a potential conflict of interest with the corporation that partially funded the study. This was mitigated by the following measures: the use of public databases from Brazilian organizations of international prestige, as Mapbiomas (recognized for the high quality of its products) and Imaflora; the stock carbon refinements were based on the BRLUC 2.0 method (which has internationally recognized proof), predominant literature of peer-reviewed papers and IPCC database; the analysis covers all center–south and north regions of Brazil, including areas that do not correspond to those provided by the company. In addition, previous hypotheses, methods and results were submitted to scrutiny by independent expert researchers and the manuscript were submitted to a peer-review journal.

References

  1. Prasad, S.; Venkatramanan, V.; Singh, A. (Eds.) Renewable energy for a low-carbon future: Policy perspectives. In Sustainable Bioeconomy; Springer: Singapore, 2021; pp. 267–284. [Google Scholar]
  2. Reid, W.V.; Ali, M.K.; Field, C.B. The future of bioenergy. Glob. Chang. Biol. 2020, 26, 274–286. [Google Scholar] [CrossRef] [PubMed]
  3. Rogelj, J.; Shindell, D.; Jiang, K.; Fifita, S.; Forster, P.; Ginzburg, V.; Handa, C.; Kheshgi, H.; Kobayashi, S.; Kriegler, E.; et al. Mitigation pathways compatible with 1.5 °C in the context of sustainable development. In Global Warming of 1.5 °C: An IPCC Special Report on the Impacts of Global Warming of 1.5 °C above Pre-Industrial Levels and Related Global Greenhouse Gas Emission Pathways, in the Context of Strengthening the Global Response to the Threat of Climate Change, Sustainable Development, and Efforts to Eradicate Poverty; Masson-Delmotte, V., Zhai, P., Pörtner, H.-O., Roberts, D., Skea, J., Shukla, P.R., Pirani, A., Moufouma-Okia, W., Péan, C., Pidcock, R., et al., Eds.; Intergovernmental Panel on Climate Change: Geneva, Switzerland, 2018; pp. 313–443. [Google Scholar]
  4. Brazil. Brazil’s Intended Nationally Determined Contribution (NDC). 2022. Available online: https://unfccc.int/NDCREG (accessed on 14 December 2022).
  5. UNICA. Observatório da Cana e Bioenergia. Ethanol Production. Available online: https://observatoriodacana.com.br/listagem.php?idMn=4 (accessed on 14 December 2022).
  6. CONSECANA Paraná. Manual de Instruções; Ganziani, J.R., Guimarães, V.A., Eds.; FAEP: Curitiba, Brazil, 2012; p. 118. Available online: https://www.sistemafaep.org.br/wp-content/uploads/2021/08/Manual-Consecana-2012.pdf (accessed on 14 December 2022).
  7. Souza, G.M.; Ballester, M.V.R.; de Brito Cruz, C.H.; Chum, H.; Dale, B.; Dale, V.H.; Fernandes, E.C.M.; Foust, T.; Karp, A.; Lynd, L.; et al. The role of bioenergy in a climate-changing world. Environ. Dev. 2017, 23, 57–64. [Google Scholar] [CrossRef]
  8. Friedlingstein, P.; Jones, M.W.; O’Sullivan, M.; Andrew, R.M.; Bakker, D.C.E.; Hauck, J.; Zeng, J. Global Carbon Budget. Earth Syst. Sci. Data Discuss. 2022, 14, 1917–2005. [Google Scholar] [CrossRef]
  9. SEEG—Sistema de Estimativas de Emissões e Remoções de Gases de Efeito Estufa. Análise das Emissões Brasileiras de Gases de Efeito Estufa e Suas Implicações Para Metas Climáticas do Brasil—1970–2020. 2021. Available online: https://seeg-br.s3.amazonaws.com/Documentos%20Analiticos/SEEG_9/OC_03_relatorio_2021_FINAL.pdf (accessed on 14 December 2022).
  10. Garofalo, D.F.T.; Novaes, R.M.L.; Pazianotto, R.A.A.; Maciel, V.G.; Brandão, M.; Shimbo, J.Z.; Folegatti-Matsuura, M.I.S. Land-use change CO2 emissions associated with agricultural products at municipal level in Brazil. J. Clean. Prod. 2022, 364, 132549. [Google Scholar] [CrossRef]
  11. Blonk Consultants. LUC Impact Tool, Full Dataset Version 2021; Blonk Consultants: Gouda, The Netherlands, 2021. [Google Scholar]
  12. Reinhard, J.; Bengoa, X.; Liernur, A. GeoFootprint, Technical Documentation; Version 1; Quantis: Lausanne, Switzerland, 2021; Available online: https://geofootprint.com/wp-content/uploads/2021/05/geoFootprint_TechnicalDocumentation20210504.pdf (accessed on 5 January 2023).
  13. Novaes, R.M.L.; Pazianotto, R.A.A.; Brandão, M.; Alves, B.J.R.; May, A.; Folegatti-Matsuura, M.I.S. Estimating 20-year land-use change and derived CO2 emissions associated with crops, pasture and forestry in Brazil and each of its 27 states. Glob. Chang. Biol. 2017, 23, 3716–3728. [Google Scholar] [CrossRef]
  14. Intergovernmental Panel on Climate Change—IPCC. Refinement to the 2006 IPCC Guidelines for National Greenhouse Gas Inventories; Calvo Buendia, E., Tanabe, K., Kranjc, A., Baasansuren, J., Fukuda, M., Ngarize, S., Osako, A., Pyrozhenko, Y., Shermanau, P., Federici, S., Eds.; IPCC: Geneva, Switzerland, 2019. [Google Scholar]
  15. De Rosa, M.; Pizzol, M.; Schmidt, J. How Methodological Choices Affect LCA Climate Impact Results: The Case of Structural Timber. Int. J. Life Cycle Assess. 2018, 23, 147–158. [Google Scholar] [CrossRef]
  16. Van Middelaar, C.E.; Cederberg, C.; Vellinga, T.V.; Van Der Werf, H.M.; De Boer, I.J. Exploring Variability in Methods and Data Sensitivity in Carbon Footprints of Feed Ingredients. Int. J. Life Cycle Assess. 2013, 18, 768–782. [Google Scholar] [CrossRef]
  17. Ahlgren, S.; Di Lucia, L. Indirect land use changes of biofuel production–a review of modelling efforts and policy developments in the European Union. Biotechnol. Biofuels 2014, 7, 35. [Google Scholar] [CrossRef]
  18. Donke, A.C.G.; Novaes, R.M.L.; Pazianotto, R.A.A.; Moreno-Ruiz, E.; Reinhard, J.; Picoli, J.F.; Folegatti-Matsuura, M.I.S. Integrating regionalized Brazilian land use change datasets into the ecoinvent database: New data, premises and uncertainties have large effects in the results. Int. J. Life Cycle Assess. 2020, 25, 1027–1042. [Google Scholar] [CrossRef]
  19. Andrade-Junior, M.A.U.; Valin, H.; Soterroni, A.C.; Ramos, F.M.; Halog, A. Exploring future scenarios of ethanol demand in Brazil and their land-use implications. Energy Policy 2019, 134, 110958. [Google Scholar] [CrossRef]
  20. Follador, M.; Soares-Filho, B.S.; Philippidis, G.; Davis, J.L.; de Oliveira, A.R.; Rajão, R. Brazil’s sugarcane embitters the EU-Mercosur trade talks. Sci. Rep. 2021, 11, 13768. [Google Scholar] [CrossRef] [PubMed]
  21. Picoli, M.C.A.; Machado, P.G. Land use change: The barrier for sugarcane sustainability. Biofuels Bioprod. Bioref. 2021, 15, 1591–1603. [Google Scholar] [CrossRef]
  22. Ministério da Agricultura, Pecuária e Abastecimento-MAPA. Plano Setorial Para Adaptação à Mudança do Clima e Baixa Emissão de Carbono na Agropecuária Com Vistas ao Desenvolvimento Sustentável (2020–2030): Visão Estratégica Para um Novo Ciclo; Secretaria de Inovação, Desenvolvimento Rural e Irrigação(MAPA): Brasília, Brasil, 2021. [Google Scholar]
  23. Banco Nacional Do Desenvolvimento—BNDES. Programa ABC+. Programa Para a Adaptação à Mudança do Clima e Baixa Emissão de Carbono na Agropecuária. Available online: https://www.Bndes.Gov.Br/Wps/Portal/Site/Home/Financiamento/Produto/Programa-Abc# (accessed on 14 February 2023).
  24. Brazil. Law 12.651/2012—Dispõe Sobre a Proteção da Vegetação Nativa (Forest Code). Diário Oficial da União, Brasília, 26 de maio 2012. 2012. Available online: http://www.planalto.gov.br/ccivil_03/_ato2011-2014/2012/lei/l12651.htm (accessed on 3 September 2022).
  25. ANP—National Agency for Petroleum, Natural Gas and Biofuels. Resolution n. 758 of 11/23/2018—DOU 11/27/2018. 2018. Available online: https://www.gov.br/anp/pt-br/assuntos/renovabio/legislacao-do-renovabio (accessed on 3 September 2022).
  26. São Paulo. Green Ethanol Protocol. 2017. Available online: https://www.infraestruturameioambiente.sp.gov.br/etanolverde/protocolo-agroambiental/diretivas/ (accessed on 5 January 2023).
  27. La Scala, N.; Figueiredo, E.B.; Panosso, A.R. A review on soil carbon accumulation due to the management change of major Brazilian agricultural activities. Braz. J. Biol. 2012, 72, 775–785. [Google Scholar] [CrossRef] [PubMed]
  28. Bordonal, R.D.O.; Carvalho, J.L.N.; Lal, R.; de Figueiredo, E.B.; de Oliveira, B.G.; La Scala, N. Sustainability of sugarcane production in Brazil. A review. Agron. Sustain. Dev. 2018, 38, 13. [Google Scholar] [CrossRef]
  29. Adami, M.; Rudorff, B.F.T.; Freitas, R.M.; Aguiar, D.A.; Sugawara, L.M.; Mello, M.P. Remote Sensing Time Series to Evaluate Direct Land Use Change of Recent Expanded Sugarcane Crop in Brazil. Sustainability 2012, 4, 574–585. [Google Scholar] [CrossRef]
  30. Souza, C.M., Jr.; Shimbo, J.Z.; Rosa, M.R.; Parente, L.L.; Alencar, A.; Rudorff, B.F.T.; Azevedo, T. Reconstructing three decades of land use and land cover changes in Brazilian biomes with Landsat archive and earth engine. Remote Sens. 2020, 12, 2735. [Google Scholar] [CrossRef]
  31. MapBiomas. MapBiomas Project- Collection 6.0 of the Annual Series of Land Use and Land Cover Maps of Brazil. 2021. Available online: https://mapbiomas.org/en/download (accessed on 5 April 2022).
  32. Maia, S.M.F.; Ogle, S.M.; Cerri, C.E.P.; Cerri, C.C. Eect of grassland management on soil carbon sequestration in Rondônia and Mato Grosso states, Brazil. Geoderma 2009, 149, 8491. [Google Scholar] [CrossRef]
  33. Carvalho, J.L.N.; Raucci, G.S.; Cerri, C.E.P.; Bernoux, M.; Feigl, B.J.; Wruck, F.J.; Cerri, C.C. Impact of pasture, agriculture and crop-livestock systems on soil C stocks in Brazil. Soil Tillage Res. 2010, 110, 175–186. [Google Scholar] [CrossRef]
  34. Braz, S.P.; Urquiaga, S.; Alves, B.J.R.; Jantalia, C.P.; Guimarães, A.P.; dos Santos, C.A.; dos Santos, S.C.; Pinheiro, E.F.M.; Boddey, R.M. Soil carbon stocks under productive and degraded Brachiaria pastures in the Brazilian Cerrados. Soil Sci. Soc. Am. J. 2013, 77, 914–928. [Google Scholar] [CrossRef]
  35. Galdos, M.V.; Cerri, C.C.; Cerri, C.E.P. Soil carbon stocks under burned and unburned sugarcane in Brazil. Geoderma 2009, 153, 347–352. [Google Scholar] [CrossRef]
  36. Luca, E.F.; Chaplot, V.; Mutema, M.; Feller, C.; Ferreira, M.L.; Cerri, C.C.; Couto, H.T.Z.D. Effect of conversion from sugarcane preharvest burning to residues green-trashing on SOC stocks and soil fertility status: Results from different soil conditions in Brazil. Geoderma 2018, 310, 238–248. [Google Scholar] [CrossRef]
  37. Guimaraes, M.D.F.; Oliveira, J.F.; Telles, T.S.; Machado, W.; Barbosa, G.; Tavares Filho, J. Soil aggregation and carbon stabilization in burn and no-burn sugarcane management systems. An. Acad. Bras. Ciências 2018, 90, 2459–2467. [Google Scholar] [CrossRef]
  38. Cherubin, M.R.; Karlen, D.L.; Franco, A.L.; Cerri, C.E.; Tormena, C.A.; Cerri, C.C. A Soil Management Assessment Framework (SMAF) evaluation of Brazilian sugarcane expansion on soil quality. Soil Sci. Soc. Am. J. 2016, 80, 215–226. [Google Scholar] [CrossRef]
  39. Oliveira, D.M.S.; Paustian, K.; Davies, C.A.; Cherubin, M.R.; Franco, A.L.C.; Cerri, C.C.; Cerri, C.E.P. Soil carbon changes in areas undergoing expansion of sugarcane into pastures in south-central Brazil. Agric. Ecosyst. Environ. 2016, 228, 38–48. [Google Scholar] [CrossRef]
  40. Nogueira, S.F.; Bayma, G.; Ligo, M.A.V.; Andrade, C.A.; Novaes, R.M.; Matsuura, M.I.S.F.; Adami, M.; Gmünder, S.; Dias, R.O.; Kabe, Y.O.; et al. Land-use change and carbon stocks: Regional assessment of sugarcane areas in Brazil. In Proceedings of the VIII International Conference on Life Cycle Analysis: LCA for Global Competitiveness, Cartago, Costa Rica, 15–20 July 2020. [Google Scholar]
  41. Escobar, N.; Tizado, E.J.; Zu Ermgassen, E.K.; Lofgren, P.; Borner, J.; Godar, J. Spatially-explicit footprints of agricultural commodities: Mapping carbon emissions embodied in Brazil’s soy exports. Glob. Environ. Chang. 2020, 62, 102067. [Google Scholar] [CrossRef]
  42. IMAFLORA. Atlas da Agropecuária Brasileira. Available online: https://www.imaflora.org/o-que-fazemos/politicas-interesse-publico/atlas-da-agropecuaria-brasileira (accessed on 10 April 2022).
  43. Raizen. Georeferenced Database in Shapefile, Provided by the Industry, about Sugarcane Fields Georeferenced (Total of 1330 Thousand ha) and Validated CARs (Area of 2246 Thousand ha); Raizen: São Paulo, Brazil, 2020. [Google Scholar]
  44. Intergovernmental Panel on Climate Change—IPCC. IPCC Guidelines for National Greenhouse Gas Inventories, Prepared by the National Greenhouse Gas Inventories Programme; Eggleston, H.S., Buendia, L., Miwa, K., Ngara, T., Tanabe, K., Eds.; IGES: Kanagawa, Japan, 2006. [Google Scholar]
  45. Maciel, V.G.; Novaes, R.M.L.; Brandão, M.; Cavalett, O.; Pazianotto, R.A.A.; Garofalo, D.T.; Folegatti-Matsuura, M.I. Towards a non-ambiguous view of the amortization period for quantifying direct land-use change in LCA. Int. J. Life Cycle Assess. 2022, 27, 1299–1315. [Google Scholar] [CrossRef]
  46. European Union Law. Directive 2018/2001/EC of the European Parliament and of the Council on the Promotion of the Use of Energy from Renewable Sources (Recast). Official Journal of the European Union. 2018. Available online: https://eur-lex.europa.eu/legal-content/EN/TXT/?uri=uriserv:OJ.L_.2018.328.01.0082.01.ENG (accessed on 3 September 2022).
  47. ICAO—International Civil Aviation Organization. CORSIA Sustainability Criteria for CORSIA Eligible Fuels. 2019. Available online: www.icao.int/environmental-protection/CORSIA/Pages/CORSIA-Eligible-Fuels.aspx (accessed on 9 August 2022).
  48. Pereira, O.J.R.; Ferreira, L.G.; Pinto, F.; Baumgarten, L. Assessing pasture degradation in the Brazilian Cerrado based on the analysis of MODIS NDVI time-series. Remote Sens. 2018, 10, 1761. [Google Scholar] [CrossRef]
  49. Santos, C.O.; Mesquita, V.V.; Parente, L.L.; de Pinto, A.S.; Ferreira, L.G. Assessing the wall-to-wall spatial and qualitative dynamics of the Brazilian pasturelands 2010–2018, based on the analysis of the Landsat data archive. Remote Sens. 2022, 14, 1024. [Google Scholar] [CrossRef]
  50. Intergovernmental Panel on Climate Change—IPCC. IPCC 2019: Annex I: Glossary. In Climate Change and Land: An IPCC Special Report On Climate Change, Desertification, Land Degradation, Sustainable Land Management, Food Security, and Greenhouse Gas Fluxes in Terrestrial Ecosystems; Shukla, P.R., Skea, J., Buendia, E.C., Masson-Delmotte, V., Portner, H.-O., Roberts, D.C., Zhai, P., Slade, R., Connors, S., van Diemen, R., et al., Eds.; IPCC: Geneva, Switzerland, 2019; pp. 803–830. [Google Scholar]
  51. IBGE—Instituto Brasileiro de Geografia e Estatística. Municipal Agricultural Production: 2020. 2022. Available online: http://www.sidra.ibge.gov.br (accessed on 2 August 2022).
  52. ANP—National Agency for Petroleum, Natural Gas and Biofuels. Painel Dinâmico de Produtores de Etanol. Available online: https://www.gov.br/anp/pt-br/centrais-de-conteudo/paineis-dinamicos-da-anp/paineis-e-mapa-dinamicos-de-produtores-de-combustiveis-e-derivados/painel-dinamico-de-produtores-de-etanol (accessed on 10 October 2022).
  53. Sparovek, G.; Reydon, B.P.; Pinto, L.F.; Faria, V.; de Freitas, F.L.; Azevedo-Ramos, C.; Gardner, T.; Hamamura, C.; Rajão, R.; Cerignoni, F.; et al. Who owns Brazilian lands? Land Use Policy 2019, 87, 104062. [Google Scholar] [CrossRef]
  54. SICAR—Sistema Nacional de Cadastro Ambiental Rural. Imóveis. Available online: https://www.car.gov.br/publico/imoveis/index (accessed on 5 April 2022).
  55. Bernoux, M.; Carvalho, M.C.S.; Volkoff, B.; Cerri, C.C. Brazil’s soil carbon stocks. Soil Sci. Soc. Am. J. 2002, 66, 888–896. [Google Scholar] [CrossRef]
  56. European Comission. Comission Decision of 10 June 2010 on Guidelines for the Calculation of Land Carbon Stocks for the Purpose of Annex V to Directive 2009/28/ EC; Official Journal of the European Union: Brussels, Belgium, 2010. [Google Scholar]
  57. Third National Communication of Brazil to the United Nations Framework Convention on Climate Change—Volume III; Ministry of Science, Technology and Innovation: Brasília, Brazil, 2016; p. 622.
  58. Dias-Filho, M. Diagnóstico Das Pastagens No Brasil; Embrapa Amazônia Oriental: Belém, Brazil, 2014; p. 38. [Google Scholar]
  59. Ferreira, L.G.; de Sousa, S.B.; Arantes, A.E. Radiografia Das Pastagens do Brasil; Laboratório de Processamento de Imagens e Geoprocessamento (LAPIG/UFG): Goiânia, Brazil, 2014; p. 214. [Google Scholar]
  60. dos Santos, S.S. O cultivo da Cana-De-Açúcar no Estado de Alagoas: Uma Análise Comparativa dos Efeitos da Mecanização no Estado de São Paulo. Master’s Thesis, Universidade de Brasília, Brasília, Brazil, 2011; p. 103. [Google Scholar]
  61. Santos, F.; Borem, A.; Caldas, C. (Eds.) Sugarcane: Bioenergy, Sugar and Ethanol, 1st ed.; Ministry of Agriculture, Livestock and Food Supply: Brasília, Brazil, 2012.
  62. CONAB—Companhia Nacional de Abastecimento. Acompanhamento da Safra Brasileira de Cana-De-Açúcar. Safra 2022/23; CONAB: Brasília, Brazil, 2022. Available online: https://www.conab.gov.br/info-agro/safras/cana/boletim-da-safra-de-cana-de-acucar (accessed on 14 October 2022).
  63. Packer, A.P.C.; Vilela, V.A.A.; Degaspari, I.A.M.; Ramos, N.P. Relatório de Referência: Emissões de Gases de Efeito Estufa na Queima de Resíduos Agrícolas; Ministério da Ciência e Tecnologia: Brasília, Brazil, 2015.
  64. Carré, F.; Hiederer, R.; Blujdea, V.; Koeble, R. Background Guide for the Calculation of Land Carbon Stocks in the Biofuels Sustainability Scheme Drawing on the 2006 IPCC Guidelines for National Greenhouse Gas Inventories; EUR 24573 EN; Office for Official Publications of the European Communities: Luxembourg, 2010; p. 109. [Google Scholar]
  65. Gava, G.J.C.; Trivelin, P.C.O.; Oliveira, M.W.; Penatti, C.P. Crescimento e acúmulo de nitrogênio em cana-de-açúcar cultivada em solo coberto com palhada. Pesqui. Agropecuária Bras. 2001, 36, 1347–1354. [Google Scholar] [CrossRef]
  66. Franco, H.C.J.; Vitti, A.C.; Faroni, C.E.; Cantarella, H.; Trivelin, P.C.O. Estoque de nutrientes em resíduos culturais incorporados ao solo na reforma de áreas com cana-de-açúcar. STAB Açúcar Álcool E Subprodutos 2007, 25, 32–36. [Google Scholar]
  67. Franco, H.C.J.; Trivelin, P.C.O.; Faroni, C.E.; Vitti, A.C.; Otto, R. Stalk yield and technological attributes of planted cane as related to nitrogen fertilization. Sci. Agric. 2010, 67, 579–590. [Google Scholar]
  68. Franco, H.C.J.; Mariano, E.; Vitti, A.C.; Faroni, C.E.; Otto, R.; Trivelin, P.C.O. Sugarcane Response to Boron and Zinc in Southeastern Brazil. Sugar Tech 2011, 13, 86–95. [Google Scholar] [CrossRef]
  69. Cherubin, M.R.; Lisboa, I.P.; Silva, A.G.B.; Varanda, L.L.; Bordonal, R.O.; Carvalho, J.L.N.; Otto, R.; Pavinato, P.S.; Soltangheisi, A.; Cerri, C.E.P. Sugarcane Straw Removal: Implications to Soil Fertility and Fertilizer Demand in Brazil. BioEnergy Res. 2019, 12, 888–900. [Google Scholar] [CrossRef]
  70. Cabral, O.M.R.; Freitas, H.C.; Cuadra, S.V.; Andrade, C.A.; Ramos, N.P.; Grutzmacher, P.; Galdos, M.; Packer, A.P.C.; Rocha, H.R.; Rossi, P. The sustainability of a sugarcane plantation in Brazil assessed by the eddy covariance fluxes of greenhouse gases. Agric. For. Meteorol. 2020, 282, 107864. [Google Scholar] [CrossRef]
  71. Cabral, O.M.R.; Rocha, H.R.; Gash, J.H.; Ligo, M.A.V.; Ramos, N.P.; Packer, A.P.; Batista, E.R. Fluxes of CO2 above a sugarcane plantation in Brazil. Agric. For. Meteorol. 2013, 182, 54–66. [Google Scholar] [CrossRef]
  72. Otto, R.; Franco, H.C.J.; Faroni, C.E.; Vitti, A.C.; Oliveira, E.C.A.; Sermarini, R.A.; Trivelin, P.C.O. The Role of Nitrogen Fertilizers in Sugarcane Root Biomass under Field Conditions. Agric. Sci. 2014, 5, 1527–1538. [Google Scholar] [CrossRef]
  73. Vieira-Megda, M.X.; Mariano, E.; Leite, J.M.; Franco, H.C.J.; Vitti, A.C.; Megda, M.M.; Khan, S.A.; Mulvaney, R.L.; Trivelin, P.C.O. Contribution of fertilizer nitrogen to the total nitrogen extracted by sugarcane under Brazilian field conditions. Nutr. Cycl. Agroecosyst. 2015, 101, 241–257. [Google Scholar] [CrossRef]
  74. Melo, P.L.A.; Cherubin, M.R.; Gomes, T.C.A.; Lisboa, I.P.; Satiro, L.S.; Cerri, C.E.P.; Siqueira-Neto, M. Straw Removal Effects on Sugarcane Root System and Stalk Yield. Agronomy 2020, 10, 1048. [Google Scholar] [CrossRef]
  75. Carvalho 2013 Carvalho, J.L.N.; Otto, R.; Franco, H.C.J.; Trivelin, P.C.O. Input of sugarcane post-harvest residues into the soil. Sci. Agric. 2013, 70, 336–344. [Google Scholar] [CrossRef]
  76. Landell, M.G.; Scarpari, M.S.; Xavier, M.A.; Anjos, I.A.; Baptista, A.S.; Aguiar, C.L.; Silva, D.N.; Bidóia, M.A.; Brancalião, S.R.; Bressiani, J.A.; et al. Residual biomass potential of commercial and pre-commercial sugarcane cultivars. Sci. Agric. 2013, 70, 299–304. [Google Scholar] [CrossRef]
  77. Menandro, L.M.S.; Cantarella, H.; Franco, H.C.J.; Kölln, O.T.; Pimenta, M.T.B.; Sanches, G.M.; Rabelo, S.C.; Carvalho, J.L.N. Comprehensive assessment of sugarcane straw: Implications for biomass and bioenergy production. Biofuels Bioprod. Bioref. 2017, 11, 488–504. [Google Scholar] [CrossRef]
  78. Bordonal, R.O.; Menandro, L.M.S.; Barbosa, L.C.; Lal, R.; Milori, D.M.B.P.; Kolln, O.T.; Franco, H.C.J.; Carvalho, J.L.N. Sugarcane yield and soil carbon response to straw removal in south-central Brazil. Geoderma 2018, 328, 79–90. [Google Scholar] [CrossRef]
  79. Castioni, G.A.F.; Cherubin, M.R.; Bordonal, R.D.O.; Barbosa, L.C.; Menandro, L.M.S.; Carvalho, J.L.N. Straw removal affects soil physical quality and sugarcane yield in Brazil. BioEnergy Res. 2019, 12, 789–800. [Google Scholar] [CrossRef]
  80. Castro, S.A.Q.; Otto, R.; Sánchez, C.E.B.; Tenelli, S.; Sermarini, R.A.; Trivelin, P.C.O. Sugarcane straw preservation results in limited immobilization and improves crop N-fertilizer recovery. Biomass Bioenergy 2021, 144, 105889. [Google Scholar] [CrossRef]
  81. Jane, S.A.; Fernandes, F.A.; Silva, E.M.; Muniz, J.A.; Fernandes, T.J.; Pimentel, G.V. Adjusting the growth curve of sugarcane varieties using nonlinear models. Ciência Rural 2020, 50, e20190408. [Google Scholar] [CrossRef]
  82. ANP—National Agency for Petroleum, Natural Gas and Biofuels. Renovacalc v7. 2022. Available online: https://www.gov.br/anp/pt-br/assuntos/renovabio/renovacalc (accessed on 14 December 2022).
  83. BRAZIL. RenovaBio. Proposta de Metas Compulsórias Anuais de Redução de Emissões na Comercialização de Combustíveis. Consulta Pública—Anexo da Nota Tecnica n 12/2018/DBIO/SPG. 2018. Available online: http://antigo.mme.gov.br/c/document_library/get_file?uuid=40d35ad0-582d-82e3-1de0-61979c5905ae&groupId=36224 (accessed on 4 November 2022).
  84. Hernandes, T.A.D.; Bordonal, R.O.; Duft, D.G.; Leal, M.R.L.V. Implications of regional agricultural land use dynamics and deforestation associated with sugarcane expansion for soil carbono stocks in Brazil. Reg. Environ. Chang. 2022, 22, 49. [Google Scholar] [CrossRef]
  85. Cherubin, M.R.; Carvalho, J.L.N.; Cerri, C.E.P.; Nogueira, L.A.H.; Souza, G.M.; Cantarella, H. Land use and management effects on sustainable sugarcane-derived bioenergy. Land 2021, 10, 72. [Google Scholar] [CrossRef]
  86. Rodrigues, R.R.; Gandolfi, S.; Nave, A.G.; Aronson, J.; Barreto, T.E.; Vidal, C.Y.; Brancalion, P.H.S. Large-scale ecological restoration of high-diversity tropical forests in SE Brazil. For. Ecol. Manag. 2011, 261, 1605–1613. [Google Scholar] [CrossRef]
  87. Hernandes, T.A.D.; Duft, D.G.; dos Santos Luciano, A.C.; Leal, M.R.L.V.; Cavalett, O. Identifying suitable areas for expanding sugarcane ethanol production in Brazil under conservation of environmentally relevant habitats. J. Clean. Prod. 2021, 292, 125318. [Google Scholar] [CrossRef]
  88. Walter, A.; Seabra, J.; Rocha, J.; Guarenghi, M.; Vieira, N.; Damame, D.; Santos, J.L. Spatially Explicit Assessment of Suitable Conditions for the Sustainable Production of Aviation Fuels in Brazil. Land 2021, 10, 705. [Google Scholar] [CrossRef]
  89. WRI. The GHG Protocol Land Sector and Removal Guidance (Draft for Pilot Testing and Review). 2022. Available online: Ghgprotocol.org/land-sector-and-removals-guidance (accessed on 3 September 2022).
  90. Strassburg, B.B.; Latawiec, A.E.; Barioni, L.G.; Nobre, C.A.; Da Silva, V.P.; Valentim, J.F.; Vianna, M.; Assad, E.D. When enough should be enough: Improving the use of current agricultural lands could meet production demands and spare natural habitats in Brazil. Glob. Environ. Chang. 2014, 28, 84–97. [Google Scholar] [CrossRef]
  91. Perillo, L.I.; de Oliveira Bordonal, R.; de Figueiredo, E.B.; Moitinho, M.R.; Aguiar, D.A.; Rudorff, B.F.; Panosso, A.R.; La Scala, N. Avoiding burning practice and its consequences on the greenhouse gas emission in sugarcane areas southern Brazil. Environ. Sci. Pollut. Res. 2022, 29, 719–730. [Google Scholar] [CrossRef]
  92. Capaz, R.S.; Carvalho, V.S.B.; Nogueira, L.A.H. Impact of mechanization and previous burning reduction on GHG emissions of sugarcane harvesting operations in Brazil. Appl. Energy 2013, 102, 220–228. [Google Scholar] [CrossRef]
  93. Cerri, C.C.; Feigl, B.J.; Galdos, M.V.; Bernoux, M.; Cerri, C.E.P. Carbon stock in soil and greenhouse gas flows in the sugarcane agro-system. In Sugarcane Bioethanol—R&D for Productivity and Sustainability; Cortez, L.A.B., Ed.; Edgard Blücher: São Paulo, Brazil, 2014; pp. 203–216. [Google Scholar]
  94. Marin, F.R.; Edreira, J.I.R.; Andrade, J.; Grassini, P. On-farm sugarcane yield and yield components as influenced by number of harvests. Field Crop Res. 2019, 240, 134–142. [Google Scholar] [CrossRef]
  95. Moore, P.H.; Botha, F.C. Sugarcane: Physiology, Biochemistry and Functional Biology; John Wiley & Sons: Oxford, UK, 2013. [Google Scholar]
  96. Balugani, E.; Sumfleth, B.; Majer, S.; Marazza, D.; Thrän, D. Bridging modeling and certification to evaluate Low-ILUC-Risk practices for biobased materials with a user-friendly tool. Sustainability 2022, 14, 2030. [Google Scholar] [CrossRef]
  97. Leland, A.; Hoekman, S.K.; Liu, X.V. Review of Modifications to Indirect Land Use Change Modeling and Resulting Carbon Intensity Values within the California Low Carbon Fuel Standard Regulations. J. Clean. Prod. 2018, 180, 698–707. [Google Scholar] [CrossRef]
  98. CARB. CA-GREET3.0 Model. Current Version: Effective 4 January 2019. 2019. Available online: https://ww2.arb.ca.gov/resources/documents/lcfs-life-cycle-analysis-models-and-documentation (accessed on 14 December 2022).
  99. ANP—National Agency for Petroleum, Natural Gas and Biofuels. Certificado da Produção Eficiente de Biocombustíveis. Available online: https://www.gov.br/anp/pt-br/assuntos/renovabio/certificados-producao-importacao-eficiente-biocombustiveis (accessed on 14 December 2022).
  100. Canabarro, N.I.; Silva-Ortiz, P.; Nogueira, L.A.H.; Cantarella, H.; Maciel-Filho, R.; Souza, G.M. Sustainability assessment of ethanol and biodiesel production in Argentina, Brazil, Colombia, and Guatemala. Renew. Sustain. Energy Rev. 2023, 171, 113019. [Google Scholar] [CrossRef]
  101. Walter, A.; Galdos, M.; Scarpare, F.; Leal, M.; Seabra, J. Brazilian sugarcane ethanol: Developments so far and challenges for the future. WIRES Energy Environ. 2014, 3, 70–92. [Google Scholar] [CrossRef]
Figure 1. Flowchart for diagnosing land use and estimating CO2 emissions due to LUC in CARs. Developed by the authors. Source: 1 Imaflora [42]; 2 MapBiomas—col. 6 [31]; 3 Garofalo et al. [10]; 4 Raizen [43].
Land 12 00584 g001
Figure 2. (a) Location of evaluated rural properties (CARs) and sugarcane area; (b) Brazilian regions and biomes, and (c) Distribution of the CARs by state in terms of area. Addressed states: São Paulo (SP), Minas Gerais (MG), Paraná (PR), Espírito Santo (ES), Mato Grosso (MT), Mato Grosso do Sul (MS), Goiás (GO), Amazonas (AM) and Tocantins (TO).
Land 12 00584 g002
Figure 3. Share (a) and area (b) of each land use and land cover class within the assessed rural properties (CARs) with sugarcane cultivation, in the years 2000, 2008, and 2020, in Brazil’s center-south and north regions.
Land 12 00584 g003
Figure 4. LUCs observed within the whole CARs area with sugarcane cultivation, in Brazil’s center–south and north regions, during the 2000–2020 and 2008–2020 periods. All detailed LUCs are presented in Supplementary Material S1.
Land 12 00584 g004
Figure 5. LUCs observed in areas of sugarcane cultivation during (a) 2000–2020 and (b) 2008–2020 periods in the main producing states. Sugarcane areas in the states of ES, TO, and AM are not shown as they contribute less than 0.2% of the total area of sugarcane in 2020. For details, see Tables S6 and S7.
Land 12 00584 g005
Figure 6. Area (a) and share (b) of pastures classified according to quality level within the sugarcane-producing CARs in the years 2000, 2008 and 2020. Location and shares (pie charts) of pasture area by quality levels are shown for years (c) 2000 and (d) 2020. Only pasture areas within the CARs are shown.
Land 12 00584 g006
Figure 7. Annual CO2 emission rates associated with LUC due to sugarcane, estimated in each parametrization in the center–south and north regions of Brazil and in the analyzed states, in the periods (a) 2000–2020 and (b) 2008–2020. The BRLUC 2.0 LUC emission rate data correspond to the default value for sugarcane all over Brazil, not just in the center–south, according to Garofalo et al. [10]. It is shown only for the period 2000–2020, as BRLUC data for 2008–2020 are not available.
Land 12 00584 g007
Figure 8. Estimated absolute annual CO2 emissions from LUCs associated with sugarcane cultivation estimated by each parametrization in the center–south and north regions of Brazil and in the analyzed states.
Land 12 00584 g008
Figure 9. Estimates of absolute annual emissions/removals, in MgCO2∙yr−1, due to all LUCs, in each parametrization, in the sugarcane producing CARs of the center–south and north regions of Brazil, during (a) 2000–2020 and (b) 2008–2020. The classes shown represent current land use and the emissions/removals associated with the conversion of LUC to the current land use. For example: during 2000–2020, all LUC that led to the current natural vegetation area (in green) resulted in a removal of −5.89 TgCO2∙yr−1 in parametrization A.
Land 12 00584 g009
Figure 10. Annual net emissions/removals rate per area (MgCO2∙ha−1∙yr−1) in parametrization D for each CAR in 2000–2020 due to the LUC that occurred within sugarcane-producing CARs.
Land 12 00584 g010
Figure 11. Total annual net emissions/removals (MgCO2∙yr−1) in parametrization D for each CAR in 2000–2020 due to (a) all LUC that occurred only within CARs and (b) the LUC that occurred only in sugarcane areas in 2020 within CARs.
Land 12 00584 g011
Table 1. MapBiomas class grouping and correspondence with BRLUC 2.0.
MapBiomas Classes—Col. 6BRLUC 2.0 ClassesAdopted Classes
1.1. Forest FormationUnspecified, naturalNatural Vegetation
1.2. Savanna FormationUnspecified, naturalNatural Vegetation
1.2. MangroveUnspecified, naturalNatural Vegetation
1.4. Wooded RestingaUnspecified, naturalNatural Vegetation
2.1. WetlandsUnspecified, naturalNatural Vegetation
2.2. GrasslandUnspecified, naturalNatural Vegetation
2.3. Salt FlatUnspecified, naturalNatural Vegetation
2.4. Rocky OutcropUnspecified, naturalOthers
2.5. Other non-Forest FormationsUnspecified, naturalNatural Vegetation
3.1. PasturePlanted pasturesPasture
3.2.1.1. SoybeanSoybeanTemporary Crop
3.2.1.2. SugarcaneArable, sugarcaneSugarcane
3.2.1.3. RiceTemporary cropTemporary Crop
3.2.1.4. Other temporary CropsTemporary cropTemporary Crop
3.2.2.1. CoffeePermanent cropsPerennial Crop
3.2.2.2. CitrusPermanent cropsPerennial Crop
3.2.2.3. Other Perennial CropPermanent cropsPerennial Crop
3.2. Forest PlantationForestryForest Plantation
3.4. Mosaic of Agriculture and Pasture-Mosaic
4.1. Beach, Dune and Sand Spot-Others
4.2. Urban Area-Others
4.3. Mining-Others
4.4. Other no-Vegetation Areas-Others
5.1. River, Lake and Ocean-Others
5.2. Aquaculture-Others
6. Not Observed-Others
Table 2. Sugarcane emission rate in each parametrization step for the center–south/north region of Brazil based on the LUC; the difference between rates; and the effects of each parametrization on the range of values from A to D.
PeriodSugarcane—Brazil’s Center–South/NorthEmission Rate (MgCO2∙ha−1∙yr−1)Difference with the Previous Parametrization 1Impact % on
Amplitude 3
2000–2020A: mod. deg. pasture0.26--
B: pasture quality−0.26−0.52 237% 4
C: mechanized harvest−0.50−0.2417%
D: biomass carbon stock−1.16−0.6646%
Amplitude between values from A to D−1.43100%
2008–2020A: mod. deg. pasture0.11--
B: pasture quality−0.09−0.2022%
C: mechanized harvest−0.48−0.3943%
D: biomass carbon stock−0.81−0.3235%
Amplitude between values from A to D−0.92100%
1 The difference is calculated by the amplitude between the parametrization’s values. For example, 2 the value −0.52 (parametrization B) corresponds to the difference between −0.26 (parametrization B) and 0.26 (parametrization A). 3 The impact % is calculated by the effects of each parametrization on the range of values from A to D. For example, 4 the value 37% corresponds to the relation between the difference −0.52 (parametrization B; fourth column) and the amplitude A—D (−1.43) in 2000–2020 period.
Table 3. CO2 emission/removals due to dLUC in sugarcane cultivation areas and within associated CARs from 2000 to 2020 and the resulting carbon footprint of ethanol associated with LUC. Data are shown for each parametrization.
ParametrizationABCD
Emission/removal carbon associated with all LUCs in the CARs (TgCO2)8.65−143.15−195.37−344.05
Emission/removal carbon exclusively associated with sugarcane LUC in the CARs (TgCO2)44.45−44.02−85.10−196.53
dLUC contribution to ethanol carbon footprint
(g CO2eq∙MJ−1)
2.53−2.51−4.85−11.21
Disclaimer/Publisher’s Note: The statements, opinions and data contained in all publications are solely those of the individual author(s) and contributor(s) and not of MDPI and/or the editor(s). MDPI and/or the editor(s) disclaim responsibility for any injury to people or property resulting from any ideas, methods, instructions or products referred to in the content.

