Article

Spatial Correlation between Urban Planning Patterns and Vulnerability to Flooding Risk: A Case Study in Murcia (Spain)

by
Salvador García-Ayllón
* and
Angela Franco
Department of Civil Engineering, Technical University of Cartagena, 30203 Cartagena, Spain
*
Author to whom correspondence should be addressed.
Land 2023, 12(3), 543; https://doi.org/10.3390/land12030543
Submission received: 28 January 2023 / Revised: 19 February 2023 / Accepted: 22 February 2023 / Published: 23 February 2023
(This article belongs to the Special Issue Spatial Planning and Land-Use Management)

Abstract

:
Cities in the Spanish Mediterranean regions have undergone an extensive process of urban growth in recent decades. This urban transformation has often failed to consider the variable of flooding in its planning. Such a situation, combined with the current meteorological changes derived from climate change phenomena that increasingly cause less frequent but more extreme rainfall events in this part of the planet, has caused a sharp increase in the vulnerability of many urban areas against flooding. This research aims to analyze, from a spatiotemporal approach, in the case study of Murcia, a Mediterranean city in southeastern Spain, the existing spatial statistical correlation between urban planning patterns of growth of the city and the increase in risk due to its current vulnerability to flooding. Using GIS-based multivariate indicators and geostatistical analysis, the behavior patterns of said correlation will be numerically evaluated, and possible future trends and scenarios for this problem will be raised.

1. Introduction

The need to plan the urban growth of cities, taking into account the natural risks associated with climate change, is a problem that is gaining increasing importance in the scientific field of urban planning [1]. In this context, flood risk analysis is a discipline that has traditionally been separated from research on urban planning since it is a problem that is univocally linked to the scientific field of hydrology and hydraulics [2,3]. However, the strong urban growth and population concentration that has occurred on the planet in the last 50 years (the United Nations Organization forecasts that almost 70% of the population will live in cities in the year 2050 [4]) requires rethinking that approach from a research point of view.
At the European level, the Spanish Mediterranean regions have been areas with the greatest urban growth in recent decades [5,6,7]. This growth has led to a major development of cities located in highly flood-prone environments, a variable that in the past has, on many occasions, not been considered, subsequently generating numerous problems in some cities today [8]. In this context, it should be noted that the problem of flooding is especially complex in urban environments, given the difficulty in reliably modeling the ground conditions [9]. In addition, these are environments in which the implementation of flood-rolling infrastructures is more complex, especially in large, low-density urbanized areas where the existing orography can limit the efficiency and profitability of these hydraulic infrastructures [10].
Currently, the increasing effect of climate change on the phenomena associated with torrential rains is forcing a rethink in those methodologies and approaches in this type of urban areas, where it is more rational to try to reduce vulnerability to flooding in urban planning sooner rather than having to undertake hydraulic lamination infrastructures later [10,11,12]. One of the locations where this change has been particularly virulent is in the Spanish Mediterranean basins. The appearance of the DANA (Spanish acronym for upper-level isolated atmospheric depression) phenomenon in those areas has replaced the traditional flash floods associated with cold fall phenomena [13]. In practice, a DANA is a weather phenomenon quite similar to a cold drop, although its intensity and effects are proving to be far more devastating. This has already prompted some researchers to begin to warn Europe about the growing phenomenon of “medicanes” [14,15,16]. These meteorological phenomena, named after the analogy in their effects with the usual hurricanes in the USA, are increasingly present every year in Mediterranean regions driven by climate change [17].
Mediterranean areas have traditionally been characterized by being subject to frequent floods, some of which are even historically quite relevant. However, during the last two decades, relevant flooding events and damage have increased exponentially (Figure 1). This phenomenon, which occurs in most of the Mediterranean basins, is likely influenced by the effects of climate change, as some recent studies have begun to alert [18,19]. Paradoxically, the existing predictions in the meteorological studies carried out in Mediterranean regions [20,21] show a global trend towards desertification in the area due to the annual loss of rainfall. This contrasts with a statistically rising value of maximum daily rainfall, detected and forecasted by Spanish authorities for recent years, which denotes a trend of increasing frequency and intensity for these extreme events (Figure 2).
This meteorological context, combined with the urban situation that has occurred in the cities of Spanish Mediterranean regions during the last three decades, has produced a dangerous cocktail in which the risk of flooding in all these urban areas has increased notably in a way that is hard to assess [24]. In addition, a relevant variable that scientific studies in this field do not normally take into account is the forecast of urban development of cities in areas concerned with the risk of flooding [8]. This problem is the result of the fundamentally hydraulic and hydrological approach to this type of research [25]. This issue, which shares many common approaches with the problem of seismic risk [26], has also recently begun to be studied from a more integrated perspective with urban planning. However, the most recent approaches have been fundamentally oriented, for example, towards analyses that have focused more on indicators of a socioeconomic nature [3] or in the search for environmental issues [27]. We can also find some analyses aimed at developing mitigation strategies for the problem of flooding in the context of climate change [28,29,30]. Nonetheless, these are concrete urban plans or frameworks of a palliative nature rather than sustained corrective actions in the field of urban planning.
It must not be forgotten that this situation is also a consequence, from a practical point of view, of the fact that urban planning instruments have habitually classified land as developable since long before flood risk assessment tools were sufficiently technologically accurate to assess the risks of existing urban planning from a holistic spatial perspective [2,31]. Thus, it is a problem that will entail a greater social impact and economic consequences in the coming years.
In this study, a new methodological approach is proposed to correlate, through spatial statistical analysis, the (past and future) urban growth patterns of cities with the risk of flooding. In this way, it seeks to demonstrate how the urban planning carried out in recent decades in many Mediterranean cities has failed to take into account the problem of flooding, which is now posing an important challenge for the future in this area of Europe due to climate change. In this context, for the case study of the city of Murcia, the urban development of the last 100 years and future areas classified as developable will be assessed, as well as what possible future scenarios may be. This will be carried out by means of a spatial trend analysis of current behaviors.
For this, a retrospective space-time analysis of multivariable GIS indicators related to different territorial anthropization phenomena will be used, which will later be statistically correlated with the evolution of the risk of flooding at a spatial level in the city. The different levels of statistical correlation of the indicators with the problem of current flooding will help us to determine which phenomena have most affected the current increase in the risk of flooding in the area.

2. Materials and Methods

2.1. Area of Study

The city of Murcia is in the southeast of Spain, and its metropolitan area has a population of over 600,000 inhabitants (the area under analysis in the case study is provided as Supplementary Information in a GIS file). Located on a large agricultural plain of more than 35,000 hectares called “Huerta de Murcia” (Figure 3), it is crossed by the Segura River, which in the past frequently overflowed during the rainy season.
It is a territory in which traditional agriculture has been deeply rooted since the time of the Muslim invasion of the Iberian Peninsula (8th to 14th centuries), which built a complex network of ditches that supplies water to the entire area. This sophisticated hydraulic infrastructure has allowed the city to live from agriculture for centuries, having been known as “the orchard of Europe”.
The city is subject to the traditional Mediterranean climate with little rainfall throughout the year (300 mm/year) but occasional torrential rains in autumn and winter that usually cause severe flooding in various zones of its urban area. To these boundary conditions, it must be added now that it is an environment with a fairly dispersed urban population whose built-up area has grown considerably in recent decades (Table 1).

2.2. GIS Indicators of Analysis of Urban Growth Patterns and Determination of Flood Zones

Based on the bibliographic review of certain publications on urban growth patterns in cities based on multivariate methods [32,33,34,35,36,37], the following GIS indicators for urban and territorial analysis have been selected, with some of them being adapted to the interest in the specific topic of spatial analysis of flooding to be studied. The indicators are:

2.2.1. Land “Artificialization” Rate (LAR)

The loss of natural land is the main example of urban sprawl transformation phenomena [38,39]. That transformation affects the intrinsic ability of a territory to mitigate the effects of a flood since it reduces its natural capacity to absorb water during a rainfall event. For the determination of this parameter, all the surfaces established as being artificial by the Information System on Land Occupation of Corine Land Cover 2018 (category 1 uses [40]) have been considered. Therefore, it is an indicator aimed at analyzing the phenomenon of soil sealing at a global level caused by urbanization processes.
Calculation Method: evaluation of land use changes according to European Corine Land Cover 2018 land uses and Inspire Directive criteria [41] for each reference sector. The higher the index value, the more “artificialized” the area is.
L A R = S n S t r
Sn = Land use changed to Corine Land Cover 2018 category 1 uses (m²)
Str = territorial surface in reference (m²)

2.2.2. Indicator of Infrastructural Anthropization (IFA)

One of the characteristics of soft anthropization in a territory is the development of fragmented configurations through linear elements that “unstructure” the natural landscape of a territory and fracture the homogeneity of plots [42]. These linear communication infrastructures, such as urban paths, roads and highways, can generate “dam micro-effects” altering the course of the water if they lack appropriate cross-drainage elements. In addition, the number of crossings that occur between this type of infrastructure must be taken into account since these areas are usually points of conflict from the point of view of local drainage. In that context, the increase in the density of construction for these elements and its configuration (more or less generator of crosses in its layout) may be a clear indicator of flood vulnerability because of the generation of unbalanced urban sprawl in metropolitan areas.
Calculation method: evaluation of the fragmentation of the territory through the density of paths and urban roads per square meter; the higher the index value, the more important the fragmentation is.
I F A = h i L i 2 S t r · c j l k
Li = length of existing linear infrastructures (m)
hi = weighting coefficient (highway = 1, normal road = 0.75, urban path = 0.5)
Str = territorial surface in reference (m²)
cj = number of crossings generated by linear infrastructures in a reference sector
lk = number of sections generated by the crossings in a reference sector

2.2.3. Indicator of Urban Fragmentation (UFI)

Fragmented urban structures are usually associated with mixed areas with dysfunctional plots where urban sprawl grows anarchically [43]. This type of growth is usually linked to a high degree of fragmentation of urban development, jeopardizing rural environments or agricultural spaces in the transition to urban areas. Therefore, certain links can be determined between the behavior of this parameter and the existence of unbalanced urban sprawl patterns in a territory. In addition, from the point of view of flood risk, it is possible that this type of fragmented urban fabric configurations, although they do not profoundly alter the traditional hydrographic network of a territory, may reduce its drainage effectiveness.
Calculation Method: fragmentation due to the increase in built-up areas. The evaluation of the fragmentation of the territory within urbanized areas creates a barrier; the higher the percentage of the index, the more important the fragmentation is.
U F I = L i L t r × S u i S t r
Li = maximum dimension of urban boundary (m),
Ltr = dimension of reference boundary (m)
Sui = Urbanized area (m²)
Str = territorial surface in reference (m²)

2.2.4. Index of City Compactness (ICC)

One reason that several authors attribute to the increased vulnerability of cities to flooding is the lack of compactness of the urbanized territory [44]. Urban and agricultural areas sometimes have a tendency for plot atomization as a result of the loss of traditional land uses in its periurban areas or the unbalanced urban sprawl phenomena, creating mixed areas quite vulnerable to flooding. As explained before, this problem usually leads to flood risk management problems due to the difficulty of implementing corrective measures through mitigation infrastructures that are economically profitable and efficient from the functional point of view in areas with such a dispersed population.
Calculation Method: the relationship between the perimeter of the different homogenous land uses and the surface of this area to the circle, which has the same surface area as the urban area in consideration. The higher the value is, the more compact and homogeneous the global urban structure of the city is understood to be.
I C C = n a 2 f i p i
af = area of a homogeneous urban subunit i of urban land use
pi = perimeter in reference to the global urban sector of analysis i
n = total number of urban subunits analyzed in the area of study

2.2.5. Index of Agricultural Transformation (IAT)

The transformation of the use of periurban agricultural land into mixed or low-density residential uses often has important connections with the loss of the natural or traditional hydrographic characteristics of the land. In this sense, this global index seeks to highlight transformation processes in non-urban and periurban areas associated with human actions (partial urbanization, the transformation of natural areas and the transformation of historical crops into irrigated or greenhouse crops, etc.). This indicator, unlike the LAR indicator, is not limited solely to the problem of the sealing effect of the soil since it involves not only urban transformations but also land use changes within agriculture. The latter are not always significant large-scale alterations or do not always affect the landscape of a territory but do involve distortions in the hydrological functioning of a territory.
Another aspect that may have some impact concerns the changes within the agricultural land regime itself, both due to its conversion from rainfed to irrigated land as well as the transformation of large estates into partially urbanized agricultural areas as a consequence of the atomization of the parcel structure. All these transformations are relevant to analyze because one of the purposes of the research is also to assess to what extent the destructuring of the semi-naturalized historical hydrographic network generated since the time of the Muslim occupation in the Iberian Peninsula in Spanish orchard areas has contributed to the current increase in the vulnerability of peri-urban areas to flooding.
Calculation Method: Natural areas or permanent crops transformed into arable land and non-irrigated crops transformed into different agricultural periurban areas for year i:
I A T = N A T i + N I C i S i
NATi = Natural areas transformed into arable land or permanent crops for a year i [Ha]. These changes are evaluated by comparison of two different years for sufficiently significant areas (agricultural crops of 1 Ha have been taken as the minimum units of evaluation), and crops are identified using criteria based on Van Vliet et al. [45].
NICi = agricultural land use relevant changes for a year i [Ha]. Those crops existing in the territory prior to 1950 have been considered traditional historical crops. To ensure that these are structural alterations of the periurban areas of a territory, the changes must be permanent and not situational, so annual milestones have been taken for at least 10 years.
Si = surface of the sector of study for a year i in the reference area of study [Ha].

2.2.6. Flood Zones Index (FZI)

Numerous categories of flood-prone areas are included in the Spanish regulations, depending on the level of risk of occurrence and hazard for the population. The delimitation of the flood zones is conducted by defining the so-called Significant Potential Flood Hazard Areas (SPFHAs). These areas are obtained from the Preliminary Flood Risk Assessment (hereinafter, PFRA) in accordance with Directive 2007/60 of the European Commission [46]. In this research, for the analysis of the flooding spatial data and metadata, the return period of 100 years from the Spanish National Flood Mapping System geoportal website [47] has been used. This value was chosen because it is the one which currently has more urban planning implications in the regulations to obtain subsequent urbanization authorizations.
One of the usual main limitations of this official spatial data system published openly by the Spanish authorities is the limitation to realistically model the behavior of water flow in highly anthropized urban areas (the difficulties to adequately represent all the artificial elements that influence the characteristics of the flow in the hydraulic model, and the computational limitations derived from a large amount of processed data sometimes cause the flood results to differ from the model forecasts). The competent bodies need to update these flood maps every six years to adapt them to technological advances and to the statistical variations of the historical series.
These flood risk analysis maps, although they represent an important step forward in the management of this problem at the spatial level, are not easy to interpret since they lack a numerical or conceptual analysis to be transferred to the urban planning policies of the cities’ masterplans. Therefore, although they represent an interesting source of information, it is spatial information that is currently scarcely exploited from the point of view of urban planning research. In this context, the approach proposed in the present research may be of great interest to better understand how to update these maps, as well as to improve city planning.

2.3. Geostatistical Analysis

To assess the level of spatial correlation between the different GIS parameters described in the previous sections, a geostatistical evaluation will be carried out using ArcGIS Pro 10.5.0 (ESRI Corporation, Redlands, CA, USA) and GvSIG Desktop 2.5.1 (GvSIG Association, Valencia, Spain) software. This analysis will enable us to understand numerically the relationship between the spatial distribution of the urban growth patterns in the city of Murcia and the mapping of the risk of flooding existing in the territory of its metropolitan area from a spatial perspective.
To carry out this task, both georeferenced local historical cartography, as well as the spatial database of the Cadastre, with temporary metadata available from the Ministry of Finance of Spain, will be used. Historical cartography is available for the following years (1929, 1945, 1956, 1967, 1972, 1981, 1990, 1995, 1999 and 2001–2019) with differing levels of resolution; these are detailed in Table 2.
To implement the analysis of the spatial statistical correlation between urban growth patterns and flooding parameters, it will be necessary to discretize the territory into a finite number of parts of the study area. For this, homogeneous orographic-urban spatial units (HOUU) will be generated, whose implementation methodology will be detailed in the results section. This analysis will allow us to assess the extent to which the urban transformation patterns of the city of Murcia have influenced the current vulnerability to flooding of its metropolitan area. The spatial relationships of these units will be parameterized and assessed using Global Moran’s I [48] and Anselin Local Moran’s I [49] bivariate statistics (both are geoprocessing tools from ArcGIS software).
These indicators enable us to evaluate the statistical correlation of a set of geolocated data obtained spatially and to know whether the sign of this autocorrelation is positive or negative. The bivariate Global Moran’s I statistic formula is given as I (6):
I = n S 0 i = 1 n j = 1 n w i , j z i z j i = 1 n z i 2
where z i is the deviation of an attribute for feature i from its mean x i X ¯ ,   w i , j is the spatial weight between feature i and j , n is equal to the total number of features and S 0 is the aggregate of all the spatial weights of (6):
S 0 = i = 1 n j = 1 n w i , j
The z I -score for the statistic is computed as in (8):
z I = I E I V I
where E I and V I can be calculated as follows:
E I = 1 / n 1  
V I = E I 2 E I 2
This autocorrelation statistic returns three types of values: the Moran’s I Index, the z-score and the p-value. Given a series of spatial features and an associated attribute, the bivariate Global Moran’s I statistic indicates whether the pattern of behavior for this feature is spatially clustered, dispersed, or random and its numerical degree of statistical correlation. When the z-score or p-value indicates statistical significance, a positive Moran’s I index value indicates a trend toward clustering, whilst a negative Moran’s I index value indicates a trend toward dispersion. The z-score and p-value are measures of statistical significance that provide us with information about whether to reject a null hypothesis of the statistical calculation. For this analysis, the null hypothesis states that the values associated with the spatial distribution of urban growth diagnosis indicators and flood risk mapping have no statistical correlation.
From this information, we can even implement, in a geolocated way, hot and cold spots in the mapping through the Local Indicators of Spatial Association (LISA) from Anselin [49] through Getis-Ord Gi* geoprocessing from ArcGIS. Each Anselin Local Moran’s I statistic of spatial association I is given as:
I i = x i X ¯ S i 2 j = 1 , j = i n w i , j x j X ¯
where x i is an attribute for feature i , X ¯ is the mean of the corresponding attribute, w i , j is the spatial weight between features i and j , and:
S i 2 = j = 1 , j = i n x j X ¯ 2 n 1
with n equating to the total number of features. The z I -score for the statistic is computed as:
z I = I E I V I i
where E I and V I can be calculated as follows:
E I = j = 1 , j = i n w i , j n 1
V I = E I 2 E I i 2
When these parameters are calculated, the null hypothesis means that the correlation values of two features are randomly distributed. Therefore, the strong intensity of the clustering of these values is represented by a high (or low) z-score. In this sense, we have three possible scenarios: a z-score near zero that implies no apparent clustering, a positive z-score denoting clustering of high values, or a negative z-score indicating clustering of low values. Thus, a bivariate statistical correlation assessment between the distribution of urban GIS indicators and flood mapping can help us to understand the relationship that exists between urban growth patterns and flooding. Consequently, the spatial distributions of the multivariate spatiotemporal indicators that analyze past urban growth patterns and future urban planning trends in the city and the evolution of the distribution of the risk of flooding determined by authorities in the territory of the metropolitan area of Murcia will be statistically correlated to reveal the most important phenomena in the problem studied.

3. Results

Based on the methodological framework described in the previous section, the relationship between urban growth patterns in the city of Murcia and the increase in flood risk in its territory will be analyzed. In the first place, how these growth patterns of the metropolitan area have evolved will be analyzed through the GIS indicators proposed using a retrospective spatiotemporal approach. Secondly, the urban structure will be analyzed from a spatial point of view in the context of the risk of flooding in the study area, generating discrete homogeneous orographic-urban units (HOUU) for subsequent analysis of spatial correlation. Thirdly, from a numerical point of view, the statistical correlation existing between the spatial distribution of the GIS indicators of analysis of the urban growth patterns of the city and the distribution of the current indicator of flood risk will be evaluated.

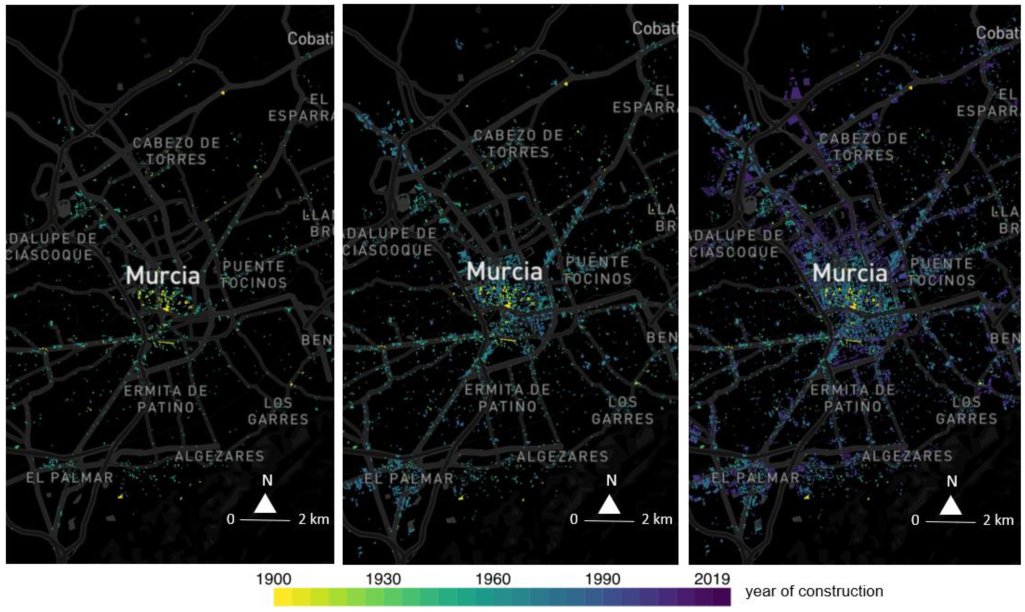
3.1. Analysis of Spatial Patterns of Urban Growth in the City of Murcia

To carry out the analysis of urban growth patterns in the city of Murcia during the last century with a spatial-temporal approach, the database of the General Directorate for Cadastre of the Ministry of Finance of the Government of Spain has been used. This database, although not fully representative of all the data since the dates that appear correspond to rehabilitations of buildings (not to their first construction) on some occasions, is very reliable from the statistical point of view since that proportion of cases is numerically very low with respect to the total volume of data. Therefore, a spatial database is available with the construction dates of all the buildings in the Murcia metropolitan area over the last 120 years (see Figure 4).
If we analyze these spatial patterns on a larger scale, covering the entire metropolitan area of Murcia, we can observe how the development of linear transport infrastructures has greatly conditioned the urban growth of the city (Figure 5). At a general level, urban development has largely followed the layout of several of the main communication infrastructures of the city, such as the road that connects with Madrid in the north, the road to Alicante in the northeast, the Alcantarilla road to the west, or the Cartagena highway to the south. These linear infrastructures can also have the opposite effect. As can be observed with the railway line that crosses the southern part of the city horizontally from east to west, it has generated a “barrier effect” favoring greater urban development in the northern area compared to the southern area in recent decades.
This phenomenon of urban structuration of the city through the fragmentation generated by the infrastructures can be observed graphically and numerically in the evolution of the IFA parameter in Table 3. Another phenomenon that can also be seen from this table is the recently increased transformation of urbanized land. This is clearly seen in the early 20th century, in which yellow and green values are proportionally much smaller than the late 20th century bluish and dark values. This trend is verified at a numerical level in the table through the evolution of the LAR parameter.
We can also observe how, at a general level, the metropolitan area presents increasingly greater dispersion patterns over time (yellow and green colors present a higher level of spatial grouping compared to the more bluish and darker colors that show further distance, with no specific structural pattern). This hypothesis is corroborated numerically when we observe the numerical evolution of the ICC compactness values and the UFI urban fragmentation value.
It is interesting to observe the contrast between the behavior of the city compactness index ICC and that of the urban fragmentation index UFI. The compactness index has increased progressively in recent decades after an initial decrease, which should theoretically indicate a higher level of compactness of the built-up structure. However, the fragmentation index clearly shows an increasing trend right from the start, which underscores a rather scattered pattern of growth. This possibly shows that the compactness index is too rudimentary to analyze the behavior patterns of urban growth since possibly its increasing value is not due to greater urban compactness but rather to a higher aggregated level of saturation as there is more and more urbanized surface. The higher level of analytical sophistication of the formulation of the urban fragmentation index, therefore, confirms that the urbanization process is increasingly dispersed, thereby giving this indicator a higher level of reliability.
Finally, we can indirectly infer, with the IAT parameter, how the transformation of agricultural land use has evolved in favor of urban land. This can be easily verified numerically by comparing its evolution with that of the LAR parameter, which only analyzes the transformation of the land due to urbanization processes. The initial decoupling of almost 50% between the two values has progressively diminished until they have become practically similar in recent years due to the growing weight of urbanization processes in the orchard as opposed to simple changes in agricultural land use.

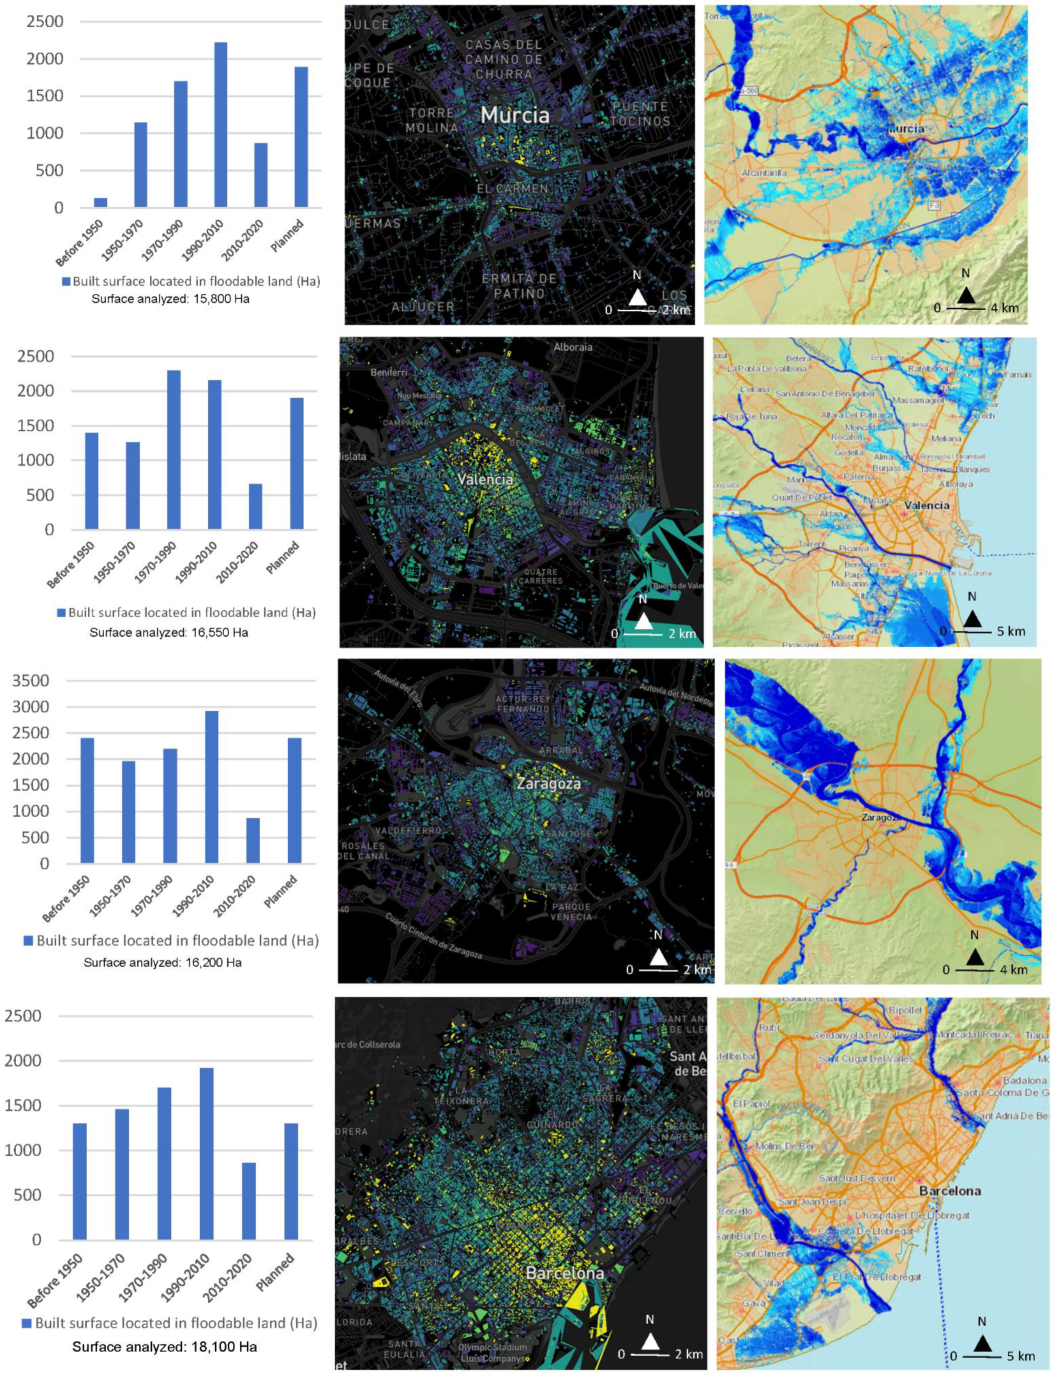
3.2. Implementation of the Flood-Urban Growth Correlation Model

As described in the methodology section, Flood risk maps for a 100-year return period from the National Flood Zone Cartography System [47] have been used to incorporate the flooding variable into the analysis of urban growth patterns in the city of Murcia. In this section, metadata, including information on two issues, have been incorporated into the spatial analysis model. On the one hand, the floodplain with risk for the population of urban areas has been included for the said return period. On the other hand, information on the level of drafts and speed of the water has been incorporated, taking into account the orography and contour conditions of the terrain to prioritize the level of said danger (see Figure 6).
If we evaluate the buildings in the city of Murcia located in flood-prone areas according to the criteria established in the previous section, we can see that such construction has been mainly carried out in recent decades. In addition, there is currently a large amount of land classified as developable located in currently floodable areas that are earmarked for new construction in the coming years (Figure 7). Another relevant issue to observe is that, during the last decade, there has not been a large amount of building in these flood-prone areas, which may be connected to the greater number of restrictions due to the improvement of the diagnosis of this problem. However, it is quite possible that this question is more related to the economic crisis that notably hit the real estate sector in Spain during this period, as can be verified by the existing drop in the urbanized area globally in Murcia during that decade (see Table 1).
In any case, in light of these data, it is evident that it is important to incorporate the variable of flooding into the urban planning of the city to improve this planning. However, this approach is not easy to integrate since the effect of existing buildings in each case is not known, nor how current urban forecasts may affect this in the future. Consequently, the common procedure is usually to demand that specific flooding studies are carried out for the development of each individual urban planning sector likely to be affected by flooding in the master plan. However, this procedure is increasingly controversial in many cases since it involves private land developers undertaking heavy investments in flood mitigation infrastructure, which generates conflicts that we shall address later in the scientific discussion section. In this case study, to more accurately assess how the city’s growth patterns have affected the current flood risk in recent decades, the spatial distributions between the analysis indicators of the city’s urban growth and the current distribution of floodable areas will be statistically correlated.
To achieve this, the analysis areas need to be discretized into a finite number of sectors. These sectors, called homogeneous orographic-urban units (HOUU), will be spatially established from the weighted intersection of internal orographic sub-basins of the main basin corresponding to the Huerta de Murcia and sectors of homogeneous urban land use included in the masterplan of the metropolitan city area (Figure 8). The numerical diagnosis of how each of the variables analyzed with the indicators has affected these sectors will provide us with more precise knowledge regarding the level of interaction between these variables. This will help us to improve future urban planning by taking a priori planning actions to design greater resilience to the problem of flooding instead of referring said problem to subsequent actions related to the execution of the urbanization.

3.3. Geostatistical Analysis of the Spatial Correlation between Indicators

Based on the model described in the previous sections, the level of statistical correlation between the current spatial distributions of the growth patterns indicators for the city of Murcia corresponding to each of the homogeneous orographic-urban units (HOUU) of its urban metropolitan area and the indicator of flood risk in each one of these units has been calculated (Table 4). As indicated in the methodology section, the risk of flooding has been carried out following the distributions of the GIS maps of the National Mapping System for flood-prone areas of Spain [47].
These maps, made by the Spanish Ministry of Ecological Transition, are updated every six years to incorporate technological innovations that improve the model’s accuracy and take into account the statistical variations of the historical series. Therefore, two spatial data series are available for the FZI flood risk indicator generated by official bodies since the approval in 2007 of the European flood risk management directives [46]: the first one was carried out during the period 2007–2013, whilst the second one was carried out during the period 2013–2020.
The results obtained numerically corroborate several of the issues that had been observed conceptually from a spatial point of view. There is a clear positive correlation between the LAR indicator related to land urbanization, but this correlation is even greater when said urbanization presents high levels of urban fragmentation shown for UFI. This can be verified since there is also a clear negative correlation with the level of compactness ICC (that is to say, the higher the compactness, the lower the risk of flooding), given that the urban structure of the metropolitan area of Murcia presents a very dispersed configuration. In the fragmentation caused by linear communication infrastructures, IFA also shows stronger values than LAR, which denotes that it is a determining parameter within the phenomenon as a whole.
Another interesting issue is the comparison between the values of the first period 2007–2013 of the flood risk indicator and those corresponding to the second period 2013–2020. As can be seen, all the values in the former case are higher than in the latter. This denotes an implicit increase in the risk of flooding since the values of the indicators associated with the urban growth patterns of the city have not increased (as verified in the first subsection of the results). The values of AIC and R2adj corroborate this hypothesis since they present comparatively higher values than those of the other GIS indicators, showing their higher ability to explain the phenomenon as a model variable.
Two factors may be responsible for this situation. On the one hand, it may be due to a higher level of precision of the flood analysis tools in this second period, when a greater risk was quantified in the area than had initially been diagnosed. On the other hand, the statistical series of precipitation are increasingly frequent and of greater intensity as a consequence of climate change. Both phenomena are probably partially to blame in this matter, so this issue will be addressed in greater detail in the scientific discussion section.

4. Discussion

The research carried out has highlighted a problem that, although in this case it has been analyzed specifically for the city of Murcia, could be clearly generalizable to many other cities in Spain and almost certainly to the European Mediterranean arc [50,51]. These are regions that have traditionally had a strong urban development in their cities, both as a consequence of phenomena associated with tourism and economic growth, as well as by the simple vegetative growth of the population. In the case of Spain, the urban planning of most of the cities of the Mediterranean zone underwent a major expansion during the decades of the 1980s, 1990s and 2000s as a result of real estate bubbles. This pushed the urban planning departments in many cities to classify a lot of land as developable at a time when flood risk diagnostic tools did not have the level of sophistication and accuracy available today.
In the last decade, thanks to the technological development of tools based on geographic information systems, it has been possible to catalog the risk of flooding with greater accuracy from the point of view of spatial evaluation. This technological improvement has also been accompanied by a legislative drive at the European level thanks to the approval of Directive 2007/60/EC on flood risk assessment and management, which has been transposed in subsequent years to all European Union countries [46]. In the case of Spain, this has allowed the development in recent years of numerous national regulations on land use limitations due to flood risks, with an approach linked to the spatial planning of the territory.
However, those in charge of executing urban planning and its subsequent urbanization processes are not state agencies but city councils. In this regard, we are currently in a situation in which a major part of the urban planning of cities has already been approved for many years, as the economic crisis of 2008 slowed down the real estate development of many cities in Spain and Europe [52]. With the economic recovery of recent years, we have found thus ourselves in a context in which greater knowledge of the risk of flooding in cities is combined from the spatial point of view with the existence of numerous constructions and buildings developed in the last decades located in flood-prone areas. This problem regarding flooding is, moreover, of a growing nature in these areas of the Mediterranean arc, where the phenomenon of climate change produces more and more frequent and intense torrential rainfall [53]. This phenomenon will therefore require national authorities to periodically reconsider the statistical return periods associated with the risk of flooding in cities.
To add further controversy to the situation, this complex situation is compounded by the existence of large pockets of developable land now located in areas determined to be at risk of flooding in the various urban plans of the cities that, with the current economic recovery, may be developed in the coming years. These are areas in which landowners have already legally consolidated their right to build, and so public administrations must manage that difficult situation. Nowadays, municipal authorities often have to choose between legally litigating with those owners to oblige them to make large private investments in flood mitigation infrastructures in order to authorize the execution of development. Otherwise, they face having to subsequently carry out important public investments in hydraulic infrastructures for the rolling of avenues to avoid unsafe situations. Given the low socioeconomic profitability in the case of low-density areas, these investments are also, in some cases, politically controversial.
This complex combination of events can currently be found in numerous cities throughout Spain, and the rest of the European Mediterranean arc [13,51] and will arise more and more often in the coming decades. In this context, it is advisable to try to avoid a priori the greatest number of future flooding problems in the general urban planning of cities instead of referring them to the evaluation of subsequent specific studies of each of the sectors to locally authorize their development. In this sense, the investigative approach adopted in this study using geostatistical analysis to parameterize the extent to which urban planning can pose an added risk to the current vulnerability to flooding of a city may be quite interesting in diagnosing future problems. This approach makes it possible not only to determine to what extent a city’s growth patterns have contributed to increasing its vulnerability to flood risks but also enables future scenarios based on current urban planning forecasts to be estimated.
In the specific case of the city of Murcia, through the geostatistical analysis carried out, we have been able to observe how the patterns of urban transformation of the city have significantly contributed to increasing its vulnerability to flooding. The Huerta de Murcia area had a natural hydrographic network whose orography and territorial structure allowed the floods that occurred due to torrential rains from cold drop phenomena to be laminated quite efficiently. This natural structure has been disappearing as a consequence of the intense urbanization process that the city has experienced in the last five decades. Although this phenomenon can be found in other places in the world [10,11,54], it presents certain interesting local nuances here.
The process has developed fundamentally in two ways. On the one hand, the continuous transformation of the periurban territory of the municipality from orchards into low-density urbanized land has generated a global phenomenon of soil sealing, significantly reducing the absorption capacity of this territory against floods. In this sense, it can be said that the traditional territory of the Huerta de Murcia has gradually become a residential structure of the “garden city” type (Figure 9). On the other hand, this process of transforming the territory by replacing orchard paths and nature trails with roads has completely modified the natural and traditional hydrographic structure of the basin that had covered the metropolitan area of the city of Murcia for centuries (Figure 10). A new artificial configuration has been created with multiple sub-basins generating “micro-dam effects” because of these linear infrastructures. According to that observed in the statistical numerical analysis, this has resulted in contributing to a notable increase in the risk of flooding in the city.
If we spatially project the current urban growth patterns identified in the city into the future, this problem, far from being mitigated or stabilized, will grow in the coming years. This will be caused both by the current forecast of urban development of different “conflictive pockets of land” classified as developable in the master plan of the municipality (Figure 11), as well as by the aforementioned effects of climate change on rainfall in these Mediterranean areas. Consequently, it can be concluded that there is a dangerous general trend in the current urban growth patterns to accentuate flood risks that occur in this metropolitan area, therefore requiring a rethinking of urban planning that takes the issues of flooding more into account.
The case study analyzed is quite paradigmatic but is not exclusive to the city of Murcia (Barriendos et al., 2019; Delgado-Artés et al., 2022). If we evaluate the data on land transformation and urbanization in recent decades for other cities in the Spanish Mediterranean arc, it can be confirmed that orchard areas are usually in regression. In metropolitan areas with size and periurban contour conditions similar to those of Murcia, such as Valencia, Zaragoza, or Barcelona, we can observe similar patterns of behavior from the point of view of the temporal evolution of the urbanization of the city over the last decades. This situation is combined with the growing consolidation of a significant risk of flooding in the areas surrounding the urban areas of these cities, and it can also be encountered on a smaller scale in many other middle-sized Spanish Mediterranean urban areas such as Figueres, Roses, Blanes, Castellon, Alzira, Jávea, Castellón, Cartagena, Lorca, Los Alcazares, etc.
In the case of Barcelona and Valencia, for example, the peri-urban growth in the north and south of the cities is currently strongly conditioned by the risk of flooding in the old orchard areas. In the case of Zaragoza, the dispersed urban growth of the city to the east and west, following the course of the river on the old agricultural areas that were cultivated on its banks, is also strongly conditioned by the current controversy of the risk of flooding. These issues are verified from the numerical point of view of the generation of urbanized or planned land as developable in their urban masterplans (Figure 12).
In addition, this problem is not exclusive to the European Mediterranean area. It is a phenomenon that, with different local nuances, is beginning to have an increasing impact in several cities all over the planet. We can find specific problems in urban areas that have grown very fast in developed countries in recent decades, such as Seoul [55], or derived from suburbanization phenomena in cities of developing countries, such as Rio de Janeiro [56]. The enormous casuistry existing in this matter is nothing more than a sample of the need for greater integration of flood risk analysis in master plans and large-scale urban planning instruments for cities.
In this sense, the methodological framework proposed can be very useful to diagnose and therefore introduce improvements in the urban planning of cities a priori at the time of its update instead of waiting for the generation of specific studies when a specific sector of the city masterplan is to be developed. Even so, it must be assumed that the method proposed still poses numerous limitations due to its fundamentally prospective nature. In this sense, the analysis carried out must be strengthened through its implementation in other case studies to verify its correct functioning. It should also be perfected in future lines of research. Given its initiatory nature, the approach may have left aside other variables whose inclusion could help the model to become more reliable and robust in other cases that present different boundary conditions. Finally, at the level of policy implications, once the model has been developed in a more sophisticated way, it would be interesting for it to be capable of helping at the spatial level in a segmented way rather than in an aggregated one as has been proposed in this research. It would be a real advance in the matter to develop a more robust graphic design tool with greater computing capacity that would be capable of integrating flooding analysis and urban planning, transferring results in a localized manner for each of the city’s urban planned sectors. This would enable what is currently a simple scientific investigation to become a true graphic tool in order to help to design the urban planning of cities.

5. Conclusions

The incorporation of flood risk as a design variable in urban planning is a challenge for the future of cities in the 21st century. The great growth of urbanized areas in most regions around the world, together with the meteorological changes caused by climate change, make it increasingly necessary to consider the impact of urban growth patterns in the study of flood risk in a city. In this field, the proposed analysis framework raises a new and innovative methodological approach that integrates urban growth patterns with traditional elements of flood risk analysis to improve future city planning. This approach makes it possible to numerically quantify from a spatial point of view interaction phenomena that until now had been applied from a more conceptual perspective.
Using this innovative approach, the Spanish city of Murcia and its metropolitan area have been analyzed from a retrospective spatiotemporal point of view. The results obtained for this case study show that the increase in variables such as urban fragmentation or the transformation of the traditional agricultural hydrographic network caused by linear infrastructures can be even more negative from the point of view of vulnerability to flooding than the simple soil sealing effect caused by land use transformation. The diagnosis of future problems is also particularly interesting, given that the current urban inertia combined with a large amount of land planned as developable in the master plan and located in potentially floodable areas will generate a greater scenario of conflict and risk for safety in the coming decades.
Even so, this is an initial proposal that addresses in an aggregate way this increasingly important problem in the urban areas of the Mediterranean arc due to climate change. Therefore, it should be further developed in greater depth through future lines of research to address, in more varied cases and with greater precision, the two-dimensional relationships between each of the urban planning variables and the future risk of flooding.

Supplementary Materials

A GIS file of the area of study can be downloaded at: www.mdpi.com/article/10.3390/land12030543/s1.

Author Contributions

Conceptualization, S.G.-A.; methodology, S.G.-A.; software, S.G.-A. and A.F.; validation, S.G.-A.; formal analysis, S.G.-A.; investigation, S.G.-A. and A.F.; resources, S.G.-A. and A.F.; data curation, S.G.-A. and A.F.; writing S.G.-A. and A.F. All authors have read and agreed to the published version of the manuscript.

Funding

This research received no external funding.

Institutional Review Board Statement

Not applicable.

Informed Consent Statement

Not applicable.

Data Availability Statement

Not applicable.

Acknowledgments

The authors thank for their help all public bodies and municipal, regional and state administrations that have provided data or information to carry out this work.

Conflicts of Interest

The authors declare no conflict of interest.

References

  1. Cremen, G.; Galasso, C.; McCloskey, J.; Barcena, A.; Creed, M.; Filippi, M.E.; Gentile, R.; Jenkins, L.T.; Kalaycioglu, M.; Mentese, E.Y.; et al. A state-of-the-art decision-support environment for risk-sensitive and pro-poor urban planning and design in tomorrow’s cities. Int. J. Disaster Risk Reduct. 2022, 85, 103400. [Google Scholar] [CrossRef]
  2. Garcia-Ayllon, S. Long-term GIS analysis of seaside impacts associated to infrastructures and urbanization and spatial correlation with coastal vulnerability in a Mediterranean area. Water 2018, 10, 1642. [Google Scholar] [CrossRef] [Green Version]
  3. Palacio-Aponte, A.G.; Ortíz-Rodríguez, A.J.; Sandoval-Solis, S. Methodological framework for territorial planning of urban areas: Analysis of socio-economic vulnerability and risk associated with flash flood hazards. Appl. Geogr. 2022, 149, 102809. [Google Scholar] [CrossRef]
  4. United Nations. World Cities Report 2022: Envisaging the Future of Cities; UNDRR: New York, NY, USA, 2022; ISBN 978-92-1-132894-3. [Google Scholar]
  5. Delgado-Artés, R.; Garófano-Gómez, V.; Oliver-Villanueva, J.-V.; Rojas-Briales, E. Land use/cover change analysis in the Mediterranean region: A regional case study of forest evolution in Castelló (Spain) over 50 years. Land Use Policy 2022, 114, 105967. [Google Scholar] [CrossRef]
  6. Taltavull de La Paz, P.; Pérez Sánchez, R.; Juárez Tárraga, F.; Norman Mora, E.; Su, Z. Synchronisation among short-term rental markets, co-movements and cycles in 39 European cities. Cities 2023, 134, 104148. [Google Scholar] [CrossRef]
  7. Gyourko, J.; Saiz, A. Reinvestment in the housing stock: The role of construction costs and the supply side. J. Urban. Econ. 2004, 55, 238–256. [Google Scholar] [CrossRef]
  8. Gil-Guirado, S.; Pérez-Morales, A.; Pino, D.; Peña, J.C.; Martínez, F.L. Flood impact on the spanish mediterranean coast since 1960 based on the prevailing synoptic patterns. Sci. Total Environ. 2022, 807, 150777. [Google Scholar] [CrossRef]
  9. Huang, H.; Liao, W.; Lei, X.; Wang, C.; Cai, Z.; Wang, H. An urban DEM reconstruction method based on multisource data fusion for urban pluvial flooding simulation. J. Hydrol. 2023, 617, 128825. [Google Scholar] [CrossRef]
  10. Ju, Y.; Lindbergh, S.; He, Y.; Radke, J. Climate-related uncertainties in urban exposure to sea level rise and storm surge flooding: A multi-temporal and multi-scenario analysis. Cities 2019, 92, 230–246. [Google Scholar] [CrossRef]
  11. Leandro, J.; Chen, K.-F.; Wood, R.R.; Ludwig, R. A scalable flood-resilience-index for measuring climate change adaptation: Munich city. Water Res. 2020, 173, 115502. [Google Scholar] [CrossRef]
  12. Cannon, C.; Gotham, K.F.; Lauve-Moon, K.; Powers, B. The climate change double whammy: Flood damage and the determinants of flood insurance coverage, the case of Post-Katrina New Orleans. Clim. Risk Manag. 2020, 27, 100210. [Google Scholar] [CrossRef]
  13. Pytharoulis, I. Analysis of a Mediterranean tropical-like cyclone and its sensitivity to the sea surface temperatures. Atmos. Res. 2018, 208, 167–179. [Google Scholar] [CrossRef]
  14. Romera, R.; Gaertner, M.Á.; Sánchez, E.; Domínguez, M.; González-Alemán, J.J.; Miglietta, M.M. Climate change projections of Medicanes with a large multi-model ensemble of regional climate models. Glob. Planet Change 2017, 151, 134–143. [Google Scholar] [CrossRef]
  15. Tous, M.; Romero, R.; Ramis, C. Surface heat fluxes influence on Medicane trajectories and intensification. Atmos. Res. 2013, 123, 400–411. [Google Scholar] [CrossRef]
  16. Ródenas, J.L.; García-Ayllón, S.; Tomás, A. Estimation of the buildings seismic vulnerability: A methodological proposal for planning ante-earthquake scenarios in urban areas. Appl. Sci. 2018, 8, 1208. [Google Scholar] [CrossRef] [Green Version]
  17. Nastos, P.T.; Karavana Papadimou, K.; Matsangouras, I.T. Mediterranean tropical-like cyclones: Impacts and composite daily means and anomalies of synoptic patterns. Atmos. Res. 2018, 208, 156–166. [Google Scholar] [CrossRef]
  18. García-Ayllón, S. Retro-diagnosis methodology for land consumption analysis towards sustainable future scenarios: Application to a Mediterranean Coastal Area. J. Clean. Prod. 2018, 195, 1408–1421. [Google Scholar] [CrossRef]
  19. Pastor, F.; Valiente, J.A.; Palau, J.L. Sea surface temperature in the Mediterranean: Trends and spatial patterns (1982–2016). Pure Appl. Geophys. 2018, 175, 4017–4029. [Google Scholar] [CrossRef] [Green Version]
  20. Oria, P. Análisis de la Precipitación en Días Muy Húmedos Sobre la Región de Murcia (1969–2018); Report of the Spanish National Meteorological Agency; AEMET: Madrid, Spain, 2020. [Google Scholar]
  21. Nuñez, J.A. Época y Posición de la Depresión Aislada en Niveles Altos; Report of the Spanish National Meteorological Agency; AEMET: Madrid, Spain, 2018. [Google Scholar]
  22. Consorcio de Compensación de Seguros. Las Depresiones Aisladas en Niveles Altos (DANA): Su Naturaleza y Sus Efectos; Access to some reports and expert opinions of the Ministry of Economy of Spain; AEMET: Madrid, Spain, 2018. [Google Scholar]
  23. AEMET. Informe Meteorologico Región de Murcia Septiembre 2019; Report of the Spanish National Meteorological Agency; AEMET: Madrid, Spain, 2019. [Google Scholar]
  24. Garcia-Ayllon, S.; Radke, J. Geostatistical analysis of the spatial correlation between territorial anthropization and flooding vulnerability: Application to the DANA phenomenon in a Mediterranean watershed. Appl. Sci. 2021, 11, 809. [Google Scholar] [CrossRef]
  25. Barriendos, M.; Gil-Guirado, S.; Pino, D.; Tuset, J.; Pérez-Morales, A.; Alberola, A.; Costa, J.; Balasch, J.C.; Castelltort, X.; Mazón, J.; et al. Climatic and social factors behind the Spanish Mediterranean flood event chronologies from documentary sources (14th–20th centuries). Glob. Planet Change 2019, 182, 102997. [Google Scholar] [CrossRef]
  26. Kodag, S.; Mani, S.K.; Balamurugan, G.; Bera, S. Earthquake and flood resilience through spatial planning in the complex urban system. Prog. Disaster Sci. 2022, 14, 100219. [Google Scholar] [CrossRef]
  27. Pacetti, T.; Cioli, S.; Castelli, G.; Bresci, E.; Pampaloni, M.; Pileggi, T.; Caporali, E. Planning nature based solutions against urban pluvial flooding in heritage cities: A spatial multi criteria approach for the city of Florence (Italy). J. Hydrol. Reg. Stud. 2022, 41, 101081. [Google Scholar] [CrossRef]
  28. Skrydstrup, J.; Löwe, R.; Gregersen, I.B.; Koetse, M.; Aerts, J.C.J.H.; de Ruiter, M.; Arnbjerg-Nielsen, K. Assessing the recreational value of small-scale nature-based solutions when planning urban flood Adaptation. J. Environ. Manag. 2022, 320, 115724. [Google Scholar] [CrossRef] [PubMed]
  29. Kim, Y.; Newman, G. Advancing scenario planning through integrating urban growth prediction with future flood risk models. Comput. Environ. Urban Syst. 2020, 82, 101498. [Google Scholar] [CrossRef] [PubMed]
  30. Afriyanie, D.; Julian, M.M.; Riqqi, A.; Akbar, R.; Suroso, D.S.A.; Kustiwan, I. Re-Framing urban green spaces planning for flood protection through socio-ecological resilience in Bandung City, Indonesia. Cities 2020, 101, 102710. [Google Scholar] [CrossRef]
  31. Jodar-Abellan, A.; Valdes-Abellan, J.; Pla, C.; Gomariz-Castillo, F. Impact of land use changes on flash flood prediction using a sub-daily SWAT model in five Mediterranean ungauged watersheds (SE Spain). Sci. Total Environ. 2019, 657, 1578–1591. [Google Scholar] [CrossRef]
  32. García-Ayllón, S. predictive diagnosis of agricultural periurban areas based on territorial indicators: Comparative landscape trends of the so-called “Orchard of Europe”. Sustainability 2018, 10, 1820. [Google Scholar] [CrossRef] [Green Version]
  33. Chakraborty, S.; Dadashpoor, H.; Novotný, J.; Maity, I.; Follmann, A.; Patel, P.P.; Roy, U.; Pramanik, S. In pursuit of sustainability—Spatio-temporal pathways of urban growth patterns in the world’s largest megacities. Cities 2022, 131, 103919. [Google Scholar] [CrossRef]
  34. Cao, H.; Chen, J.; Chen, C.; Li, P. Identification of multi-temporal urban growth patterns with a modified urban growth index: Case study of three fast growing cities in the Greater Mekong Subregion (GMS). Ecol. Indic. 2022, 142, 109206. [Google Scholar] [CrossRef]
  35. He, Q.; Zeng, C.; Xie, P.; Tan, S.; Wu, J. Comparison of urban growth patterns and changes between three urban agglomerations in china and three metropolises in the USA from 1995 to 2015. Sustain. Cities Soc. 2019, 50, 101649. [Google Scholar] [CrossRef]
  36. Garcia-Ayllon, S. Urban transformations as indicators of economic change in post-communist Eastern Europe: Territorial diagnosis through five case studies. Habitat. Int. 2018, 71, 29–37. [Google Scholar] [CrossRef]
  37. García-Ayllón, S. Rapid development as a factor of imbalance in urban growth of cities in Latin America: A perspective based on territorial indicators. Habitat. Int. 2016, 58, 127–142. [Google Scholar] [CrossRef]
  38. Stephenson, J. The cultural values model: An integrated approach to values in landscapes. Landsc. Urban Plan. 2008, 84, 127–139. [Google Scholar] [CrossRef]
  39. Vizzari, M.; Hilal, M.; Sigura, M.; Antognelli, S.; Joly, D. Urban-rural-natural gradient analysis with CORINE data: An application to the metropolitan France. Landsc. Urban Plan. 2018, 171, 18–29. [Google Scholar] [CrossRef]
  40. Copernicus EU Corine Land Cover Classes. Available online: https://land.copernicus.eu/user-corner/technical-library/corine-land-cover-nomenclature-guidelines/html (accessed on 12 February 2023).
  41. European Environment Agency. CLC2006 Technical Guidelines; European Environment Agency: Copenhagen, Denmark, 2007; Volume 2010, p. 70. [Google Scholar]
  42. Liu, X.; Zhou, J. Mind the missing links in china’s urbanizing landscape: The phenomenon of broken intercity trunk roads and its underpinnings. Landsc. Urban Plan. 2017, 165, 64–72. [Google Scholar] [CrossRef]
  43. Ji, W.; Ma, J.; Twibell, R.W.; Underhill, K. Characterizing urban sprawl using multi-stage remote sensing images and landscape metrics. Comput. Environ. Urban Syst. 2006, 30, 861–879. [Google Scholar] [CrossRef]
  44. Ode, Å.; Tveit, M.S.; Fry, G. Capturing landscape visual character using indicators: Touching base with landscape aesthetic theory. Landsc. Res. 2008, 33, 89–117. [Google Scholar] [CrossRef]
  45. Van Vliet, J.; de Groot, H.L.F.; Rietveld, P.; Verburg, P.H. Manifestations and underlying drivers of agricultural land use change in Europe. Landsc. Urban Plan. 2015, 133, 24–36. [Google Scholar] [CrossRef] [Green Version]
  46. European Parliament. European Parliament Directive 2007/60/EC of the European Parliament and of the Council of 23 October 2007 on the Assessment and Management of Flood Risks; European Parliament: Strasbourg, France, 2007. [Google Scholar]
  47. Ministerio para la Transición Ecológica y el Reto Demográfico. Geoportal Sistema Nacional de Cartografía de Zonas Inundables. Available online: https://www.miteco.gob.es/es/cartografia-y-sig/ide/descargas/agua/descargas_agua_snczi.aspx (accessed on 8 January 2023).
  48. Wu, C. Handbook of applied spatial analysis: Software tools, methods and applications edited by Manfred M. Fischer and Arthur Getis. J. Reg. Sci. 2012, 52, 386–388. [Google Scholar] [CrossRef]
  49. Anselin, L. Local Indicators of Spatial Association—LISA. Geogr. Anal. 1995, 27, 93–115. [Google Scholar] [CrossRef]
  50. Degeai, J.-P.; Blanchemanche, P.; Tavenne, L.; Tillier, M.; Bohbot, H.; Devillers, B.; Dezileau, L. River flooding on the French Mediterranean coast and its relation to climate and land use change over the past two millennia. Catena 2022, 219, 106623. [Google Scholar] [CrossRef]
  51. Cristiano, E.; Urru, S.; Farris, S.; Ruggiu, D.; Deidda, R.; Viola, F. Analysis of potential benefits on flood mitigation of a CAM green roof in Mediterranean urban areas. Build. Environ. 2020, 183, 107179. [Google Scholar] [CrossRef]
  52. Glaeser, E.L.; Gyourko, J.; Saiz, A. Housing supply and housing bubbles. J. Urban Econ. 2008, 64, 198–217. [Google Scholar] [CrossRef] [Green Version]
  53. Gaertner, M.Á.; González-Alemán, J.J.; Romera, R.; Domínguez, M.; Gil, V.; Sánchez, E.; Gallardo, C.; Miglietta, M.M.; Walsh, K.J.E.; Sein, D.V.; et al. Simulation of medicanes over the Mediterranean Sea in a regional climate model ensemble: Impact of ocean–atmosphere coupling and increased resolution. Clim. Dyn. 2018, 51, 1041–1057. [Google Scholar] [CrossRef] [Green Version]
  54. Gu, X.; Zhang, Q.; Li, J.; Liu, J.; Xu, C.-Y.; Sun, P. The changing nature and projection of floods across Australia. J. Hydrol. 2020, 584, 124703. [Google Scholar] [CrossRef]
  55. Choi, Y.; Kang, J.; Kim, J. Urban flood adaptation planning for local governments: Hydrology analysis and optimization. Int. J. Disaster Risk Reduct. 2021, 59, 102213. [Google Scholar] [CrossRef]
  56. Lourenço, I.B.; Beleño de Oliveira, A.K.; Marques, L.S.; Quintanilha Barbosa, A.A.; Veról, A.P.; Magalhães, P.C.; Miguez, M.G. A framework to support flood prevention and mitigation in the landscape and urban planning process regarding water dynamics. J. Clean. Prod. 2020, 277, 122983. [Google Scholar] [CrossRef]
Figure 1. Impact level of flooding events between 1950 and 2020 in the Region of Murcia. Source: Consorcio de Compensación de seguros de España [22].
Land 12 00543 g001
Figure 2. Climate change scenarios for 2020–2100 regarding precipitation in the city of Murcia area using three different Representative Concentration Pathway (RCP) greenhouse scenarios: (a) annual rainfall and (b) maximum daily rainfall. Source: AEMET [23].
Land 12 00543 g002
Figure 3. Metropolitan area of the so-called “orchard of Murcia” (up) and the main urban area of the city (bottom). Source: Sentinel 2 satellite.
Land 12 00543 g003
Figure 4. Spatial representation at a city scale of existing buildings by date of construction in the city of Murcia in 1980 (left) and 2019 (right). Source of data: General Directorate for Cadastre of Spain.
Land 12 00543 g004
Figure 5. Spatial representation at a metropolitan scale of the evolution of urban growth in the metropolitan area of the city of Murcia in 1940 (left), 1980 (center) and 2019 (right). Data source: General Directorate of the Cadaster of Spain.
Land 12 00543 g005
Figure 6. Implementation of spatial information on flood-prone areas: terrain elevation model incorporating orographic conditions in areas at risk of flooding (upper left), map of flood-prone areas with risk for the population in urban areas (upper right), map depths (bottom left) and preferential flow areas where the water flow only acquires greater speed (bottom right).
Land 12 00543 g006
Figure 7. Breakdown of the surface areas built in the different decades in areas currently determined as flood-prone areas in the metropolitan area of the city of Murcia.
Land 12 00543 g007
Figure 8. Generation of discrete homogeneous orographic-urban units (HOUU) for spatial analysis: (a) zoning map of urban planning uses of the Murcia masterplan; (b) current orthophoto of the city of Murcia with a layer superimposition of sub-basins of homogeneous orography; (c) superposition of layers of homogeneous sub-basins and classification by masterplan land planning classes and (d) homogeneous orographic-urban planning units generated.
Land 12 00543 g008
Figure 9. Example of evolution over time of a traditional orchard area in the metropolitan area of Murcia (above). Images of the current landscape configuration of the old peri-urban areas of Huerta: the construction of numerous paved roads as a consequence of an increasingly fragmented plot structure focused on residential urban development has ended up completely misconfiguring the natural hydrographic network (below).
Land 12 00543 g009
Figure 10. The Huerta de Murcia traditional landscape: (a.1) Extension of the area and subunits of the Huerta directly linked to the metropolitan area of the city of Murcia (a.2) example of its traditional landscape, (b) scheme of the traditional agricultural hydrographic network of the Huerta and (c.1,c.2) traditional hydraulic infrastructures existing since the Muslim period (8th–14th century).
Land 12 00543 g010
Figure 11. Graphical scheme representation of trend analysis of growth patterns in the city of Murcia: (a) spatial distribution of the main vectors of growth and transformation of the peri-urban space vs. the resistance inertia of the orchard; (b) Levels of the demographic intensity of the urban areas of the city and main “pockets” of urban development foreseen in the planning in flood-prone areas.
Land 12 00543 g011
Figure 12. Temporal evolution of the urbanized vs. flooded areas in Murcia, Valencia, Zaragoza and Barcelona.
Land 12 00543 g012
Table 1. Evolution of the urban metropolitan area of Murcia area in terms of urbanized land and population from 1950 to 2019.
19501960197019801990200020102019Planned
Urbanized land (Ha)
Urban metropolitan area526107918862782393161568532886711,624 1
Population
Metropolitan area district260,023297,806304,522371,237432,851491,290551,119626,451680,409 2
1 Planned as buildable land in the current masterplan of the municipality. 2 Population estimated for the year 2030.
Table 2. Technical characteristics of georeferenced spatial data used.
Mapping Data YearsPixel Size Projected on the GSD Ground (cm)Planimetric Accuracy (X, Y) Mean Squared Error (m)Altimetric Accuracy (Z) Mean Squared Error (m)Mesh Step
FlightOrthophoto
<195690100<2.00<2.005 × 5
19814550<2.00<2.005 × 5
1990–20044550<1.00<2.005 × 5
2005–20202225<0.50<1.005 × 5
Table 3. Numerical evolution of GIS indicators of urban growth in Murcia from 1950 to 2019.
195019501960197019801990200020102019
LAR0.0280.0360.0680.1160.1740.2320.3960.5150.548
IFA0.0640.0750.0880.1010.1250.1740.2230.2790.310
ICC0.2330.2160.1950.2200.2210.2280.2360.2520.257
UFI0.3460.3740.4110.4590.5100.5520.6140.6460.668
IAT0.0410.0530.0770.1210.1770.2340.3980.5160.548
Table 4. Results of the evaluation of the existing statistical correlation between the indicators for the analysis of urban growth patterns in the city of Murcia and the FZI flood zone indicator.
GIS IndicatorsFZI Flood Hazard Index (1st Cycle 2007–2013)
BStd. ErrortSign.
L A R 0.2380.0072.1790.000 *
I F A 0.2650.0052.7440.000 *
I C C −0.1380.008−2.5750.000 *
U F I 0.2550.0094.0030.000 *
I A T 0.0980.0091.5100.000 *
Akaike’s information criterion (AIC): 21,364.7
Multiple R-squared: 0.19
Adjusted R-squared: 0.18
F-statistic: 136.72 Prob (>F) (3,3) degrees of freedom: 0
GIS IndicatorsFZI Flood Hazard Index (2nd Cycle 2013–2020)
BStd. ErrortSign.
L A R 0.2490.0062.6840.000 *
I F A 0.2860.0063.3680.000 *
I C C −0.1920.011−1.8840.000 *
U F I 0.3130.0062.8110.000 *
I A T 0.0620.0091.6670.000 *
Akaike’s information criterion (AIC): 23,191.3
Multiple R-squared: 0.22
Adjusted R-squared: 0.22
F-statistic: 154.88 Prob (>F) (3,3) degrees of freedom: 0
* Significant at 0.01 level.
Disclaimer/Publisher’s Note: The statements, opinions and data contained in all publications are solely those of the individual author(s) and contributor(s) and not of MDPI and/or the editor(s). MDPI and/or the editor(s) disclaim responsibility for any injury to people or property resulting from any ideas, methods, instructions or products referred to in the content.

