1. Introduction
With the boom in the tea industry in recent decades, increased numbers of tea gar-dens have been established on hillslopes after the clearance of natural and secondary forests in subtropical China [
1,
2]. The conversion of forest hillslopes into tea fields usually changes the slope structure, soil properties, and vegetation, which may induce large variations in the soil nutrient losses (i.e., nitrogen [N], phosphorous [P]) through the surface runoff along the hillslopes [
3,
4,
5,
6,
7], and hence strongly contribute to the water quality deterioration in agricultural regions [
3,
8,
9]. These variations are generally drastic and significant in the first years of conversion, which is associated with the serial processes of slope stabilization, soil structure restoration, formation of vegetation cover, and difference in fertilizer application in the new tea system. The crop N and P utilization and environment efficiencies of long-term tea systems have been well examined [
8,
9]. The issue of what magnitude of land use conversion changes the N and P losses through the surface runoff is rarely quantified in newly reclaimed tea systems, although this quantification could improve our understanding of the ecological service function of the tea ecosystem [
10].
The conversion of forest hillslopes into tea fields has strong effects on the N and P losses through the surface runoff along the hillslopes due to several possible mechanisms [
4,
11,
12]. The commonly used slope terracing technique for tea system establishment changes the slope shape and can strongly influence the occurrence, flow accumulation, and flow pathway of surface runoff, which is a major driving force behind the N and P losses on hillslopes [
13,
14,
15]. The soil movement and refill during land reclamation changes the slope and soil structure, which strongly determine the soil erodibility and particle N and P losses through surface runoff [
10,
12,
16,
17]. Changes in the vegetation cover strongly relate to the different surface runoff process magnitudes that regulate the N and P migration on hillslopes [
18,
19]. The high N and P application rates in the tea ecosystem may potentially increase the N and P release into the surface runoff and hence increase the N and P losses from hillslopes [
1,
2,
8]. These mechanisms and factors usually interact at different times and spatial scales, as well as in different magnitudes, making the impacts of converting forest hillslopes into tea fields ambiguous on hillslopes.
The N and P losses through surface runoff have been intensively examined in stable and long-term tea systems [
8,
9]. For instance, Chen and Lin estimated that up to 30% and 5% of the applied N and P fertilizers, respectively, were lost through surface runoff in tea systems [
8]. Ma et al. determined that the annual total N (TN) and total P (TP) losses through surface runoff were only 2.13 and 0.26 kg ha
−2 yr
−1, respectively, under conventional fertilization conditions [
20]. Generally, a newly reclaimed tea system takes at least three years to start the tea harvest. During the first three years, the slope stabilization, soil structure restoration, formation of vegetation cover, and difference in fertilizer application may bring about huge uncertainty in terms of the N and P losses through the surface runoff along the hillslopes. As reported, China has the world’s largest tea fields, and its increased rate of tea field area is also the world’s fastest [
21], which implies the large scale of the tea systems newly reclaimed in the last few years. The uncertainty concerning the N and P losses through the surface runoff in the newly reclaimed tea systems has aroused great concern regarding the potential environmental risk of converting forest hillslopes into tea fields. Therefore, the magnitude of the impacts of converting forest hillslopes into tea fields on the N and P losses through surface runoff requires intensive quantification, particularly during the first three years.
The present study hypothesized that the slope and soil structure, vegetation cover, and fertilization determine the N and P losses through surface runoff. A natural forest system and a newly reclaimed tea system were observed and compared from 2013 to 2016. The study aimed (1) to determine the variation in the N and P losses through surface runoff in the two systems, and (2) to reveal the effects of converting forest hillslopes into tea fields on the N and P losses.
2. Methods
2.1. Study Site
The study site is located at the Changsha Research Station for Agricultural and Environmental Monitoring (27°55′–28°40′ N, 112°56′–113°30′ E, elevation of 46–452 m) of the Chinese Academy of Sciences (CAS) in Hunan Province, China. The study area has a typical subtropical monsoon climate, with an annual mean air temperature of 17.5 °C and a mean annual rainfall of 1340 mm. Most of the annual rainfall occurs between April and July due to the moist summer monsoons, while evaporation usually exceeds rainfall between July and October, producing severe soil water deficits in the region. The hillslope gradient was 15%, and the slope length was 45–50 m. The soil depth along the slope ranged from 0.8 to 2.0 m, overlying a less permeable parent material horizon. The soils, which developed from gravitate, are classified as a sandy loam Ultisol according to the USDA soil taxonomy [
22].
2.2. Conversion of Forest Hillslopes into Tea Fields
The land use conversion experiment was performed on a forest hillslope. The forest is mainly secondary Masson pine (Pinus massoniana Lamb) woodland (approximately 30 years old). Other plants also grow in the forest, such as Sawtooth oaks (Quercus acutissima Carr), Azalea (Rhododendron simsii Planch), and Cape Jasmine (Gardenia jasminoides Ellis). The average leaf area index (LAI) of the Masson pine trees was 2.24, the average diameter at breast height was 32.08 cm, the tree canopy coverage was 92%, and the tree density was 2283 n ha−1.
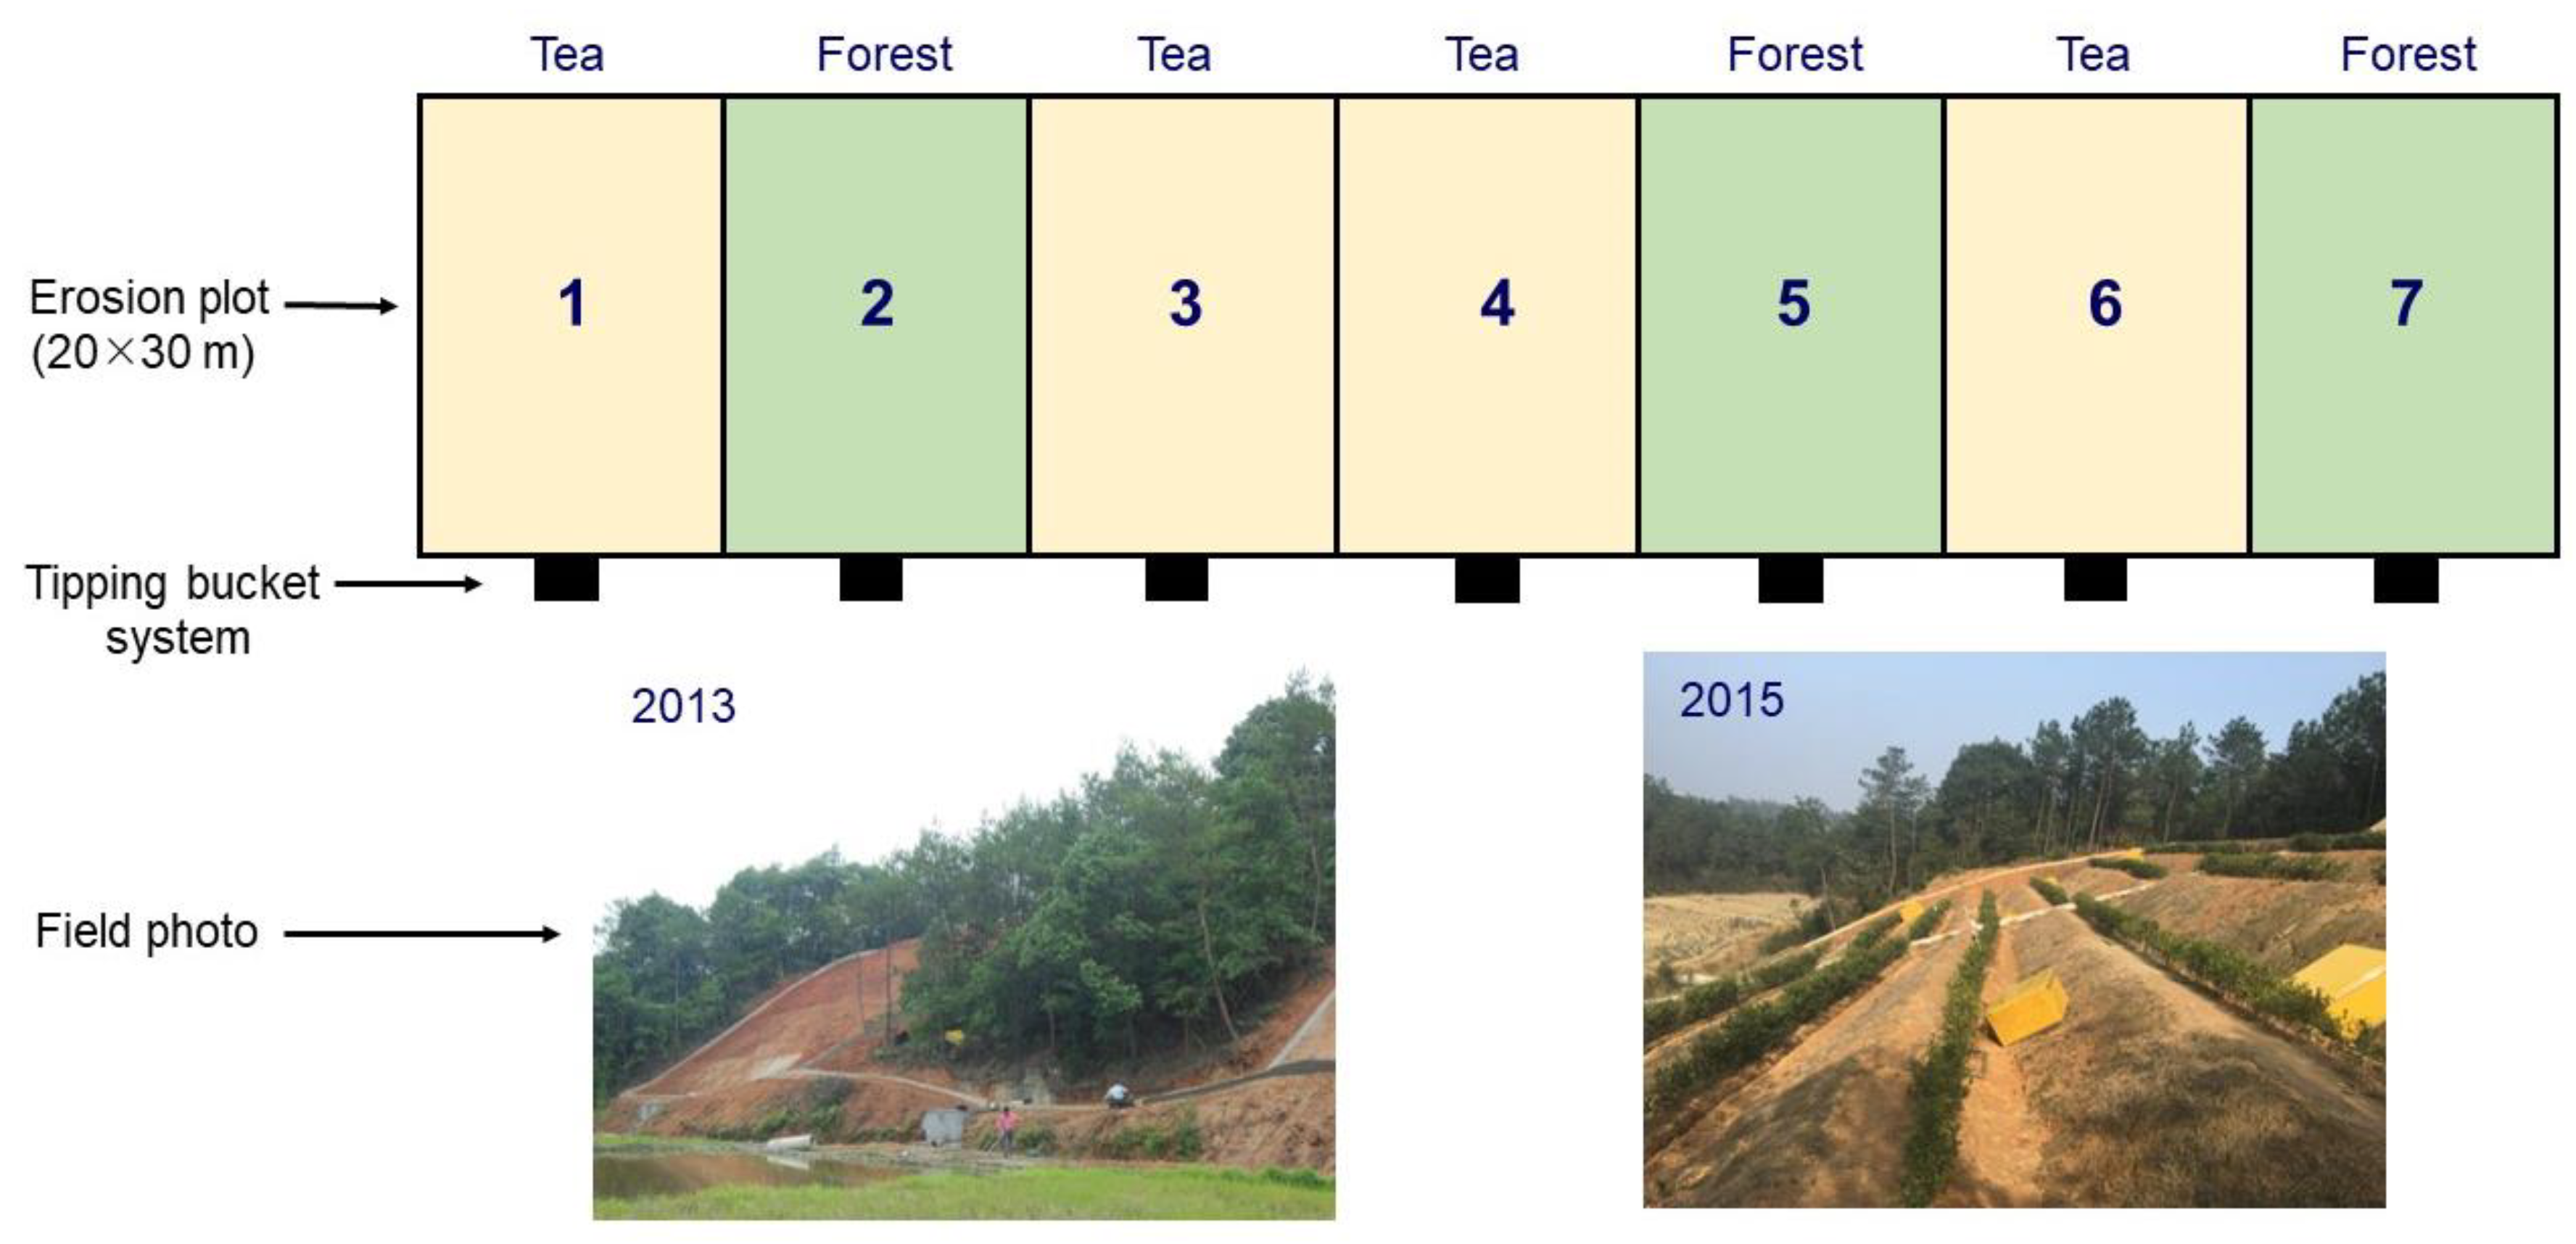
The entire forest hillslope was separated into 7 plots (20 m × 30 m) (
Figure 1), with 3 forest plots and 4 tea plots. All the vegetation was cleared, and the land surface was cascaded-terraced along the contour line of the hillslope in the tea plots in 2013, following the traditional methods for tea system establishment. Each tea plot had 7 terraced stages, and 2 rows of tea trees (
Camellia sinensis L., cv.
Baihaozao) were planted at a spacing of 20 cm × 20 cm on each terraced stage. During the tea tree planting in 2013, oilseed residual was applied as a basal fertilizer. In 2014, no fertilizer was applied because the tea trees were short. In 2015 and 2016, the fertilizer application amount was increased due to the growth stage of the tea trees. All the fertilizers were applied in the inter-rows along the tea rows using the deep placement method, whereby the fertilizer is buried in a 10 cm deep trench and covered with soil. The fertilization species, quantity, and timing in the tea plots during the observation period are listed in
Table 1. However, no fertilizer was applied in the forest plots.
2.3. Soil Properties
The 8 soil columns (l m in length and 9 cm in diameter) in the tea plots and the 13 columns in the forest plots were collected using a soil column cylinder auger machine (Stiboka, Standard set, 05.07, Eijkelkamp, The Netherlands). Each column was stratified at the depths of 15–25 cm, 25–35 cm, and 45–55 cm in the laboratory, from which the soil cylinder cores (100 cm3) were sampled to determine the saturated hydraulic soil conductivity (Ks) in the stratified columns. The remaining soil was then air-dried and passed through 2 mm and 0.25 mm sieves for the basic soil physical and chemical properties. The Ks was determined using the constant head method. After determining the Ks, the soil cores were oven-dried at 105 °C for 24 h to determine the soil bulk density (BD). Using the remaining air-dried soil, the soil particle size distribution, according to the US texture classification system, i.e., sand content (2.0–0.05 mm), silt content (0.05–0.005 mm), and clay content (less than 0.002 mm), was determined by means of the hydrometer method. The soil organic carbon (SOC) content was determined using the combustion method with an elemental analyzer (Vario MAX CN, Germany).
2.4. Field Monitoring and Chemical Sampling
The surface runoff during rainstorm events was measured using the erosion plot method along the hillslope (
Figure 1). The erosion plots were constructed with cement plates, of which 0.2 m was above the soil and 0.3 m was below the soil. A tipping bucket system (Smart Agriculture Technology Company, Nanjing, China) was installed at the lower end of each plot. During the rainstorm events, the water/soil suspension was guided to a bucket and then tipped into a sampling box when the bucket was full. The number of bucket tips was recorded using an event data logger (Onset Computer Corporation, Bourne, MA, USA) and then calibrated into the surface runoff volume.
The water/soil suspension in the sampling box was collected on an event basis to determine the different forms of N and P concentrations. The collected water/soil suspension samples were immediately sent to the laboratory for analysis. Each sample was separated into two subsamples. One subsample was digested with a K2S2O8-NaOH solution to determine the total N (TN) using a fully automated injection system (Tecator FIA Star 5000 analyzer, Foss Tecator, Sweden), and another portion was dissolved in a K2SO4 solution to determine the total P (TP) using an ultraviolet spectrophotometric method (UV-2450, SHIMADZU, Japan). The other subsample was filtered through a 0.45 μm membrane, and the filtrate was used to determine the TN (referred to as the dissolved N [DN]) and TP (referred to as the dissolved P [DP]) after digestion, to directly determine the nitrate N (NO3−-N) and ammonia (NH4+-N) using a fully automated injection system, and to determine the DP using an ultraviolet spectrophotometric method. Therefore, the particulate N (PN) and particulate P (PP) were determined by subtracting the DN/P from the TN/P, respectively.
2.5. Data Processing
An analysis of variance (ANOVA) was performed to compare the differences among the N and P nutrient concentrations in the surface runoff during rainstorms at p < 0.05 level during the observation period.
The N and P losses (
, kg N or P ha
−1 yr
−1) were estimated by multiplying the N and P concentrations by the simultaneous surface runoff volume at the rainstorm event basis according to the following equation:
where C is the N and P concentration in the stream water (mg N or P L
−1); q is the surface runoff volume during the rainstorm (L);
is the area of the field (ha); k is the total time of the rainstorm events in a given year; and the subscript i is the count of the rainstorm events in a given year.
3. Results
The selected physical, chemical, and hydraulic properties within the soil pedons in the two systems are presented in
Table 2, and they varied between the two systems. The soil bulk densities increased with the soil depth in the two systems. However, the soil organic carbon content values decreased with the soil depth in the two systems and were higher at comparable soil depths in the tea system than in the forest system. The silt percentages within the soil profiles were smaller in the tea system than in the forest system, while the clay percentage in the 0–10 cm soil depth was much higher in the tea system than in the forest system. For the soil hydraulic properties, the saturated soil conductivities at the 10 cm and 30 cm depths were significantly higher in the tea system than in the forest system (
p < 0.05), whereas they were similar at the 50 cm depth.
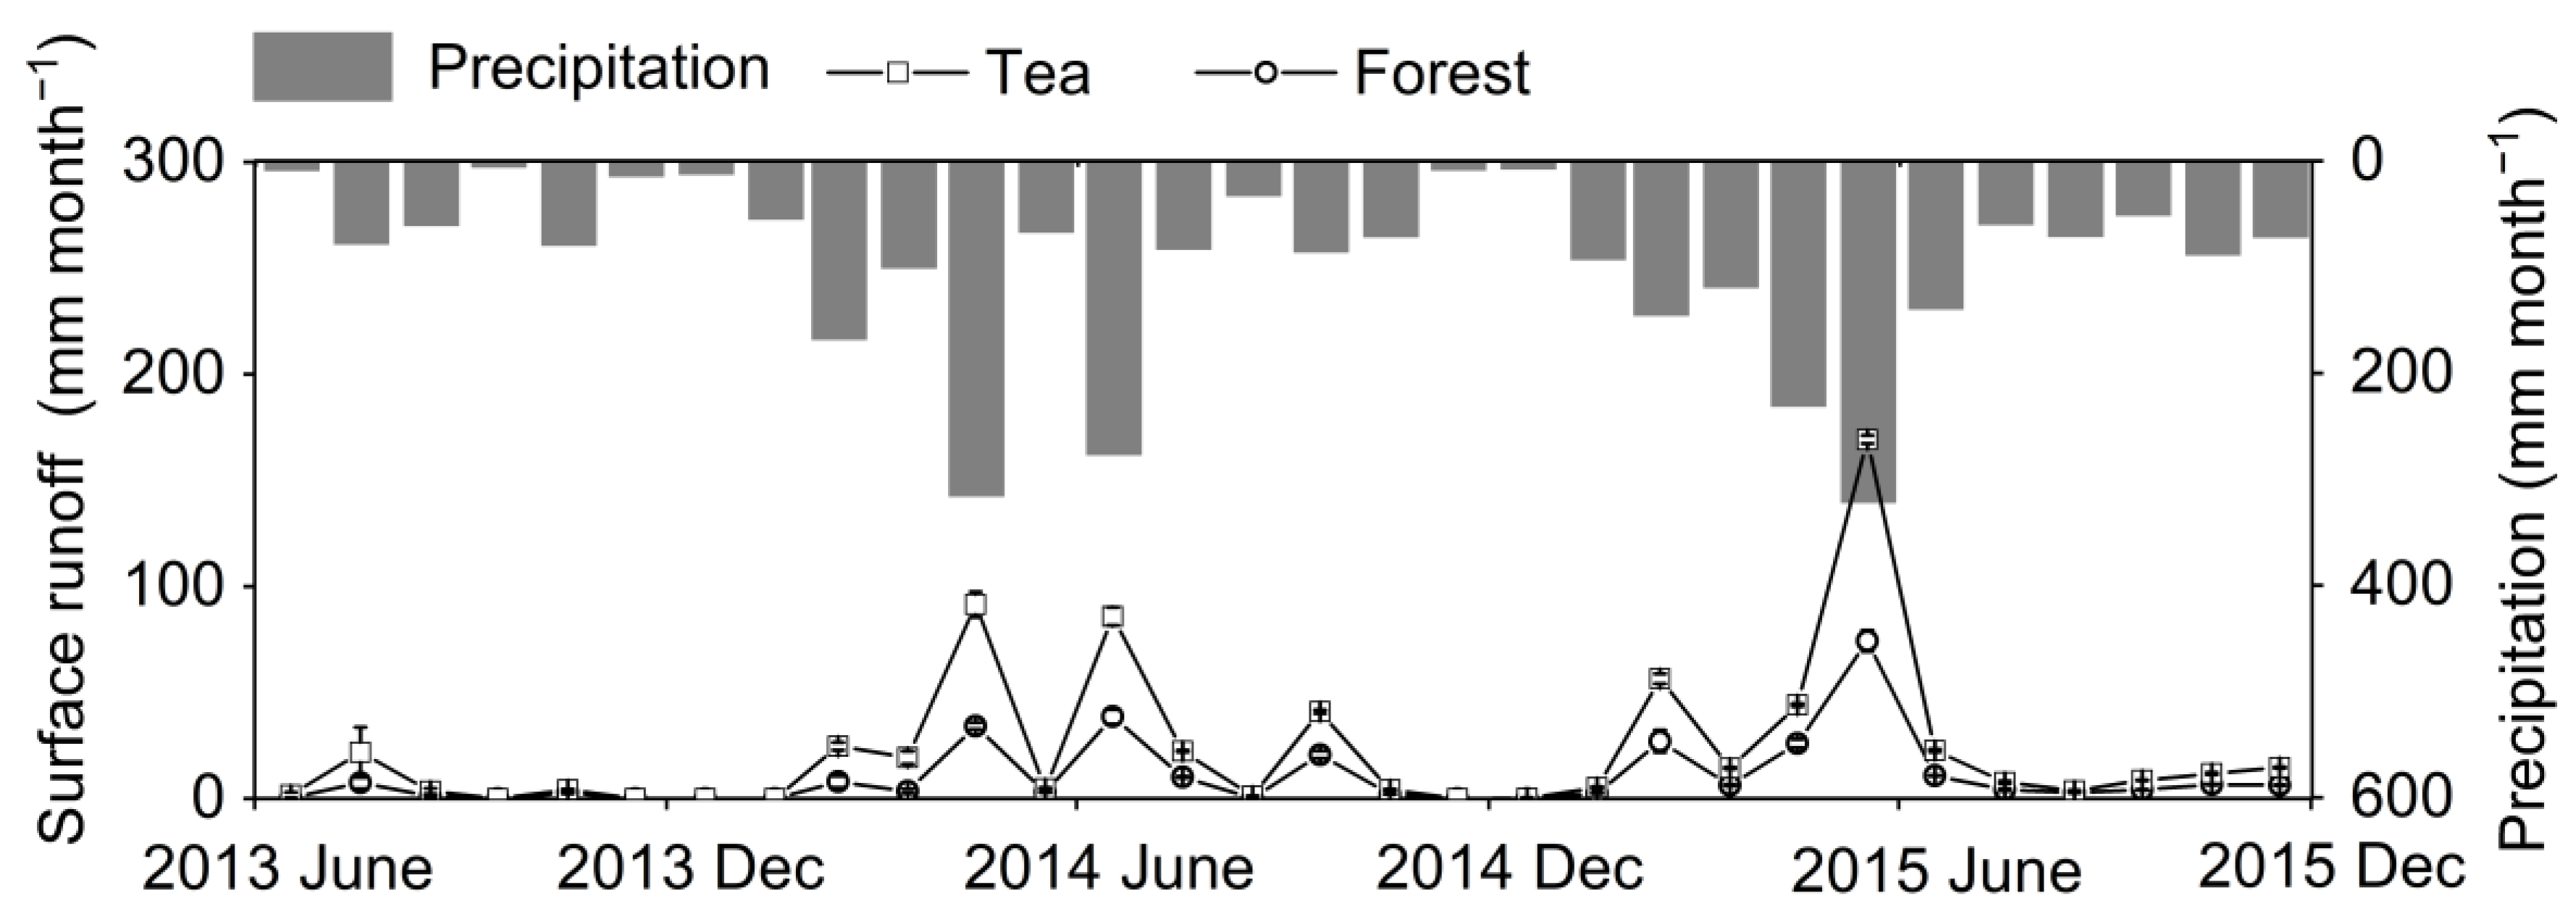
The monthly precipitation and surface runoff in the two systems are illustrated in
Figure 2. The annual precipitation was 1390.4 mm yr
−1, with 66.16% of the total occurring from April to June. The heavy precipitation resulted in obvious surface runoff, particularly in the tea system. It was estimated that the surface runoff was 308.80 ± 4.88 and 138.90 ± 5.24 mm yr
−1, accounting for 22.2 ± 0.40% and 10.0 ± 0.43% of the annual precipitation in the tea and forest systems, respectively.
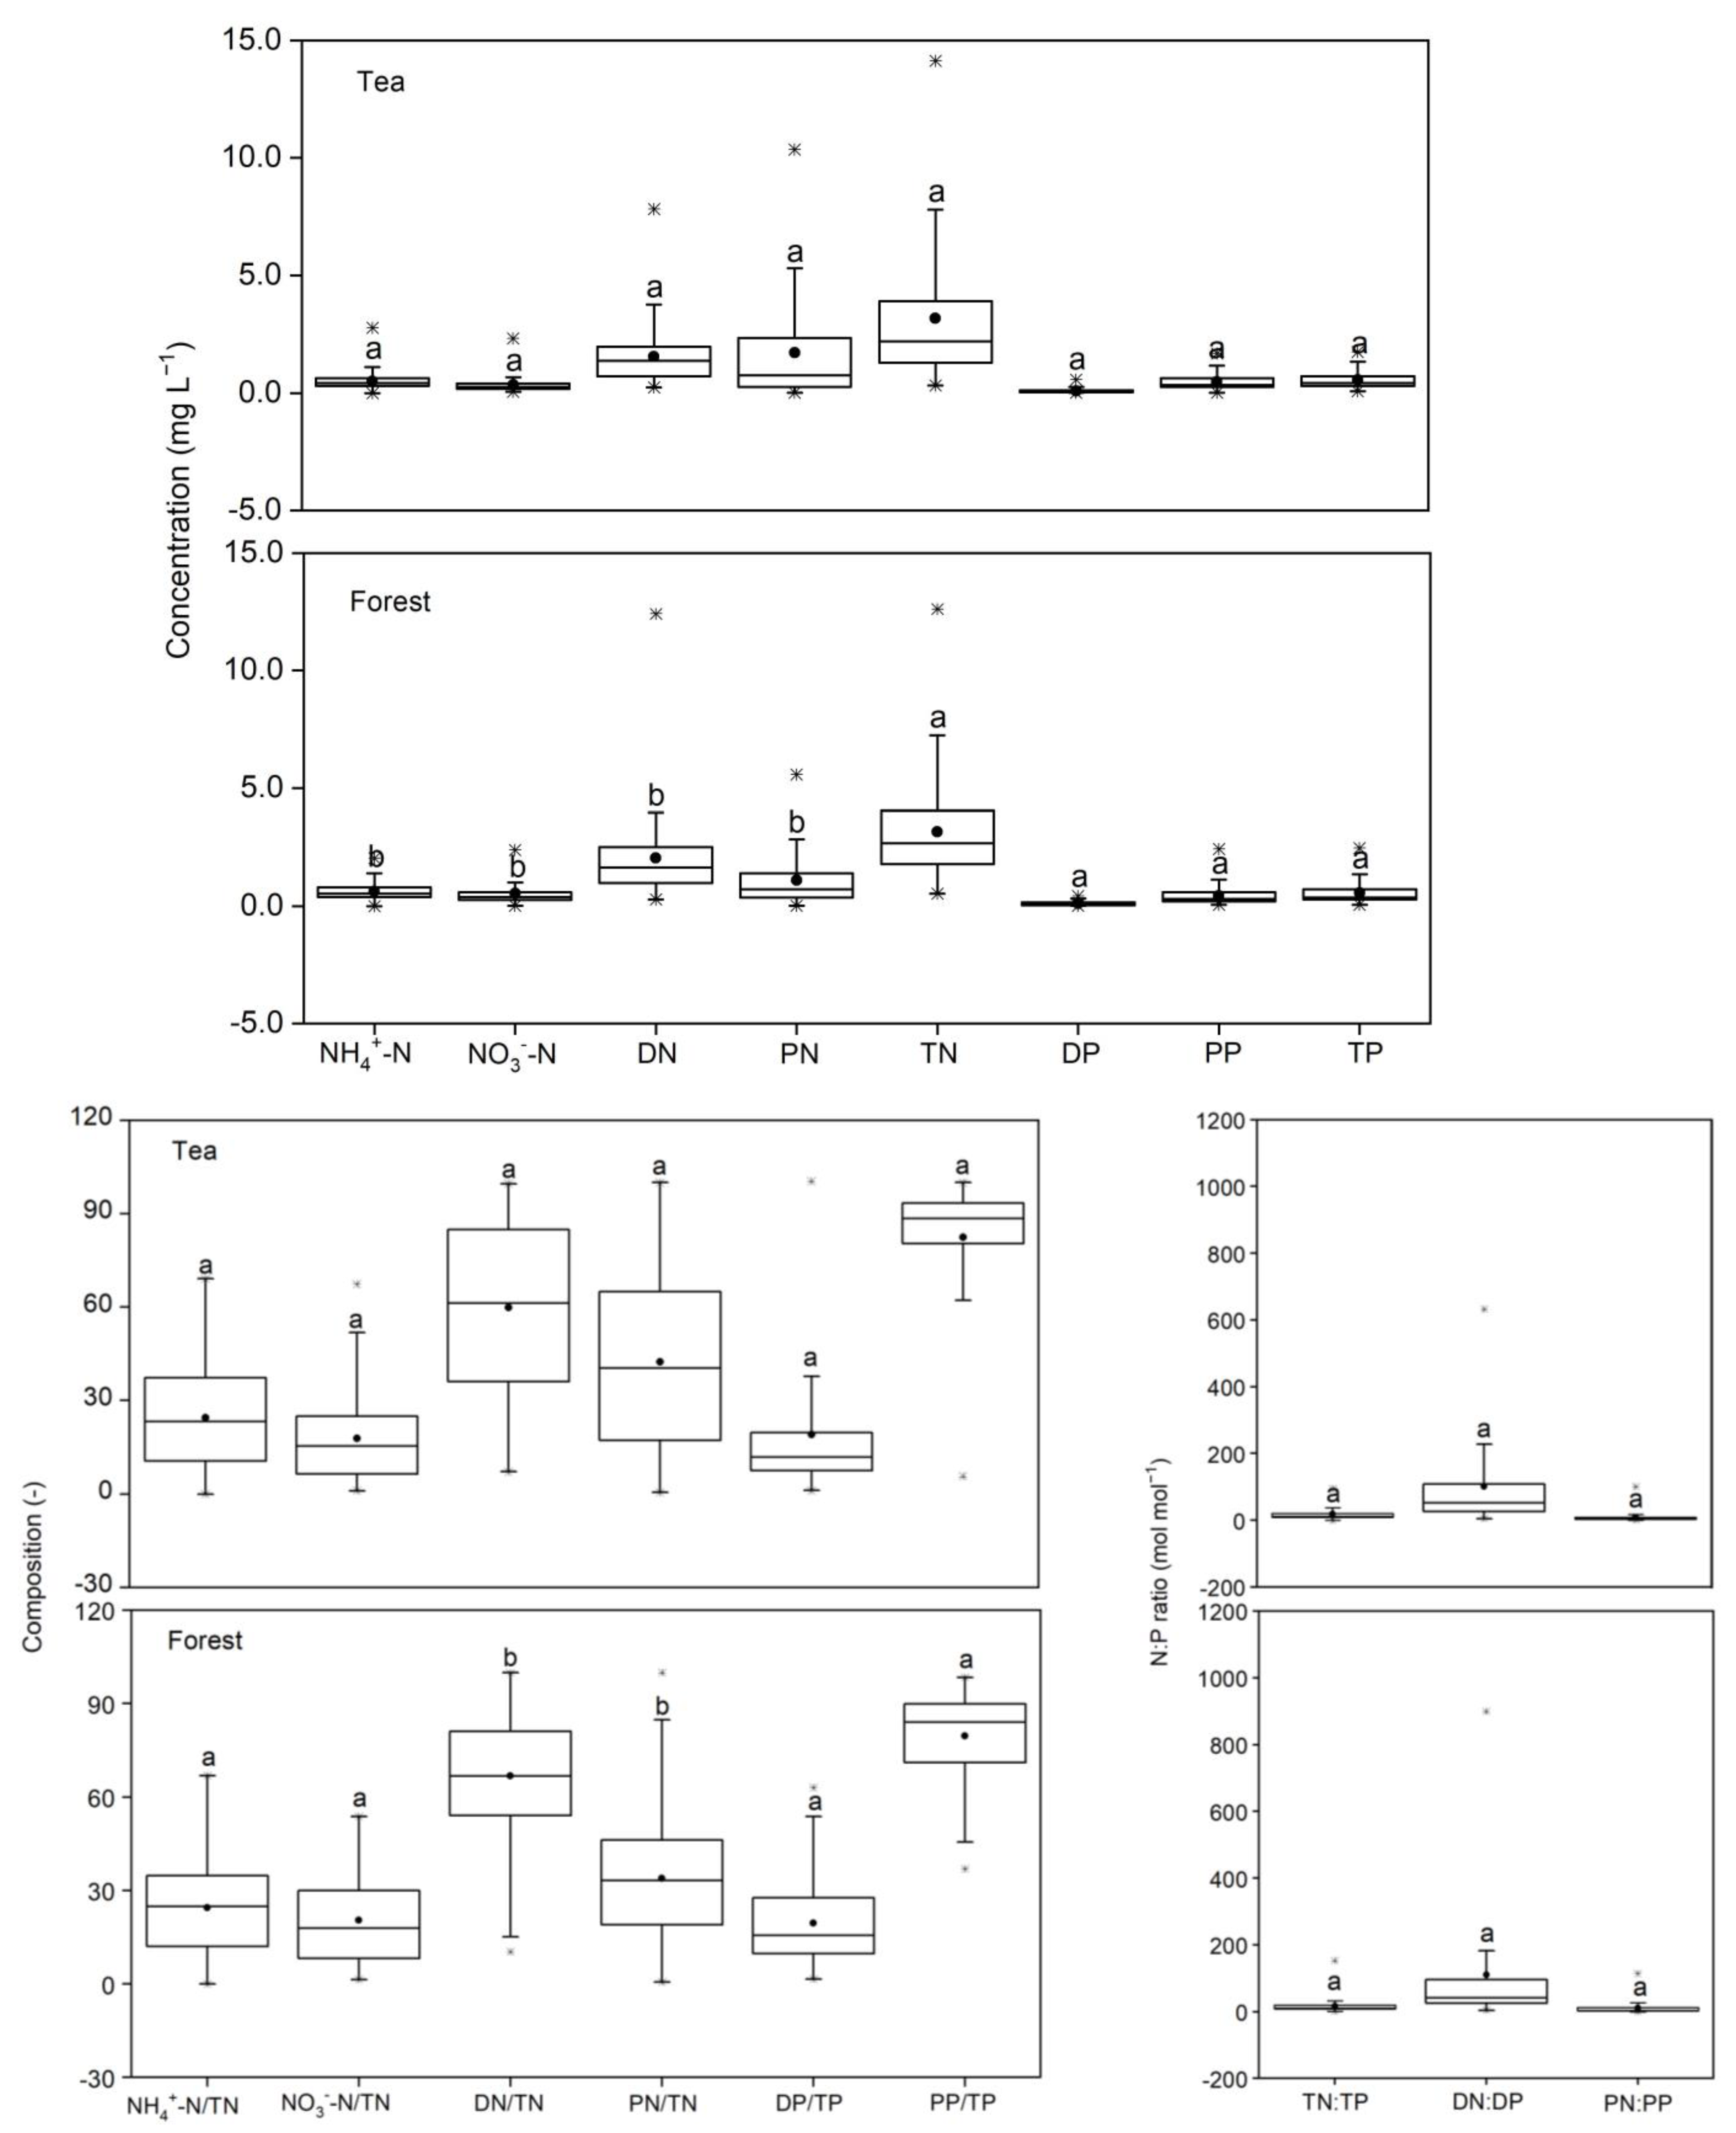
The concentrations of the different chemical forms of P in the surface runoff were similar in the tea and forest systems (
Figure 3). The TN and PN concentrations were higher in the tea system than in the forest system, while the DN, NH
4+-N, and NO
3−-N concentrations were lower in the tea system than in the forest system. When comparing the two systems, the DN/TN and PN/TN percentages were, respectively, lower and significantly higher in the tea system than in the forest system; however, the DP/TP and PP/TP showed no significant difference (
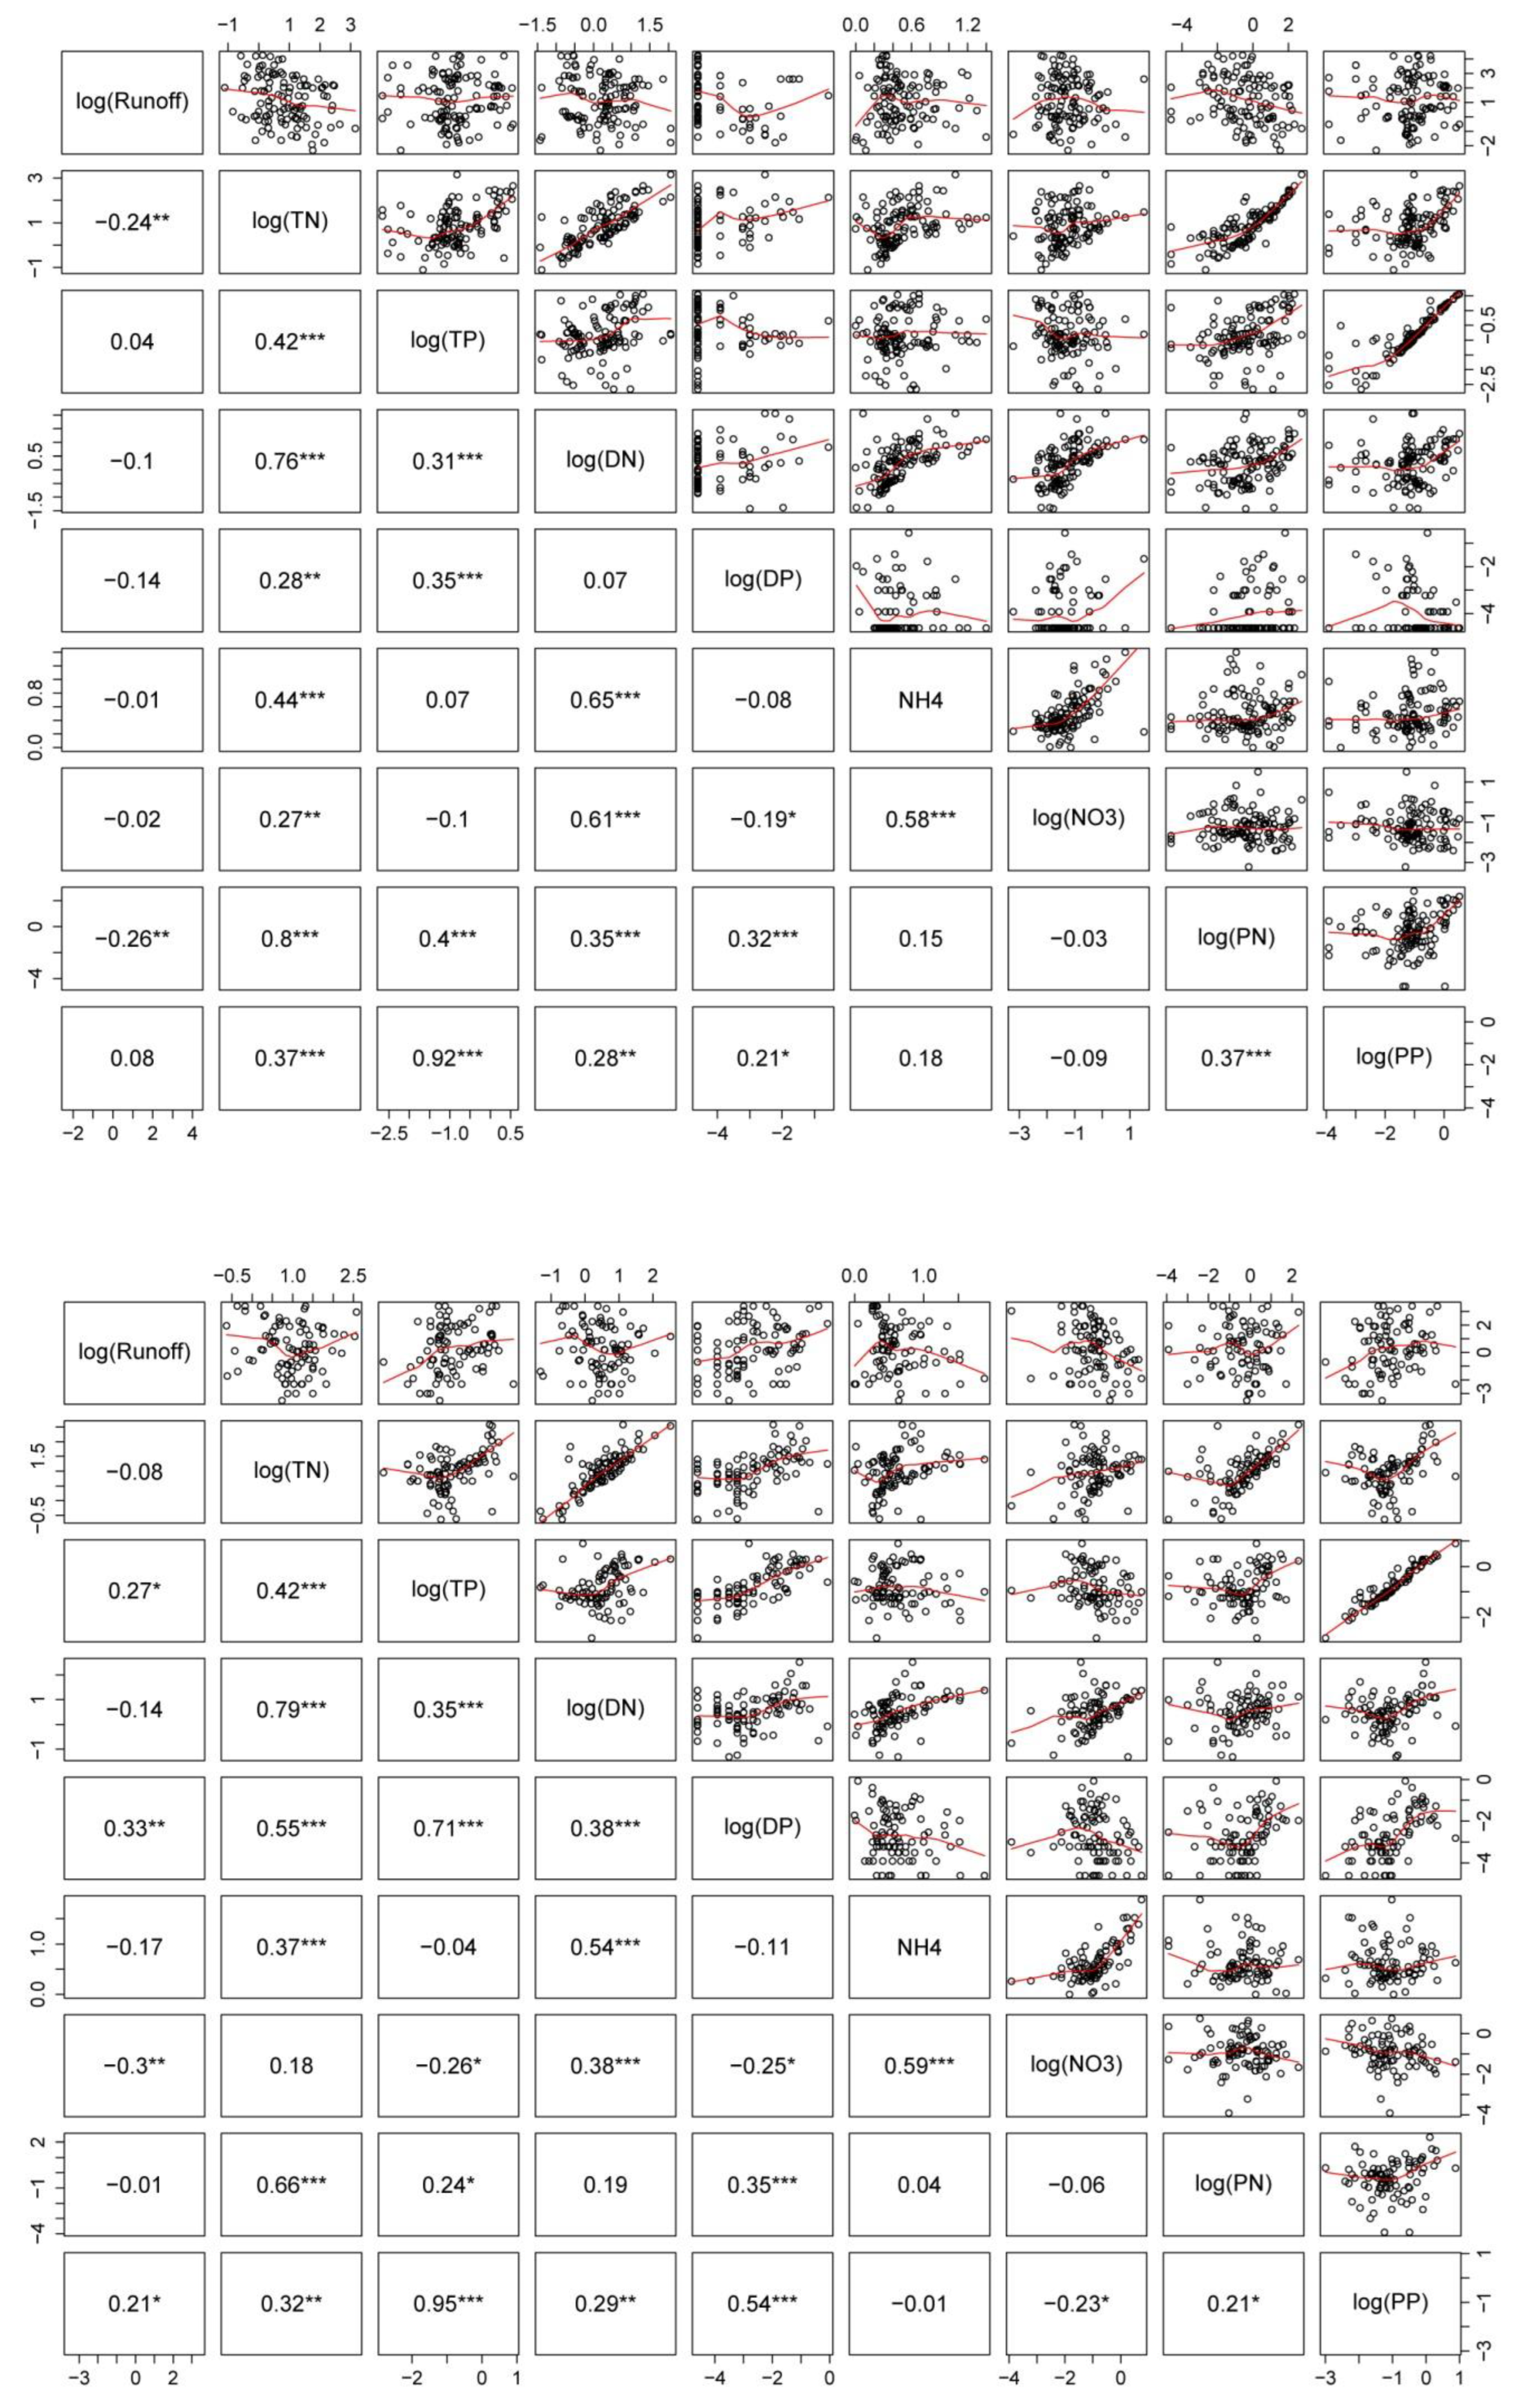
Table 3). The correlation analysis illustrated the different relationships between the surface runoff and N and P concentrations in the tea and forest systems (
Figure 4). The surface runoff was significantly correlated with the TN and PN concentrations in the tea system, whereas it was significantly correlated with the TP, DP, NO
3−-N, and PP concentrations in the forest system.
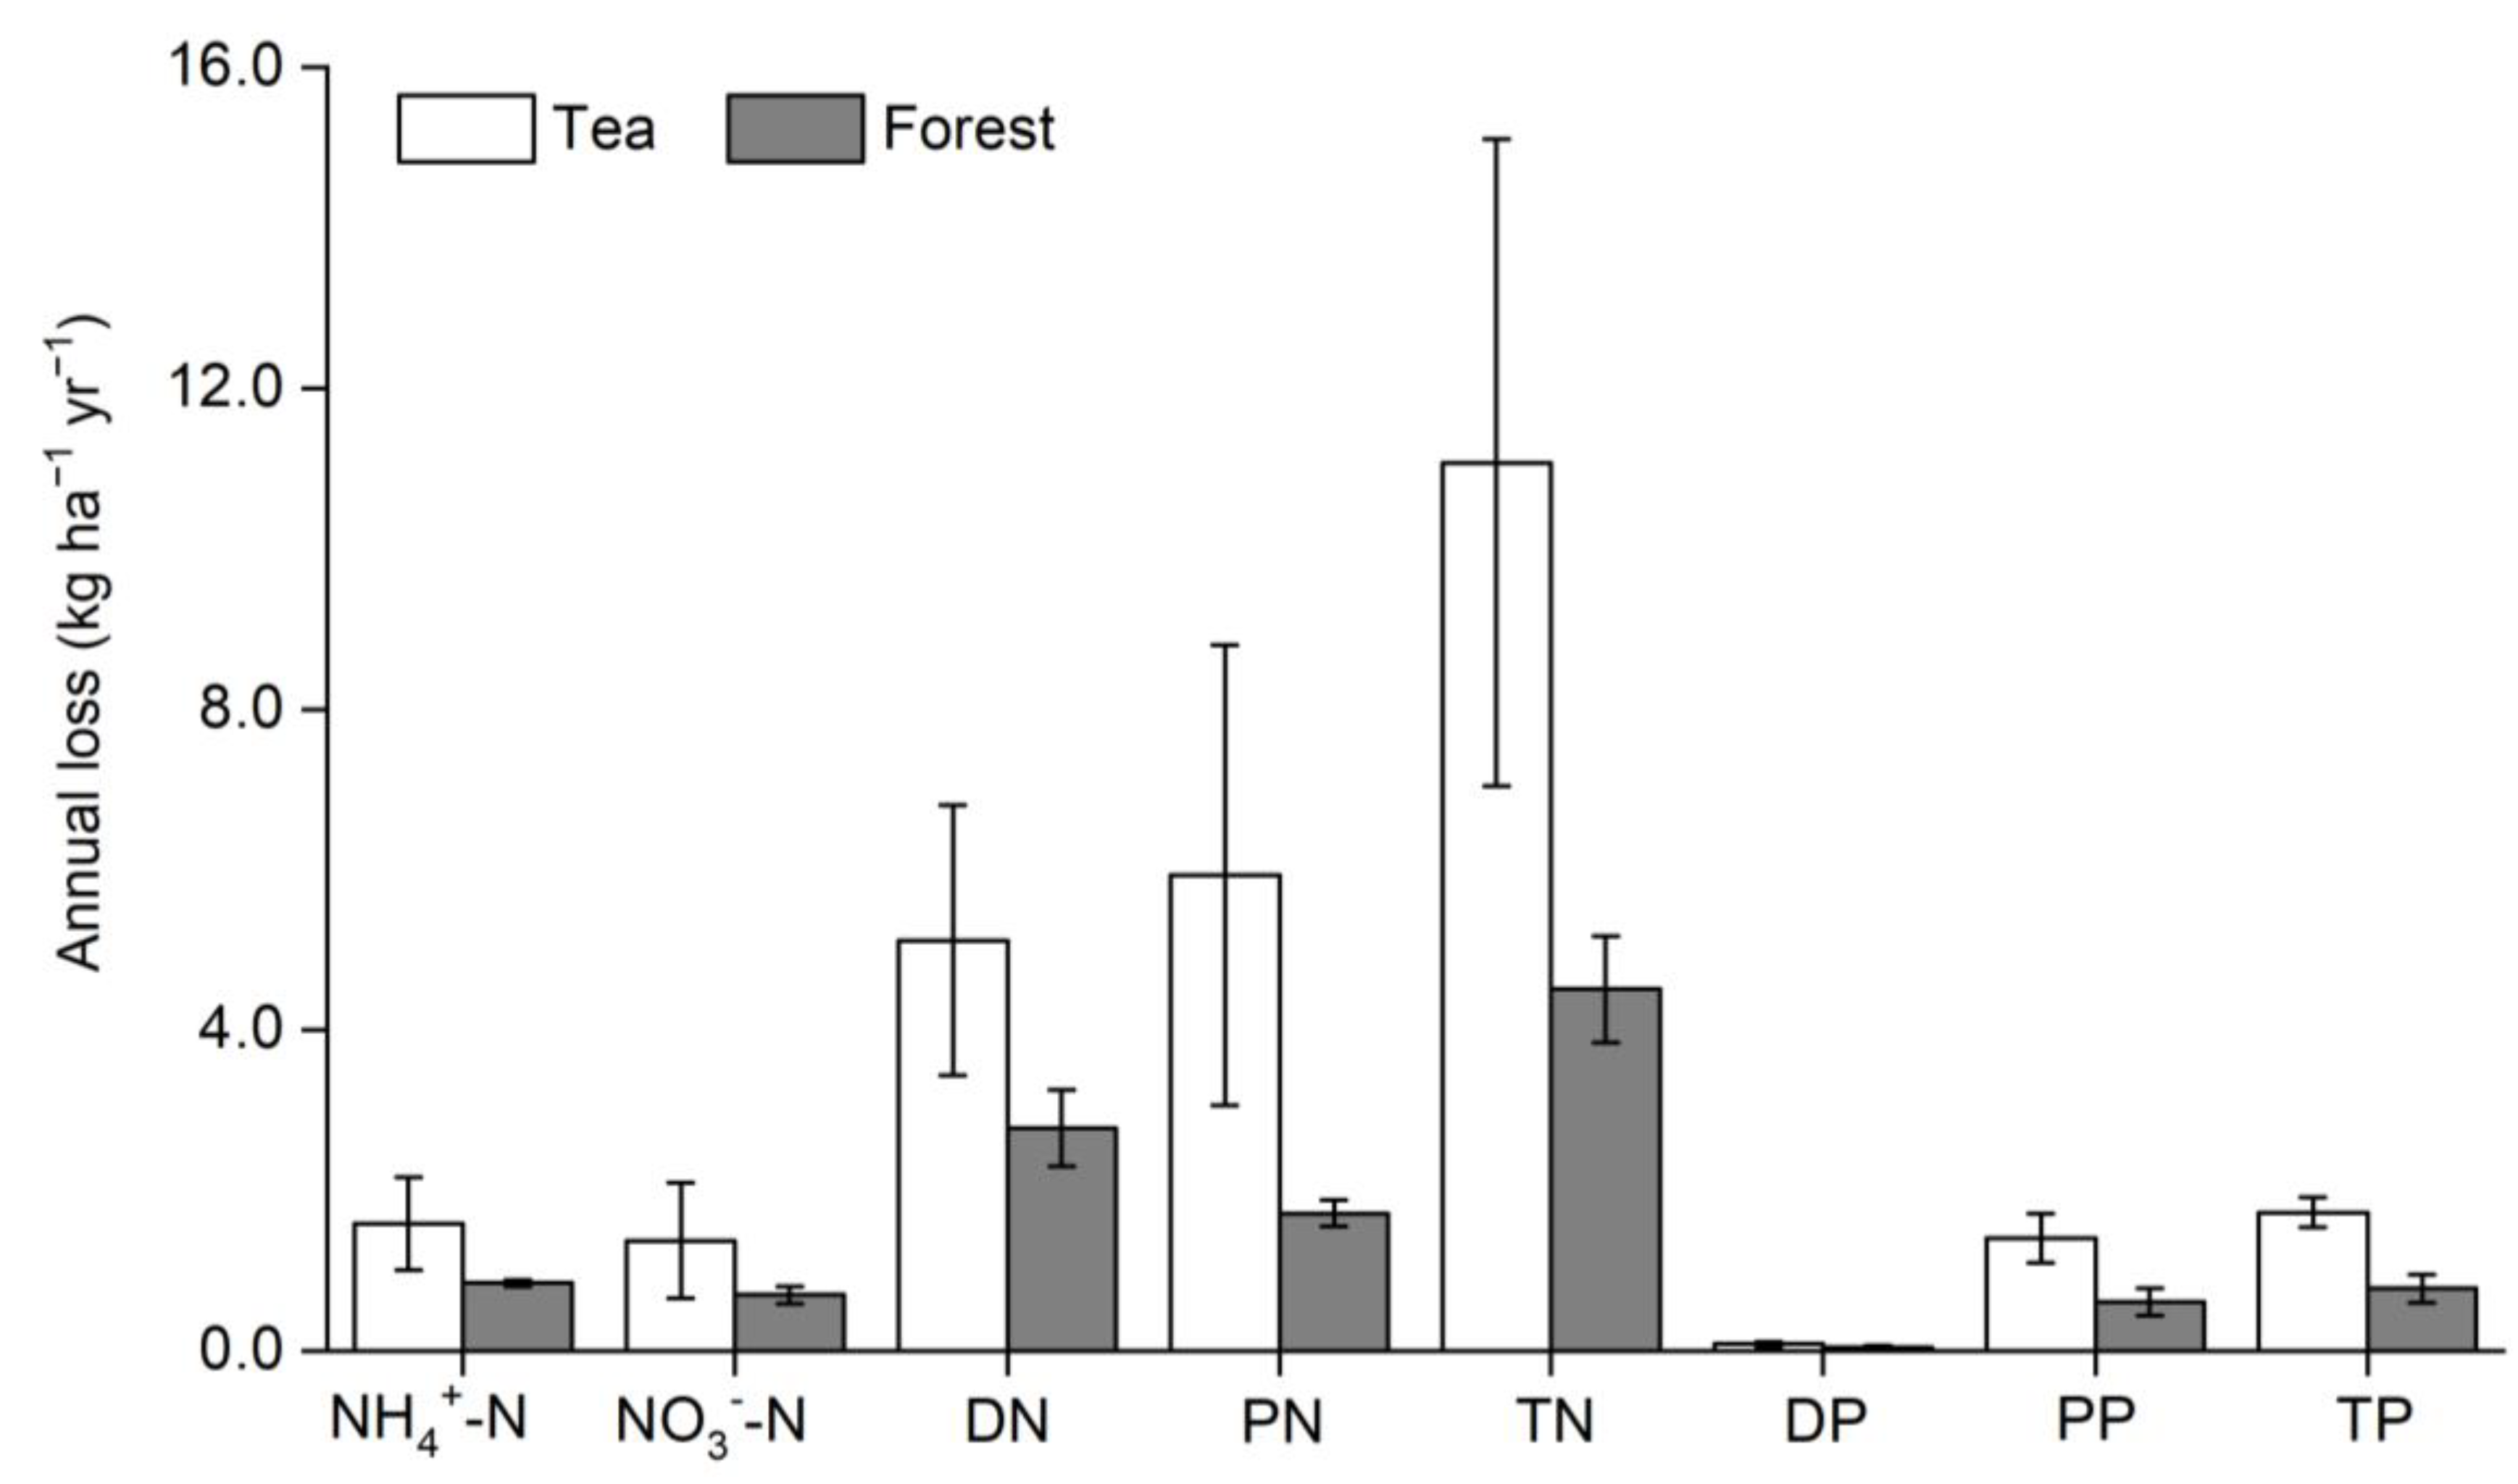
The estimate of the N and P losses through the surface runoff was larger in the tea system than in the forest system (
Figure 5). The mean annual TN and TP losses were 11.07 ± 4.03 and 1.73 ± 0.19 kg ha
−1 yr
−1 in the tea system and 4.51 ± 0.66 and 0.78 ± 0.18 kg ha
−1 yr
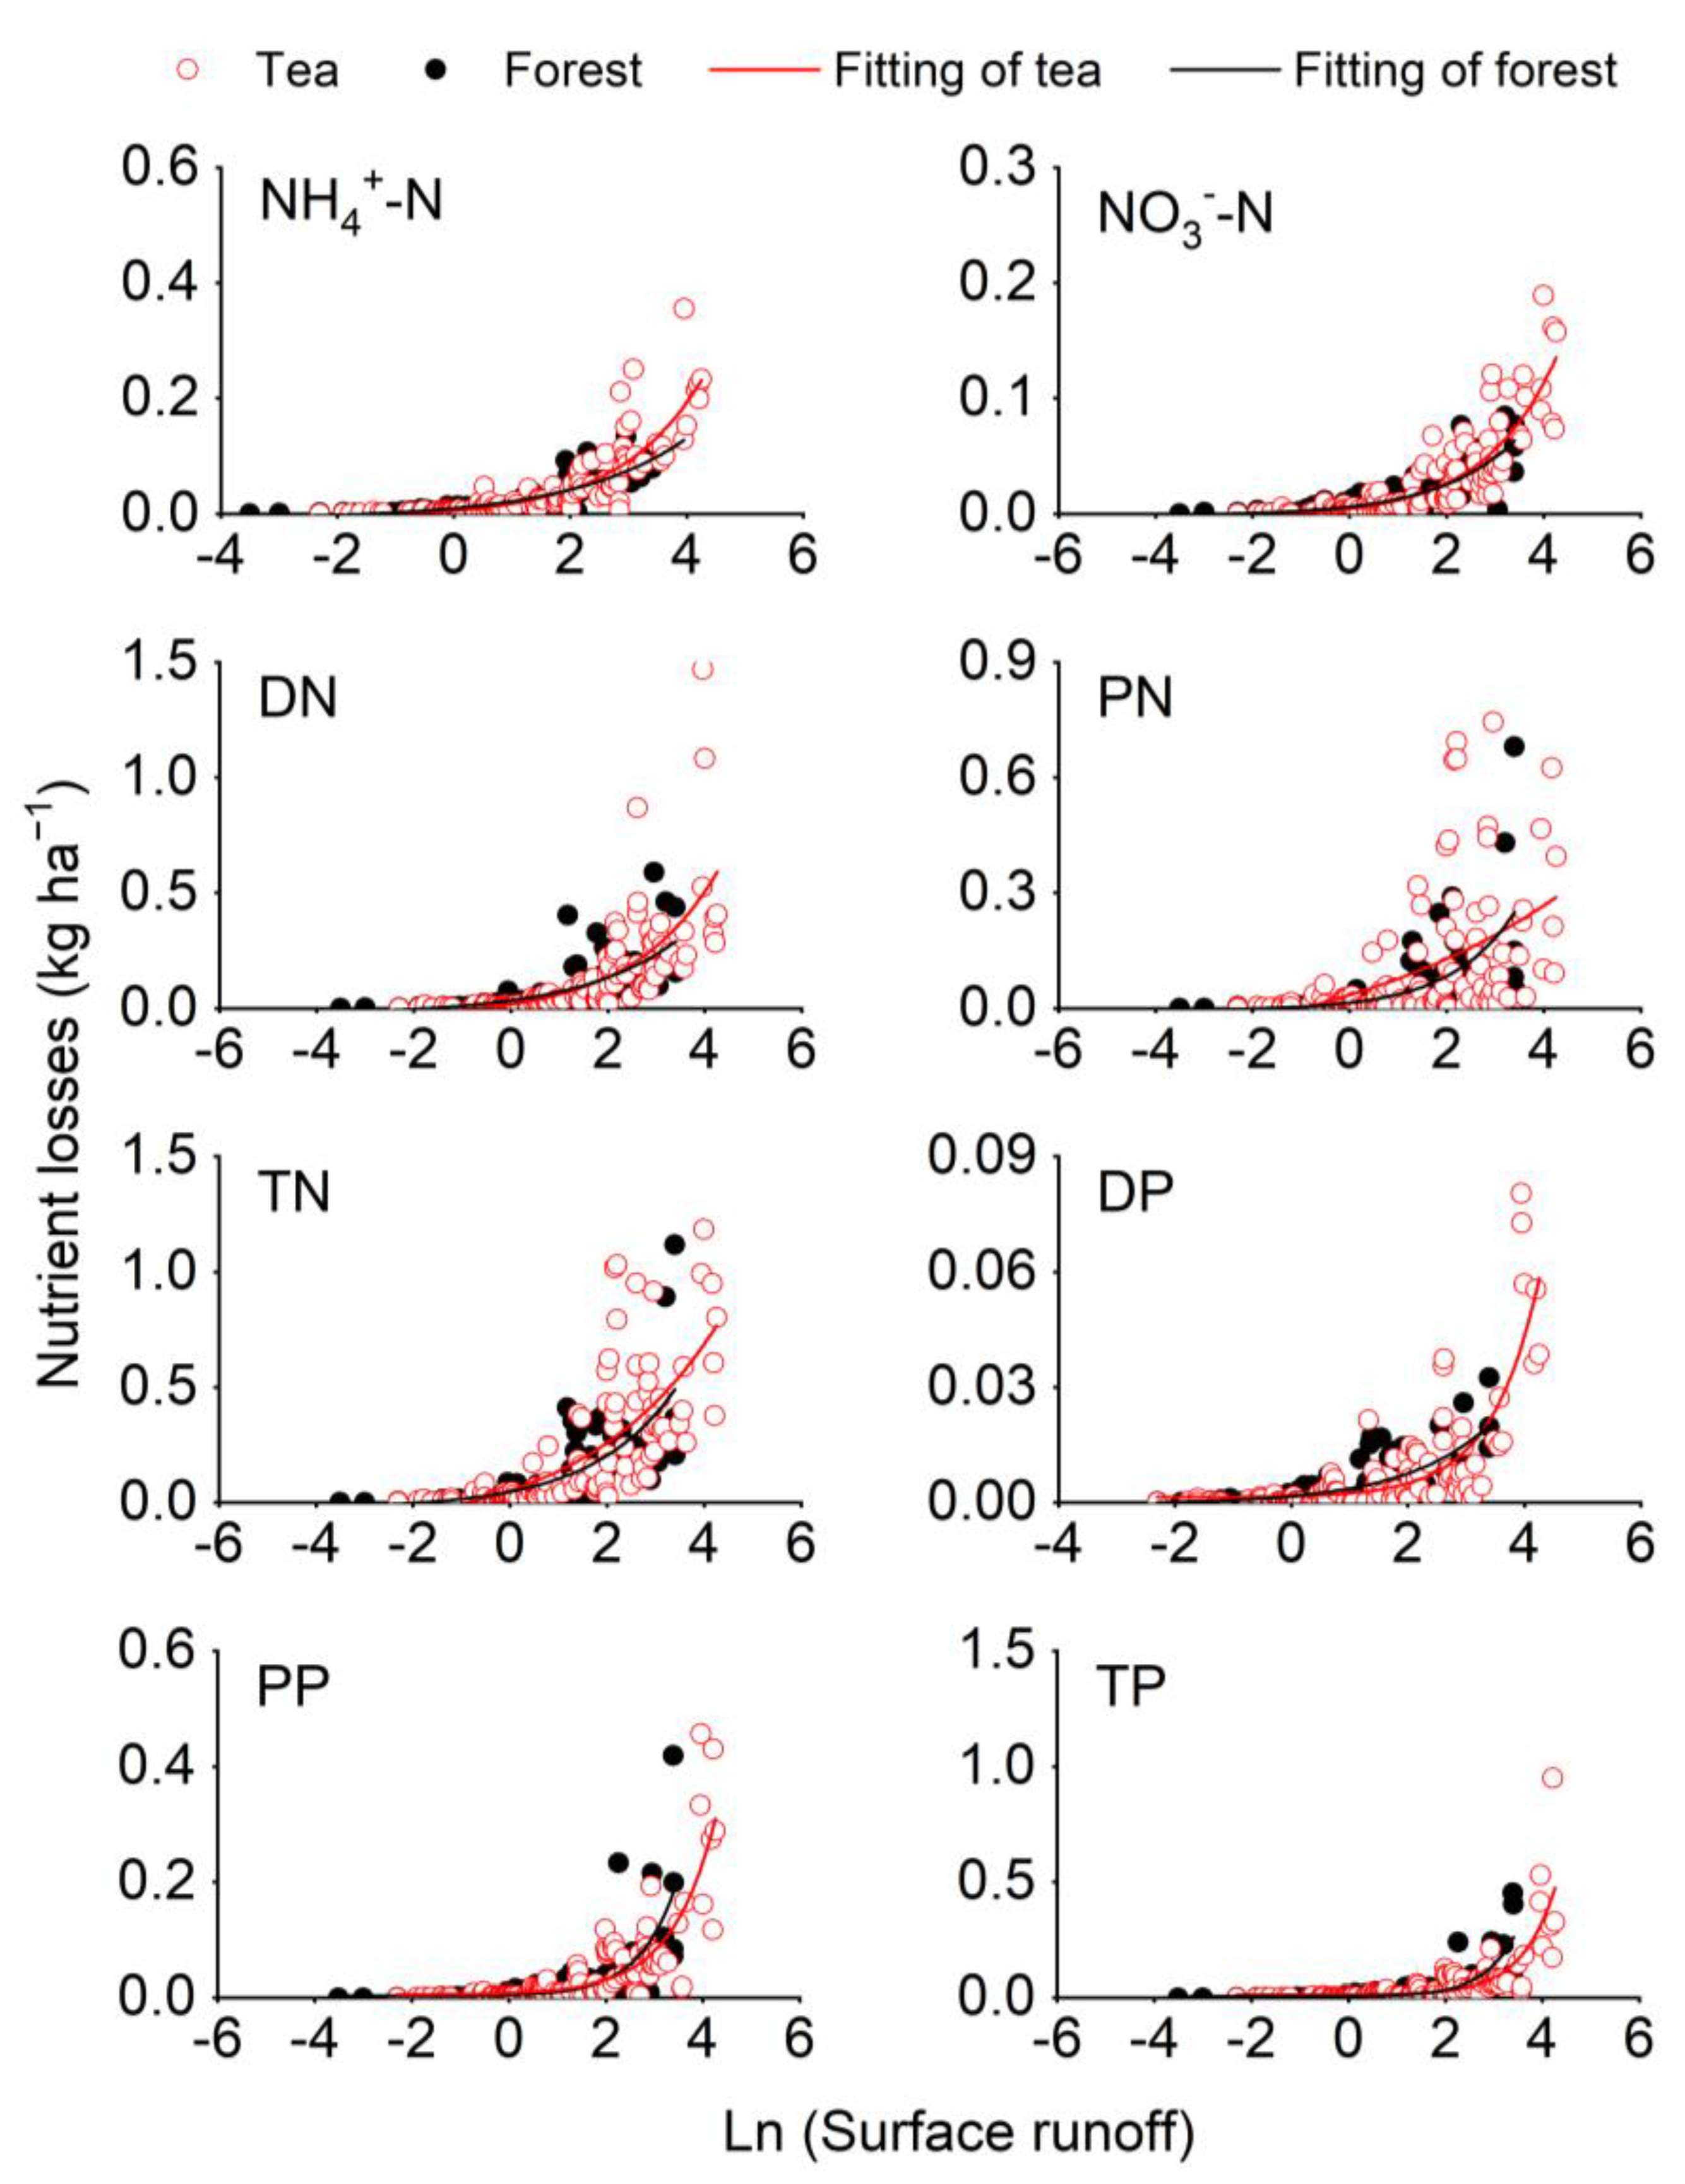
−1 in the forest system, respectively. When comparing the two systems, the annual TN, TP, PN, and PP losses in the tea system were 2.2–3.5 times higher than in the forest system, while the DN, NH
4+-N, NO
3−-N, and DP losses were 1.8–2.0 times higher than in the forest system. Interestingly, all the N and P losses at the rain event basis exponentially and significantly correlated with the surface runoff after the hyperbolic logarithm transformation (
p < 0.05) (
Figure 6). In particular, the coefficients of determination (R
2) for the goodness of fit were generally higher in the forest system than in the tea system (
Table 4).
4. Discussion
More surface runoff was received in the tea system than in the forest system (
Figure 2), which was associated with the change in the slope and soil structure restoration and the vegetation cover. Llorens observed that slope terracing can fully retain rainfalls of approximately 50 mm over 24 h without generating surface runoff in the subhumid Mediterranean basin, Spain [
23]. Hence, it is reasonable to believe that slope terracing during tea system establishment can effectively reduce surface runoff. The field determination showed an obvious difference in the soil properties between the forest and tea systems (
Table 2), which should be attributed to violent man-induced agricultural activities [
12,
16,
17], particularly for intensive soil movement and refill from slope terracing [
16]. Arnáez et al. concluded that slope terracing provides flat surfaces and deep, loose soils that increase infiltration and reduce runoff [
15]. In our study, the annual surface runoff volumes and ratios were significantly greater in the tea system than in the forest system (
Figure 2). These inconsistent results could be explained by the distinguished vegetation canopy interception between the two systems. The canopy interception could be assumed to be zero in the tea system because the tea trees were short, whereas it accounted for 15.45% of the annual precipitation in the forest system, as estimated using the Water and Nutrient Management Model (WNMM) (unpublished data). The canopy interception ratio in the forest system almost compensated for the difference in the surface runoff ratios between the two systems, suggesting that the contribution of the change in the slope and soil structure to the surface runoff is approximately zero. Therefore, use of the slope terracing technique during tea system establishment increased the water infiltration and, hence, covered the contribution of the change in the slope and soil structure to the surface runoff processes.
The TN concentrations in the surface runoff were higher in the tea system than in the forest system (
Figure 3) due to the higher fertilizer application rates (100–300 kg N ha
−1 yr
−1) in the tea system. The proportion of the DN in the TN (DN/TN) was significantly lower in the tea system than in the forest system, while the PN in the TN (PN/TN) was significantly higher in the tea system than in the forest system (
Table 3). The lower DN/TN proportion in the tea system can be explained by the water-soluble N present in the soil, which can be confirmed by the lower NH
4+-N and NO
3−-N concentrations in the surface runoff in the tea system than in the forest system (
Figure 3). The higher PN/TN proportion can be attributed to the increased soil erodibility associated with the loose surface soil (
Table 2) in the newly reclaimed tea system [
15]. Theoretically, the soil erodibility strongly correlates with the surface runoff [
24,
25], which is also the reason why the surface runoff was significantly correlated with the N concentrations (TN and PN) in the tea system (
Figure 4).
There were no significant differences in the P concentrations and the DP/TP and PP/TP proportions in the surface runoff between the tea and forest systems (
Figure 3 and
Table 3). The conversion of forest hillslopes into tea fields usually removes the original surface soil with relatively rich P content during slope terracing, and the P concentrations should be lower in the tea system than in the forest system. There are two likely routes by which the tea system increased the P concentrations. First, the additional P applied through fertilization into the tea soils compensated for the P-deficient surface soil and effectively increased the P loss capacity through surface runoff [
25,
26]. Second, P is prone to being fixed in acid soils in the form of Al/Ca/Fe-bound P and lost in the form of P-containing minerals through soil erosion [
27]. However, land reclamation and slope terracing usually decrease the hydrological connectivity [
15], such that the surface runoff was significantly correlated with the DP and PP concentrations in the forest system but not in the tea system (
Figure 4). This situation highlights the disturbance of converting forest hillslopes into tea fields in relation to the surface hydrology and resulting N and P losses.
The N and P losses through the surface runoff were higher in the tea system than in the forest system (
Figure 5), suggesting that converting forest hillslopes into tea fields increases the N and P losses along hillslopes. The increased N and P losses can be explained by three factors. The first factor is the high fertilizer application rates, which represent the largest source of N and P in the surface runoff water of the tea system. The common fertilizer application rate is approximately 450 kg N ha
−1 yr
−1 [
1,
2,
8], which is higher than the 100–300 kg N ha
−1 yr
−1 due to the short tea trees in the studied tea system (
Table 1). This situation implies that the N losses may increase when the tea trees mature. The second factor is the increased surface runoff, which is a major driving force behind N and P migration along hillslopes [
18,
19]. The annual TN and TP losses through the surface runoff reached as high as 11.07 ± 4.03 kg N ha
−1 yr
−1 and 1.73 ± 0.79 kg P ha
−1 yr
−1, respectively. These values were higher than the 3.24–15.36 kg N ha
−1 yr
−1 and 0.24–1.44 kg P ha
−1 yr
−1, respectively, at the catchment scale in the studied region [
28], highlighting the importance of converting forest hillslopes into tea fields in relation to the environmental water quality. The third factor is the degradation of the soil structure and change in the slope structure during the conversion of forest hillslopes into tea fields. This mechanism can be confirmed by the decreased soil bulk density and increased saturated soil conductivities within the soil profile (
Table 2) and the increased particle N and P concentrations in the surface runoff in the tea system (
Figure 3).
The N and P losses exponentially and significantly correlated with the surface runoff after the hyperbolic logarithm transformation in both systems (
p < 0.001) (
Figure 5), indicating that the N and P losses through the surface runoff were significantly influenced by the runoff rate rather than by the N and P concentrations in the runoff (Zhang et al., 2016). A similar relationship between the N and P losses and surface runoff, which is usually used to estimate the N and P losses at the catchment scale, was widely determined in streams and rivers [
29]. For example, the USGS program ESTIMATOR estimated the catchment substance export through the effective interpolation between the different water quality observation intervals based on the relationship between the catchment substance export intensity and surface runoff flow after the hyperbolic logarithm transformation [
30,
31,
32]. Our results suggested that these relationships also existed at the slope scale and can be used to estimate the N and P losses in the first three years of the conversion of forest hillslopes into tea fields. However, the coefficients of determination (R
2) of the goodness of fit were generally higher in the forest system than in the tea system (
Table 4), which indicates that the exponential relationship between the surface runoff and the N and P losses should be more stable in the forest system than in the newly reclaimed tea system.
Many studies have demonstrated the importance of land use effects on soil surface hydrology and N and P loss processes in stable and long-term ecosystems [
3,
5,
7,
11,
33]. Our results further confirmed that the conversion of forest hillslopes into tea fields increased the N and P losses along the hillslopes in subtropical China and highlighted the importance of appropriate land use conversion to protect the environmental water quality in agricultural regions. However, further studies are required to isolate the mechanisms that cause land use conversion to increase the N and P loss processes and assess the environmental and agronomic effectiveness of converting forest hillslopes into tea fields in the first years. In particular, efforts to control the N fertilization application rates and reduce the soil surface runoff must be evaluated. In general, to reduce the soil surface runoff and the resulting N and P losses along the slope areas, the conversion of forest hillslopes into tea fields must be carefully conducted.


