Article

Analysis of County-Scale Eco-Efficiency and Spatiotemporal Characteristics in China

1
Key Laboratory of Western China’s Environmental Systems (Ministry of Education), College of Resources and Environment, Lanzhou University, Lanzhou 730000, China
2
Institute of Green Development for the Yellow River Drainage Basin, Lanzhou University, Lanzhou 730000, China
3
Institute for Circular Economy in Western China, Lanzhou University, Lanzhou 730000, China
*
Author to whom correspondence should be addressed.
Land 2023, 12(2), 438; https://doi.org/10.3390/land12020438
Submission received: 2 January 2023 / Revised: 30 January 2023 / Accepted: 6 February 2023 / Published: 8 February 2023
(This article belongs to the Special Issue Urban and Rural Land Use, Landscape and Sustainability)

Abstract

:
Eco-efficiency is a key indicator to measure the level of regional sustainable development. The county is the basic spatial unit of socio-economic activities and sustainable policy implementation in China. Hence, this paper conducts eco-efficiency analysis at the county scale in order to provide reference for the central and local governments to formulate differentiated eco-efficiency enhancement policies, further promote Chinese ecological sustainable development, and advance the construction of ecological civilization with high quality. Based on the Super-Slacks-Based Measure (SBM) model and the Malmquist index, the paper constructed an eco-efficiency measurement method and analyzed the variation characteristics, influencing factors, spatial pattern of eco-efficiency in Chinese counties from 2000 to 2020. The results showed that: (1) The eco-efficiency of the county unit was generally low in China and was roughly distributed in a pyramid. The county-level eco-efficiency had a spatial distribution pattern of being high in the west and low in the east, and high in the south and low in the north, with significant non-equilibrium. There was a positive correlation between eco-efficiency of neighboring counties in China. (2) The per-capita GDP has a significant positive correlation with eco-efficiency, while energy consumption, arable land area and eco-efficiency have a negative correlation. The redundancy rate of input indicators was high in Chinese counties. (3) During the study period, the eco-efficiency of most counties displayed a fluctuating growth trend. The growth was mainly driven by technological progress.

1. Introduction

Since China’s reform and opening up, China’s rapid economic growth has improved the well-being of its people while aggravating issues such as resource depletion, environmental pollution, and ecological destruction. From the perspective of resource and environmental constraints, China’s environmental carrying capacity has reached or is close to the upper limit. The unique geographical environment has intensified the imbalance of resources, environment and ecological problems among regions. Therefore, it is necessary to promote the formation of a new green low-carbon cycle development model through changes in production, consumption, and lifestyle so as to obtain the maximum economic and social benefits with minimum resource consumption and the lowest eco-environmental impact possible. With the continuous improvement of eco-efficiency, the construction of an ecological civilization and 2030 Sustainable Development Goals (SDGs 2030) can be realized. Research has shown that population expansion and urbanization are one of the main causes of resource consumption, environmental pollution, and ecological destruction [1]. The population within China’s 2844 county-level administrative regions accounted for about 74% of the country’s total population at the end of 2020 [2]. The county is not only an important driver of future urbanization but also the main spatial unit of resource consumption, environmental pollution, and ecological destruction activities. The county is the basic spatial unit of China’s superior policy implementation and is therefore essential for the successful implementation of sustainable development and ecological civilization construction policies [3]. Hence, eco-efficiency research on the county scale is of great significance for more finely depicting the spatiotemporal pattern characteristics of eco-efficiency and formulating differentiated eco-efficiency enhancement policies.
First put forward by scholars Schaltegger and Sturm in 1990, eco-efficiency is defined as the ratio of the value of services or products to their environmental impact [4]. Since then, international institutions such as the World Business Council for Sustainable Development (WBCSD), the Organization for Economic Cooperation and Development (OECD), and the European Environment Agency (EEA) have further developed and improved the concept of eco-efficiency [5,6,7]. These institutions argue that eco-efficiency should focus not only on resource and energy consumption but also on environmental pollution so as to obtain more value from products and services with minimum resource consumption and environmental pollution. Although there are differences in the expression of the concept of eco-efficiency in academic circles, its essential content has formed a consensus, which is to obtain the maximum socio-economic output with the minimum environmental resources and ecological costs. On this basis, existing studies have conducted extensive research on assessment models and methods of eco-efficiency. The current eco-efficiency assessment methods mainly include the single ratio method [8,9], the indicator system method [10,11,12], and the model method. The model method has become a common method used to assess eco-efficiency because it can avoid the subjectivity of weight assignment. The Data Envelopment Analysis (DEA) model has significant advantages in the analysis and processing of multi-input and multi-output decision-making units because of its accurate assessment results and complete preservation of the original indicator data. To overcome the issues of relaxation and radiality of the traditional DEA model, scholars in China and abroad have extended more targeted models, such as the SBM, super-efficiency DEA, three-stage DEA, and Malmquist total factor productivity index (MI), to improve the accuracy of eco-efficiency assessment [13,14].
Using the above models, scholars have evaluated the eco-efficiency of different industry sectors, including industry, agriculture, tourism, and commerce [15,16,17], to analyze the industry heterogeneity of eco-efficiency. Other scholars conducted eco-efficiency research at the regional level from different scales. Mainly focusing on macro- and meso-scales such as global [18], national [19,20], regional [21,22], and urban scales [23], these scholars analyzed the spatiotemporal pattern evolution characteristics of eco-efficiency and explored the driving factors of eco-efficiency evolution and the impacts [24,25]. In this research field, most studies on China have taken the whole country, provinces, the Yangtze River economic belt, the Yellow River basin, and urban agglomerations as research objects to depict the characteristics of spatiotemporal patterns on the provincial and urban scales. For example, Zhang analyzed the spatiotemporal evolution characteristics of eco-efficiency in China using panel data from 30 provinces in mainland China [26]. Qiu conducted a quantitative measurement and spatiotemporal evolution analysis of county eco-efficiency in Zhejiang province [27]. In addition, Ren evaluated and analyzed the eco-efficiency and spatiotemporal evolution characteristics of four major urban agglomerations in the eastern coastal areas [24].
In general, studies on the spatiotemporal pattern of eco-efficiency in China mainly focus on the provincial and regional scales, while few studies have focused on the county scale. Limited by data availability, there is no research on the spatiotemporal pattern evolution of eco-efficiency in China on the county scale. In addition, only a small number of existing studies have been conducted on the county scale for specific regions such as Zhejiang province, Shandong province, and the Yangtze River basin [27,28,29]. Most of this research work is based on multi-year cross-sectional data and lacks the dynamic monitoring of efficiency at different stages.
In view of this, the purpose of this research is to explore the effectiveness of China’s ecological civilization construction and further promote China’s ecological sustainable development. This study provides an in-depth analysis of the overall and divergent characteristics, dynamic evolution and spatial and temporal patterns of county-scale eco-efficiency in China. We took 1766 counties as the research object and constructed an eco-efficiency assessment database based on multi-source geographic data and socio-economic data. The Super-SBM model considering the undesirable output was used to measure the eco-efficiency in Chinese counties in 2000, 2005, 2010, 2015 and 2020. Dynamic changes of efficiency were revealed by the MI (Malmquist Index). The causes of eco-efficiency inefficiency and the factors influencing eco-efficiency are explored in conjunction with input–output indicators. Based on this, the spatial correlation pattern and spatiotemporal dynamic characteristics of county eco-efficiency were analyzed in the paper, in order to provide reference for the central and local governments to formulate differentiated eco-efficiency enhancement policies and advance the construction of ecological civilization with high quality.

2. Materials and Methods

2.1. County Eco-Efficiency Indicator System

The paper constructed a county-scale eco-efficiency assessment system according to the Cobb–Douglas Production Function, drawing on a comprehensive reference to the existing research results [28,29,30], and based on the county characteristics and data availability.
(1) Input indicators
Due to the limitation of data availability and quality (the missing capital input data were mainly located in Shanxi province, Fujian province, and the Tibet autonomous region), the study ignored the capital input variable. Eventually, the labor force and natural resources inputs were selected as the input indicators in the paper (Table 1). In terms of the labor force, due to the lack of publicly available county-level statistics on employment data, the paper used the total population at the end of the year as the proxy variable. This was completed because the total population was the base of labor supply, which could reflect the labor supply to a certain extent. In terms of natural resources input, two types of resources, land and energy resources, were selected in the paper. Land input included the area of arable land and construction land. The county is not only the main spatial unit of China’s agricultural and rural development but also a key carrier of future urbanization. Therefore, arable land and construction land are the most important in terms of land input. Energy input was measured based on the energy consumption index. Existing studies have shown that there is a linear relationship between lighting area, lighting brightness, and electric energy consumption [31,32]. Thus, night-time lighting data can be used as indicators of energy consumption. Referring to the research of Ma et al. [28], The sum of the grayscale values of the night-time lighting data raster within the administrative region was used as the energy consumption index of this region.
(2) Output indicators
The outputs included desirable output and undesirable output. The paper selected the regional gross domestic product (GDP) as the desirable output while the average annual PM2.5 concentration was selected as the undesirable output. Rapid economic development is accompanied by serious environmental pollution. The decline in air quality has become one of the main factors hindering county’s sustainable development. Given the availability of data, the average annual concentration of PM2.5, which is the main air quality pollutant in China, was selected as the undesirable output.

2.2. Data Source and Processing

Based on the county-level administrative divisions announced by the Ministry of Civil Affairs of the People’s Republic of China in 2020, the paper selected 1766 counties as the study objects, excluding 974 municipal districts and 104 county-level administrative units that lacked sufficient data. The selected data covered 30 provinces, municipalities, and autonomous regions (the Tibet autonomous region, Taiwan province, Hong Kong, and Macao special administrative regions were not included).
The data of arable land area and construction land area were obtained from the Chinese multi-period land use/land cover remote sensing monitoring database provided by the Institute of Geographic Sciences and Resources Research of the Chinese Academy of Sciences, with a resolution of 30 m × 30 m. The night-time lighting data were derived from the National Tibetan Plateau Scientific Data Center (NTPSDC) the China long time series annual artificial night-time lighting data set (PANDA) from 1984 to 2020. The year-end total population and GDP were obtained from the China County Statistical Yearbook, the China Regional Economic Statistical Yearbook, the statistical bulletins of national economic and social development of counties and cities, and the China regional economic database on the EPS data platform. Part of the missing data were calculated using the metabolic gray prediction model GM (1, 1) [33]. The PM2.5 data were derived from the air quality automatic monitoring results of the national air quality automatic monitoring sites.
Based on the map data of 2020 Chinese county-level administrative divisions, ArcGIS10.7 software was used to project, calculate, extract values, and reject outliers from the acquired grid raw data of multi-source remote sensing images. Then, the extracted values were matched with socio-economic statistics to construct a complete county-scale eco-efficiency assessment database.

2.3. Research Methods

2.3.1. Super-SBM Model Based on Undesirable Output

Data envelopment analysis is a model for estimating the distance of decision-making unit (DMU) relative to the production frontier surface on the basis of linear programming, and the production frontier surface consists of efficient DMUs [24]. The efficiency value of a DMU is indicated by the relative ratio of output to input [34], and the closer the DMU is to the production frontier, the higher the efficiency value [35].
Since traditional DEA models cannot effectively address issues such as variable slackness and efficiency of non-desired outputs, Tone proposed a non-radial and non-angular SBM model in 2001 [36]. Then, the Super-SBM model was further proposed in combination with the super-efficiency DEA model [37], which can not only effectively solve the efficiency problem under undesirable output but can also effectively measure the assessment unit located in the frontier (efficiency value > 1) [38]. The model equation is as follows:
Min ρ = 1 + 1 m i = 1 m s i X i k 1 1 q 1 + q 2 ( r = 1 q 1 s r + y r k + t = 1 q 2 s t b b t k )
s . t   j = 1 , j k n x i j λ j + s i x i k
j = 1 , j k n y r j λ j s r + y r k
j = 1 , j k n b t j λ j + s t b b t k
1 1 q 1 + q 2 ( r = 1 q 1 s r + / y r k + t = 1 q 2 s t b / b t k ) > 0
λ ,   s ,   s + 0
i = 1, 2, …, m; r = 1, 2, …, q1; t = 1, 2, …, q2, j = 1, 2, …, n (jk)
In the equation, ρ represents the county eco-efficiency; m represents the number of input indicators; q1 and q2 represent the number of desirable outputs and undesirable outputs, respectively; xik, yrk, and btk are the i-th input factor, the r-th desirable output, and the t-th undesirable output of the k-th county (city), respectively; si, s+r, and sb−t are the slack variables of input factor, desirable output, and undesirable output, respectively; and λj is the constraint.

2.3.2. Malmquist Index

The concept of the MI was first introduced by Malmquist in 1953 [39]. The MI can compare the eco-efficiency of counties (cities) in different years and assess the dynamic changes of eco-efficiency [40]. Scholars including Färe and Grosskopf then applied the MI to DEA and decomposed the MI into technical efficiency change (EC) and production technological (production frontier) change (TC) [41]. This paper referred to Jesús T. Pastor’s study and selected the global reference Malmquist model to measure the dynamic eco-efficiency of 1766 counties in China [42].
Taking the k-th decision-making unit as an example, it is assumed that the input–output of the k-th decision-making unit in period t is (xtk, ytk, btk, gtk). The specific equation for the total factor productivity index from period t to period t + 1 is as follows:
MI t t + 1   = 1 + D k t ( x k t , y k t , b k t , g k t ) 1 + D k t ( x k t + 1 , y k t + 1 , b k t + 1 , g k t + 1 ) · 1 + D k t + 1 ( x k t , y k t , b k t , g k t ) 1 + D k t + 1 ( x k t + 1 , y k t + 1 , b k t + 1 , g k t + 1 ) = 1 + D k t ( x k t , y k t , b k t , g k t ) 1 + D k t + 1 ( x k t + 1 , y k t + 1 , b k t + 1 , g k t + 1 ) · 1 + D k t + 1 ( x k t , y k t , b k t , g k t ) 1 + D k t ( x k t , y k t , b k t , g k t ) · 1 + D k t + 1 ( x k t + 1 , y k t + 1 , b k t + 1 , g k t + 1 ) 1 + D k t ( x k t + 1 , y k t + 1 , b k t + 1 , g k t + 1 ) =   EC t t + 1 · T C t t + 1
If MI t t + 1 is greater than 1, it means that the eco-efficiency of the region increases from period t to period t + 1, while the opposite indicates a decrease in eco-efficiency [40].   EC t t + 1 is the technological efficiency improvement index, indicating the change in the degree of the maximum possible output as indicated by the resource environment frontier and the actual production in each county, also known as the catch-up effect. If the value of this index is greater than 1, it means that there is a technological efficiency improvement from period t to period t + 1, indicating that the policies and instruments of resource allocation, resource utilization, and resource-environmental management are effective, and that the improvement of technological efficiency promotes the improvement of eco-efficiency. Conversely, the opposite means that there is an efficiency loss. T C t t + 1 is the technological progress index. If the value is greater than 1, it means that the county produces more desirable output and less undesirable output from the period t to the period t + 1, resulting in technological progress and thus promoting the improvement of eco-efficiency. If the value is less than 1, it means that the county produces less desirable output and more undesirable output, resulting in technological retrogression [43].

2.3.3. Spatial Autocorrelation Analysis

Spatial autocorrelation analysis includes global spatial autocorrelation and local spatial autocorrelation. The Global Moran’s I (GMI) measures the overall correlation degree of eco-efficiency while the Local Moran’s I (LMI) reflects the spatial correlation degree of adjacent counties [30]. The equations are as follows, respectively:
GMI = n i = 1 n j = 1 n ω i j ( x i x ¯ ) ( x j x ¯ ) ( i = 1 n j = 1 n ω i j ) i = 1 n ( x i x ¯ ) 2   = i = 1 n j = 1 n ω i j ( x i x ¯ ) ( x j x ¯ ) S 2 i = 1 n j = 1 n ω i j
L M I i   = n ( x i x ¯ ) j = 1 n ω i j ( x i x ¯ ) i = 1 n ( x i x ¯ ) 2   = ( x i x ¯ ) S 2 j = 1 n ω i j ( x i x ¯ )
In the equations, n is the number of study samples, xi and xj represent the eco-efficiency values of the i-th and j-th county (city), respectively; x represents the average regional eco-efficiency, S2 is the sample variance, and wij is the spatial weight matrix. The second-order adjacency matrix was adopted in the paper.
The value range of the GMI is [−1, 1]. If the GMI is greater than zero, it means that there is a positive spatial correlation. If GMI is equal to zero, it means that there is no spatial correlation and the sample exhibits a random distribution. If GMI is less than zero, it means that there is a negative spatial correlation. The positive (negative) Local Moran’s I indicates the spatial proximity of counties with similar (dissimilar) attributes. The agglomeration types can be specifically classified into four categories, namely high–high (H-H), high–low (H-L), low–low (L-L), and low–high (L-H) agglomeration.

3. Results and Discussion

3.1. County-Scale Eco-Efficiency and Assessment in China

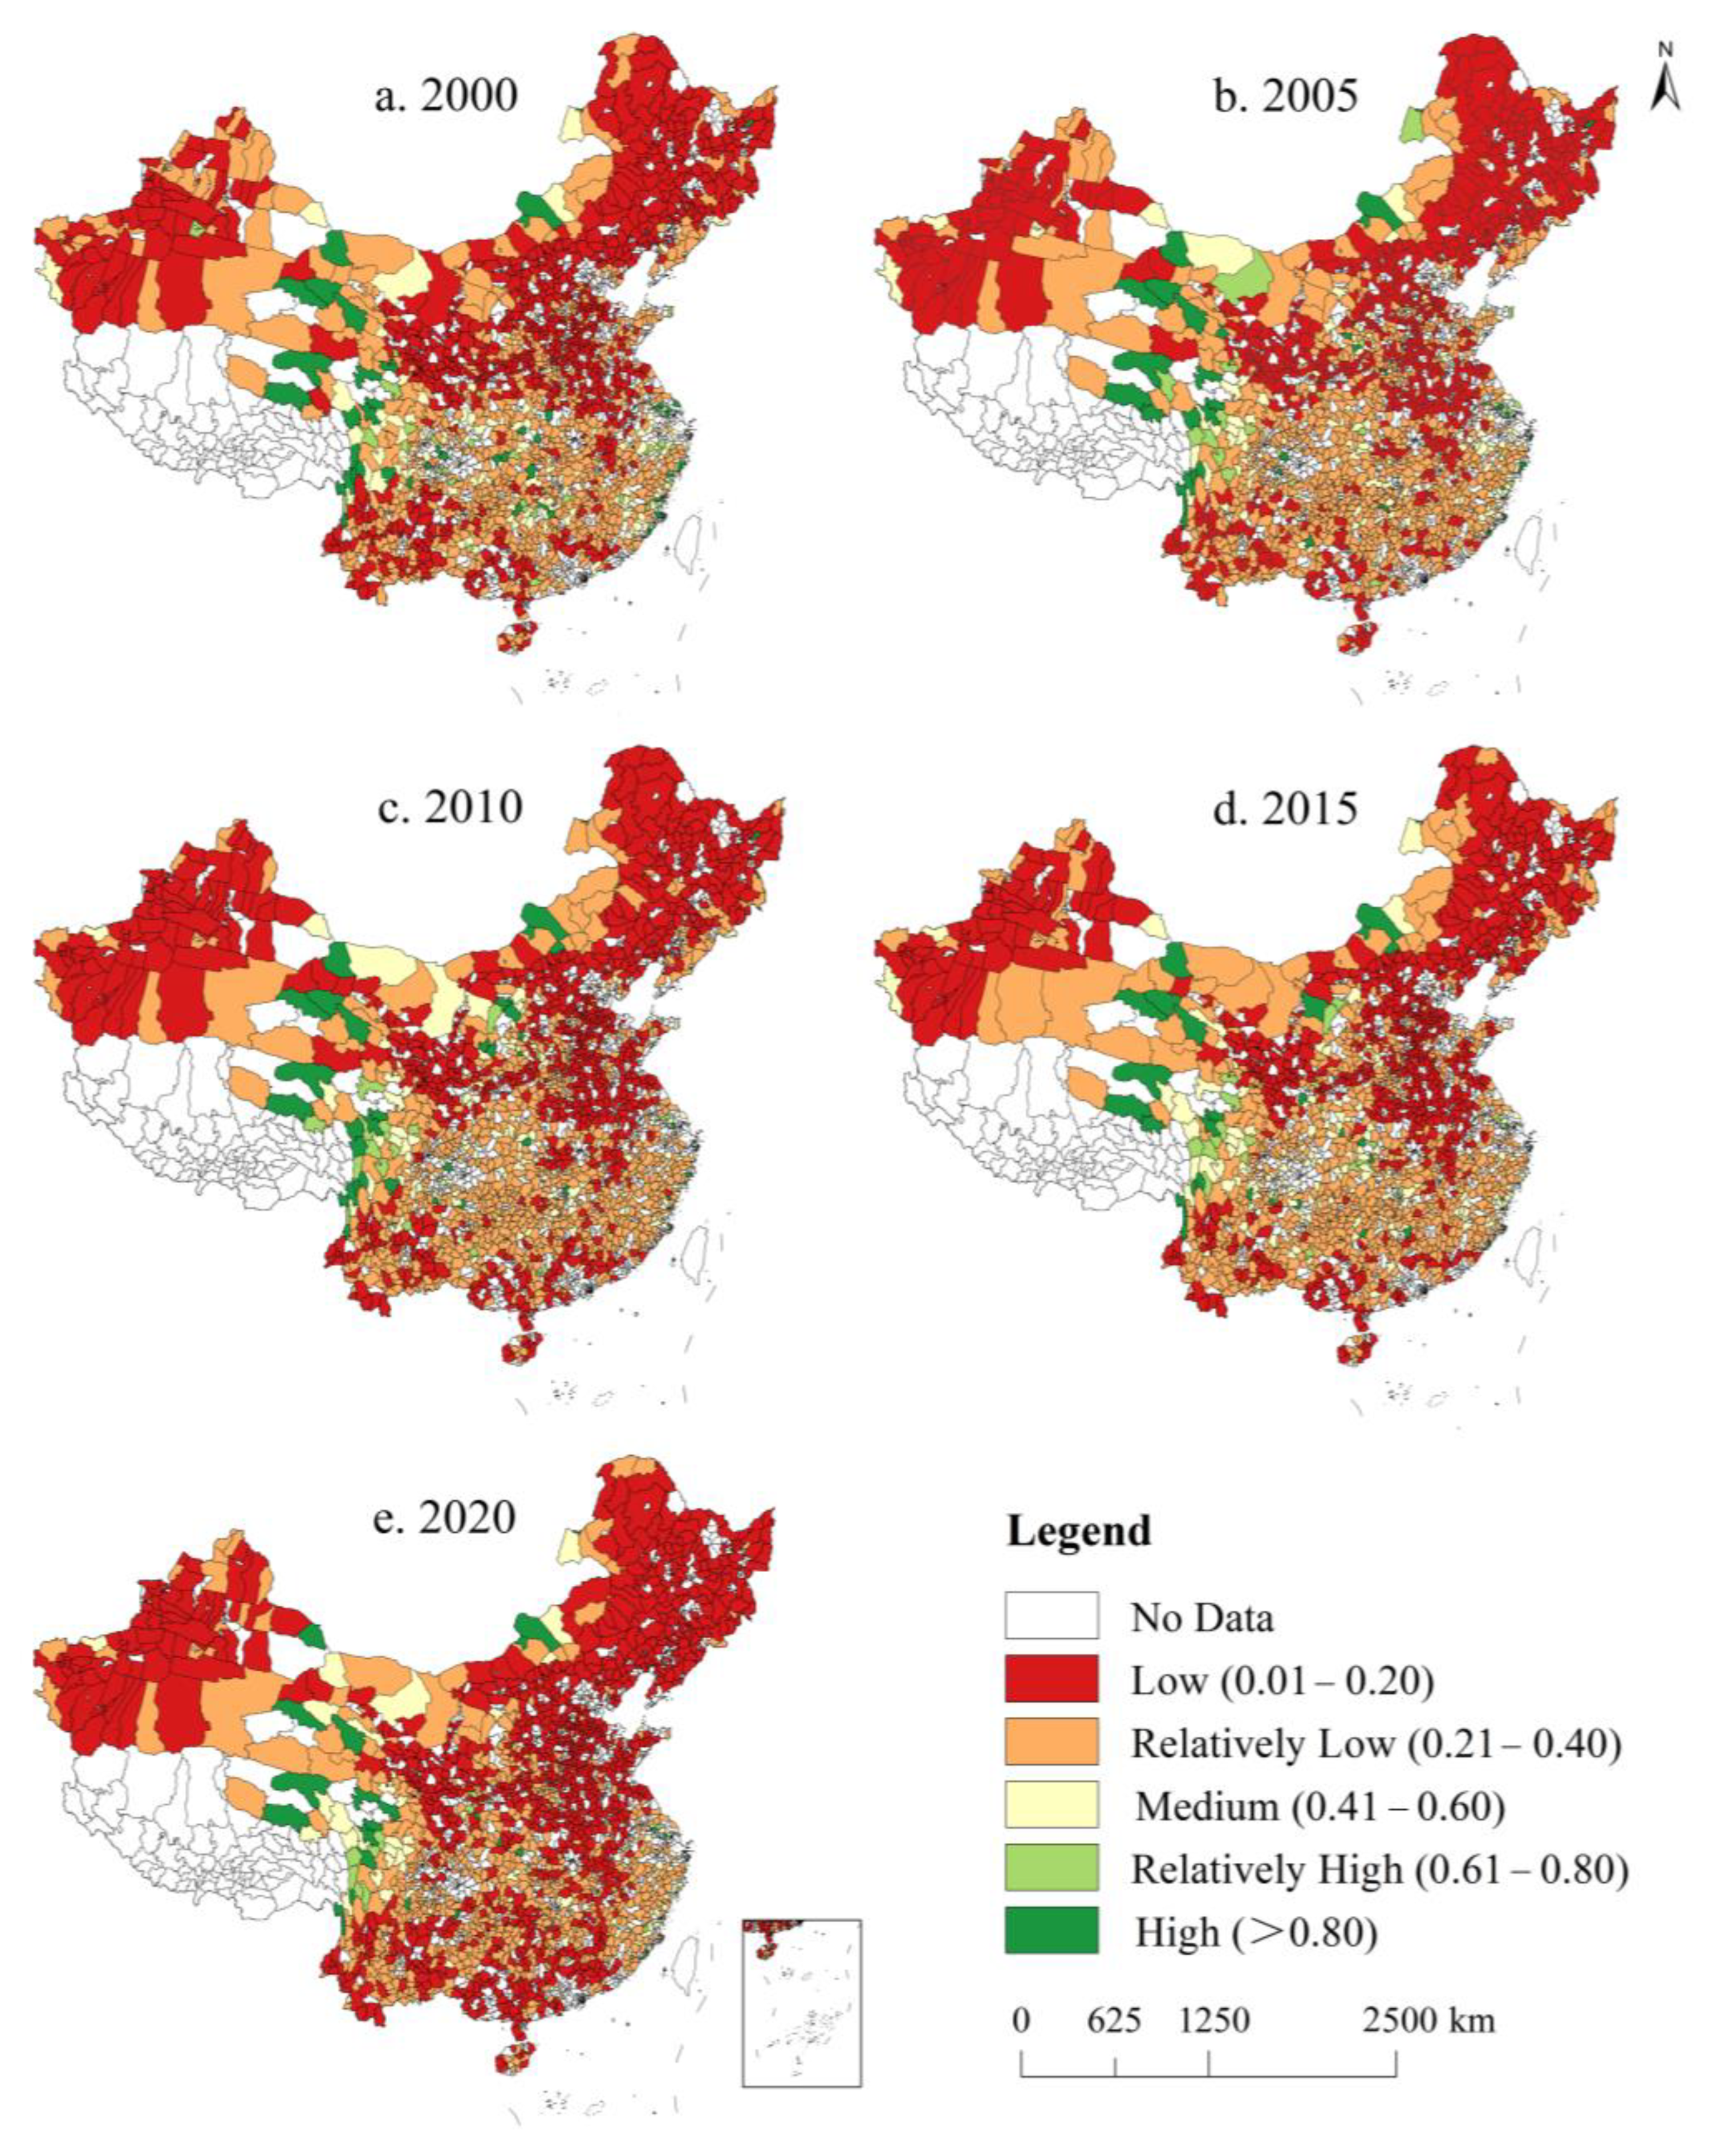
3.1.1. General Characteristics of County Eco-Efficiency

The eco-efficiency values of Chinese counties were calculated using MAXDEA Ultra 9.1 software, and the descriptive statistics are shown in Figure 1.
As shown in Figure 1, the overall eco-efficiency of county units in China was low in the five years studied. (1) The county eco-efficiency values were roughly distributed in a pyramid. The interval with the largest number of county units was concentrated below 0.4, accounting for more than 80% of the total. (2) The number of county units with eco-efficiency values above 0.80 was small, accounting for about 2% of the total in all five years studied. From 2000 to 2020, the number of county units reaching the DEA frontier decreased from 40 to 27, displaying a continuous downward trend. (3) There were only 12 counties (cities) in which the eco-efficiency values were greater than 1 in all five years studied. In addition, these eco-efficiency values were high and stable in the years of study. In these counties, the ecological background was good and the industrial structure was dominated by agriculture and animal husbandry. Moreover, the levels of urbanization and economic development in these counties were low.

3.1.2. Spatially Divergent Characteristics of Eco-Efficiency

The 0.2 step method was adopted to divide Chinese counties into five types, including the low eco-efficiency zone (0.01 < EE ≤ 0.20), the relatively low eco-efficiency zone (0.21 < EE ≤ 0.40), the medium eco-efficiency zone (0.41 < EE ≤ 0.60), the relatively high eco-efficiency zone (0.61 < EE ≤ 0.80), and the high eco-efficiency zone (EE > 0.80) [44] (Figure 2).
In general, the spatial differentiation of eco-efficiency was significant on the county scale, showing clear characteristics of being high in the west and low in the east, and high in the south and low in the north. This result was different from the spatial pattern of east > central > west in China on the provincial scale [14,44,45,46], indicating that the spatial pattern of eco-efficiency was characterized by a level of scale dependence. Within the different types of zones, there was also significant spatial heterogeneity in the distribution of eco-efficiency. (1) Low eco-efficiency zones and relatively low eco-efficiency zones were mainly distributed in Xinjiang, the three northeast provinces, and the North China Plain. Xinjiang, the three northeast provinces, and the North China Plain are rich in coal, oil, and gas resources. The mode of economic development is relatively extensive, the industrial structure is single, and the mode of resource utilization is extensive. As a result, the level of eco-efficiency was low. (2) The high eco-efficiency zone was mainly distributed in Qinghai, western Sichuan, and the southeast coastal areas, including Fujian, Zhejiang, and Jiangsu. Most of the counties in Qinghai and western Sichuan belong to China’s ecological functional regions, with good ecological environment, low level of environmental degradation, and relatively low levels of industrialization and urbanization. Hence, the value of eco-efficiency was high. The coastal areas of Fujian, Zhejiang, and Jiangsu have a high degree of openness to the outside world, with upgraded industrial structures and strong economic output capacities. As a result, the value of eco-efficiency is high. (3) The medium and relatively high eco-efficiency zones were mainly distributed in the middle and upper reaches of the Yangtze River, such as Chongqing, Sichuan, Hubei, Hunan, and Jiangxi province. There are many technology-intensive industries in this region, which have achieved industrial scale, modern development and rapid economic development, so the efficiency value is high. Overall, most of the relatively high and high eco-efficiency zones were adjacent to municipal districts. These counties are adjacent to economically developed areas and are strongly radiated and diffused by the developed areas, with high levels of economic development. As a result, the eco-efficiency was high.
In order to analyze the spatial equilibrium of county eco-efficiency in China, the kernel density distribution of the eco-efficiency of Chinese counties was drawn (Figure 3). In terms of shape, the kernel density curves of eco-efficiency showed a clear unimodal distribution in all five years studied. This result indicated that the eco-efficiency of Chinese counties showed a trend of agglomeration with significant non-equilibrium. However, there was no trend of bifurcation. In terms of kurtosis, the position of the peak was on the left side in all years, which was less than 0.2, further indicating that most of the county eco-efficiency was at the low to medium level.

3.1.3. Eco-Efficiency Loss and Improvement Analysis

County eco-efficiency level is closely related to its input–output level. According to the principle of SBM model, if the effective value of DMU is less than 1, the size of slack variables si, s+r, and sbt can reflect the cause of the inefficiency of eco-efficiency at county level. Therefore, the cause of efficiency loss can be further analyzed and the reasonable way to improve eco-efficiency can be discussed. The average relaxation rates of input and output were calculated for 1691 ineffective county units (eco-efficiency value < 1) in the five years studied. The results are shown in Table 2 and Figure 4.
From the perspective of input indicators, the overall redundancy rate of each input indicator was high. The redundancy rate of input indicators in most counties was more than 60%, indicating that most of the resource inputs were not fully utilized in practice, resulting in the waste of resources. From the perspective of output indicators, the redundancy rate of undesirable output varied greatly from county to county, which was related to the industrial structure and resource endowment of different counties. The majority of the desirable output insufficiency rate was zero, indicating that the GDP output of most counties was saturated. Therefore, increasing the desirable output would have little impact on improving the level of eco-efficiency.
(1) The high-value zones of the energy input redundancy rate were mainly distributed in the three northeast provinces, the North China Plain, northwest China, and Yunnan province, indicating that the effective utilization rate of energy was low in this type of zone. The extensive industrial development model, excessive dependence on resources, and outdated technology and equipment in these areas led to a large amount of energy not being used effectively. As a result, there is a large potential for energy conservation in these zones. (2) The high-value zones of the labor input redundancy rate were mainly distributed in the three northeast provinces, the middle and lower reaches of the Yangtze River, and the North China Plain, indicating that the labor productivity was low in this type of zone. As a result of the agglomeration of labor-intensive industries and the low overall quality of the labor force, a large proportion of the labor force has not been fully transferred, developed, and utilized. It is necessary to educate and train the labor force, thereby improving the quality and added value of the labor force, and to meet changes in the social demand structure. In addition, it is necessary to establish and improve the employment service system, broaden employment channels, and enhance employment quality. (3) The redundancy rate of land input is more than 80%, indicating that there is a large waste of land resources in counties throughout China. Land use is inefficient or idle due to unreasonable land planning and use, land financial dependence, and defects of the land-related legal system. Therefore, counties should attach importance to intensive land use and improve scientific and rigorous land planning through establishing a complete land use and operation mechanism. The local tax system should be improved and the financial dependence on land should be reduced. Furthermore, new concepts, such as ecological protection, should be introduced into land planning to construct an environmentally friendly land use model. (4) The high-value zones of undesirable output redundancy rate were mainly distributed in the northwest and the three northeast provinces, indicating excessive pollutant emissions in this type of zone. Since the development of western China, industries transferred from eastern regions and overseas as well as local industries mostly consist of traditional industries. Industries that cause high pollution and high environmental risks cause serious environmental pollution and reduce air quality in the northwest. Industries with high dependence on resources and heavy industry have led to serious environmental pollution in the three northeast provinces, limiting the regional economic development. (5) Areas where the GDP output was insufficient were remote counties, such as Luqu, Chengduo, and Ganzi county, which are accompanied by a weak economic foundation and insufficient investment, resulting in low levels of productivity. There is great room for improvement in these areas. The development level of the county economy can be enhanced through measures such as improving the level of science and technology and optimizing the economic structure.
Comparing the desirable output insufficiency rate and the undesirable output redundancy rate, the results showed that excessive annual average PM2.5 concentrations had a strong impact on the loss of eco-efficiency. The redundancy rate of undesirable output was low compared with that of input indicators. Hence, the improvement of eco-efficiency should focus on the rational allocation of input resources while taking into account the reduction in average annual PM2.5 emission concentration.

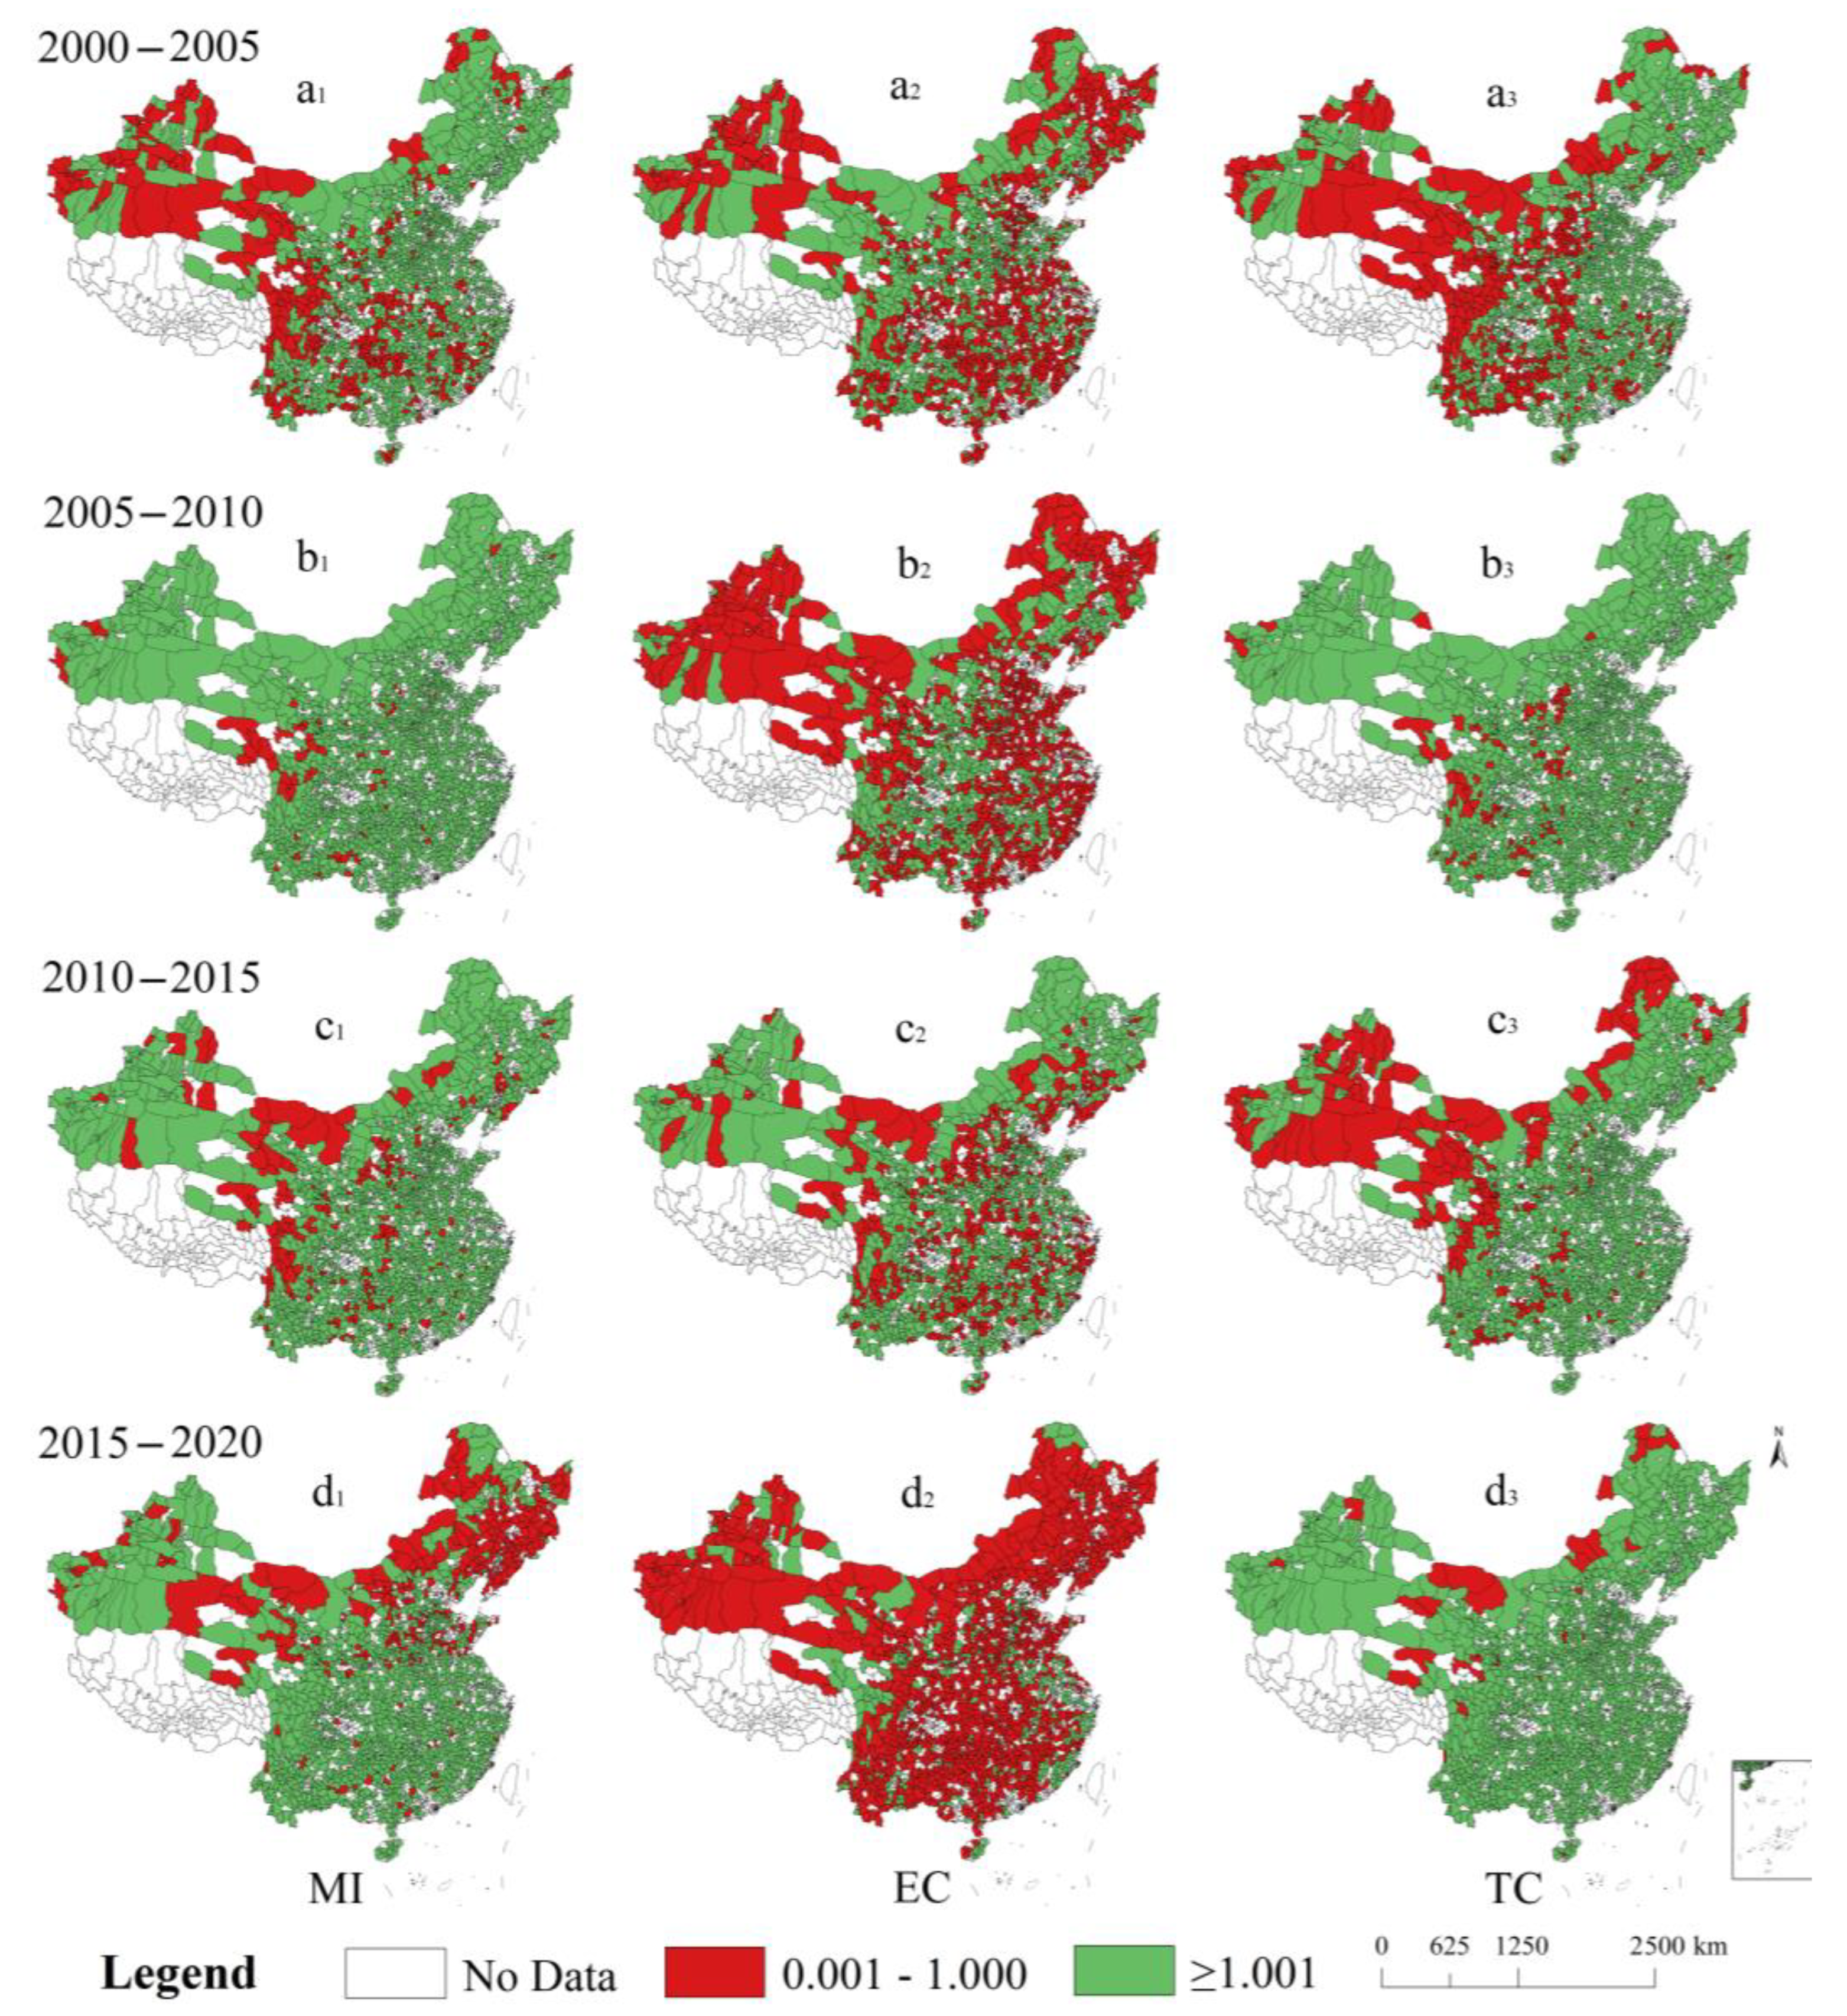
3.1.4. Dynamic Evolution Analysis of Eco-Efficiency

The Super-SBM model can measure county eco-efficiency values, but it cannot reflect the dynamic changes of these efficiency values. In order to further analyze the dynamic evolution process and contribution sources of eco-efficiency, the MI of county eco-efficiency in China was calculated at a time period of every five years corresponding to China’s Five-Year planning period. In addition, the MI was decomposed into the EC index and the TC index. The calculated results were geometrically averaged to obtain the average eco-efficiency MI and the decomposition of Chinese counties from 2000 to 2020 (Figure 5).
As shown in Figure 5, the MI values of all periods were greater than 1, indicating that scientific and technological innovation has gradually broken through the constraints of resource and environment bottlenecks, and the eco-efficiency of Chinese counties maintained an overall growth trend from 2000 to 2020. However, the MI values fluctuated. The growth rate was 11% from 2000 to 2005, and reached the maximum of 45% from 2005 to 2010. The growth rate then gradually declined to 26% from 2015 to 2015 and 20% from 2015 to 2020. The results reflected that the county eco-efficiency was in an unstable state. In particular, the contradiction between economic development and environmental protection intensified, which increased its unstable factors. How to strengthen ecological protection under the background of rapid economic development and achieve a stable eco-efficiency growth rate in the future is an issue that all counties need to focus on.
In the four periods, the TC values were all greater than 1. The EC values were only greater than 1 from 2010 to 2015 (the “12th Five-Year Plan” period), while they were less than 1 in other periods. The results showed that the improvement of county eco-efficiency in China mainly benefited from the promoting effect of technological progress. The TC value consistently greater than 1 reflects the fact that the policies introduced by the central government, such as Decision on strengthening technological innovation, developing high technology and realizing industrialization, Outline of National Innovation-driven Development Strategy, A number of views on the county’s innovation-driven development, have successfully promoted science and technology innovation since 1999. In 2001, China joined the WTO, which laid the foundation for economic development and scientific and technological exchanges. The counties have increased investment in science and technology, introduced new and emerging technologies, and developed high-tech industries through digestion and absorption as well as independent innovation, improving the overall level of technology and achieving technological progress. The EC values were less than 1 in the “10th Five-Year Plan”, “11th Five-Year Plan”, and “13th Five-Year Plan” periods, indicating that EC had an inhibitory effect on the improvement of eco-efficiency in these three periods. During the “12th Five-Year Plan” period, the growth rate was only 6%, which contributed less to the improvement of eco-efficiency. It shows that the improvement of eco-efficiency was hindered by the resource allocation, ecological and environmental problems and environmental regulation instruments of Chinese county units. Since the Reform and Opening up, the central government has encouraged local governments to vigorously develop the economy. Rigid enterprise management system has increased the difficulty of economic development, and environmental protection has been ignored, leading to serious pollution. Ecological environment problems have seriously affected the improvement of technical efficiency. During the “12th Five-Year Plan” period, the country launched the pilot of “Two types of Society” (“Two types of Society” refers to a resource-saving and environmentally friendly society), and promoted the implementation of National Energy Conservation Act and Energy saving and emission reduction national action implementation plan, which strengthened the constraints on environmental resources in development, helped reduce the emission of pollutants and improved the level of technical efficiency to a certain extent.
The MI and its decomposition in Chinese counties from 2000 to 2020 was visualized to obtain the spatial pattern distribution of the MI, EC, and TC (Figure 6). All three indices displayed spatial heterogeneity. The MI showed a pattern of being high in the south and low in the north, the EC exhibited a pattern of west > central > east, and the TC had a pattern of being high in the southeast and low in the northwest. An analysis of the three indices for the southeast coast, the northeast and the North China Plain, the southwest, south-central regions, and the northwest regions is detailed as follows.
(1) In four periods, the MI and TC values of most counties along the southeast coast were greater than 1. The EC was less than 1 from 2005 to 2010 and greater than 1 in all other periods. The results showed that the eco-efficiency of the southeast coastal counties continued to grow in the context of sustainable development. In addition, the changes in technological efficiency and technological progress promoted the improvement of eco-efficiency. Since 2000, the strategy of economic development in coastal areas has made full use of their advantages in resources, industrial base and geographical location. Counties in coastal areas have actively introduced advanced technology, advanced management experience, talents and capital, attracted foreign investment, improved technological innovation, and vigorously developed high-tech industries such as electronic information technology and high-tech services, on the basis of which technological progress has been continuously achieved. In addition, technical efficiency has been improved by comprehensively implementing the foreign trade contract management responsibility system, deepening the reform of the foreign trade system, perfecting investment laws and regulations, and improving the investment environment.
(2) From 2000 to 2010, the MI and TC of most counties in the northeast and the North China Plain were greater than 1, while the EC was less than 1, indicating that the level of county eco-efficiency was enhanced during this period, which was mainly due to technological progress. The MI, TC, and EC were all greater than 1 from 2010 to 2015, indicating that the counties enhanced eco-efficiency, achieved technological progress, and improved technological efficiency during this period. Moreover, the TC was greater than 1 and the MI and EC were less than 1 from 2015 to 2020, indicating that the county eco-efficiency declined during this period, mainly affected by the decrease in technological efficiency. Since the strategy of revitalizing Northeast China was put forward in 2004, the central government has increased transfer payments and investment in Northeast China, supported the development of high-tech industries and modern agriculture, reformed and upgraded the economic output capacity of traditional industries. So the eco-efficiency and technological level of counties in Northeast China was improved. However, the late withdrawal of planned economy and the imbalance in the industrial structure led to internal rigidity and inefficiency of enterprises and difficulties in reforming the management system [47], which eventually led to the fluctuation and decline of technical efficiency level. The counties of the North China Plain are adjacent to Beijing, Zhengzhou and other central regions, so they have obvious traffic advantages. By taking advantage of the national policy to promote scientific and technological innovation, these counties actively introduce foreign investment, realize industrial transformation and economic development, and finally promote technological progress. However, problems such as slow upgrading of coal, oil and other old mining areas, low utilization of resources, regressive resource management policies and so on, lead to the technical efficiency level cannot be steadily improved.
(3) The MI and TC of most counties in the southwest and south-central regions were greater than 1 in the four periods. In most counties, the EC was greater than 1 from 2010–2015 and less than 1 in other periods. Since the implementation of the strategy of developing the Western region and the rise of the Central region in 2004, counties in southwest and south-central China have actively introduced emerging technologies to develop modern agriculture, advanced manufacturing, new materials, optoelectronics and other high-tech industries, which further strengthening its status as a competitive base for advanced manufacturing and high-tech industries, promoting technological progress, and improving economic development and ecological efficiency. However, due to the high dependence of the government on investment attraction in counties in southwest and central South, the reform of enterprise system and mechanism is slow, the market mechanism is not active enough, and some mining machinery, non-ferrous metals and other industries are seriously polluted, so the technical efficiency cannot be steadily improved.
(4) The number of counties with MI values greater than 1 in northwest China increased at first and then decreased over the four periods, indicating unstable eco-efficiency. The eco-efficiency of some counties continued to improve, while that of other counties increased at first and then declined. The EC and TC fluctuated greatly. In addition, the TC was less than 1 in some counties, while the EC was greater than 1. The results indicated that the technological progress and technological efficiency improvement of the northwest counties were not sustainable during the study period. Since the implementation of the Western development strategy in 2000, the economic level of Northwest China has been improved significantly, but there are quality weaknesses—insufficient innovation drive. Some counties in Northwest China are still in the transitional stage of development from the initial stage of industrialization to the middle stage. The development of high-tech industries such as traditional manufacturing industry, new energy and energy-saving technology is not stable, and the leading capacity of scientific and technological innovation needs to be improved, so technological progress cannot be achieved steadily. Incomplete reform of system and mechanism, and confusion of resource and environment management mechanism lead to great fluctuation of technical efficiency, so ecological efficiency cannot achieve stable growth.

3.2. Spatial Correlation Effect of County-Scale Eco-Efficiency in China

3.2.1. Global Correlation Pattern of Eco-Efficiency

In order to identify the agglomeration degree of eco-efficiency among counties (cities) and their internal regions in China, the spatial correlation analysis of eco-efficiency was performed in neighboring counties nationwide. The GMI of eco-efficiency in Chinese counties in 2000, 2005, 2010, 2015 and 2020 was calculated and tested for significance. The results are shown in Figure 7. The GMI was greater than zero in all five years studied, and all passed the 1% significance test, indicating that the eco-efficiency of Chinese neighboring county units had significant spatial correlations and positive agglomeration effect. The eco-efficiency of each unit was not only correlated to its own level of economic development and the construction efforts of an ecological civilization but was also positively correlated to the eco-efficiency values of the surrounding counties.

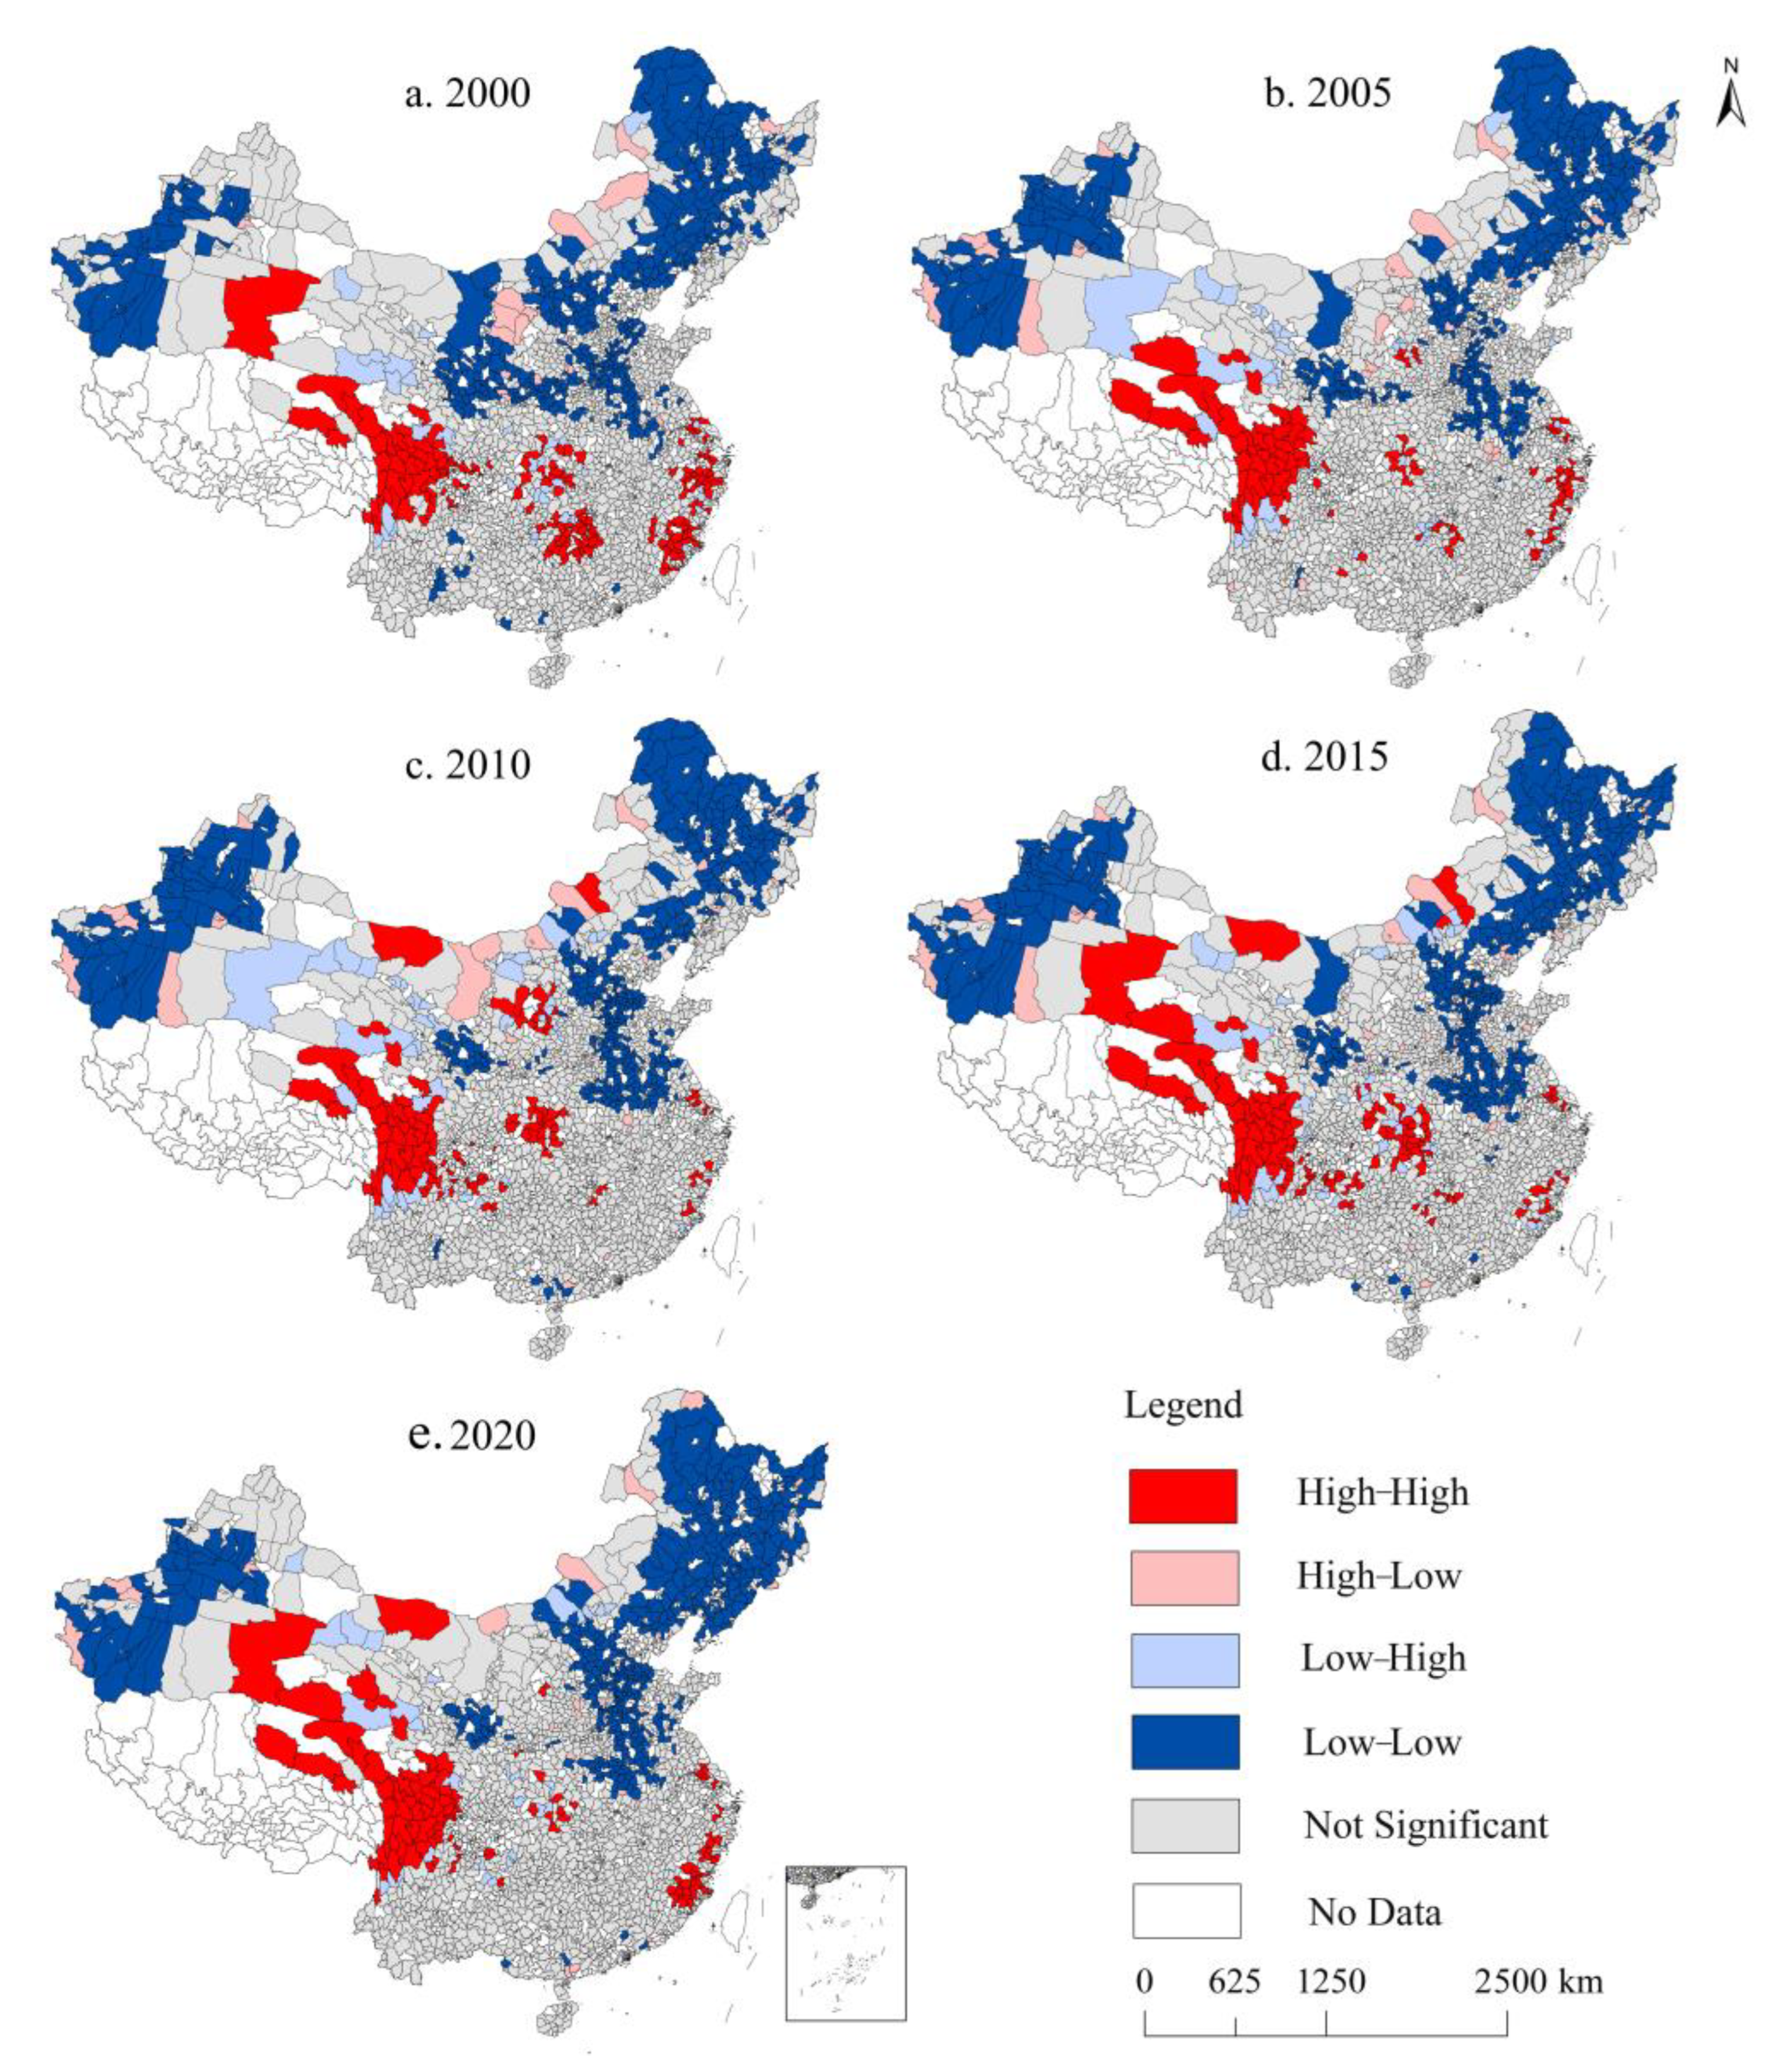
3.2.2. Local Correlation Pattern of Eco-Efficiency

The local indicators of spatial association (LISA) agglomeration in 2000, 2005, 2010, 2015 and 2020 was drawn to analyze the local spatial heterogeneity of the eco-efficiency of Chinese county units (Figure 8). The agglomeration types were divided into four categories, including H-H agglomeration, H-L agglomeration, L-H agglomeration, and L-L agglomeration.
In general, the spatial agglomeration types of eco-efficiency in Chinese counties were significant and stable, mostly of H-H agglomeration and L-L agglomeration. However, there were variations within regions in each year. Specifically in terms of the four types of aggregation:
(1) the H-H agglomeration was mainly distributed in southwestern Qinghai, western Sichuan, the southeast coastal areas, and the south-central regions such as Hunan and Hubei, indicating that the eco-efficiency levels of these neighboring counties were closely related and positively correlated. Furthermore, the H-H agglomeration areas in the south-central region and southeast coastal area experienced a process of firstly decreasing and then increasing. Most of the counties in this region are closely connected with the traffic network, and are endowed with resources. So, it has the advantage of development and exchange and learning, and has a positive impact on the eco-efficiency of the surrounding counties.
(2) The L-L agglomeration was mainly distributed in northwestern Xinjiang and the three northeast provinces, northern Inner Mongolia, parts of the North China Plain, and the eastern-central region of Gansu, and there is no decreasing trend of the agglomeration. These regional counties have a tendency to be marginalized due to their weak economic foundation, the lack of high-level technology, and distance from high eco-efficiency value areas. Therefore, it is necessary to increase the support for this region, as well as financial and policy support, to improve the level of ecological efficiency as soon as possible.
(3) The agglomeration characteristics of H-L agglomeration were not significant. The majority of counties were located north of the Huai River and Qin Mountains, such as the Sonid Left Banner, Urumqi county, and Anze county. The natural background conditions and the economic development level of these counties are not good enough to drive the development of surrounding counties. Therefore, on the basis of maintaining the existing environmental management and innovative development policies, these counties should actively introduce innovative technologies and advanced management ideas to prevent the reduction in its own ecological efficiency level.
(4) The L-H agglomeration was sporadically distributed around the H-H agglomeration, mainly in western Hunan, northern Yunnan, eastern Qinghai, and the Gansu Hexi Corridor. The economic development level of this type of agglomeration was relatively regressive. However, adjacent areas with good ecological environments can play a positive guiding role to this type of agglomeration. If reasonable and feasible economic and environmental protection policies are implemented in time, there will be a great potential for improving the eco-efficiency of such regions.

3.3. Analysis of Input-Output Relationship

When there is input redundancy, undesired output redundancy or insufficient expected output, it will lead to low eco-efficiency in counties. Therefore, input-output factors are important factors affecting eco-efficiency. In order to explore the relationship between input-output factors and ecological efficiency in counties, multiple linear regression analysis was conducted on per-capita GDP, PM2.5 average annual concentration, energy consumption, arable land area and construction land area and ecological efficiency. The results are shown in Table 3.
GDP per capita, energy consumption index, and arable land area passed the 5% significance test. Therefore, we believe that per-capita GDP has a significant positive correlation with eco-efficiency, while energy consumption, arable land area and eco-efficiency have a negative correlation. There is little correlation between construction land and PM2.5 average annual concentration and ecological efficiency. The results showed that the eco-efficiency level increased with the increase in per-capita GDP, while decreased with the increase in energy consumption and arable land.
Counties with a relatively low level of economic development often have problems such as resource waste and excessive emission of pollutants, and their ability to innovate and develop is weak, inhibiting the improvement of eco-efficiency. On the contrary, counties with relatively high economic development level have certain capital basis to develop innovative and environmentally friendly industries, optimize and upgrade industrial structure, reduce environmental pollution, and thus improve ecological efficiency. Therefore, per-capita GDP and eco-efficiency show a positive correlation. At present, the development model for some regions is still “intense resource consumption, high economic benefits, and high pollution” [24], although the input quantity of production factors in counties is large, the effective utilization rate is low. Irrational allocation of resources leads to most of the energy and arable land is not fully used, so the county cannot get economic advantage through resource advantage. The level of economic development is promoted slowly, and technological innovation is difficult to achieve, affecting the level of eco-efficiency in counties.

4. Conclusions

4.1. Findings

Based on multi-source geographic data and socioeconomic data, the paper analyzed the level and dynamic changes of county-scale eco-efficiency in China in 2000, 2005, 2010, 2015 and 2020 using the Super-SBM model and the MI. On this basis, the paper analyzed the causes of ineffective eco-efficiency and the factors influencing eco-efficiency by combining input–output indicators, and discussed its spatial agglomeration characteristics using spatial analysis method. The main conclusions are as follows:
(1) The eco-efficiency of Chinese county units was generally low, roughly displaying a pyramid distribution. Spatially, there was a distribution pattern of being high in the west and low in the east, and high in the south and low in the north. There was significant non-equilibrium but no trend of bifurcation. High-value zones of Qinghai, western Sichuan, and southeastern coastal areas along with low-value zones of Xinjiang, the three northeast provinces, and the North China Plain were formed in the years studied. The eco-efficiency of most neighboring counties was positively correlated.
(2) In terms of eco-efficiency influencing factors and improvement, the per-capita GDP has a significant positive correlation with eco-efficiency, while energy consumption, arable land area and eco-efficiency have a negative correlation. Chinese counties had a high redundancy rate in various input indicators, resulting in a large amount of wasted resources. Compared with the insufficiency in GDP output, the redundancy of the annual average PM2.5 concentration had a large impact on eco-efficiency loss, while the insufficiency in desirable output had a small impact on eco-efficiency loss.
(3) The dynamic analysis of eco-efficiency based on the MI showed that the overall eco-efficiency of Chinese counties maintained a growth trend during the study period, mainly due to technological progress. Further improvement of eco-efficiency was hindered by the retrogression of technological efficiency caused by the misallocation of resources, the increased scale of natural resource utilization, and regulation policies and instruments of resources and the environment. The contributions of technological progress and technological efficiency to eco-efficiency exhibited spatial heterogeneity. The eco-efficiency in the southeast coastal areas, southwest mountainous areas, and south-central regions showed a fluctuating upward trend due to the dual contribution of technological efficiency improvement and technological progress. The improvement of county eco-efficiency in northwest China, the three northeast provinces, and the North China Plain was mainly due to technological progress. However, the stability of its growth was insufficient.

4.2. Implications for Policy and Practice

To sum up, this paper believes that improving and developing the eco-efficiency of Chinese counties and achieving sustainable development can be carried out from the following three aspects:
(1) The redundancy rate of energy inputs is high in counties in northwest China, northeast China, and the North China Plain. Therefore, it is necessary to accelerate the transformation and upgrading of traditional industries, and increase the proportion of middle and high-end manufacturing, so as to improve the effective utilization rate of energy and reduce the redundancy rate of energy inputs. Counties in northwest China and northeast China also need to formulate stricter policies on pollution emissions, strengthen supervision and management, and increase the proportion of clean energy in the energy mix, so as to reduce the redundancy rate of PM2.5 and improve eco-efficiency. In addition, due to the instability of eco-efficiency, technological progress and technological efficiency improvement, counties in northwest China, northeast China and North China Plain should make full use of the policy advantages of “developing the West”, “aiding Xinjiang” and “revitalizing the Northeast” to expand the source and quantity of funds. Counties should cooperate with more developed regions to learn new concepts of modern management, deepen the reform of resource and environmental management system and mechanism, and thus improve the level of eco-efficiency steadily.
(2) The redundancy rate of land inputs in counties in the southeastern coastal and upper Yangtze River regions is too high, so these counties should focus on the level of economical and intensive land use, scientifically formulate land spatial planning, improve land use efficiency, and thus improve the level of eco-efficiency. In addition, the MI, TC, EC index of most counties in the southeast coastal areas from 2000 to 2020 is greater than 1 and highly clustered with the surrounding counties, indicating their strong technological innovation capacity and advanced resource management policies. Therefore, these counties need to actively play a radiation-driven role in order to promote the docking of innovation resources and innovation markets with low eco-efficiency counties, promote the transfer of advanced manufacturing industries and large and medium-sized high-tech industries, and eventually form an industrial cooperation system with gradient development, reasonable division of labor, and complementary advantages, thus improving the equilibrium and coordination of eco-efficiency in Chinese counties.
(3) The redundancy rates of labor input, land input and undesired output are all high in the counties of the south-central regions, so attention should be paid to reducing pollutant emissions while improving labor utilization and land use efficiency. Local governments need to strengthen the education and training of the workforce to improve the quality and added value of the labor. The counties also should actively introduce and improve online monitoring and treatment technologies for industrial waste gas, boiler combustion and other pollution sources, eliminate old motor vehicles and improve motor vehicle emission standards. In addition, the EC index of some counties in the south-central regions is less than 1, indicating that their resource and environmental management systems are deficient, so they need to continue to improve their management systems and increase their level of innovation in order to ensure a steady improvement in eco-efficiency and achieve sustainable development.

4.3. Limitations

This study has some limitations. Firstly, due to excessive missing data, capital input is not reflected in the established indicator system. Secondly, this study focuses on the spatial and temporal characteristics of county eco-efficiency, we will also conduct in-depth research on factors affecting county eco-efficiency in the future.

Author Contributions

Conceptualization, H.Z. and Z.Z.; methodology, S.W. and Z.F.; software, Z.F.; validation, H.Z. and Z.F.; formal analysis, H.Z. and Z.L.; data curation, S.W.; writing—original draft preparation, H.Z. and Y.S.; writing—review and editing, H.Z., Y.S., Z.L. and Z.Z.; visualization, H.Z. and Z.F.; supervision, X.C.; funding acquisition, Z.Z. and X.C. All authors have read and agreed to the published version of the manuscript.

Funding

This research was funded by the National Natural Science Foundation of China (Grant No. 72050001).

Data Availability Statement

Not applicable.

Conflicts of Interest

The authors declare no conflict of interest.

References

  1. Nie, G.; Qiu, Y. Prediction and analysis of the impact of urbanization on environmental pollution in China. Res. World 2017, 10, 10–16. [Google Scholar]
  2. He, X. County-based modernization and shared prosperity. Explor. Controv. 2021, 1, 24–26. [Google Scholar]
  3. Hu, X.; Zhang, Z.; Chen, X.; Wang, Y. Geographic detection of spatial-temporal difference and its influencing factors on county economic development: A case study of gansu province. Geogr. Res. 2019, 38, 772–783. [Google Scholar]
  4. Schaltegger, S.; Sturm, A. Ökologische rationalität: Ansatzpunkte zur ausgestaltung von ökologieorientierten managementinstrumenten. Die Unternehm. 1990, 44, 273–290. [Google Scholar]
  5. EEA. Making Sustainability Accountable: Eco-Efficiency, Resource Productivity and Innovation; EEA: Copenhagen, Denmark, 1999. [Google Scholar]
  6. WBCSD. Eco-Efficient Leadership for Improved Economic and Environmental Performance; WBCSD: Geneva, Switzerland, 1996. [Google Scholar]
  7. OECD. Eco-Efficiency; The Organization for Economic Co-operation and Development: Paris, France, 1998. [Google Scholar]
  8. Gössling, S.; Peeters, P.; Ceron, J.-P.; Dubois, G.; Patterson, T.; Richardson, R.B. The eco-efficiency of tourism. Ecol. Econ. 2004, 54, 417–434. [Google Scholar]
  9. Zhao, W.; Sun, Y.; Zhang, W.; Liang, S. Eco-efficiency analysis of municipal solid waste recycling systems by using life cycle approaches. Acta Ecol. Sin. 2016, 36, 7208–7216. [Google Scholar]
  10. Michelsen, O.; Fet, A.M.; Dahlsrud, A. Eco-efficiency in extended supply chains: A case study of furniture production. J. Environ. Manag. 2006, 79, 290–297. [Google Scholar] [CrossRef]
  11. Cerutti, A.K.; Beccaro, G.L.; Bagliani, M.; Donno, D.; Bounous, G. Multifunctional ecological footprint analysis for assessing eco-efficiency: A case study of fruit production systems in Northern Italy. J. Clean. Prod. 2013, 40, 108–117. [Google Scholar]
  12. Hu, W.; Han, Z.; Ge, Y.; Hu, Y.; Zhang, Y.; Peng, F. Chinese marine eco-economic system development efficiency based on emergy. Econ. Geogr. 2018, 8, 162–171. [Google Scholar]
  13. Chen, X.; Meng, Q.; Shi, J.; Shen, Y. Ecological Efficiency Measurement and Analysis of Spatial—Temporal Evolution in Eight Comprehensive Economic Areas of China. Econ. Manag. Rev. 2022, 38, 109–121. [Google Scholar]
  14. Xu, T.; Zhu, Q.; Mei, J.; Chen, Y. Spatio-temporal Pattern Changes and Optimal Strategies of Provincial Ecological Efficiency in China. Soil Water Conserv. Res. 2022, 29, 380–388. [Google Scholar]
  15. Zhang, Z.; Xue, B.; Chen, X.; Li, Y. Convergence in spatial difference of industrial environmental efficiency in China. China Popul. Resour. Environ. 2015, 25, 30–38. [Google Scholar]
  16. Korhonen, P.J.; Luptacik, M. Eco-efficiency analysis of power plants: An extension of data envelopment analysis. Eur. J. Oper. Res. 2004, 154, 437–446. [Google Scholar] [CrossRef]
  17. Hahn, T.; Figge, F.; Liesen, A.; Barkemeyer, R. Opportunity cost based analysis of corporate eco-efficiency: A methodology and its application to the CO2-efficiency of German companies. J. Environ. Manag. 2010, 91, 1997–2007. [Google Scholar] [CrossRef] [PubMed]
  18. Camarero, M.; Castillo, J.; Picazo-Tadeo, A.J.; Tamarit, C. Eco-Efficiency and Convergence in OECD Countries. Environ. Resour. Econ. 2013, 55, 87–106. [Google Scholar]
  19. Huang, J.; Yang, X.; Cheng, G.; Wang, S. A comprehensive eco-efficiency model and dynamics of regional eco-efficiency in China. J. Clean. Prod. 2014, 67, 228–238. [Google Scholar] [CrossRef]
  20. Demiral, E.E.; Sağlam, Ü. Eco-efficiency and Eco-productivity assessments of the states in the United States: A two-stage Non-parametric analysis. Appl. Energ. 2021, 303, 117649. [Google Scholar]
  21. Moutinho, V.; Fuinhas, J.A.; Marques, A.C.; Santiago, R. Assessing eco-efficiency through the DEA analysis and decoupling index in the Latin America countries. J. Clean. Prod. 2018, 205, 512–524. [Google Scholar]
  22. Bianchi, M.; Valle, I.d.; Tapia, C. Measuring eco-efficiency in European regions: Evidence from a territorial perspective. J. Clean. Prod. 2020, 276, 123246. [Google Scholar]
  23. Hou, M.; Yao, S. Measurement and temporal-spatial dynamic evolution of urban eco-efficiency in China. China Popul. Resour. Environ. 2018, 28, 13–21. [Google Scholar]
  24. Ren, Y.; Fang, C.; Lin, X.; Sun, S.; Li, G.; Fan, B. Evaluation of the eco-efficiency of four major urban agglomerations in coastal eastern China. J. Geogr. Sci. 2019, 29, 1315–1330. [Google Scholar]
  25. Kun, W.; Kairui, Y.; Hong, R.; Lei, G. The impact of industrial agglomeration on ecological efficiency: An empirical analysis based on 244 Chinese cities. Environ. Impact Assess. Rev. 2022, 96, 106841. [Google Scholar]
  26. Zhang, Z.; Wang, K.; Chen, X. Relationship between China Ecological Efficiency and Environmental Regulation——Based on SBM Model and Provincial Panel Data. Econ. Surv. 2015, 32, 126–131. [Google Scholar]
  27. Qiu, L.; Zhou, J. Temporal and spatial differentiation and influencing factors of eco-efficiency at county scale in Zhejiang province. East China Econ. Manag. 2020, 34, 11–20. [Google Scholar]
  28. Ma, Y.; Tong, Y.; Ren, J. Calculation and robustness test of county-scale ecological efficiency based on multi-source remote sensing data: Taking the urban agglomeration in the middle reaches of Yangtze River as an example. J. Nat. Resour. 2019, 34, 1196–1208. [Google Scholar]
  29. Li, X.; Zhao, L.; Liu, Y.; Jiang, Z.; Cai, L. Eco-efficiency measurement and spatial-temporal characteristics analysis of county-scale in Shandong Province. World Geogr. Res. 2022, 31, 120–129. [Google Scholar]
  30. Ren, Y.; Fang, C. Spatial pattern and evaluation of eco-efficiency in counties of the Beijing-Tianjin-Hebei Urban Agglomeration. Prog. Geogr. 2017, 36, 87–98. [Google Scholar]
  31. Amaral, S.; Câmara, G.; Monteiro, A.M.V.; Quintanilha, J.A.; Elvidge, C.D. Estimating population and energy consumption in Brazilian Amazonia using DMSP night-time satellite data. Comput. Environ. Urban 2005, 29, 179–195. [Google Scholar] [CrossRef]
  32. Elvidge, C.D.; Baugh, K.E.; Kihn, E.A.; Kroehl, H.W.; Davis, E.R.; Davis, C.W. Relation between satellite observed visible-near infrared emissions, population, economic activity and electric power consumption. Int. J. Remote Sens. 1997, 18, 1373–1379. [Google Scholar] [CrossRef]
  33. Wang, N.; Zhang, S.; Zeng, Q. Prediction of Population Aging in Chongqing: A study Based on Metabolic Grey GM (1, 1) Model. Northwest Popul. 2017, 38, 66–70. [Google Scholar]
  34. Cui, X.; Fang, C.; Wang, Z.; Bao, C. Spatial relationship of high-speed transportation construction and land-use efficiency and its mechanism: Case study of Shandong Peninsula urban agglomeration. J. Geogr. Sci. 2019, 29, 549–562. [Google Scholar]
  35. Ren, Y.; Bai, Y.; Liu, Y.; Wang, J.; Zhang, F.; Wang, Z. Conflict or Coordination? Analysis of Spatio-Temporal Coupling Relationship between Urbanization and Eco-Efficiency: A Case Study of Urban Agglomerations in the Yellow River Basin, China. Land 2022, 11, 882. [Google Scholar]
  36. Tone, K. A slacks-based measure of efficiency in data envelopment analysis. Eur. J. Oper. Res. 2001, 130, 498–509. [Google Scholar]
  37. Andersen, P.; Petersen, N.C. A Procedure for Ranking Efficient Units in Data Envelopment Analysis. Manag. Sci. 1993, 39, 1261–1264. [Google Scholar]
  38. Tian, P.; Wang, H.; Li, J.; Cao, L.; Hu, Q. Eco-efficiency evaluation and influencing factors analysis of county-level cities in the East China Sea coastal zone. Geogr. Res. 2021, 40, 2347–2366. [Google Scholar]
  39. Malmquist, S. Index numbers and indifference surfaces. Trab. Estadística 1953, 4, 209–242. [Google Scholar] [CrossRef]
  40. Xie, H.; Wang, W. Spatiotemporal differences and convergence of urban industrial land use efficiency for China’s major economic zones. J. Geogr. Sci. 2015, 25, 1183–1198. [Google Scholar] [CrossRef]
  41. Färe, R.; Grosskopf, S.; Lindgren, B.; Roos, P. Productivity changes in Swedish pharamacies 1980–1989: A non-parametric Malmquist approach. J. Prod. Anal. 1992, 3, 85–101. [Google Scholar] [CrossRef]
  42. Pastor, J.T.; Lovell, C.A.K. A global Malmquist productivity index. Econ. Lett. 2005, 88, 266–271. [Google Scholar]
  43. Zhao, Z.; Bai, Y.; Wang, G.; Chen, J.; Yu, J.; Liu, W. Land eco-efficiency for new-type urbanization in the Beijing-Tianjin-Hebei Region. Technol. Forecast. Soc. Chang. 2018, 137, 19–26. [Google Scholar] [CrossRef]
  44. Ren, M.; Wang, X.; Liu, Z.; Liu, L.; Zhang, W. Analysis on Spatio-temporal Change and the Influencing Factors of Regional Eco-efficiency of China. East China Econ. Manag. 2019, 33, 71–79. [Google Scholar]
  45. Ren, W.; Zhang, Z.; Wang, Y.; Xue, B.; Chen, X. Measuring regional eco-efficiency in China (2003–2016): A “Full World” perspective and network data envelopment analysis. Int. J. Environ. Res. Public Health 2020, 17, 3456. [Google Scholar] [CrossRef] [PubMed]
  46. Wang, E.; Wu, C. Spatial-temporal differences of provincial eco-efficiency in China based on super efficiency DEA model. Chin. J. Manag. 2011, 8, 443–450. [Google Scholar]
  47. He, C. The Policy Factors of Economic Stall in Northeast Region———Based on the Inspection of “ Northeast Revitalization”Policy Effect. Econ. Syst. Reform 2017, 01, 44–49. [Google Scholar]
Figure 1. Descriptive statistical analysis of eco-efficiency in Chinese counties in 2000, 2005, 2010, 2015 and 2020.
Land 12 00438 g001
Figure 2. Spatial distribution of eco-efficiency in Chinese counties in (ae).
Land 12 00438 g002
Figure 3. Kernel density distribution of eco-efficiency in Chinese counties.
Land 12 00438 g003
Figure 4. (ad) Analysis of the energy input, the labor input, the land input and the undesirable output relaxation rates in Chinese counties.
Land 12 00438 g004
Figure 5. Malmquist index and decomposition of average eco-efficiency in Chinese counties from 2000 to 2020.
Land 12 00438 g005
Figure 6. Spatial patterns of (a1) 2000–2005 MI, (a2) 2000–2005 EC, (a3) 2000–2005 TC, (b1) 2005–2010 MI, (b2) 2005–2010 EC, (b3) 2005–2010 TC, (c1) 2010–2015 MI, (c2) 2010–2015 EC, (c3) 2010–2015 TC, (d1) 2015–2020 MI, (d2) 2015–2020 EC, (d3) 2015–2020 TC in Chinese counties.
Land 12 00438 g006
Figure 7. Moran index scatterplot of eco-efficiency in Chinese counties in 2000, 2005, 2010, 2015 and 2020.
Land 12 00438 g007
Figure 8. Local indicators of spatial association (LISA) agglomeration of eco-efficiency in Chinese counties in 2000, 2005, 2010, 2015 and 2020.
Land 12 00438 g008
Table 1. Measurement indicator system for county-scale eco-efficiency in China.
Target LayerCriterion LayerIndicator LayerSpecific Indicator Composition
County-scale eco-efficiencyInput indicatorsLaborYear-end total population
EnergyEnergy consumption index
LandArable land area
Construction land area
Output indicatorsDesirable outputGDP
Undesirable outputAnnual average PM2.5 concentration
Table 2. Analysis of desirable output relaxation rate in Chinese counties.
Number of Counties/ItemsRelaxation Rate
00–30%30–60%>60%
20001684511
20051687211
20101688012
20151689110
20201683611
Note: Positive numbers indicate that there is room for improvement of the indicator.
Table 3. Multiple linear regression results.
BSE(B)BetatSig.VIF
(constant)0.0210.001 14.2750.000
PGDP0.1260.0110.29611.2800.0001.391
ENI−0.0330.009−0.131−3.7040.0002.506
AL−0.0320.007−0.119−4.3970.0001.476
CL−0.0160.008−0.066−1.9610.0502.257
PM2.5−0.0250.017−0.033−1.4590.1451.018
Note: Dependent variable: EE, PGDP, ENI, AL, CL and PM2.5 represent per-capita GDP, Energy consumption index, Arable land area, Construction land area and Annual average PM2.5 concentration, respectively.
Disclaimer/Publisher’s Note: The statements, opinions and data contained in all publications are solely those of the individual author(s) and contributor(s) and not of MDPI and/or the editor(s). MDPI and/or the editor(s) disclaim responsibility for any injury to people or property resulting from any ideas, methods, instructions or products referred to in the content.

