Article

People, Crops, and Bee Farming: Landscape Models for a Symbiotic Network in Greece

1
School of Architecture, National Technical University of Athens, 157 80 Athens, Greece
2
IE Business School, Brown University, Providence, RI 02912, USA
3
School of Plant Sciences, Agricultural University of Athens, 118 55 Athens, Greece
*
Author to whom correspondence should be addressed.
Land 2023, 12(2), 430; https://doi.org/10.3390/land12020430
Submission received: 27 December 2022 / Revised: 31 January 2023 / Accepted: 2 February 2023 / Published: 7 February 2023

Abstract

:
Despite the rising awareness of the mutual benefits of pollination, agricultural production, and biodiversity, Greek planning has scarcely moved toward patterns of pollinator-friendly farm design models. This paper presents data from preliminary research analysis that defined generic landscape design models that can enhance the symbiotic associations between farming production and beekeeping in Greece. The main objective is to determine tailor-made landscape models that can contribute to a portfolio of actions easily apprehensible by non-technical audiences in the farming sector who want to introduce biodiversity enhancements to monoculture farming, fostering a safer, poisonous-free environment for introduced honeybees, simultaneously helping to augment their production yields. A preliminary study was conducted in four agricultural farming estates in Thessaly and the Peloponnese involving apple farming, citrus orchards, and hemp cultivation. It combined the analysis and assessment of land cover classes with regard to the provision of foraging habitat, assessment of foraging suitability, description of connectivity characteristics, and emerging spatial patterns of natural corridors, patches, and edges at an observation perimeter around each farm. Assessment of these data informed design models for planting enrichment and integration of natural patches, such as meadows and shrub corridors. Pilot installations of hives in study areas that combined characteristics of the landscape models presented resulted in the production of 8% to 12% bigger fruits and 30% to 50% increase in the total yield. We conclude that landscape design models for biodiversity enhancement are an important attribute of ecosystem services and require an understanding of specific geographical and landscape parameters to render models operational for bee farming and pollination.

1. Introduction

Apiculture, regenerative agriculture, and biodiversity enhancement processes form a nexus that has quite recently triggered the interest of interdisciplinary researchers in the field of landscape ecology and habitat restoration [1,2]. Regenerative agriculture refers to the set of agricultural practices and principles that aims to promote human health and economic prosperity, while also restoring and enhancing the farm’s overall ecosystem from a sustainability perspective [3]. Here, we make use of the term in a wider sense, implying the adoption of holistic management principles that consider the interrelatedness of all parts of a farming system, including the farmer and the wider semi-natural context of species [4].
Mutual benefits emerge from working with nature’s solutions, via the integration of richer flora and fauna areas within farming estates securing food production [5], fostering sustainable, competitive agro-food value chains [6,7,8], and preserving habitats for native or introduced pollinators, such as honeybees. These linkages not only construct a critical dimension within the symbiotic network of bees, crops, and people but also further inform the goals of insurgent policies that aim to ensure circular and sustained economic growth [6] alongside environmental protection [2]. The UN’s 2030 Agenda for Sustainable Development [9], the European Green Deal [10], and the EU Pollinators Initiative [11] are frameworks that challenge the comprehensive view of people, agro-ecosystems, and wild and managed bees, not only identifying the bees’ role as agents of ecosystem services through pollination but also further seeing coupled benefits and developmental opportunities in achieving sustainability goals for crop yield enhancement, social and economic sustenance, livelihood, education, and environmental monitoring [2] that calls for management schemes and actions.
Landscape design could be one approach to merging agriculture and conservation first by eradicating the divide between production and nature’s protection [12] and second by offering an opportunity to embed respective policies into action plans. The interconnections of pollinators with single-crop farming practices and the close relationships amongst landscape structure, ecological processes, and ecosystem services [13] through a landscape design approach constitute the core of this paper. From a landscape perspective, the coupled benefits addressed by pollinators and regenerative agriculture depend on intermediary and adjacent zones of crop-farming estates, such as wild strips and hedgerows [14], crop field boundaries, and living fences [15], as these constitute essential bee foraging areas. Notably, the size and shapes of these interstitial natural habitats can be used to assess pollination service supply in studies on the landscape level [13]. Considering different types of ecosystems within the specific matrices of agricultural establishments and their specific arrangements allows the assessment of ecological services both at local and at regional scales [13]. Landscape design in agricultural systems relies on a body of literature that has broadened the study of landscapes and how these impact pollination services by parameters such as scale [16], landscape composition [17], configuration [18], connectivity [19], and heterogeneity [20]. Land use and land cover change, in particular, have been considered major stressors for pollination habitats, forcing pollinator insects to expand or change their foraging range [21,22,23]. Land use and land cover classes containing vegetation that is beneficial for pollinators not only alleviate stressors that threaten pollinators (pesticides, deforestation, and fragmentation [24]) but also further improve pollinators’ abundance and health [25].
Despite the increased recognition of the services of wild and managed bees to agriculture, little adaptability has been monitored in single-crop farming estates [26]. Optimum approaches to spatial monitoring, management, and design configuration remain uncertain [27] or have been addressed in a limited context [28]. Even studies indicating how intensively managed land can provide a valuable contribution to the overall biodiversity of the landscape mosaic are scarce [29]. What the authors of this paper feel that requires greater investigation is a common understanding of the types of applied landscape design schemes that could be introduced to conventional single-crop farming estates in order to facilitate the mutual interests of beekeepers and farmers and the way these could be communicated through simple visionary graphs to the knowledge of farmers and beekeepers. The latter is the main enquiry point of our preliminary research, aiming to provide evidence on the forms and operational layouts of biodiversity-rich types that could be prioritized in farming estates according to the specific physio-geographical conditions of each estate.
Our design research approach is carried forward in four distinctive single-crop farms of mainland Greece. Our treatment of these case studies acknowledges the fact that despite the rising awareness of the mutual benefits between pollination, agricultural production, and biodiversity and the quantitative spatial studies already available with tool sets that measure and map attractiveness and priority areas for bees [30] and biodiversity hotspots [21], Greek planning has scarcely moved toward patterns of pollinator-friendly farm design models and has also not adjusted national scale initiatives in order to fight the decline in wild pollinators and as such to safeguard honey production [31].

1.1. Bees’ Ecological Services in Regenerative Agriculture and Posed Threats

Regenerative agriculture practices aiming for low input and sustainable [32] and non-extractive management [33] currently benefit from bees’ ecosystem services. Pollination and habitat restoration are amongst the most important ecological services due to the positive externalities generated, the impact on biodiversity, the water balance, and the produced benefits with respect to nutrition and health [34]. Crop pollination, in particular, is regarded as an ecosystem service of enormous economic value and critical importance, given that approximately one-third of the foods we consume are insect-pollinated vegetables, pulses, and fruits [35,36]. Bees as pollinators are essential for both ecosystem services and landscape conservation [37]. Especially, the bees’ importance and contribution to the conservation of biodiversity and wild flora regulate almost 90% of the flowering plants, including one-third of human food crops, which need animal pollinators for their reproduction [7,20,38,39]. Within the pollination process, bees (Apis mellifera) contribute to the transfer of pollen from male to female flowers when foraging for pollen and nectar. This process has been proven to maximize fruit production in several plantations, increasing production per acre [40]. Conserving foraging areas for bee pollinators improves fruit set and quality and increases fruit size [38]. Apples, pear, cherries, citrus fruit, aromatic herbs, and croplands, all depend on cross-pollination by bee colonies, and recorded increases in their yields have been related with paired initiatives with bee farming and provision of rich species patches with co-flowering plants [41,42,43]. Crop pollination service, when performed by wild bees, has been evaluated to contribute on average US $3251 per ha/year to crop production compared to managed honeybee colonies, which are worth US $2913 a hectare [41,44].
Anthropogenic transformations often cause disturbances, such as habitat fragmentation and habitat loss [45], which have been associated with a large decline in pollinator functions, while they largely influence pollination dynamics, such as pollinator density, pollen availability [46], pollinator movement, and plant demography [47,48]. Recent reports of reductions in both managed and wild bees have raised awareness of the importance of the landscape’s structure in conserving habitats that support pollinators [49,50]. Forests and woodlands, in adjacency to agriculture land, have been observed to provide shelter, nesting sites, water, larval food plants, and floral resources for an enormous number of pollinators ranging from tiny insects to birds and bats, but the spread of intensive monoculture farming has been blamed for the decline in pollinators, mainly attributed to the spread of intensive farming and the clearance of natural vegetation patches [51].
Almost 10% of bees in Europe are affected by wider changes in land use and land cover [21] related to agricultural practices. Contemporary discussion about intensively managed single-crop farming estates draws attention to their characteristics of landscape simplification and biotic homogenization [52], in addition to their recorded hazards associated with diseases, pest outbreaks, habitat loss, and the excessive and inappropriate use of pesticides [30], which has led to a significant loss of commercial bees [53], in extreme cases faced with colony collapse disorder [38]. Agriculturally intensive environments fail to be adequately pollinated by wild pollinators, which are sparser in areas with low foraging and nesting interest [37].
The aforementioned parameters are regarded as stressors for pollinators [25] and seriously affect their health and foraging availability. To mitigate this condition, the pollination services that the commercial beekeeping industry provides are currently receiving renovated interest for research and conservation of resources. Good practices that aim to reduce stresses caused by disease, pesticide use, insufficient nutrition, and the practice of transportation of bee colonies for excessive miles has lead researchers to investigate local benefits that can be traced within the regional ecosystems and the enhancement of biodiversity within the crop agriculture–pollinator nexus. Recent research with this perspective has been closely tied to local initiatives. In the core of these initiatives lies the understanding that wild or introduced honeybees are essential agents of the pollination process. In fact, their integration with sustainable and organic farming initiatives has become part of a rising perspective on regional and national levels amongst several states in the United States [54] as well as in European countries, such as Spain, where biodiversity enhancement models applied to monoculture farming estates have increased the profitability of farmers, together with a parallel increase in the area’s biodiversity [55,56]. According to Wezel et al. , in recent years, organic farming orientation in agricultural practices is aiming to produce significant amounts of food by relying more on ecological processes and ecosystem services than simply relying on ordinary techniques, such as chemical fertilizer and synthetic pesticide application, or technological solutions, such as genetically modified organisms [57]. Those contemporary manifestations in regenerative agriculture are seeing a rising interest in services such as (a) the provisioning for the upkeep of networks and processes that maintain biodiversity and the production of ecosystem goods (e.g., food) and (b) waste assimilation, water purification, climate regulation, disease control, and pollination [58].

1.2. Disturbed Environments and Apiculture in the Greek Context

The Mediterranean Basin is considered a biodiversity hotspot for both wild bees and wild bee–pollinated plants [59,60]. This favorable context renders Greece one of the biggest honey producers [61], as greek honey production accounts for 1% of the global production [62]. Nomadic beekeeping in the Mediterranean South is widespread [63]. In Greece, beekeepers move their hives across the country from spring to autumn, seeking locations that provide an abundance of foraging habitats [61]. This touring between varying flowering seasons and temporary bee habitat areas often comes in conflict with accelerated urbanization patterns, land use change, and deforestation, which are associative threats that endanger bees in their foraging journeys, in addition to the ecological footprint caused by excessive traveling and elevated costs for beehive maintenance that are to be weighed against sustainable profits. Current studies have reported a gradual increase in land degradation [64]; uneven distribution of water resources; loss of biodiversity due to natural system modifications, including urbanization and habitat fragmentation [65]; and excessive use of synthetic fertilizers and pesticides as some of the environmental challenges presented through conventional monoculture farming [66] threatening wild and managed bees, which may be associated with a decrease in the food web complexity and pollination benefits [67]. Simultaneously, climate change [68], desertification [21], and a dramatic increase in forest wildfires further threaten the beekeeping industry, alongside the viability of agricultural systems. Additionally, research shows that beehives that have been introduced in large densities in natural preserved areas outcompete wild pollinators, depressing pollen and nectar harvesting in spanned distances of up to 1 km from the hives [69,70,71], resulting in non-efficient apiculture practices [62]. Counterbalancing these trends, a commitment to provide beekeepers with access to chemical-free lands providing balanced foraging areas for both wild and managed pollinators is critical for long-term beekeeping sustainability [72] within the management of a wider landscape context comprising agricultural lands and adjacent natural habitat–carrying capacity [37]. As long as organic farming is a minority, access to enhanced patches with floral interest [73] provides a vital refuge to bees from pesticides or other contaminated farming fields. In this context, natural enclaves, ecologic corridors, and niche environments and the way they interweave with agriculture are essential for the sustenance and balanced exchange of nutrients and energy.
The main objective of this paper is to configure landscape models that can ameliorate the setting of organic, single-crop farming estates for the inclusion of bees. The paper describes the approach undertaken to compile a dataset of landscape models that can act as diversity enhancements to monoculture farming, facilitating a safer, poisonous-free environment, mutually beneficial for bees and crop yield. In this respect, we take into account first the migratory patterns of beekeepers seeking seasonality fields for bee foraging and second the condition that rich biodiversity areas if integrated with organic agriculture practices may bring an added benefit from the available pollen resources from native flora to bees’ foraging needs. Our aim is to provide adequate planting schemes and a recognition of preservation of wild strips of flora that can augment biodiversity-rich patches within farms that want to develop mutual synergies with beekeepers. The unpacking of such benefits within the farming context remains obscure for non-technical audiences and unskilled people in the agriculture sector, and for this reason, we proceed with visualizing models that can potentially reinforce action tools.
The first part of this paper highlights the importance of pairing honeybees with single-crop farmers by outlining the context on which we base our preliminary research. In the second part, we deploy our methodology by introducing a multi-scalar analysis of each farming estate. In this part, we combine diagrammatic analysis that relates to land cover, forage suitability, landscape configuration, landscape connectivity, and fragmentation as parameters for the identification of distinctive types of species-rich flora patches. The last part undertakes evaluation and further recommendations from the pilot installations carried forward in three of the four farming estates.

2. Materials and Methods

2.1. Landscape Configuration and Landscape Composition as Determinant Contexts
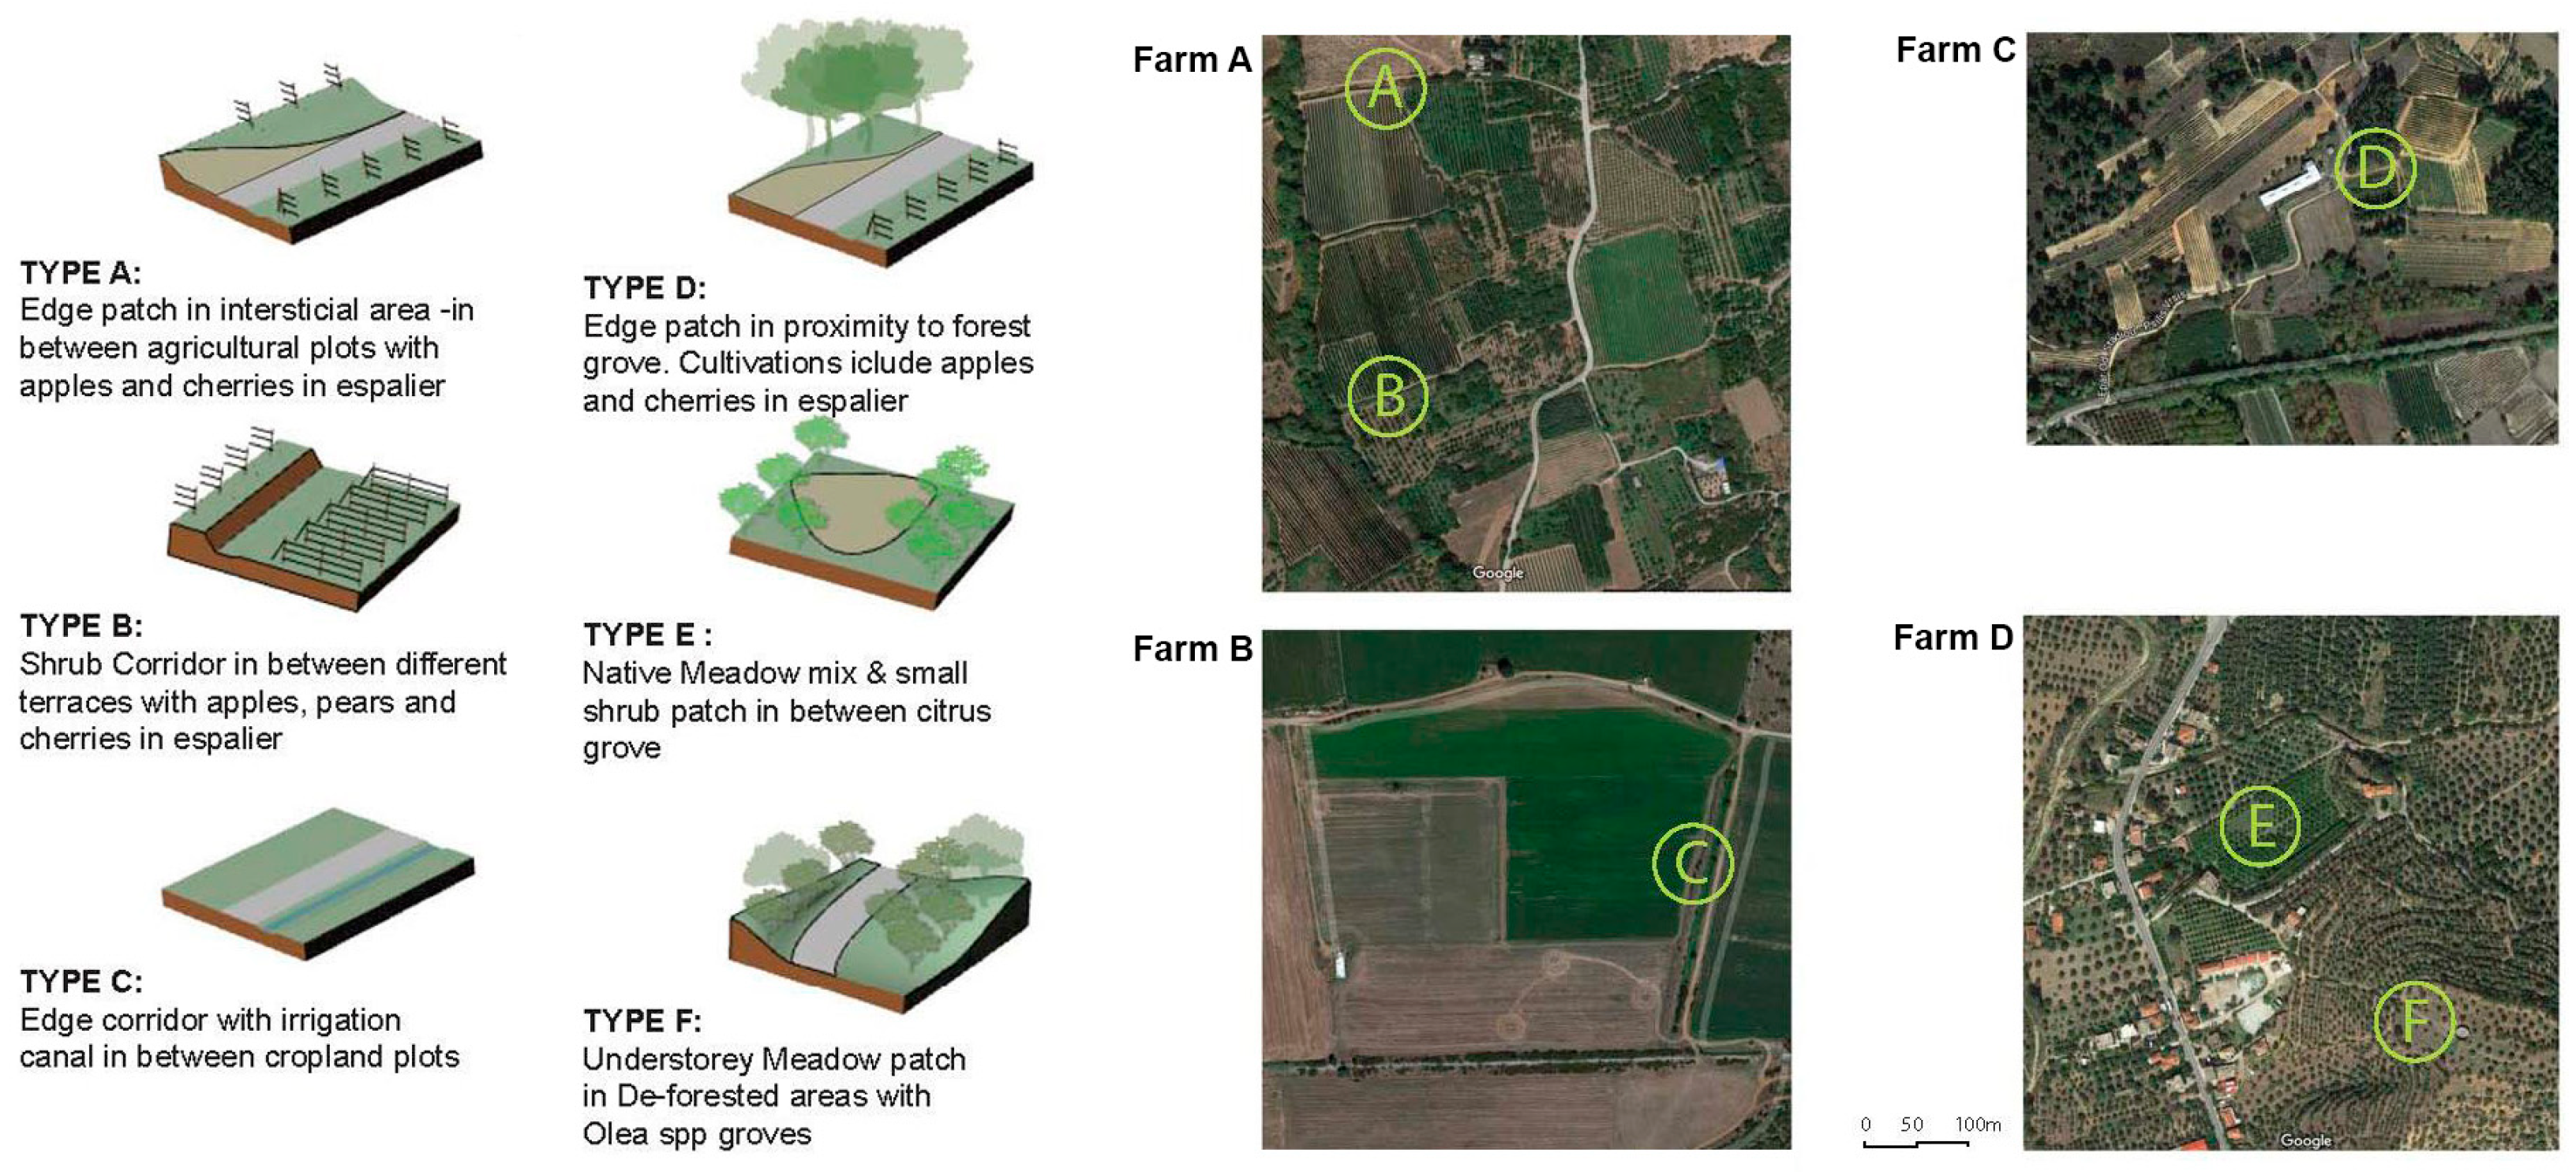
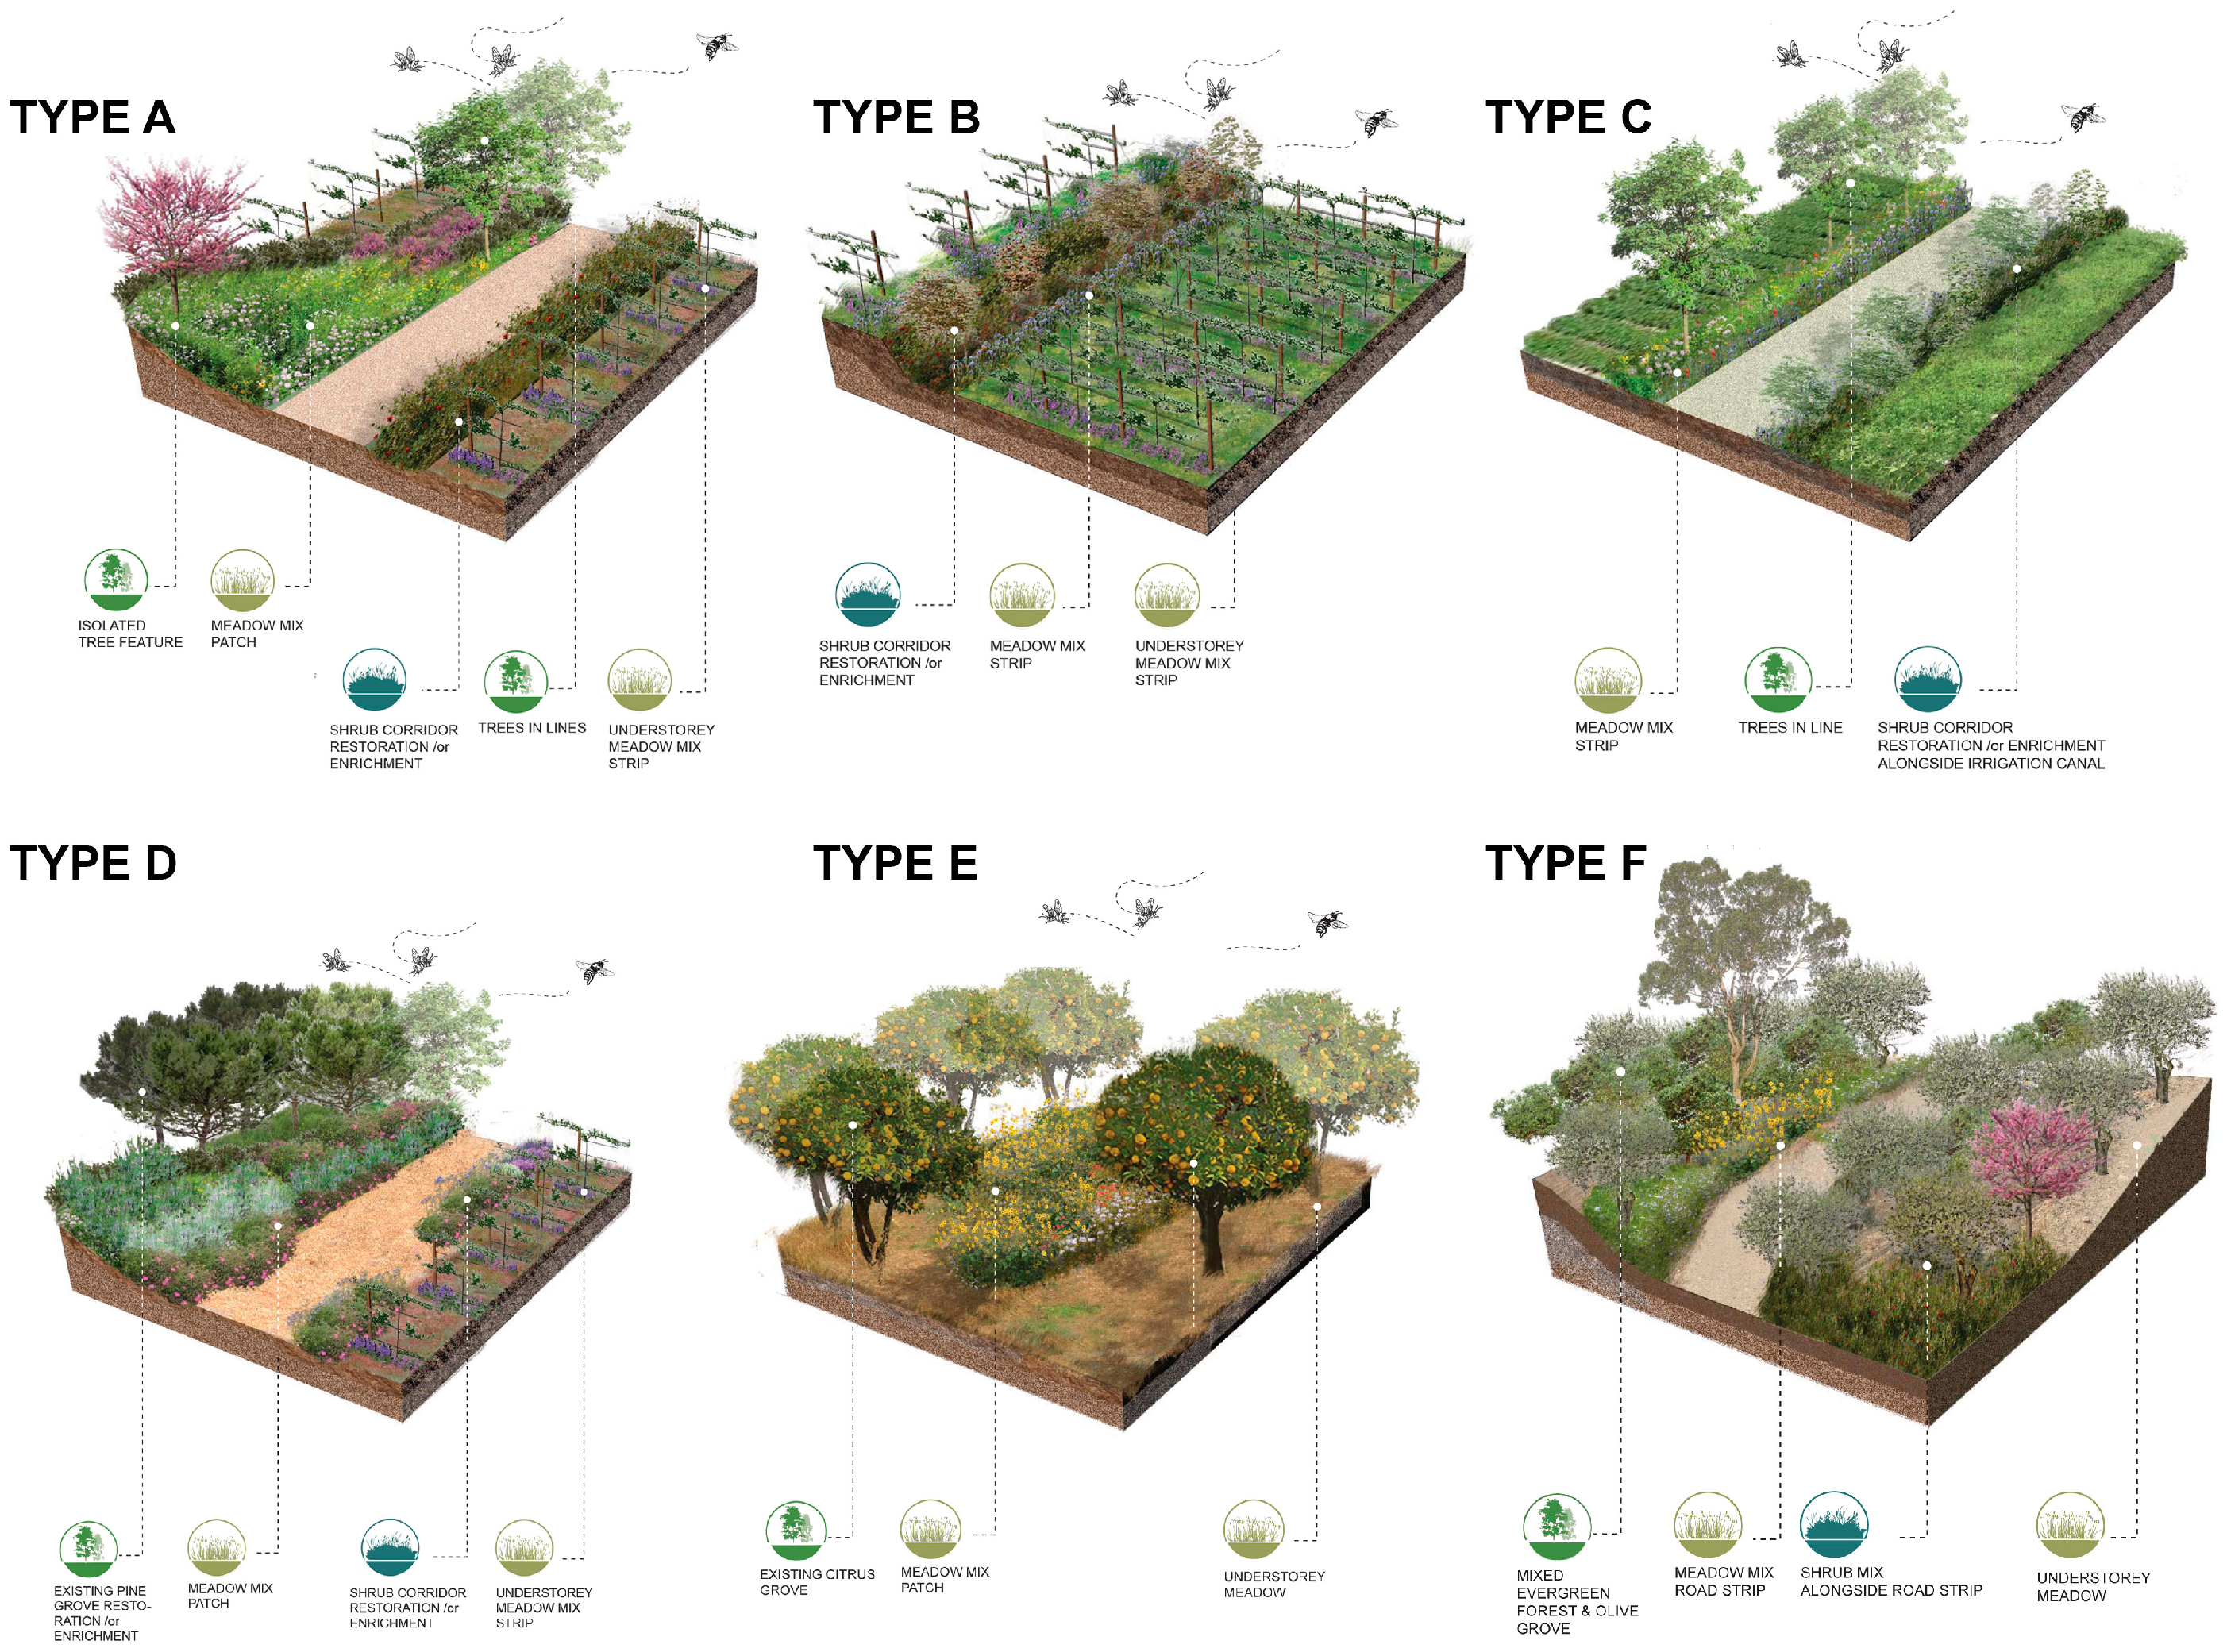
The need to study the spatial characteristics of farms and reconcile contrasting regimes between intensive single-crop farming, crop pollination, and apiculture via land management and implementable landscape design solutions [68,74] brings our attention to landscape ecology and to the growing development of landscape pollination ecology [20,75]. These fields have set the research basis for interrelated dynamics between pollinators’ movements and the landscape’s spatial matrix, elevating the significance of the spatial scale of research [30]. Under this influence, progressive land management with introduced and indigenous plants helps to improve ecological outcomes [74] by bringing an ecosystem toward more complex succession. Hybridized, rich flora species facilitate higher visitation rates of pollinators to crop fields [76], improve ecological services and soil quality, provide erosion protection [68], and even inhibit excessive nitrification [77]. Studies have advocated that increasing species richness in stressed environments requires certain restructuring of landscape components that supply resources important to many species and whose presence increases local species diversity, such as transitory wetlands in fields and solitary trees distributed through grassland [78,79]. Specialized habitats associated with streamside vegetation, gullies, ridges, and ditches are important in an agricultural setting as they have a positive effect on native fauna disproportionate to their limited extent [80]. Agricultural landscapes may incur specialized habitats connected with topographic characteristics, such as gullies and ridges, or anthropogenic ground formations, such as irrigation ditches, for example, which have also been considered essential with a favorable influence on wild pollinator thriving and abundance [80].
As monoculture treatments often result in processes that negatively affect pollination [81,82] through habitat loss and land fragmentation [83,84], we focus on land cover and landscape mosaic characteristics for which studies have shown interdependencies between pollinators and the extent of habitats, the composition class of the mosaic, and the spatial configuration of elements [79,85]. According to Bennet, the land mosaic’s composition relates to the various elements present and their relative proportions [79]. These elements can be grouped according to land use categories, such as grassland, arable crops, wetlands, forests, and human settlements [79], or in relation to characteristic vegetation types. A further step is taken to rank land cover classes according to how well they respond in the provision of forage for honeybees [25,86]. In this context, the landscape composition (type and amount of landscape cover types) [87,88], landscape configuration (patch size, strips, edges) [88,89], and landscape connectivity (as connection to landscape corridors and natural habitats) [90] inform a threshold for biodiversity enrichment and influence the movement behavior of pollinator [85]. Although the contemporary literature in this field is still emerging and effective associations remain obscure or partially developed, a description and understanding of the synthesis of the landscape help us to configure which aspects of the landscape’s structure to emphasize. Landscape pollination ecology places a central interest on the configuration and synthesis of the wider regional landscape and the effects of landscape attributes on pollination dynamics [85].
The approach undertaken for this study of farming estates was defined on a multidisciplinary level involving landscape design representations, charting, diagramming, and GIS mapping techniques, together with cross-referencing of plant lists from botanical indexes. The approach required specific targets to be set in order to (a) understand the existing landscape characteristics of each specific farming area, (b) understand the immediate surroundings of the farming areas, (c) bring attention to the landscapes’ configuration and composition parameters, (d) gain knowledge about the plant habitats that secure adequate foraging areas for the domesticated bee populations, and (e) propose optional plant enrichments for each farming field with different vegetation layers from indigenous Mediterranean plant species, as well as plants that are geographically related to the wider eco-region, in order to increase biodiversity and improve the quality and production of fruits and seeds from the process of cross-pollination to which bees contribute.

2.2. Study Areas

Our preliminary study was conducted in four agricultural farming estates in Thessaly and the Peloponnese involving apple farming, citrus orchards, and hemp cultivation. The study areas ranging from 2 ha to 20 ha were not intended to bear any similarities apart from their common attribute of sustaining a biological farming profile. All case studies involved agricultural estates of mainland Greece, situated in the Peloponnese and Thessaly. The aim was to analyze and support habitat, nectar, and pollen availability across seasons and to further configure the local landscape’s spatial characteristics that relate to biodiversity conservation with an emphasis on plants that contribute to the sustenance of bee colonies throughout their active seasons and services offered to organic agriculture. The specific geo-reference locations for each farm are (1) farm A in Metaxochori, Larissa (39°43′06.6″ N, 22°44′21.9″ E); (2) farm B in Kokkina, Farsala (39°20′33.6″ N, 22°39′22.2″ E); (3) farm C in Rizes, Arkadia (37°25′56.7″ N, 22°28′49.4″ E); and (4) farm D in Aigies, Laconia (39°20′33.6″ N, 22°39′22.2″ E).
Farm A in Metaxochori, Larissa, is located in the area of Agia in the municipality of Larissa, which is a traditional settlement. Metaxochori Village is built at an altitude of 300 m and is 36 km from Larissa. The main crops are apples, cherries, hazelnuts, olives, peaches, cherries, figs, and a few potatoes. Apples, cherries, and pears are trained as espaliers in order to maximize crop production and save space. About 20% of the apple production in Greece is in the area of Agia. The area belongs to the vegetation zone Quercetalia ilicis Subarea Quercion ilicis. The ecosystems grown in this sub-area are mainly those of sclerophyllous shrubs with or without pine trees. In the most shallow, poor, and acidic soils, there are plant communities, such as Erica manipuliflora, Arbutus unedo, and Cistus sp. There are often pine trees, which are poor and sparse, and their height rarely exceeds 10 m. Where the soil is better, Erica arborea penetrates, while the pine trees here are in closed formations and acquire a higher height (up to 15 m). On the contrary, in good places with deep, fertile, and elevated-moisture soils, we find almost all of the evergreen sclerophyllous shrubs of Oleo lentiscetum and in addition Spartium junceum, Calicotome villosa, and Quercus ilex and deciduous plants of the upper blooming zone, such as Fraxinus ornus, Quercus pubescens, and others [88,89].
Farm Β in Kokkina, Farsala, belongs to the municipality of Farsala in the geographical district of Thessaly. Kokkina has an altitude of 642 m above sea level. In this area, mainly large-scale crops, cereals, cotton, industrial tomatoes, corn, and, more recently, medical cannabis are produced. The area belongs to the vegetation zone Quercetalia ilicis Subarea Quercion ilicis. The ecosystems grown in this sub-area are mainly those of sclerophyllous shrubs with or without pine trees. In the most shallow, poor, and acidic soils, there are plant communities of the family Ericaceae (Erica manipuliflora, Arbutus unedo) and the rock roses (Cistus sp.). There are often pine trees, which are poor and sparse, and their height rarely exceeds 10 m. Where the soil is better, Erica arborea penetrates, while the pine trees here are in closed formations and acquire a higher height (up to 15 m). On the contrary, in good places with deep, fertile, and elevated-moisture soils, we find almost all of the evergreen sclerophyllous shrubs of Oleo lentiscetum and in addition Spartium junceum, Calicotome villosa, and Quercus ilex and deciduous plants of the upper blooming zone, such as Fraxinus ornus, Quercus pu-bescens, and others [88,89].
Farm C in Rizes, Arcadia, is the largest village of the municipality of Tegea in the Peloponnese district. It is situated at an altitude of 690 m. The inhabitants are mainly engaged in agriculture but also in trade. The local agricultural products are cherries and apples, mostly trained in espaliers. In addition, potatoes and vegetables are also cultivated. The village toward Prophetes Elias is largely covered by pine forest. The area belongs to the vegetation zone Quercetalia pubescentis Subarea Ostryo carpinion. It is characterized by vegetation of evergreen sclerophyllous shrubs, deciduous broadleaf, and mainly oak forests dominated by Quercus pubescens. The sub-area is distinguished in individual growth areas: Cocciferocarpinetum, Carpinetum orientalis, and Quercetum cocciferae [88,89].
Farm D in Aigies, Laconia, belongs to the eastern Mani in the geographical district of the Peloponnese. Aigies is situated 47 m above sea level. The main crops are olives, forage plants, and Citrus spp. The uphill areas have been severely deforested due to successive extensive fires, while Olea europea varieties create an extensive monoculture substituting the previously forested areas. The area belongs to the vegetation zone Quercetalia ilicis subarea Oleo ceratonion growth space Oleoceratonietum. Τhis zone is the warmest and driest zone of the country. It is known as Quercetalia ilicis or Arizona because its limits coincide with the distribution of Quercus ilex. This is where most fires occur. It is the zone of the coast and the scrubland of shrubs with or without the presence of warm pine trees. It appears in an almost continuous strip, interrupted locally by agricultural and residential areas, along the coasts of Western, Southeastern, and Eastern Greece; the Ionian and Aegean islands; and the coasts of Macedonia and Thrace. The study area is ecologically, and physiologically subdivided into the sub-area of wild olive and locust bean (Oleoceratonion). Oleoceratonietum is geographically the lowest area of southern Greece and climatically the warmest growth area. This is one of the most disturbed zones due to the strong presence of humans from ancient times. In fact, we could characterize this compound as a growth area of predominant species, such as Poterium spinosum, Genista acanthoclada, Euphorbia acanthothamnos, Corydothymus capitatus, Salvia sp., Phlomis fruticosa, Asparagus aphyllus, and Anthyllis hermaniae. In addition, many of the evergreen sclerophylla species, such as Ceratonia siliqua, Olea europea, Pistacia lentiscus, Juniperus sp., and Erica sp., are also found here [88,89].

2.3. Methodology

The preliminary study undertaken does not have the character of a final study of application (this would require topographical plans), nor does it use quantifiable evidence for landscape configuration. Within the available time frame and the existing resources, it relates bibliographic research for each region’s climate and flora with studies of landscape composition characteristics and mappings of landscape configuration to deliver prototypical landscape models that farmers can follow as indicative actions, suggesting (a) the identification of the existing plant species of apiculture interest in the study areas and (b) enrichment proposals (species and methods of enrichment) with new plant species of apiculture interest suitable for study areas.
We used three research approaches to compile our dataset of parameters that led to the definition of models, and then, we followed a pilot implementation of introduced honey bees in three of the four farms and monitored the impact on crop growth and yield. The research approaches were synthesized in three different tiers of analysis.
The first tier of analysis involved classification of each study area by climate conditions (mean temperature and rainfall), soil type, vegetation zone, and type of agricultural practice, followed by the indexing of significant plant species that have been registered in the literature for the respective region of each study area, with a charting of their blossoming period, providing adequate pollen and/or nectar production (Table 1). This study informed year-round charts that made evident the abundance or scarcity of bee foraging areas throughout the year (Figure 1). These charts were helpful for the definition of the seasonality profile of each farm but also instructive for the definition of plant species that could be introduced to diversify and prologue the seasonality for bee foraging.
The second tier of analysis followed an observation radius of 6 km from each farm for the study of land cover classes. This distance corresponds to a maximum threshold that may be traveled by a bee in the search for food. Although the mean foraging area around a beehive extends for 3 km, bees have been observed foraging twice and three times this distance from the hive. According to Beekman and Ratnieks, only 10% of the bees (Apis mellifera L.) foraged within 0.5 km of the hive, whereas 50% went more than 6 km, 25% more than 7.5 km, and 10% more than 9.5 km from the hive [90]. A comparative change of land cover classes at steps of 1 km perimeter from the source was used to create column charts that could visualize and assess the ecosystem change related to the maximum flying trip of honeybees. Land composition analysis was developed with the use of ARCH GIS (Geographical Information System) and set a geo-reference area of 6 km, as mentioned before. With the use of the Euclidean distance tool, we ran zonal statistics in increments of 1 km. These allowed the identification of land cover changes within the 6 km areas. The grain of the analysis corresponds to 100 m × 100 m and land cover data that were provided by CORINE DATASET 2012 [91], as shown in Chart 1 and Figure 2 and Figure 3.
Although there is no direct available ranking for the pairing of CORINE land cover classes to measurements that would allow us to rank types of land cover with the foraging suitability of pollinators, helpful evidence has been drawn by the EUNIS Habitats Classification [92] for the association of habitats and spatial distribution of biodiversity to the CORINE land cover classes. As there have been no recorded data that index specific values available for the participation of honeybees in the pollination process, ranking land cover classes according to pollination process criteria requires a systematic review of the literature to run tailor-made criteria and classifications [30]. Our ranking of land cover classes in terms of the foraging capacity for pollinators was further based on literature references from datasets and research undertaken by Kudrnovsky et al. [86] and Hellerstein et al. [25]. Our range values developed from 0 to 1 as attributes for land cover that vary from scarce foraging areas (seawater) to classes that provide abundance of foraging habitats, respectively (Chart 2).
A third tier of analysis was used for the interpretation of landscape connectivity characteristics at a diameter of 1 km from each farm, assessing the spatial characteristics of natural corridors, patches, and edges surrounding each farming estate. This radius was defined by following the argumentation of scholars proposing that native pollinators, on average, have shorter foraging ranges than honeybees and that native bees require nesting habitats [25,93]. Thus, pollinator friendly land covers must be relatively close, often less than 500 m, to crops that require pollination services from native pollinators [25,94]. This perimeter defines the observation of the immediate habitats and the inter-matrix of habitats and farms. Since agricultural areas are integrated with fragments of natural assemblages and unmanaged natural sites with plant species that are not purposefully manipulated but constitute biodiversity incubators facilitating flows of energy and matter within species, we considered such mappings essential for the delineation of landscape connectivity patterns in each farm. The mappings that were drawn indicated in a color gradient how each farming context is situated within natural and semi-natural areas, urban areas, and intensive-farming spaces (Figure 4). These mappings enabled us to observe the role of the natural patches, the “unmanaged sites,” and how fragmented or connected each farm was.
The assessment of the landscape’s functional connectivity within the spatial matrix of the farms’ adjacent mosaic [79] and its relationship with the pollinators’ movement defines a useful frame of thinking for further decisions to be made across managed landscapes. Effective measures for the restoration and optimization of ecosystem services require tools that facilitate plant biodiversity toward the development of complex landscape communities. Significant structural tools toward this direction include:
(a)
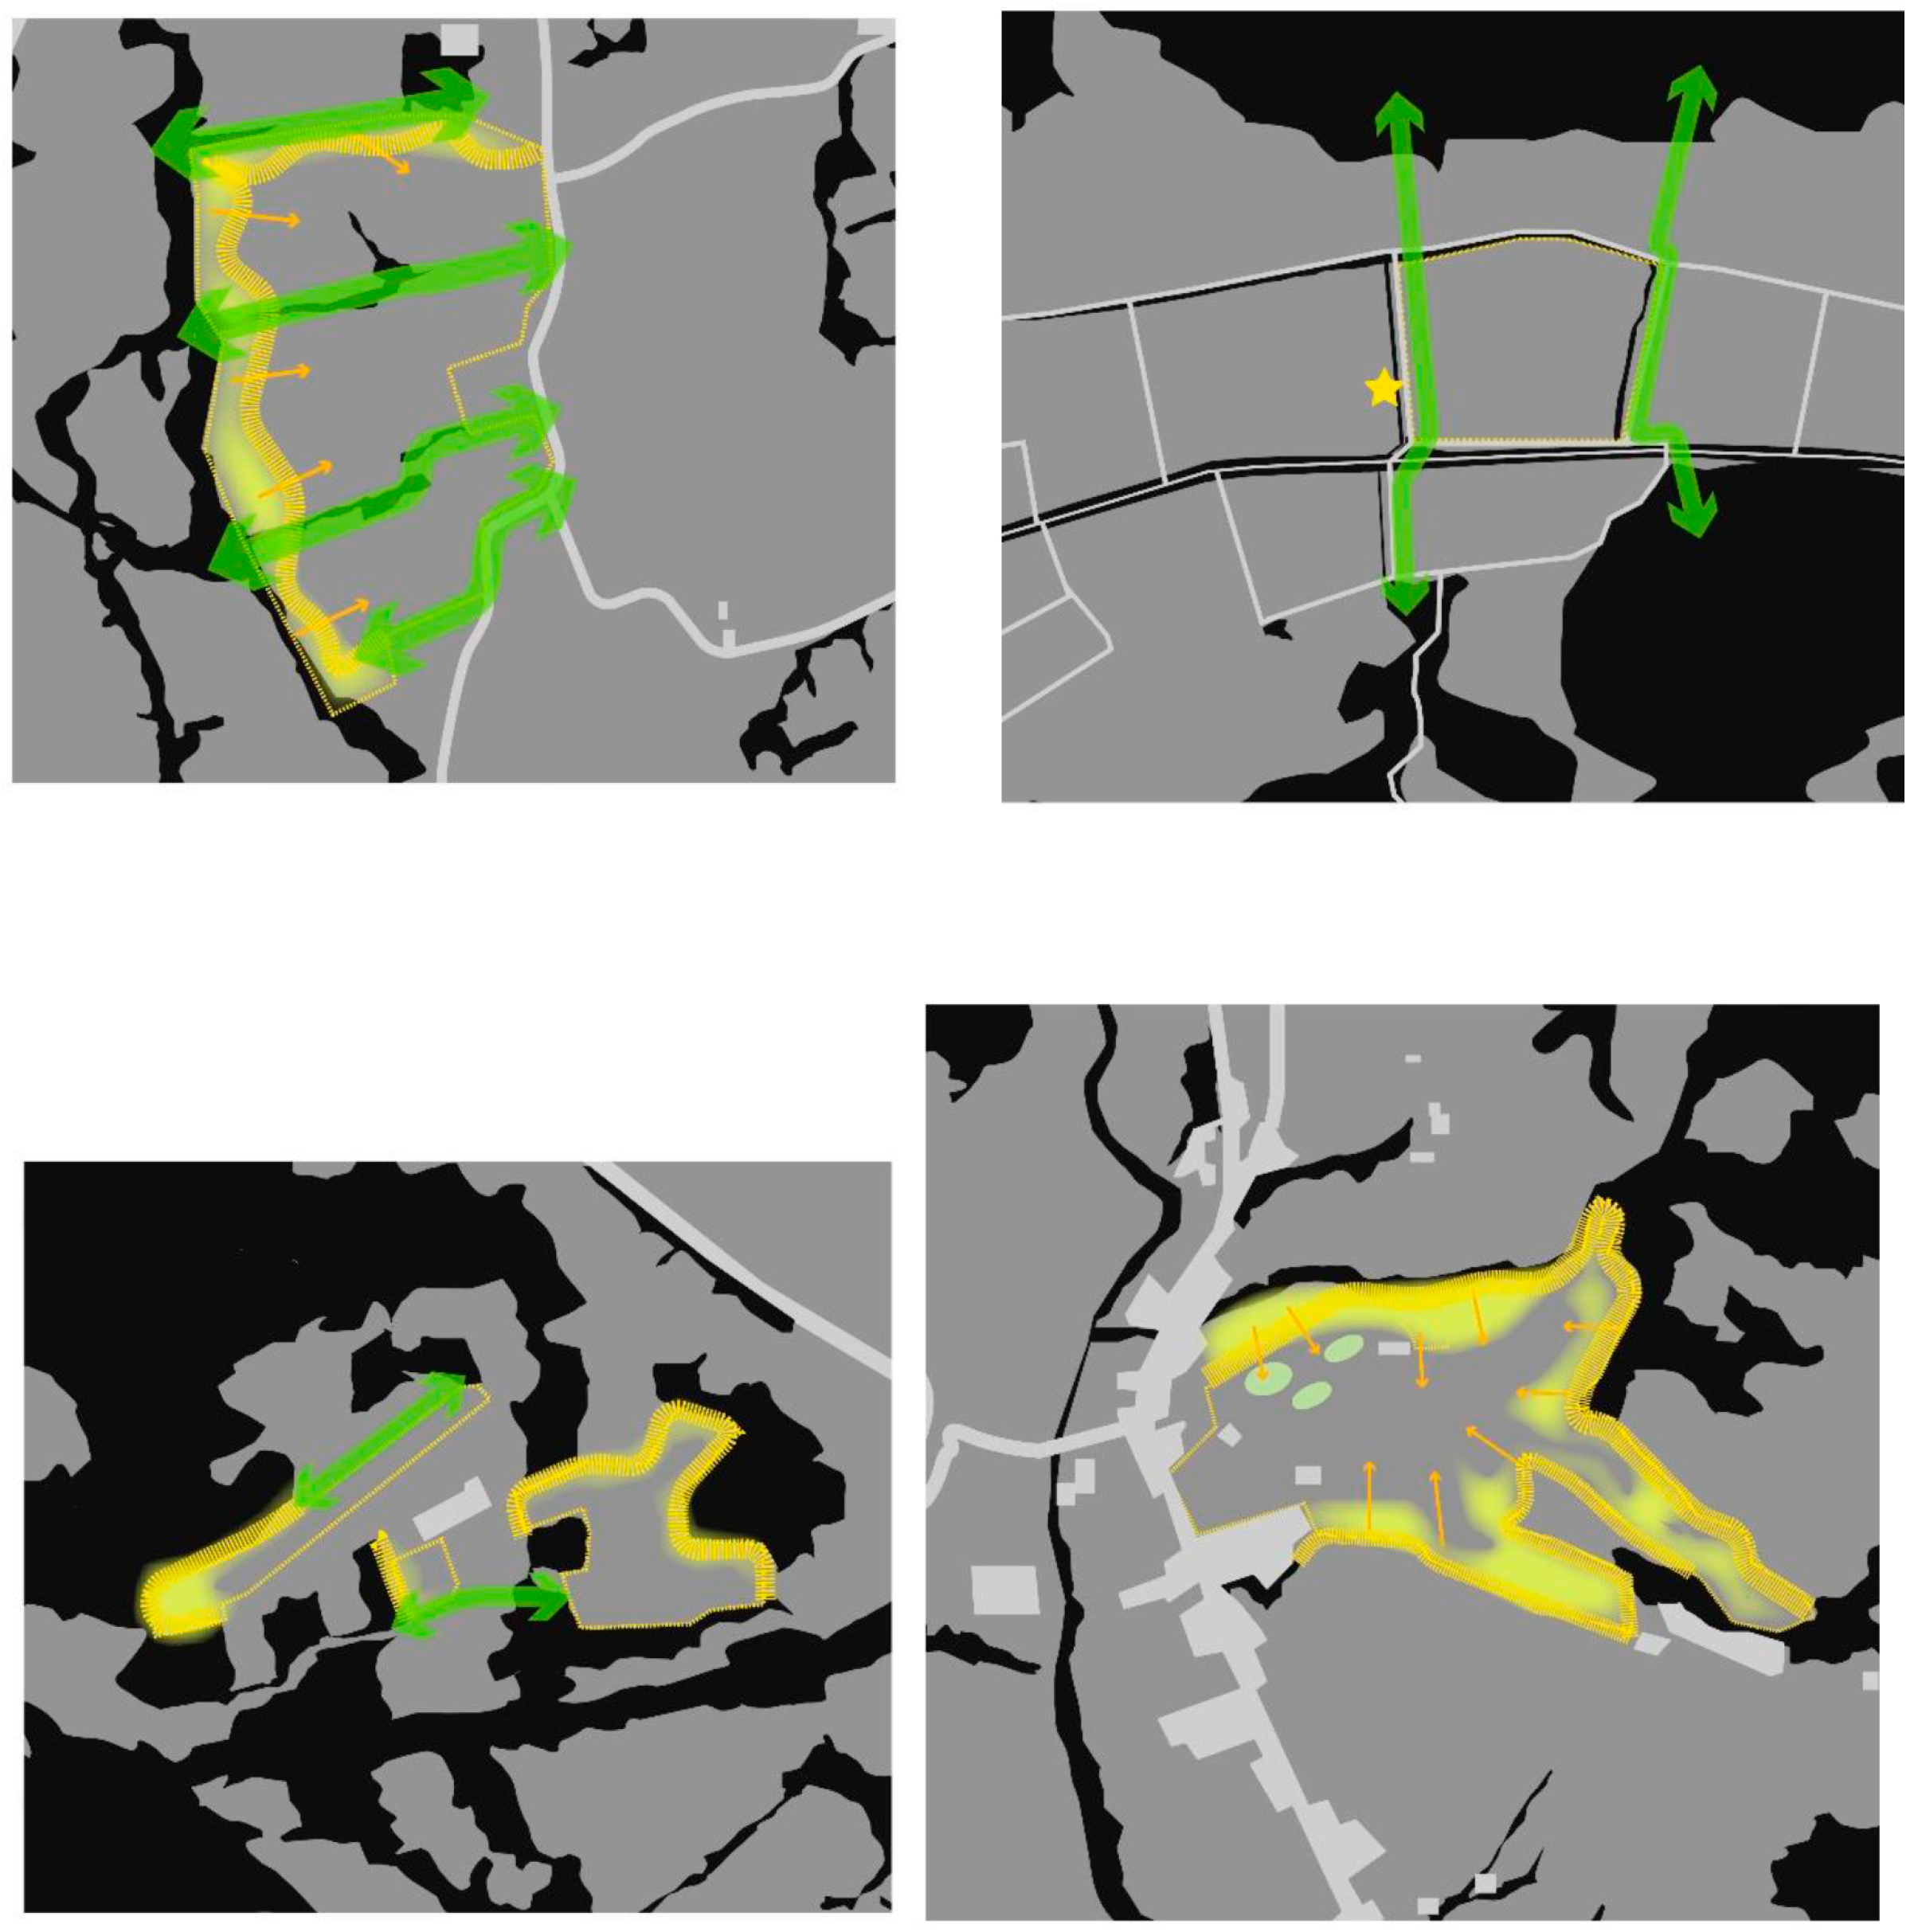
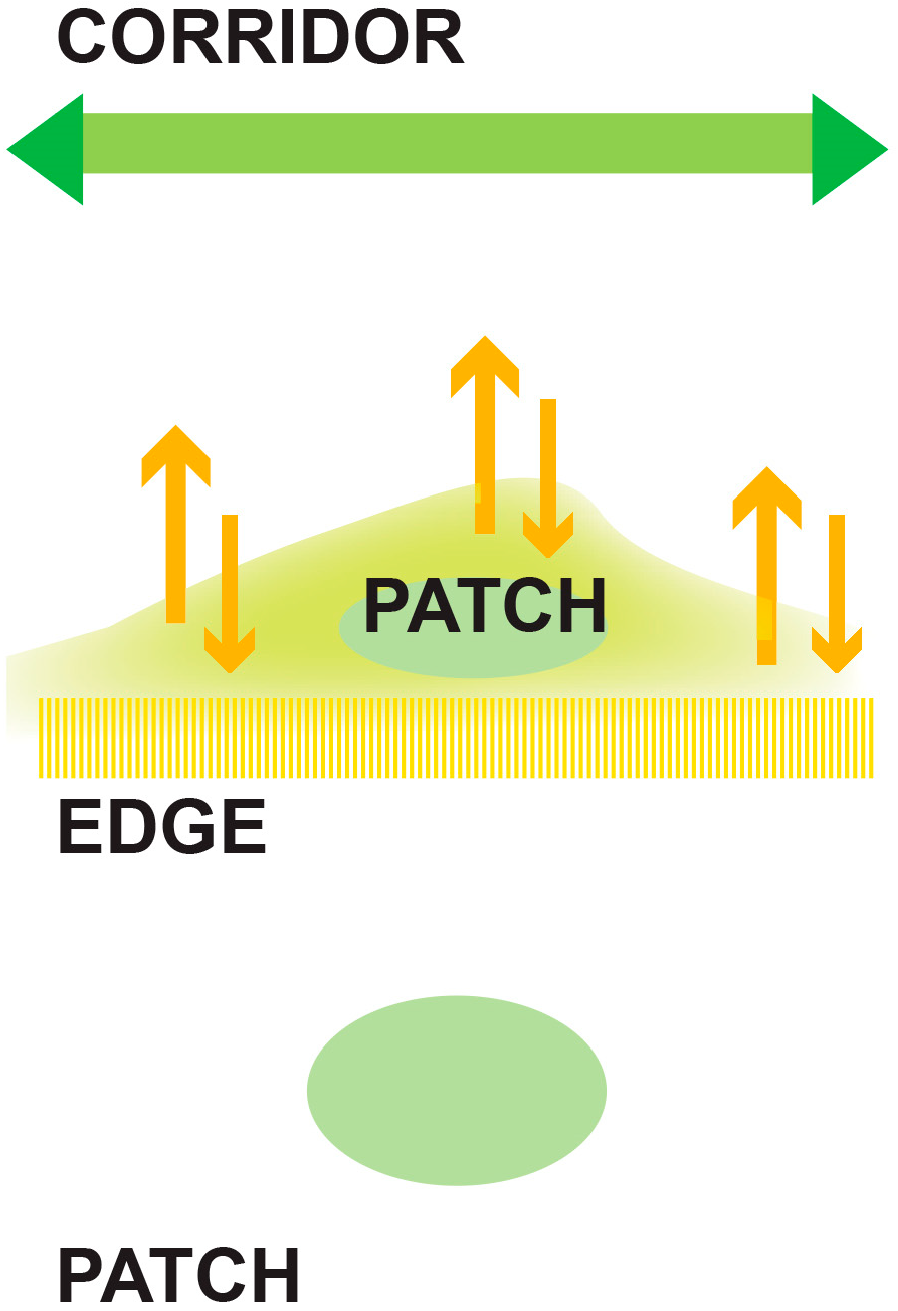
Corridors, which signify the degree to which the landscape facilitates or impedes movements between resource patches. Corridors facilitate the movement of pollinators. Provision for the intensification of landscape corridors increases functional connectivity by allowing the development and exchange of material, energy, and food.
(b)
Patches are defined as relatively homogeneous areas that differ from their surroundings. Their shape and size are critical for the spatial configuration of the landscape, since it disrupts or connects habitats.
(c)
Edges can direct the movement of animal species even deeper within a patch that possesses attractive resources [95] (Scheme 1).
Implementing landscape configuration components to each farm highlighted how different natural habitats, spatially defined as formations of edges, corridors, and island patches within the farms, play a structural role in the fostering of pollination services within the farms (Figure 5). These mappings provide armatures for the identification of landscape models and the definition of different typologies that can foster pollinator foraging areas and diversify the access of pollinators to pollen and nectar in the farms. Although presence of co-flowering plant species may reduce pollination success in a farm, with introduced honeybees resulting in competition among different flower species, it has been shown that pollinators switch their diet plan according to available resources [16]. Site fidelity by certain pollinators facilitates pollination by influencing pollen collection from sequentially blooming plant species. According to Ogilvie and Thomson, when the flowers of a preferred forage plant decline in an area, site fidelity may cause individual flower feeders to stay in the area and switch plant species rather than search for preferred plants in a new location at more remote distances. A newly blooming plant may quickly inherit the visitors from the plant species that was blooming previously and therefore experience higher pollination success in the same area [96]. Since foraging areas within the four farming estates decrease significantly in specific seasons, due to monoculture, tailor-made models for the diversification of pollinator foraging were largely based on the aforementioned armatures, aiming to intersperse the pollinator’s habitat with floral resources that would maximize abundance in proximity to the farms.
The configuration of the landscaped models was based on the definition of different types of interaction between natural systems and managed farming patterns, observing the embeddedness of edges, corridors, and patches of the landscape matrix within each farm. Six types of systems were defined in the four study sites: (i) type A: edge patch found in interstitial areas between apple and cherry plantations in espaliers; (ii) type B: shrub corridor between different terraces, with apples, pears, and cherries in espaliers; (iii) type C: edge corridor alongside an irrigation ditch bordering cropland plantations; (iv) type D: edge patch in proximity to forest groves, where cultivations include cherries and apples in espaliers; (v) type E: native meadow mix and understory layer of shrubs in citrus groves; and (vi) type F: understory meadow patch in deforested terrains with introduced olive groves (Figure 6). Plant enrichments for each defined type were based on planting data acquired for each farming region. These enrichments aim to provide farmers with a strategy that can easily provide recognizable types that offer a source for pollen and nectar abundance but further expand its availability outside the seasonal window targeted at each farm. The habitat systems that become operational in the different landscape model types include (a) rich species meadow patches and strips, (b) shrub corridors, and (c) mixed-species patches and strips (Figure 7). The synthesis of the aforementioned parameters resulted in illustrative sets of landscape models that visualize possible flora enrichment actions, as shown in Figure 8 and Figure 9 and Chart 3.
A pilot implementation of the introduced honeybees was performed in three of the four farms: A, B, and C. The introduction of the bees followed the seasonality of the main crop under cultivation in each farm. Observations were aimed at crop yield, crop size, and sugar content, with measurement of the solid solvents in apples, the content of essential oil, the quantity of seeds per inflorescence, and the size of seeds (in weight of 100 seeds), in the hemp cultivars.

3. Results

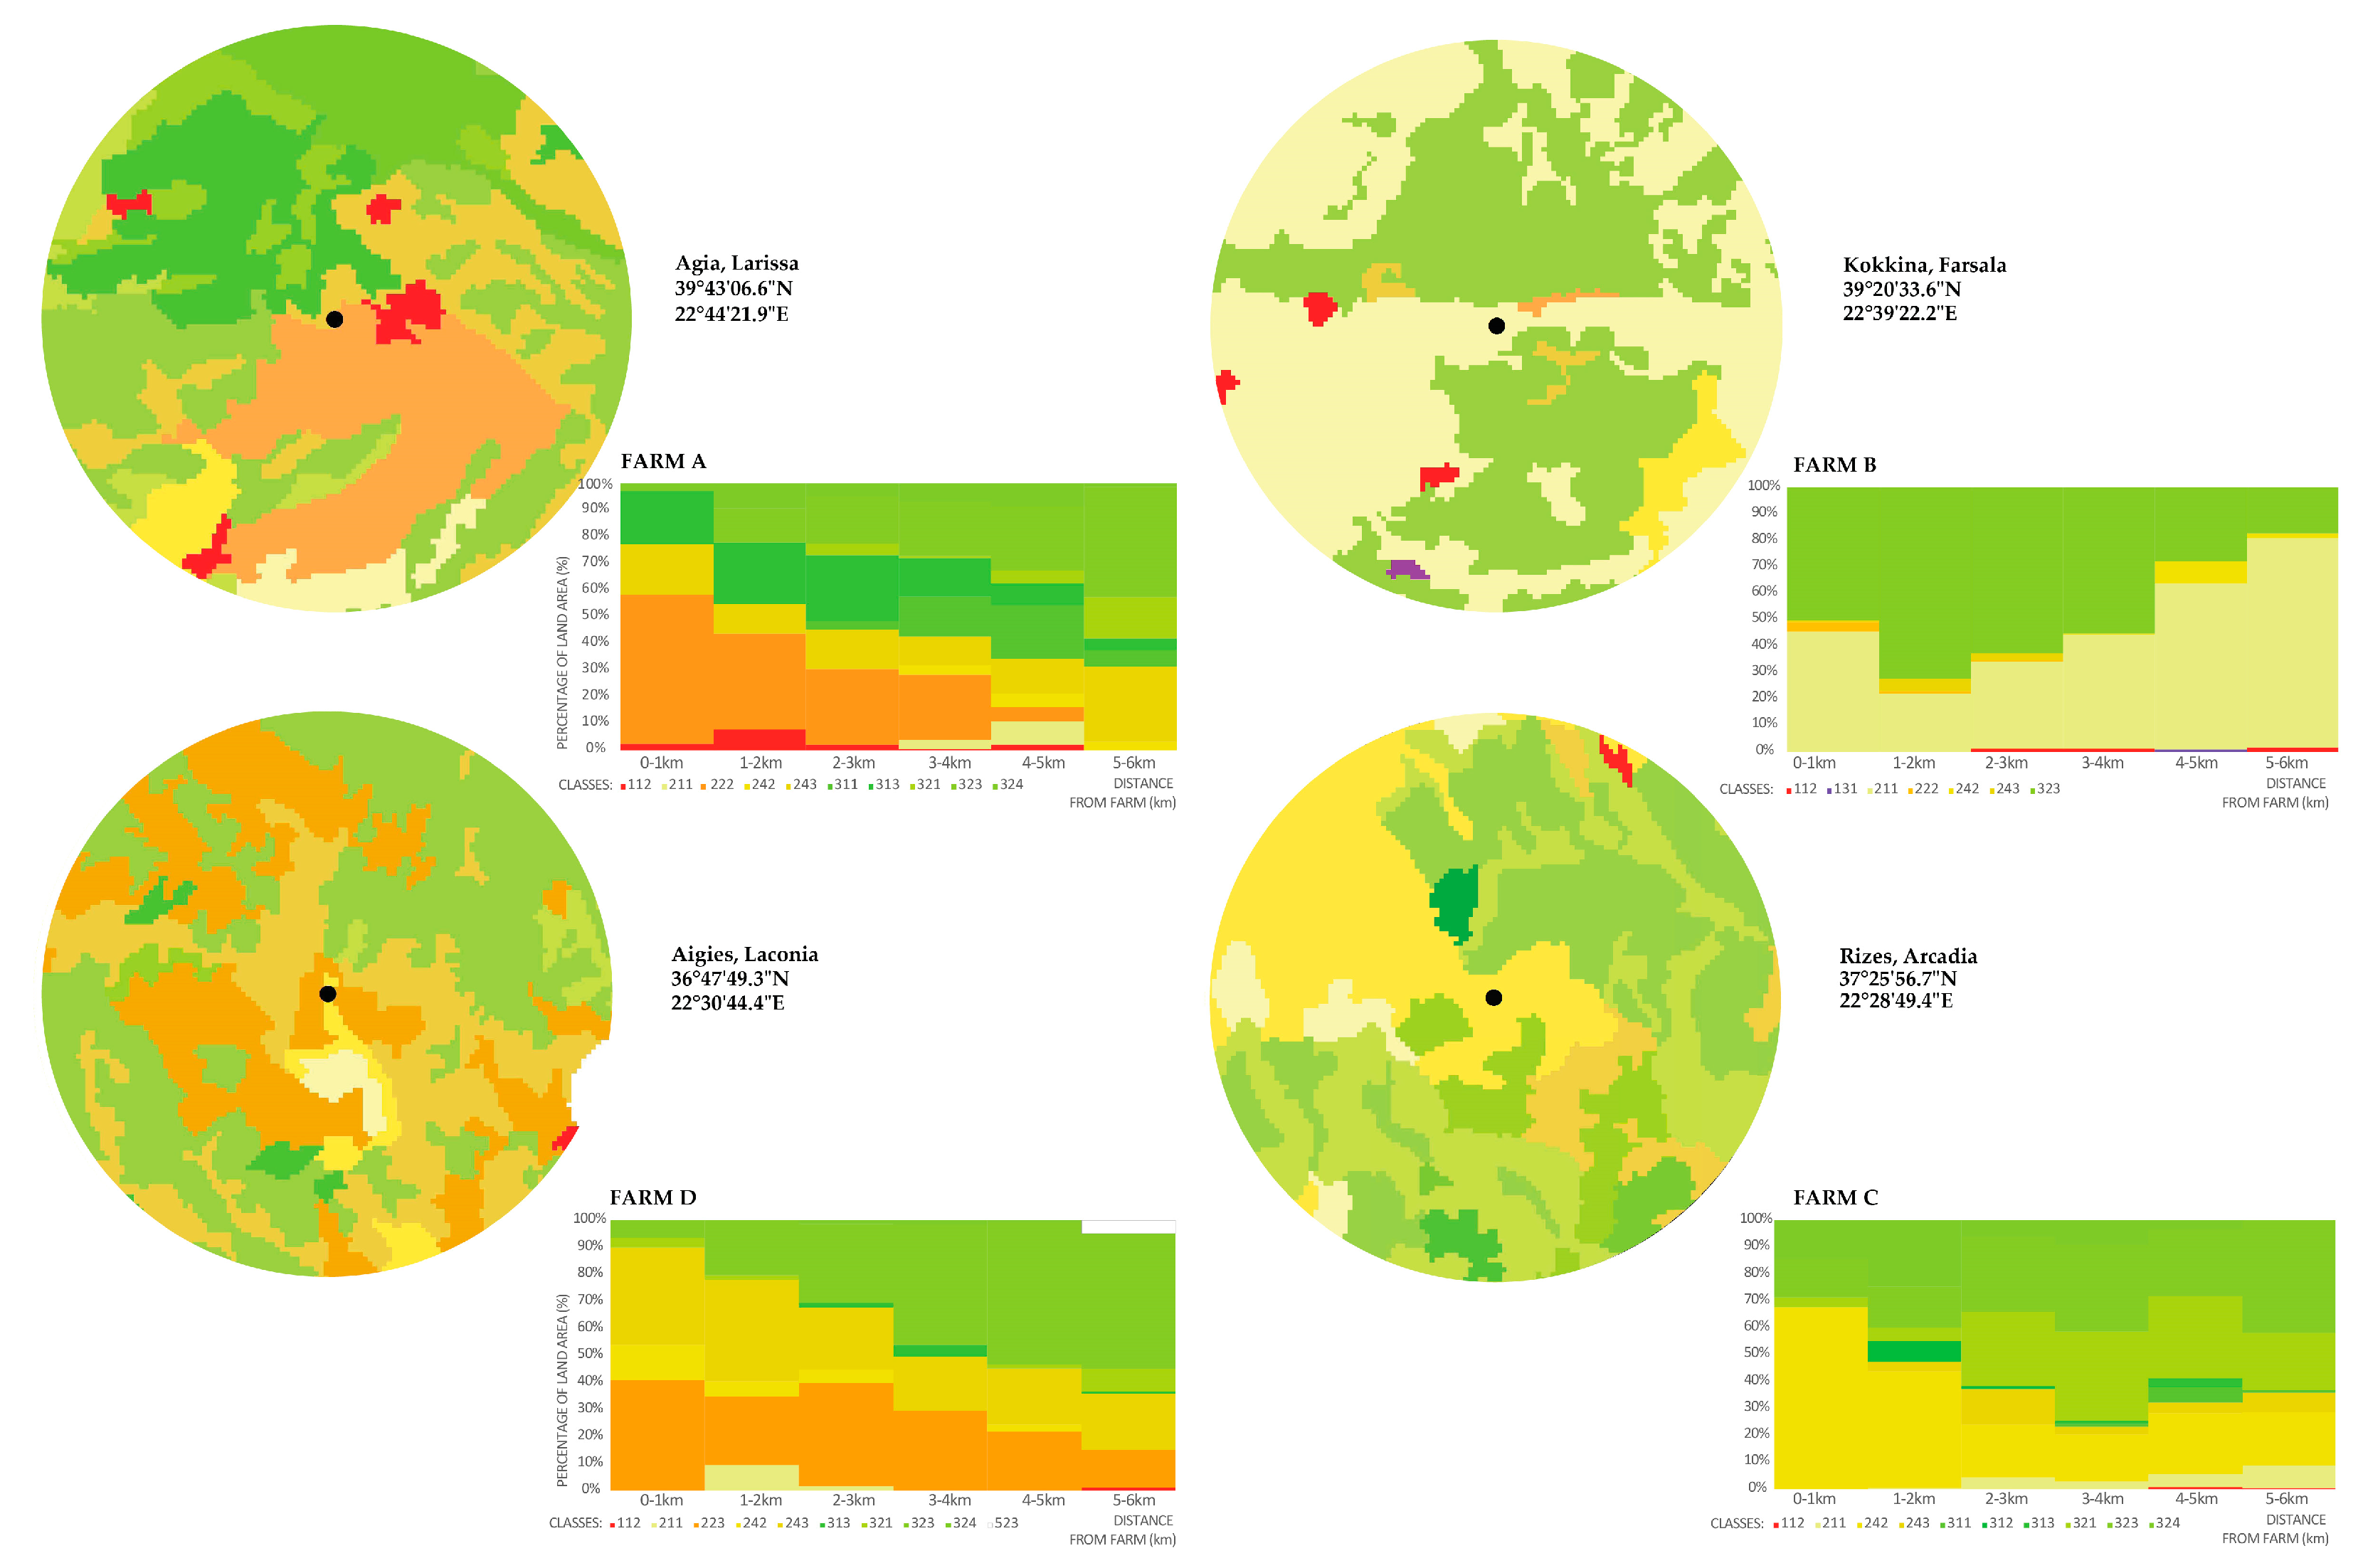
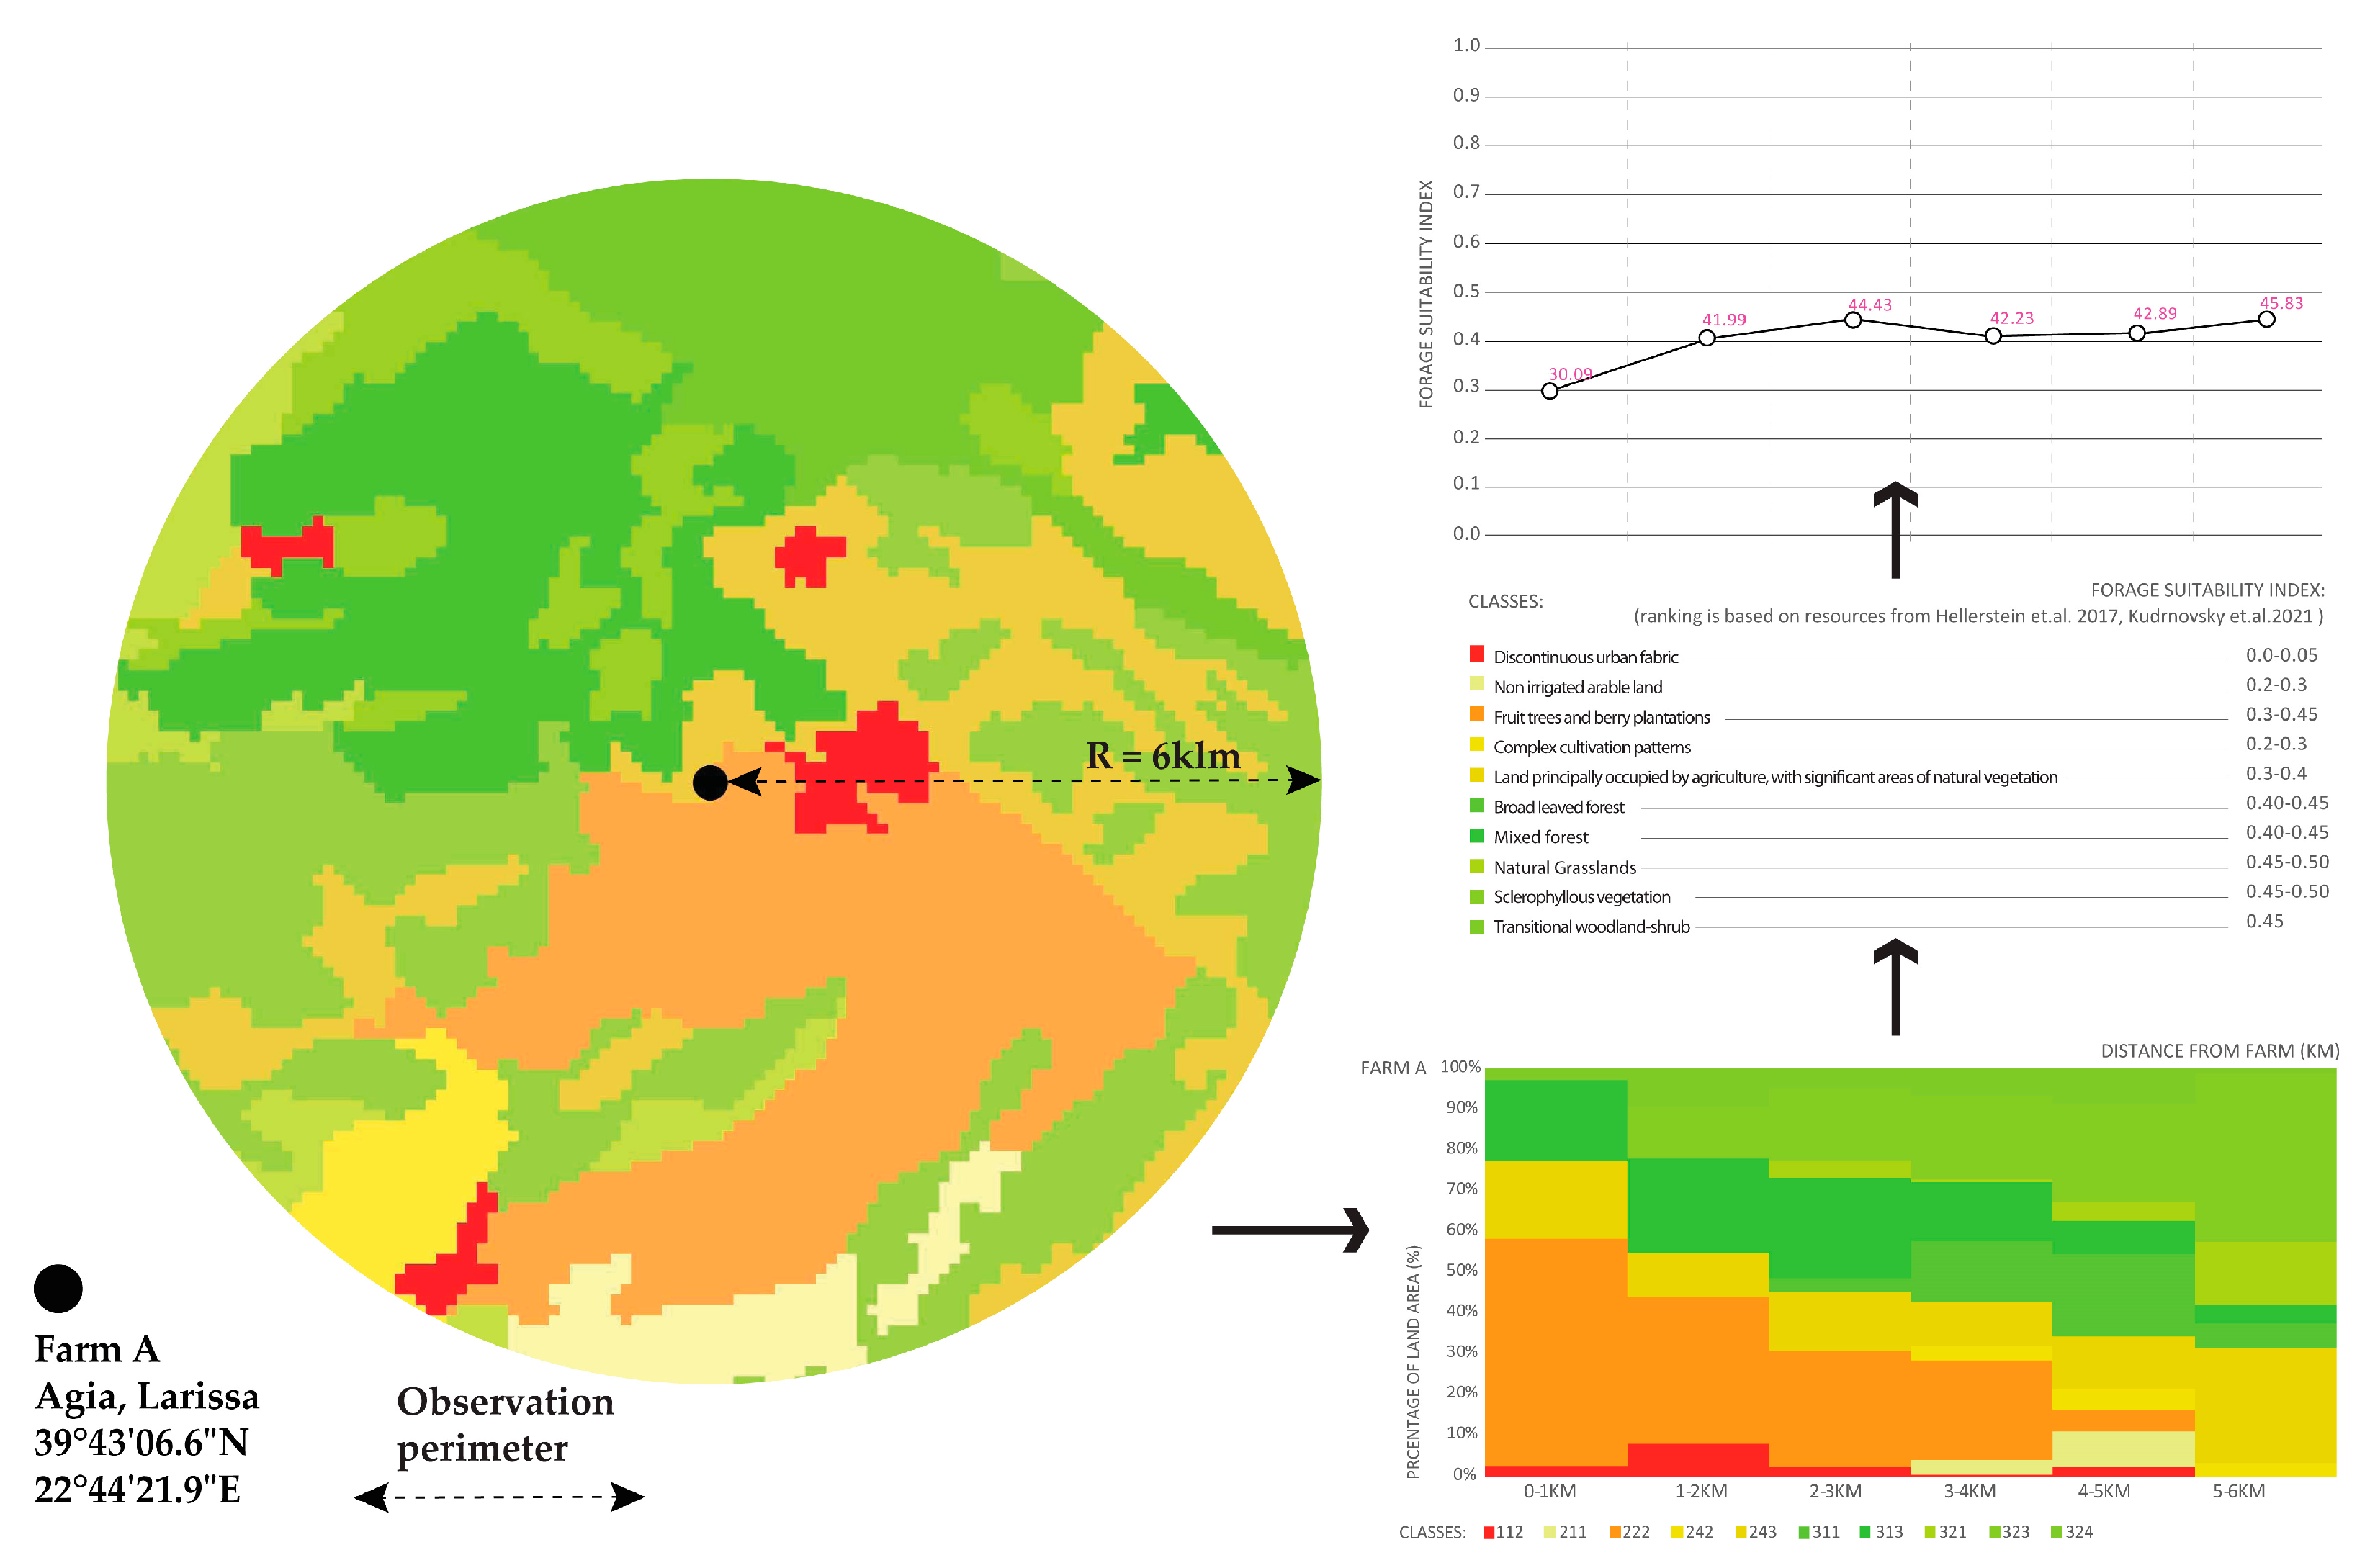
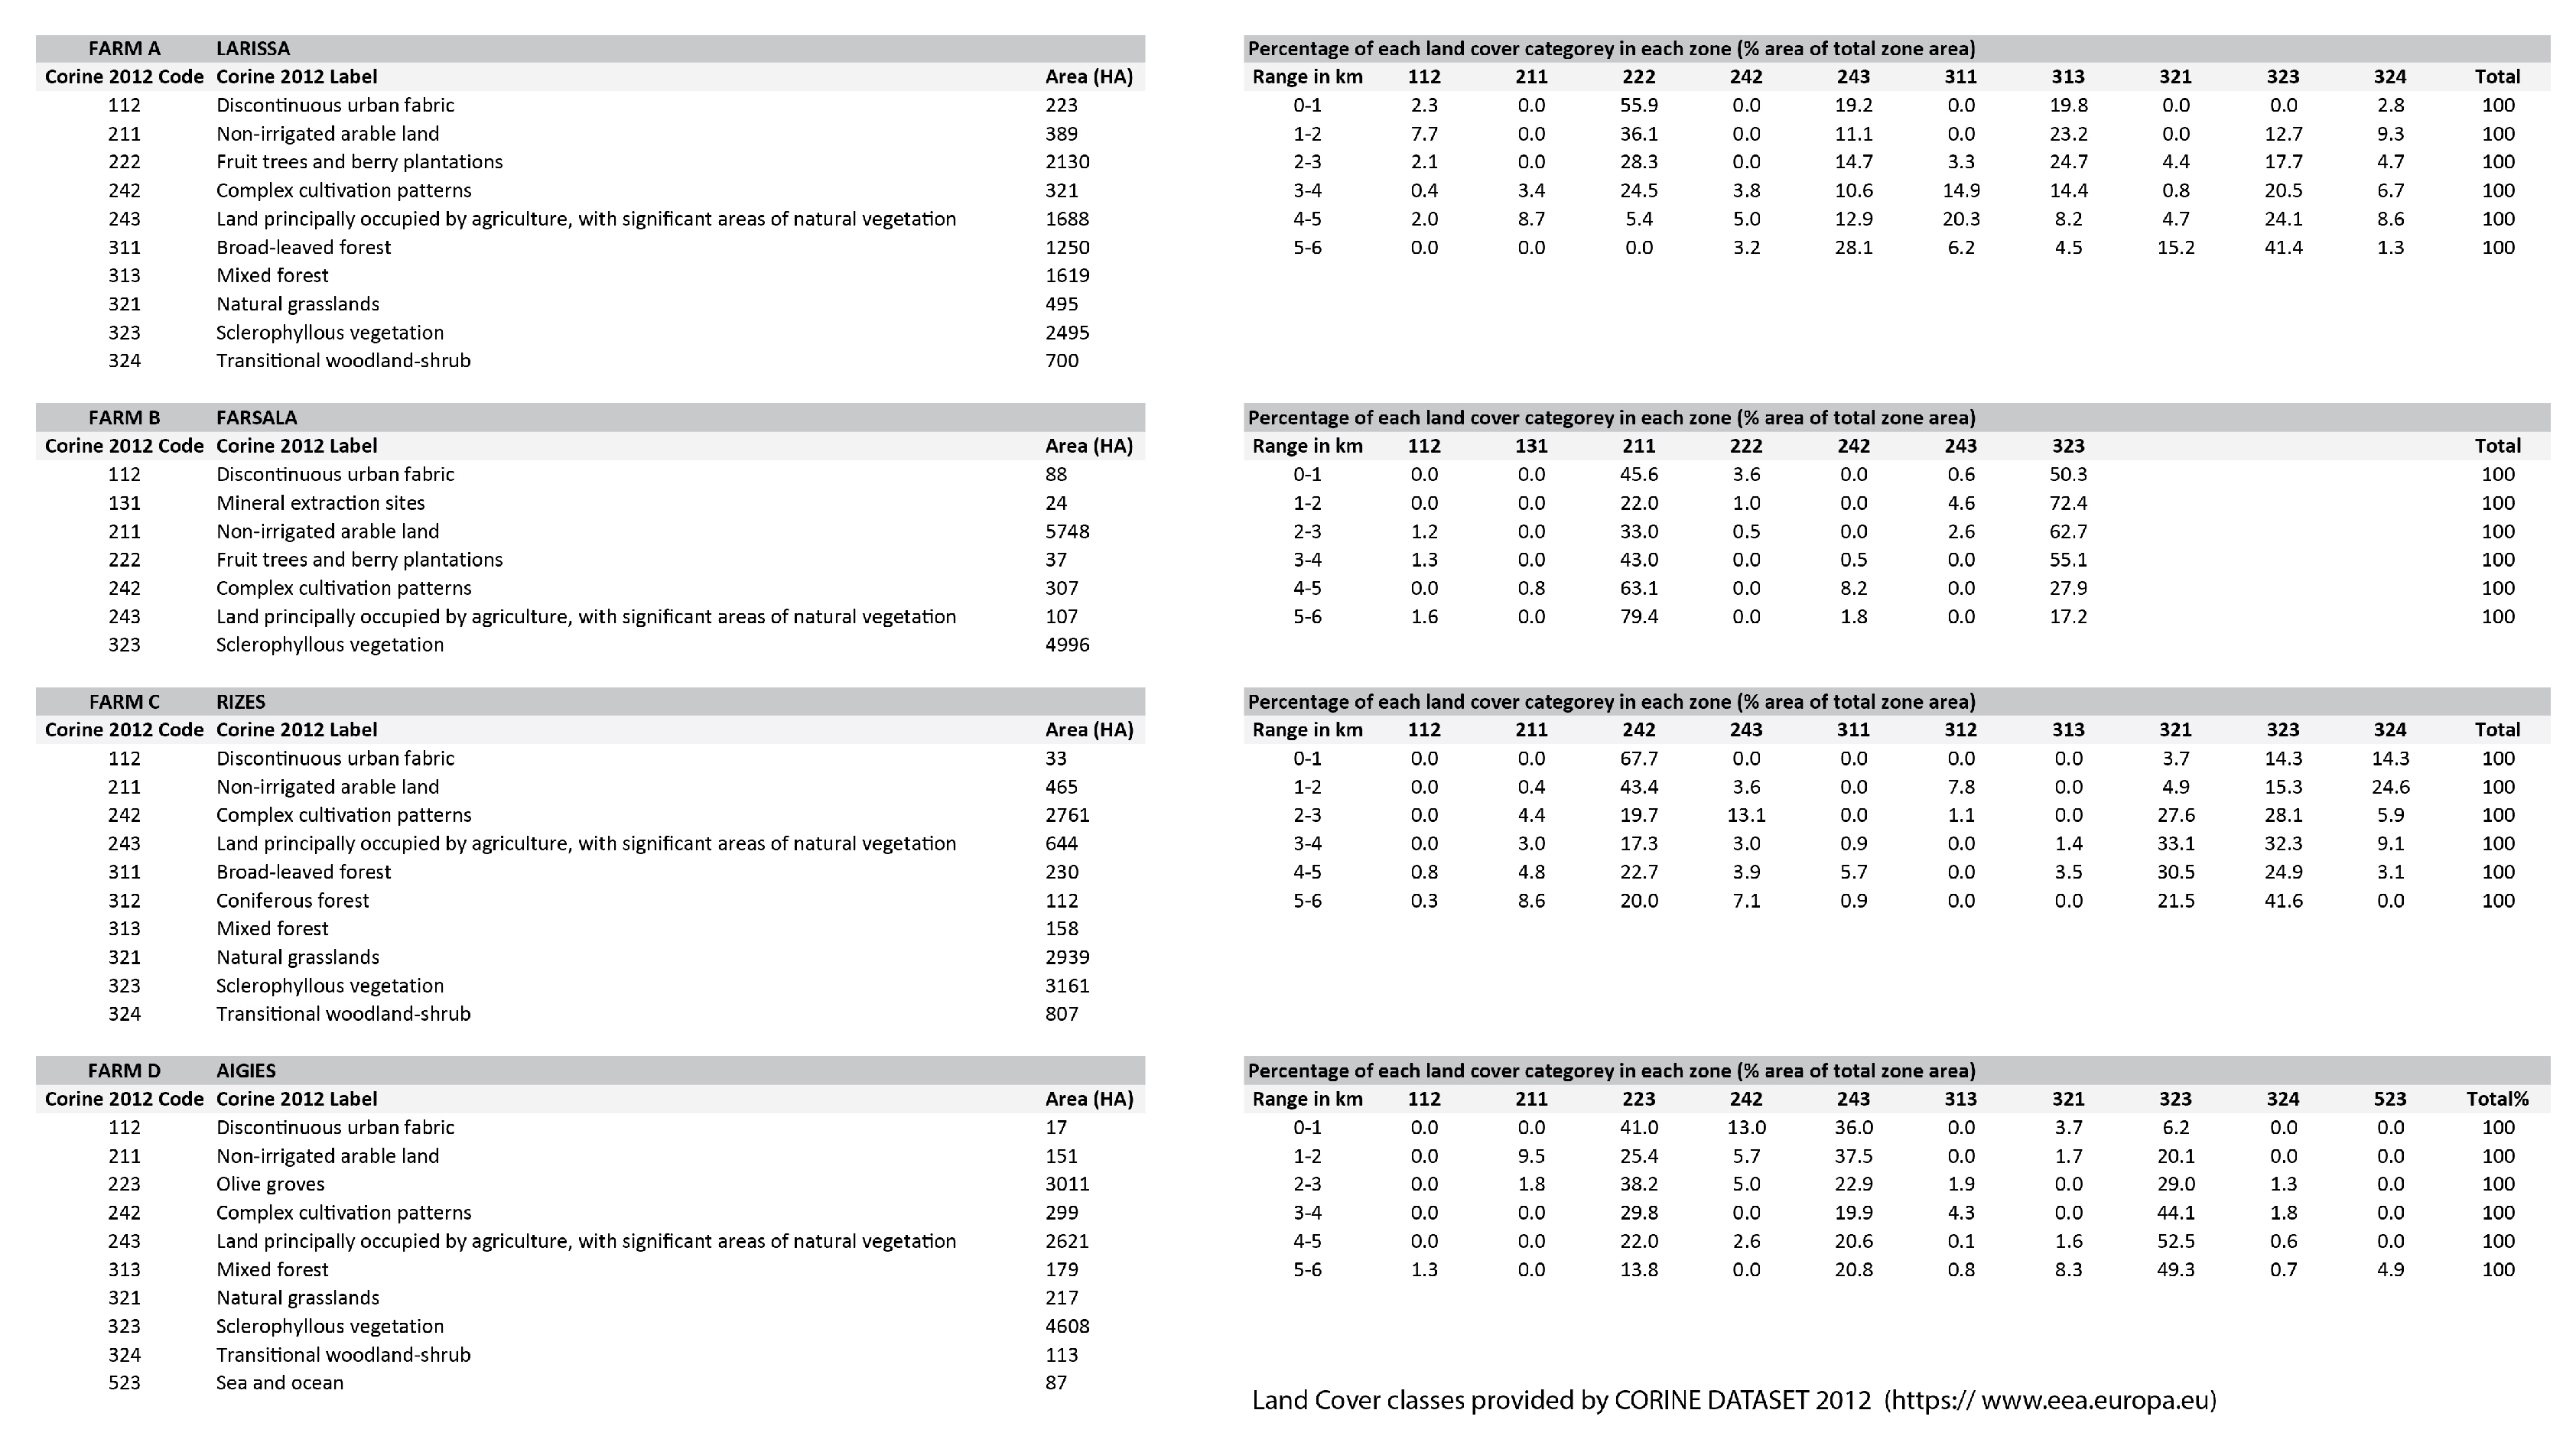
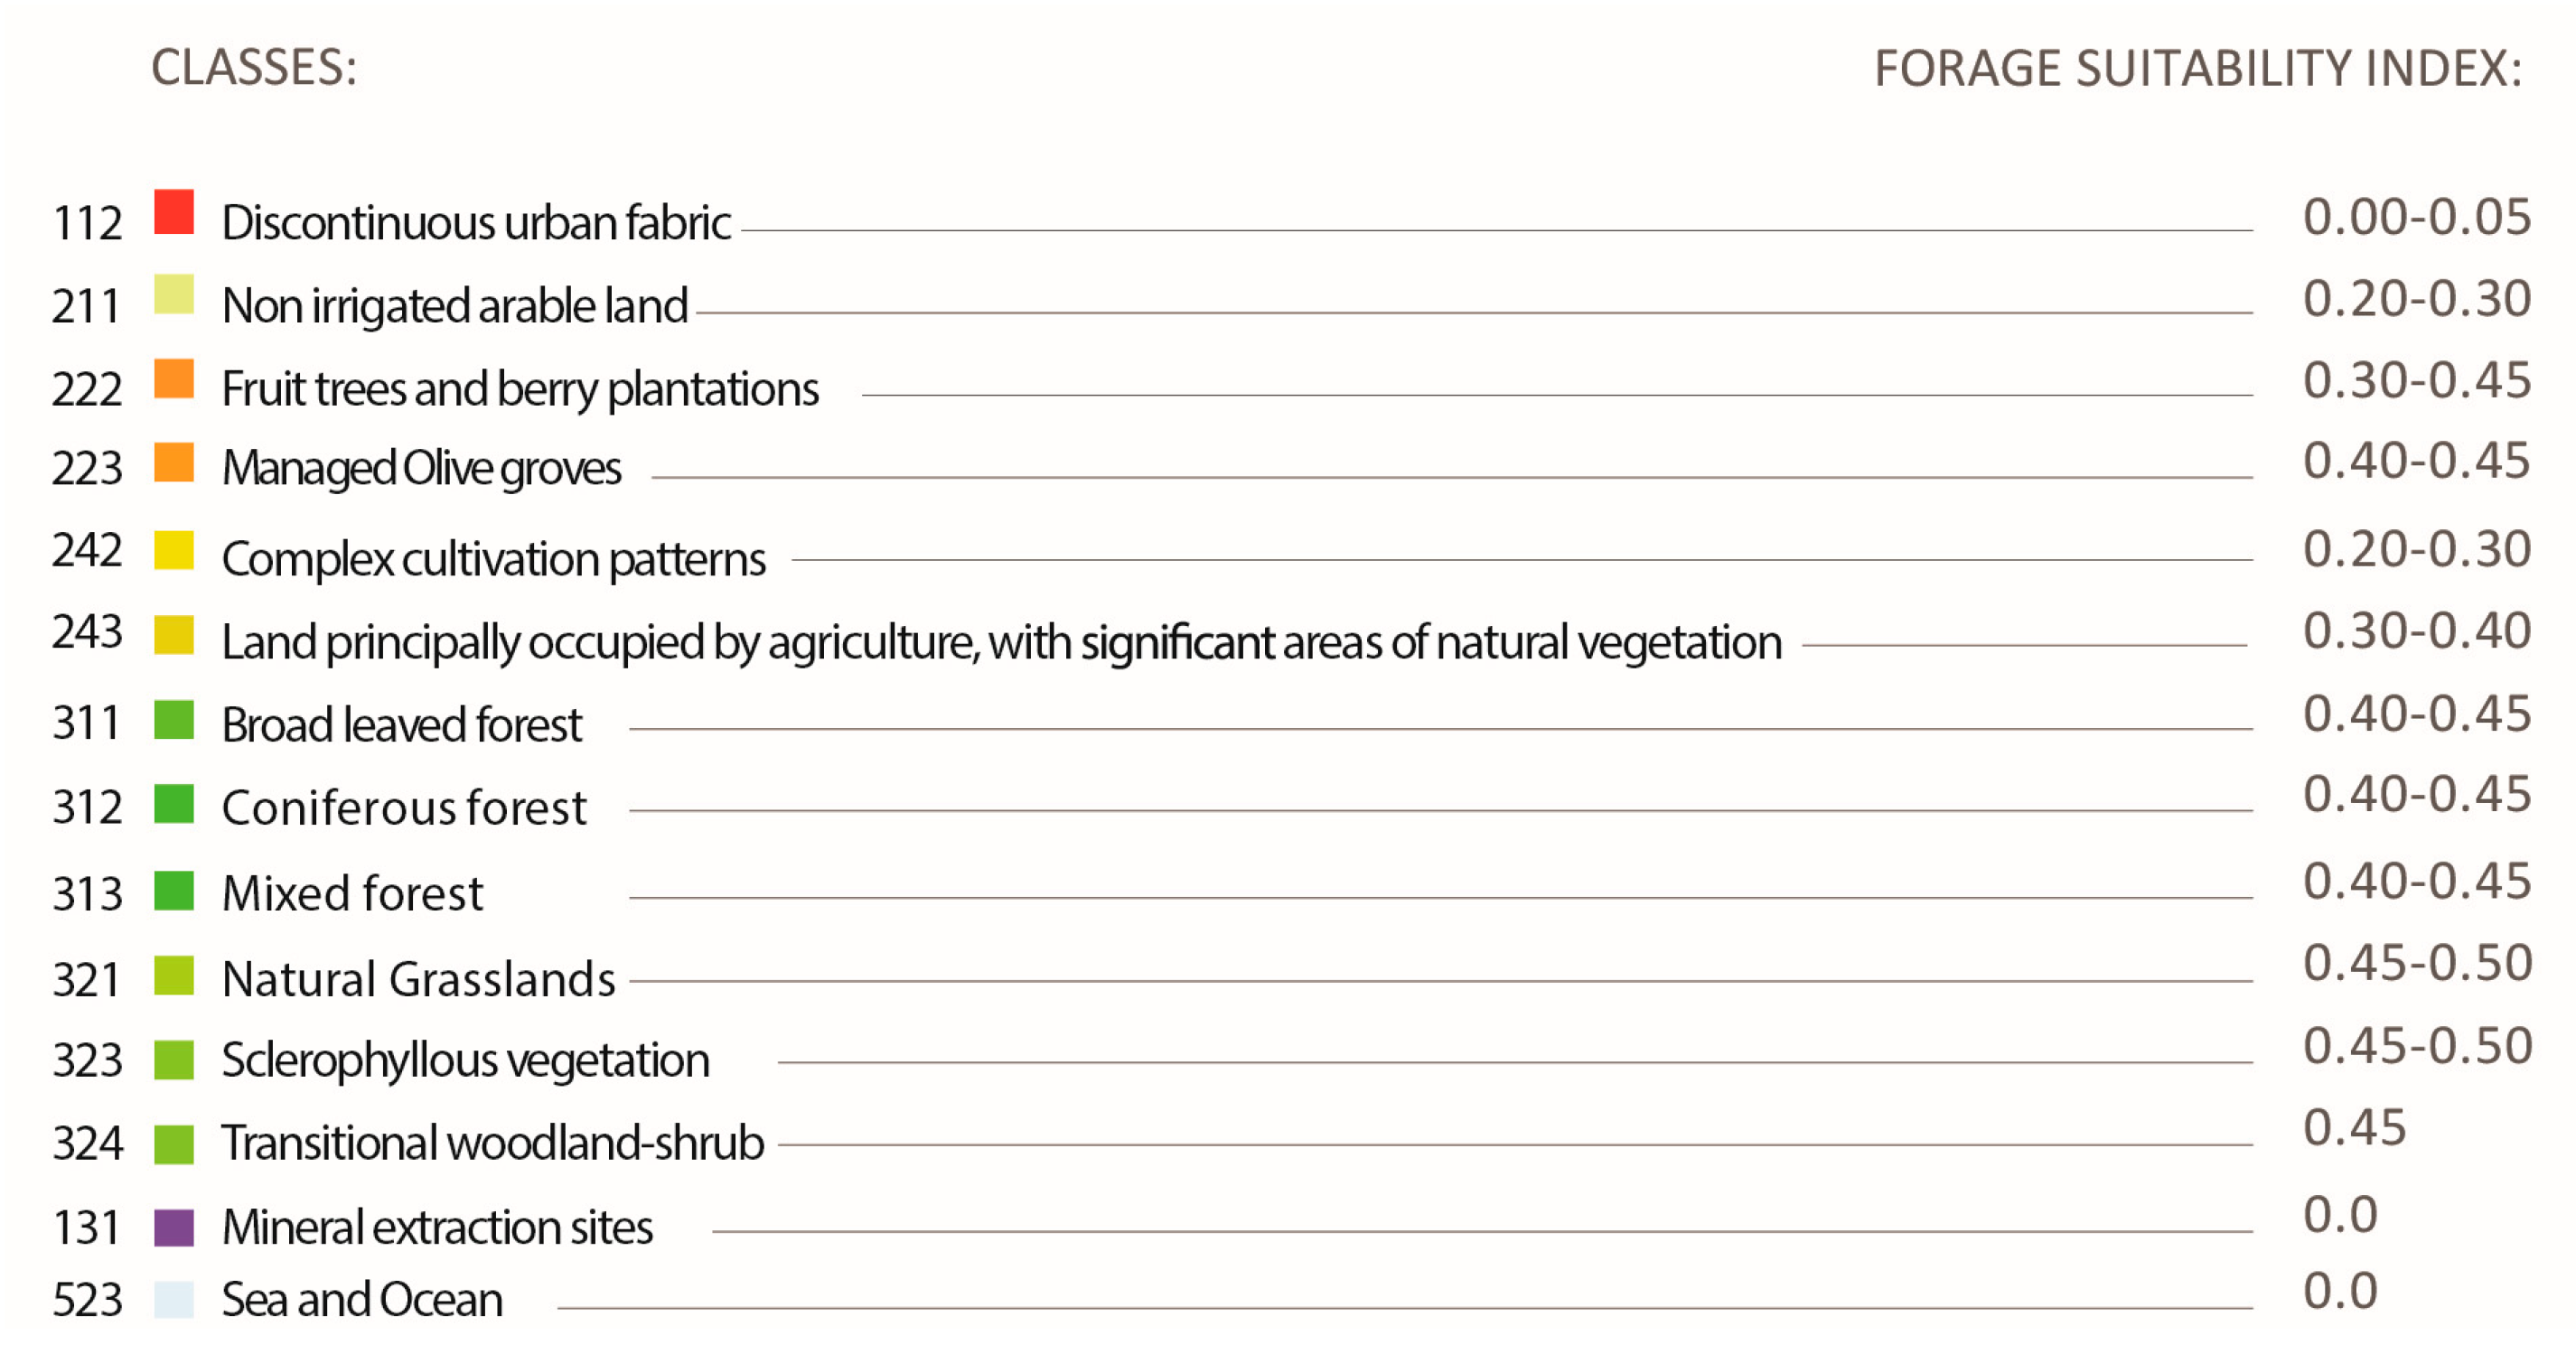
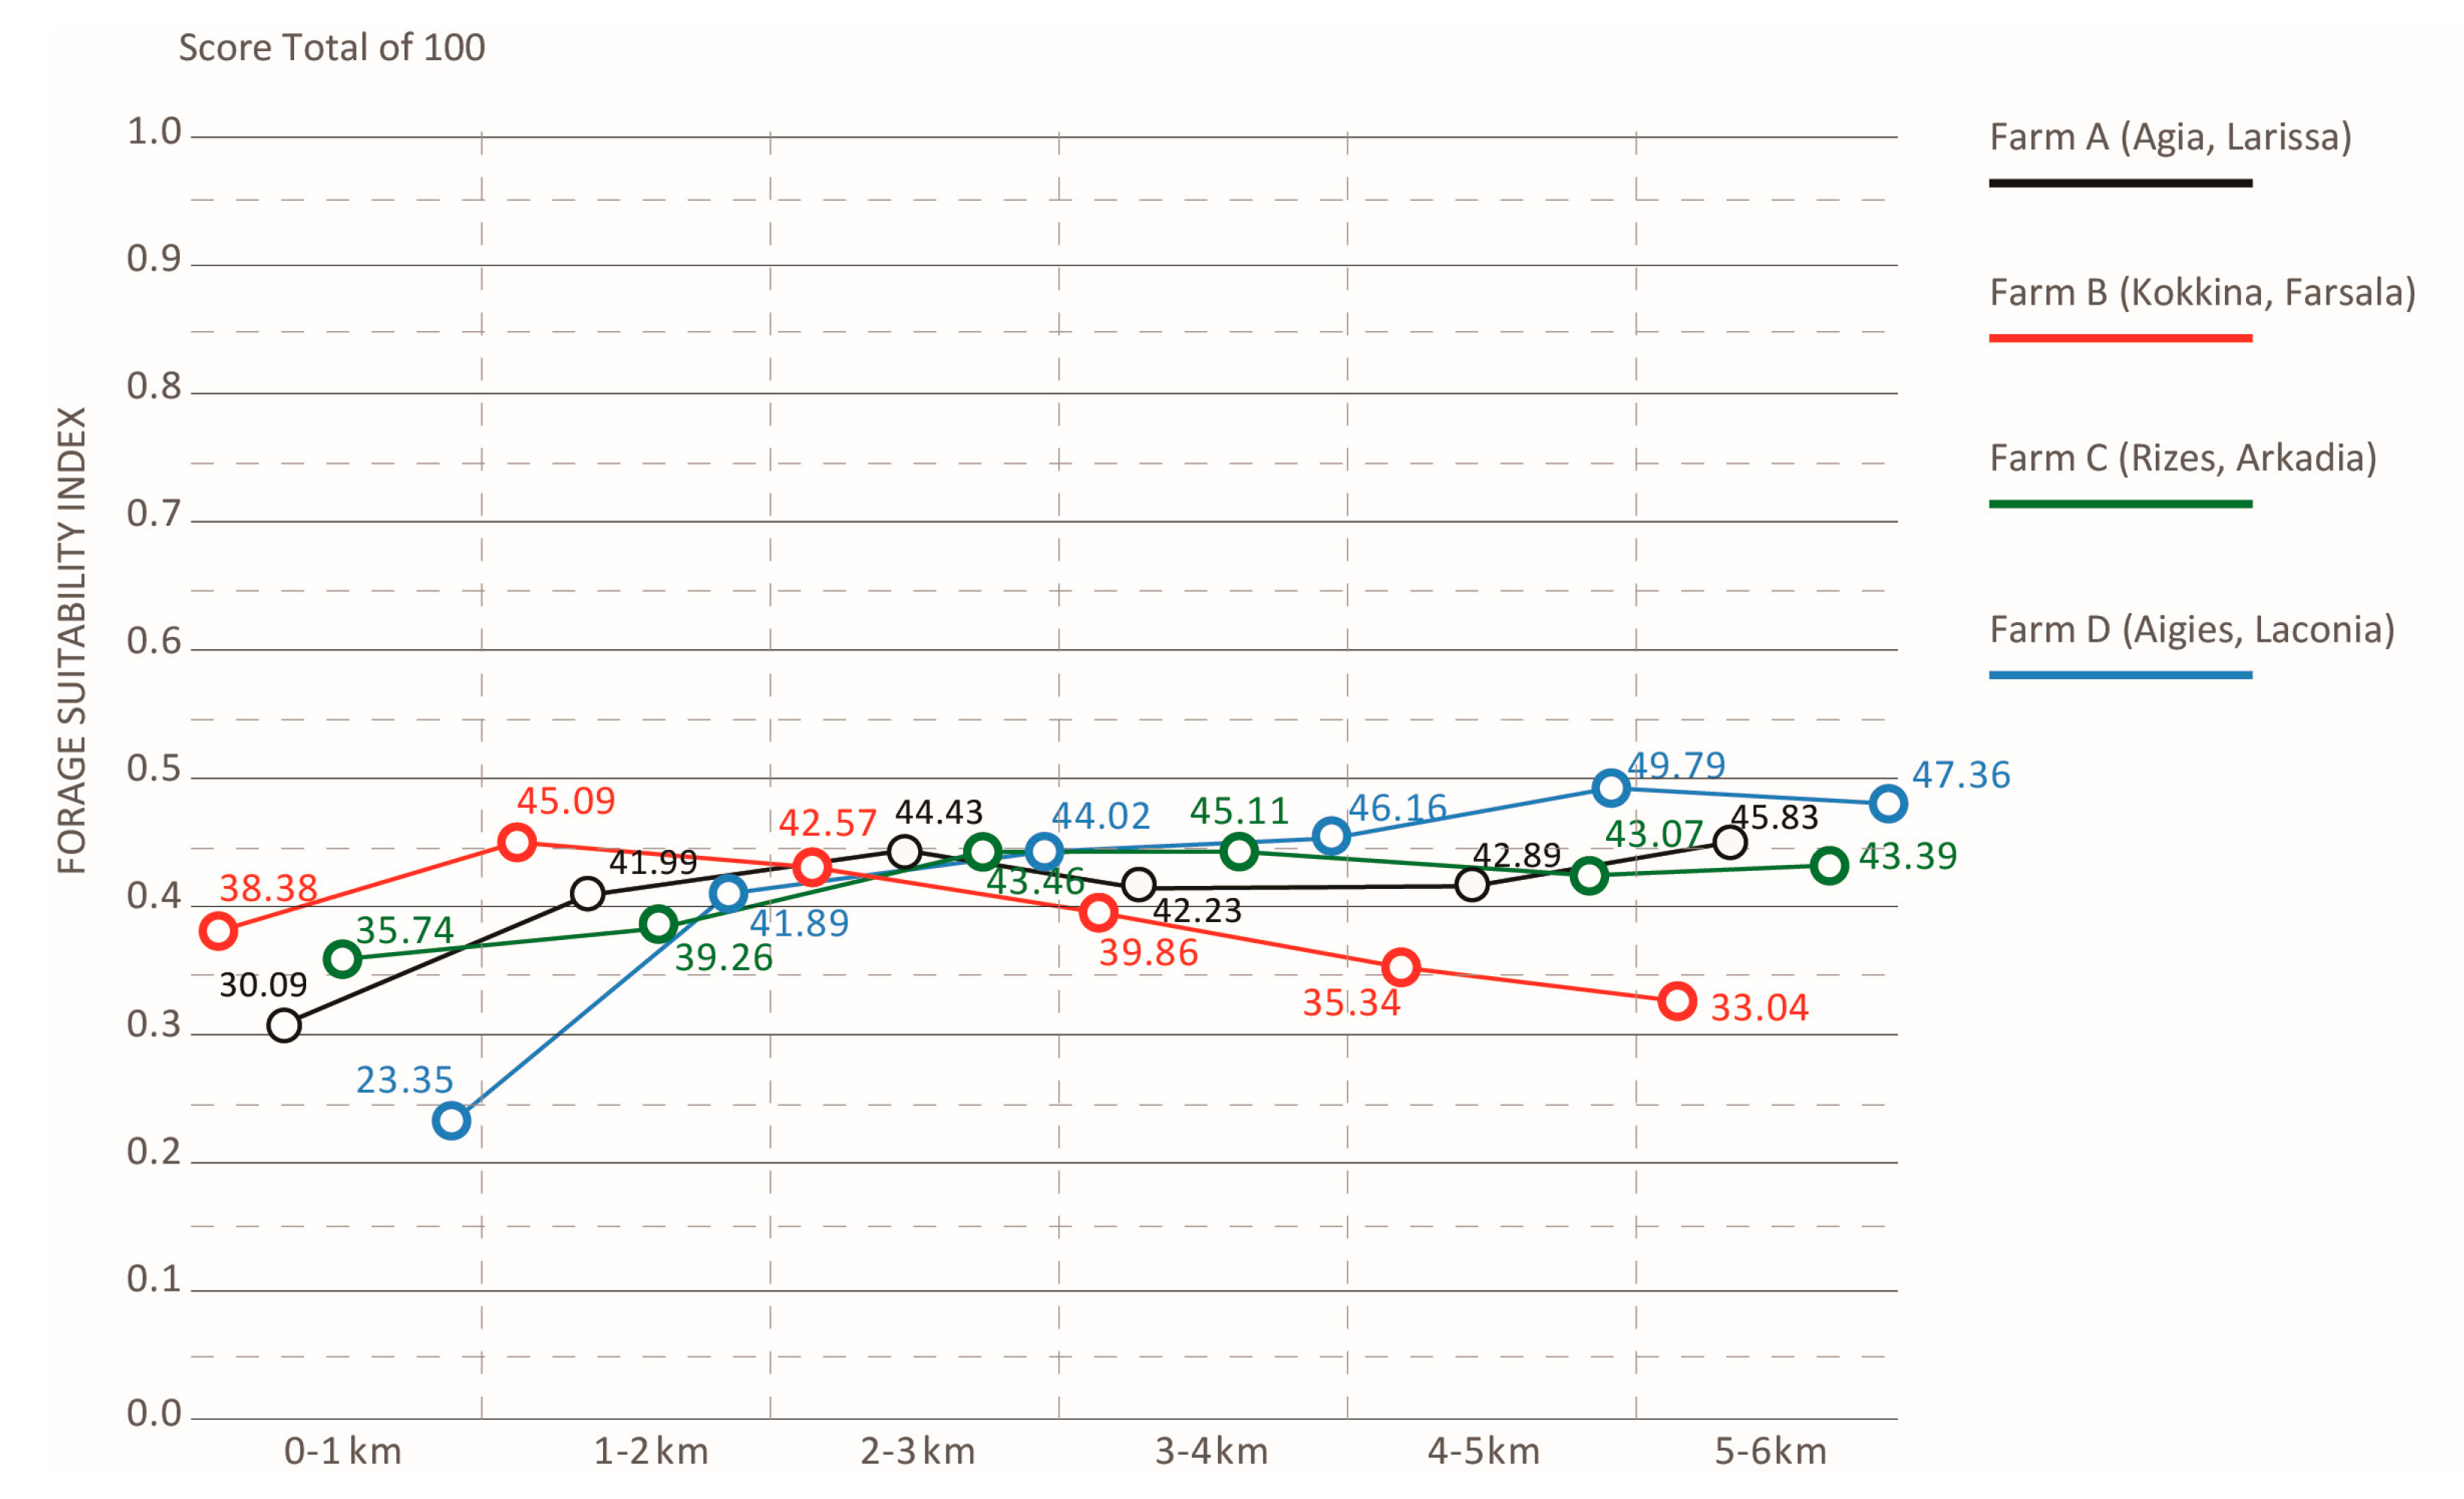
  • Indexing foraging suitability and associating it with land cover classes from each farm helped us to understand the suitability of the context of each class for hovering pollinators. Within the range of up to 1 km from each farm, which that reaches the extent of foraging for native pollinators, farms A, B, and C seem to possess an adequate foraging profile variation from 0.3 to 0.38 as compared to farm D that has a moderate mean value of 0.23. For all study farms, the mean value of foraging suitability within the flight range of managed bees (0–6 km) ranges in adequate levels from 0.39 for farm C to 0.42 for farm D (Chart 4).
  • By looking at the comparative change of land cover classes in farm A, the area remains highly agricultural. Almost 60% of the coverage within a 1 km distance from the farm is fruit trees and berry plantations. This cultivation diminishes significantly within 4–5 km from the farm. Mixed forest contributes to a quarter of the land coverage for a distance of up to 3 km from the farm and later changes to sclerophyllous scrub vegetation and transitional woodland-shrub communities, which are the dominant varieties at a 6 km distance from the farm, improving significantly the foraging conditions for the bees. In farm B, non-irrigated arable land almost doubles in coverage as we move away from the center, while sclerophyllous vegetation remains the most dominant community within and up to a 4 km distance from the farm. The land cover change in farm C revealed that almost 70% of the coverage within the first 1 km from the farm comprises complex cultivation patterns, such as viniculture and land principally occupied by agriculture, with significant areas of natural vegetation. However, natural grasslands and sclerophyllous vegetation gradually rise to half of the land coverage up to a 3 km distance and continue to dominate almost two-thirds of the area up to 6 km. Coniferous forest and transitional woodland-shrub areas comprise one-third of the land coverage within the first 2 km distance from the farm. Finally, in farm D, almost 70% of the coverage within the first 1 km from the farm comprises land principally occupied by olive grove agriculture. This land cover class diminishes to half of the coverage, gradually giving place to Sclerophyllous vegetation. However, field observations have shown that this land cover class has been seriously affected by recent wildfires.
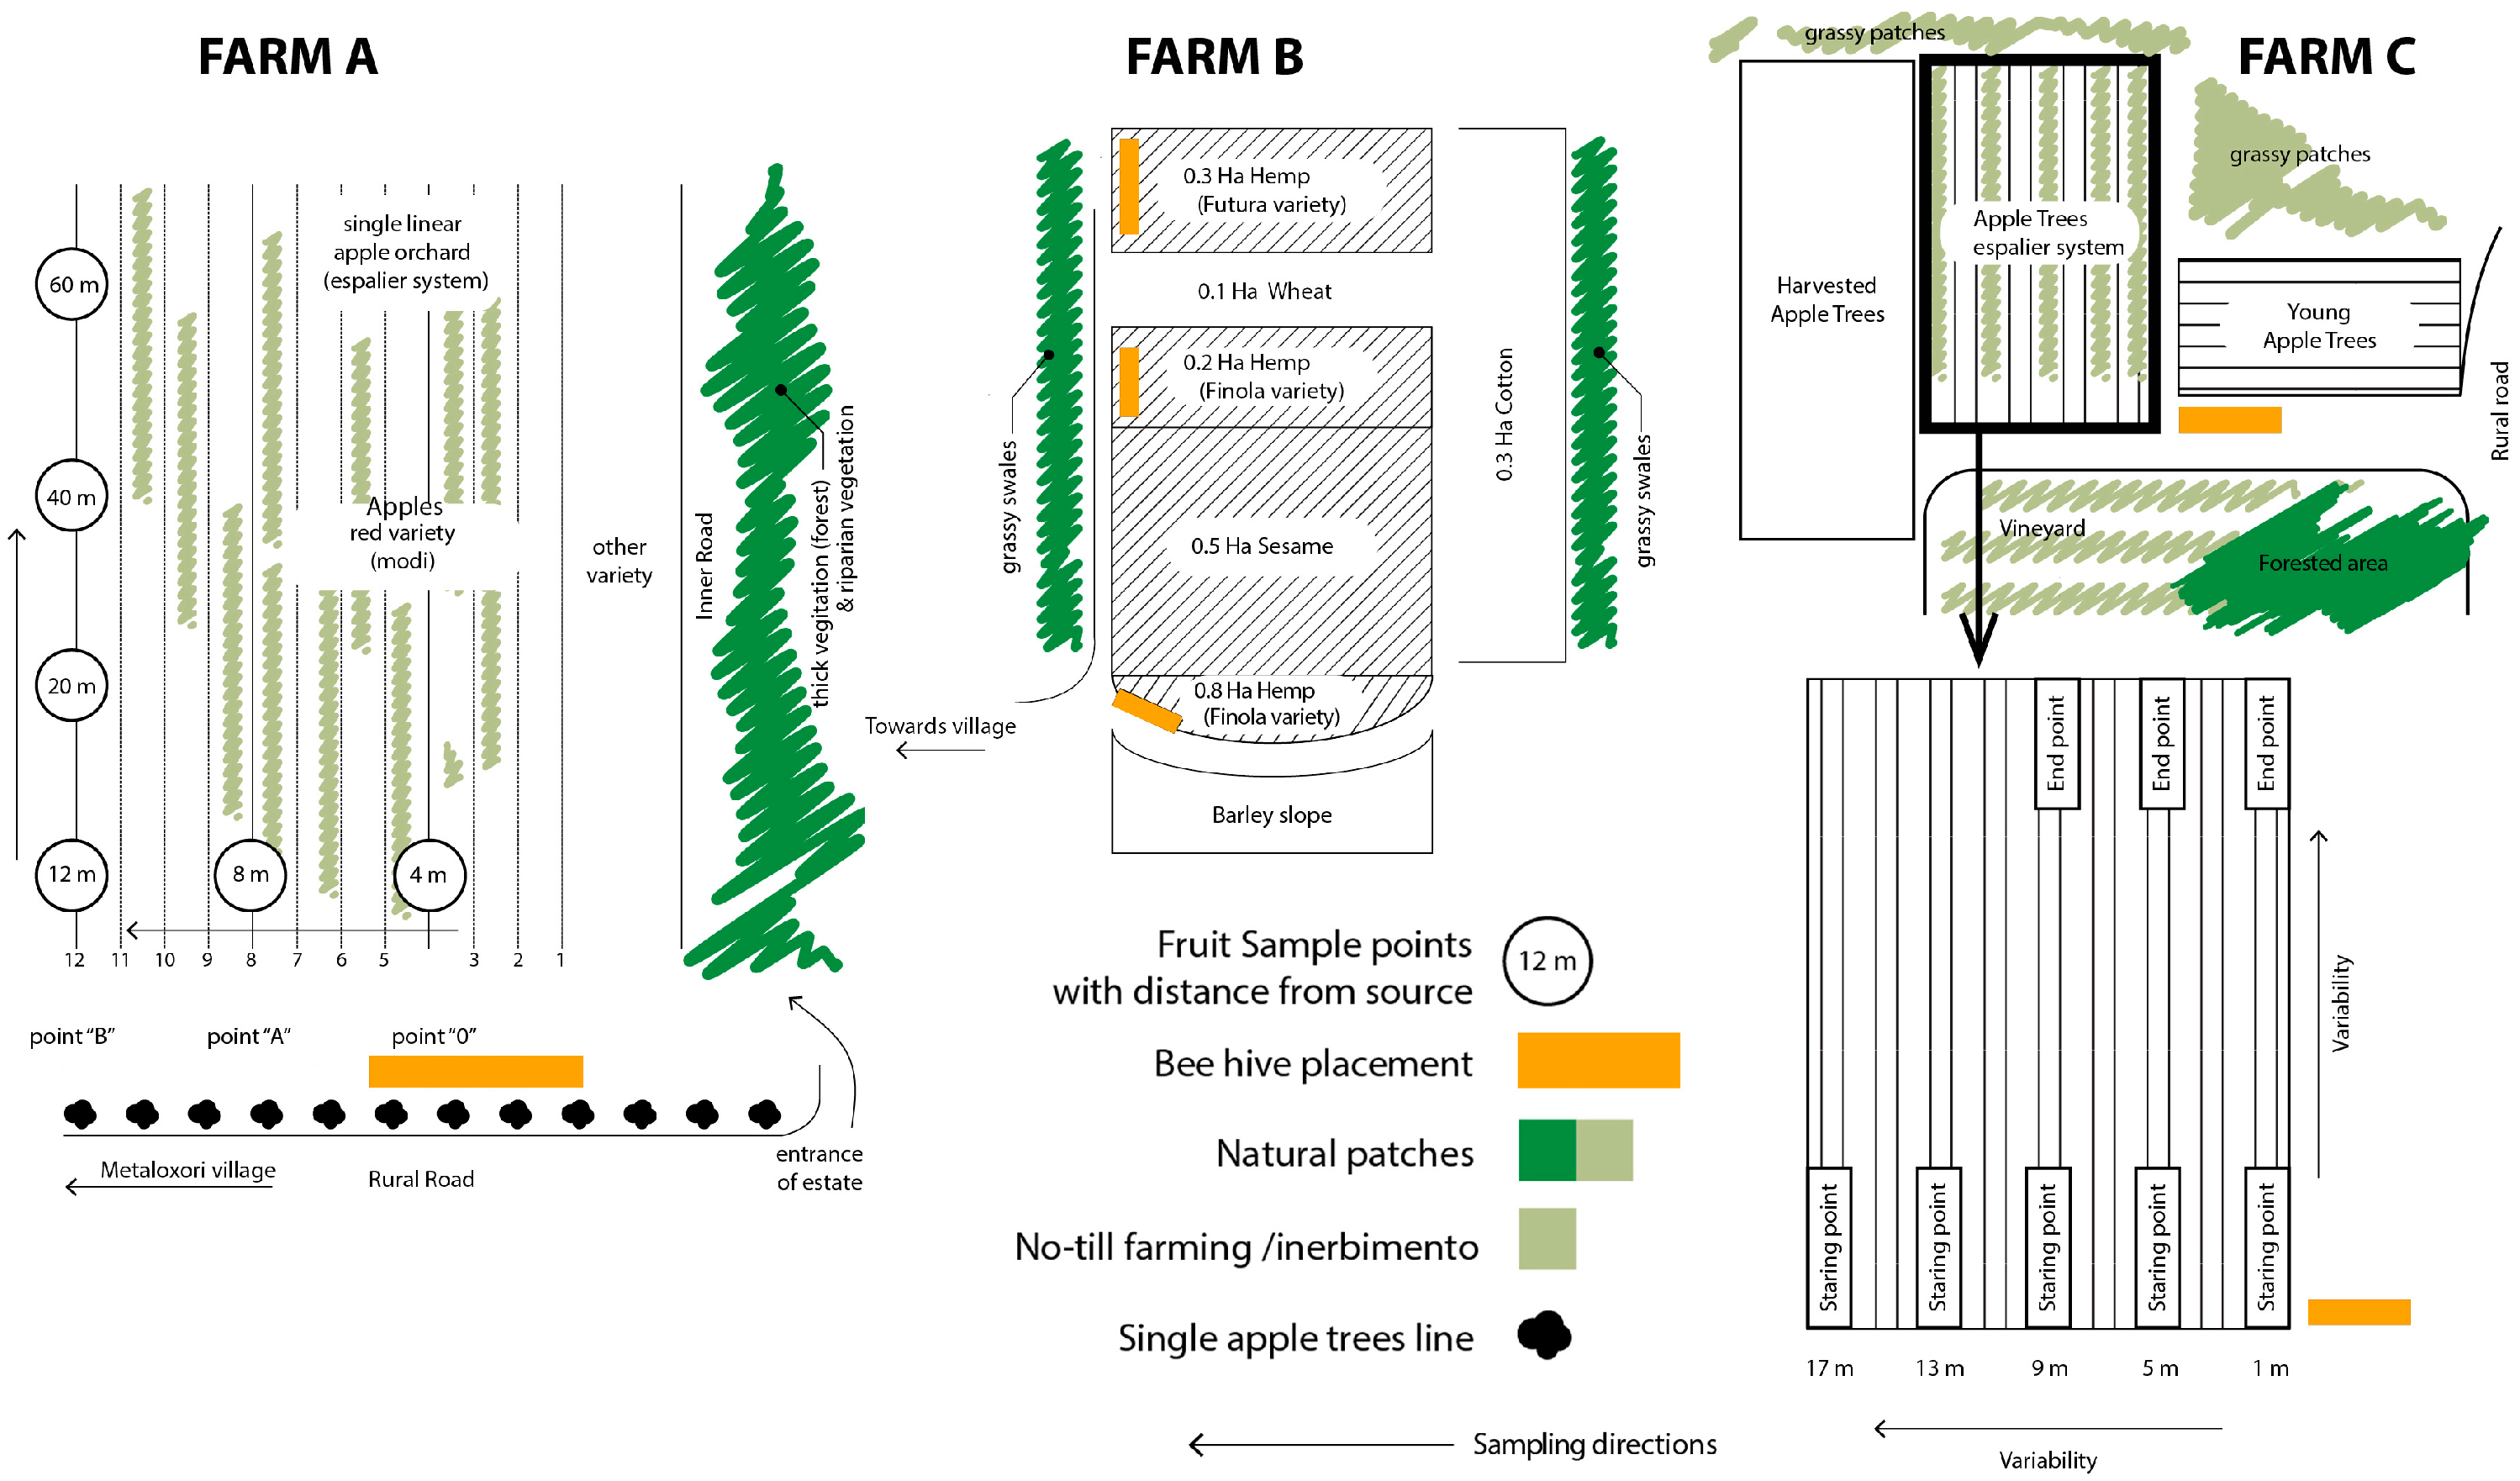
  • A pilot test implementing managed bees in the farms (Scheme 2) delivered the following observations: In farm A, the applied conservation scheme included conservation of shrub corridors between different farming plots (type B model) and grassy meadow strips between rows of espaliered apples and cherries (partial implementation of landscape model type A). Honeybees were placed near the apple orchard of the Modi variety. Measurements were performed in late August, before the harvest of the variety. The main sampling method estimated the mean diameter every 10 fruits at the beginning of the rows as a function of the distance from the hives (at 5–15 and 29 m and so on). We observed an almost negative correlation: fruits appear larger when further away from the hive than when closer to it. However, this difference was not statistically significant (<5%); see Table 2.
  • In farm B, no landscape model actions were followed. The installation of beehives in hemp plots presented a negative impact on hemp cultivation, as bees visited mail cannabis flowers to forage pollen and showed a preference for grazing on sesame cultivated in proximity to the hemp fields. Sesame proved to be an antagonist to hemp, as it has large white inflorescences and a longer flowering period than hemp. In farm C, type D and B landscape conservation models were partially applied. Measurements in the apple orchard indicated that there is a clear tendency for larger and heavier fruits the closer we are to the hives. A relatively small difference in the diameter of the fruit means a much larger increase in the total volume and therefore the weight of the fruit. So, the installation of bees gave from 8% (min.) to +12% (max.) larger fruits, corresponding to 32% (min. to 51% (max.) heavier fruits, making a significant impact on the production/harvest (yield) as shown in Table 3.
  • If these data are juxtaposed to the foraging suitability profile of each plot, then farm A and farm C with comparable crops and foraging suitability rankings delivered different results, not because of the landscape models in the inter-habitat matrix of the farm system, but because the treatment of the farmers in farm A varied to that in farm C. Owners in farm A declared the use of chemical plant growth regulators, an external parameter, that deprived bees of their ecological service operations. In farm B, it was evident that competitive crops in the surrounding areas make the symbiotic profile of bees and farmers more complicated.
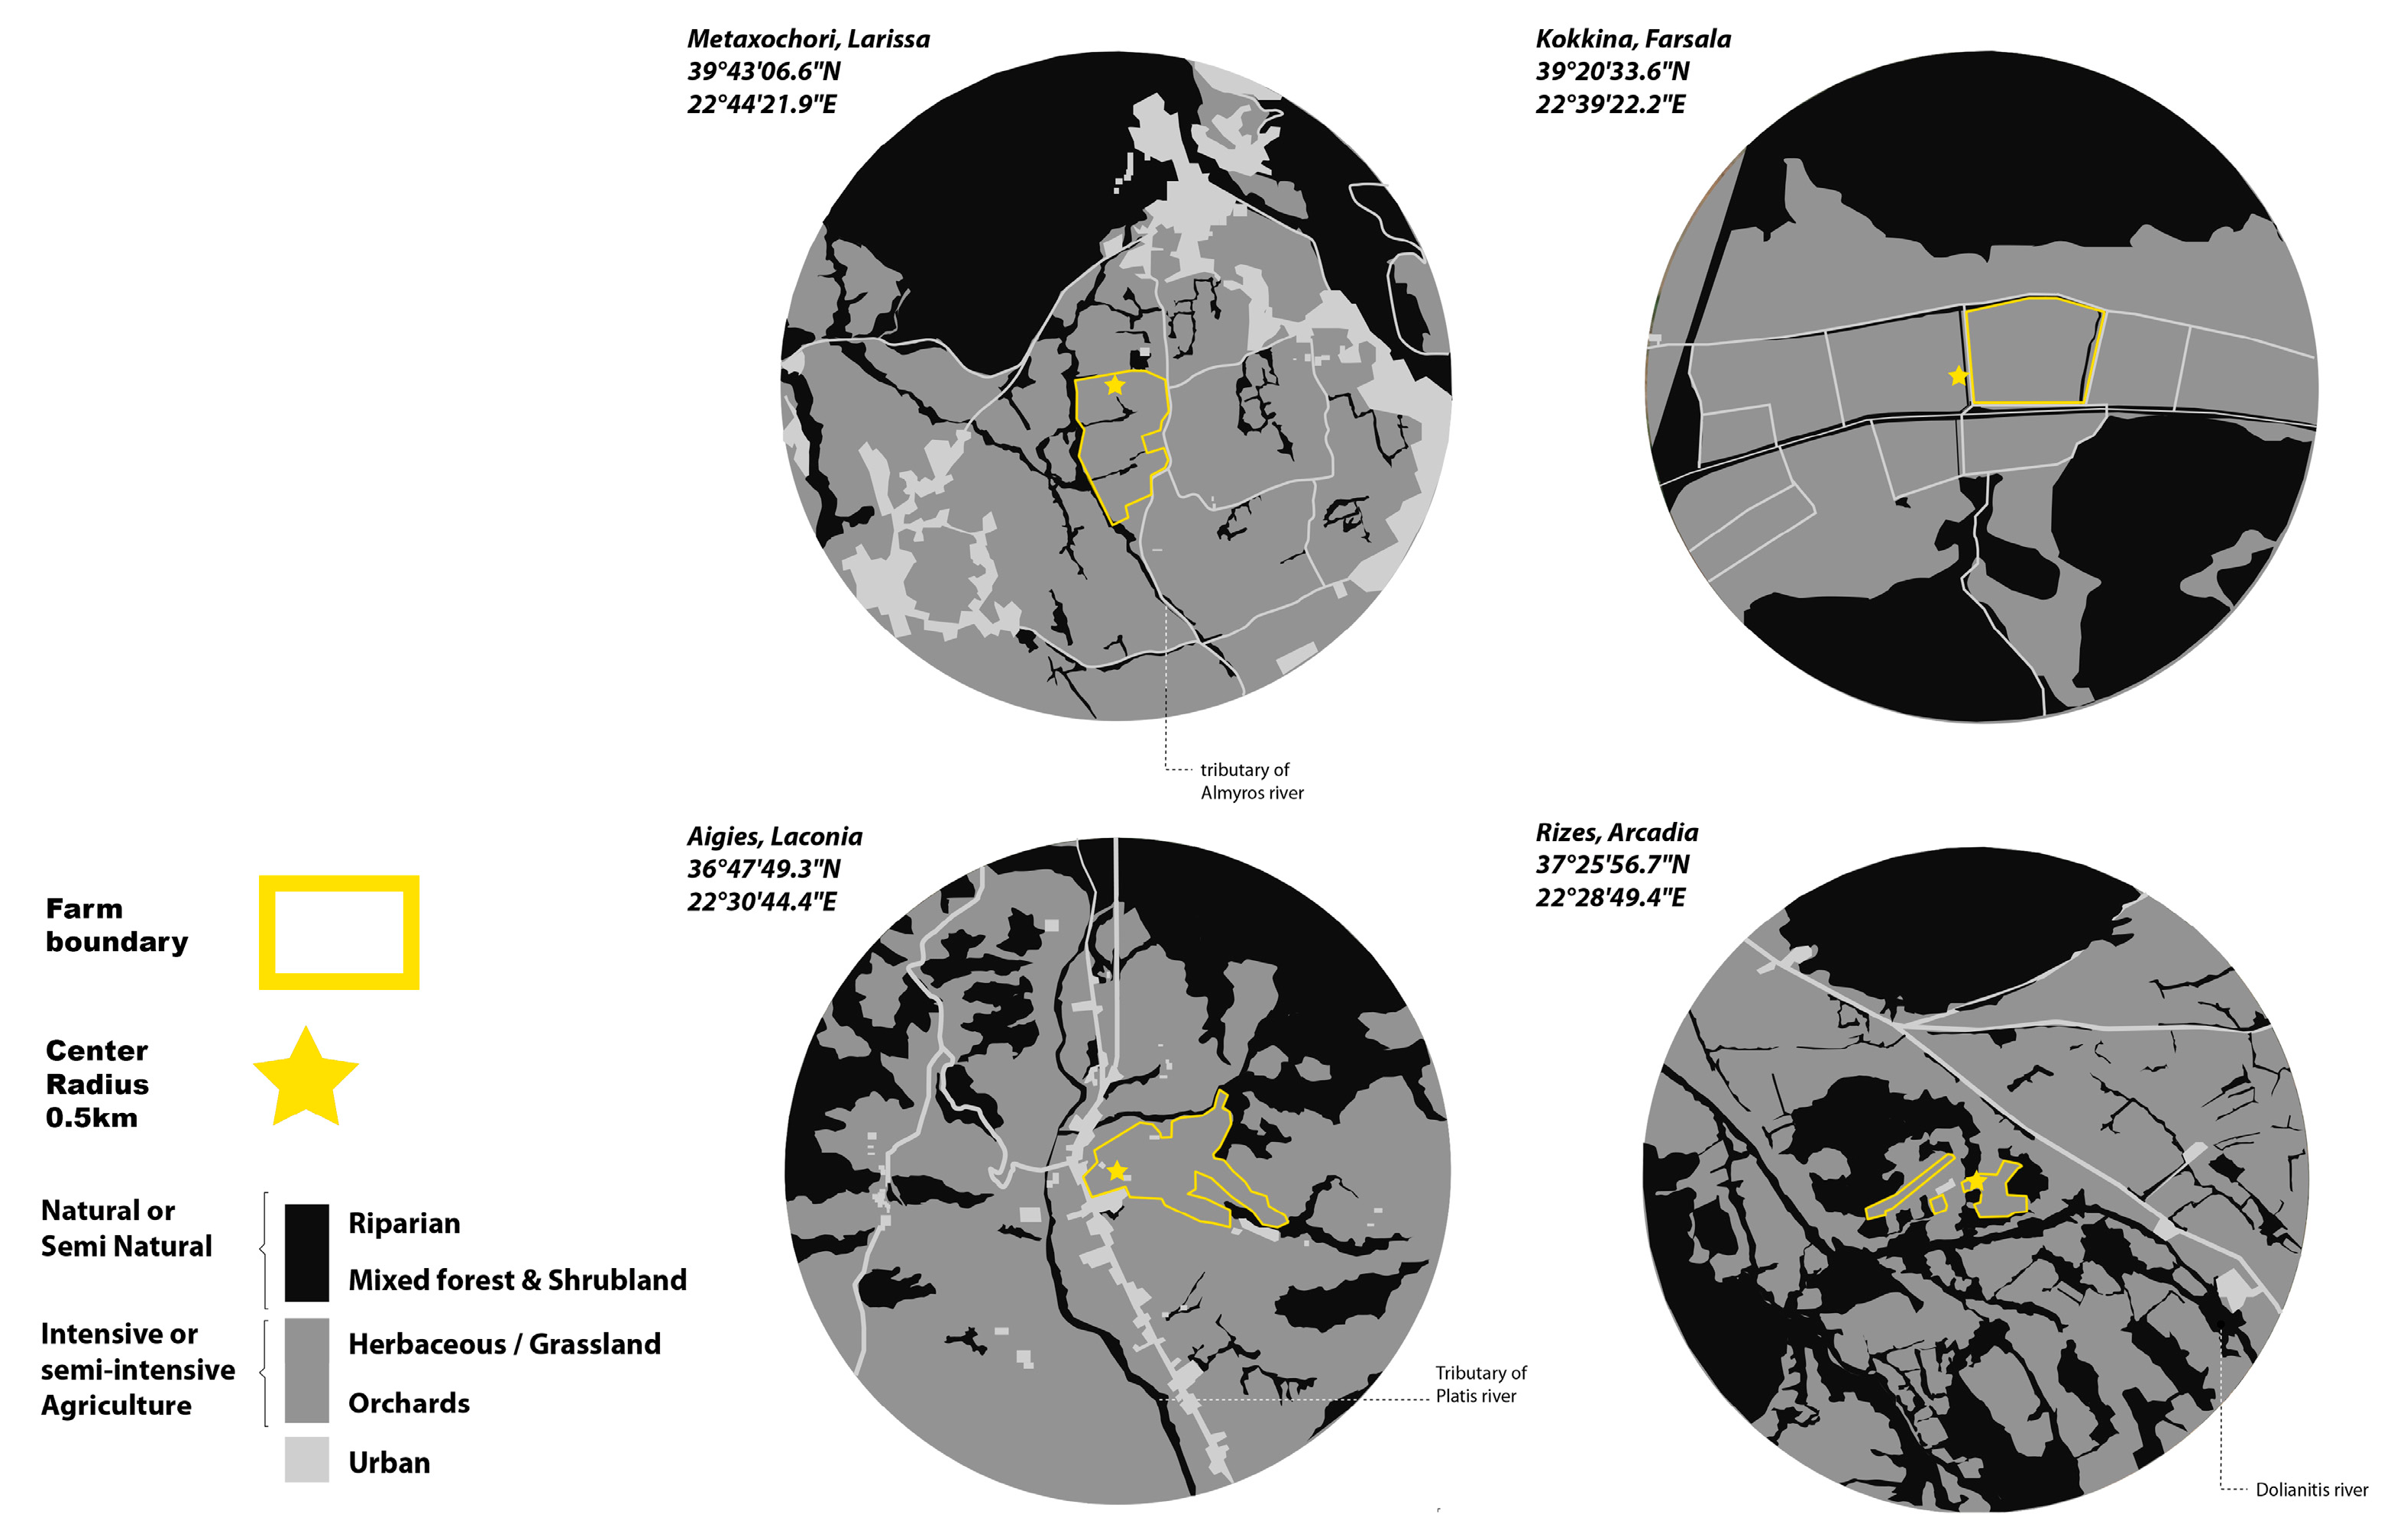
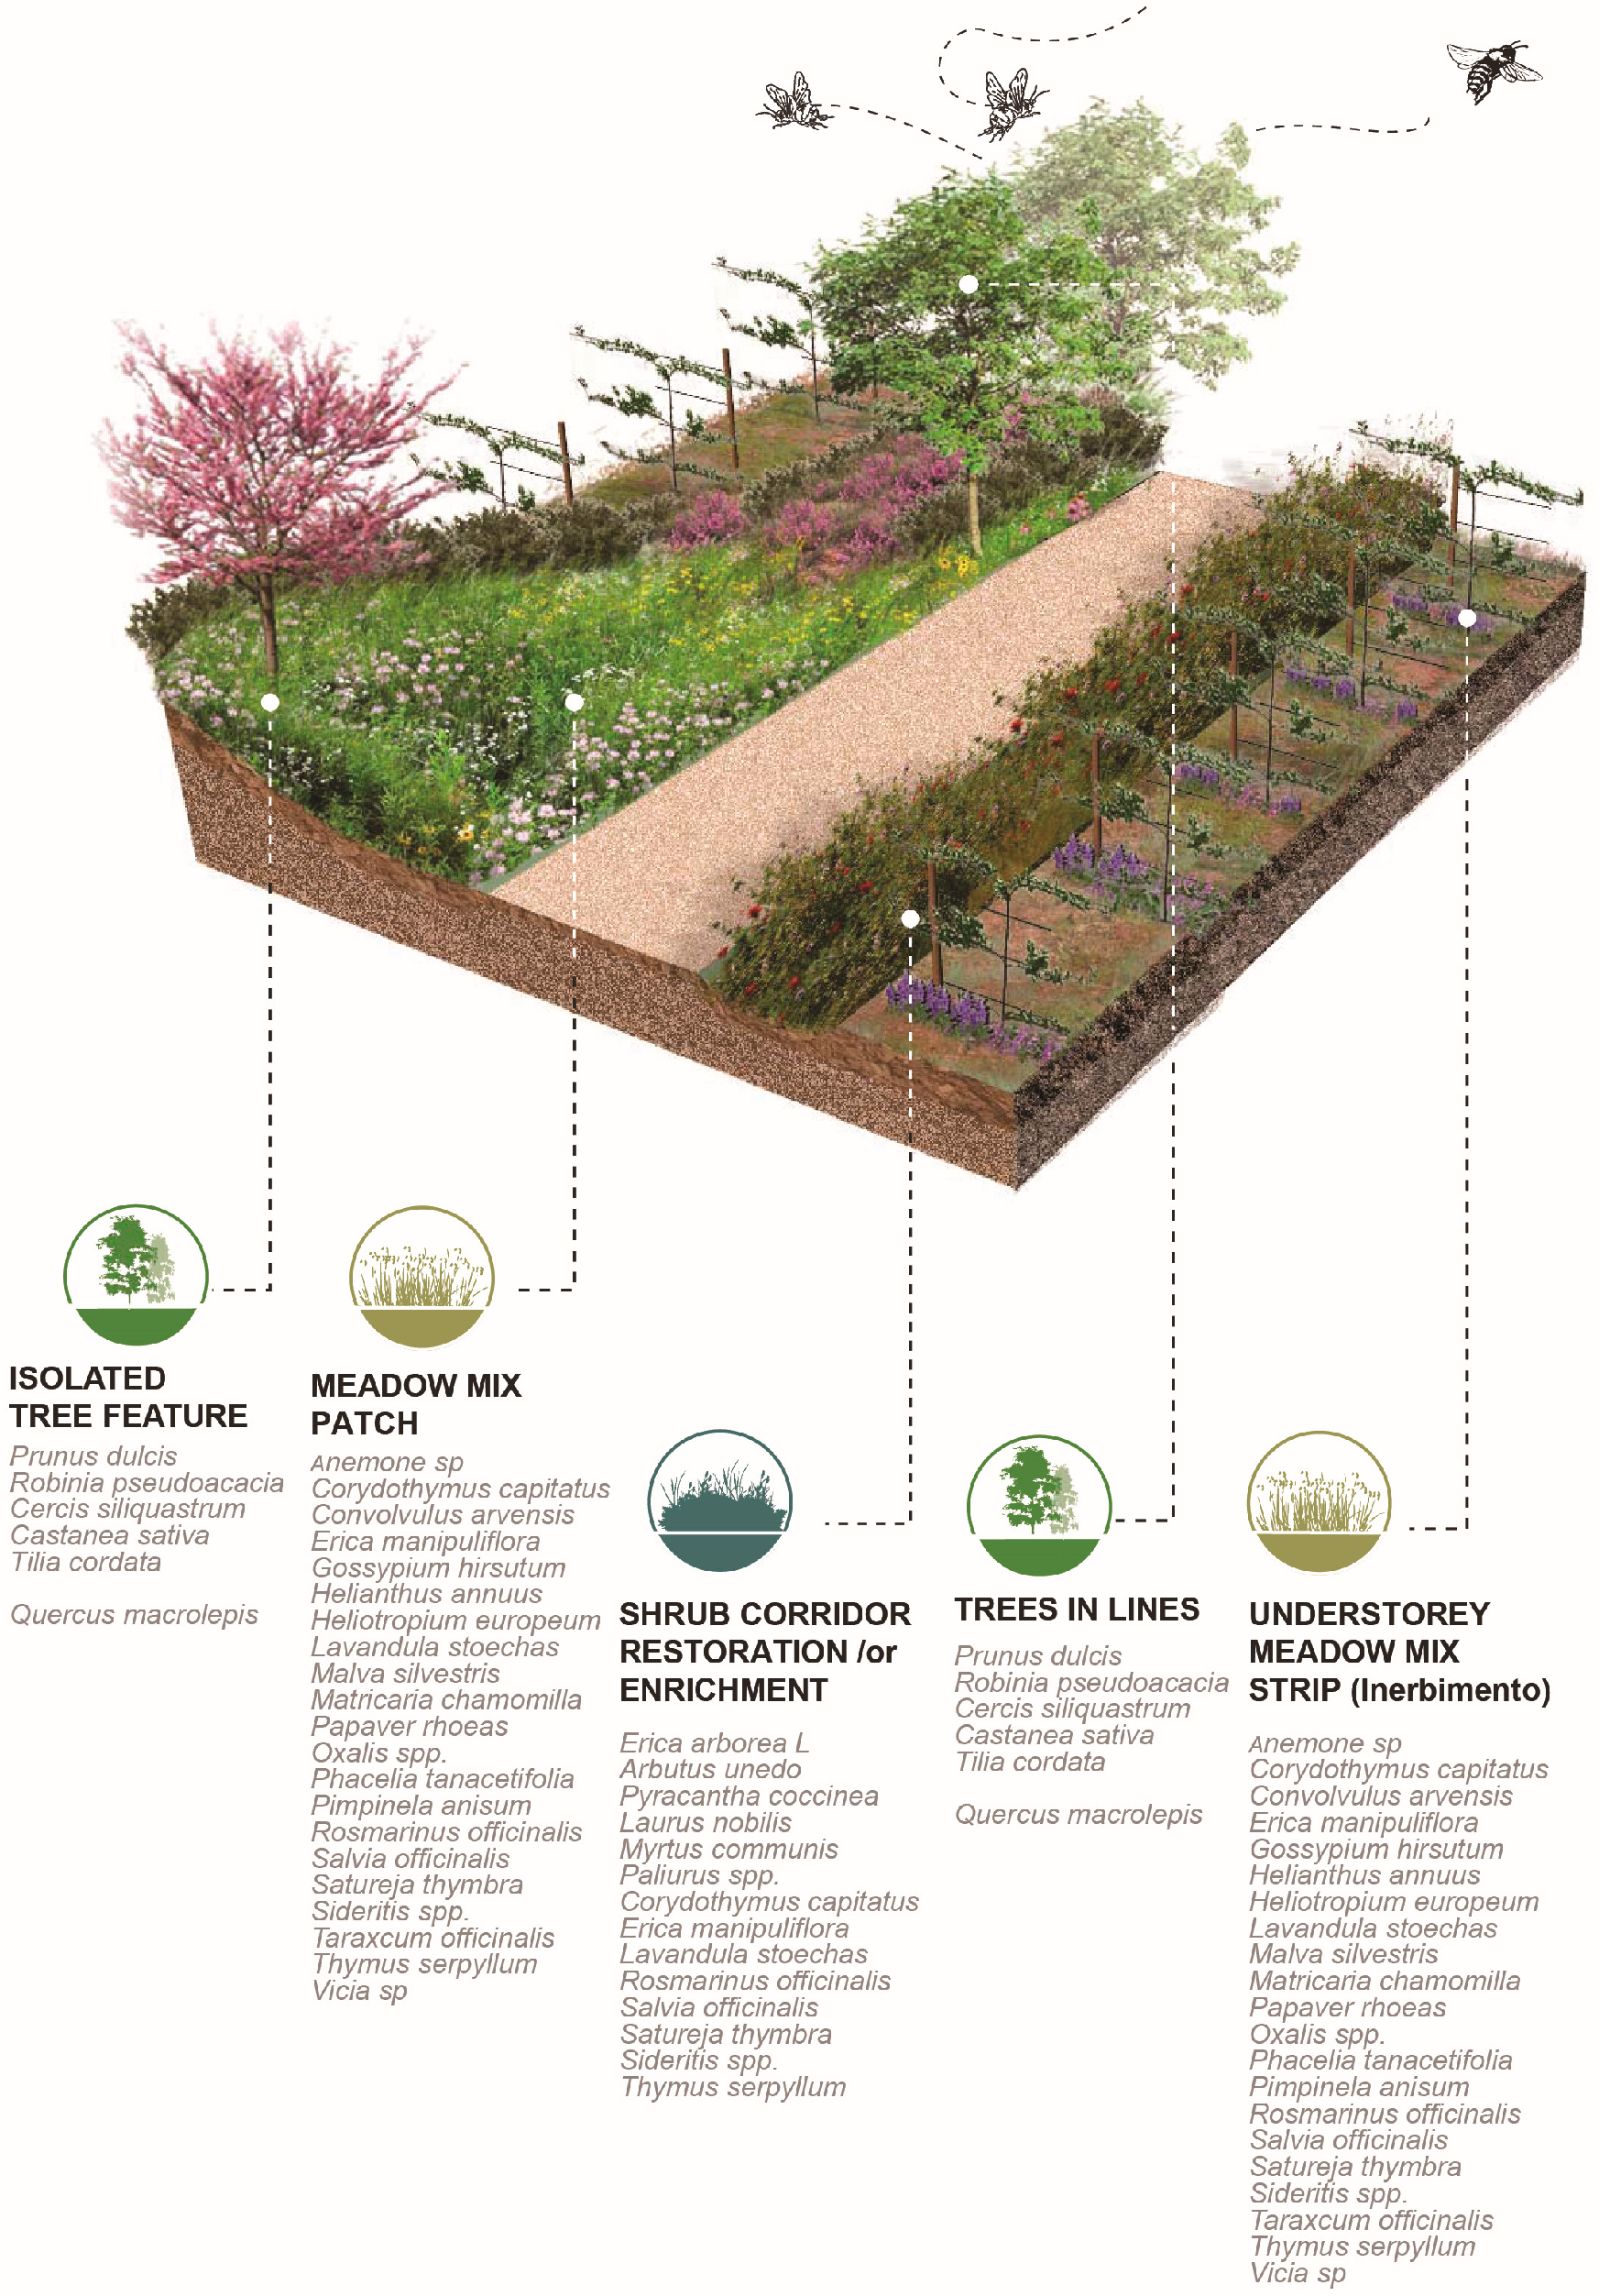
  • A cross-relational observation of the results acquired from the different tiers of analysis revealed that farm A would benefit from edge patches on the west side of the plot and the conservation of wild corridors between the terraces with the apples in espaliers. For farm B, large patchiness of orchards and croplands interrupts forested areas, necessitating the reconstruction of wild corridors running from north to south to interconnect naturally vegetated patches. In farm C, landscape configuration suggests that there are adequate corridors with good flow of energy and mass between habitats westward and south of the farm. Provisions for edge patches and minor corridor strips embedded with the espalier systems could further foster or regulate connectivity locally between different cultivated patches. In farm D, large patchiness of orchards and olive cultivations requires interspersion of forested patches at the edge of olive groves for the enrichment of deforested areas. Distinct meadow patches within the orchards will increase biodiversity and provide pools for pollen and nectar resources within citrus monocultures.

4. Discussion

This paper takes an initial look at landscape tools for enrichment of single-crop farms and builds its methodological frame on observations across multiple levels of the wider landscape context. The research was based on empirical preliminary data based on observations and measurements performed during one crop season. Expanding observations in different seasons, acquiring data regarding bee pollen, and comparing results over successive years are scheduled within our future endeavors as this would improve data validation and ensure the subsistence of bee colonies in single-crop farms throughout the year. The landscape design approach followed for the definition of management models coincides with studies that put emphasis on the evaluation of the larger context of each farm establishment [12,13]. We developed a synthetic approach for the symbiotic relation between farmers and apicultures that relied both on the macro-scale through the trends revealed from the foraging index and the micro-scale through the analysis of the landscape context of each farm. We expect this parallel outlook in macro- and micro-scale data to support further innovations in the sector of regenerative design. The landscape design tools presented here prove that regenerative agriculture needs to be dealt with as an operational and instrumental field by ecologists and landscape managers, as also suggested by other scholars [28]. The case studies presented, although limited in their validation of metric data, still offer an integrated and interdisciplinary approach that allows farm managers, researchers, and decision makers in conservation planning to anticipate and respond to wild-bee and managed-bee pollination patterns in the agricultural sector in ways that are specific to the local context [68].
The aim of this multifaceted analysis was to raise farmers’ and beekeepers’ awareness of the potential floral enhancement models of management that could be based on landscape configuration, land cover, and foraging suitability. We consider these parameters important indicators of the assessment and suitability of single-crop farms for beekeeping. Our study emphasized the importance of the spatial configuration of the broader farming context and showed how this affects species presence or incidence as well as the richness and composition of assemblages. Our synthesis of landscape models was based on observations that follow the line of studies that have shown the interrelations between the subdivision, aggregation, or clumping of patches, extensive edges, connectivity of elongated networked physical features, and their influence on the distribution and persistence of species [34,79,97,98]. The use of landscape configuration and foraging suitability as tools for the management of the landscape for habitat richness and conservation in proximity to farms not only has a significance for pollinator-based crops but also can further inform the design directions for enhanced biodiversity patches and enhanced edges [73]. The proposed plant enrichment models developed in interstitial zones and the identification and preservation of natural, unmanaged zones within farms are in line with researchers who have argued for management practices of agro-ecosystems with more semi-natural habitats and co-flowering plants in order to increase nesting opportunities and foraging abundance for diverse pollinators [37,42]. The emphasis we built upon enhanced connectivity opportunities with flowering strips, rich species hedgerows around arable fields, and conservation of small forest groves is associated with similar research proposals [29,42,95] that argue for the maintenance of the aimed ecological services performed between hovering pollinators and crops. The proposal of co-flowering plants alongside crop fields was developed so as to not only elongate the foraging seasonality and availability of pollen and nectar [99] of wild and managed bees alongside crops, increasing the habitat-carrying capacity of the larger landscape context [37], but also counterbalance resource availability adjacent to single-crop farms and outweigh the competition between wild pollinators and managed bees [69,70].
The landscape prototypes showed that diversification of pollen and nectar availability in proximity to the installed beehives can be based on the observations and structure of the natural, unmanaged zones and could regulate the extension and supply of foraging for pollinator species by providing access to plants with successive blooming. The embeddedness of patches, corridors, and edges is an important determinant of pollinator foraging capacity and also for the definition of the shape and form of these models. However, the landscape types developed are not definite. A multiplicity of systems may be configured according to the specificities of each farm and the spatio-geographical system they are based in. Yet, applying criteria and making observations that reflect the degree of patchiness and connectivity shed light on previously obscured natural entities, such as those interstitial natural zones that lie between or within farmed estates. These illustrative sets of actions inform prototypical examples that are valuable for the recognition and preservation of unmanaged areas and can inform an agenda of potential actions for non-technical audiences. The models introduce tools that contribute to a portfolio of actions that can be easily apprehensible, visualizing potential solutions that can be followed in order to combat direct and indirect drivers of biodiversity loss. The models not only delineate spatial linkages with fragments of natural assemblages that are regarded as “unmanaged sites” but also further introduce biologically rich plant structures that safeguard the abundance of biological resources for pollinators.
The aforementioned models make a strong case for a networked knowledge-building approach involving stakeholders, policymakers, landscape designers, agriculture scientists, and agricultural producers. Such transdisciplinary models reach different scientific insights, activities, and business models. They align with the goals of active policies, foster ecosystem services, and aim for enhanced productions with a significant ecological impact. The networking of farmers and beekeepers in the Greek context impacts apiculture since it retrofits new potential foraging grounds, minimizes traveling distances, builds social impact through the network effects it creates amongst different practitioners in the field, and strengthens these relationships in the relatively new approach of regenerative agriculture. We argue that the transition to sustainable farming management of single-crop farming should be based on transdisciplinary models. Design charettes and detailed modeling explorations such as the ones performed in this preliminary study inform a toolbox of actions for non-technical audiences and create opportunities for transdisciplinary networking between scientists, farmers, and other stakeholders.

5. Conclusions

The main goal of this article was to present regenerative landscape models as an alternative enhancement approach to single-crop farming, showing how these contribute to a symbiotic relationship with beekeeping, providing new meanings to the concept of sustainability in the sector. By looking at the larger landscape context of four farming estates, landscape ecology tools informed different landscape typologies to sustain or regenerate floral diversity in alignment with the characteristic ecological systems of the wider context. The models presented not only influence a sustainable outcome that benefits equally beekeepers and farmers by enhancing pollination services but can also be retrofitted in managerial planning schemes in the agricultural sectors since it has the following impacts:
(i)
Beekeepers can acquire new locations for the placement of their hives, with the possibility of bees to forage and nest in low-competition areas [71], exploiting less pristine natural areas on which wild pollinators depend.
(ii)
Farmers can enjoy enhanced yield from the presence of managed bees.
(iii)
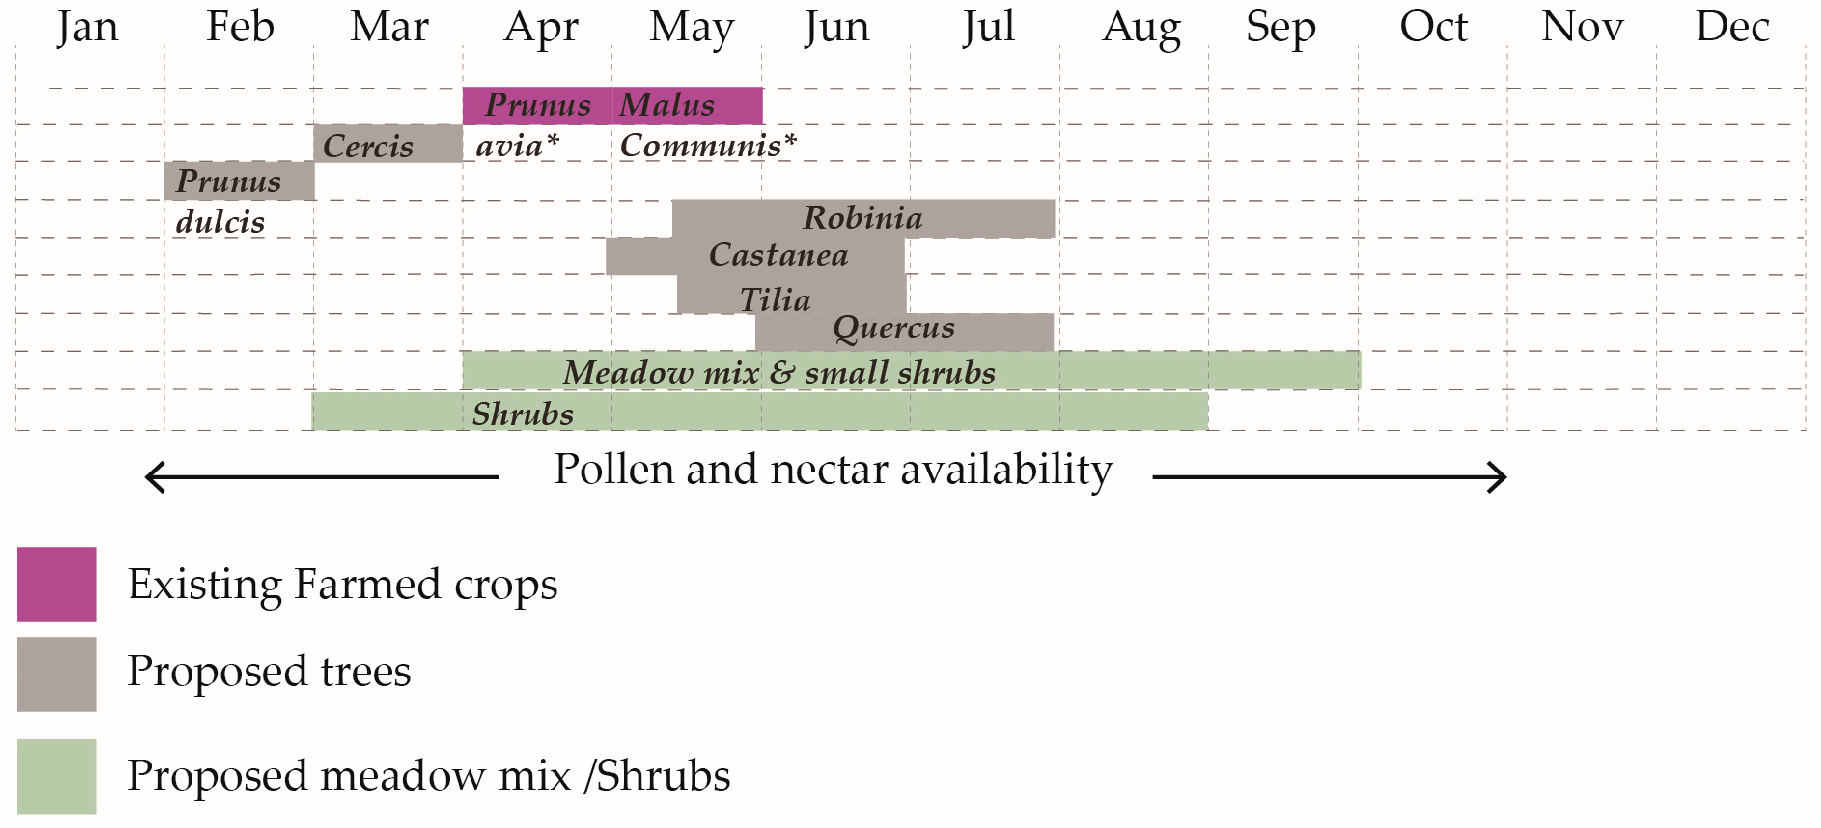
Landscape models through a balanced approach of introduced floral patches and reserved semi-natural corridors and patches can offer extended resources of pollen and nectar, assuming the possibility to have winter hives in one location instead of constantly moving hives in different blossoming regions. This contributes to a circular model of agriculture, closing nutrient loops for bees, thus reducing dependencies on external inputs [8].
(iv)
Intensifying floral richness through design in a single-crop farm that hosts beehives can offer extended resources of pollen and nectar, minimizing the competition for resources amongst wild pollinators and honeybees.
(v)
The foraging index could be introduced in technological applications as a monitoring indicator of the larger foraging capacity of a specific hive, helping beekeepers assess the larger geographical context of an agricultural site and determine locations for establishment based on the bees’ dependence on nutrition parameters.

Author Contributions

Conceptualization, A.K. and I.C.; methodology, I.C. and M.D.; software, I.C.; validation, A.K., I.C. and M.D.; formal analysis, A.K., I.C. and M.D.; investigation, I.C. and M.D.; resources A.K. and I.C.; data curation, I.C.; writing—original draft preparation, I.C.; writing—review and editing, I.C. and A.K.; visualization, I.C.; supervision, A.K.; project administration, A.K.; funding acquisition, A.K. All authors have read and agreed to the published version of the manuscript.

Funding

This research would not have been possible without the funding, and operational support received from SYMBEEOSIS S.A.

Data Availability Statement

Not applicable.

Acknowledgments

We acknowledge the support given to this research by the Agricultural University of Athens and especially Antonios Mazarakis (AUA, Faculty of Crop Science), who helped in the pilot implementations; Lefteris Katsoulakos (Agronomist), for gathering preliminary material and conducting a literature review for flora species; and Nikos Katsikis (Architect and Urbanist), for providing land cover data.

Conflicts of Interest

The authors declare no conflict of interest.

References

  1. Etxegarai-Legarreta, O.; Sanchez-Famoso, V. The Role of Beekeeping in the Generation of Goods and Services: The Interrelation between Environmental, Socioeconomic, and Sociocultural Utilities. Agriculture 2022, 12, 551. [Google Scholar] [CrossRef]
  2. Patel, V.; Pauli, N.; Biggs, E.; Barbour, L.; Boruff, B. Why bees are critical for achieving sustainable development. Ambio 2021, 50, 49–59. [Google Scholar] [CrossRef] [PubMed]
  3. Newton, P.; Civita, N.; Frankel-Goldwater, L.; Bartel, K.; Johns, C. What Is Regenerative Agriculture? A Review of Scholar and Practitioner Definitions Based on Processes and Outcomes. Front. Sustain. Food Syst. 2020, 4, 577723. [Google Scholar] [CrossRef]
  4. Francis, C.; Harwood, R.; Parr, J. The potential for regenerative agriculture in the developing world. Am. J. Altern. Agric. 1986, 1, 65–74. [Google Scholar] [CrossRef]
  5. Bullock, J.M.; McCracken, M.E.; Bowes, J.M.; Chapman, R.E.; Graves, R.A.; Hinsley, A.S.; Hutchins, G.M.; Nowakowski, M.; Nicholls, D.J.E.; Oakley, S. Does agri-environmental management enhance biodiversity and multiple ecosystem services?: A farm-scale experiment. Agric. Ecosyst. Environ. 2021, 320, 107582. [Google Scholar] [CrossRef]
  6. Constantin, M.; Strat, G.; Deaconu, M.E.; Patarlageanu, S.R. Innovative Agri-food Value Chain Management through a Unique Urban Ecosystem. Manag. Res. Pract. 2021, 13, 5–22. Available online: https://mrp.ase.ro/no133/f1.pdf (accessed on 27 December 2022).
  7. Van der Sluijs, J.P.; Vaage, N.S. Pollinators and Global Food Security: The Need for Holistic. Food Ethics 2016, 1, 75–91. [Google Scholar] [CrossRef]
  8. Rauw, W.M.; Gomez-Raya, L.; Star, L.; Overland, M.; Delezie, E.; Grivins, M.; Hamann, K.T.; Pietropaoli, M.; Klaassen, M.T.; Klemetsdal, G.; et al. Sustainable development in circular agriculture: An illustrative bee↺legume↺poultry example. Sustain. Dev. 2022. [Google Scholar] [CrossRef]
  9. UN General Assembly. Transforming Our World: The 2030 Agenda for Sustainable Development; 2015, A/RES/70/1. Available online: https://www.refworld.org/docid/57b6e3e44.html (accessed on 17 January 2023).
  10. European Commission, Directorate-General for Environment. The EU Pollinator’s Initiative; Publications Office: Luxembourg, 2019. Available online: https://op.europa.eu/en/publication-detail/-/publication/8e6e7bf0-7d03-11e9-9f05-01aa75ed71a1 (accessed on 17 January 2023).
  11. European Commission, Directorate-General for Communication. European Green Deal: Delivering on Our Targets; Publications Office of the European Union: Luxembourg, 2021; Available online: https://data.europa.eu/doi/10.2775/373022 (accessed on 17 January 2023).
  12. Muir, C. Re-Designing Farming. Foreground 2021. Available online: https://www.foreground.com.au/agriculture-environment/re-designing-farming/ (accessed on 17 January 2023).
  13. Lowicki, D.; Fagiewicz, K. A new model of pollination services potential using a landscape approach: A case study of post-mining area in Poland. Ecosyst. Serv. 2021, 52, 101370. [Google Scholar] [CrossRef]
  14. Albrecht, M.; Knecth, A.; Riesen, M.; Rutz, T.; Ganser, D. Time since establishment drives bee and hoverfly diversity, abundance of crop-pollinating bees and aphidophagous hoverflies in perennial wildflower. Basic Appl. Ecol. 2021, 57, 102–114. [Google Scholar] [CrossRef]
  15. Altieri, M.A. Agroecology: A new research and development paradigm for world agriculture. Agric. Ecosyst. Environ. 1989, 27, 37–46. [Google Scholar] [CrossRef] [Green Version]
  16. Gomez-Martinez, C.; Gonzalez-Estévez, M.A.; Cursach, J.; Lazaro, A. Pollinator richness, pollination networks, and diet adjustment along local and landscape gradients of resource diversity. Ecol. Appl. 2022, 32, e2634. [Google Scholar] [CrossRef] [PubMed]
  17. Beyer, N.; Gabriel, D.; Westphal, C. Landscape composition modifies pollinator densities, foraging behavior and yield formation in faba beans. Basic Appl. Ecol. 2022, 61, 30–40. [Google Scholar] [CrossRef]
  18. Ekroos, J.; Jakobsson, A.; Wideen, J.; Herbertsson, L.; Rundlöf, M.; Smith, H.G. Effects of landscape composition and configuration on pollination in a native herb: A field experiment. Oecologia 2015, 179, 509–518. [Google Scholar] [CrossRef]
  19. Banaszak-Cibicka, W.; Ratyńska, H.; Dylewski, Ł. Features of urban green space favourable for large and diverse bee populations (Hymenoptera: Apoidea: Apiformes). Urban For. Urban Green. 2016, 20, 448–452. [Google Scholar] [CrossRef]
  20. Betts, M.G.; Hadley, A.; Kormann, U. The landscape ecology of pollination. Landsc. Ecol. 2019, 34, 961–966. [Google Scholar] [CrossRef]
  21. Kougioumoutzis, K.; Kaloveloni, A.; Petanidou, T. Assessing Climate Change Impacts on Island Bees: The Aegean Archipelago. Biology 2022, 11, 552. [Google Scholar] [CrossRef]
  22. Ke, Q.; Chen, S.; Zhao, D.; Li, M.; Su, C. Effects of Land-Use Change on the Pollination Services for Litchi and Longan Orchards: A Case Study of Huizhou, China. Land 2022, 11, 1073. [Google Scholar] [CrossRef]
  23. De Palma, A.; Abrahamczyk, S.; Aizen, M.A.; Albrecht, M.; Basset, Y.; Bates, A.; Blake, R.J.; Boutin, C.; Bugter, R.; Connop, S.; et al. Predicting bee community responses to land-use changes: Effects of geographic and taxonomic biases. Sci Rep. 2016, 6, 31153. [Google Scholar] [CrossRef]
  24. Samuelson, A.E.; Leadbeater, E. A land classification protocol for pollinator ecology research: An urbanization case study. Ecol Evol. 2018, 8, 5598–5610. [Google Scholar] [CrossRef]
  25. Hellerstein, D.; Hitaj, C.; Smith, D.; Davis, A. Land Use, Land Cover, and Pollinator Health: A Review and Trend Analysis. In United States Department of Agriculture, Economic Research Service; Report no 232; U.S. Department of Agriculture, Economic Research Service: Washington, DC, USA, 2017. Available online: https://www.researchgate.net/publication/319130660_Land_Use_Land_Cover_and_Pollinator_Health_A_Review_and_Trend_Analysis (accessed on 27 December 2022).
  26. Nicholls, C.I.; Altieri, M.A. Agro-ecological approaches to enhance resilience. Farming Matters 2012, 14–17. Available online: https://archive.foodfirst.org/wp-content/uploads/2016/02/Farming-Matters-28-2-Agroecological-approaches-to-enhance-resilience.pdf (accessed on 27 December 2022).
  27. Holland, J.M.; Smith, B.M.; Storkey, J.; Lutman, P.J.W.; Aebischer, N.J. Managing habitats on English farmland for insect pollinator conservation. Biol. Conserv. 2015, 182, 215–222. [Google Scholar] [CrossRef]
  28. O’Donoghue, T.; Minasny, B.; Mc Bratney, A. Regenerative Agriculture and Its Potential to Improve Farmscape Function. Sustainability 2022, 14, 5815. [Google Scholar] [CrossRef]
  29. Tylianakis, J.M.; Klein, A.M.; Tscharntke, T. Spatiotemporal variation in the diversity of hymenoptera across a tropical habitat gradient. Ecology 2005, 86, 3296–3302. [Google Scholar] [CrossRef]
  30. Marnasidis, S.; Kantartzis, A.; Malesios, C.; Hatjina, F.; Arabatzis, G.; Verikouki, E. Mapping Priority Areas for Apiculture Development with the Use of Geographical Information Systems. Agriculture 2021, 11, 182. [Google Scholar] [CrossRef]
  31. Cole, L.J.; Kleijn, D.; Dicks, L.V.; Stout, J.C.; Potts, S.G.; Albrecht, M.; Balzan, M.V.; Bartomeus, I.; Bebeli, P.J.; Bevk, D.; et al. A critical analysis of the potential for EU Common Agricultural Policy measures to support wild pollinators on farmland. J. Appl. Ecol. 2020, 57, 681–694. [Google Scholar] [CrossRef] [PubMed]
  32. Ibarra, I. Permaculture, regeneration and AAFMs discussion shift. In Proceedings of the XXVII European Society for Rural Sociology Congress, Krakow, Poland, 24–27 July 2017. [Google Scholar]
  33. Ngugi, R.K.; Nyariki, D.M. Rural livelihoods in the arid and semi-arid environments of Kenya: Sustainable alternatives and challenges. Agric. Hum. 2005, 22, 65–71. [Google Scholar] [CrossRef]
  34. López-Pintor, A.; Sanz-Cañada, J.; Salas, E.; Rescia, A.J. Assessment of Agri-Environmental Externalities in Spanish Socio-Ecological Landscapes of Olive Groves. Sustainability 2018, 10, 2640. [Google Scholar] [CrossRef]
  35. Kevan, P.G.; Phillips, T.P. The economic impacts of pollinator declines: An approach to assessing the consequences. Conserv. Ecol. 2001, 5, 8. Available online: http://www.consecol.org/vol5/iss1/art8/ (accessed on 27 December 2022). [CrossRef]
  36. Hanley, N.; Breeze, D.T.; Ellis, C.; Goulson, D. Measuring the economic value of pollination services: Principles, evidence and knowledge gaps. Ecosyst. Serv. 2015, 14, 124–132. [Google Scholar] [CrossRef]
  37. Klein, A.-M.; Vaissière, B.E.; Cane, J.H.; Steffan-Dewenter, I.; Cunningham, S.A.; Kremen, C.; Tscharntke, T. Importance of pollinators in changing landscapes for world crops. Proc. R. Soc. B 2007, 274, 303–313. [Google Scholar] [CrossRef] [PubMed]
  38. Pollinator Partnership. Available online: http://pollinator.org (accessed on 27 December 2022).
  39. Ollerton, J.; Winfree, R.; Tarrant, S. How many flowering plants are pollinated by animals? Oikos 2011, 120, 321–326. [Google Scholar] [CrossRef]
  40. Rizzardo, R.; Milfont, M.; Da Silva, E.M.S.; Freitas, B.M. Apis mellifera pollination improves agronomic productivity of anemophilous castor bean (Ricinus communis). Ann. Braz. Acad. Sci. 2012, 84, 1137–1145. Available online: https://www.scielo.br/j/aabc/a/KZ7QXcsp6jpkkVgT8P4nzKv/?format=pdf&lang=en (accessed on 27 December 2022). [CrossRef] [PubMed]
  41. Lautenbach, S.; Seppelt, R.; Liebscher, J.; Dormann, C.F. Spatial and Temporal Trends of Global Pollination Benefit. PLoS ONE 2012, 7, e35954. [Google Scholar] [CrossRef] [PubMed]
  42. Gilpin, A.M.; O’Brien, C.; Kobel, C.; Brettell, L.E.; Cook, J.M.; Power, S.A. Co-flowering plants support diverse pollinator populations and facilitate pollinator visitation to sweet cherry crops. Basic Appl. Ecol. 2022, 63, 36–48. [Google Scholar] [CrossRef]
  43. Földesi, R.; Kovács-Hostyánszki, A.; Korosi, A.; Somay, L.; Elek, Z.; Marko, V.; Sarospataki, M.; Bakos, R.; Varga, A.; Nyisztor, K.; et al. Relationships between wild bees, hoverflies and pollination success in apple orchards with different landscape contexts. Agric. For. Entomol. 2015, 18, 68–75. [Google Scholar] [CrossRef]
  44. The Guardian, BEES are Worth Billions to Farmers across the Globe, Study Suggests, 2015. Available online: https://www.theguardian.com/environment/2015/jun/17/bees-are-worth-billions-tofarmers-across-the-globe-study-suggests (accessed on 27 December 2022).
  45. Winfree, R.; Griswold, T.; Kremen, C. Effect of Human Disturbance on Bee Communities in a Forested Ecosystem. Conserv. Biol. 2007, 21, 213–223. [Google Scholar] [CrossRef]
  46. Bernhardt, C.E.; Mitchell, R.J.; Michaels, H.J. Effects of Population Size and Density on Pollinator Visitation, Pollinator Behavior, and Pollen Tube Abundance in Lupinus Perennis. Int. J. Pla 2008, 169, 944–953. [Google Scholar] [CrossRef]
  47. Petanidou, T.; Kallimanis, A.S.; Lazarina, M.; Tscheulin, T.; Devalez, J.; Stefanaki, A.; Hanlidou, E.; Vujic, A.; Kaloveloni, A.; Sgardelis, S.P. Climate drives plant–pollinator interactions even along small-scale climate gradients: The case of the Aegean. Plant Biol. 2018, 20, 176–183. [Google Scholar] [CrossRef]
  48. Chaplin-Kramer, R.; Dombeck, E.; Gerber, J.; Gerber, J.; Knuth, K.A.; Mueller, N.D.; Mueller, M.; Ziv, G.; Klein, A.M. Global malnutrition overlaps with pollinator-dependent micronutrient production. Proc. R. Soc. B 2014, 281, 20141799. [Google Scholar] [CrossRef]
  49. Piri Sahragard, H.; Ajorlo, M.; Karami, P. Landscape structure and suitable habitat analysis for effective restoration planning in semi-arid mountain forests. Ecol. Process. 2021, 10, 17. [Google Scholar] [CrossRef]
  50. Allen-Wardell, G.; Bernhardt, P.; Bitner, R.; Burquez, A.; Buchmann, S.; Cane, J.; Cox, P.A.; Dalton, V.; Feinsinger, P.; Ingram, M.; et al. The potential consequences of pollinator declines on the conservation of biodiversity and stability of food crop yields. Conserv. Biol. 1998, 12, 8–17. [Google Scholar] [CrossRef] [Green Version]
  51. EFTEC. The Economic, Social and Ecological Value of Ecosystem Services: A Literature Review; Department for Environment, Food and Rural Affairs (DEFRA), Economics for the Environment Consultancy: London, UK, 2005. Available online: https://www.cbd.int/financial/values/unitedkingdom-valueliterature.pdf (accessed on 27 December 2022).
  52. Douglas, A. Landis, Designing agricultural landscapes for biodiversity-based ecosystem services. Basic Appl. Ecol. 2017, 18, 1–12. [Google Scholar] [CrossRef]
  53. Ballogh, A. The rise and fall of monoculture farming. Horizon 2021. Available online: https://ec.europa.eu/research-and-innovation/en/horizon-magazine/rise-and-fall-monoculture-farming (accessed on 27 December 2022).
  54. Honey Bee Health Coalition. Available online: https://honeybeehealthcoalition.org/program/bee-integrated-demonstration-project (accessed on 27 December 2022).
  55. Martinez-Núñez, C.; Manzaneda, A.J.; Isla, J.; Tarifa, R.; Calvo, G.; Molina, J.L.; Salido, T.; Ruiz, C.; Gutierrez, J.E.; Rey, P.J. Low-intensity management benefits solitary bees in olive groves. J. Appl. Ecol. 2020, 57, 111–120. [Google Scholar] [CrossRef]
  56. Olives Alive. Available online: https://olivaresvivos.com/en/ (accessed on 27 December 2022).
  57. Wezel, A.; Casagrande, M.; Celette, F.; Vian, J.-F.; Ferrer, A.; Peigné, J. Agroecological practices for sustainable agriculture. A review. Agron. Sustain. Dev. 2014, 34, 1–20. [Google Scholar] [CrossRef]
  58. Costantza, R.; D’Arge, R.; de Groot, R.; Farber, S.; Grasso, M.; Hannon, B.; Limburg, k.; Naeem, S.; O’ Neill, R.V.; Paruelo, J.; et al. The value of the world’s ecosystem services and natural capita. Nature 1997, 387, 253–260. [Google Scholar] [CrossRef]
  59. Herrera, C.M. Gradual replacement of wild bees by honeybees in flowers of the Mediterranean Basin over the last 50 years. Proc. R. Soc. B 2020, 287, 20192657. [Google Scholar] [CrossRef]
  60. Petanidou, T.; Lambor, E. A land for flowers and bees: Studying pollination ecology in Mediterranean communities. Plant Biosyst. 2005, 139, 279–294. [Google Scholar] [CrossRef]
  61. Hope, K. Honey: The Untapped Potential of a Greek Superfood, Economia 2022. Available online: https://www.economia.gr/en/honey-the-untapped-potential-of-a-greek-superfood/ (accessed on 27 December 2022).
  62. Makri, P.; Papanagiotou, P.; Papanagiotou, E. Efficiency And Economic Analysis Of Greek Beekeeping Farms. Bulg. J. Agric. Sci. 2015, 21, 479–484. Available online: https://www.agrojournal.org/21/03-02.pdf (accessed on 27 December 2022).
  63. Marchal, L.; Prager, A.; Villadiego, A. Beekeepers in Western Europe Fear for Their Future. Equal. Times 2022. Available online: https://www.equaltimes.org/beekeepers-in-western-europe-fear#.Y87lFD1Bypo (accessed on 27 December 2022).
  64. Panagos, P.; Ballabio, C.; Poesen, J.; Lugato, E.; Scarpa, S.; Montanarella, L.; Borrelli, P. A soil erosion indicator for supporting agricultural, environmental and climate policies in the European Union. Remote Sens. 2020, 12, 1365. [Google Scholar] [CrossRef]
  65. OECD. OECD Environmental Performance Reviews: Greece 2020; OECD Environmental Performance Reviews; OECD Publishing: Paris, France, 2020. [Google Scholar] [CrossRef]
  66. Gomiero, T. Soil Degradation, Land Scarcity and Food Security: Reviewing a Complex Challenge. Sustainability 2016, 8, 281. [Google Scholar] [CrossRef]
  67. Ferreira, C.S.S.; Seifollahi-Aghmiuni, S.; Destouni, G.; Ghajarnia, N.; Kalantari, Z. Soil degradation in the European Mediterranean region: Processes, status and consequences. Sci. Total Environ. 2022, 805, 150106. [Google Scholar] [CrossRef] [PubMed]
  68. Lister, N.; Brocki, M.; Ament, R. Integrated adaptive design for wildlife movement under climate change. Front. Ecol. Environ. 2015, 13, 493–502. [Google Scholar] [CrossRef] [PubMed]
  69. Lázaro, A.; Müller, A.; Ebmer, A.W.; Dathe, H.H.; Scheuchl, E.; Schwarz, M.; Risch, S.; Pauly, A.; Devalez, J.; Tscheulin, T.; et al. Impacts of beekeeping on wild bee diversity and pollination networks in the Aegean Archipelago. Ecography 2021, 44, 1353–1365. [Google Scholar] [CrossRef]
  70. Casanelles-Abella, J.; Fontana, S.; Fournier, B.; Frey, D.; Moretti, M. Low Resource Availability Drives Feeding Niche Partitioning between Wild Bees and Honeybees in a European City. Ecol. Appl. 2023, 33, e2727. [Google Scholar] [CrossRef]
  71. Henry, M.; Rodet, G. Controlling the impact of the managed honeybee on wild bees in protected areas. Sci. Rep. 2018, 8, 9308. [Google Scholar] [CrossRef]
  72. Cannon, D. Is Beekeeping Sustainable? The Australian Beekeper. 2014. Available online: http://www.theabk.com.au/articles/2016/8/3/is-beekeeping-sustainable (accessed on 27 December 2022).
  73. Nicholson, C.C.; Ward, K.L.; Williams, N.M.; Isaacs, R.; Mason, K.S.; Wilson, J.K.; Brokaw, J.; Gut, L.J.; Rothwell, N.L.; Wood, T.J.; et al. Mismatched outcomes for biodiversity and ecosystem services: Testing the responses of crop pollinators and wild bee biodiversity to habitat enhancement. Ecol. Lett. 2020, 23, 326–335. [Google Scholar] [CrossRef]
  74. Zeunert, J. Landscape Architecture and Environmental Sustainability, 1st ed.; Bloomsbury Publishing: London, UK, 2017; pp. 40–60. [Google Scholar]
  75. Klein, A.; Cunningham, S.A.; Bos, M.; Steffan-Dewenter, I. Advances in Pollination Ecology from Tropical Plantation Crops. Ecology 2008, 89, 935–943. [Google Scholar] [CrossRef]
  76. Donoso, S.; Murúa, M. Floral Patches and Their Impact on Pollinator Attraction and Yield Production on Cucurbita maxima Var. Paine in Central Chile. Diversity 2021, 13, 608. [Google Scholar] [CrossRef]
  77. Zhou, Y.; Lambrides, C.J.; Li, J.; Xu, Q.; Toh, R.; Tian, S.; Yang, P.; Yang, H.; Ryder, M.; Denton, M.D. Nitrifying Microbes in the Rhizosphere of Perennial Grasses are Modified by Biological Nitrification Inhibition. Microorganisms 2020, 8, 1687. [Google Scholar] [CrossRef]
  78. Tews, J.; Brose, U.; Grimm, V.; Tielbörger, K.; Wichmann, M.C.; Schwager, M.; Jeltsch, F. Animal species diversity driven by habitat heterogeneity/diversity: The importance of keystone structures. J. Biogeogr. 2004, 31, 79–92. [Google Scholar] [CrossRef]
  79. Bennett, A.F.; Radford, J.Q.; Haslem, A. Properties of land mosaics: Implications for nature conservation in agricultural environments. Biol. Conserv. 2006, 133, 250–264. [Google Scholar] [CrossRef]
  80. Mac Nally, R.; Soderquist, T.; Tzaros, C. The conservation value of mesic gullies in dry forest landscapes: Avian assemblages in the box-ironbark ecosystem of southern Australia. Biol. Conserv. 2000, 93, 293–302. [Google Scholar] [CrossRef]
  81. Varah, A.; Jones, H.; Smith, J.; Smith, J.; Potts, S.J. Temperate agroforestry systems provide greater pollination service than monoculture. Agric. Ecosyst. Environ. 2020, 301, 107031. [Google Scholar] [CrossRef]
  82. Rands, S.A.; Whitney, H.M. Effects of pollinator density-dependent preferences on field margin visitations in the midst of agricultural monocultures: A modelling approach. Ecol. Model. 2010, 221, 1310–1316. [Google Scholar] [CrossRef]
  83. Walker, K.J.; Stevens, P.A.; Stevens, D.P.; Mountford, J.O.; Manchester, S.J.; Pywell, R. F The restoration and re-creation of species-rich lowland grassland on land formerly managed for intensive agriculture in the UK. Biol. Conserv. 2004, 119, 1–18. [Google Scholar] [CrossRef]
  84. Polus, E.; Vandewoestijne, S.; Choutt, J.; Baguette, M. Tracking the effects of one century of habitat loss and fragmentation on calcareous grassland butterfly communities. Biodivers. Conserv. 2007, 16, 3423–3436. [Google Scholar] [CrossRef]
  85. Hadley, A.; Betts, M. The effects of landscape fragmentation on pollination dynamics: Absence of evidence not evidence of absence. Biol. Rev. Camb. Philos. Soc. 2012, 87, 526–544. [Google Scholar] [CrossRef]
  86. Kudrnovsky, H.; Ellmauer, T. Report for a List of Annex I Habitat Types Important for Pollinators. 2020. Available online: https://www.eionet.europa.eu/etcs/etc-bd/products/etc-bd-reports/etc-bd-technical-paper-1-2020-report-for-a-list-of-annex-i-habitat-types-important-for-pollinators (accessed on 27 December 2022).
  87. Bartholomée, O.; Lavorel, S. Disentangling the diversity of definitions for the pollination ecosystem service and associated estimation methods. Ecol. Indic. 2019, 107, 105576. [Google Scholar] [CrossRef]
  88. Arianoutsou, M.; Delipetrou, P.; Dimopoulos, P.; Economidou, E.; Karagiannakidou, V.; Konstantinidis, P.; Panagiotidis, P.; Panitsa, M.; Tsiourlis, G. Habitat types in Greece. In Directive 92/43/EEC, The Project of Habitats in Greece, Network Natura 2000; Dafis, S., Papastergiadou, E., Georgiou, K., Babalonas, D., Georgiadis, T., Papageorgiou, M., Lazaridou, T., Tsiaousi, V., Eds.; Goulandris Museum of Natural History-Greek Center of Biotopes Ecotypes: Thessaloniki, Greek, 1997; pp. 402–435. [Google Scholar]
  89. FILOTIS. Database for the Natural Environment of Greece. Available online: http://filotis.itia.ntua.gr (accessed on 27 December 2022).
  90. Beekman, M.; Ratnieks, F.L.W. Long-range foraging by the honey-bee, Apis mellifera L. Funct. Ecol. 2000, 14, 490–496. [Google Scholar] [CrossRef]
  91. Copernicus, Land Monitoring Service. Available online: https://land.copernicus.eu/pan-european/corine-land-cover (accessed on 27 December 2022).
  92. Davies, C.E.; Moss, D.; Hill, M.O. EUNIS Habitat Classification Revised. European Topic Centre on Nature Protection and Biodiversity. 2004. Available online: https://www.eea.europa.eu/data-and-maps/data/eunis-habitat-classification/documentation/eunis-2004-report.pdf/download (accessed on 27 December 2022).
  93. Ricketts, T.H.J.; Regetz, I.; Steffan-Dewenter, I.; Cunningham, S.A.; Kremen, C.; Bogdanski, A.; Gemmill-Herren, B.; Greenleaf, S.S.; Klein, A.M.; Mayfield, M.M.; et al. Landscape Effects on Crop Pollination Services: Are There General Patterns? Ecol. Lett. 2008, 11, 499–515. [Google Scholar] [CrossRef] [PubMed]
  94. Garibaldi, L.A.I.; Steffan-Dewenter, C.; Kremen, C.; Morales, J.M.; Bommarco, R.; Cunningham, S.A.; Carvalheiro, L.G.; Chacoff, N.P.; Dudenhöffer, J.H.; Greenleaf, S.S.; et al. Stability of Pollination Services Decreases With Isolation From Natural Areas Despite Honey Bee Visits. Ecol. Lett. 2011, 14, 1062–1072. [Google Scholar] [CrossRef] [PubMed]
  95. Forman, R.T.T. Land Mosaics: The Ecology of Landscapes and Regions, 1st ed.; Cambridge University Press: Cambridge, UK, 1995; pp. 406–474. [Google Scholar]
  96. Ogilvie, J.E.; Thomson, J.D. Site fidelity by bees drives pollination facilitation in sequentially blooming plant species. Ecology 2016, 97, 1442–1451. [Google Scholar] [CrossRef]
  97. Fahrig, L. Effects of habitat fragmentation on Biodiversity. Annu. Rev. Ecol. Evol. Syst. 2003, 34, 487–515. [Google Scholar] [CrossRef]
  98. Kennedy, C.M.; Lonsdorf, E.; Neel, M.C.; Williams, N.M.; Ricketts, T.H.; Winfree, R.; Bommarco, R.; Brittain, C.; Burley, A.L.; Cariveau, D.; et al. A global quantitative synthesis of local and landscape effects on wild bee pollinators in agroecosystems. Ecol. Lett. 2013, 16, 584–599. [Google Scholar] [CrossRef]
  99. Dimou, M.; Tananaki, C.; Liolios, V.; Thrasyvoulou, A. Pollen Foraging by Honey Bees (Apis mellifera L.) in Greece: Botanical and Geographical Origin. J. Apic. Sci. 2014, 58, 11–23. [Google Scholar] [CrossRef] [Green Version]
Figure 1. Year-round blooming charts indicating availability of pollen and nectar by month. Clockwise from top left: farms A, B, C, and D.
Land 12 00430 g001
Chart 1. Identification of land cover changes and percentages for every 1 km distance from the farm and up to 6 km. Data based on CORINE DATASET 2012.
Land 12 00430 ch001
Figure 2. Land cover analysis over a radius of 6 km and zonal statistics of land cover change in increments of 1 km. Clockwise from top left: farms A, B, C, and D. The grain of the analysis corresponds to 100 m × 100 m and land cover data as provided by CORINE DATASET 2012.
Land 12 00430 g002
Figure 3. Demonstration of the applied methodology in farm A, Agia, Larissa. We applied ranking values to land cover classes (CORINE DATASET 2012) based on their ability to provide foraging for pollinators and monitor the foraging suitability in increments of 1 km [25,86].
Land 12 00430 g003
Chart 2. Association of observed CORINE land classes with the foraging suitability for pollinators. The ranking is based on resources from Hellerstein et al. [25] and Kudrnovsky et al. [86].
Land 12 00430 ch002
Figure 4. Clockwise from top left: landscape mosaic configuration in a color gradient indicating how each farming context is situated within natural and semi-natural areas, urban areas, and intensive-farming spaces.
Land 12 00430 g004
Scheme 1. Landscape configuration components.. Arrows indicate resource exchange dynamics. Redrawn from Forman [95].
Land 12 00430 sch001
Figure 5. Clockwise from top left: farms A, B, C, and D. Landscape configuration components adapted to the study sites. Arrows indicate resource exchange dynamics.
Land 12 00430 g005
Figure 6. Different types of landscape models based on the observation of interactions between natural systems and managed farming patterns regarding the embeddedness of edges, corridors, and patches of the landscape matrix within each farm.
Land 12 00430 g006
Figure 7. Habitat systems that became operational through applied landscape model types include from left to right: rich species meadow patches and strips, shrub corridors, and mixed-species patches and strips.
Land 12 00430 g007
Figure 8. Illustrative sets of landscape models type A to F from left to right, visualizing flora enrichment actions.
Land 12 00430 g008
Figure 9. Diversification of pollen and nectar resources facilitated through landscape model type A applied in the inter matrix zone of each farming estate in order to increase foraging and habitat nests.
Land 12 00430 g009
Chart 3. Diversification and prolongation of availability of pollen and nectar resources through introduced species, according to the type A landscape model illustrated in Figure 8. Species with asterisk refer to existing farmed crops.
Land 12 00430 ch003
Chart 4. Foraging suitability index associated with land cover classes, adjusted per flight range from 0 km up to 6 km from each farm.
Land 12 00430 ch004
Scheme 2. Sampling fields in farms with introduced honeybees.
Land 12 00430 sch002
Table 1. Climate, vegetation, cultivation data and pollinator foraging plants per study area.
DataFarm AFarm BFarm CFarm D
Place, regional unit geo-reference location of farmMetaxochori, Larissa (39°43′06.6″ N, 22°44′21.9″ E)Kokkina, Farsala (39°20′33.6″ N, 22°39′22.2″ ERizes,
Arkadia (37°25′56.7″ N, 22°28′49.4″ E
Aigies,
Laconia (39°20′33.6″ N, 22°39′22.2″ E
Climate data during farm-blooming season *
Temperature variation/rainy days
March–May
10–20 °C *
July and September
25–32 °C *
March–May
15–23 °C *
February–May
25–32 °C *
825 mm */20 days *640 mm */14 days *764 mm */18 days *534 mm */11 days *
Altitude/slope250 m/gradient 3.5%300 m/plain700 m/gradient 3–5%100 m/Hills
SoilRich in organic matter, medium–shallow ground depth, fertile,
average texture
Medium depth, clay-loam type, organic matter in moderate-to-low levelsMedium–shallow ground depth, clay-loam type, fertile, calcium deficiencyMedium–shallow ground depth, clay-loam type, fertile, excess calcium
Bio-climatic environment
Vegetation zones
Zone Quercetalia ilicis Subarea Quercion ilicisZone Quercetalia ilicis Subarea Quercion ilicisZone Quercetalia pubescentis Subarea Ostryo carpinionZone Quercetalia ilicis subarea Oleo ceratonion growth Oleo ceratonietum
Cultivations, varietiesApple varieties: Firikia, Gala, Jonas, Pink Lady; pear; cherriesSesame, durum wheat, hempGala apples, Granny Smith apples, Jeromine apples, Super Starkin applesOlive trees, citrus fruit, lemon trees, tangerine, Valencia oranges, oranges
Plot size and cultivation type and crop details, age of trees in years (y)5.5 ha, not certified organic, irrigated, 1000 trees/ha, espaliered, apples: 5–45 y 12 ha, organic, irrigated, 200 plants/m21.5–2.0 ha organic, irrigated, espaliered, 1200–1300 trees/ha, apples: 5–6 y 20 ha, organic, irrigated, 40 trees/ha, >35 y
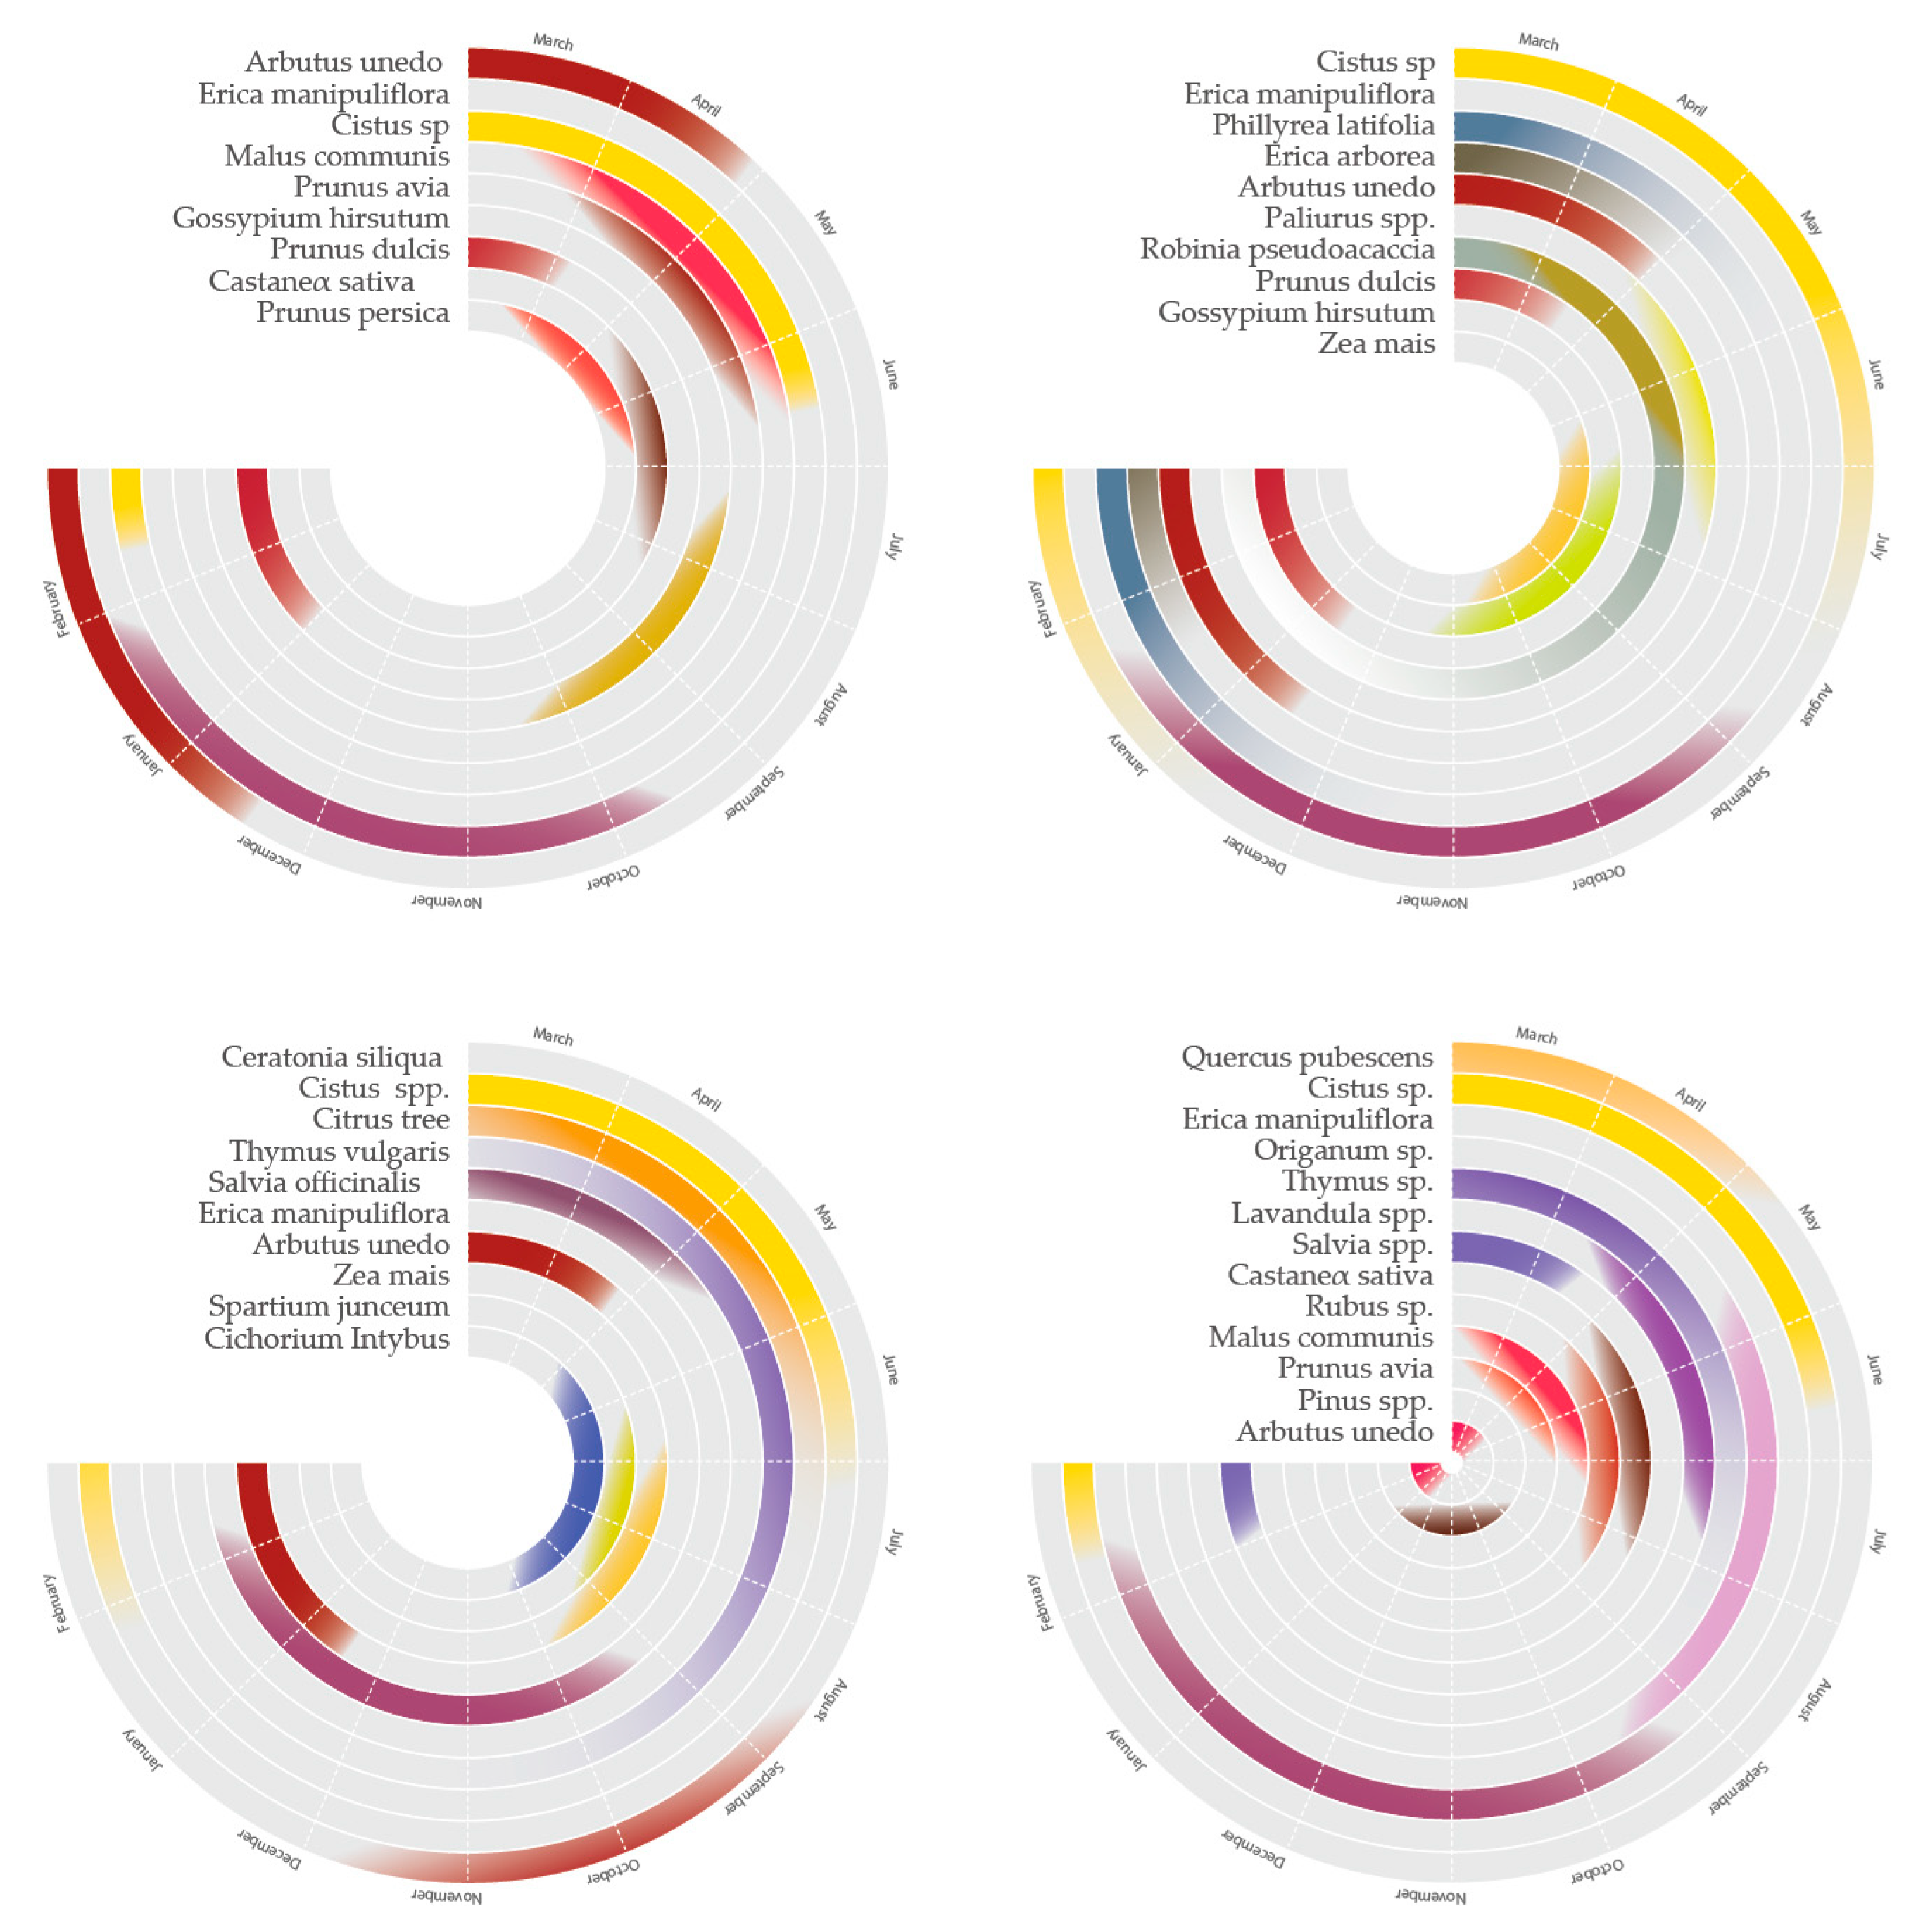
Significant plant species observed within 6 km suitable for bees (data based on the literature, listed nectar- and pollen-producing species)Arbutus unedo, Erica manipuliflora, Cistus sp., Malus communis, Prunus avia, Gossypium hirsutum, Prunus dulcis, Castanea sativa, Prunus persicaCistus sp., Erica manipuliflora, Phillyrea latifolia, Erica arborea, Arbutus unedo, Paliurus spp., Robinia pseudoacaccia, Prunus dulcis, Gossypium hirsutum, Zea maisQuercus pubescens, Cistus sp., Erica manipuliflora, Origanum sp., Thymus sp., Salvia spp., Castanea sativa, Rubus sp., Malus communis, Prunus avia, Pinus spp., Arbutus unedoCeratonia siliqua, Cistus spp., citrus trees, Thymus vulgaris, Salvia officinalis Ericamanipuliflora, Arbutus unedo, Zea mais
* According to the Hellenic National Meteorological Service.
Table 2. Point sampling and fruit diameter in farm A.
Point of Sampling
(at 3rd Row from Interior Row)
Distance from Beehives
(m)
Mean Diameter
Every 10 Fruits
(mm)
Point «0»—4th row 569.4
Point «A»—8th row 1569.9
Point «B»—12th row 2972.4
Point of sampling
(at 12rd row from interior row)
Point «B» [3rd tree] 72.4
Point «Β + 20 m» 71.25
Point «Β + 40 m» 73.1
Point «Β + 60 m» 71.5
Table 3. Point sampling and fruit diameter/weight in farm C.
Point of SamplingWeight (Mean)
g
Mean Diameter Every 10 Fruits (mm)
1st row—starting point22878.4
1st row—end point22176.3
5th row—starting point26081.1
5th row—end point19375.8
13th row—starting point17272.4
13th row—end point20377.6
Disclaimer/Publisher’s Note: The statements, opinions and data contained in all publications are solely those of the individual author(s) and contributor(s) and not of MDPI and/or the editor(s). MDPI and/or the editor(s) disclaim responsibility for any injury to people or property resulting from any ideas, methods, instructions or products referred to in the content.

