
Simulation of Urban Areas Exposed to Hazardous Flash Flooding Scenarios in Hail City
 , ,
, ,  , and
, and 
Abstract
:1. Introduction
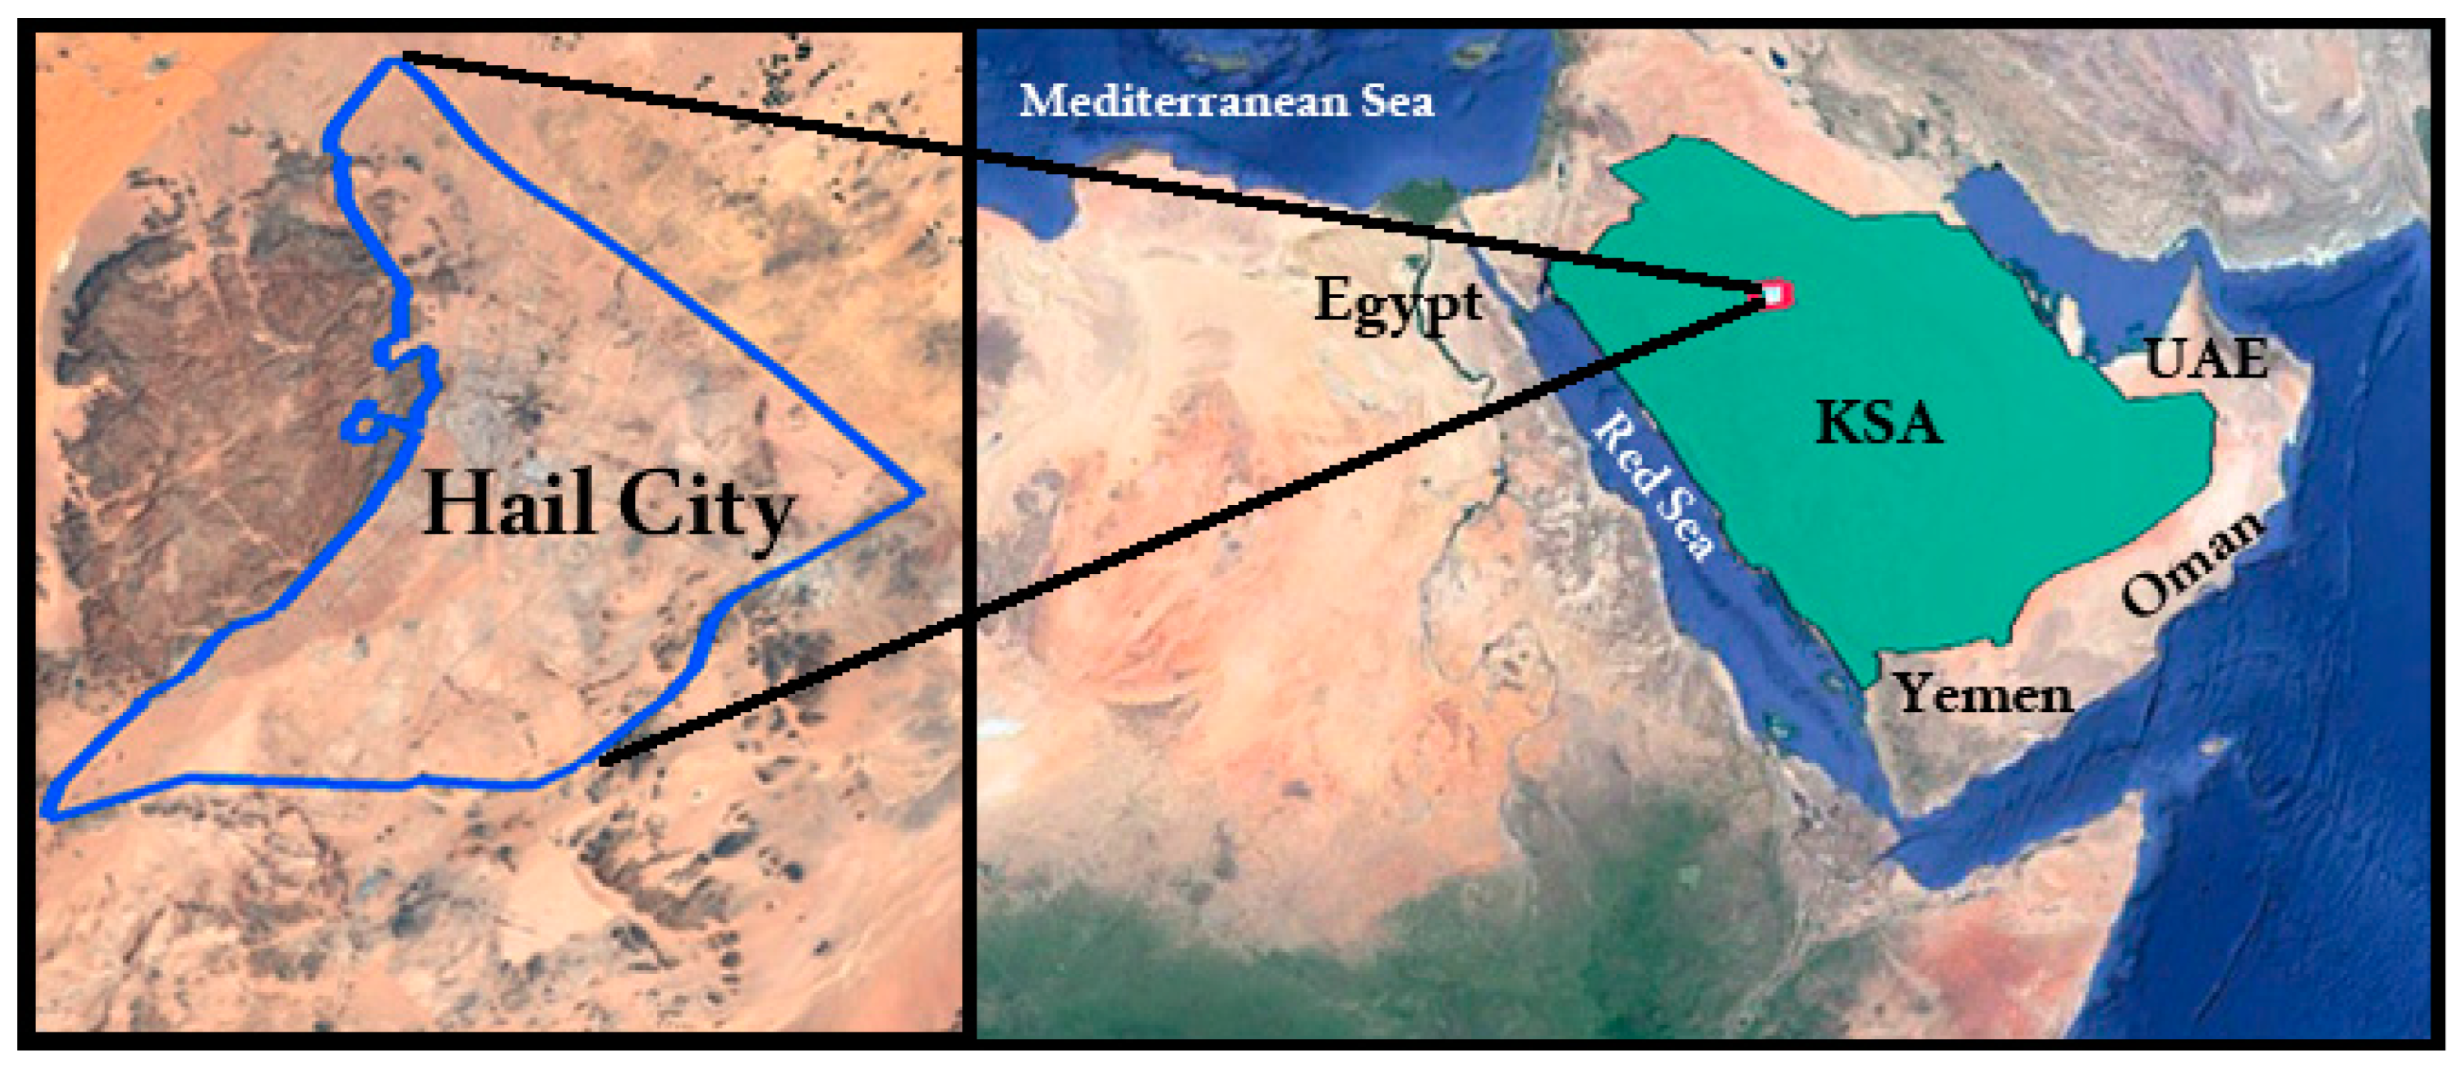
2. Study Area
3. Research Methodology and Simulation Data
3.1. Simulation Data Sources
3.2. Identifying Urban Areas
3.3. Identifying the Risk Areas
3.4. Classifying Urban Areas Exposure
4. Simulation Process
4.1. Extraction of DEM for the Study Area’s Watershed
4.2. Land Use and Soil Data
4.3. Infiltration and Initial Moisture Data Source
4.4. Rainfall Values
5. Results
5.1. Urban Land Use
5.2. Simulating the Flash Flooding
5.3. Comparing the Worst-Case Historical Event between 1984-2022
6. Discussion
7. Conclusions
Author Contributions
Funding
Data Availability Statement
Conflicts of Interest
References
- Vaz, E.; Nijkamp, P. Gravitational forces in the spatial impacts of urban sprawl: An investigation of the region of Veneto, Italy. Habitat Int. 2015, 45, 99–105. [Google Scholar] [CrossRef]
- Jiao, L. Urban land density function: A new method to characterize urban expansion. Landsc. Urban Plan. 2015, 139, 26–39. [Google Scholar] [CrossRef]
- Belal, A.A.; Moghanm, F.S. Detecting urban growth using remote sensing and GIS techniques in Al Gharbiya governorate, Egypt. Egypt. J. Remote Sens. Space Sci. 2011, 14, 73–79. [Google Scholar] [CrossRef] [Green Version]
- Hamdy, O.; Zhao, S.; Abd El-Atty, H.; Ragab, A.; Salem, M. Urban areas management in developing countries: Analysis of the urban areas crossed with risk of storm water drains, Aswan-Egypt. Int. J. Urban Civ. Eng. 2020, 14, 96–102. [Google Scholar]
- Yue, W.; Liu, Y.; Fan, P. Measuring urban sprawl and its drivers in large Chinese cities: The case of Hangzhou. Land Use Policy 2013, 31, 358–370. [Google Scholar] [CrossRef]
- Lagarias, A. Urban sprawl simulation linking macro-scale processes to micro-dynamics through cellular automata, an application in Thessaloniki, Greece. Appl. Geogr. 2012, 34, 146–160. [Google Scholar] [CrossRef]
- Guha-Sapir, D.; Vos, F.; Below, R. Annual Disaster Statistical Review 2011; Centre for Research on the Epidemiology of Disasters: Brussels, Belgium, 2012; p. 52. [Google Scholar]
- IPCC. IPCC Sixth Assessment Report; IPCC: Geneva, Switzerland, 2022. [Google Scholar]
- Güneralp, B.; Güneralp, İ.; Liu, Y. Changing global patterns of urban exposure to flood and drought hazards. Glob. Environ. Chang. 2015, 31, 217–225. [Google Scholar] [CrossRef]
- World Bank Group. Egypt Dashboard. Available online: http://sdwebx.worldbank.org/climateportalb/home.cfm?page=country_profile&CCode=EGY&ThisTab=NaturalHazards (accessed on 11 September 2022).
- United Nations Office for Disaster Risk Reduction. National Strategy for Crisis/Disaster Management and Disaster Risk Reduction; United Nations Office for Disaster Risk Reduction: Geneva, Switzerland, 2010. [Google Scholar]
- Hamdy, O.; Zhao, S.; Salheen, M.; Eid, Y. Using Arc GIS to analyse urban growth towards torrent risk areas (Aswan city as a case study). IOP Conf. Ser. Earth Environ. Sci. 2014, 20, 12009. [Google Scholar] [CrossRef] [Green Version]
- Ayyub, B.M. Risk Analysis; The United Nations Office for Disaster Risk Reduction: Geneva, Switzerland, 2014. [Google Scholar]
- Twigg, J. Disaster Risk Reduction; Humanitarian Policy Group: London, UK, 2015. [Google Scholar]
- APFM. Guidance on Flash Flood Management. Recent experiences from Central and Eastern Europe. In Flood Management Tools Series; APFM: Seattle, DC, USA, 2007; Available online: https://www.preventionweb.net/publication/guidance-flash-flood-management-recent-experiences-central-and-eastern-europe (accessed on 11 September 2022).
- Tanner, D. Analyzing wildlife habitat with Google Earth. Green Teach. 2009, 87, 9–15. [Google Scholar]
- Wilson, C.R.; Murphy, J.; Trautmann, N.M.; Makinster, J.G. From Local to Global: A Birds-Eye View of Changing Landscapes. Am. Biol. Teach. 2009, 71, 412–416. [Google Scholar] [CrossRef]
- McCarty, J.A., Jr. Long-term Simulation in Parley’s Canyon Using GSSHA; Brigham Young University: Provo, UT, USA, 2013. [Google Scholar]
- Paudel, M. An Examination of Distributed Hydrologic Modeling Methods as Compared with Traditional Lumped Parameter Approaches; Brigham Young University: Provo, UT, USA, 2010. [Google Scholar]
- Taylor, J.R.; Lovell, S.T. Mapping public and private spaces of urban agriculture in Chicago through the analysis of high-resolution aerial images in Google Earth. Landsc. Urban Plan. 2012, 108, 57–70. [Google Scholar] [CrossRef]
- Collin, A.; Nadaoka, K.; Nakamura, T. Mapping VHR Water Depth, Seabed and Land Cover Using Google Earth Data. ISPRS Int. J. Geoinf. 2014, 3, 1157–1179. [Google Scholar] [CrossRef]
- El Hassan, A.A.; Sharif, H.O.; Jackson, T.; Chintalapudi, S. Performance of a conceptual and physically based model in simulating the response of a semi-urbanized watershed in San Antonio, Texas. Hydrol. Process. 2012, 27, 3394–3408. [Google Scholar] [CrossRef]
- Wright, D.B.; Smith, J.A.; Baeck, M.L. Flood frequency analysis using radar rainfall fields and stochastic storm transposition. Water Resour. Res. 2014, 50, 1592–1615. [Google Scholar] [CrossRef]
- Noby, M.; Michitaka, U.; Hamdy, O. Urban Risk Assessments: Framework for Identifying Land-uses Exposure of Coastal Cities to Sea Level Rise, a Case Study of Alexandria. SVU-Int. J. Eng. Sci. Appl. 2022, 3, 78–90. [Google Scholar] [CrossRef]
- Rikimaru, P.A.; Roy, P.S.; Miyatake, S. Tropical Forest cover density mapping. Trop. Ecol. 2002, 43, 39–47. [Google Scholar]
- Ramadhan Kete, S.C.; Suprihatin Tarigan, S.D.; Effendi, H. Land use classification based on object and pixel using Landsat 8 OLI in Kendari City, Southeast Sulawesi Province, Indonesia. IOP Conf. Ser. Earth Environ. Sci. 2019, 284, 012019. [Google Scholar] [CrossRef]
- Schneider, A. Monitoring land cover change in urban and peri-urban areas using dense time stacks of Landsat satellite data and a data mining approach. Remote Sens. Environ. 2012, 124, 689–704. [Google Scholar] [CrossRef]
- USGS, “GloVis—USGS”. 2001. Available online: https://glovis.usgs.gov/ (accessed on 2 October 2022).
- Hamdy, O.; Zhao, S.; Salheen, M.A.; Eid, Y.Y. Identifying the Risk Areas and Urban Growth by ArcGIS-Tools. Geosciences 2016, 6, 47. [Google Scholar] [CrossRef] [Green Version]
- Stefanidis, S.; Alexandridis, V.; Mallinis, G. A cloud-based mapping approach for assessing spatiotemporal changes in erosion dynamics due to biotic and abiotic disturbances in a Mediterranean Peri-Urban forest. Catena 2022, 218, 106564. [Google Scholar] [CrossRef]
- Cohen, B. Urban growth in developing countries: A review of current trends and a caution regarding existing forecasts. World Dev. 2004, 32, 23–51. [Google Scholar] [CrossRef]
- Hamdy, O.; Gaber, H.; Abdalzaher, M.S.; Elhadidy, M. Identifying exposure of urban area to certain seismic hazard using machine learning and GIS: A case study of greater Cairo. Sustainability 2022, 14, 10722. [Google Scholar] [CrossRef]
- Alsonny, Z.; Ahmed, A.M.M.A.; Hamdy, O. Studying the Effect of Urban Green Spaces Location on Urban Heat Island in Cities Using Remote Sensing Techniques, 6th October City as a Case Study. Int. Des. J. 2022, 12, 243–262. [Google Scholar]
- Van Vliet, J.; Bregt, A.K.; Hagen-Zanker, A. Revisiting Kappa to account for change in the accuracy assessment of land-use change models. Ecol. Modell. 2011, 222, 1367–1375. [Google Scholar] [CrossRef]
- Hamdy, O. Using Remote Sensing Techniques to Assess the Changes in the Rate of Urban Green Spaces in Egypt: A Case Study of Greater Cairo. Int. Des. J. 2022, 12, 53–64. [Google Scholar] [CrossRef]
- Alsonny, Z.; Hamdy, O. Procedural Framework for Assessing the Impact of New Cities Growth on Urban Heat Island, A Case Study of 6thOctober City. SVU-Int. J. Eng. Sci. Appl. 2022, 3, 64–78. [Google Scholar] [CrossRef]
- Hamdy, O.; Alsonny, Z. Assessing the Impacts of Land Use Diversity on Urban Heat Island in New Cities in Egypt, Tiba City as a Case Study. Int. Des. J. 2022, 12, 93–103. [Google Scholar] [CrossRef]
- A Draft Guide to Flood Risk Assessment Data Collection Survey on ASEAN regional Collaboration in Disaster Management. Available online: https://openjicareport.jica.go.jp/216/216/216_100_12085734.html (accessed on 11 September 2022).
- Accuracy Assessment for Image Classification—ArcMap. Documentation. Available online: https://desktop.arcgis.com/en/arcmap/latest/manage-data/raster-and-images/accuracy-assessment-for-image-classification.htm (accessed on 27 December 2021).
- ESRI. Compute Confusion Matrix (Spatial Analyst)—ArcMap. Documentation. Available online: https://desktop.arcgis.com/en/arcmap/latest/tools/spatial-analyst-toolbox/compute-confusion-matrix.htm (accessed on 27 December 2021).
- Hereher, M.E. Synopsis of geo-environmental hazards in Hail region, Saudi Arabia using remote sensing. Environ. Earth Sci. 2016, 75, 1–13. [Google Scholar] [CrossRef]
- Al Saud, M. Assessment of flood hazard of Jeddah area 2009, Saudi Arabia. J. Water Resour. Prot. 2010, 2, 839–847. [Google Scholar] [CrossRef] [Green Version]
- Youssef, A.M.; Pradhan, B.; Sabtan, A.A.; El-Harbi, H.M. Coupling of remote sensing data aided with field investigations for geological hazards assessment in Jazan area, Kingdom of Saudi Arabia. Environ. Earth Sci. 2012, 65, 119–130. [Google Scholar] [CrossRef]
- Youssef, A.M.; Maerz, N.H. Overview of some geological hazards in the Saudi Arabia. Environ. Earth Sci. 2013, 70, 3115–3130. [Google Scholar] [CrossRef]
- Alharbi, T.; Sultan, M.; Sefry, S.; Elkadiri, R.; Ahmed, M.; Chase, R.; Milewski, A.; Abu Abdullah, M.; Emil, M.; Chounaird, K. An assessment of landslide susceptibility in the Faifa area, Saudi Arabia, using remote sensing and GIS techniques. Nat. Hazards Earth Syst. Sci. 2014, 14, 1553–1564. [Google Scholar] [CrossRef] [Green Version]
- Hereher, M.; Alghmdi, A.; Mseddi, K.; el Kenawy, A. Remote sensing of vegetation prolonged drought at the salt playas of Hail—Saudi Arabia. Egypt. J. Remote Sens. Space Sci. 2022, 25, 135–145. [Google Scholar] [CrossRef]
- Ahmed, I.; Nazzal, Y.; Zaidi, F. Groundwater pollution risk mapping using modified DRASTIC model in parts of Hail region of Saudi Arabia. Environ. Eng. Res. 2018, 23, 84–91. [Google Scholar] [CrossRef]
- Al-Sehly, T.E.; Youssef, A.M.; Al-Otaibi, A.A.; Al-Harbi, H.M. Site investigation using engineering geology mapping and geological hazard evaluation: Case study of the New Hail Economic City, Hail Region, KSA. In Proceedings of the International Congress and Exhibition, Sustainable Civil Infrastructures: Innovative Infrastructure Geotechnology, El-Salam, Egypt, 15 July 2017; pp. 1–19. [Google Scholar]
- Alhedyan, M.A. Change Detection of Land Use and Land Cover, Using Landsat-8 and Sentinel-2A. Ph.D. Dissertation, University of Leicester, Leicester, UK, 2021. [Google Scholar]
- Sharaf, M.A.; Hussein, M.T. Groundwater quality in the Saq aquifer, Saudi Arabia. Hydrol. Sci. 1996, 4, 683–699. [Google Scholar] [CrossRef] [Green Version]
- Elshewey, M.I.A. The Study of Prevention of the Dangers of the Torrents and Draining Rainwater of Uqdah in Hail Region, Saudi Arabia. Int. J. Appl. Innov. Eng. Manag. 2016, 5, 62–75. [Google Scholar]
- Pienaar, H.; Fundarò Costanza, S.; Mantia, L.; Nguyen, H.A. Future Saudi Cities Programme City Profiles Series: Hael; 2019. Available online: https://saudiarabia.un.org/en/39461-future-saudi-cities-programme-city-profiles-series-abha (accessed on 27 December 2021).
- El Kenawy, A.M.; Mccabe, M.F. A multi-decadal assessment of the performance of gauge- and model-based rainfall products over Saudi Arabia: Climatology, anomalies and trends. Int. J. Climatol. 2016, 36, 656–674. [Google Scholar] [CrossRef] [Green Version]
- Do, H.-T.; Limet, S.; Melin, E. Parallel Computing Flow Accumulation in Large Digital Elevation Models. Procedia Comput. Sci. 2011, 4, 2277–2286. [Google Scholar] [CrossRef]
- Jarihani, A.A.; Callow, J.N.; McVicar, T.R.; van Niel, T.G.; Larsen, J.R. Satellite-derived Digital Elevation Model (DEM) selection, preparation and correction for hydrodynamic modelling in large, low-gradient and data-sparse catchments. J. Hydrol. 2015, 524, 489–506. [Google Scholar] [CrossRef]
- Small, C.; Sohn, R. Correlation scales of digital elevation models in developed coastal environments. Remote Sens. Environ. 2015, 159, 80–85. [Google Scholar] [CrossRef] [Green Version]
- ESRI. Classifying Landsat Image Services to Make a Land Cover Map. Available online: https://www.esri.com/arcgis-blog/products/product/imagery/classifying-landsat-image-services-to-make-a-land-cover-map/ (accessed on 27 December 2021).
- Tran, H.L. A GIS-Based Data Model and Tools for Analysis and Visualization of Levee Breaching Using the GSSHA Model; Brigham Young University: Provo, UT, USA, 2011. [Google Scholar]
- Hall, S.R. Model Development and Calibration for a Flood Early Warning System; Brigham Young University: Provo, UT, USA, 2013. [Google Scholar]
- Hamelin, J. Estimation of GSSHA (Gridded Surface/Subsurface Hydrologic Analysis) Model Parameters for Chotysanka Basin Using a Long Term Simulation; Czech Technical University of Prague: Prague, Czech Republic, 2013. [Google Scholar]
- Almashat, H.; AlSharqawy, M. The Dangers of Torrential Rains in the Al-Adeira Valley Basin in the Hail Region: An Applied Study Using GIS and Remote Sensing Techniques. 2017, pp. 1–19. Available online: http://swideg-geography.blogspot.com/2018/03/blog-post_69.html#.Y2bsn3ZBzWV. (accessed on 6 November 2022).
- Audigé, L.; Bhandari, M.; Kellam, J. How reliable are reliability studies of fracture classifications? A systematic review of their methodologies. Acta Orthop. Scand. 2004, 75, 184–194. [Google Scholar] [CrossRef] [PubMed] [Green Version]
- El-Sayed, E.A.; Habib, E. Advanced technique for rainfall-runoff simulation in arid catchments Sinai, Egypt. In Proceedings of the 3rd International Conference on Water Resources and Arid Environments, Riyadh, Saudi Arabia, 16–19 November 2008. [Google Scholar]
- Fathy, I.; Abd-Elhamid, H.F.; Negm, A.M. Prediction and mitigation of flash floods in Egypt. In Flash Floods in Egypt; Springer: Berlin/Heidelberg, Germany, 2020; pp. 349–368. [Google Scholar]
- Hamdy, O.; Zhao, S. A Study on Urban Growth in Torrent Risk Areas in Aswan, Egypt. J. Archit. Plan. Trans. AIJ 2016, 81, 1733–1741. [Google Scholar] [CrossRef]
- Al-Hawas, F. The Archaeological and Architectural Remains of the Ancient City of Faid in the Province of Hail in Saudi Arabia. Ph.D. Dissertation, University of Southampton, Southampton, UK, 2003. [Google Scholar]


| Data Source | |
|---|---|
| Urban Area | Landsat satellite images. |
| DEM file | U.S. Geological Survey (USGS) Website. |
| Land Use map | USGS Land Cover Institute. |
| Soil Type map | Food and Agriculture Organization of the United Nations (FAO) Digital Soil Map of the World (DSMW). |
| Precipitation | Literature Review. |
| Flood Hazard | Hazard Degree | Depth (Meters) |
|---|---|---|
| H1 | Very Low | <0.5 |
| H2 | Low | 0.5–1 |
| H3 | Medium | 1–2 |
| H4 | High | 2–5 |
| H5 | Extreme | >5 |
| Class Value | Urban | Non-Urban | Total | U Accuracy | Kappa |
|---|---|---|---|---|---|
| Urban | 29.00 | 5.00 | 34.00 | 0.85 | 0.00 |
| Non-Urban | 2.00 | 221.00 | 223.00 | 0.99 | 0.00 |
| Total | 31.00 | 226.00 | 257.00 | 0.00 | 0.00 |
| P Accuracy | 0.94 | 0.98 | 0.00 | 0.97 | 0.00 |
| Kappa | 0.00 | 0.00 | 0.00 | 0.00 | 0.88 |
| Class Value | Urban | Non-Urban | Total | U Accuracy | Kappa |
|---|---|---|---|---|---|
| Urban | 50.00 | 3.00 | 53.00 | 0.94 | 0.00 |
| Non-Urban | 4.00 | 200.00 | 204.00 | 0.98 | 0.00 |
| Total | 54.00 | 203.00 | 257.00 | 0.00 | 0.00 |
| P Accuracy | 0.93 | 0.99 | 0.00 | 0.97 | 0.00 |
| Kappa | 0.00 | 0.00 | 0.00 | 0.00 | 0.92 |
| Year | Urban (Ha) | % | Non-Urban (Ha) | % | Total |
|---|---|---|---|---|---|
| 1984 | 3454 | 2.01 | 168,149 | 97.99 | 171,603 |
| 2022 | 16,123 | 9.40 | 155,480 | 90.60 | 171,603 |
| Flood Hazard | Hazard Degree | Water Depth | Urban Area 1984 | Urban Area 2022 | ||
|---|---|---|---|---|---|---|
| (Ha) | % | (Ha) | % | |||
| H1 | Very Low | <0.5 | 3156.15 | 91.39% | 14,394.68 | 89.28% |
| H2 | Low | 0.5–1 | 210.34 | 6.09% | 1213.06 | 7.52% |
| H3 | Medium | 1–2 | 75.68 | 2.19% | 439.28 | 2.72% |
| H4 | High | 2–5 | 11.23 | 0.33% | 74.33 | 0.46% |
| H5 | Extreme | >5 | 0.13 | 0.00% | 1.52 | 0.01% |
| Total | 3453.53 | 100% | 16,122.87 | 100% | ||
| Flood Hazard | 1984 | 2022 | Differences | Increasing (1984 to 2022) |
|---|---|---|---|---|
| H1 | 3156.15 | 14,394.68 | 11,238.53 | 456% |
| H2 | 210.34 | 1213.06 | 1002.72 | 577% |
| H3 | 75.68 | 439.28 | 363.6 | 580% |
| H4 | 11.23 | 74.33 | 63.1 | 662% |
| H5 | 0.13 | 1.52 | 1.39 | 1169% |
| Total % | 3453.53 | 16,122.87 | 12,669.34 | 467% |
Disclaimer/Publisher’s Note: The statements, opinions and data contained in all publications are solely those of the individual author(s) and contributor(s) and not of MDPI and/or the editor(s). MDPI and/or the editor(s) disclaim responsibility for any injury to people or property resulting from any ideas, methods, instructions or products referred to in the content. |
© 2023 by the authors. Licensee MDPI, Basel, Switzerland. This article is an open access article distributed under the terms and conditions of the Creative Commons Attribution (CC BY) license (https://creativecommons.org/licenses/by/4.0/).
Share and Cite
Hamdy, O.; Abdelhafez, M.H.H.; Touahmia, M.; Alshenaifi, M.; Noaime, E.; Elkhayat, K.; Alghaseb, M.; Ragab, A. Simulation of Urban Areas Exposed to Hazardous Flash Flooding Scenarios in Hail City. Land 2023, 12, 353. https://doi.org/10.3390/land12020353
Hamdy O, Abdelhafez MHH, Touahmia M, Alshenaifi M, Noaime E, Elkhayat K, Alghaseb M, Ragab A. Simulation of Urban Areas Exposed to Hazardous Flash Flooding Scenarios in Hail City. Land. 2023; 12(2):353. https://doi.org/10.3390/land12020353
Chicago/Turabian StyleHamdy, Omar, Mohamed Hssan Hassan Abdelhafez, Mabrouk Touahmia, Mohammed Alshenaifi, Emad Noaime, Khaled Elkhayat, Mohammed Alghaseb, and Ayman Ragab. 2023. "Simulation of Urban Areas Exposed to Hazardous Flash Flooding Scenarios in Hail City" Land 12, no. 2: 353. https://doi.org/10.3390/land12020353