


Sociogeomorphological Analysis in a Headwater Basin in Southern Brazil with Emphasis on Land Use and Land Cover Change
 ,
,  , ,
, ,
Abstract
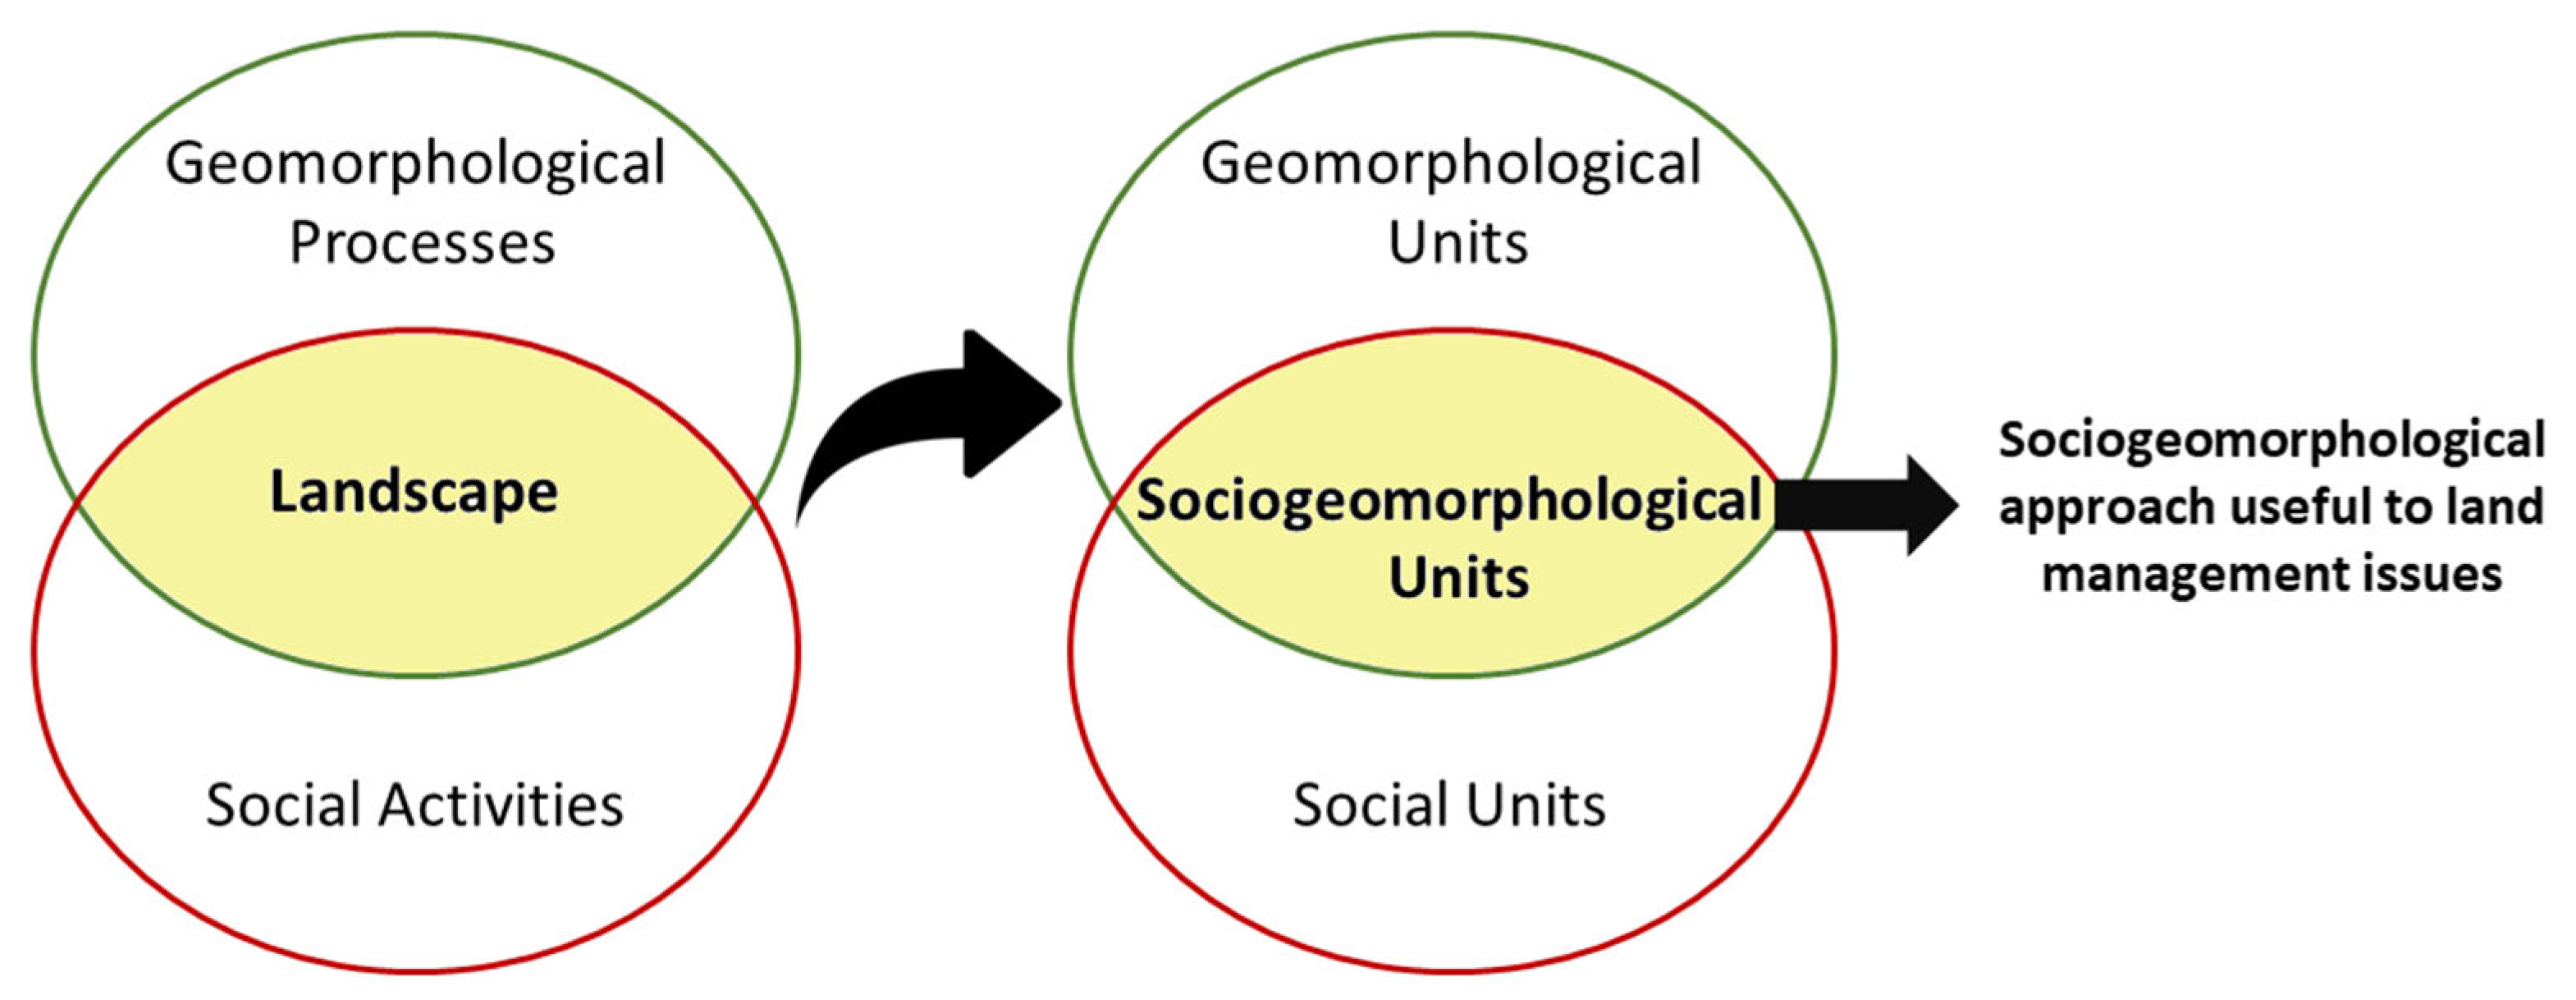
:1. Introduction
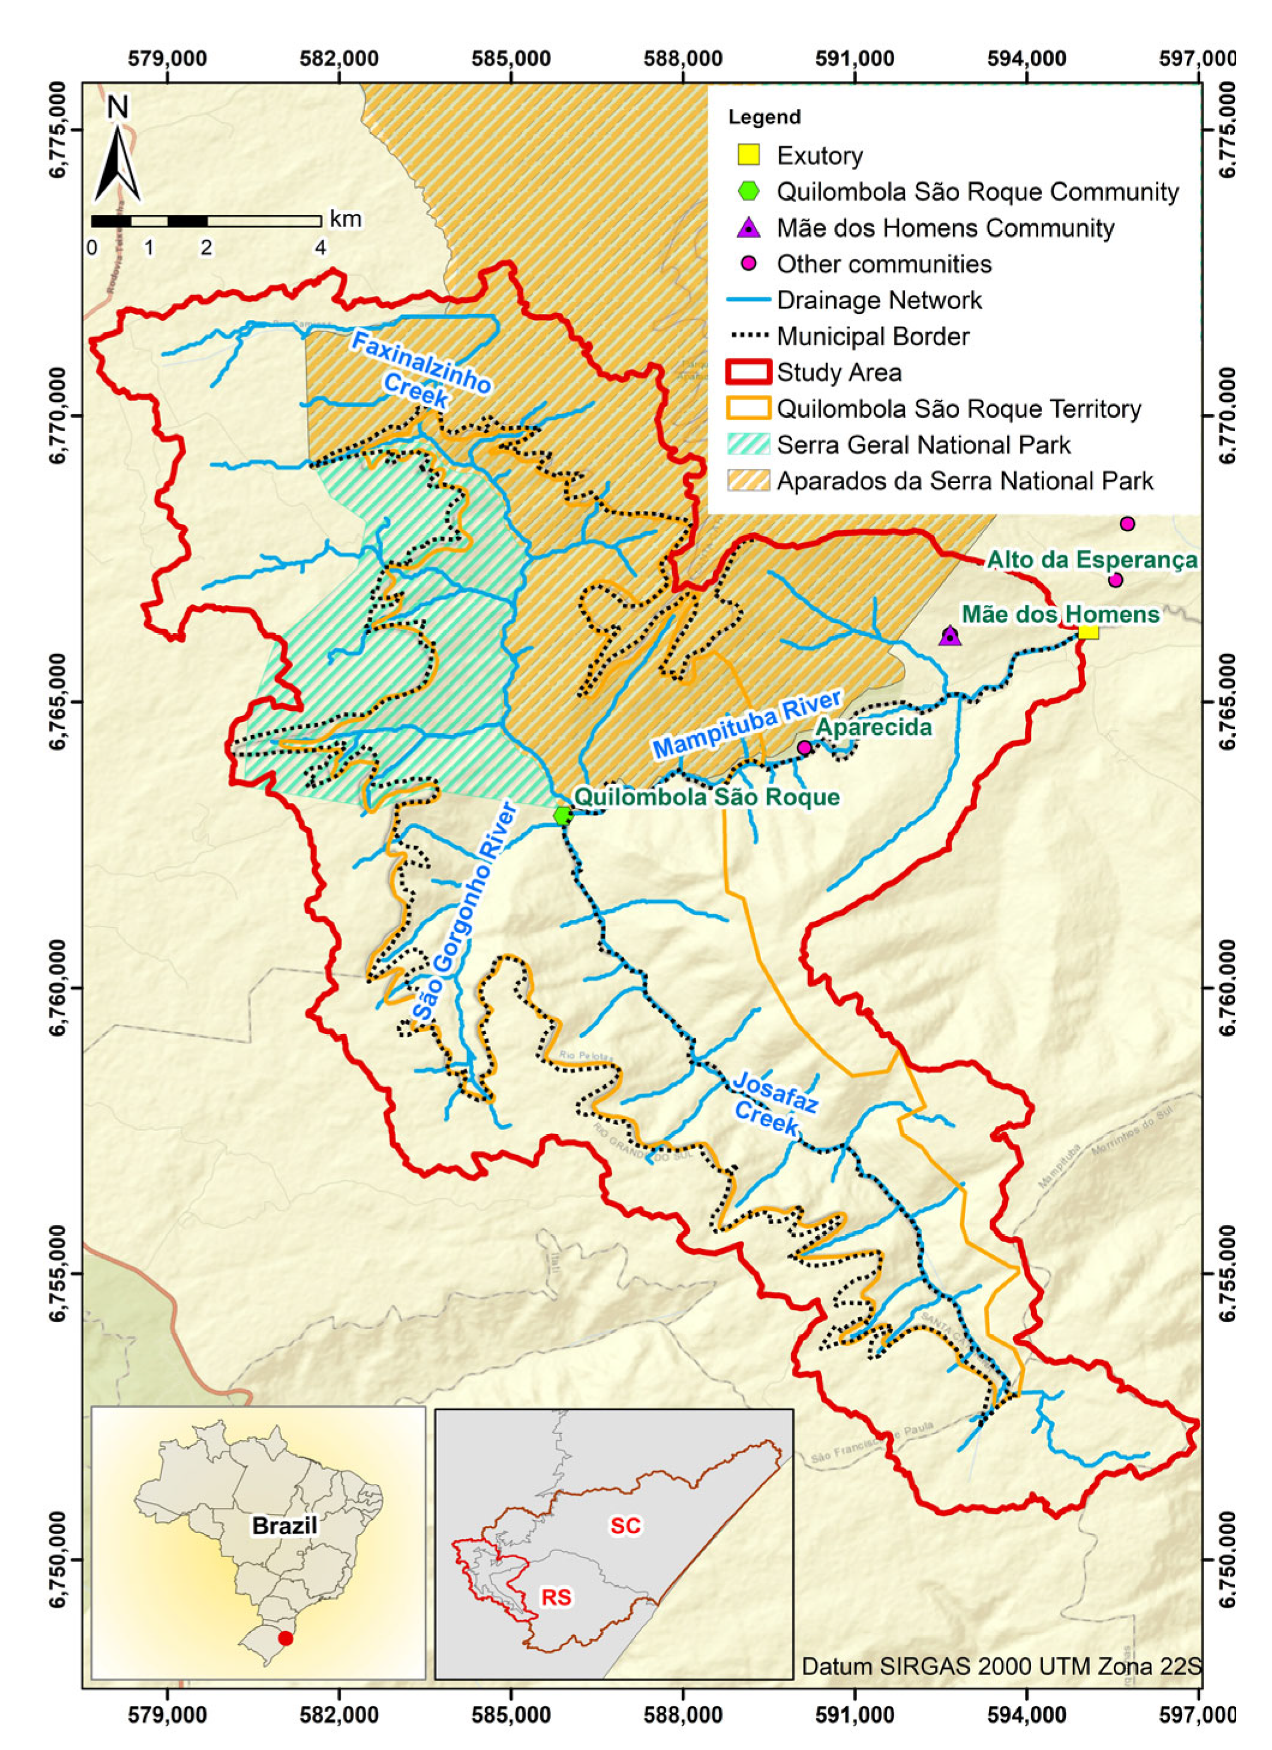
2. Study Area
2.1. Physiographic Characteristics
2.2. Social Characteristics
3. Materials and Methods
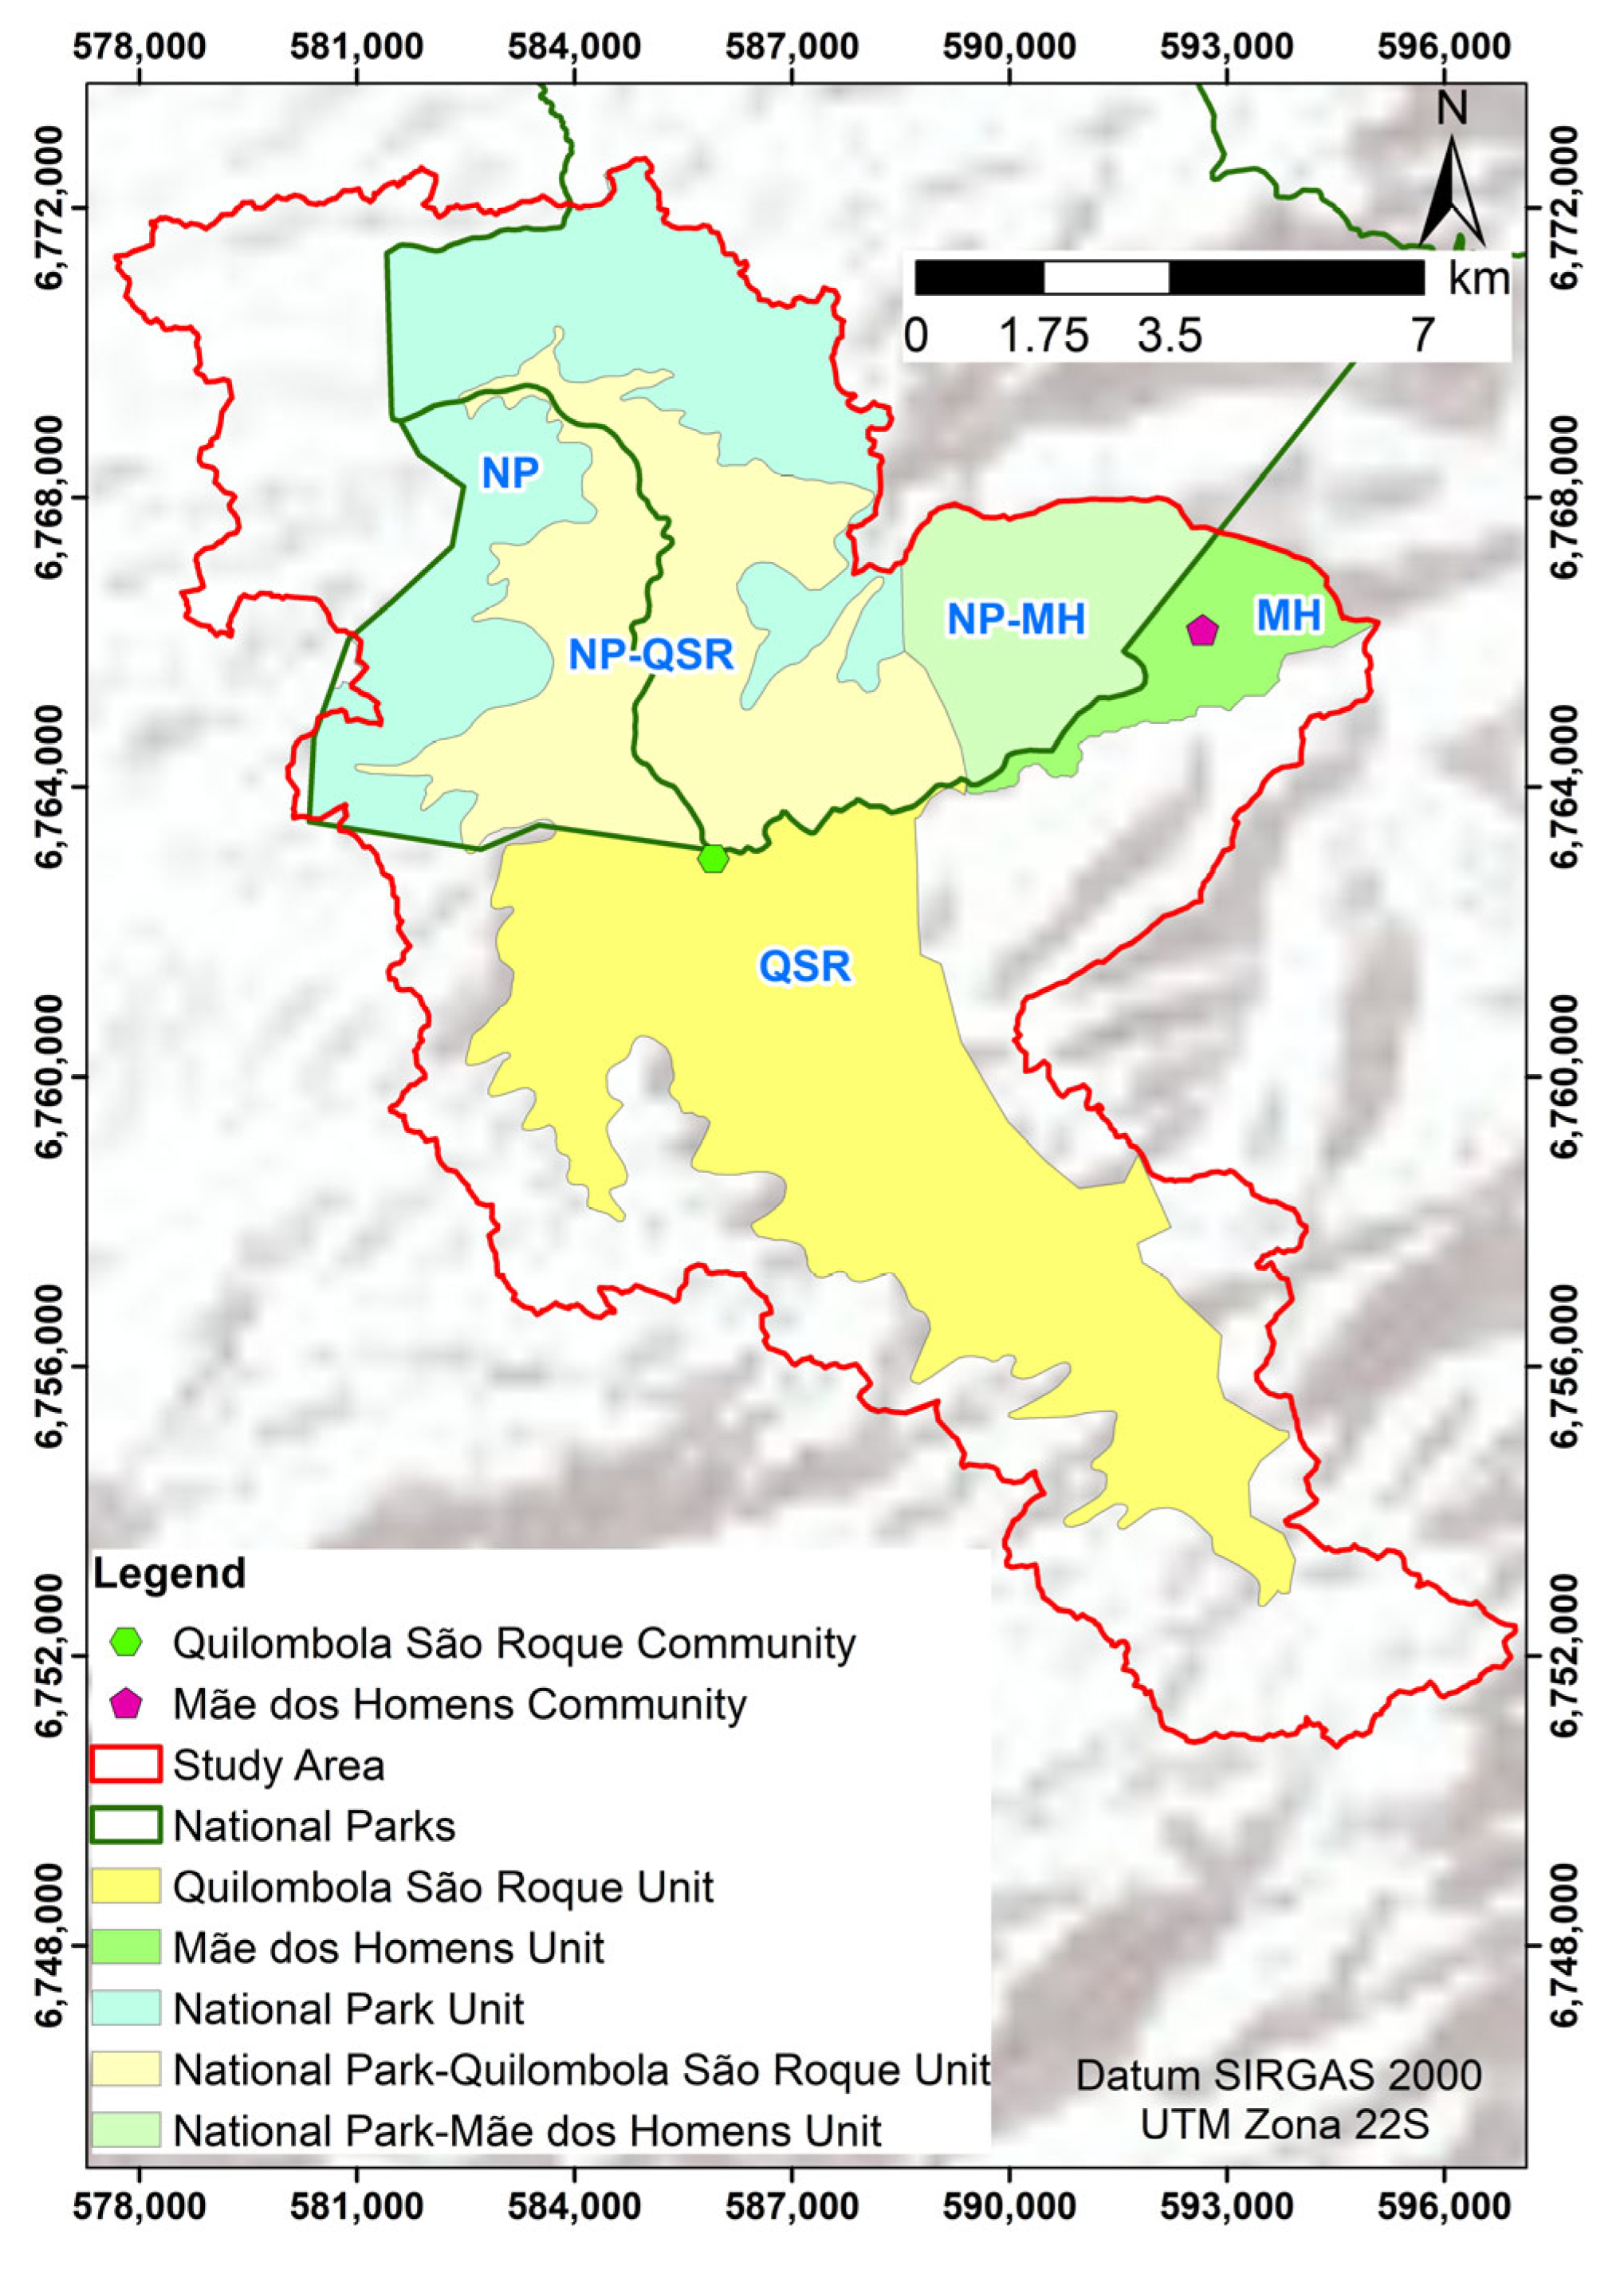
3.1. Social Units
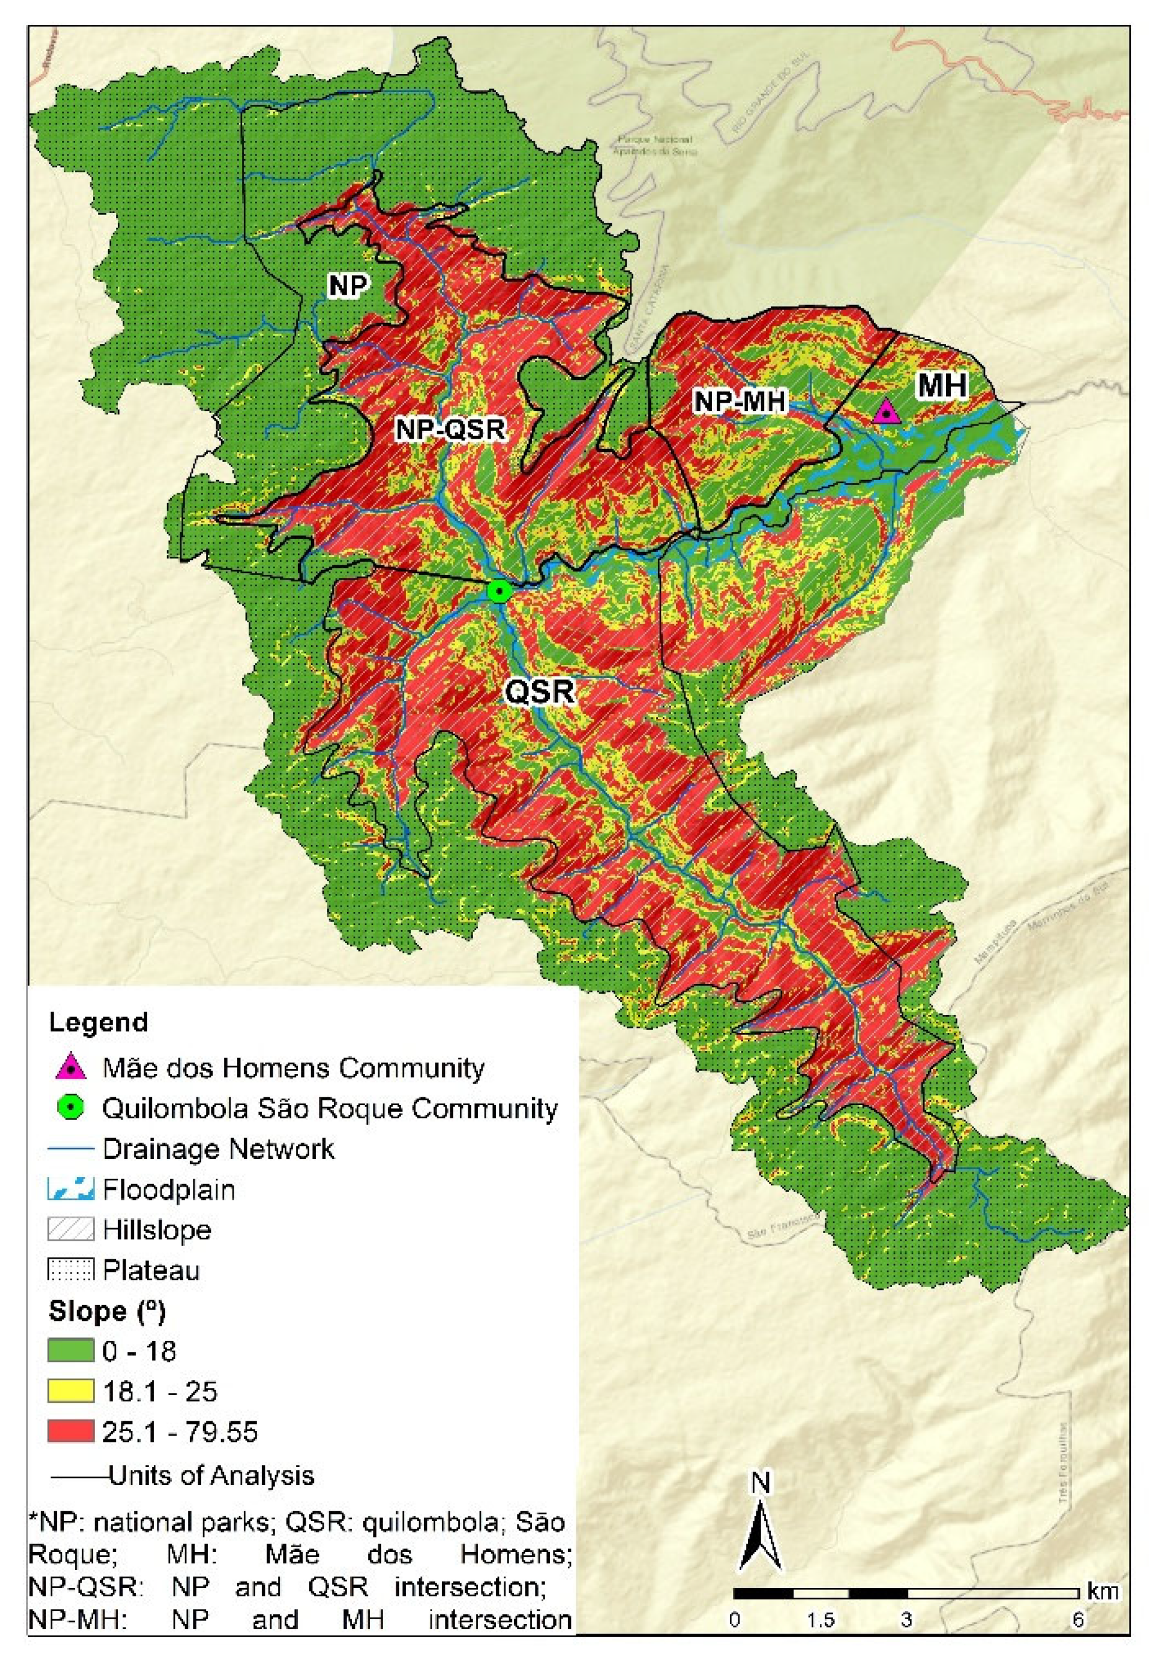
3.2. Geomorphological Characterization
3.3. Description of LULC
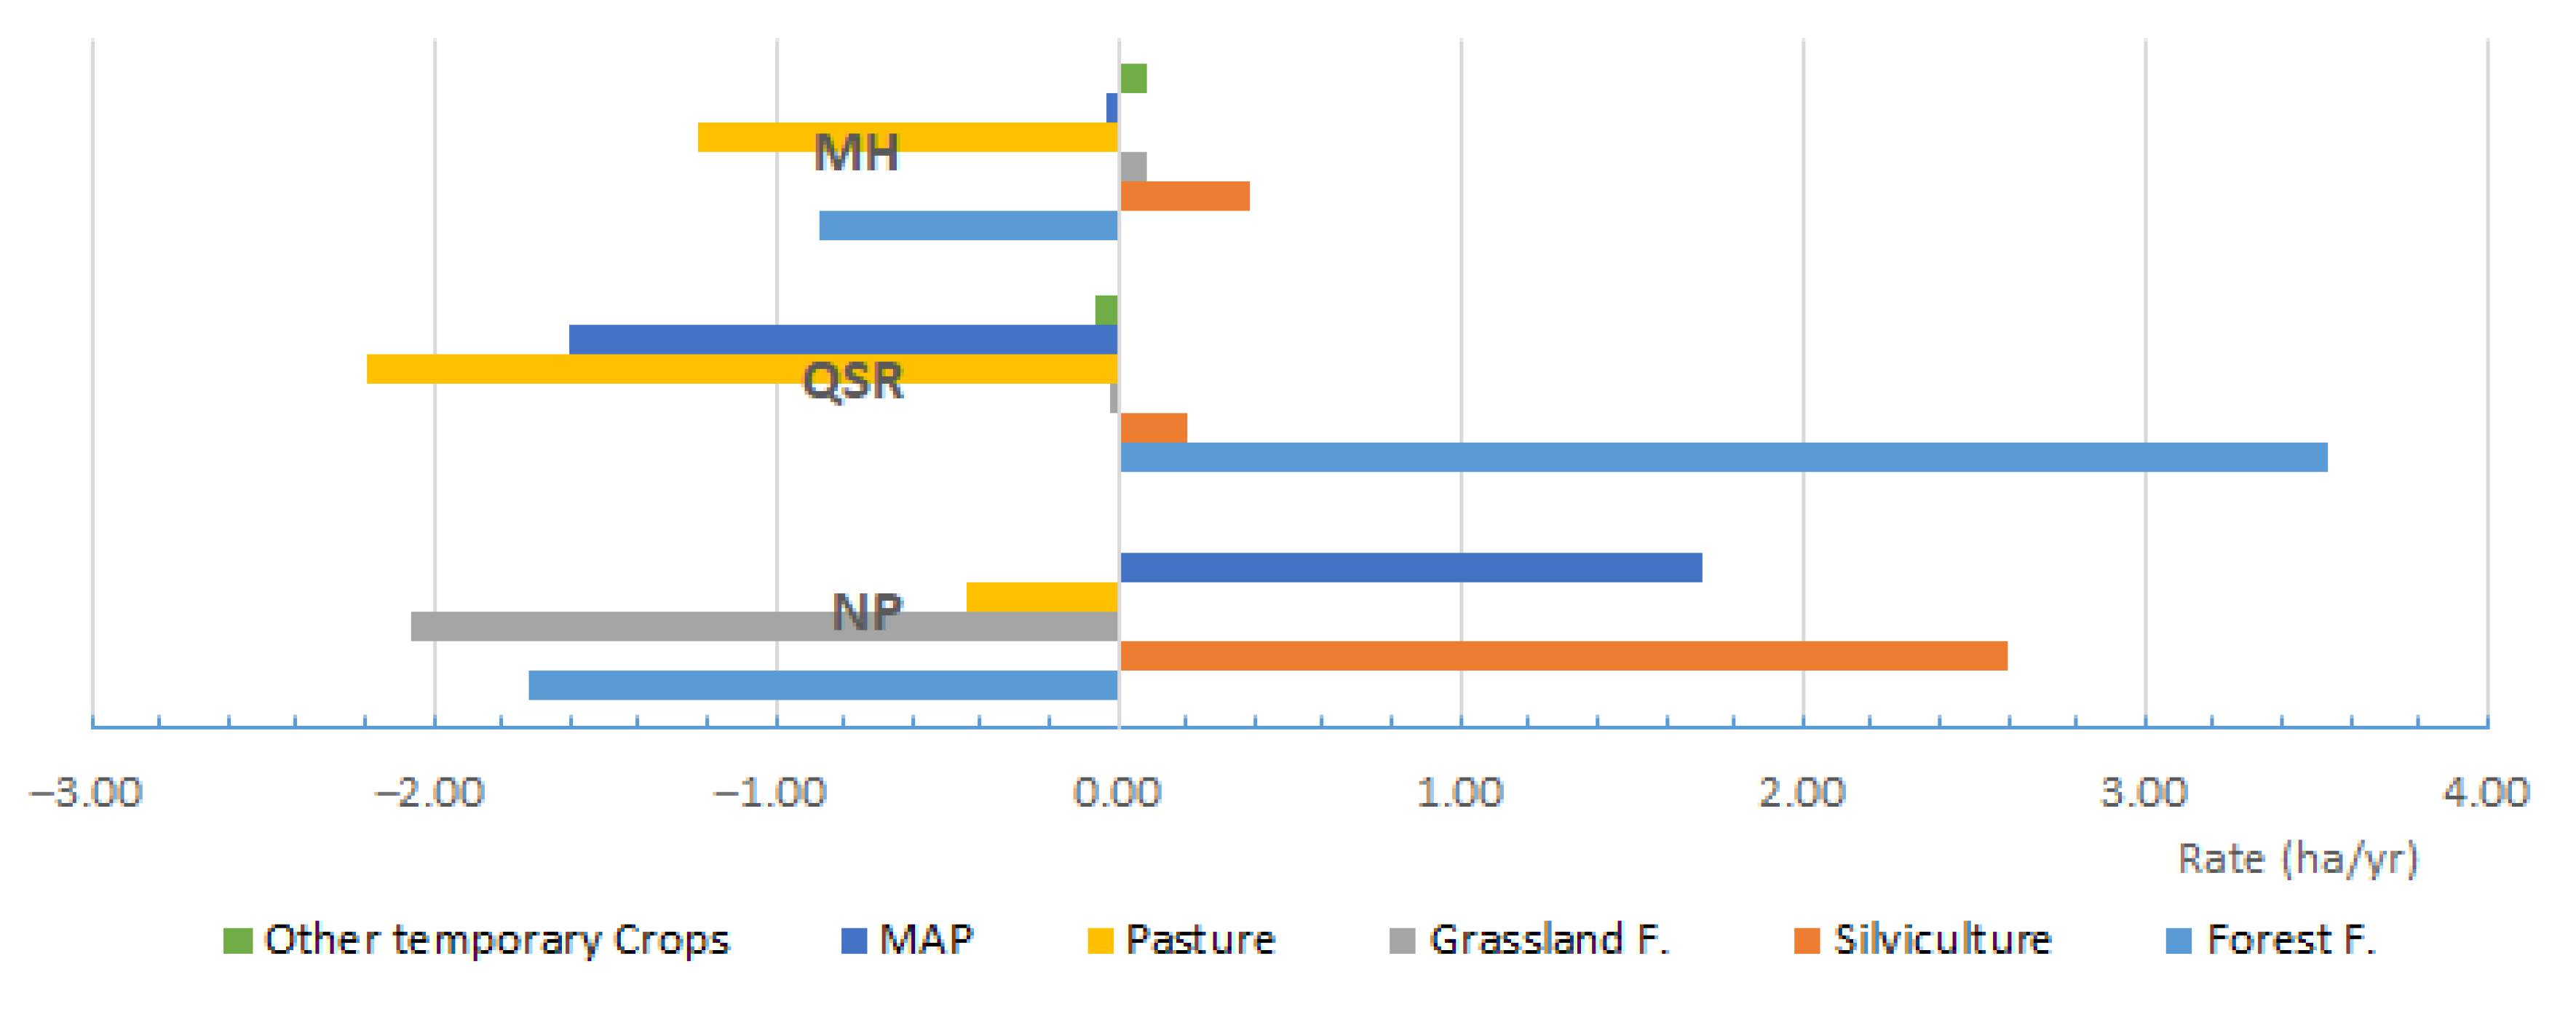
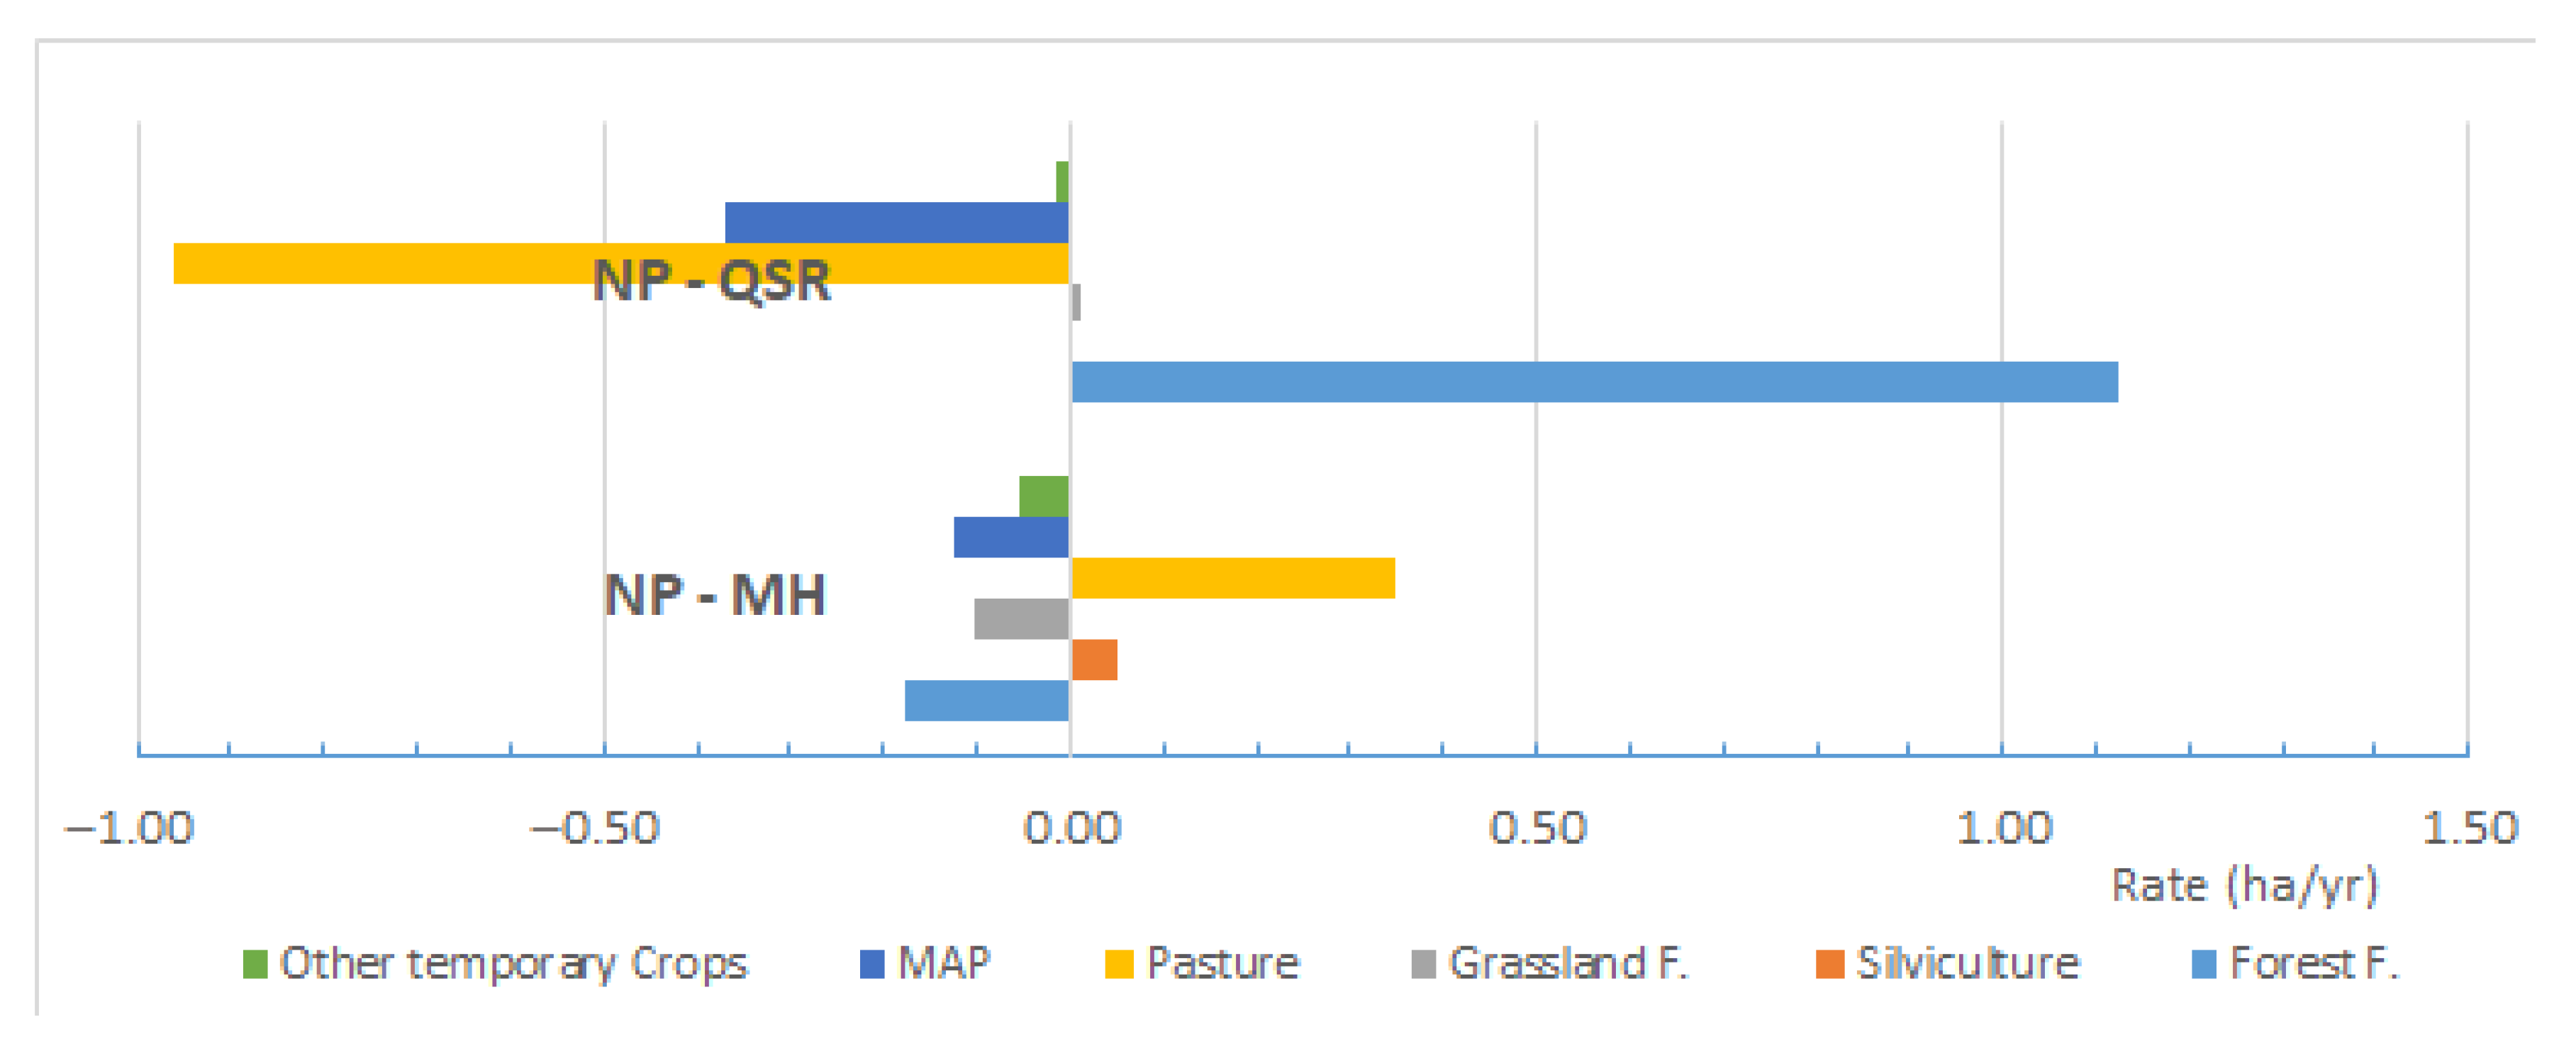
3.4. Estimation of LULC Variation
3.5. Statistical Analysis
3.5.1. Statistical Comparisons of LULC
3.5.2. Cluster Analysis
4. Results and Discussion
4.1. Sociogemorphological Characterization
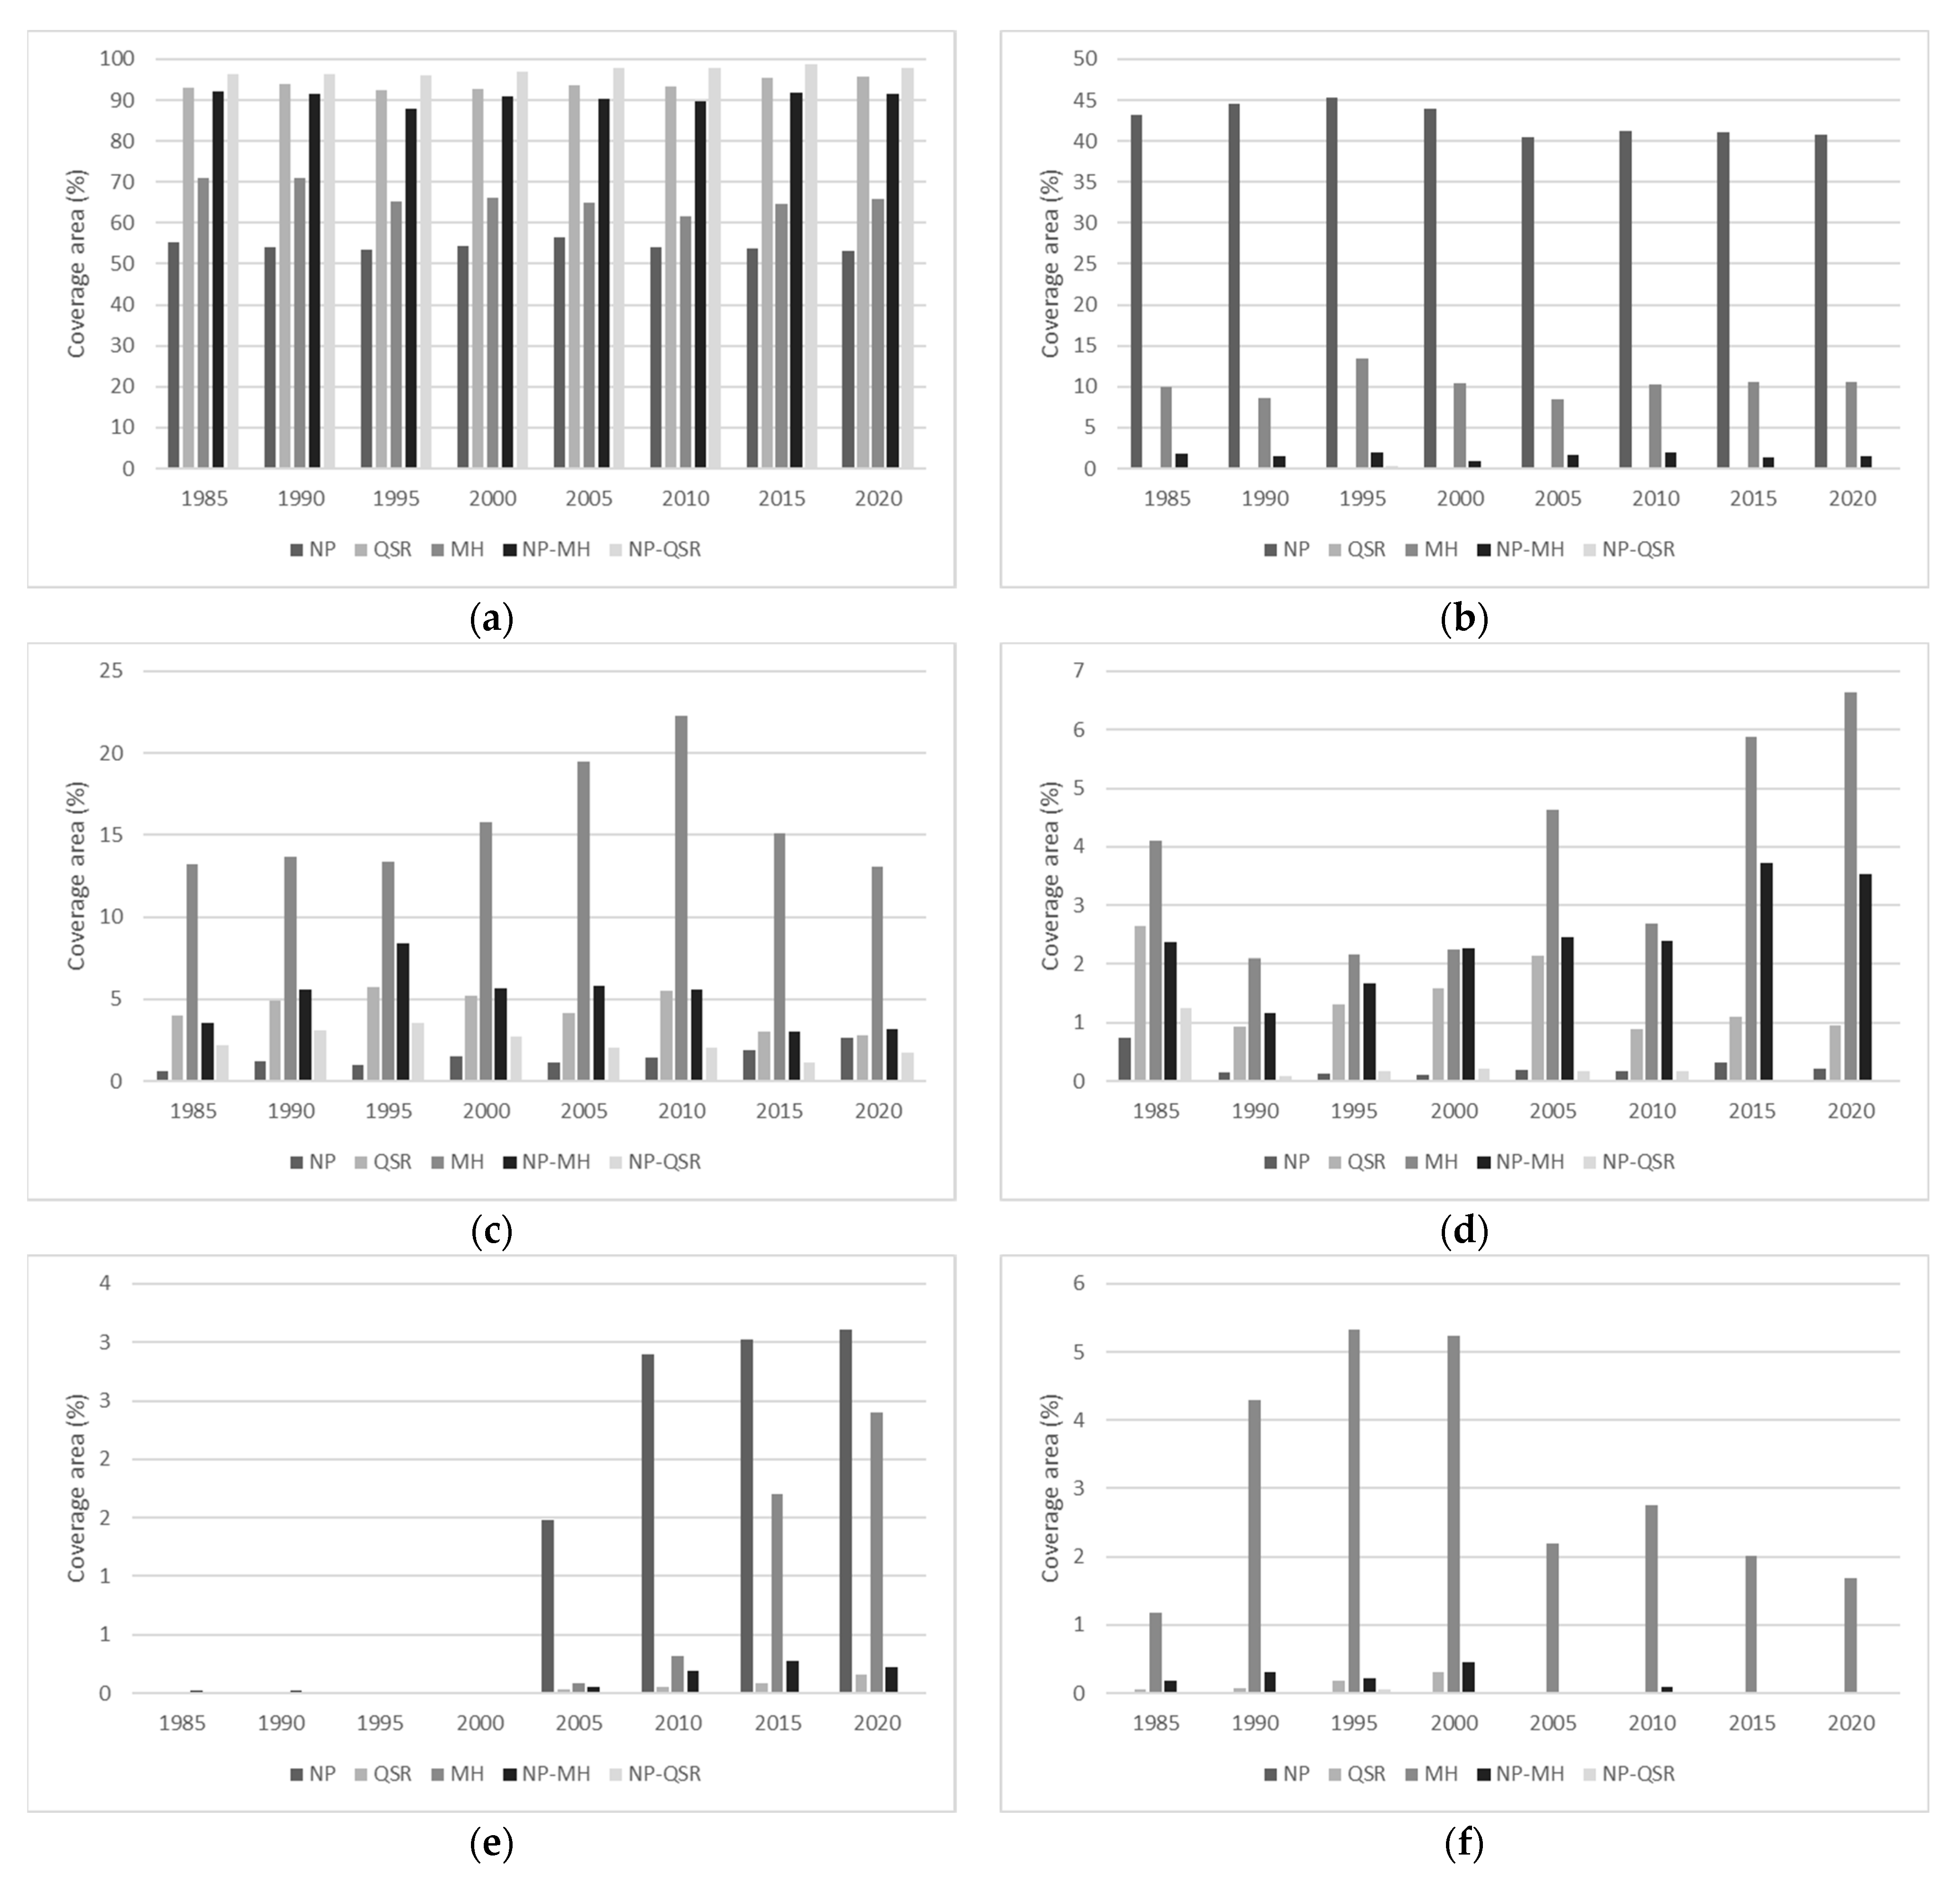
4.2. LULC Description and Variation
4.3. Statistical Analysis
4.3.1. Statistical Comparison of LULC
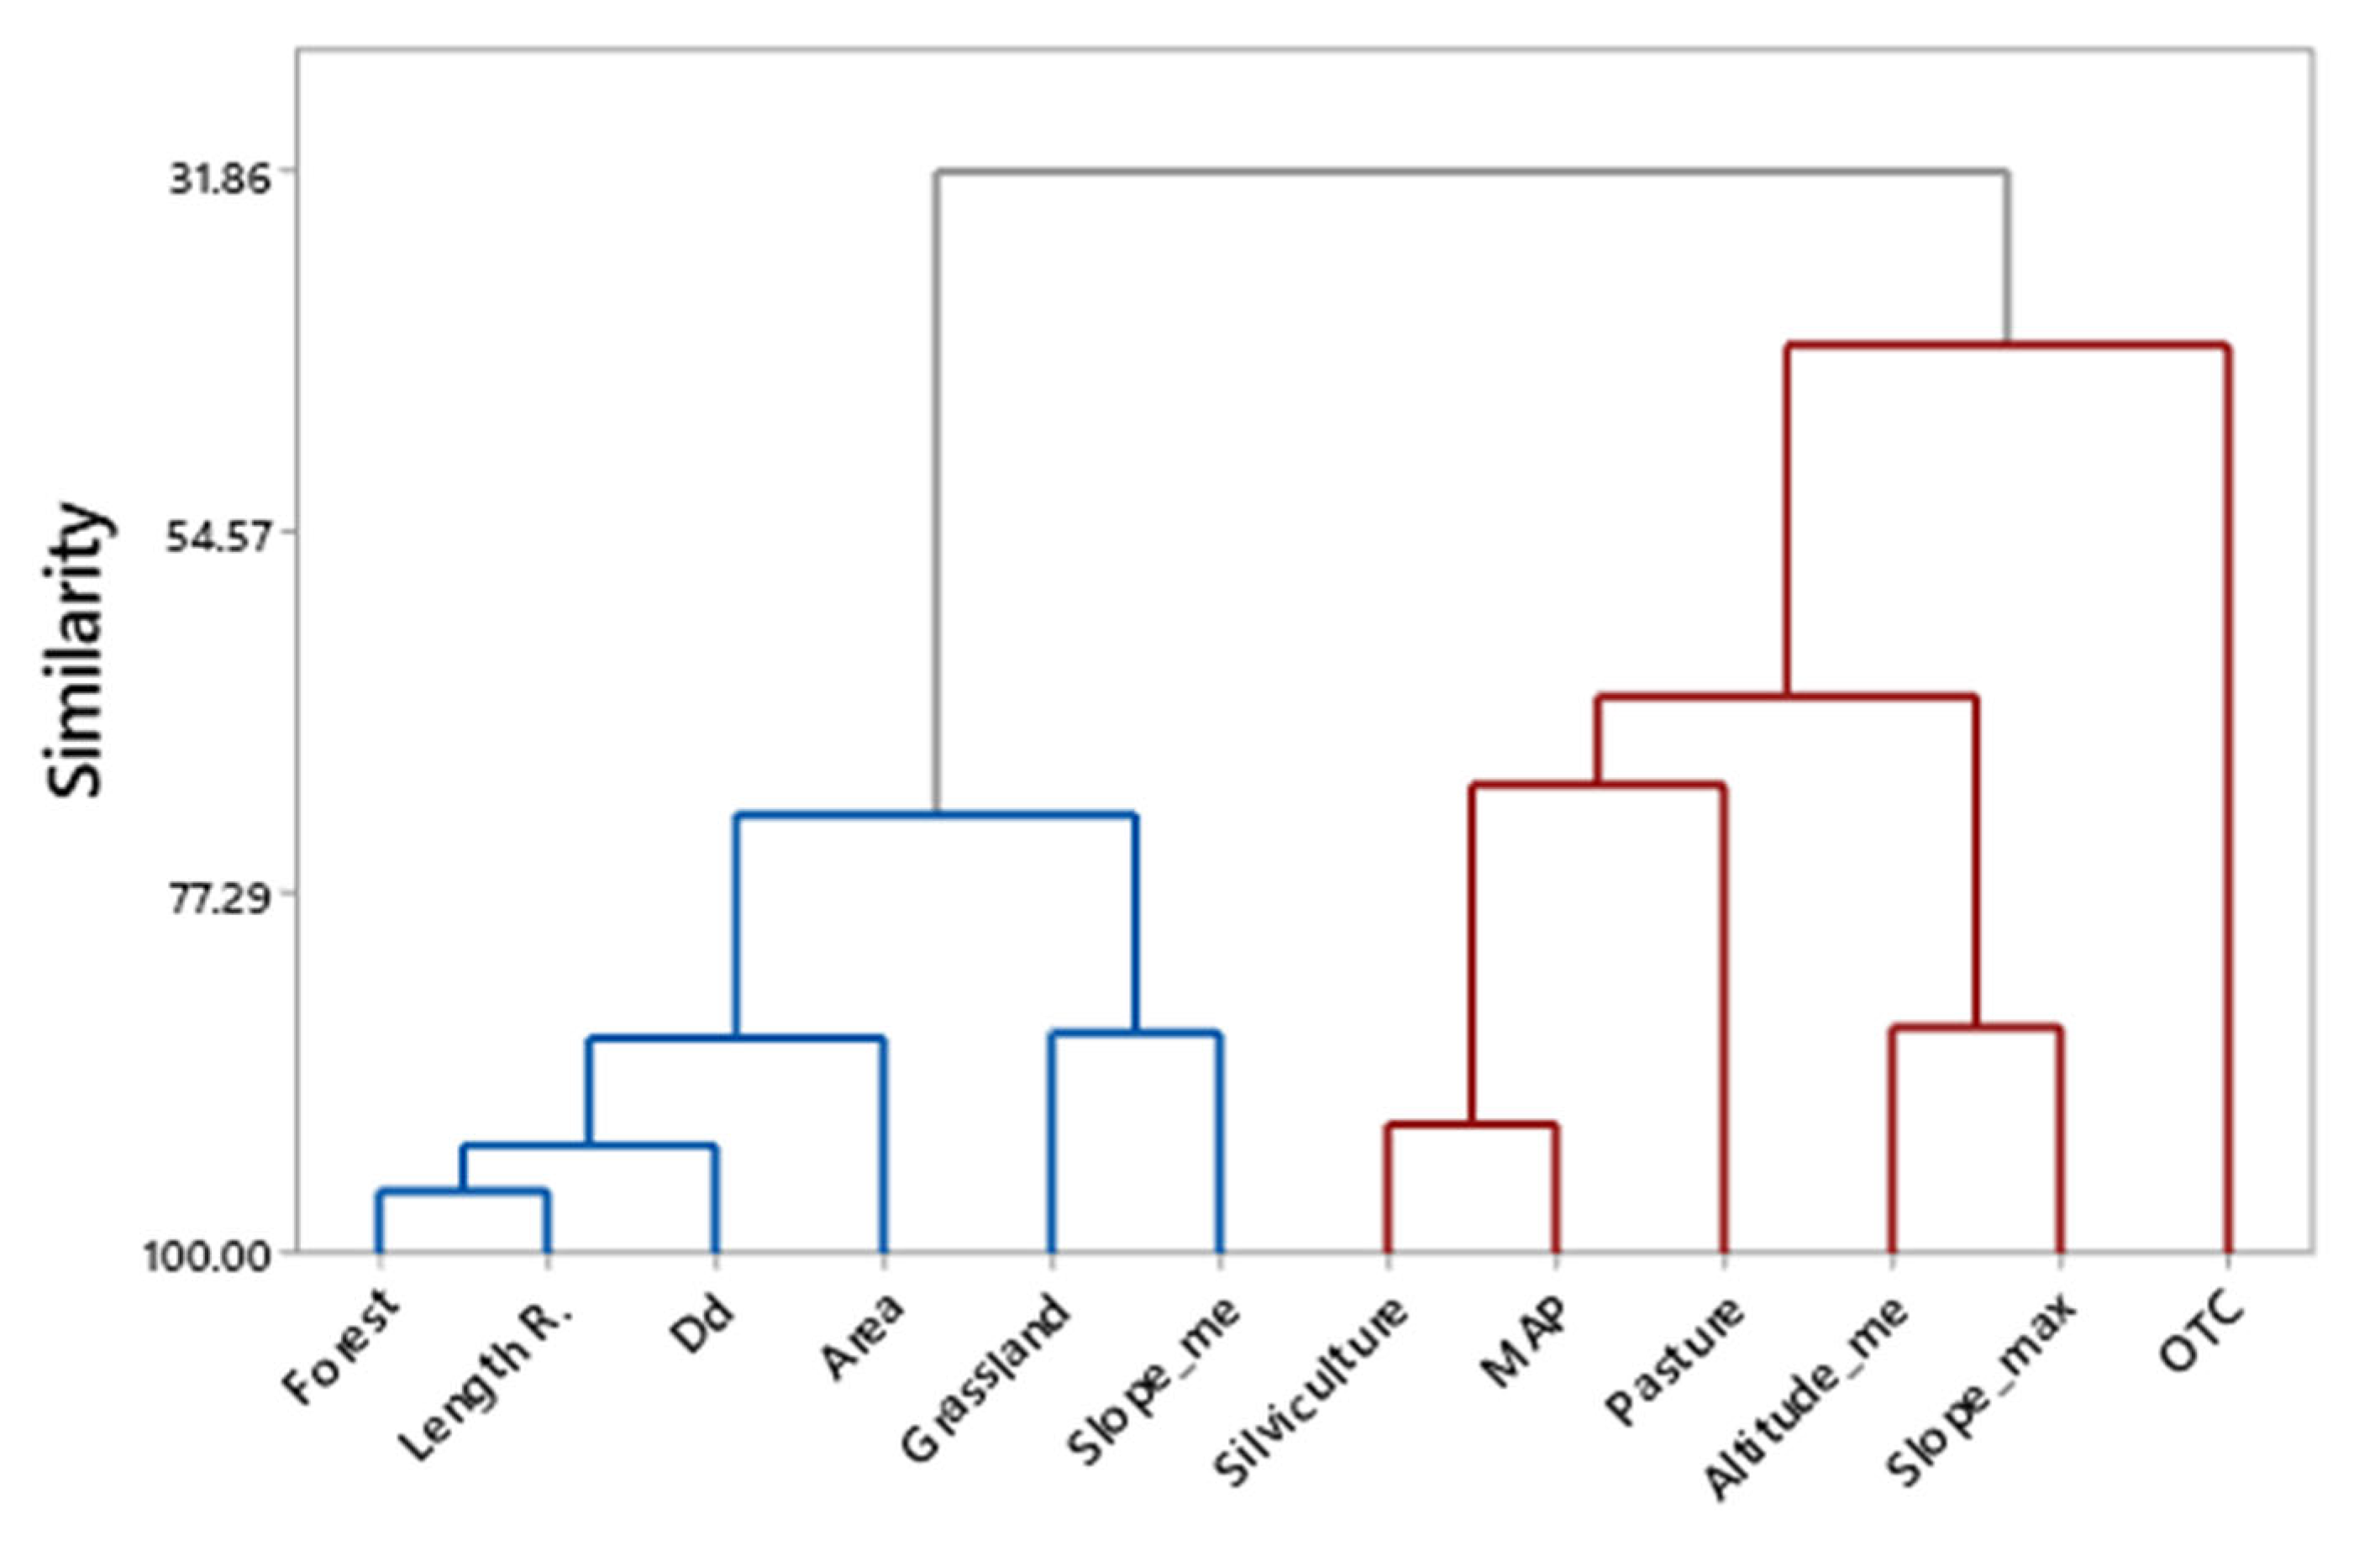
4.3.2. Cluster Analysis
5. Final Remarks
Supplementary Materials
Author Contributions
Funding
Institutional Review Board Statement
Informed Consent Statement
Data Availability Statement
Acknowledgments
Conflicts of Interest
References
- González-Ávila, I.; Kobiyama, M.; Goerl, R.F.; Paixão, M.; Menezes, D. Some Considerations on Sociogeomorphology and Its Importance in Integrated Management of Natural Resources. In Proceedings of the XXIV Brazilian Symposium on Water Resources, Belo Horizonte, Brazil, 21–26 November 2021; p. 10. [Google Scholar]
- Ashmore, P. Towards a Sociogeomorphology of Rivers. Geomorphology 2015, 251, 149–156. [Google Scholar] [CrossRef] [Green Version]
- Mould, S.; Fryirs, K.; Howitt, R. Sociogeomorphic River Recovery: Integrating Human and Physical Processes in Rehabilitation. In Proceedings of the Australian Stream Management Conference (9th: 2018), Hobart, Tasmania, 12–15 August 2018; p. 8. [Google Scholar]
- Mould, S.A.; Fryirs, K.; Howitt, R. Practicing Sociogeomorphology: Relationships and Dialog in River Research and Management. Soc. Nat. Resour. 2018, 31, 106–120. [Google Scholar] [CrossRef]
- Dunning, J.B.; Danielson, B.J.; Pulliam, H.R. Ecological Processes That Affect Populations in Complex Landscapes. Oikos 1992, 65, 169–175. [Google Scholar] [CrossRef] [Green Version]
- Antrop, M. Why Landscapes of the Past Are Important for the Future. Landsc. Urban Plan. 2005, 70, 21–34. [Google Scholar] [CrossRef]
- Tallis, H.; Kareiva, P. Ecosystem Services. Curr. Biol. 2005, 15, R746–R748. [Google Scholar] [CrossRef] [PubMed] [Green Version]
- Sreedhar, Y.; Nagaraju, A.; Murali Krishna, G. An Appraisal of Land Use/Land Cover Change Scenario of Tummalapalle, Cuddapah Region, India—A Remote Sensing and GIS Perspective. ARS 2016, 5, 232–245. [Google Scholar] [CrossRef] [Green Version]
- Nedd, R.; Light, K.; Owens, M.; James, N.; Johnson, E.; Anandhi, A. A Synthesis of Land Use/Land Cover Studies: Definitions, Classification Systems, Meta-Studies, Challenges and Knowledge Gaps on a Global Landscape. Land 2021, 10, 994. [Google Scholar] [CrossRef]
- Oliveira, C.V. De Análise de Mudanças da Cobertura e Uso Do Solo No Bioma Pampa com Matrizes de Transição. Master’s Thesis, Universidade Federal do Rio Grande do Sul, Porto Alegre, Brazil, 2020. [Google Scholar]
- Eguiguren, P.; Fischer, R.; Günter, S. Degradation of Ecosystem Services and Deforestation in Landscapes With and Without Incentive-Based Forest Conservation in the Ecuadorian Amazon. Forests 2019, 10, 442. [Google Scholar] [CrossRef] [Green Version]
- Kittipongvises, S.; Phetrak, A.; Rattanapun, P.; Brundiers, K.; Buizer, J.L.; Melnick, R. AHP-GIS Analysis for Flood Hazard Assessment of the Communities Nearby the World Heritage Site on Ayutthaya Island, Thailand. Int. J. Disaster Risk Reduct. 2020, 48, 101612. [Google Scholar] [CrossRef]
- Drummond, J.A.; Franco, J.L.; Oliveira, D. Uma análise sobre a história e a situação das unidades de conservação no Brasil. In Conservação da Biodiversidade: Legislação e Políticas Públicas; Edições Câmara, Câmara dos Deputados: Brasilia, Brazil, 2010; pp. 341–385. [Google Scholar]
- Fonseca, V.M.; Cara, R.N.B. Os parques nacionais da argentina e do brasil: Aspectos contemporâneos do uso público. An. Uso Público Unidades Conserv. 2021, 9, 19–40. [Google Scholar] [CrossRef]
- Mazur, K. River Re-Naturalization-a Nature-Based Solution for Climate Change in Urban Areas. IOP Conf. Ser. Mater. Sci. Eng. 2021, 1203, 022044. [Google Scholar] [CrossRef]
- Caballero, C.B.; Ruhoff, A. Relação entre temperatura de superfície e mudanças de uso e cobertura do solo em áreas do bioma Pampa e Mata Atlântica. In Proceedings of the XXIV Simpósio Brasileiro de Recursos Hidrícos, Belo Horizonte, Brasil, 21–26 November 2021; p. 10. [Google Scholar]
- Sposito, E.C. Uso e Cobertura do Solo na Bacia Hidrográfica do Rio Doce (MG/ES): Inter-Relações para a Governança. Ph.D. Thesis, Tese (Doutorado em Solos e Nutrição de Plantas). Universidade Federal de Viçosa, Viçosa, Brazil, 2021. [Google Scholar]
- Ramos, A.L.D.; Sartório, M.V.O.; Saldanha, M.C.; Coelho, A.L.N. Avaliação Visual de Rios Urbanos: Metodologia e Aplicação. Acta Geográfica 2017, 11, 159–184. [Google Scholar] [CrossRef]
- Coelho, A.L.N.; Ferreira, G.A.C.; Ferreira, G.L.; Goulart, A.C.O.; Mendoca, E.M.S. Sistema Fluvial Do Rio Jacaraípe, Serra, Espírito Santo: Proposta de Análise a Partir Do Geossistema e Da Sociogeomorfologia; Universidad Federal do Espiritu Santo: Vitória, Brazil, 2018. [Google Scholar]
- Brasil. regulamenta o procedimento para identificação, reconhecimento, delimitação, demarcação e titulação das terras ocupadas por remanescentes das comunidades dos quilombos. In Decreto No 4.887, de 20 de Novembro de 2003; Diário Oficial da União de 21/11/2003; p. 4, col. 2.
- UNDRR, U.N. for D.R.R. Sendai Framework for Disaster Risk Reduction 2015–2030; Japan, 2015. [Google Scholar]
- SEMA–Secretaría de Meio Ambiente e Infraestrutura. Diagnóstico Do Plano de Recurso Hídricos Da Bacia Hidrográfica Do Rio Mampituba; SEMA: Porto Alegre, Brazil, 2020; p. 219. [Google Scholar]
- Bohn, L. Expressões de Conhecimento de Grupos Sociais Locais para a Gestão de Recursos Hídricos Na Bacia Hidrográfica Do Rio Mampituba; Universidade Federal de Santa Catarina: Florianópolis, Brazil, 2008. [Google Scholar]
- Viero, A.C.; Silva, D.R.A.d. Geodiversidade Do Estado Do Rio Grande Do Sul; CPRM–Serviço Geológico do Brasil, Porto Alegre, Brazil. 2010. Available online: https://rigeo.cprm.gov.br/handle/doc/16774 (accessed on 18 September 2022).
- Waterman, T.; Wolff, J.; Wall, E. Landscape Citizenships; Routledge: Milton Park Abingdon, UK, 2021. [Google Scholar]
- Spaolonse, M.B. Desamparados nas grotas do estado: Os contratempos da sobreposição entre o território quilombola de São Roque e os parques nacionais de aparados da serra e da serra geral. RURIS-Rev. Cent. Estud. Rurais-UNICAMP 2013, 7, 24. [Google Scholar] [CrossRef]
- Lummertz, C.F. Memorial Histórico-Cultural Das Vilas e Comunidades Do Município de Praia Grande SC. In Projeto de Promoção e Estruturação Do Turismo Comunitário e de Valorização Dos Produtos Associados Ao Turismo No Entorno Dos Parques Nacionais de Apa-Rados Da Serra e Serra Geral; Praia Grande, Brazil, 2015. [Google Scholar]
- dos Santos Carmo, G.M.; da Silva, N.M.; Hernandez, A.R.C. O Território Invisível: Quilombo São Roque “Os Filhos da Pedra Branca”, Praia Grande, SC, Brasil. Rev. Gestão & Políticas Públicas 2018, 8, 297–315. [Google Scholar] [CrossRef]
- ASF Data Search. Available online: https://search.asf.alaska.edu/#/ (accessed on 1 November 2022).
- Ross, J.L.S. Relevo Brasileiro: Uma Nova Proposta de Classificação. Rev. Dep. Geogr. 1985, 4, 25–39. [Google Scholar] [CrossRef]
- Rebelo, V. A Importância Do Estudo Dos Riscos Geomorfológicos No Ordenamento Do Concelho de Vieira Do Minho. Master’s Thesis, Dissertação de mestrado em Gestão de Riscos Naturais; Faculdade de Letras da Universidade de Porto, Porto, Portugal, 2007. [Google Scholar]
- González-Ávila, I.; Paixão, M.A.; Kobiyama, M. Análise Geomorfométrica de Uma Bacia Montanhosa Com Presença de Cânion. Rev. Bras. Geomorfol. 2022, 23, 1947–1959. [Google Scholar] [CrossRef]
- Sidle, R.C.; Pearce, A.J.; O’Loughlin, C.L. Hillslope Stability and Land Use; American Geophysical Union: Washington, DC, USA, 1985; ISBN 978-0-87590-315-6. [Google Scholar]
- Souza, C.M.; Azevedo, T. MapBiomas General “Handbook”. Brazil. 2017. Available online: https://www.researchgate.net/publication/345239707_MapBiomas_General_Handbook (accessed on 18 September 2022).
- Mapbiomas Descrição da Coleção 6. Brazil. 2021. Available online: https://mapbiomas-br-site.s3.amazonaws.com/downloads/Colecction%206/Cod_Class_legenda_Col6_MapBiomas_BR.pdf (accessed on 18 September 2022).
- Mapbiomas Coleção 6 da Série Anual de Mapas de Cobertura e Uso de Solo Do Brasil; 2021.
- Jarman, A. Hierarchical Cluster Analysis: Comparison of Single Linkage, Complete Linkage, Average Linkage and Centroid Linkage Method; 2020. [Google Scholar]
- Wildner, W.; Orlandi Filho, V.; Giffoni, L.E. Itaimbezinho e Fortaleza, RS e SC-Magníficos Canyons Esculpidos Nas Escarpas Aparados Da Serra Do Planalto Vulcânico Da Bacia Do Paraná. Sítios Geológicos Paleontológicos Brasil. Publ. Internet 2006, 1, 2006. [Google Scholar]
- Campagnolo, K.; Mazzali, L.H.; Diaz, L.R.; Kobiyama, M. Aplicação da NBR 15505-2:2019 na Análise dos Trechos da Trilha do Rio do Boi, no Parque Nacional de Aparados da Serra, Sul do Brasil. Biodivers. Bras. -BioBrasil 2021, 11, 134–147. [Google Scholar] [CrossRef]
- Caballero, C.B.; de Menezes, D.; Campagnolo, K.; Censi, G.; Schwarz, H.; Kobiyama, M. Dimensão Fractal e análise geomorfológica de bacias hidrográficas brasileiras. Rev. Gestão Água América Lat. 2020, 17, 12. [Google Scholar] [CrossRef]
- Singh, S.; Kanhaiya, S.; Singh, A.; Chaubey, K. Drainage Network Characteristics of the Ghaghghar River Basin (GRB), Son Valley, India. Geol. Ecol. Landsc. 2019, 3, 159–167. [Google Scholar] [CrossRef] [Green Version]
- Costa, C.W.; Lorandi, R.; de Lollo, J.A.; Imani, M.; Dupas, F.A. Surface Runoff and Accelerated Erosion in a Peri-Urban Wellhead Area in Southeastern Brazil. Environ. Earth Sci. 2018, 77, 160. [Google Scholar] [CrossRef]
- de Faccio Carvalho Carvalho, P.C.; Batello, C. Access to Land, Livestock Production and Ecosystem Conservation in the Brazilian Campos Biome: The Natural Grasslands Dilemma. Livest. Sci. 2009, 120, 158–162. [Google Scholar] [CrossRef]
- de Oliveira, T.E.; de Freitas, D.S.; Gianezini, M.; Ruviaro, C.F.; Zago, D.; Mércio, T.Z.; Dias, E.A.; do Lampert, V.N.; Barcellos, J.O.J. Agricultural Land Use Change in the Brazilian Pampa Biome: The Reduction of Natural Grasslands. Land Use Policy 2017, 63, 394–400. [Google Scholar] [CrossRef]
- Custódio, A.V.; da Silva Lima, F.A. O direito fundamental à titulação de terras das comunidades remanescentes de quilombos no Brasil. Espaço Jurídico J. Law 2009, 10, 275–298. [Google Scholar]
- Benedetti, A.C.; dos Anjos, J.C.G. Conflitos envolvendo quilombolas no Rio Grande do Sul: Entre raça, classe e território. Rev. Praia Vermelha 2021, 31, 315–340. [Google Scholar]
- Brasil. Lei no 12.651, de 25 de Maio de 2012; Novo Código Florestal Brasileiro. Diario Oficial da União de 28/05/2012; 2012. [Google Scholar]
- Kenny, M.L. Making Heritage in Brazilian Quilombos. Antipod. Rev. Antropol. Arqueol. 2011, 12, 93–111. [Google Scholar] [CrossRef]
- Penna-Firme, R.; Brondízio, E.S. Quilombolas as “Green Collectives”: Contesting and Incorporating Environmentalism in the Atlantic Forest, Brazil. Ambient. Soc. 2017, 20, 139–158. [Google Scholar] [CrossRef] [Green Version]
- Pontee, N.; Narayan, S.; Beck, M.W.; Hosking, A.H. Nature-Based Solutions: Lessons from around the World. Proc. Inst. Civ. Eng. Marit. Eng. 2016, 169, 29–36. [Google Scholar] [CrossRef]


| Social Unit (SU) | Geomorphological Unit (GU) | Sociogeomorphological Unit (SGU) |
|---|---|---|
| SU1 | GU1 | SGU1 |
| GU2 | SGU2 | |
| GU3 | SGU3 | |
| SU2 | GU2 | SGU4 |
| GU4 | SGU5 | |
| SU3 | GU4 | SGU6 |
| Community | Quilombola São Roque | Mãe dos Homens |
|---|---|---|
| Type | Traditional | Non-traditional |
| Start of Occupation | About 1800 1 | 1840~1900 2 |
| Ancestors | Enslaved Africans | European immigrant families |
| Social Organization | • Grota system (“Grota” local name to cave). Organizational system. • Social Association formed in 2003 • Around 30 families | Community |
| Delimited area | 73.28 km2 | No |
| Economy | Agriculture | • Agriculture •Livestock •Logging |
| Natural Disasters | Floods (1974, 1995, 2006) Storms | Flood (1974) Storms |
| Fluvial network | • Josafaz creek • São Gorgonho creek • Mampituba River | • Mampituba River • Facão River |
| Geoform and relief | • Pedra Branca mountain • Cliffs • Canyons | • Flood Plain • Wavy Relief |
| N° | Class | Description |
|---|---|---|
| 1 | Forest kFormation | Woody vegetation with arboreal or arboreal-shrub species, with a predominance of continuous canopy. It includes the following forest typologies: ombrophilous, deciduous, and semideciduous, and part of the pioneer formations. |
| 2 | Silviculture | Tree species planted for commercial purposes (e.g., pines, Eucalyptus) |
| 3 | Grassland Formation | Vegetation with a predominance of grassy herbaceous strata, with the presence of herbaceous and subshrubby dicotyledons. In most cases, it corresponds to native vegetation, but patches of invasive exotic vegetation or the use of forage (planted pasture) or livestock may be present. Local name is “Campos de Altitude” |
| 4 | Pasture | Pasture area, predominantly planted, linked to agricultural activity. |
| 5 | Mosaics of Agriculture and Pasture (MAP) | Areas of agricultural use where it was impossible to distinguish between pasture and agriculture. It may include cropland, winter or summer pasture, and horticulture. It includes rest areas between agricultural crops (fallow). |
| 6 | Other Temporary Crops (OTC) | Areas occupied with short- or medium-term crops, generally with a vegetative cycle of less than one year, that need to be planted again to produce after harvesting. |
| Units of Analysis | Units of Analysis Type | Area (km2) | Maximum (°) | Average (°) | Average Slope Description | Standard Deviation | Coefficient of Variation (%) |
|---|---|---|---|---|---|---|---|
| Basin | - | 193.4 | 79.55 | 17.95 | Medium | 13.41 | 74.71 |
| Plateau (P) | GU | 91.65 | 50.7 | 8.33 | Low | 5.8 | 69.63 |
| Hillslope (H) | GU | 93.95 | 79.55 | 28.26 | High | 11.56 | 40.91 |
| Floodplain (F) | GU | 7.8 | 35.84 | 9.62 | Low | 6.25 | 64.97 |
| NP | SU | 29.28 | 76.6 | 8.57 | Low | 7.91 | 92.30 |
| QSR | SU | 45.55 | 76 | 28.06 | High | 12.15 | 43.30 |
| MH | SU | 5.85 | 43.38 | 14.02 | Low | 8.42 | 60.06 |
| NP-QSR | SU | 27.7 | 79.55 | 28.87 | High | 12.5 | 43.30 |
| NP-MH | SU | 10.64 | 77.75 | 23.36 | Medium | 10.44 | 44.69 |
| Unclassified | SU | 59.6 | - | - | - | - | - |
| NP-P | SGU | 27.29 | 36.35 | 7.25 | Low | 5.16 | 71.17 |
| NP-H | SGU | 1.63 | 76.6 | 31.27 | High | 10.42 | 33.32 |
| NP-F | SGU | - | - | - | - | - | - |
| QSR-P | SGU | 3.29 | 39.06 | 13.64 | Low | 6.75 | 49.49 |
| QSR-H | SGU | 40.71 | 76 | 29.79 | High | 11.27 | 37.83 |
| QSR-F | SGU | 1.55 | 35.84 | 10.83 | Low | 5.92 | 54.66 |
| MH-P | SGU | - | - | - | - | - | - |
| MH-H | SGU | 3.08 | 43.38 | 18.85 | Medium | 7.23 | 38.36 |
| MH-F | SGU | 2.77 | 26.88 | 8.69 | Low | 6.08 | 69.97 |
| NP-QSR-P | SGU | 1.74 | 41.61 | 14.3 | Low | 6.95 | 48.60 |
| NP-QSR-H | SGU | 25.37 | 79.55 | 30.61 | High | 11.9 | 38.88 |
| NP-QSR-F | SGU | 0.59 | 26.63 | 10.45 | Low | 5.87 | 56.17 |
| NP-MH-P | SGU | 0.39 | 30.97 | 9.89 | Low | 6.41 | 64.81 |
| NP-MH-H | SGU | 9.98 | 77.75 | 24.08 | Medium | 10.15 | 42.15 |
| NP-MH-F | SGU | 0.26 | 25.17 | 14.34 | Low | 5.3 | 36.96 |
| Units of Analysis | Area (km2) | Length (km) | Dd (km/km2) |
|---|---|---|---|
| NP | 29.28 | 14.33 | 0.49 |
| QSR | 45.55 | 73.97 | 1.62 |
| MH | 5.85 | 5.78 | 0.98 |
| NP-QSR | 27.70 | 33.44 | 1.21 |
| NP-MH | 10.64 | 4.89 | 0.46 |
| NP-P | 27.29 | 13.29 | 0.49 |
| NP-H | 1.63 | 1.00 | 0.61 |
| QSR-P | 3.29 | 3.50 | 1.06 |
| QSR-H | 40.71 | 42.63 | 1.05 |
| QSR-F | 1.55 | 7.62 | 4.92 |
| MH-H* | 3.08 | - | - |
| MH-F | 2.77 | 9.78 | 3.53 |
| NP-QSR-P | 1.74 | 1.99 | 1.14 |
| NP-QSR-H | 25.37 | 25.87 | 1.02 |
| NP-QSR-F | 0.59 | 3.68 | 6.24 |
| NP-MH-P * | 0.39 | - | - |
| NP-MH-H | 9.98 | 3.32 | 0.33 |
| NP-MH-F | 0.26 | 1.44 | 5.54 |
| Social Unit | LULC Description | p-Value |
|---|---|---|
| NP | MAP—Silviculture | 0.791 |
| Pasture—Silviculture | 1.000 | |
| QSR | Grassland—Silviculture | 0.957 |
| Grassland—Other temporary crops | 0.561 | |
| Silviculture—Other temporary crops | 0.419 | |
| MH | Pasture—Other temporary crops | 0.372 |
| NP-QSR | Grassland—Pasture | 0.226 |
| NP-MH | Silviculture—Other temporary crops | 0.790 |
| Group | Variables | Correlation | p-Value | |
|---|---|---|---|---|
| A | Forest | Li | 0.922 | 0.026 |
| A | Forest | Dd | 0.867 | 0.057 |
| A | Forest | Slope_m | 0.842 | 0.074 |
| A | Length | Dd | 0.860 | 0.061 |
| B | Silviculture | MAP | 0.837 | 0.077 |
| B | Other temporary crops (OTC) | Slope_max | −0.874 | 0.053 |
Disclaimer/Publisher’s Note: The statements, opinions and data contained in all publications are solely those of the individual author(s) and contributor(s) and not of MDPI and/or the editor(s). MDPI and/or the editor(s) disclaim responsibility for any injury to people or property resulting from any ideas, methods, instructions or products referred to in the content. |
© 2023 by the authors. Licensee MDPI, Basel, Switzerland. This article is an open access article distributed under the terms and conditions of the Creative Commons Attribution (CC BY) license (https://creativecommons.org/licenses/by/4.0/).
Share and Cite
González-Ávila, I.; Jato-Espino, D.; Paixão, M.A.; Carvalho, M.M.; Kobiyama, M. Sociogeomorphological Analysis in a Headwater Basin in Southern Brazil with Emphasis on Land Use and Land Cover Change. Land 2023, 12, 306. https://doi.org/10.3390/land12020306
González-Ávila I, Jato-Espino D, Paixão MA, Carvalho MM, Kobiyama M. Sociogeomorphological Analysis in a Headwater Basin in Southern Brazil with Emphasis on Land Use and Land Cover Change. Land. 2023; 12(2):306. https://doi.org/10.3390/land12020306
Chicago/Turabian StyleGonzález-Ávila, Itzayana, Daniel Jato-Espino, Mauricio Andrades Paixão, Michele Moraes Carvalho, and Masato Kobiyama. 2023. "Sociogeomorphological Analysis in a Headwater Basin in Southern Brazil with Emphasis on Land Use and Land Cover Change" Land 12, no. 2: 306. https://doi.org/10.3390/land12020306