Article

Spatiotemporal Evolution and Optimization of Landscape Patterns Based on the Ecological Restoration of Territorial Space

1
College of Water Resources and Architectural Engineering, Tarim University, Alaer 843300, China
2
Institute of Urban Planning and Design, Zhejiang University, Hangzhou 310058, China
3
Urban and Rural Planning Research Center, Qujiang Branch of Quzhou Natural Resources and Planning Bureau, Quzhou 324022, China
*
Author to whom correspondence should be addressed.
Land 2022, 11(12), 2114; https://doi.org/10.3390/land11122114
Submission received: 30 October 2022 / Revised: 15 November 2022 / Accepted: 16 November 2022 / Published: 23 November 2022
(This article belongs to the Special Issue Feature Papers for Landscape Ecology Section)

Abstract

:
The ecological restoration of territorial space emphasizes the synergy between ecology and social development. On this basis, we used landscape index analysis methods to explore the spatiotemporal evolution of landscape patterns in urban areas on a district scale. Then, we used multiple regression analysis to explore the driving factors behind this evolution. The results showed the following: (1) Landscape compositions have changed significantly. The growth rate of construction land in the main districts was about three times that in the urban area. (2) There were differences in the characteristics of landscape pattern evolution. Arable land is becoming more fragmented as construction land expands outward. The shapes of public green spaces, arable land, and woodlands tend to be simple and regular. The degree of both urban sprawl and agglomeration decreased in the urban area and the main districts. Meanwhile, landscape separation first decreased and then increased, and landscape diversity increased. (3) Population growth, industrial development, changes in industrial structure, and real estate development are the main driving factors of landscape pattern evolution. Based on this, this study puts forward some suggestions for landscape pattern optimization, which is significant for ecological restoration planning and promotion.

1. Introduction

Urbanization is an inevitable trend of global socio-economic development, as cities are regarded as the future of mankind [1]. The impact of human activities on territorial space is profound. Some scholars have noted that the quality of energy tends to degrade irreversibly. It can be presumed that each successive transformation of land by humans exacerbates environmental imbalances [2,3]. The development mode in the past has caused many environmental problems, spatially manifested by the encroachment of living or production spaces into natural spaces [4], with the temporal trend of landscape fragmentation, woodland degradation, and a decline in habitat quality [5,6,7]. The disorderly exploitation of natural spaces not only restricts sustainable economic development [8,9], but also causes serious negative effects on people’s health [7,10]. With ongoing urban development, the boundaries of ecology, production, and living space are becoming increasingly blurred. China has attached great importance to solving ecological problems. The 12th Five-Year Plan called for greater efforts toward environmental protection, and the 13th Five-Year Plan accelerated the comprehensive management of the ecological environment. The 14th Five-Year Plan proposed the construction of a new array of high-quality territorial spaces, which was aimed at the efficient use of land and the need to achieve high-quality spatial development. Therefore, coordinating urban development and ecological protection has become the core issue of global sustainable development research [11].
Spatial ecological restoration is one of the most important aspects of ecological construction. It is mainly undertaken through the optimization of land space structures and ecological reconstruction to repair dysfunctional or damaged ecosystems, allowing them to achieve self-regulation, succession, and renewal [12,13], so that such systems can reach an optimal state [14,15]. Ecological restoration has gradually received widespread attention from the public and governments. The Convention on Biological Diversity proposed the rebuilding and restoration of degraded ecosystems through on-site conservation. Australia has successfully restored red willow eucalyptus ecosystems in abandoned bauxite mines [16]. Existing studies on ecological restoration have focused on single ecological elements such as rivers, lakes [17], woodlands, or vegetation [18]. However, high-quality ecological restoration emphasizes the internal adjustment and evolution of all the landscape elements, i.e., “mountains, water, woodlands, lakes, green, and residence”. Some scholars have also proposed strategies for land consolidation and ecological restoration transformation. Wang et al. emphasized systematic thinking, upgrades to theories, strengthening technology support, and improving mechanisms [19]. Gong et al. analyzed the transformation which occurs through ecological restoration in terms of planning ideas, objectives, nature, and pathways based on the human-earth system coupling framework [20]. Pang et al. emphasized the construction of sustainable land ecological restoration patterns and zoning schemes [21] to promote the integrated restoration and management of landscapes [22].
The effect of ecological restoration is a comprehensive representation of human social activities and natural ecological spaces whereby the restoration object is essentially the landscape [23]. Restoration initiatives have come to incorporate the multi-objective coordination of societies, economies, and ecology, rather than just governments. Landscape patterns integrate the features of landscape spatial structures, as well as their spatial distribution, and service capacity [24], which can effectively reflect the relationship between ecological construction and social development. Changes in urban land use landscape patterns are important indicators of the relationship between the social economic system and the natural ecosystem [25]. Many scholars have applied the theories and methods of landscape ecology to ecological restoration practices, such as natural resource planning, utilization, and protection, and have achieved some significant gains [26]. Li et al. found a close relationship between urban landscape patterns and ecological land evolution [27]. Chen et al. argued that it is urgent to solve the ecological and environmental problems caused by the evolution of landscape patterns [28]. Dong et al. analyzed the landscape spatial pattern and ecological process of the Dahei River and proposed a landscape structure and planning layout for the governance of that ecosystem [29]. Wang et al. obtained the landscape pattern index of Changling village through an ecological landscape evaluation and put forward suggestions for its ecological restoration [30]. Wu et al. divided an ecological restoration area and proposed an approach for the restoration of the landscape pattern evolution characteristics [31]. Peng et al. proposed the research path of “pattern and process coupling-spatial and temporal scale-ecosystem services-landscape sustainability” in landscape ecology, providing theoretical support for ecological restoration in spatial ecological restoration planning [23]. Traditional landscape pattern evolution studies have focused on landscape evolution itself, and therefore, have lacked a connection with ecological restoration. Secondly, traditional ecological restoration has mostly focused on small-scale ecosystems, making it poorly suited to the multi-scale and multi-functional collaborative optimal development of territorial space.
Studies have shown that landscape patterns are important guides for the ecological restoration of territorial space [32]. Landscape patterns refer to the spatial patterns of landscapes, i.e., the spatial distribution and combination of spatial units (patches) of different sizes, shapes, quantities, and attributes. They are also the specific expression of the degree of spatial variation in an ecosystem or in its system attributes [33]. The evolution of landscape patterns affects ecosystem functions, and landscape fragmentation reduces the value of ecosystem services [34,35]. Identifying severely degraded ecological spaces based on landscape pattern evolution characteristics can help promote the quality of ecological restoration [23] and strengthen ecosystem network construction [17]. In order to identify the inherent characteristics and value of territorial space, Wang et al. proposed incorporating landscape character assessment into territorial space planning from a macroscopic perspective, which became a basis for coupling landscape patterns and territorial ecological restoration [36]. Meanwhile, the evolution of territorial landscape patterns is influenced by many driving forces, such as human activities, economic development, and land use transformations. To restore the efficiency and intensity of territorial spatial patterns, it is necessary to explore the landscape pattern evolution and driving factors during urbanization, grasp the evolution rules, and identify the spatial characteristics in order to provide a scientific reference for the ecological restoration of territorial space.
From 2000 to 2020, the social economy and population in Hangzhou, China, grew rapidly. With the continuous expansion of urban construction land, the landscape pattern underwent profound changes. From 1996 to 2006, the dominant landscape in Hangzhou changed from agricultural to artificial [37,38]. Since 2010, Hangzhou has developed more rapidly, with eight main districts having the fastest growth of construction land and the highest population density, which are typical areas of urbanization development. ENVI, GIS, and landscape pattern analysis methods were used to analyze the spatiotemporal evolution characteristics and variability of land use patterns in Hangzhou and its major urban areas from 2000 to 2020. Combined with social and economic factors, we used SPSS multiple regression to explore the driving factors of landscape pattern evolution. Theoretically, we can identify degraded landscapes according to the features of landscape pattern evolution. We can also coordinate social-ecological needs and determine restoration goals based on landscape versatility trade-offs. We propose integrating landscape pattern studies into ecological restoration as an important contribution and also put forward some optimization strategies to restore harmonious territorial spatial patterns.

2. Data and Methods

2.1. Data Processing

Hangzhou is located in the south of the Yangtze River Delta, with complex and diverse topography. The western part has a hilly terrain, while the eastern part belongs to the northern Zhejiang plain. The terrain is low and flat, the river network is dense, and it has a natural environment of intermingling rivers, lakes, and mountains. In this paper, urban areas and eight main districts in Hangzhou were selected as the study areas. The main districts are Shangcheng, Xihu, Gongshu, Binjiang, Yuhang, Xiaoshan, Linping, and Qiantang Districts.
The land cover data were obtained from GlobeLand30 global land cover data of the National Geographic Information Resources Catalogue Service System and 30 × 30 m Landsat 8.0 remote sensing images from the cloud-based Geospatial Information Services. ENVI 5.2 software (the flagship product of Exelis Visual Information Solutions in the United States) was used for radiometric calibration and atmospheric correction of remote sensing data and combined with land use and land cover data for correction and calibration. We classified the landscape types into six categories: arable land, woodlands, wetland, water, public green spaces, and construction land. We evaluated the accuracy of the classified images, and the total accuracy was higher than the required minimum. Finally, the images were imported into ArcGIS to construct a GIS database of land use landscape patterns (Figure 1). Socioeconomic and demographic data were from the Hangzhou Statistical Yearbook.

2.2. Methods

2.2.1. Methods of Measuring Land Use Landscape Patterns

The landscape index is the most widely used method to measure the spatial structure and evolution characteristics of the landscape. It is a quantitative indicator that quantifies the structural composition and spatial evolution and condenses spatial pattern characteristics at the patch and landscape levels [39]. To explore typical landscape features with guiding significance for the ecological restoration of territorial space, factors such as landscape area advantage, fragmentation, separation, connectivity, and diversity were considered [14,28,38,40]. A total of nine indexes were selected in this study to establish the index system: at the patch level they were percent of landscape (PLAND), largest patch index (LPI), patch density (PD), edge density (ED), and landscape shape index (LSI), and at the landscape level they were aggregation index (AI), contagion index (CONTAG), landscape division index (DIVISION), and Shannon diversity index (SHDI) (Table 1). We chose Fragstats 4.2 software to calculate the landscape index, which was developed by Oregon State University in the United States for landscape pattern analysis.

2.2.2. Methods of Exploring the Driving Factors

The main driving factors of landscape pattern evolution are natural and human [41]. The driving factors for urban and ecological landscapes are different. In urban landscapes, humans become the direct driving force, based on multiple factors such as social, economic, and policy [42]. In previous studies, scholars used multiple regression [43,44], enhanced regression trees [45], CAA analysis [37], and other methods to analyze the driving factors of landscape pattern evolution. In this study, we considered that landscape pattern evolution is associated with multiple factors, so we combined multiple independent variables to predict or estimate the dependent variable in order to improve the analysis.

3. Results

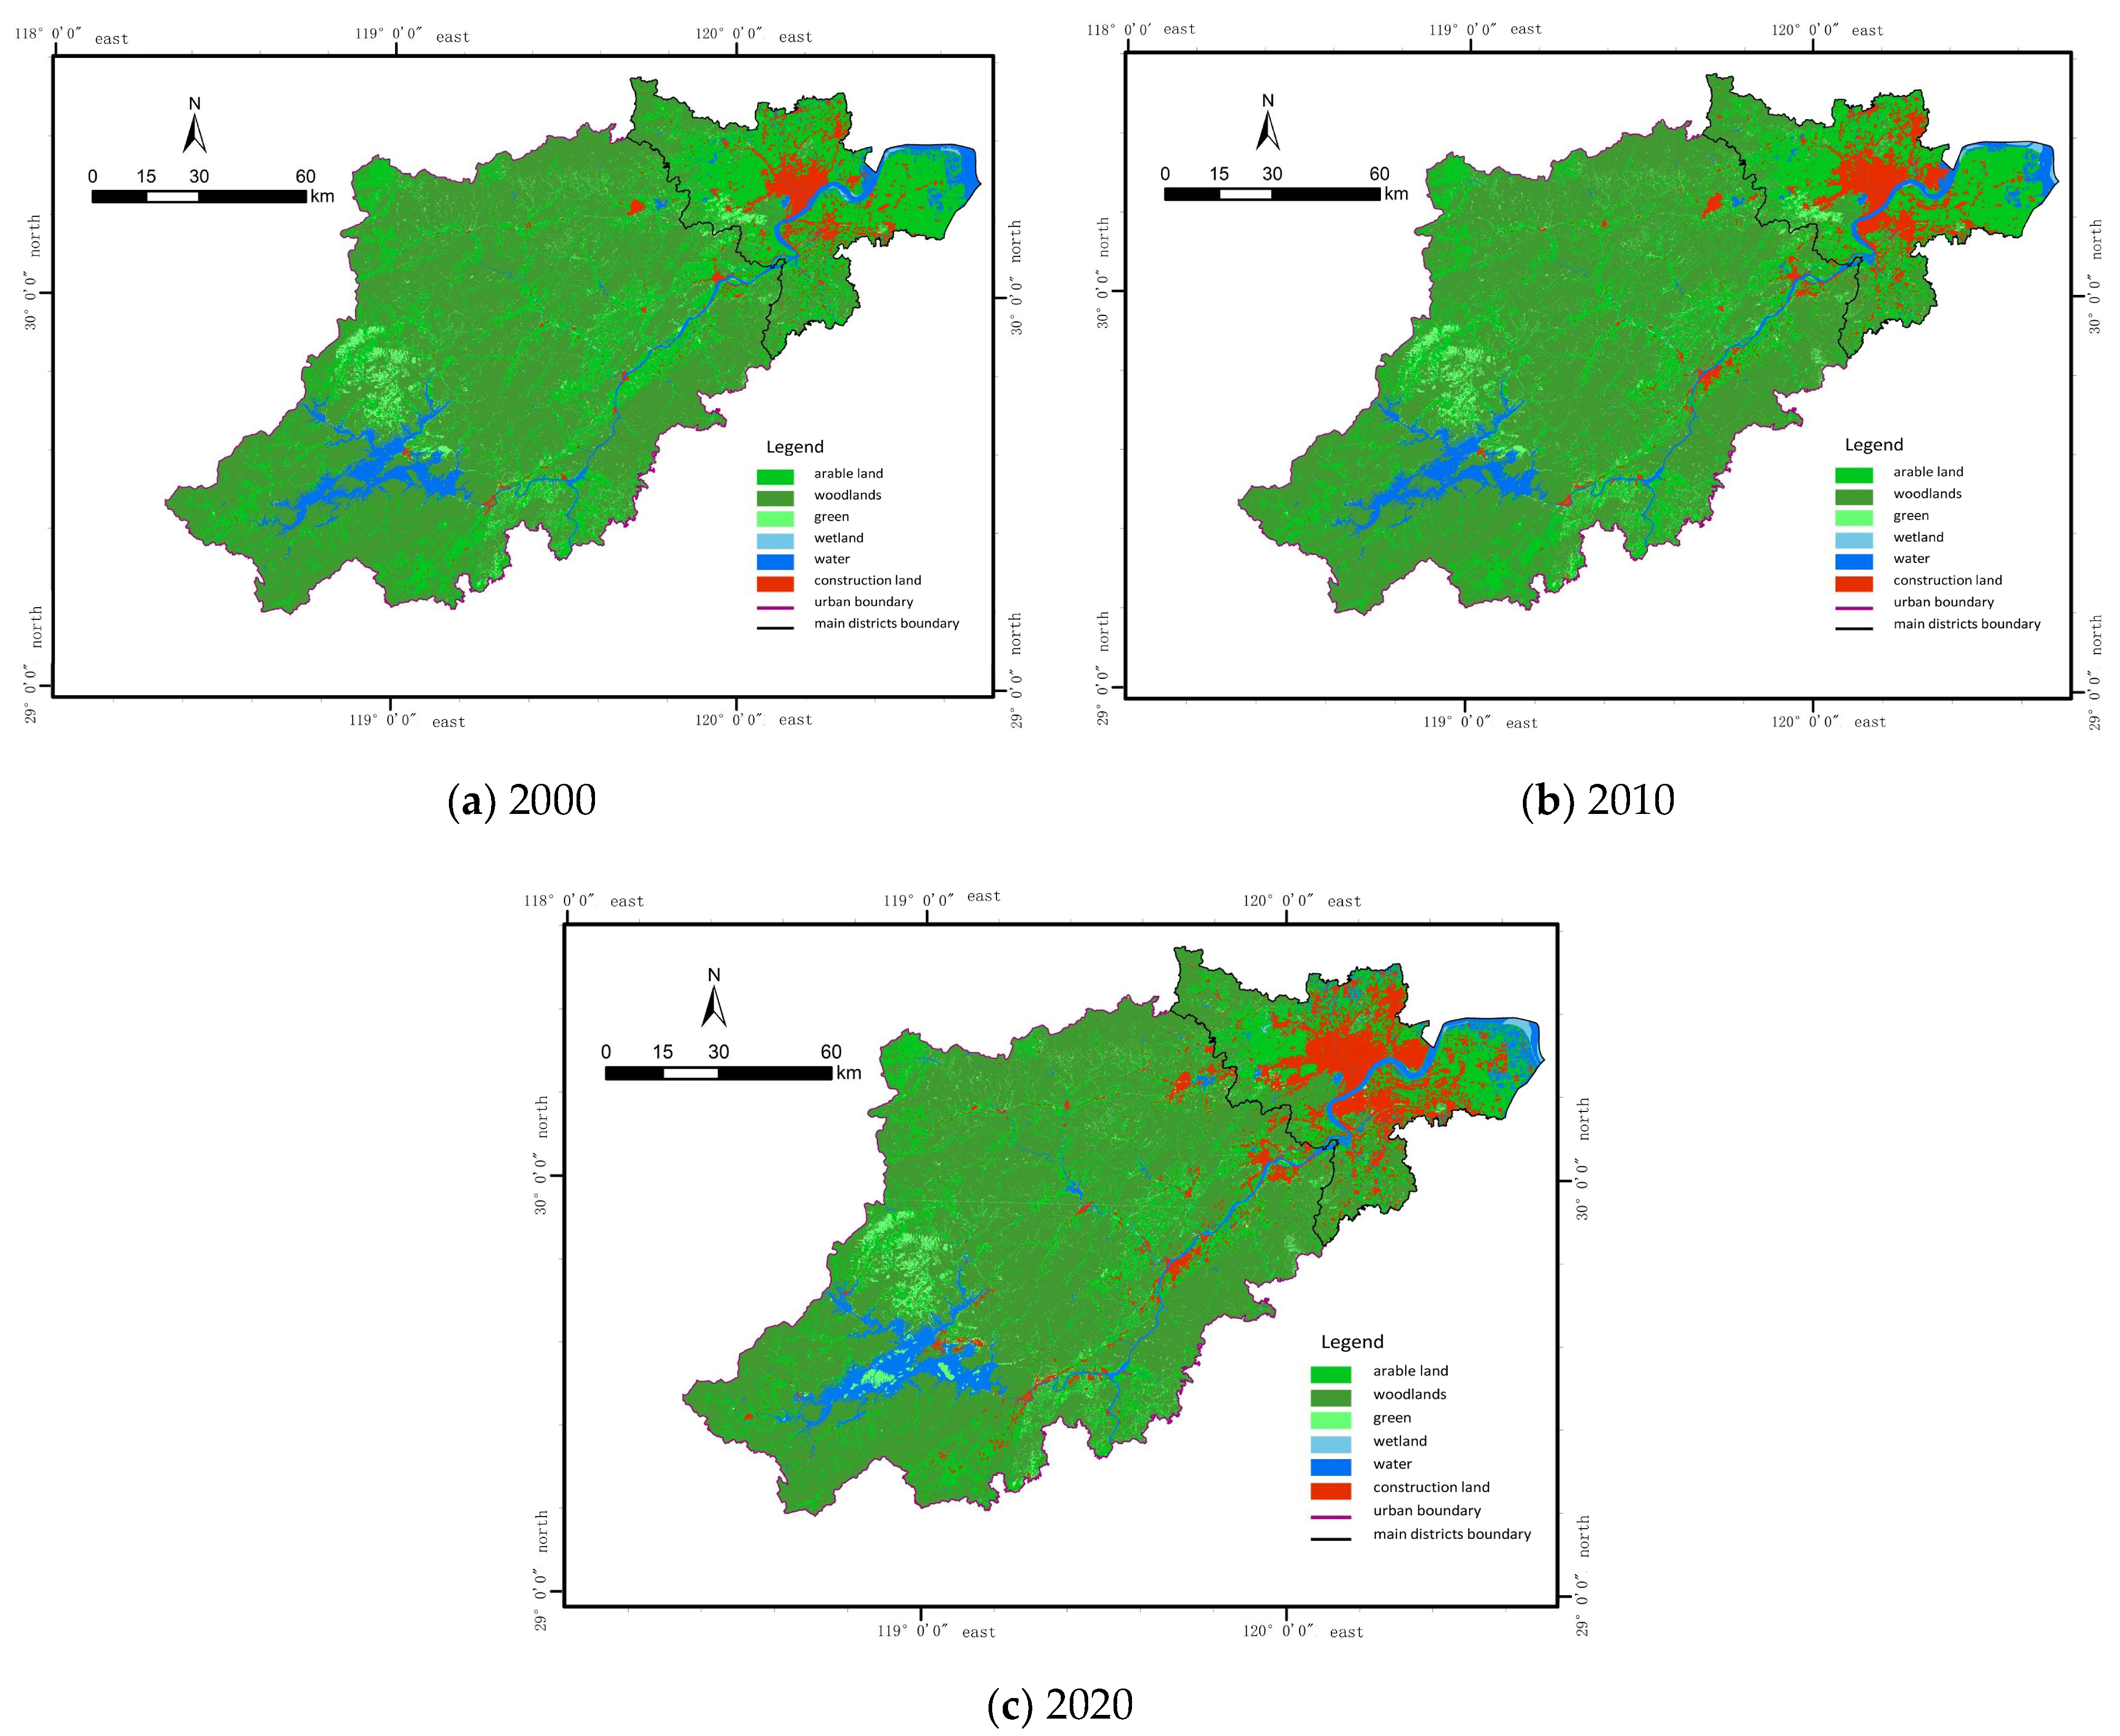
3.1. Evolution of Landscape Composition

3.1.1. Evolution of Landscape Composition in Urban Area

Table 2, Table 3 and Table 4 show the evolution of landscape composition in urban areas. It was found that construction land grew the fastest. From 2000 to 2020, the proportion of construction land increased by 5.02%, and the average annual growth rate after 2010 was about twice as fast as before. The arable land decreased by 5.59%, and the declining trend was more significant after 2010, which indicates that arable land was substantially occupied. From the land use area transfer matrix, it was found that arable land was the primary source of construction land expansion. In addition, the composition of wetlands and public green spaces showed a slight increase as residents’ demand for environmental improvement and recreation increased. Water areas also began to increase after a slight decline in the previous decade. Between 2000 and 2010, the composition of woodlands declined but remained at more than 60%, and was the dominant landscape for mitigating environmental risk exposure within urban areas.
We explain some of the data and the direction of land use conversion in Table 3. Columns show transfer-out areas, and rows show transfer-in areas. For example, the value of 606.80 in the first row refers to the area of woodlands converted to arable land from 2000 to 2010 and 97.05 is the area converted from green spaces to arable land, 581.67 is the area of arable land converted to woodland, and 847.20 (606.80 + 97.05 + 4.28 + 83.37 + 55.69) is the sum of the area of other land converted to arable land. The value of 1076.97 in the first column refers to the area converted from arable land to other lands during that decade.

3.1.2. Evolution of Landscape Composition in Main Districts

The land use intensity in the main districts is higher than in urban areas, and the conversion of ecological land to construction land is faster. According to the evolution of landscape composition in the main districts (Table 5, Table 6 and Table 7), construction land has maintained a high growth rate, with an annual average of about three times that of the urban area, and has increased significantly since 2010. In contrast, the proportion of arable land has been decreasing the fastest and the most. The dominant landscape in the main districts has changed from arable land to construction land. In addition, the composition of woodlands increased before 2010, and the growth rate has been more rapid since 2010. The evolution trend of wetlands, public green spaces, and water areas is similar to that of the urban area, but the range is more pronounced. The proportion of public green spaces and wetlands showed an increase before 2010 and decreased after 2010, indicating that public green spaces for leisure and recreation were destroyed. In this context, we should pay attention to the encroachment on public green spaces and take further measures to strengthen the protection of green spaces and parks in cities. The ecological restoration strategy for wetlands includes laying out wetland ecological restoration projects on the watershed scale and creating special wetland parks on the site scale [46]. Before 2010, the water area was decreasing. Hangzhou revised the Measures for the Protection and Management of Urban River Courses, which required strengthening the comprehensive protection, scientific management, and reasonable development of the Beijing–Hangzhou Canal, Qiantang River, West Lake, and other waterways. The watershed composition showed a significant growth trend afterward.

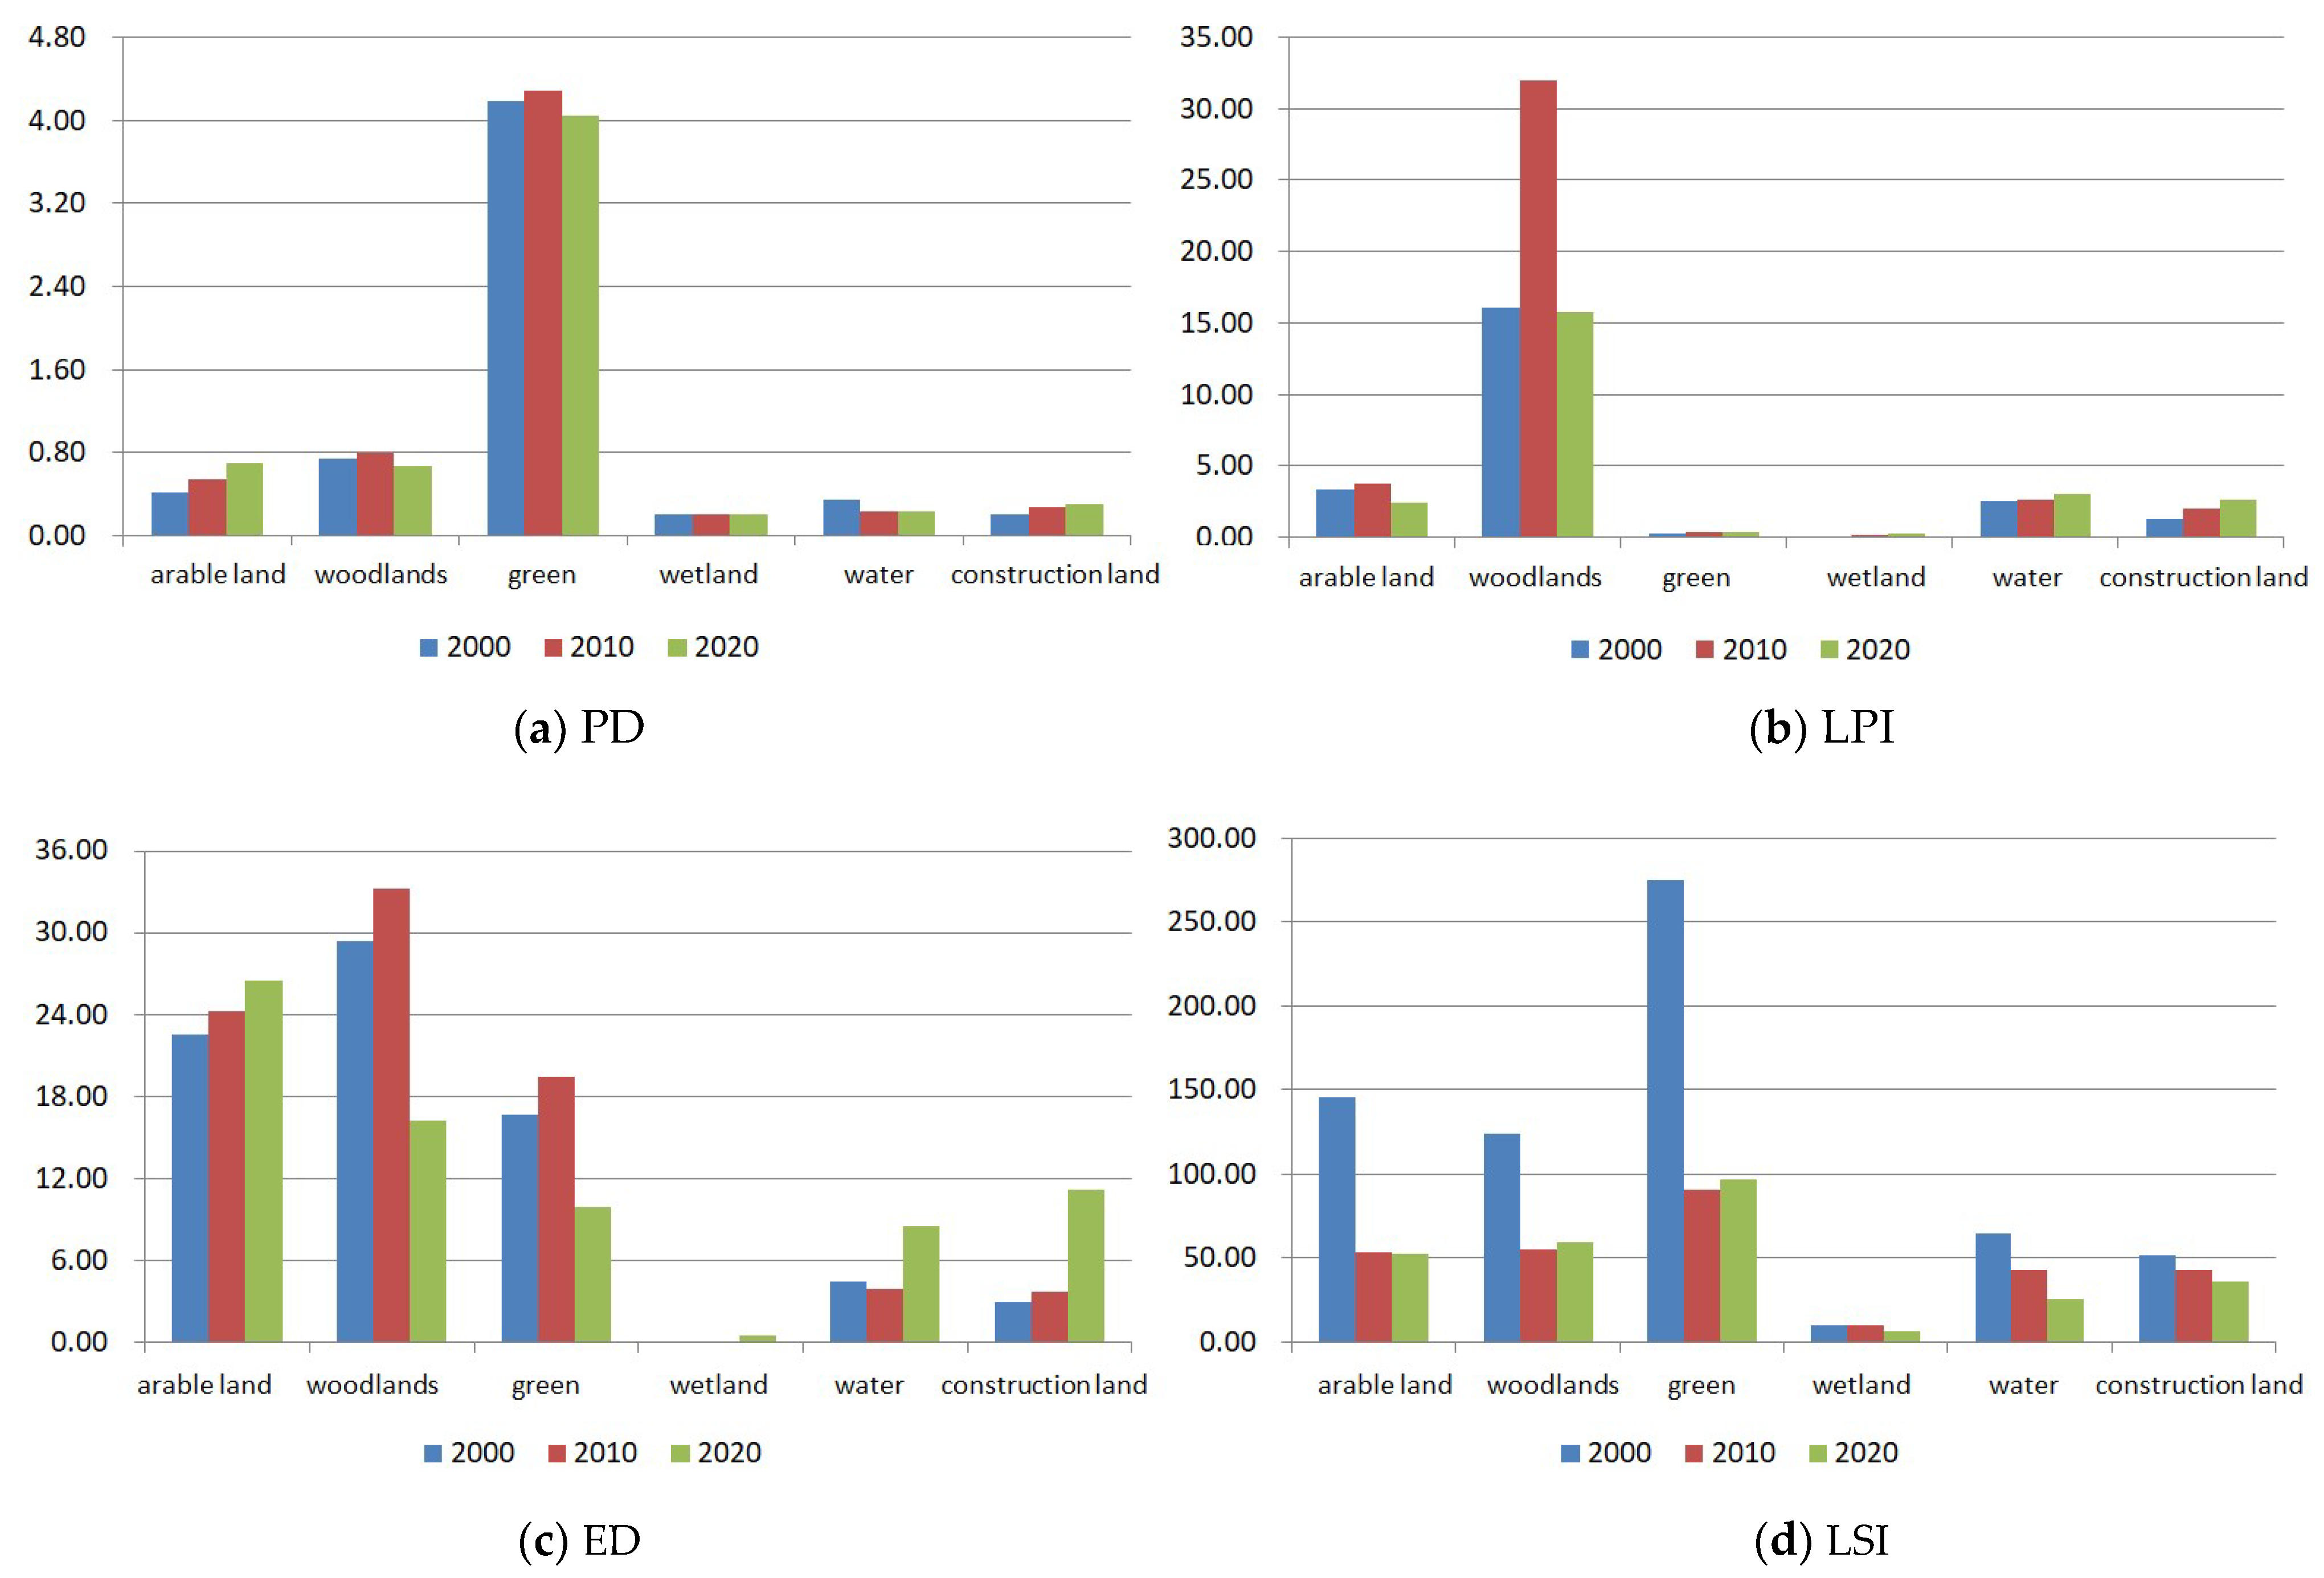
3.2. Spatial Evolution of Landscapes at the Patch Level

3.2.1. Spatial Evolution at the Patch Level in Urban Areas

Figure 2 shows changes in the landscape index at the patch level, and it can be found that woodlands have always been the dominant landscape in urban areas. From 2000 to 2020, the PD and ED of arable land increased, indicating that the spatial fragmentation of arable land increased and the distribution tended to be dispersed when some arable land was converted to construction land. The PD, LPI, and ED of construction land increased continuously, and the LPI increased most significantly before 2010. This indicates that construction land expanded rapidly and the space became more fragmented when the centralized construction area was formed. The LSI of public green spaces, arable land, and woodlands decreased significantly before 2020, the landscape shape tended to be simple and regular, and the connectivity between patches was enhanced, indicating that the distribution of public green spaces became more clustered after their integration planning. However, the dominance of these landscapes still needs to be improved. The LPI of water areas increased and the PD and LSI decreased, indicating that water patches tend to be complete and regular under the effect of human activities. The landscape ecological function of wetlands remained relatively stable, but the LPI was insufficient because of the small scale of wetlands and the low percentage of landscapes.

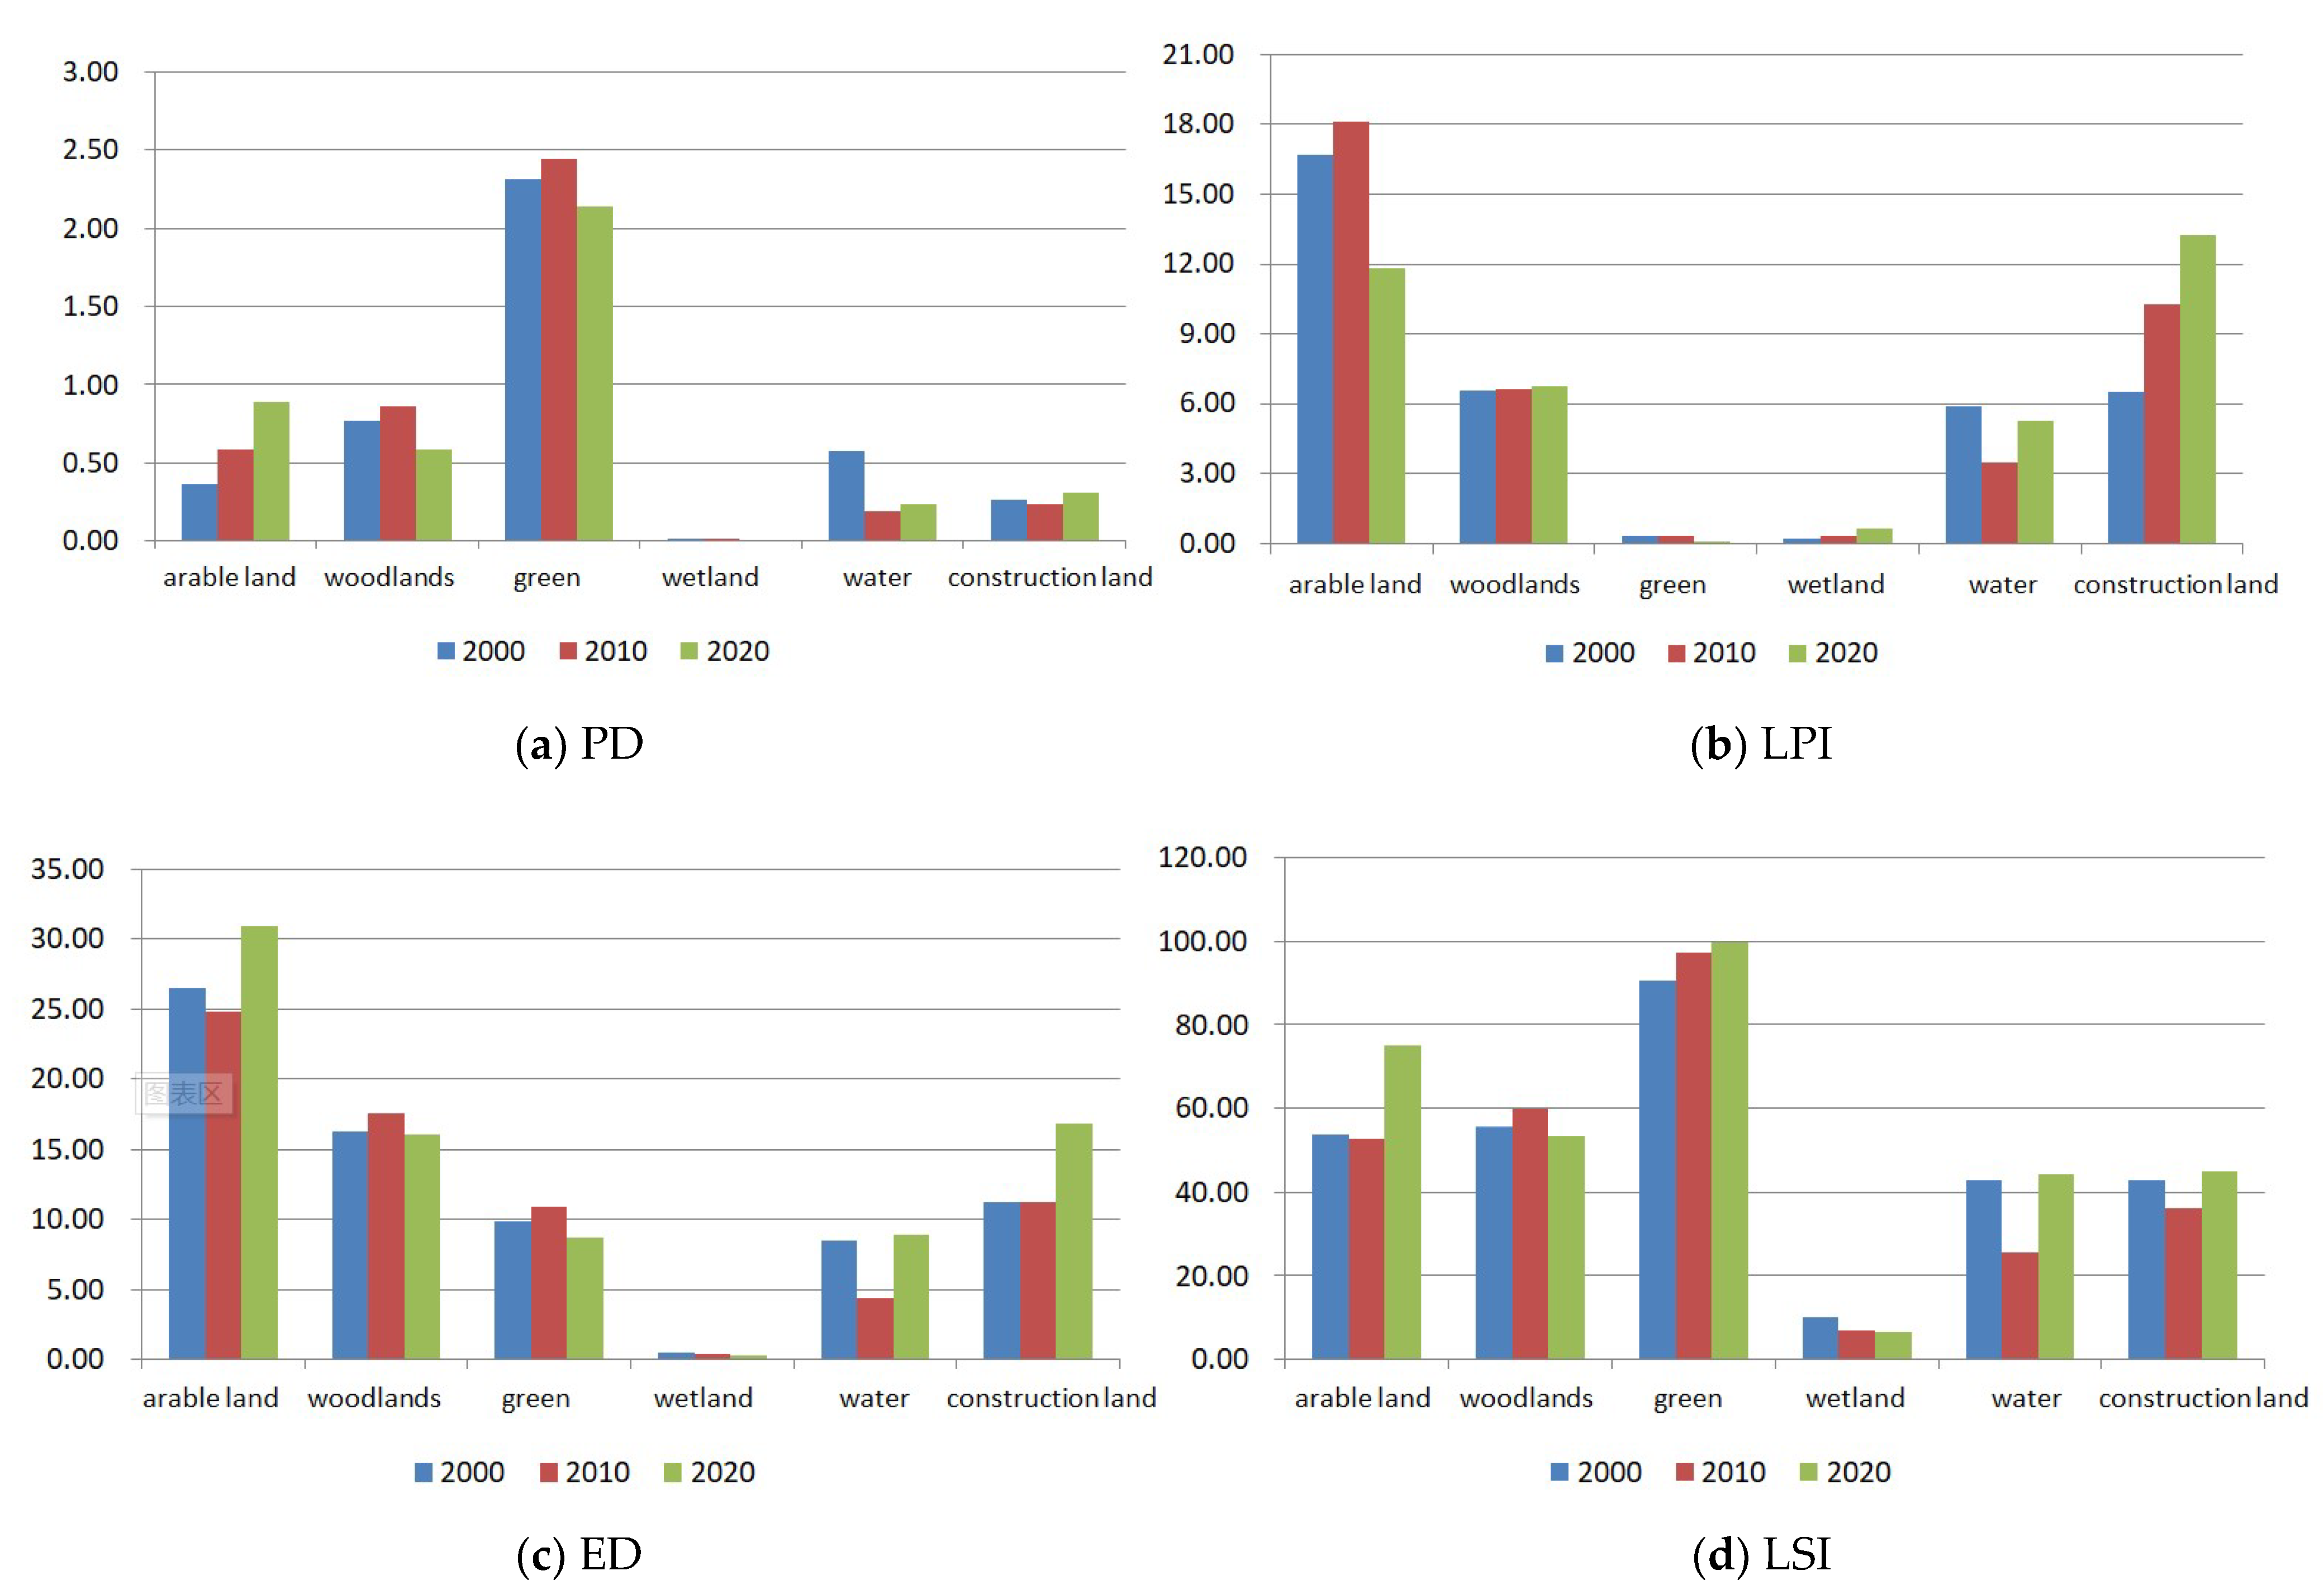
3.2.2. Spatial Evolution at the Patch Level in the Main Districts

The evolution of landscape patterns in main districts was different from that in urban areas (Figure 3). Construction land in the main districts grew rapidly, with increasing LPI, and the distribution tended to be large-scale and centralized. The LPI, ED, and LSI increased, and the trend of the former two was faster than that in urban areas. The PD, ED, and LSI of arable land increased, but the LPI decreased, which indicates that the arable land was fragmented during the continuous encroachment of construction land. However, the PD of woodlands, green spaces, wetlands, and water decreased, which shows that the landscape tended to be centralized. After 2010, the LPI of green spaces decreased significantly while the LSI increased, due to the small scale and scattered distribution of public green spaces. The LPI of woodland increased, indicating that its dominance increased. However, its LSI decreased, which indicates that the shape of woodlands tends to be complete and regular if it is under better protection.

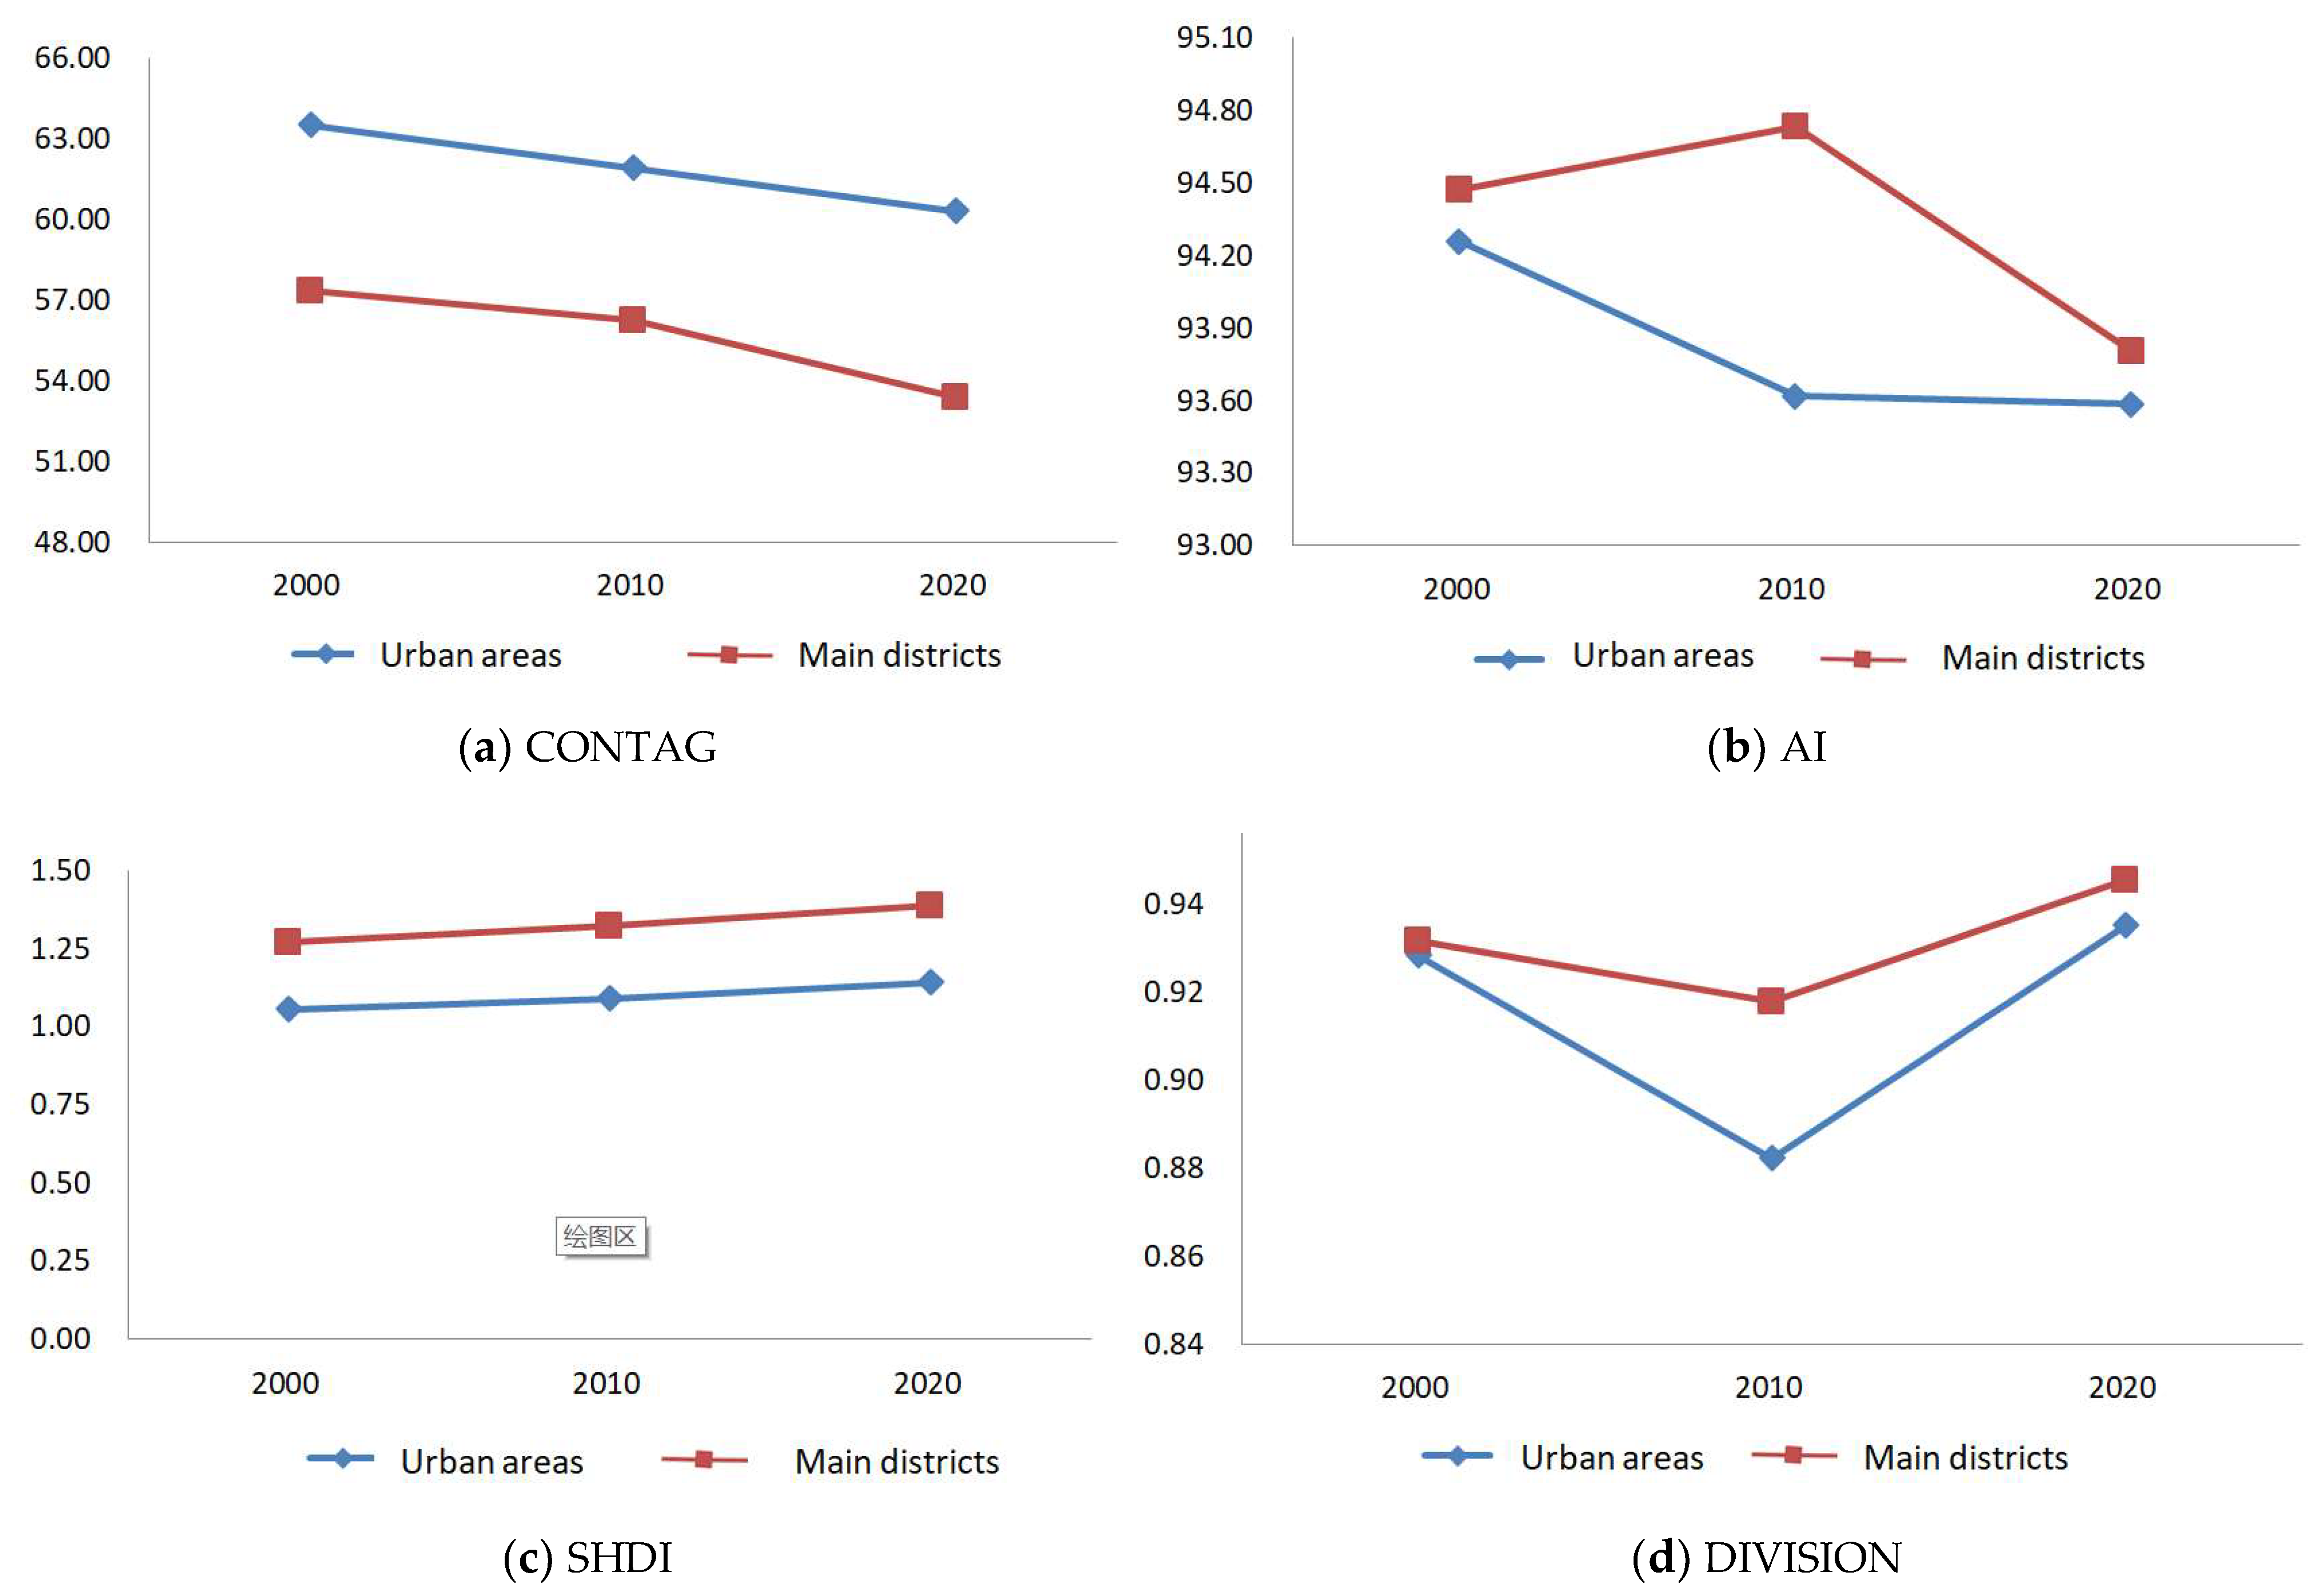
3.3. Spatial Evolution of Landscapes at the Landscape Level

From the perspective of spatial evolution at the landscape level (Figure 4), the landscape pattern evolution in urban areas and main districts is different. (1) The AI of landscape in urban areas has decreased, while that of main districts first increased and then decreased, which may be due to the rapid increase of construction land and centralized development. (2) DIVISION of landscape in urban areas and main districts first decreased and then increased, indicating a closer connection between different landscapes. In addition, a more complete network was formed when DIVISION decreased. The increase in DIVISION showed that the composition of patches was becoming more fragmented and the complexity of the landscape was increasing. (3) The increase in SHDI in urban areas was higher than in main districts. We found that landscape diversity increased, different patches were more evenly distributed spatially, and the overall component area ratio gap narrowed. This indicated that the city of Hangzhou paid attention to protecting the ecological space during urbanization, and the gap in the proportion of different landscape components was reduced by integrating woodlands and public green spaces. This also indicated that landscape diversity can be protected under high-intensity development through ecological restoration and rational land development.

3.4. Driving Factors of Landscape Pattern Evolution

Cities are complex ecosystems dominated by human social activities. The evolution of landscape patterns is due to internal and external factors, among which human factors such as social and economic development play an important role. Both natural and human factors can have a significant impact on the structure, configuration, and patchiness of landscapes, but human activities are undoubtedly the most dominant factor [47]. In this study, we took driving factors based on human activities as the research objects, and Hangzhou’s population (X1), regional GDP (X2), social fixed asset investment (X3), industrial GDP (X4), real estate investment (X5), and proportion of tertiary industries (X6, X7, X8) as independent variables. The landscape Shannon diversity index (Y1) and construction land proportion (Y2) were the dependent variables. The Shannon diversity index (Y1) is equal to the negative sum of the area ratio of patch type i multiplied by the natural logarithm of its value, where pi is the ratio occupied by landscape patch type i, which is calculated on a logarithmic basis, and the SHDI formula can be found in [48]. In a landscape system, if the land use is richer, the landscape is more fragmented, and the value of SHDI will be higher. SHDI = 0 indicates that the landscape is composed of one patch, and an increase in SHDI indicates an increase in patch types or a balanced distribution of patches. Then, we used multiple regression analysis for calculation. The regression model summary and the coefficients are given in Table A1, Table A2, Table A3 and Table A4. The results are as follows.
Y1 = 0.14X1 + 0.012X4 − 0. 135X6 + 0.04X8 + 9.837 (R2 = 0.998, p < 0.05)
Y2 = 0.875X1 + 0.069X3 + 0.14X5 − 3.531 (R2 = 0.996, p < 0.05)
The results show that population growth, industrial development, structural changes in primary and tertiary industries, and real estate development are the main driving factors of landscape pattern evolution in Hangzhou. These results are similar to those of some existing studies [40,41,43,49].
(1)
Population growth. During the past 20 years, the population in Hangzhou has increased by about 5.77 million people, which increases the demand for housing, public services, and other resources. As a result, construction land continues to sprawl and its dominance in the landscape is rising.
(2)
Industrial development. From 2000 to 2020, the industrial output value of Hangzhou increased from 70.932 billion to 487.507 billion. With the transition of the secondary industry, the traditional industry shifted to modern manufacturing, high-tech industry, and other innovative industries. Therefore, it is necessary to continuously establish industrial parks such as Future Science and Technology City and Zhijiang Science and Technology Industrial Park. The construction of industrial parks and transportation facilities will also affect the landscape pattern evolution.
(3)
Changes in the structure of industries. From 2000 to 2020, the proportion of the primary industry changed from 8.00% to 51.40%, the secondary industry from 40.60% to 2.10%, and the tertiary industry from 31.70% to 66.20%. The proportion of primary industry decreased and the tertiary industry developed rapidly. Hangzhou hosted the G20 Summit in 2016 and was supposed to host the Asian Games in 2022, so it is urgent to improve the quality of public service facilities. During these times, the development of the modern service industry also led to the occupation of ecological space by construction land.
(4)
Development of the real estate industry. With the growth of the population, the real estate industry has greatly promoted the construction of urban land, which directly affects the evolution of the landscape pattern.

4. Discussion

There are complex interactions between human systems and ecosystems, which gradually become more complicated with the progress of human society and increased human activity [50,51]. It is necessary to restore and protect urban ecosystems, comprehensively improve their resistance and resilience, and strengthen the coordination between human systems and natural ecosystems [52]. Therefore, to promote efficient ecological restoration of territorial space, the focus should be on the functional relationships between different landscapes. Some scholars have studied the relationship between urban sprawl and landscape pattern evolution [53,54]. It was found that landscape pattern indexes (e.g., PD, CONTAG, SHDI) are significantly correlated with urban sprawl, and this can provide a valuable reference for territorial space planning and ecological restoration by understanding the characteristics of landscape pattern evolution during urban expansion. According to the research results, the evolution of the landscape pattern index in the main districts of Hangzhou is the most obvious, and the expansion of construction land is mainly concentrated in these areas. Urban construction land sprawls along the edges of central urban areas, potentially destroying important ecological spaces in the suburbs. Therefore, we need to identify the fragmented ecological spaces and restore the ecosystem that has been destroyed by human activities. Finally, it is important to restore the function and structure of the ecosystem to the state before it was disturbed to ensure its sustainable development.

4.1. Incorporating Landscape Pattern Study into Ecological Restoration Planning

The ecological restoration of territorial space directly affects the spatial structure of the landscape and has an impact on ecological processes [23]. It needs to fully consider the potential impact of high-intensity human activities on landscape pattern evolution [55]. Hangzhou has the West Lake, the Qiantang River, and the Grand Canal, all of which provide advantages for building a natural ecological network with a complex structure. However, with rapid urban expansion, construction land has crossed the Qiantang River to the south and the West Lake scenic area to the west. These natural advantages also exert great pressure on the urban ecological network. Landscape patterns and ecological restoration complement each other: landscape patterns guide ecological restoration toward scientific discovery, and ecological restoration can build a more healthy landscape pattern. If the city is regarded as an ecosystem, natural landscape elements such as farmland, water, and mountains can be regarded as giant patches, and each patch can be regarded as an ecological interval to establish a dynamic composite multi-level ecological network. Therefore, incorporating the study of landscape patterns into the ecological restoration of territorial space is important in order to improve ecological function and identify spatial value and make up for the neglect of background resource characteristics.
Combining the evolution characteristics and driving factors of landscape patterns to identify land use trends and priority areas that need to be protected will help to provide a scientific basis for optimizing the urban land use structure. In terms of regional space, problem-oriented ecological restoration can only improve a small number of landscape functions [56,57] without systematic thinking, which can easily aggravate the trade-off between different landscape functions and lead to a human–land contradiction [58]. In urban areas, it is necessary to connect and implement major restoration projects in national and provincial areas and quantitatively assess the intensity of interference with the ecosystem by human activities using a human footprint. We should take the key areas of damaged landscapes as priority areas for ecological restoration according to the evolution rules of landscape fragmentation and diversity change [59], and we should arrange important restoration projects scientifically. In the main districts, we need to accelerate the integration of territorial space ecological restoration with urban development strategies. We should focus on ecosystem protection and urban development benefits while using the landscape pattern index and other quantitative evaluations of restoration efficiency [60]. Then, we should connect provincial and municipal ecological restoration planning with ecological restoration monitoring and supervision platforms, which can help in carrying out dynamic monitoring and ecological risk assessment, completion effects, and ecological protection to strengthen adaptive management.

4.2. Landscape Pattern Optimization of Ecological Reserves

An ecological reserve is an area delimited for the protection of a special natural environment, natural resources, or ecological system. Ecological reserves are primary areas for landscape pattern optimization, with the aim of optimizing ecological restoration by adjusting landscape composition, quantity, and distribution. Many scholars have carried out studies on the division of ecosystem areas and the prioritization of ecological protection areas in special natural zones (e.g., watersheds, wetlands, etc.) [61,62]. The ecological service effect of urban landscape pattern evolution has attracted more attention, especially the service value of urban ecological land [6,63]. The dominance, shape, and connectivity of the landscape affect environmental health risks and sustainable urban development. For example, the higher the LSI, the higher the risk of infectious diseases [64,65]. Better landscape connectivity means higher species richness [66]. Optimizing the spatial layout of the landscape to enhance regional landscape heterogeneity is also of great significance for the maintenance of biodiversity [67]. The restoration of ecological reserves should fully consider the characteristics of landscape evolution and optimize the function of territorial space by adjusting the spatial structure. For the ecological restoration of territorial space in Hangzhou, it is necessary to identify the core ecological areas, such as mountains, woodlands, important scenic spots, wetlands, rivers, and urban parks, in order to improve landscape dominance and ecological functions. The focus is on exploring the relationship between recreational activities and urban ecological protection [68], integrating the protection of damaged ecological spaces with leisure spaces, and carrying out recreation-oriented ecological restoration [69], as well as assessing the resulting recreation value of the landscape [70]. Some areas that are close to mountains and waterways should be used to connect core ecological spaces, which can protect the system and improve the connectivity between different landscapes. The research objectives of optimizing the landscape patterns of ecological reserves and the mechanism of the effect of ecological recreation space on human welfare are consistent [71,72].

4.3. Landscape Pattern Optimization of Construction Areas

The expansion of construction land is the most direct representation of urban construction and is also an important index to measure the pressure of the urban ecological environment [73]. Construction land is the dominant landscape in the main districts of Hangzhou. The large-scale urban traffic network often makes the urban landscape become a grid, deepening the fragmentation of the landscape [74]. For example, the disturbance of urban construction caused the landscape pattern of the riparian zone of the Huangpu River to be broken, and industrial land, production shelterbelt, and dry land have become the key landscapes for ecological restoration [75]. Landscape patterns should be regarded as indicators of spatial control in the ecological restoration of territorial space. When unreasonable urban development negatively affects the landscape patterns, we should limit the disorderly sprawl of construction land and delimit a reasonable development boundary. Severely damaged ecological space should be restored by returning abandoned land to woodland and implementing comprehensive management. It is necessary to restore the damaged ecosystem to its natural state through artificial reconstruction [76]. The efficient use of resources can help to improve the quality of territorial space. For example, the proportion of public green spaces in the main districts in Hangzhou has decreased, and the landscape distribution is scattered. Abandoned land and fragmented land can be transformed into public green spaces such as pocket parks for leisure and entertainment.
From the research results, it was found that population, urbanization, and industrial structure have had a profound impact on the landscape pattern evolution of Hangzhou. Population growth leading to a need for construction land is the driving force of urban expansion. The Yangtze River Delta region has also had a significant impact on Hangzhou’s development. On the premise of ensuring economic development and urban construction, Hangzhou should further integrate the development of the Yangtze River Delta, and the Yangtze River Delta region should further strengthen cross-regional cooperation, promote industrial integration, strictly guard the cultivated land red line, and ensure ecological security. From urban areas, ecological land should be created by ecosystem reorganization. For example, construction land should be integrated into public green spaces of different sizes. It is also possible to integrate fragmented natural spaces and connect them through ecological corridors, by constructing an interwoven landscape structure of points, lines, and surfaces that can effectively provide the functions of ecosystem regulation and cultural services. A recreational network can be formed through regional ecological restoration, in which various types of point-shaped and plane-shaped ecological patches are combined into an ecosystem with recreational functions and strong self-regulation ability [77]. Some studies have identified the spatial distribution and land use of priority areas for ecological restoration based on ecological patterns and proposed directions for improved restoration to provide scientific guidance for territorial space restoration [78,79].

5. Conclusions

The ecological restoration of territorial space is aimed at balancing human development and natural resource protection, in which landscape pattern optimization plays an important role. It is also necessary to build a healthy, diverse, and harmonious landscape distribution pattern through ecological restoration. The landscape pattern index analysis in this study quantitatively explains the landscape evolution characteristics at the patch and landscape level and reveals the landscape structure and function in detail in the spatiotemporal dimension to improve the efficiency and accuracy of ecological restoration. The innovation of this study is that it provides an important point for the ecological restoration of territorial space by comprehensively considering the evolution of landscape composition and landscape pattern characteristics, and the driving factors.
We took Hangzhou City as an example to conduct an empirical study. The results show that there were differences in the landscape pattern evolution between urban areas and main districts. The change of ecological space into production and living space in the main districts was more significant. Population growth, industrial development, structural industrial changes, and real estate development all have an important impact on landscape pattern evolution. In general, we propose integrating landscape pattern optimization into the ecological restoration of territorial space. We also propose a landscape pattern optimization strategy for the restoration of ecological reserves and construction areas, which are of great significance for coordinating ecological protection and social development. In the future, we need to explore more complex factors inherent in the conversion of one type of land to another. Second, as China vigorously promotes a rural revitalization strategy, we need to further explore the relationship between rural landscape patterns and ecological restoration in order to promote the sustainable development of urban–rural areas and the effective improvement of human well-being.

Author Contributions

X.H. conceived the research framework, innovation, methodology, and revised the manuscript. F.L. put forward guidance and formulated revision plans. W.X. collected and calculated all the data and analyzed and visualized the research results. All authors constructed the theoretical framework, participated in the discussion, and completed the manuscript. All authors have read and agreed to the published version of the manuscript.

Funding

This research was supported by the Bingtuan Science and Technology Program (2021DB019), Youth and Middle-aged Scientific and Technological Innovation Leading Talents Program of the Corps (2022CB001-01).

Institutional Review Board Statement

Not applicable.

Informed Consent Statement

Not applicable.

Data Availability Statement

The data presented in this study are available on request from the website of http://www.globallandcover.com/home.html?type=data, accessed on 16 August 2021, and the http://www.gscloud.cn, accessed on 10 August 2021. The data is publicly available.

Acknowledgments

We would like to thank the editors and reviewers for their helpful comments and suggestions.

Conflicts of Interest

The authors declare no conflict of interest.

Appendix A

Table A1. Model summary b.
RR2Adjusted R2Error in Standard EstimatesDurbin Watson
0.998 a0.9980.9243.2561.853
a. Predictive variables: (constant), X1, X2, X3, X4, X5, X6, X7, X8. b. Dependent variable: the Shannon diversity index.
Table A2. Coefficient of regression model b.
Unstandardized CoefficientStandardized CoefficienttSig.
BStandard ErrorBeta
(Constant)9.8374.894-10.2560.001
X10.140.2450.4892.4250.000
X40.0120.0060.5433.1120.002
X6−0.1350.089−0.261−2.150.000
X80.040.0580.7643.3320.010
b. Dependent variable: the Shannon diversity index.
Table A3. Model summary b.
RR2Adjusted R2Error in Standard EstimatesDurbin Watson
0.996 a0.9960.9055.1532.188
a. Predictive variables: (constant), X1, X2, X3, X4, X5, X6, X7, X8. b. Dependent variable: construction land proportion.
Table A4. Coefficient of regression model b.
Unstandardized CoefficientStandardized CoefficienttSig.
BStandard ErrorBeta
(Constant)−3.53111.203-16.7740.002
X10.8752.1560.5915.1250.000
X30.0691.8890.2237.2150.001
X50.143.1250.1053.2130.000
b. dependent variable: construction land proportion.

References

  1. McDonnell, M.J.; MacGregor-Fors, I. The ecological future of cities. Science 2016, 352, 936–938. [Google Scholar] [CrossRef] [PubMed]
  2. Pepliński, B.; Czubak, W. The influence of opencast lignite mining dehydration on plant production—A methodological study. Energies 2021, 14, 1917. [Google Scholar] [CrossRef]
  3. Georgescu-Roegen, N. The Entropy Law and the Economic Process; Harvard University Press: Cambridge, MA, USA, 1971. [Google Scholar]
  4. Shen, Y.; Liu, T.K.; Zhou, P. Theoretical analysis and strategies of natural ecological space use control. China Land Sci. 2017, 31, 17–24. [Google Scholar]
  5. Crooks, K.R. Relative sensitivities of mammalian carnivores to habitat fragmentation. Conserv. Biol. 2002, 16, 488–502. [Google Scholar] [CrossRef]
  6. Kadish, J.; Netusil, N.R. Valuing vegetation in an urban watershed. Landsc. Urban Plan. 2012, 104, 59–65. [Google Scholar] [CrossRef]
  7. Wang, J.; Zhou, W.Q.; Xu, K.P.; Yan, J.L. Spatiotemporal pattern of vegetation cover and its relationship with urbanization in Beijing-Tianjin-Hebei megaregion from 2000 to 2010. Acta Ecol. Sin. 2017, 37, 7019–7029. [Google Scholar]
  8. Zhu, C.M.; Zhang, X.L.; Zhou, M.M.; He, S.; Gan, M.Y.; Yang, L.X.; Wang, K. Impacts of urbanization and landscape pattern on habitat quality using OLS and GWR models in Hangzhou, China. Ecol. Indic. 2020, 117, 106654. [Google Scholar] [CrossRef]
  9. Tratalos, J.; Fuller, R.A.; Warren, P.; Davies, R.G.; Gaston, K.J. Urban form, biodiversity potential and ecosystem services. Landsc. Urban Plan. 2007, 83, 308–317. [Google Scholar] [CrossRef]
  10. Liu, S.L.; Dong, Y.H.; Cheng, F.Y.; Coxixo, A.; Hou, X.Y. Practices and opportunities of ecosystem service studies for ecological restoration in China. Sustain. Sci. 2016, 11, 935–944. [Google Scholar] [CrossRef]
  11. Wang, C.; Wu, X.; Fu, B.J.; Han, X.G.; Chen, Y.N.; Wang, K.L.; Zhou, H.K.; Feng, X.M.; Li, Z.S. Ecological restoration in the key ecologically vulnerable regions: Current situation and development direction. Acta Ecol. Sin. 2019, 39, 7333–7343. [Google Scholar]
  12. Lindenmayer, D.; Hobbs, R.J.; Montague-Drake, R.; Alexander, J.; Bennett, A.; Burgman, M.; Cale, P.; Calhoun, A.; Cramer, V.; Cullen, P.; et al. A checklist for ecological management of landscapes for conservation. Ecol. Lett. 2008, 1, 78–91. [Google Scholar] [CrossRef]
  13. Cao, Y.; Wang, J.Y.; Li, G.Y. Ecological restoration for territorial Space: Basic concepts and foundations. China Land Sci. 2019, 33, 1–10. [Google Scholar]
  14. Gao, S.C. Theory and method of ecological restoration of territorial space. China Land 2018, 40–43. [Google Scholar]
  15. Martin, D.M. Ecological restoration should be redefined for the twenty-first century. Restor. Ecol. 2017, 25, 668–673. [Google Scholar] [CrossRef] [Green Version]
  16. Koch, J.M.; Hobbs, R.J. Synthesis: Is Alcoa successfully restoring a jarrah forest ecosystem after bauxite mining in Western Australia? Restor. Ecol. 2007, 15, 137–144. [Google Scholar] [CrossRef]
  17. Lin, J.Q.; Chen, K.Q.; Cao, X.H.; Qi, C.J.; Fan, B.; Peng, Q.D. A thought on top-level design of river ecological restoration. J. Hydraul. Eng. 2018, 49, 483–491. [Google Scholar]
  18. Wallace, W. Cheatgrass encroachment on a ponderosa pine forest ecological restoration project in Northern Arizona. Ecol. Restor. 2021, 27, 37–46. [Google Scholar]
  19. Wang, J.; Ying, L.X.; Zhong, L.N. Thinking for the transformation of land consolidation and ecological restoration in the new era. J. Nat. Resour. 2020, 35, 26–36. [Google Scholar]
  20. Gong, Q.H.; Zhang, H.O.; Ye, Y.Y.; Yuan, S.X. Planning strategy of land and space ecological restoration under the framework of man-land system coupling: Take the Guangdong Hong Kong-Macao Greater Bay Area as an example. Geogr. Res. 2020, 39, 2176–2188. [Google Scholar]
  21. Pang, Y.Y.; Zhu, Z.M.; Ye, Z.D.; Qin, M.L. Exploration on the ideal model and zoning method of territorial ecological restoration. J. Guangxi Univ. Nat. Sci. 2022, 47, 933–943. [Google Scholar]
  22. Couix, N.; Gonzalo-Turpin, H. Towards a land management approach to ecological restoration to encourage stakeholder participation. Land Use Policy 2015, 46, 155–162. [Google Scholar] [CrossRef]
  23. Peng, J.; Lv, D.N.; Dong, J.Q.; Liu, Y.X.; Liu, Q.Y.; Li, B. Processes coupling and spatial integration: Characterizing ecological restoration of territorial space in view of landscape ecology. J. Nat. Resour. 2020, 35, 3–13. [Google Scholar]
  24. Shackelford, N.; Hobbs, R.; Burgar, J.; Erickson, T.; Fontaine, J.; Laliberté, E.; Ramalho, C.; Perring, M.; Standish, R. Primed for change: Developing ecological restoration for the 21st century. Restor. Ecol. 2013, 21, 297–304. [Google Scholar] [CrossRef] [Green Version]
  25. Hubacek, K.; Van Den Bergh, J.C.J.M. Changing concepts of ’land’ in economic theory: From single to multi-disciplinary approaches. Ecol. Econ. 2006, 56, 2659–2669. [Google Scholar] [CrossRef]
  26. Young, T.; Petersen, D.A.; Clary, J. The ecology of restoration: Historical links, emerging issues and unexplored realms. Ecol. Lett. 2005, 8, 662–673. [Google Scholar] [CrossRef]
  27. Li, F.; Ye, Y.P.; Song, B.W.; Wang, R.S. Spatial structure of urban ecological land and its dynamic development of ecosystem services: A case study in Changzhou City, China. Acta Ecol. Sin. 2011, 31, 5623–5631. [Google Scholar]
  28. Chen, L.D.; Sun, R.H.; Liu, H.L. Eco-environmental effects of urban landscape pattern changes: Progresses, problems, and perspectives. Acta Ecol. Sin. 2013, 33, 1042–1050. [Google Scholar] [CrossRef] [Green Version]
  29. Dong, W.J.; Ren, P.; Hu, L.X. Research on ecological restoration planning strategy of Daheihe River based on quantitative analysis of landscape pattern. J. Green Sci. Technol. 2019, 109–111. [Google Scholar]
  30. Wang, J.; Sun, Q.Y.; Li, S. Ecological rehabilitation of landscape pattern in Changling village based on GIS. J. Chin. Urban For. 2020, 18, 106–110. [Google Scholar]
  31. Wu, G.X.; Yu, Z.Z.; Liu, L.Y. Research on landscape pattern changeand regional ecological restoration: A case study of Mentougou District, Beijing. Geogr. Res. 2011, 30, 1227–1236. [Google Scholar]
  32. Feng, W.L.; Li, S.Z.; Li, C. Overview and frame work for ecosystem services and human well-being. Resour. Sci. 2013, 35, 1482–1489. [Google Scholar]
  33. Wang, C.X.; Liu, Y.X.; Yu, C.Y.; Liu, X.Q. Research progress on the arrangement of territorial ecological restoration. Prog. Geogr. 2021, 40, 1925–1941. [Google Scholar] [CrossRef]
  34. Wang, Y.; Zhou, Z.X.; Guo, Z.Z. Impact of the urban agricultural landscape fragmentation on ecosystem services: A case study of Xi’an City. Geogr. Res. 2014, 33, 1097–1105. [Google Scholar]
  35. Cen, X.T. Correlation Analysis and Optimization between Land Use Landscape Patterns and Ecosystem Service Values—A Case Study of South Coast of Hangzhou Bay; Zhejiang University: Hangzhou, China, 2016. [Google Scholar]
  36. Wang, Y.C.; Ma, Y.Y.; Shen, J.K. Application of landscape personality assessment in national territory spatial planning and control. Landsc. Archit. 2020, 27, 35–40. [Google Scholar]
  37. Huang, M.Y.; Yue, W.Z.; Du, J. Analysis on Land use landscape pattern changes and driving force in Hangzhou City. Soils 2012, 44, 326–331. [Google Scholar]
  38. Deng, J.S.; Li, J.; Yu, L.; Wang, K. Dynamics of land use landscape pattern in Hangzhou City during its rapid urbanization. Chin. J. Appl. Ecol. 2008, 19, 2003–2008. [Google Scholar]
  39. Wu, J.G. Landscape Ecology: Pattern, Process, Scale and Hierarchy; Higher Education Press: Beijing, China, 2000. [Google Scholar]
  40. Ma, Y.X.; Cong, H.; Zhou, W.B.; Zhou, H. Landscape pattern of land use dynamic development and driving force in Xi’an. J. Northwest For. Univ. 2017, 32, 186–192. [Google Scholar]
  41. Qi, Y.; Wu, J.G.; Li, J.L.; Yu, Y.; Peng, F.L.; Sun, C. Landscape dynamics of medium- and small-sized cities in eastern and western China: A comparative study of pattern and driving forces. Acta Ecol. Sin. 2013, 33, 275–285. [Google Scholar]
  42. Plieninger, T.; Draux, H.; Fagerholm, N.; Bieling, C.; Bürgi, M.; Kizos, T.; Kuemmerle, T.; Primdahl, J.; Verburg, P.H. The driving forces of landscape change in Europe: A systematic review of the evidence. Land Use Policy 2016, 57, 204–214. [Google Scholar] [CrossRef] [Green Version]
  43. Zhang, M.; Wang, R.H. Envolution of landscape in Jiangbei District of Nanjing City. Res. Soil Water Conserv. 2015, 22, 229–233. [Google Scholar]
  44. Li, C.; Li, J.X.; Wu, J.G. Quantifying the speed, growth modes, and landscape pattern changes of urbanization: A hierarchical patch dynamics approach. Landsc. Ecol. 2013, 28, 1875–1888. [Google Scholar] [CrossRef]
  45. Che, T.; Li, C.; Luo, Y.J. Characteristics and driving forces of landscape pattern evolution of built-up land during urban expansion. Acta Ecol. Sin. 2020, 40, 3283–3294. [Google Scholar]
  46. Huang, M.H.; Long, N.; Li, X.H.; Wu, J. Urban wetland ecological rehabilitation in the context of national land and space plan, Guangzhou. Planners 2020, 36, 20–25. [Google Scholar]
  47. Nüsser, M. Understanding cultural landscape transformation: Arephotographic survey in Chitral, eastern Hindukush, Pakistan. Landsc. Urban Plan. 2001, 57, 241–255. [Google Scholar] [CrossRef]
  48. Yan, T.; Jin, J.X.; Zhu, Q.S.; Liu, Y. A dataset of land cover and Shannon’s diversity index based on plant functional types in China and its adjacent areas (1992–2018). China Sci. Data 2022, 7, 108–117. [Google Scholar]
  49. Yang, W.R. Spatiotemporal change and driving forces of urban landscape pattern in Beijing. Acta Ecol. Sin. 2015, 35, 4357–4366. [Google Scholar]
  50. Metcalf, E.C.; Mohr, J.J.; Yung, L.; Metcal, P.; Craig, D. The role of trust in restoration success: Public engagement and temporal and spatial scale in a complex social-ecological system. Restor. Ecol. 2015, 23, 315–324. [Google Scholar] [CrossRef]
  51. Sebesvari, Z.; Renaud, F.G.; Haas, S.; Zachary, T.; Michael, H. A review of vulnerability indicators for deltaic social-ecological system. Sustain. Sci. 2016, 11, 575–590. [Google Scholar] [CrossRef]
  52. Ye, Y.M.; Lin, Y.B.; Liu, S.C.; Luo, M. Social-ecological system (SES) analysis framework for application in ecological restoration engineering for mountains-rivers-forests-farmlands-lakes-grasslands: Utilizing the source area of Qiantang River in Zhejiang Province as an example. Acta Ecol. Sin. 2019, 39, 8846–8856. [Google Scholar]
  53. Ben, X.C.; Yu, C. Evolutionary characteristic analysis of land use and landscape patterns of Suzhou in the past 40 years. J. Suzhou Univ. Sci. Technol. Nat. Sci. Ed. 2022, 39, 65–73. [Google Scholar]
  54. Zhang, Z.Y.; Chen, Y.Q.; Liu, Z.Y. Landscape pattern evolution and driving forces analysis in Hangjiahu plain. J. Hangzhou Norm. Univ. Nat. Sci. Ed. 2022, 21, 553–560. [Google Scholar]
  55. Ma, S.F.; Lao, C.H.; Jiang, H.Y. Ecological restoration zoning of territorial space based on the pattern simulation of eco-security scenario: A case study of Guangdong Hong Kong-Macao Greater Bay Area. Acta Ecol. Sin. 2021, 41, 3441–3448. [Google Scholar]
  56. Mansourian, S.; Sgard, A. Diverse interpretations of governance and their relevance to forest landscape restoration. Land Use Policy 2021, 104, 104011. [Google Scholar] [CrossRef]
  57. Hernandez-Santin, L.; Erskine, P.D.; Bartolo, R.E. A review of revegetation at mine sites in the Alligator Rivers Region, Northern Territory, and the development of a state and transition model for ecological restoration at Ranger uranium mine. J. Clean. Prod. 2020, 246, 119079. [Google Scholar] [CrossRef]
  58. Zhou, Y.; Chen, Y.; Ying, L.X.; Yang, C.Y. A technical framework for ecosystem conservation and restoration. Earth Sci. Front. 2021, 28, 14–24. [Google Scholar]
  59. Jiao, S.; Liu, Y.C.; Han, Z.W.; Zhou, K.J.; Hu, L.; Liu, T.X. Determining priority areas for land ecological restoration based on ecological network-human disturbance: A case study of Changsha-Zhuzhou-Xiangtan Urban Agglomeration. J. Nat. Resour. 2021, 36, 2294–2307. [Google Scholar] [CrossRef]
  60. Wang, J.Y.; Chen, T. Identification method of key areas of ecological restoration of territorial space in coastal high-density cities: A case study of Macao special administrative region. Landsc. Archit. 2021, 28, 16–22. [Google Scholar]
  61. Bailey, R.G. Ecoregions: The Ecosystem Geography of the Oceans and Continets; Springer: New York, NY, USA, 2014. [Google Scholar]
  62. Omernik, J.M. Ecoregions of the Conterminous United Stated. Ann. Assoc. Am. Geogr. 1987, 77, 118–125. [Google Scholar] [CrossRef]
  63. Strohbach, M.W.; Haase, D. Above-ground carbon storage by urban trees in Leipzig, Germany. Landsc. Urban Plan. 2012, 104, 95–104. [Google Scholar] [CrossRef]
  64. Schmidt, K.A.; Ostfeld, R.S. Biodiversity and the dilution effect in disease ecology. Ecology 2001, 82, 609–619. [Google Scholar] [CrossRef]
  65. Patz, J.A.; Daszak, P.; Tabor, G.M.; Aguirre, A.A.; Pearl, M.; Epstein, J.; Wolfe, N.D.; Kilpatrick, A.M.; Foufopoulos, J.; Molyneux, D.; et al. Unhealthy landscapes: Policy recommendations on land use change and infectious disease emergence. Environ. Health Perspect. 2004, 112, 1092–1098. [Google Scholar] [CrossRef] [PubMed] [Green Version]
  66. Jordan, F.; Baldi, A.; Orci, K.M.; Racz, I.; Varga, Z. Characterizing the importance of habitat patches and corridors in maintaining the landscape connectivity of a Pholidoptera transsylvanica (Orthoptera) metapopulation. Landsc. Ecol. 2003, 18, 83–92. [Google Scholar] [CrossRef]
  67. Harlio, A.; Kuussaari, M.; Heikkinen, R.K.; Arponen, A. Incorporating landscape heterogeneity into multi-objective spatial planning improves biodiversity conservation of semi-natural grasslands. J. Nat. Conserv. 2019, 49, 37–44. [Google Scholar] [CrossRef]
  68. Daniel, T.C.; Muhar, A.; Arnberger, A.; Aznar, O.; Boyd, J.W.; Chan, K.M.A.; Costanza, R.; Elmqvist, T.; Flint, C.G.; Gobster, P.H. Contributions of cultural services to the ecosystem services agenda. Proc. Natl. Acad. Sci. USA 2012, 109, 8812–8819. [Google Scholar] [CrossRef] [Green Version]
  69. Zheng, X.; Wang, F.Y.; Wang, K.Y. Study on the theory and model of recreation oriented ecological restoration of national territorial space. J. Nat. Resour. 2021, 36, 1923–1936. [Google Scholar] [CrossRef]
  70. Pueyo, R.J.; Garcia, X.; Ribas, A.; Fraguell, M.R. Ecological restoration of a coastal wetland at a mass tourism destination. Will the recreational value increase or decrease? Ecol. Econ. 2018, 148, 1–14. [Google Scholar] [CrossRef]
  71. Allan, J.D.; Smith, S.D.; McIntyre, P.B.; Joseph, C.A.; Caitlin, E.D. Using cultural ecosystem services to inform restoration priorities in the Laurentian Great Lakes. Front. Ecol. Environ. 2015, 13, 418–424. [Google Scholar] [CrossRef] [PubMed] [Green Version]
  72. Loures, L.; Panagopolos, T.; Burley, J.B. Assessing user preferences on post-industrial redevelopment. Environ. Plan. B Plan. Des. 2016, 43, 871–892. [Google Scholar] [CrossRef]
  73. El Garouani, A.; Mulla, D.J.; El Garouani, S.; Knight, J. Analysis of urban growth and sprawl from remote sensing data: Case of Fez, Morocco. Int. J. Sustain. Built Environ. 2017, 6, 160–169. [Google Scholar] [CrossRef]
  74. Zhou, Z.Z. Landscape changes in a rural area in China. Landsc. Urban Plan. 2000, 47, 33–38. [Google Scholar]
  75. Xu, H.S.; Du, H.Y.; Cai, C.L. Spatial characteristics of landscape pattern based on ecological restoration in the riparian zone of Huangpu river, Shanghai city. J. Nanjing For. Univ. Nat. Sci. Ed. 2019, 43, 125–131. [Google Scholar]
  76. Gao, L.; Bryan, B.A. Finding pathways to national-scale land-sector sustainability. Nature 2017, 544, 217–222. [Google Scholar] [CrossRef] [PubMed]
  77. Sandifer, P.A.; Sutton-Grier, A.E.; Ward, B.P. Exploring connections among nature, biodiversity, ecosystem services, and human health and well-being: Opportunities to enhance health and biodiversity conservation. Ecosyst. Serv. 2015, 12, 1–15. [Google Scholar] [CrossRef]
  78. Fang, Y.; Wang, J.; Huang, L.Y.; Zhai, T.L. Determining and identifying key areas of ecosystem preservation and restoration for territorial spatial planning based on ecological security patterns: A case study of Yantai city. J. Nat. Resour. 2020, 35, 190–203. [Google Scholar]
  79. Ni, Q.L.; Hou, H.P.; Ding, Z.Y.; Li, Y.B.; Li, J.R. Ecological remediation zoning of territory based on the ecological security pattern recognition: Taking Jiawang district of Xuzhou city as an example. J. Nat. Resour. 2020, 35, 204–216. [Google Scholar]
Figure 1. Distribution of landscape types in Hangzhou from 2000 to 2020.
Land 11 02114 g001
Figure 2. Evolution of landscape index at the patch level in urban areas.
Land 11 02114 g002
Figure 3. Evolution of landscape index at patch level in the main districts.
Land 11 02114 g003
Figure 4. Evolution of landscape index at the landscape level.
Land 11 02114 g004
Table 1. Meaning and description of landscape pattern indexes.
MeaningIndexDescription
Type compositionPLANDProportion of the area of a certain landscape patch to the total area
Area advantageLPIMaximum patch area as a percentage of total area
EDEdge length between heterogeneous landscape patches per unit area
Degree of fragmentationPDA higher value indicates a more fragmented landscape
Shape complexityLSIThe larger the value, the more complex the shape deviates from the geometric pattern
ConnectivityAIThe larger the value, the more aggregated the landscape
CONTAGThe degree of aggregation of different patches, and the higher value means the less discrete
Degree of separationDIVISIONThe larger the value means the higher the separation of the different patches
DiversitySHDILarger values indicate an increase in landscape types or a more balanced distribution of landscapes
Table 2. Evolution of land use landscape composition in urban areas from 2000 to 2020.
Landscape TypeComposition Ratio(%)Average Rate of Change from 2000–2010
(Percentage Points)
Average Rate of Change from 2000–2010
(Percentage Points)
200020102020
Arable land25.8124.4320.22−1.38−4.21
Woodlands61.4761.0861.06−0.390.02
Green3.874.143.970.27−0.17
Wetland0.080.170.170.09−0.01
Water5.224.846.02−0.381.18
Construction land3.545.348.561.793.23
Table 3. Transfer matrix of land use area in urban areas from 2000 to 2010.
Land Use Area
(km2)
2000
Arable LandWoodlandsGreenWetlandWaterConstruction LandTransfer in Area
2010Arable land-606.8097.054.2883.3755.69847.20
Woodlands581.67-262.850.0137.829.09891.42
Green116.37289.40-0.0110.013.72419.50
Wetland0.520.020.01-20.710.1228.27
Water51.5342.006.411.99-4.76106.69
Construction land326.8822.698.210.1218.96-376.86
Transfer out1076.97960.9374.536.41170.8673.38
Table 4. Transfer matrix of land use area in urban areas from 2010 to 2020.
Land Use Area
(km2)
2010
Arable LandWoodlandsGreenWetlandWaterConstruction LandTransfer in Area
2020Arable land-412.8881.580.3942.2755.2592.32
Woodlands549.95-285.660.0621.4110.41867.49
Green81.69284.94-0.0110.86.78384.22
Wetland1.240.390.01-10.18011.82
Water168.0892.416.5813.11-10.86301.03
Construction land506.1758.3836.780.2221-622.55
Transfer out area1307.13848.94420.5713.79105.6683.24
Table 5. Evolution of land use landscape composition in main districts from 2000 to 2020.
Landscape TypeComposition Ratio(%)Average Rate of Change from 2000–2010
(Percentage Points)
Average Rate of Change from 2000–2010
(Percentage Points)
200020102020
Arable land53.2548.5136.68−4.74−11.83
Woodlands20.2020.2721.300.071.03
Green2.552.741.610.19−1.14
Wetland0.410.840.810.43−0.04
Water9.047.089.49−1.962.41
Construction land14.5520.5630.116.019.56
Table 6. Transfer matrix of land use in main districts from 2000 to 2010.
Land Use Area
(km2)
2000
Arable LandWoodlandsGreenWetlandWaterConstruction LandTransfer in Area
2010Arable land-61.9115.074.1752.2233.88167.24
Woodlands67.20-20.610.001.172.9591.94
Green18.0722.36-0.010.281.5442.26
Wetland0.420.000.00-20.230.0020.64
Water17.970.880.291.91-1.8622.91
Construction land221.534.511.620.1014.19-241.96
Transfer out area325.1989.6637.596.1988.0940.23
Table 7. Transfer matrix of land use in main districts from 2010 to 2020.
Land Use Area
(km2)
2010
Arable LandWoodlandsGreenWetlandWaterConstruction LandTransfer in Area
2020Arable land-33.5310.920.2627.1327.6499.48
Woodlands50.18-42.350.000.452.1295.10
Green9.0015.74-0.000.133.2428.11
Wetland1.890.030.00-10.120.0012.04
Water109.371.790.6412.97-7.40132.17
Construction land326.289.9610.500.0713.48-360.29
Transfer out area496.7259.5264.4113.3051.3140.40
Publisher’s Note: MDPI stays neutral with regard to jurisdictional claims in published maps and institutional affiliations.

