Article

Modelling Impact of Urban Expansion on Ecosystem Services: A Scenario-Based Approach in a Mixed Natural/Urbanised Landscape

by
Fatemeh Mohammadyari
1,*,
Ardavan Zarandian
2,
Mir Mehrdad Mirsanjari
1,
Jurate Suziedelyte Visockiene
3 and
Egle Tumeliene
3
1
Department of Environmental Sciences, Malayer University, Malayer 65719-95863, Iran
2
Research Center for Environment and Sustainable Development (RCESD), Department of Environment, Tehran 19395-4697, Iran
3
Department of Geodesy and Cadaster, Vilnius Gediminas Technical University, Sauletekio av. 11, LT-10223 Vilnius, Lithuania
*
Author to whom correspondence should be addressed.
Land 2023, 12(2), 291; https://doi.org/10.3390/land12020291
Submission received: 12 December 2022 / Revised: 6 January 2023 / Accepted: 17 January 2023 / Published: 19 January 2023
(This article belongs to the Special Issue Applying Earth Observation Data for Urban Land-Use Change Mapping)

Abstract

:
The present study aims at predicting future land use/land cover (LULC) and quantifying and mapping the ecosystem services (ESs) of water yield, outdoor recreation opportunity and food production in current (here, 2017) and future landscapes in Northern Iran, using the InVEST, Recreation Opportunity Spectrum (ROS) and yield models. To that end, two LULC scenarios known as business as usual (BAU) and protection-based (PB) plan were applied for 2028, using the Markov Artificial Neural Network and Multi-objective land allocation (MOLA) models. The results show that rapid urbanisation, caused by the expansion of human settlements and industrial areas, has led to a decline in the ESs in the region. Compared to the ESs in 2017, the service of water yield increases as urban expansion increases, whereas food production and recreation services decrease as urban expansion increases, under the BAU scenario. On the other hand, in the PB scenario, relatively better conditions can be observed for all three ESs. Considering that the ecological structures of this region have been severely affected by rapid urban expansion, the results of this research will be useful for maintaining the existing ESs and can greatly affect planning and decision-making regarding future development towards urban sustainability.

1. Introduction

As a functional and dynamic unit of the biosphere, an ecosystem consists of living organisms and the physical environment in which interaction and material exchanges are witnessed [1]. Ecosystems, with the goods and services they provide, underlie all aspects of human, cultural, social and economic well-being [2] and provide an important material basis for development [3]. However, they are under threat from anthropogenic drivers including climate change, urbanisation and agricultural intensification and expansion [4], which have serious effects on nature (which provides such goods and services [5]). Meanwhile, since changes in ecological parameters are not tangible to most humans and development decision-makers, ecosystem services (ESs) are used to link ecological or biophysical changes to economic and social consequences [6].
ESs refer to delivering services to human beings through special ecosystems under appropriate ecological situations and functional and structural integrity [7]. ESs provide a large number of satisfaction-related advantages to human beings, such as well-being, selection, social relationships, personal security, social sustainability and human needs. Thus, ESs are indispensable to human health and sustainable development [8] and comprise four categories: provisioning services, regulating services, supporting services and cultural services [5].
Urban expansion, resulting from the development of human activities such as industrialization and urbanization, reduces the construction of ecological and natural infrastructure of a region and, thus, causes a decrease in the provision of ESs [9,10]. In this regard, urban expansion refers to a dynamic process, growing towards the surrounding natural regions [11], that leads to land use/land cover (LULC) change and the alteration of ecosystems and their services [12]. Due to human activities, especially in terms of land use or land management change, ESs undergo significant variation [13]. The changes in ESs reflect the impacts of anthropic activities on the ecological environment and directly or indirectly affect patterns, processes and ecosystem functions [14].
Therefore, investigating the effects of urban development on ESs has become an urgent and significant task in the better realisation of urban ecology and achieving urban stability and sustainable urban development [15,16]. In addition, evaluating and predicting the current and future condition of ES supply based on different plausible scenarios can assist decision-makers [17] in taking efficient measures to deal with environmental issues in a more informed way [18].
In a wide variety of studies, possible scenarios have been programmed based on local LULC policies or only focused on improving one particular ES [19]. In this regard, scenario-based modelling [20] and mapping [18] of multiple ESs has aroused widespread attention, leading to specific research aimed at implementing the concept of ESs [21]. In this research, due to the proximity of natural and urban areas where the supply and demand of ESs are exchanged, this approach was performed in a mixed urban/natural landscape.
In recent years, the evaluation and modelling of urban ecosystem services have also been taken into consideration. In most studies, regulating services (carbon sequestration and air pollution removal services) were the most common subjects [22,23,24,25,26]. In the meantime, a small number of studies were associated with food provision, recreation services and water yield. Considering the importance and priority of these services for city residents, this research focused on their modelling. In this sense, water yield is critical in water resource management [27] and the health and well-being of the urban population [28]. Outdoor recreational opportunity is also an important factor in human well-being [29]. Food production is vital to ensuring food safety and urban stability [30]. Thus, quantifying and modelling these services are essential in urban planning [31].
However, studies that have been performed on the effects of urban expansion on these services (food provision, outdoor recreational opportunity and water yield) are still insufficient. In this regard, Reference [16] investigated the effects of urban expansion on several ESs in a metropolitan area. It was found that food supply services, habitat quality, carbon storage and soil conservation decrease with increased urbanisation and water service increases as urbanisation increases. Similarly, Reference [32] modelled urban expansion and its relationship with multiple ESs (recreation opportunity, carbon storage, biodiversity conservation) in the Wuhan metropolitan area. They found that, to a large extent, global urban expansion causes the destruction of ESs and changes in relation to exchanges and synergies. Reference [33] found that the services of food production, water supply, raw materials, air quality and climate regulation are greatly affected by urbanisation, while recreation and habitat quality are less affected by urbanisation. By reviewing various studies, it was found that, in different parts of the world, especially the areas that face unplanned and unstable urban growth, natural and ecological structures and assets have been severely damaged. Consequently, people’s livelihoods and well-being have been threatened due to the lack of supply of ecosystem goods and services.
A wide variety of methods has been used to model important ESs in urban ecosystems. For example, the Integrated Valuation of Ecosystem Services and Trade-offs (InVEST) water yield model has been extensively used by water resource managers to model the hydrological balance [34,35]. Moreover, the most common methods used in modelling recreation services are the InVEST model [36,37] and Recreation Opportunity Spectrum (ROS) [12,38,39,40]. Eventually, various factors are involved when investigating food production, yield quality, nutritional value and the amount of land [41]. Therefore, food supply quantification has been performed in different ways, including the use of statistical data of the agricultural yield [42], the comprehensive evaluation of agricultural suitability by indicators [43], harvested energy [44] and a yield model [19].
Although ES studies in Iran have recently focused on urban ecosystems, these studies are limited and in their early stages. Meanwhile, in more advanced countries, the quantification of urban ESs has received much attention.
The dominant composition of the recent Karaj landscape has been green cover and it is known as a ‘garden city’. The proximity of the Karaj metropolis to the capital city and communication highways to the west and south of the country has caused increased growth of the city’s area and population density (beyond its capacity). The natural resources available have been dramatically degraded because of the rapidly growing population that migrated to this city due to rapid industrialisation. This means that ecological structures have been threatened, causing damage to the sustainability of the urban environment, so that the continuity of citizens’ lives and their social well-being has decreased. In fact, the city of Karaj, near the capital of Iran, suffers from development instability, especially in terms of damage to its infrastructure and ecological assets. In this sense, urban expansion, LULC change, destroyed urban green spaces, recent droughts, the characteristics of climate seasonality, lack of rainfall, increased evapotranspiration, reduced water supply and increased water stress have all greatly reduced the capacity of ESs in this area. Accordingly, this city was chosen as a case study. Herein, we believe that the application of the ESs approach, as an integrated economic-social and ecological strategy, can greatly affect planning and decision-making regarding future developments towards urban sustainability. This investigation is the first attempt at quantifying and assessing ESs in the Karaj landscape, which has been experiencing dramatic urban change and intense environmental change.
In this research, the LULC map was initially generated using satellite imagery data of the Karaj landscape in 2006, 2011 and 2017. Afterwards, considering two different scenarios, an LULC simulation map was prepared for 2028. In this sense, the present study aims to predict future LULC by quantifying and mapping the ESs of water yield, outdoor recreation opportunity and food production in current and future landscapes. Comparing the results can contribute to proposing the most effective policy related to landscape-cover changes and sustainable urban development policies, achieving a sustainable city in the study area.

2. Materials and Methods

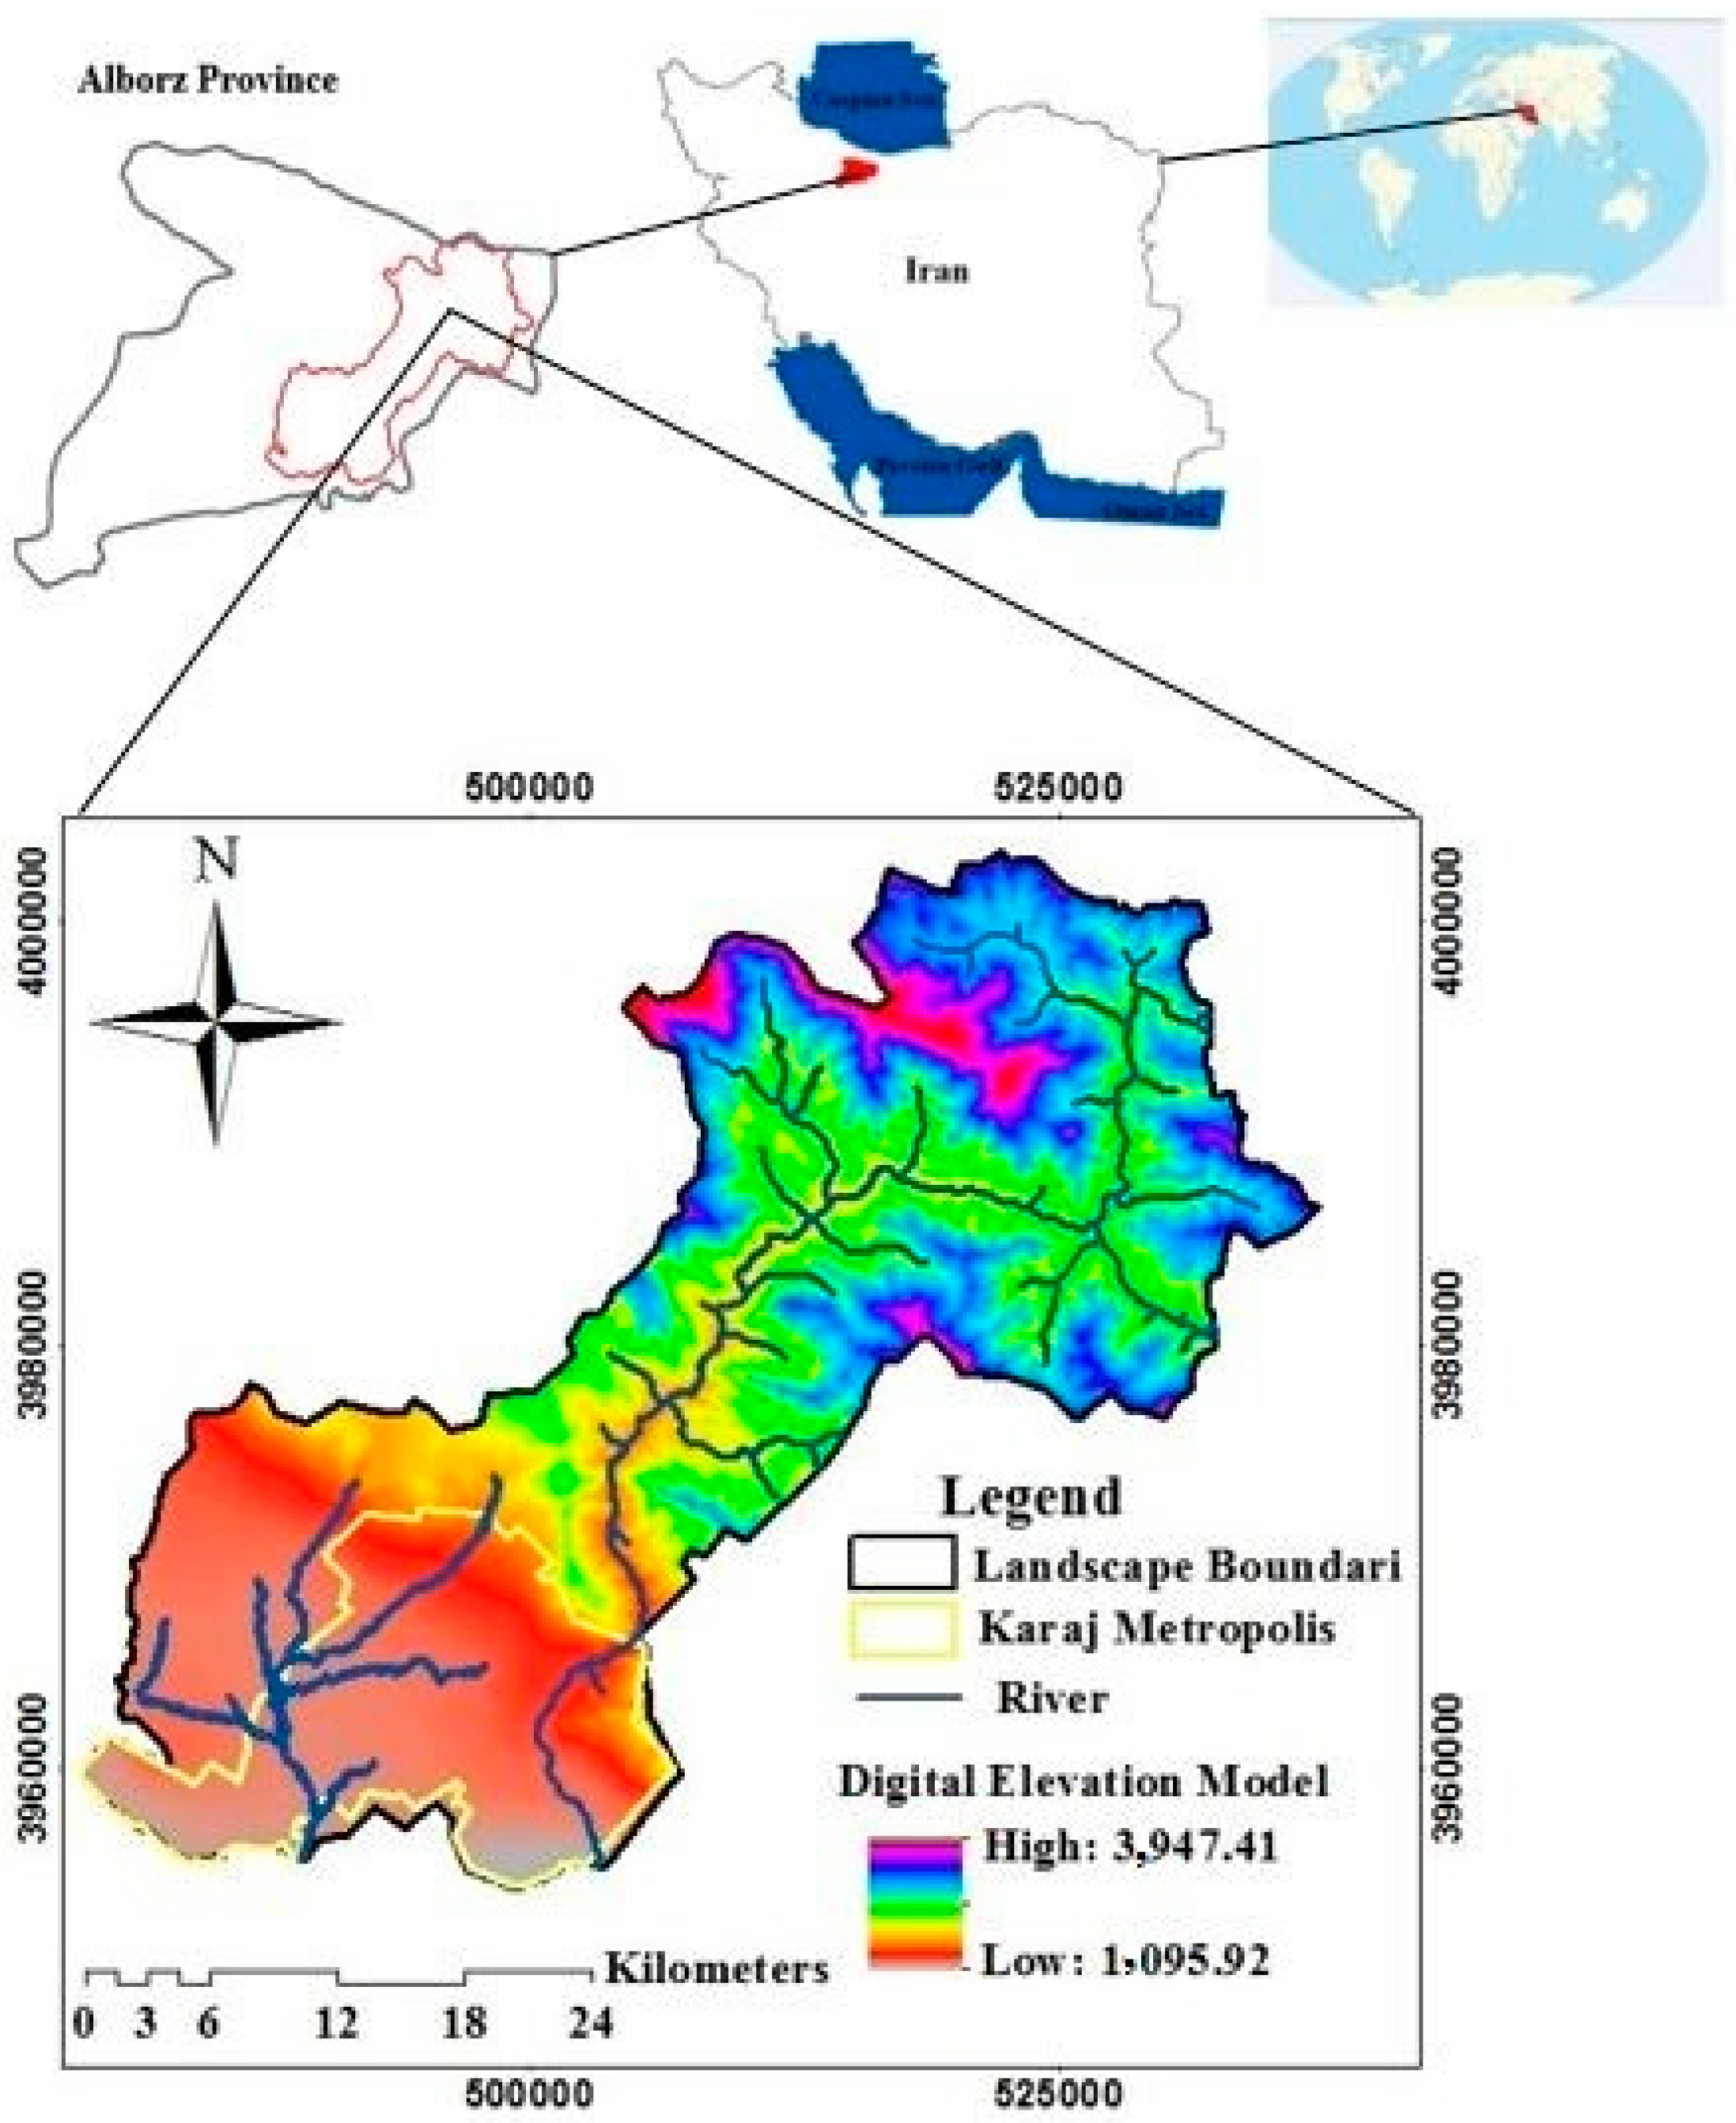
2.1. Study Landscape

The Karaj landscape (35°46′–36°09′ N, 50°46′–51°21′ E) covers an area of 117,520 ha in the east of Alborz Province, Iran. Karaj city is the fourth-largest city in Iran and the first populated city in Alborz Province, with a population of 1,592,492 people, according to the 2017 census. Moreover, about 96.2% of the population live in urban regions, with 3.8% living in rural areas (https://amar.org.ir/english, 20 January 2018). This region is mountainous, with an average altitude of 1300 m above sea level. The average annual rainfall and temperature are 247 mm and 14.4 °C, respectively. According to the Köppen–Geiger classification system, the Karaj metropolis is categorised as having a cold semi-arid climate. To better examine ESs and the influencing mechanism of urbanisation, the case study area was divided into two districts: upstream (ES supply locations) and downstream (ES demand locations) landscapes. In this regard, the upstream landscape is mainly covered by mountains, forest, grassland and gardens, which have a high potential for ecotourism. Regarding Alborz Province, there are two important water sources: the Karaj River and the Amir Kabir Dam; the Central Alborz Protected area is also in this district. The Karaj River is the most important waterway in the Alborz province and Karaj metropolis. Furthermore, most of the water in this river is transferred to Tehran city after being restrained in the Karaj dam. In addition, despite massive water production in the Amir Kabir Dam, a small part of it is consumed in the Karaj landscape but most of it is allocated to agriculture and drinking purposes in Tehran province. In addition, the popular Chalous Road—one of the busiest recreational roads—connects the district to the north of Iran. It is worth mentioning that the Karaj metropolis and agricultural land are located in the downstream landscape (Figure 1).

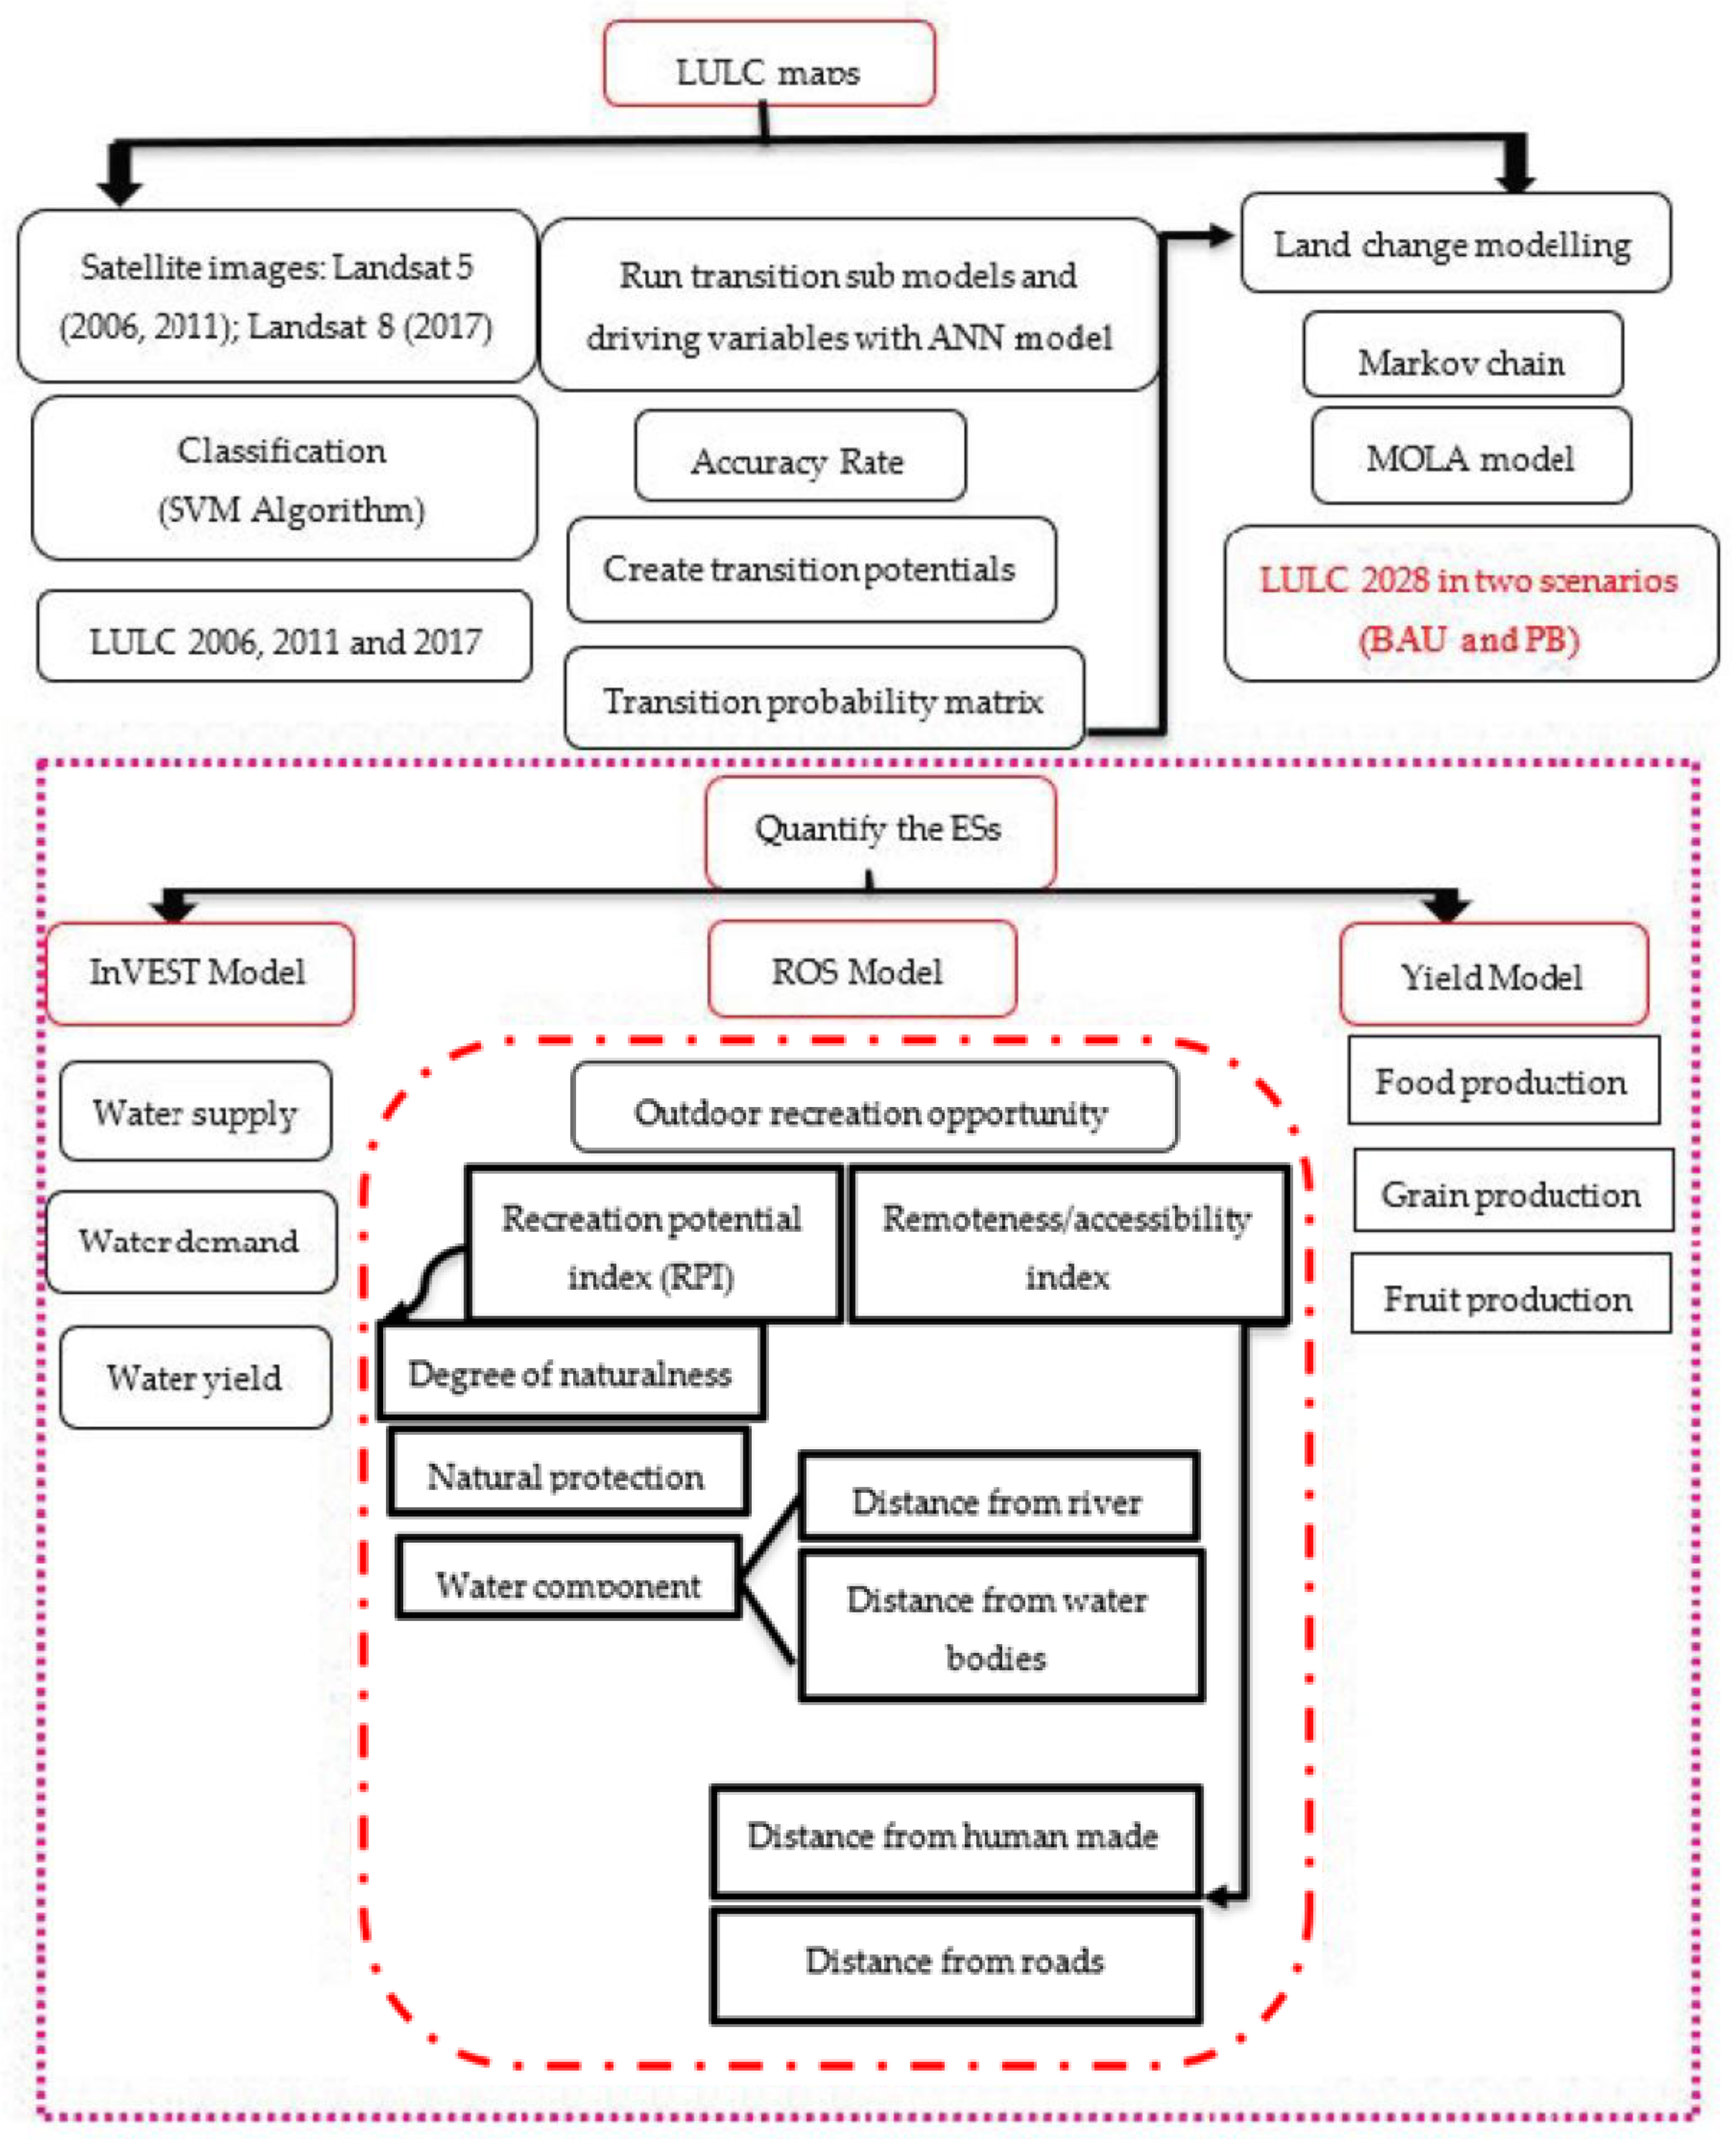
2.2. Data Sources and Methods to Quantify the ESs

In this study, three ESs were selected: water yield, food production and outdoor recreation opportunity. The selection of ESs was based on their importance in the region, data availability, interviews with local stakeholders, the knowledge of scientists from different disciplines and research centres and literature reviews for the ESs in an urban context [23,45]. The InVEST software tool was applied to model water yield [16,33], food production was evaluated with the Sun and Li yield model [19], and the ROS model was used to quantify outdoor recreation opportunity [37].
In addition, the Markov Artificial Neural Network (ANN)—Multi-objective land allocation (MOLA) model was used to model the future LULC (year 2028) in the first and second scenarios. The first scenario was defined on the basis that the process of LULC change will continue, compared to previous years, without any restrictions. On the other hand, the definition of the second scenario was based on the intervention of the government to prevent the destruction of agricultural land to stop the current process of LULC change. The second scenario, based on the protection of natural assets, was defined by assuming the existence of limits for the unsustainable development of human and industrial infrastructure and, if implemented, it is expected to change the current unsustainable development process towards gradual sustainability.
The sources and input data for ES assessment and LULC modelling are presented in Table 1. Moreover, the general structure of the study is indicated in Figure 2.

2.3. LULC Changes and Future Scenarios in the Karaj Landscape

The Landsat images were classified using the Support Vector Machines (SVM) algorithm [11,48,49] in the ENVI 5.3 software. The generated LULC were categorised into ten classes: Human-made (including rural settlements, urban areas, industrial land and mining land); Agriculture (all areas used for crop production); Garden; Water bodies (the deep and shallow waters of the Amir Kabir Lake dam); Low dense grassland (including sparse vegetation surface); Dense grassland (including moderate to good vegetation and shrubs); Barren (including uncovered, unutilised and barren land); Rocky outcrop; Greenspace (parklands); and River (Karaj River).
In order to confirm the accuracy of the classification, the kappa standard, kappa location, kappa no. and FoM in the IDRISI VALIDATE module were calculated. FoM is a number between 0 and 1, indicating complete overlap (1) and no overlap (0) between the simulated and real maps, respectively. FoM was obtained using Equation (1) [50].
FoM = Hits Misses + Hits + False   Alarms
where Hits denotes the correct pixels where land use change has occurred in the observed and simulated data; Misses means the pixels that were fixed in the simulated data, although in the observed data they have changed; and False Alarms are errors that the model predicts changed but did not do so in observation.

2.3.1. Future Scenarios in the Karaj Landscape

Business as Usual Scenario (BAU)

This scenario was created based on a recent investigation [51] that considered the continuation of the present transformation trend of natural and green covers (agriculture, garden and grassland) to human-made areas. The comparison of the current status (2017) and base map (2006) indicated that agricultural lands have been dramatically reduced and rapidly replaced by human-made classes. In this sense, Markov and ANN models were applied to simulate LULC in 2028, using the LCM tool in IDRISI Terrset 16.3 software [52,53,54,55,56]. The transition potential of each LULC was modelled using ANN. The output of this step was used as the input for the Markov model. The Markov chain model is a stochastic process model that explains how likely one state is to change into another. In addition, the transition probability matrix is created from the Markov chain analysis in the LCM model (for more details, see [57]). The combination of ANN and Markov models is a robust approach that can be used to successfully simulate future urban expansion [58].
In the present research, the LULC map in 2017 was modelled using LULC maps from 2006 and 2011 and applying Markov and ANN models. The accuracy of this model was 90% compared to the real LULC map in 2017. Afterwards, the LULC map in 2028 was modelled based on the maps from 2006 and 2017, utilising the integrated method.

Protection-Based Scenario (PB)

This scenario modelled the interference of governmental conservation policies towards preserving agricultural and garden lands that are at risk of being converted to human-made areas. Applying this scenario will prevent the conversion of 1316.97 ha of agricultural lands and 161.42 ha of garden lands to built-up areas. To implement this scenario, MOLA was used to simulate land use in 2028. This method was conducted to dedicate new land use transfer and predict variations [59]. It is worth mentioning that MOLA authorises the utilisation of suitability maps, according to Multi-Layer ANN, to help divide the amount of variation predicted by Multicriteria decision analysis (MCDA) in various LULC classes [60]. Moreover, the main purpose of using the MCDA method is to provide a basis for evaluating a number of alternative electoral possibilities, based on multiple criteria [59]. Furthermore, an Analytical Hierarchy Process (AHP) method was used to determine the weight of the criteria [59] and the Weighted Linear Combination (WLC) method was used to overlay maps [61,62].

2.4. Assessing ESs

2.4.1. Water Yield

The model was developed using InVEST software, based on precipitation, storage and evapotranspiration data [38]. In fact, this model shows how variation in LULC patterns influences the annual water yield [12]. Regarding the InVEST model, evapotranspiration is the main parameter in computing the water yield depth under the assumption that precipitation is constant [34]. Evapotranspiration is interceded by transpiration through plants [63] and the shading effect of vegetation cover also changes heat fluxes in the soil, consequently leading to a reduction in evaporation [34,64]. The amount of rainwater permeating into the watershed’s subsoil and groundwater is calculated through soil depth, the available water content for plants and root depth [29]. The calculation of annual water yield is based on Equation (2).
Yx = ( 1 AETx Px ) .   Px
where Y(x), AET(x) and P(x) refer to water yield, the annual actual evapotranspiration of grid unit x and the annual precipitation amount of grid unit x, respectively. Moreover, AET(x)/P(x) represents vegetation evapotranspiration [35]. In order to calculate the mean annual evapotranspiration, the ‘Modified Hargreaves’ equation [17] was applied, using:
  • Daily average, maximum and minimum temperatures.
  • Mean daily maximum and minimum differences.
  • Extra-terrestrial radiation.
All information was acquired from the Karaj synoptic meteorological station. The data were collected from the Iranian Meteorology Organization’s daily database (http://irimo.ir/far/, 17 June 2017). The factors related to the soil, such as plant available water and soil depth [46], were not accessible and so, accordingly, we used data from the Harmonized World Soil Database (HWSD) provided by FAO [17,65]. Moreover, plant available water was obtained from HWSD and then divided by soil depth in order to determine the plant available water content (PAWC) fraction throughout the landscape. PAWC is the fraction of water content in the soil profile that is available for plants [46]. Notably, the model assumptions are based on the processes at watershed and sub-watershed scales. The whole landscape was considered to be one large watershed containing five sub-watersheds. Regarding each LULC class, plant evapotranspiration coefficients (Kc) were computed based on the existing coefficients in the relevant literature: Human-made = 0.10; Agriculture = 0.65; Garden = 0.70; Low dense grassland = 0.80; Dense grassland = 0.90; Barren = 0.50; Water bodies, Rocky outcrop, Greenspace and River = 1.00 [38].
The total water demand was calculated as the quantity of water consumption in agricultural land and human-made areas. Consumptive water in farmland was assumed to be the water used by agricultural activities that are not returned to the watershed. Considering the human-made area, water-use was calculated according to the water consumption per person, multiplied by the relative population density per square km and generalised to each pixel of the raster map with a resolution of 30 m [1]. Water consumption was also calculated according to the water demands for each type of crop in the irrigation plan of the Karaj metropolis. Various biophysical variables for model implementation are represented in Table 1 and further information related to the water yield model can be found in the InVEST user guide [46].

2.4.2. Food Production

Food production was examined for the current situation (CU), the business as usual scenario (BAU) and the protection-based scenario (PB) in two steps, as described below.

Calculation of Food Production Using the Yield Model

In this step, the production of fruits and grains was considered in the area. Food production was calculated using the yield model (Equations (3) and (4)) [19].
PRO G = i = 1 i A i × R Gi × P Gi
PRO F = i = 1 i A i × R Fi × P Fi
where PROG and PROF indicate the production of fruits and grains, respectively. Ai is the area of district i in the Karaj landscape; RFi and RGi indicate the area proportions of fruits and grains in the range of i, respectively, and PFi and PGi indicate the yields of fruits and grains per area unit for each district, respectively.

Calculation of the Relevant Capacity of LULC Classes for Food Production

To calculate the present level of ES delivery produced by each LULC class, the viewpoints of thirty scientists were collected from various sectors of governmental institutions (five of these scientists were members of the Iranian Association for Environmental Assessment (http://www.iraneia.ir/en, 24 August 2018)). In this regard, a questionnaire was designed based on the opinions of Burkhard et al. [66,67]. The questionnaire included a matrix specifying the relationship or disaffiliation between each LULC class and food production service. Afterwards, each participant was asked to specify the disaffiliation or relationship between each LULC class and food production by signing ‘Yes’ or ‘No’ in a matrix, to identify the resources producing this ecosystem service. Subsequently, they gave a score for the effective resourcing of food supply in the range of 0 to 5: 0 = no capacity to supply the selected ESs; 1 = very low capacity; 2 = low capacity; 3 = medium capacity; 4 = high capacity and 5 = very high capacity. The scores were averaged and then the values of average capacity were transferred to Arc GIS software to prepare a food production map for current, BAU and PB scenarios for the study landscape.

2.4.3. Outdoor Recreation Opportunity

Outdoor recreation opportunities refer to an ecosystem’s capacity [37] to provide outdoor recreation activities such as walking, running, outdoor sports and enjoyment in watching plants and animals. Therefore, the ROS model was conducted to determine the outdoor recreation service. The model simulates recreation opportunities provided by nature at a local level, as categorised in the ESs cascade [68]. This method was undertaken to assess outdoor recreation in the European Union [69]. Recreation potential covers three essential aspects of people’s behaviour and preferences for outdoor activities [47]. This model is estimated according to two indicators: the recreation potential index (RPI) and the remoteness/accessibility index (RAI).
The first component of the RPI relates to people’s preferences for more natural regions and concerns the degree of naturalness [12,19,38]. The second component of the RPI refers to the protected regions, as they indicate a high natural value [70], and the third one is the attractiveness of water bodies [71]. The degree of naturalness is simulated according to the Hemeroby index [38], which determines the human effect on vegetation and landscape, ranging from 1 (natural) to 7 (artificial). Moreover, the degree of naturalness was obtained for each LULC class [37,72,73]. The protected natural regions are scored based on the management classes of the International Union for Conservation of Nature (IUCN) [74]. The protected areas were classified by focusing on their significance for recreation aims in the range between 1 (with the highest natural value) and 0 (the lowest). In this regard, the protected areas were mapped using information from the database of the Department of Environment of Iran. Based on the database, there are two protected areas (the Central Alborz Area and Karaj River) in the study area.
The water landmark is considered a natural key factor for leisure and recreation activities [75]. The attractiveness of water bodies was determined by measuring the distance to all surface water bodies [38]. Two layers of distance from the river and from water sources were prepared with a buffer function. The layers were then standardised using the decreasing linear fuzzy method (Table 2).
Moreover, in this method the remoteness/accessibility index (RAI) or access to the recreation sites was examined [19]. The RAI was determined by applying the proximity analysis in the ArcGIS toolbox to compute the straight distance from roads and human-made areas with a buffer function [12,19]. Table 2 shows the control points and the selected membership function.
The final RAI map was prepared according to the parameters presented in Table A1 (Appendix A) [47]. Notably, this method was slightly modified to augment the precision of spatial distributions of recreation potential. The final ROS was obtained by combining the RPI and RAI, based on the parameters in Table A2 (Appendix B).

3. Results

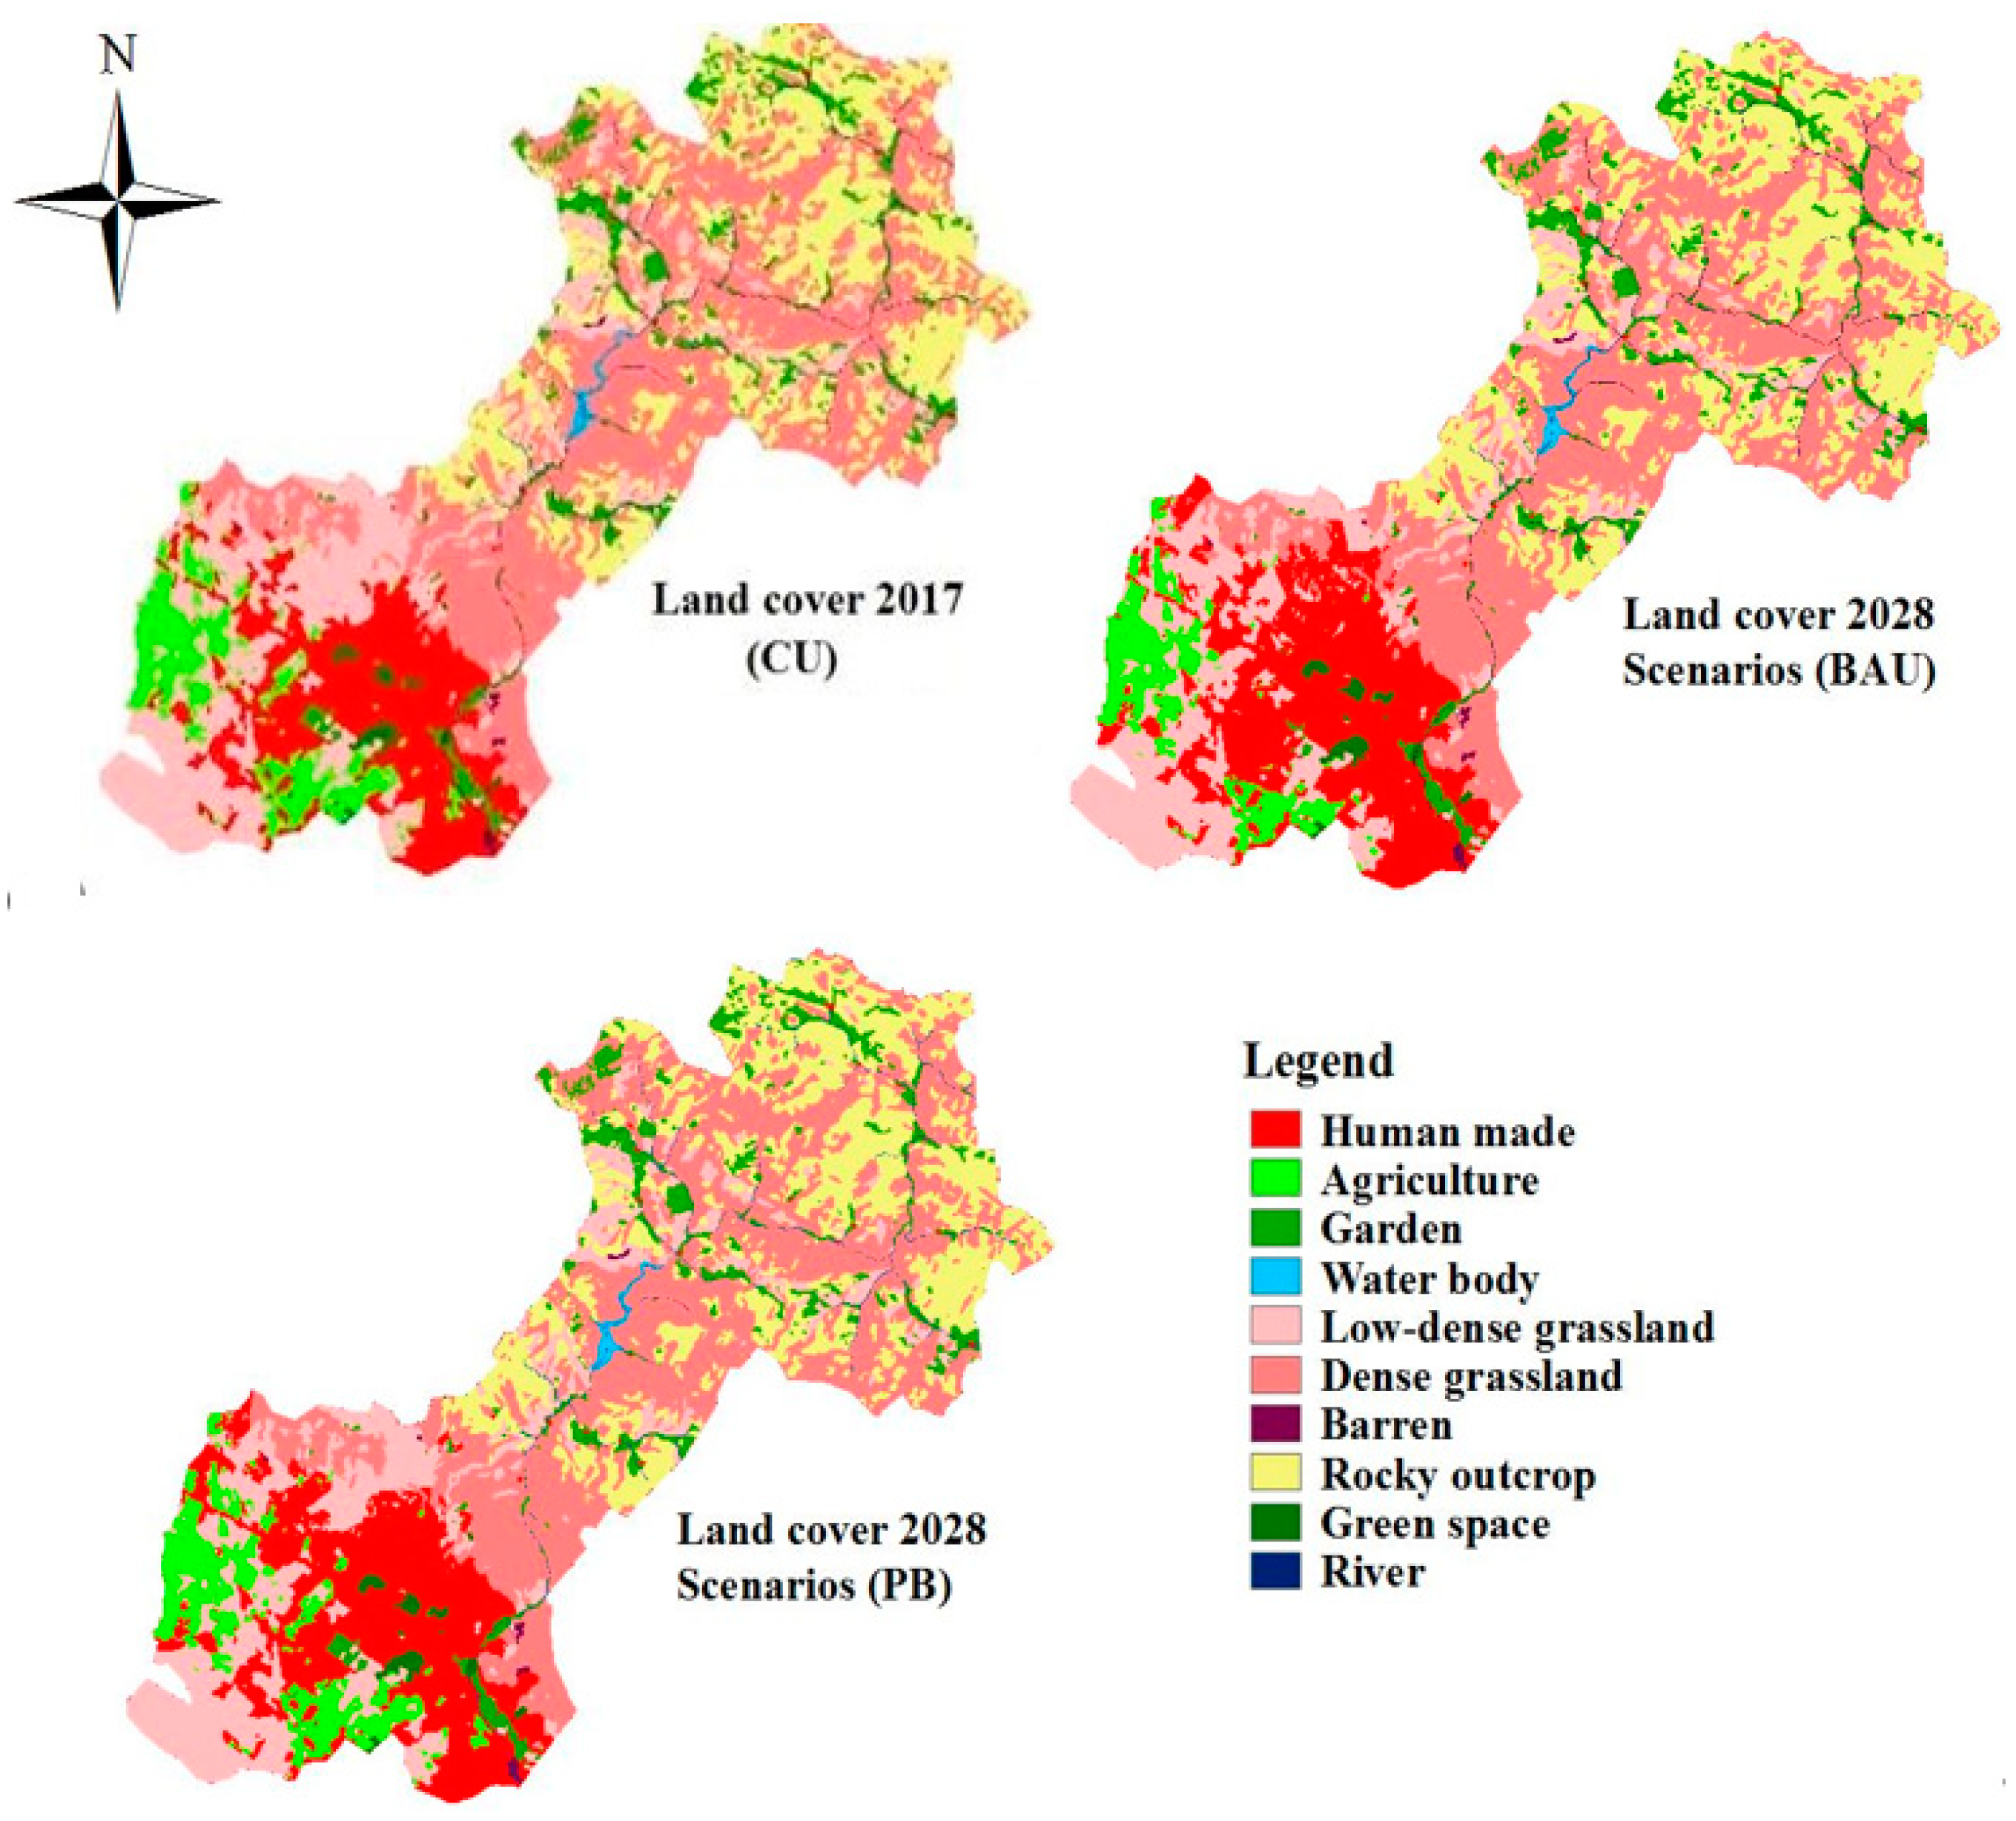
3.1. LULC in CU Situation and Two Scenarios

Kappa indexes (K standard = 0.92; k location = 0.94 and k no. = 0.95) and FoM coefficient (0.89) indicate satisfactory results of the Markov chain and MOLA models in LULC modelling. The results confirm that these models are suitable for modelling urban expansion. From 2017 to 2028, the proportion of different classes was as follows (from the highest to the lowest, respectively): dense grasslands, rocky outcrop land, low dense grassland, human-made, garden, agriculture, rivers, and green space. It is worth mentioning that water bodies and barren land had the lowest proportion of LULC class in the Karaj landscape. As shown in Figure 2, the BAU scenario, agricultural, garden and low dense grassland increased in the downstream landscape and, in some parts, they were converted to human-made land. On the contrary, in the upstream landscape, dense grassland decreased, which can be related to overgrazing. According to the BAU scenario from 2017 to 2018, agricultural lands, gardens, dispersed grasslands and dense grassland decreased, while agricultural land and gardens experienced the highest reduction. Based on this scenario, it was expected that the area of agricultural lands would experience a reduction from 6511.86 ha to 5199.85 ha (i.e., a 20% reduction of agricultural lands in the next 11 years). Furthermore, the garden areas will be reduced by 202.38 hectares. According to this scenario, the development of human-made areas will continue to increase in the future. Thus, the area of this class will increase by 29%, from 14,478.66 ha to 18,729.64, compared to that of 2017 (CU situation).
In the PB scenario, applying efficient management practices will prevent the transformation of gardens and farmland to the human-made class (conserving 1273.31 ha of agricultural lands and 161.42 ha of gardens). In this scenario, human-made areas are still increasing because of high demand for settlements due to a high population, but the intensity of the increase is less than that of the BAU scenario. In general, regarding the current scenario, 12, 13 and 14% of the land area are under the human-made, agricultural and water body classes, respectively.
The modelling results indicate that, in the PB and BAU scenarios, 10% and 12% are agricultural and garden lands, and the remaining 76% and 73% are covered by natural land cover and water ecosystems, respectively. However, the spatial distribution of the landscape elements is different for each scenario (Figure 3). Moreover, the findings showed that the most significant LULC change was manifested by urban growth and garden, grassland and agricultural land reduction in the Karaj landscape during 2017–2028 (Table 3).

3.2. Changes to ES Flows
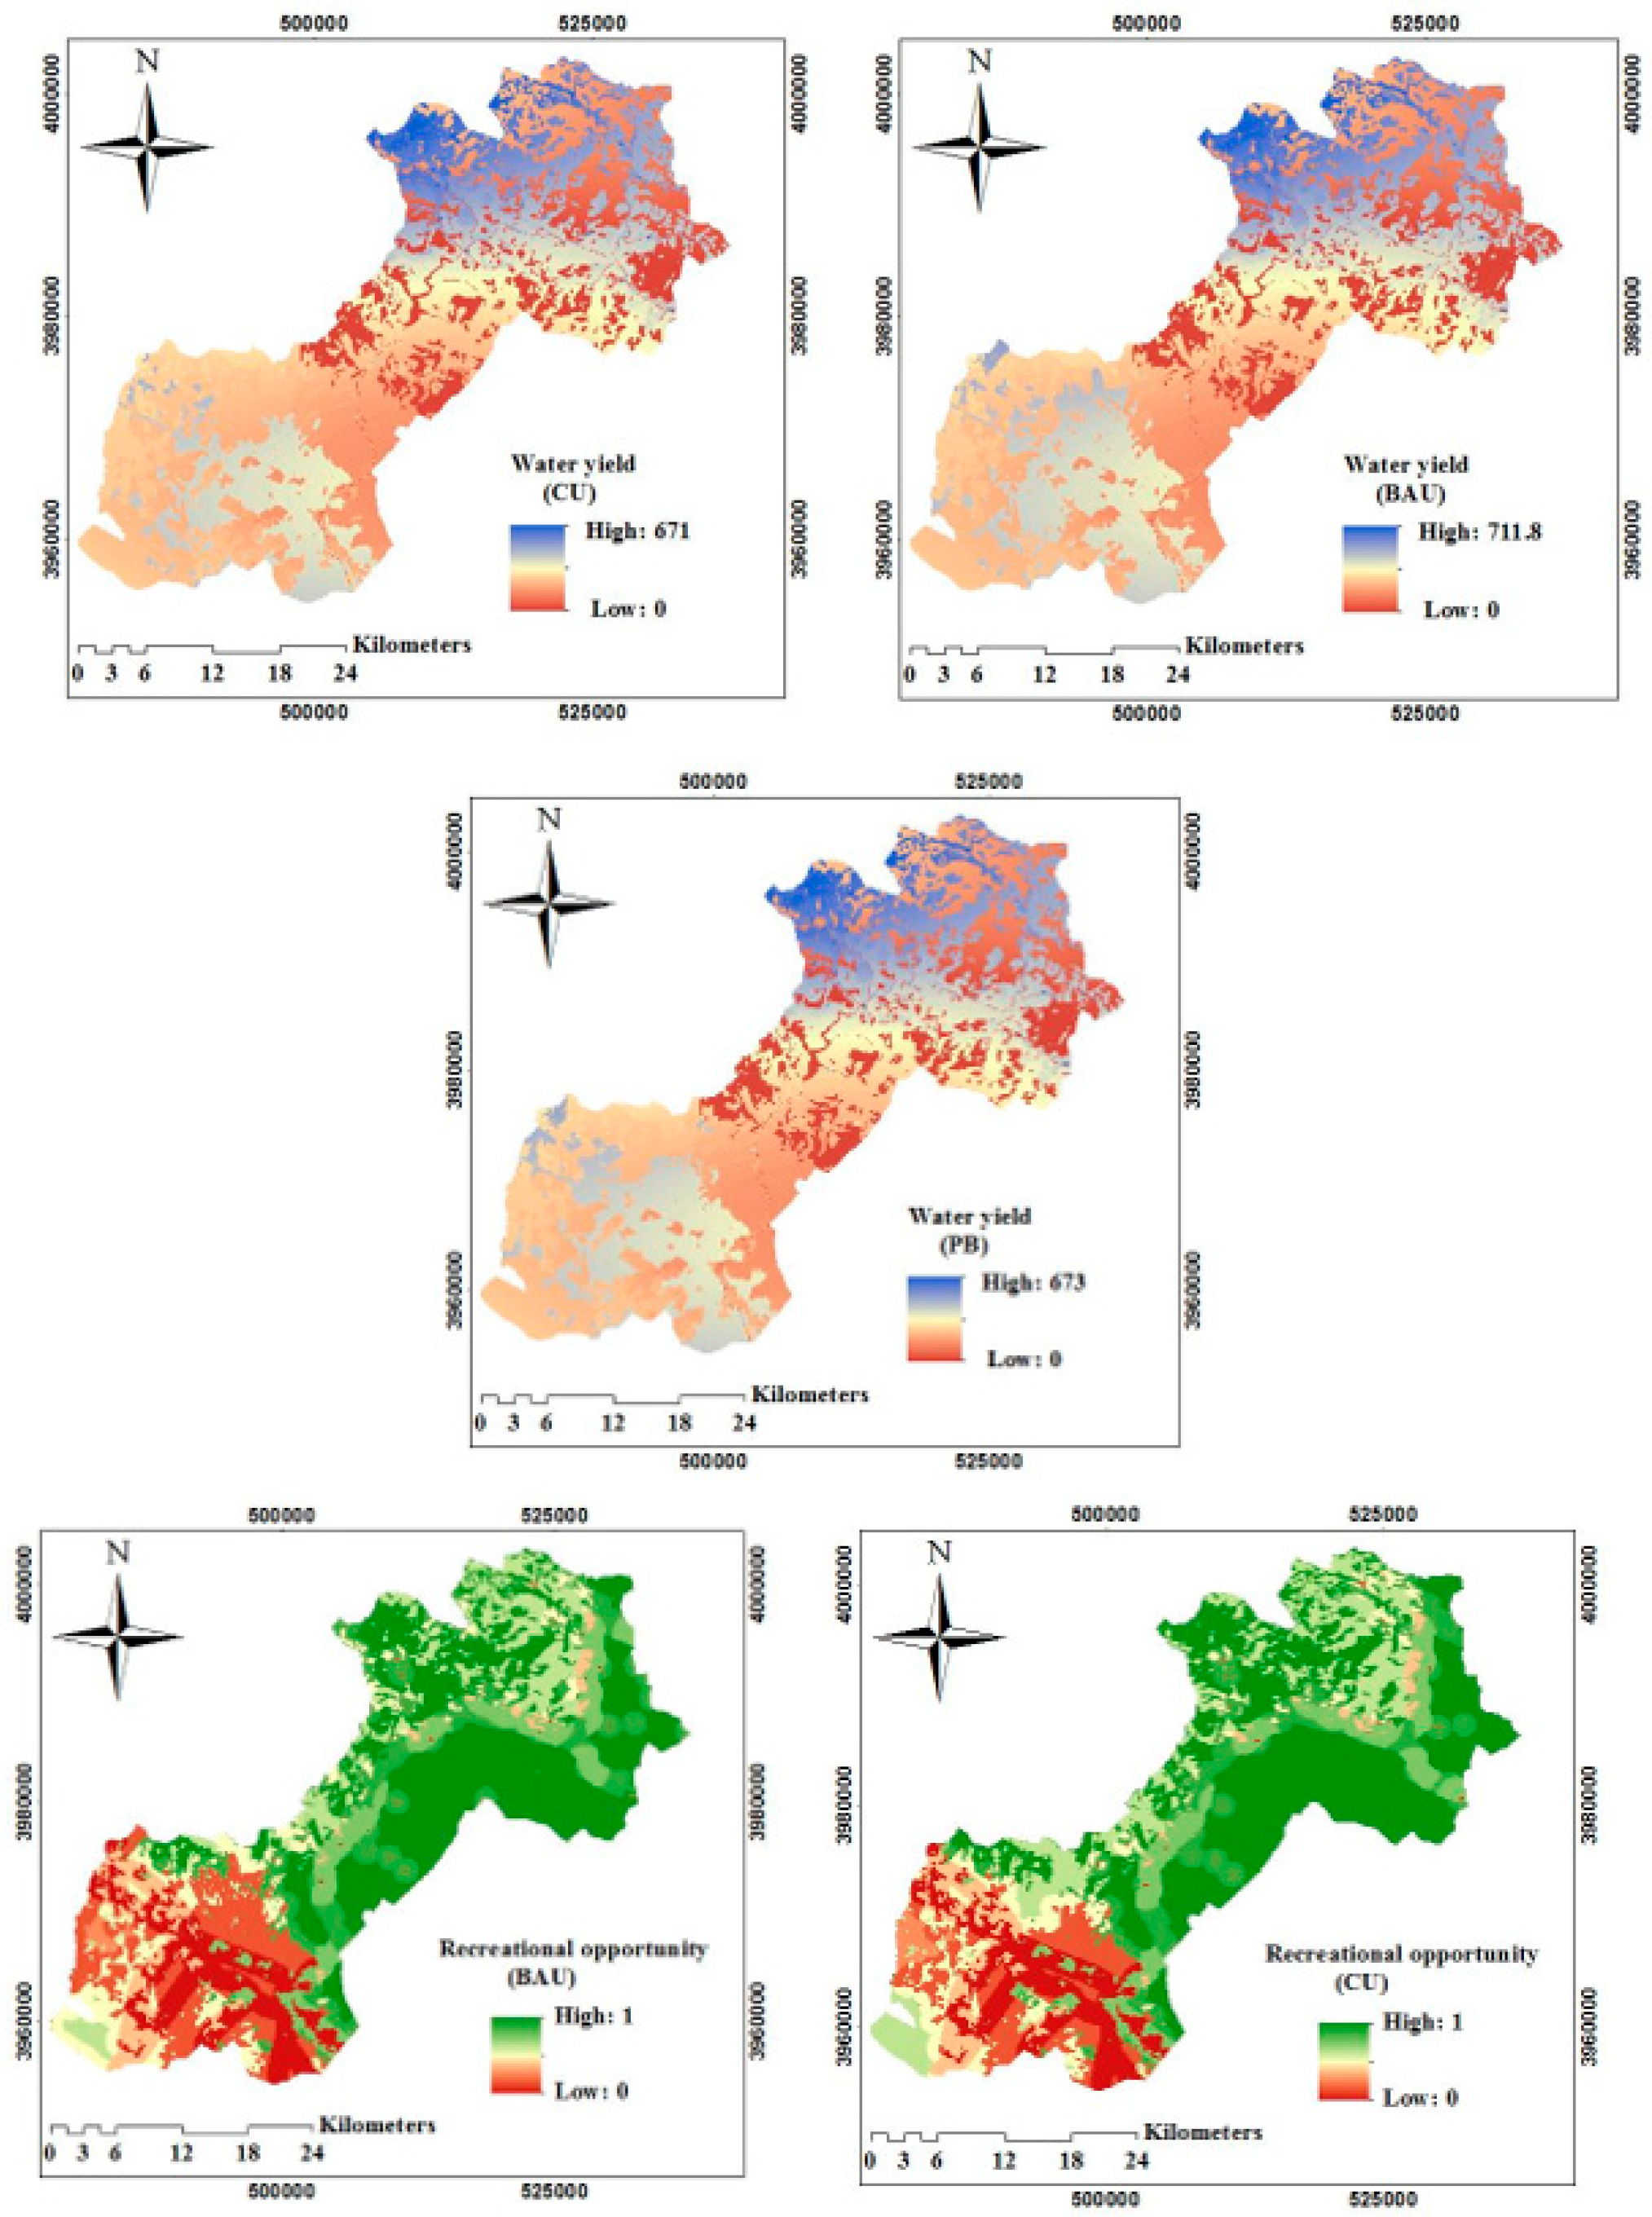
3.2.1. Water Yield

The outputs of the InVEST water yield model were the volume of water yield in the sub-watershed scale and the estimated water yield per pixel. One of the outputs is in the form of a shapefile and a table containing biophysical output values per sub-watershed and the other is in the form of a raster map. In CU and the two scenarios, the ESs were assessed at the sub-watershed scale and the results of the water balance are presented in Table 4. The results show that the average water balance and the amount of available water will be enhanced in all scenarios, since green areas and natural cover transformation (low dense grassland, dense grassland) lead to decreasing evapotranspiration. The increase in water yield due to the reduction in evapotranspiration is not a positive result for water but it signifies the sudden release of water due to the destruction of grassland and gardens, instead of being stored in plant tissue and then being gradually released throughout the year.
According to the model predictions, although the water yield would increase, the water demand outweighs the water resource due to the excessive water consumption in the region. This may result in increased access to groundwater aquifers, subsequently leading to a decrease in groundwater storage. The PB scenario indicates a minimum decrease in water supply potential, signifying more efficiency in terms of water consumption compared to the BAU scenario. Moreover, regarding the BAU scenario, the highest enhancement in water demand can follow. Due to the arid and semi-arid climatic conditions in the area, on the one hand, and the rapid development of man-made areas, on the other, a water supply deficit is witnessed in the current situation and, also, under both future scenarios. However, under the PB scenario, despite maintaining the existing farms, the demand for irrigation of the protected farms is reduced compared to the BAU scenario; this indicates the greater efficiency of our conservation (PB) scenario for optimal water management in the area. On the other hand, the amount of food production in farms also increases, which is an advantage for all stakeholders.
The volume of water production and other related variables in the five water basins in the Karaj landscape are shown in Table 5.
In CU and the two scenarios, sub-basins 1 and 5 (possessing more than 120 million m3/year) and sub-basins 2 and 3 (with 1000 million m3/year) indicate the highest water supply and demand, respectively. In the BAU scenario, the water demand in watersheds 4 and 5 will increase by up to 38 million m3/year and 3 million m3/year, respectively. In watershed 1, the conditions will be the same as those of the CU situation, indicating the least effects on water-related ESs due to LULC transformation. Moreover, other watersheds show a decrease in water demand. In the PB scenario, the water supply potential is the same as the CU situation; however, the water demand will increase in all watersheds, especially in 3 (from 1081 to 1099 million m3/year) and 4 (from 771 to 857 million m3/year), because of the increasing agricultural activities.
Figure 4 shows the pixel-based (30 × 30 m) map of the water balance of the ecosystem in the study area. Water balance is higher in all three scenarios in the upstream landscape because the rainfall in these areas is greater than the evapotranspiration. In the northwest part of the upstream area, the water yield increases between 2017 and 2028. Significantly, in the central part of the study area, the water yield is low and the majority of change occurs in the central and downstream parts of the study area. The water yield decreases downstream (from 2017 to 2028) because of the transformation of vegetation cover to other LULC classes with higher water demand and, also, due to the fact that evapotranspiration is higher and precipitation is lower than the upstream areas. The results indicate that the volume of water produced in each of the three scenarios is 1259, 1304 and 1274 million m3/year, respectively. Accordingly, in 2028, the volume of water production in the BAU and PB scenarios will increase by 45 and 15 million m3/year, respectively.

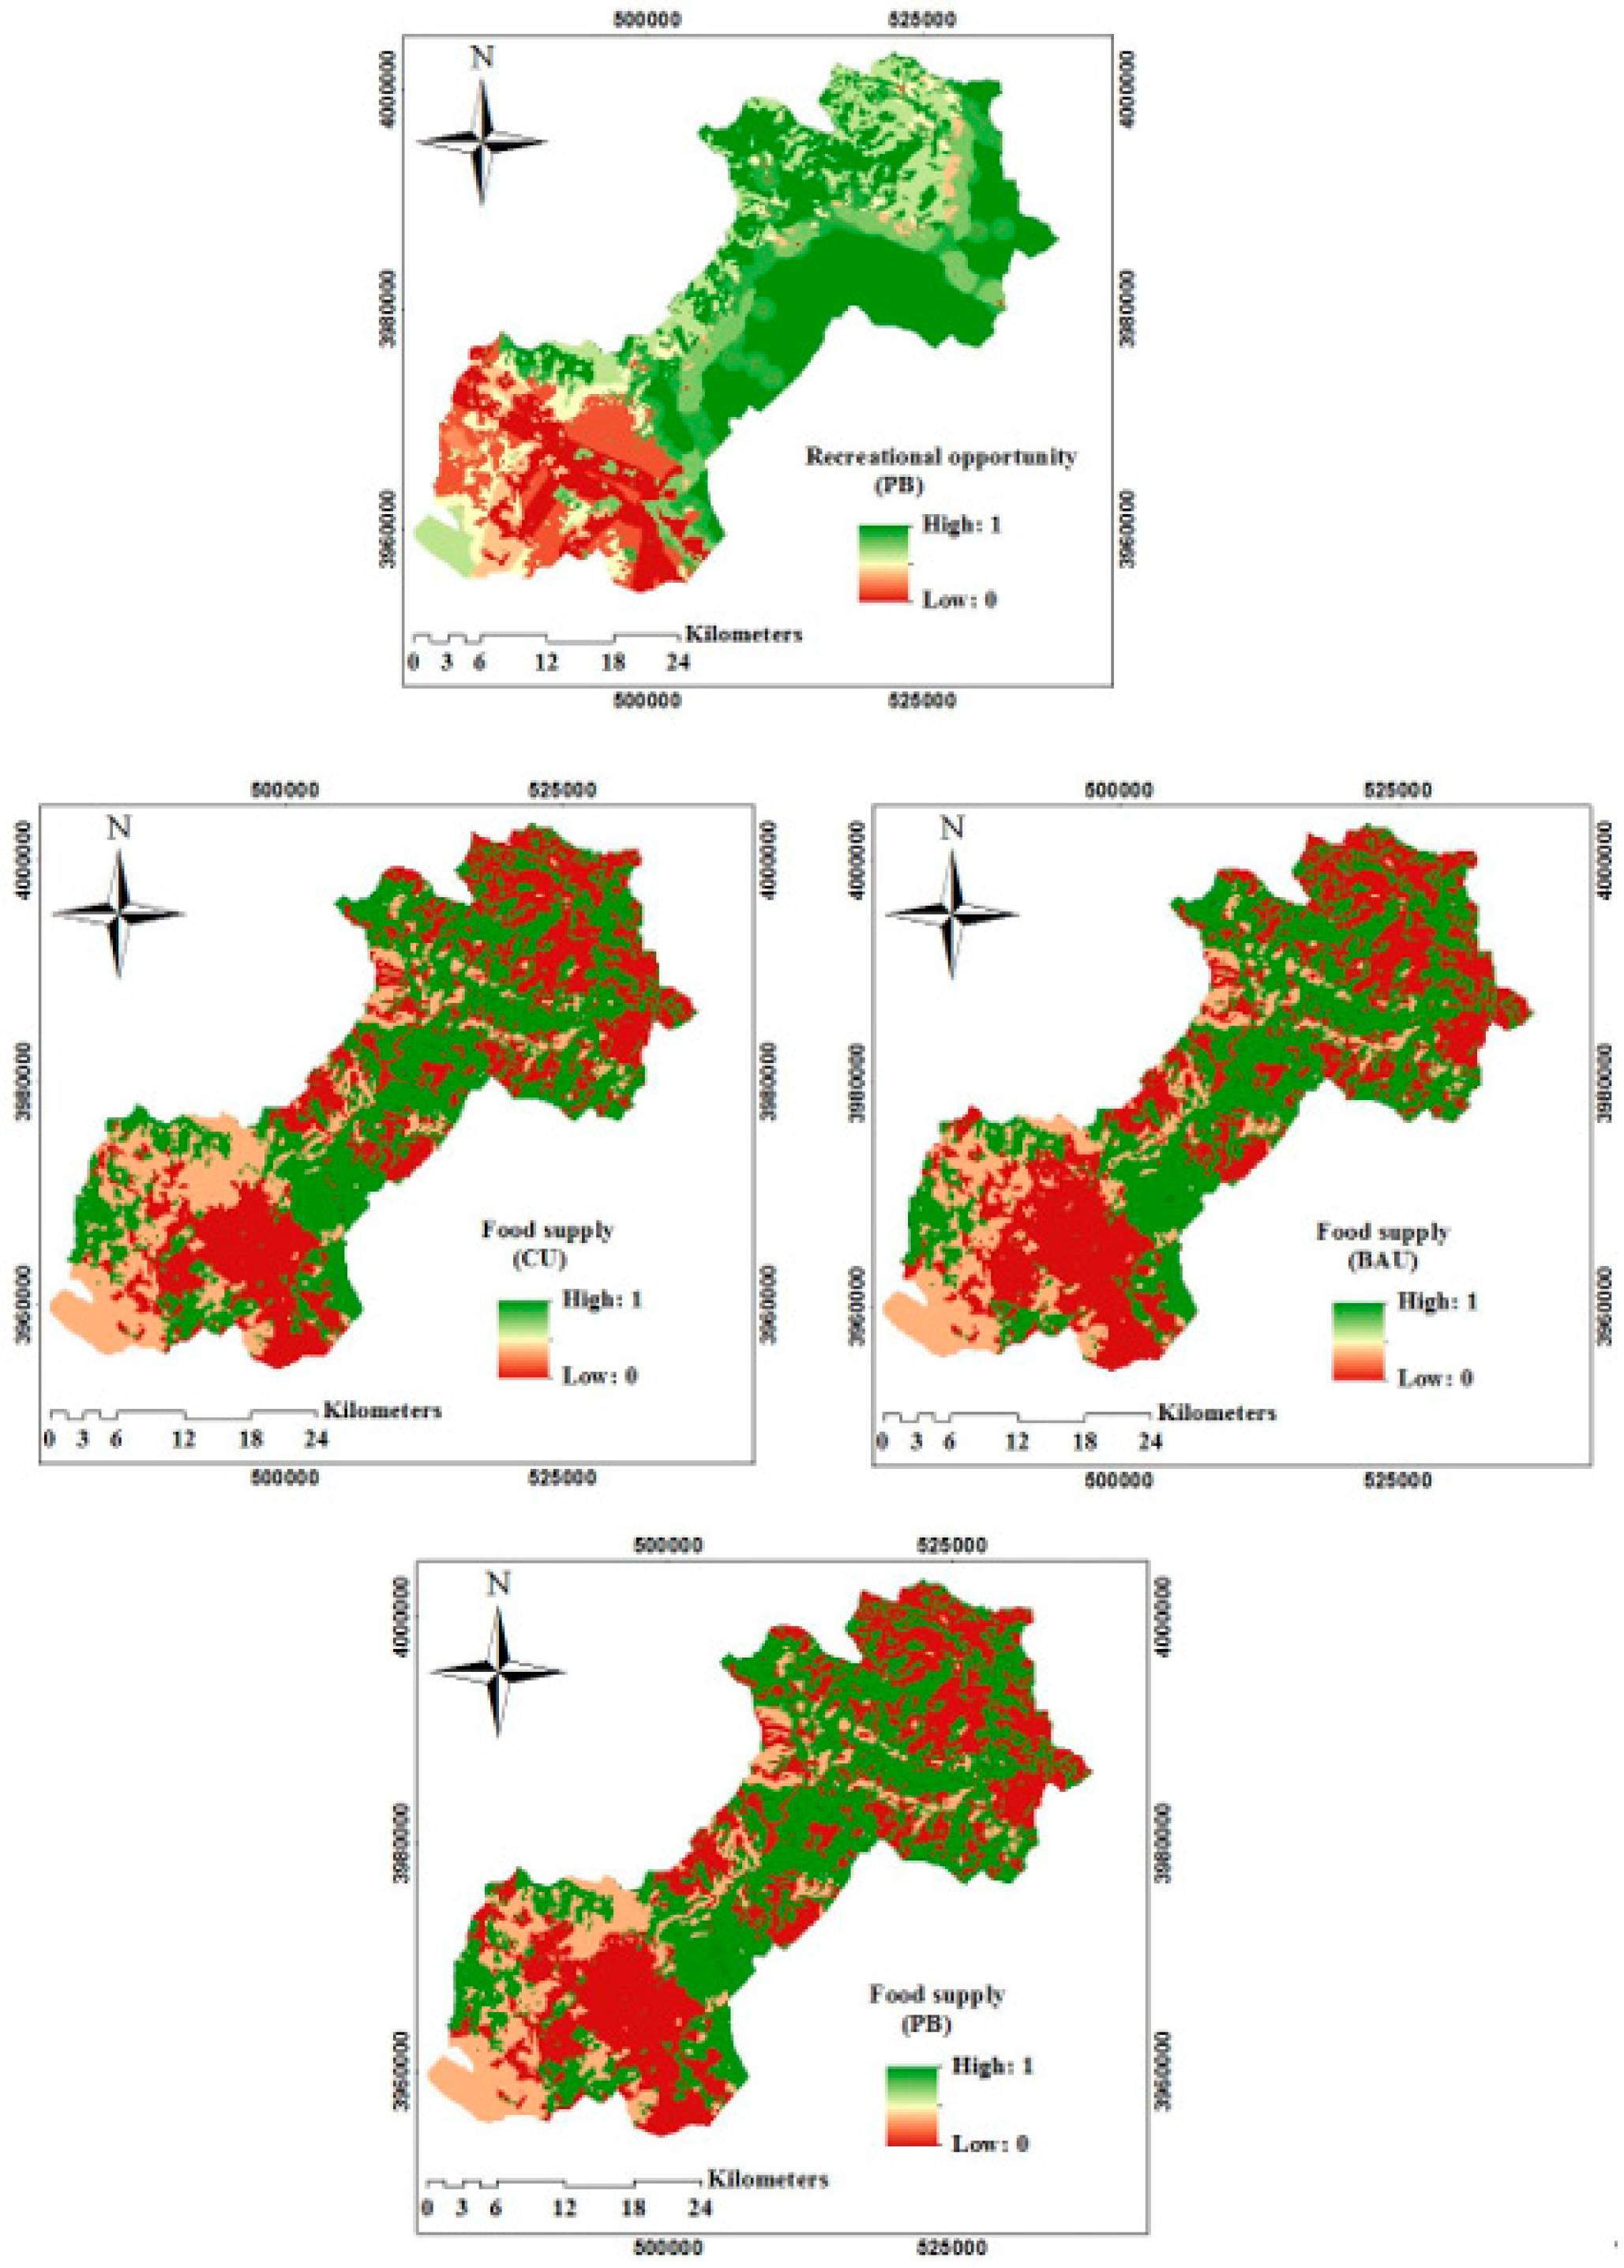
3.2.2. Food Production

Food production showed various distribution patterns. In this sense, grain planting was only provided by the downstream landscape in the rather flat and fertile areas. In the west and southwest of the region, there is the least human habitation. Fruit production was mainly provided by the upstream landscape (Figure 4). Accordingly, from 2017 to 2028, grain production decreased in both the BAU and PB scenarios by 19% and 0.6%, respectively. Total grain production in the Karaj landscape will decrease in both BAU and PB scenarios. In this regard, grain production is 110,024.95, 88,170.88 and 109,271.36 tons per hectare for the CU situation and BAU and PB scenarios, respectively. During the 2017–2028 period, the cultivated lands decrease in the BAU and PB scenarios by 1312.01 and 38.7 ha, respectively. The expansion of urban and industrial areas of the downstream landscape is the reason for this decrease. The crop yield also decreases, mainly due to the reduction in cultivated land. Considering the fruit production, an increasing trend is seen in the upstream landscape (from 56,602.34 to 57,588.55 ton/ha), while in the downstream landscape—from the CU situation to the BAU scenario—a significant reduction is witnessed (from 1259.22 to 1015.15 ton/ha) and, in the PB scenario, it reaches the highest value (1361.53 ton/ha). In general, the total fruit production in the Karaj landscape decreases in the BAU scenario and increases in the PB scenario. Fruit production in the CU situation is 57,861.56 ton/ha and for the BAU and PB scenarios, it could be 57,774.38 and 58,950.91 ton/ha, respectively. During the 2017–2028 period in the upstream region, the area of garden land reduces in the BAU and PB scenarios by up to 74.15 and 70.23 ha, respectively. On the contrary, regarding the downstream area, the area of garden land experiences a reduction in the BAU scenario (from 930.7 to 802.47 ha) but a specific increase in the PB scenario (from 930.7 to 959.97 ha) (Table 6). The reason for this decrease is rooted in the massive villa construction and road expansion in the upstream area and the urbanisation of the downstream area. In general, the results indicate that the amount of food production will only improve under the PB scenario.

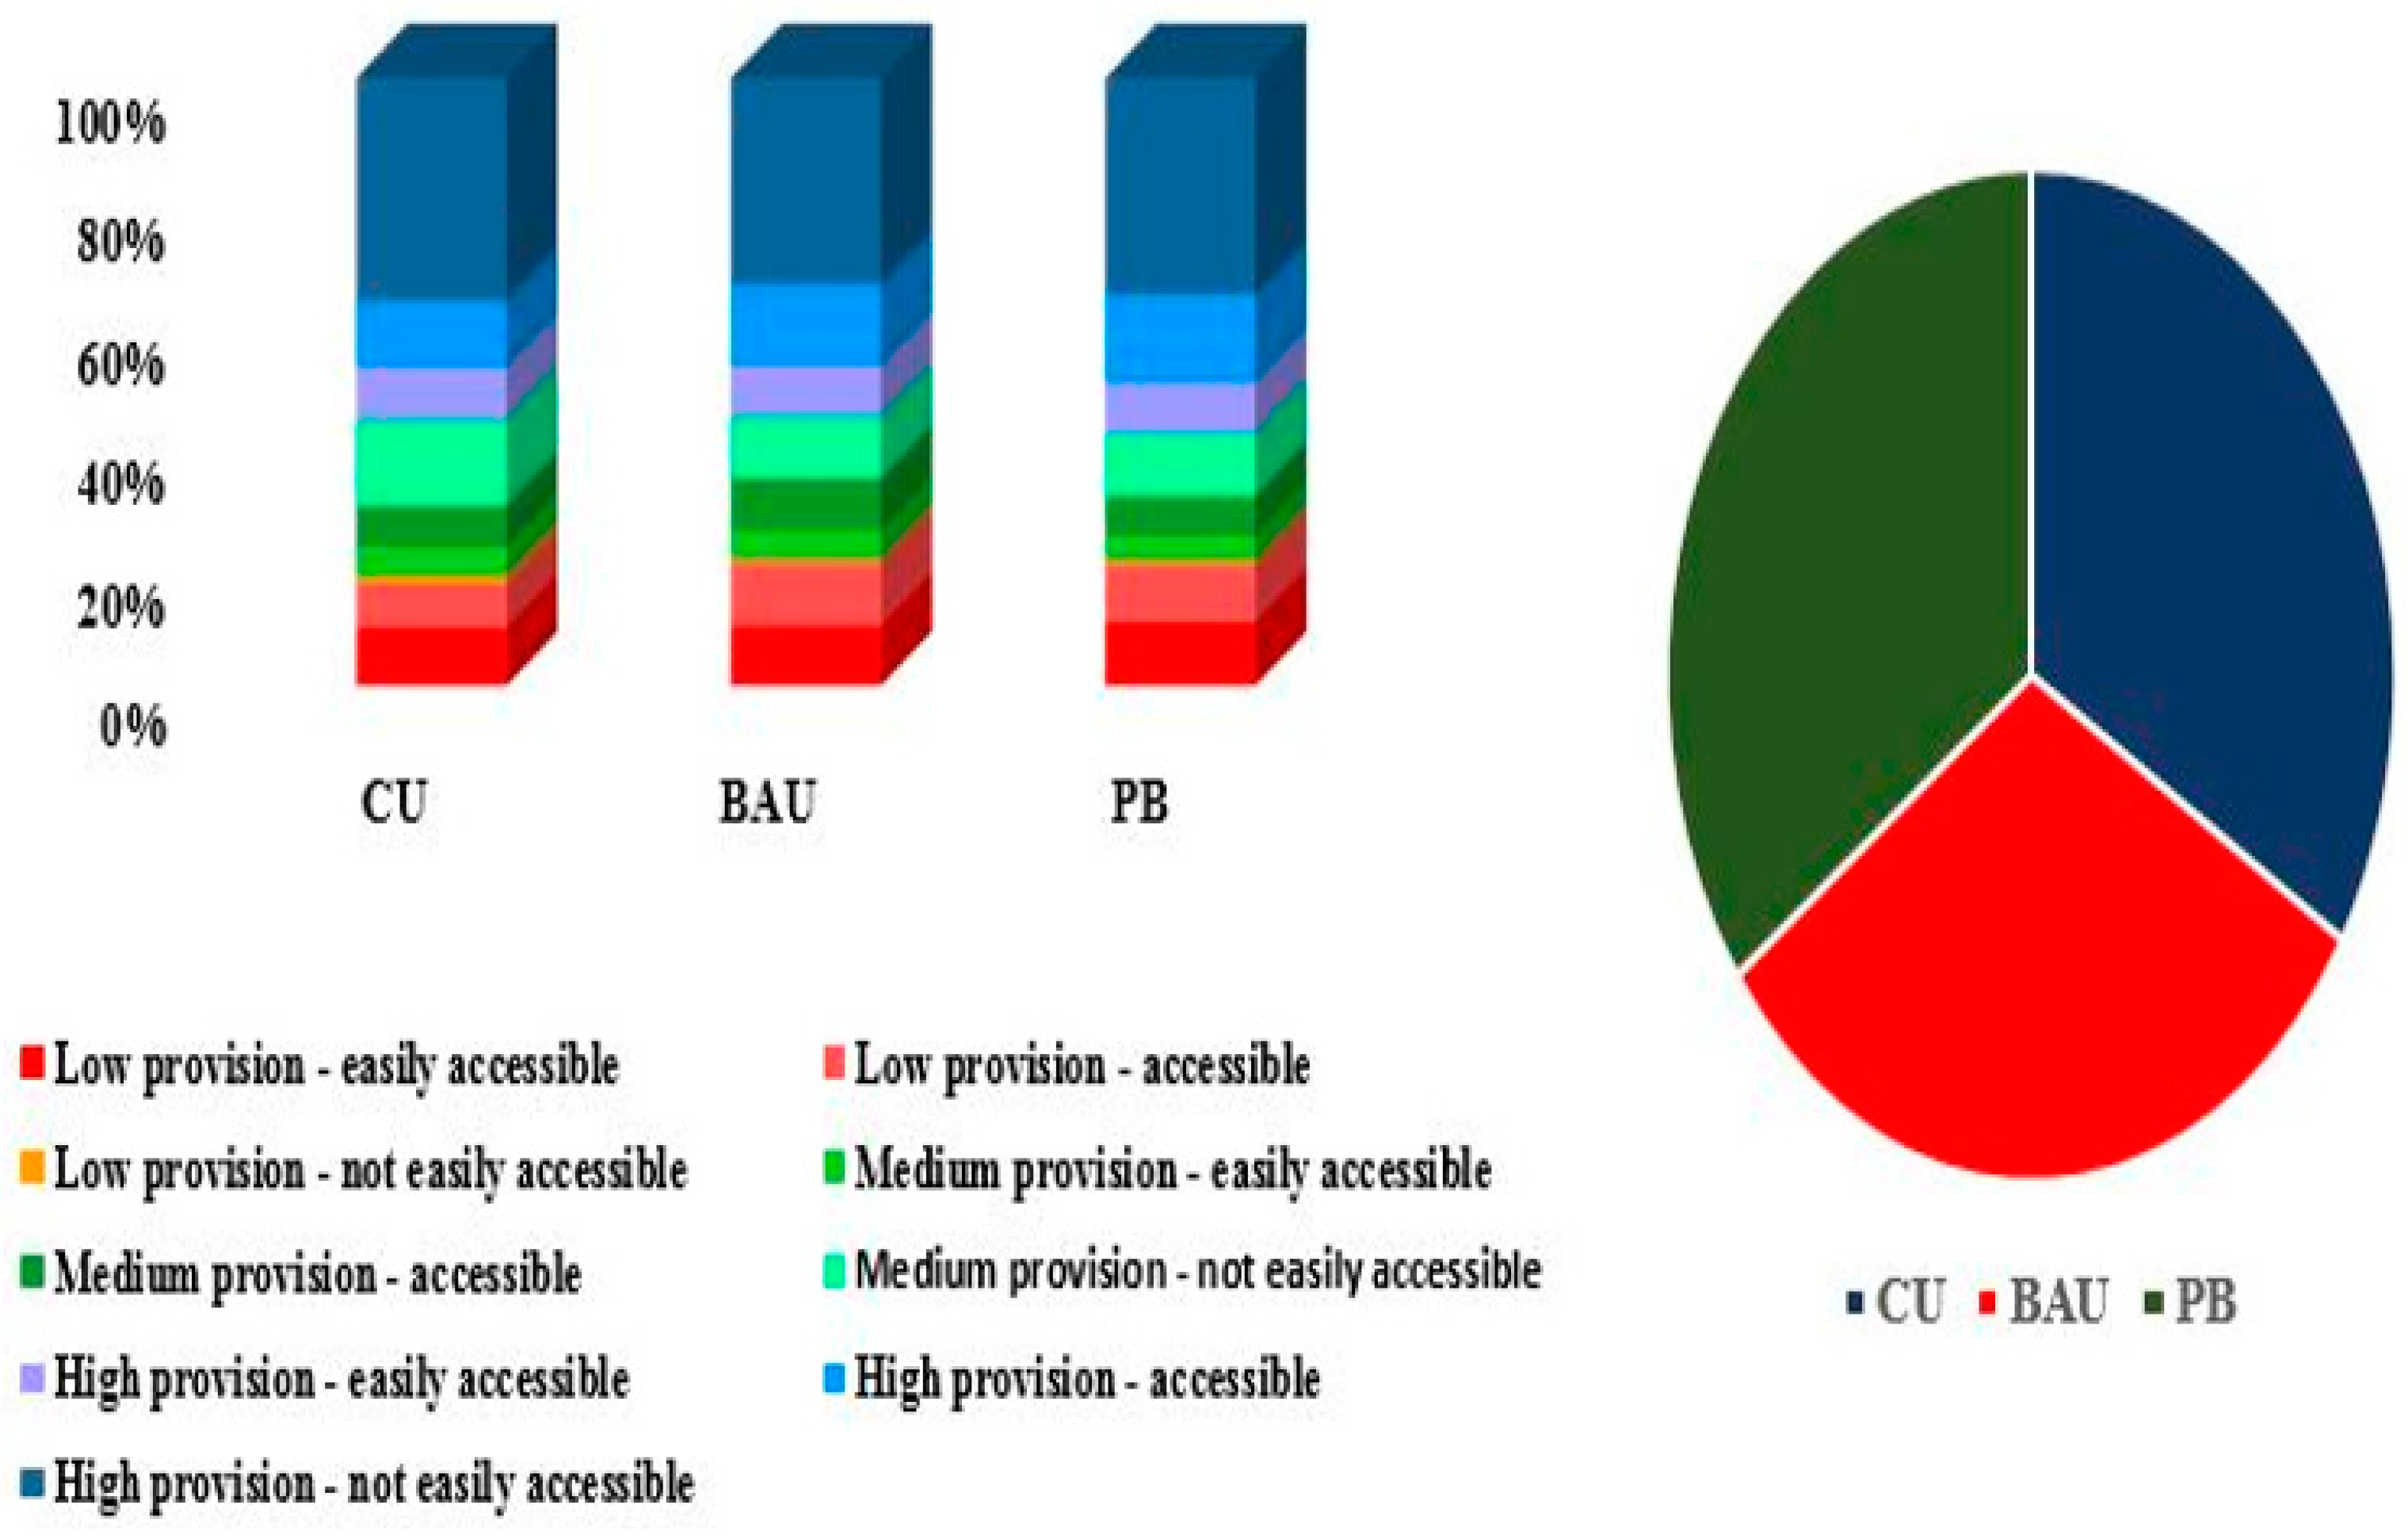
3.2.3. Outdoor Recreation Opportunity

Figure 5 shows the percentage of land within each ROS category. It can be seen that categories 9 (high provision–not easily accessible) and categories 3 (low provision–not easily accessible) are the largest and smallest areas, respectively. From 2017 to 2028, the value of the outdoor recreation opportunity index in the BAU scenario decreased, but in the PB scenario it increased.
Despite no considerable variation in recreation potential, this service represented clear spatial heterogeneity. Additionally, recreation services decreased from the upstream landscape to the downstream landscape because in the upstream landscape there are natural and semi-natural habitats such as water bodies, grassland, lakes, etc. It is worth mentioning that most of this area is mountainous with forest cover. Moreover, regions with a low population and high distance from the roads and urban areas always presented higher values of outdoor recreation opportunity. However, this service became worse in the downstream landscape. The rapid growth of the human-made class decreased recreational opportunity. The parts of the downstream landscape with green spaces showed a high recreation opportunity (Figure 4). According to the results, the PB scenario would be more favourable than the BAU scenario.

4. Discussion

4.1. Changes to LULC under Scenarios in the Future

Scenario simulation is one of the essential methods for predicting ES delivery [76], which can provide recommendations for LULC planning scenarios [77]. Therefore, in this paper, the effects of LULC changes were investigated on multiple ES delivery and supply under the current situation and two other scenarios in the future (BAU and PB scenarios).
There are some limitations in previous studies. Some researchers, such as [78,79], did not perform scenario analysis, which usually leads to different results. Additionally, in the studies that considered scenario analysis, such as Gao et al. [80], they did not study LULC effects on ESs in future scenarios.
The development of human-made settlements and infrastructure, due to urbanisation, will be the main LULC change in the Karaj landscape under both scenarios in 2028. Another important change is the reduction in agricultural and garden areas in the BAU scenario and their increase in the PB scenario. This augmentation can be attributed to lower anthropogenic pressure on the agricultural, garden and grassland areas as a result of better management practices followed by all stakeholders in the PB scenario. Furthermore, rapid economic development and population growth in the Karaj metropolis significantly changes the LULC.

4.2. Spatial Distribution of ESs in the Karaj Landscape

4.2.1. Spatial Distribution of Water Yield

In the InVEST model, the raster output is used to interpret and identify areas with water balance, as compared to areas facing water stress. Considering the problems of drought and lack of water output, our model indicates that, in the current situation, a major part of the downstream area suffers from water stress. By implementing the protection scenario and preserving the existing natural assets, it can be hoped that the water stress situation in the studied area will not worsen. Based on the yield, supply and demand of water in the sub-basins (Table 5), the water balance status of the Karaj landscape can be classified into three categories: balanced, water stressed and critical. In the CU situation and two scenarios, sub-basins 1 and 5 are in the balanced class, sub-basin 4 is in the water-stress class, and sub-basins 2 and 3 are in the critical class. Sub-basin 1 is dominated by green cover, mountainous and blue areas located in the upstream landscape, and sub-basins 2, 3 and 4 are dominated by agricultural lands and urban areas in the downstream area, which demand the most water. Overall, due to the topographic conditions [26,81,82] and LULC coverage [83,84,85,86,87], the water balance in the upstream landscape is higher than in the downstream area.
The water yield in the central parts of the downstream area is higher than other parts. This includes Karaj city and urban areas. The expansion of human-made areas increases the impervious region and, accordingly, a large amount of precipitation is collected and stored in the form of runoff, which decreases land surface evaporation and results in a high water yield depth in the urban area [88]. Therefore, in this section, urban growth was conducive to the augmentation of water yield [34]. In general, regarding the Karaj landscape, the destruction and conversion of green cover (such as agriculture and gardens) can be seen but the rate of this conversion is higher in the downstream region. The result of these LULC changes leads to evapotranspiration reduction, consequently increasing water yield [33,84] and floods [89] in the arid region of Karaj. In total, LULC change has a little positive impact on water yield but a powerful negative impact on water demand, water supply and, consequently, water stress. The positive effect of LULC change on water yield is mainly via decreased evapotranspiration and vegetation. This result is also compatible with the results of studies performed by [17,89,90,91]. On the other hand, rapid urban expansion and population growth have led to an increased water demand. In fact, population change has caused a change in water supply and demand, its increase leading to an increase in water demand. Therefore, in the Karaj landscape, despite the large supply of water, there is no balance between supply and demand. The mismatch between water supply and demand limits sustainable development and the economy of the region [79]. In this regard, given that most water resources in the region have been used more than the existing capacity, the need to pay attention to water resources and their management is very important for informing decision- and policy-makers regarding regional water security.

4.2.2. Spatial Distribution of Food Production

In terms of food supply, large amounts of fruit and grain production were dispensed in the upstream and downstream. According to the results (Table 6), although the cultivation level of garden products in the upstream decreases by 74.15 and 70.23 ha in 2028 compared to 2017, production in both scenarios is higher than the base year. Increasing garden products, despite reducing the area under cultivation of crops, indicates an increase in production per unit area and a productivity improvement. Generally, compared to the ESs in 2017, food production will decrease under the BAU scenario but will increase under the PB scenario in 2028. According to the different results of food production in the two scenarios, it can be argued that food production is dependent on intact natural LULC [92,93]. However, food production was also affected by other factors, such as the amount of land, yield, food quality, soil properties, climate, management practices and agricultural technology [19]. Herein, the model shows that grain production will decrease in the Karaj landscape by 2028. Due to the fact that there is no possibility of agricultural activities in the upstream areas, downstream agricultural activities must be developed and the preservation of these lands must be accompanied by strict management to ensure food security in the region. [87] argued that grain production decreases due to the degradation of agricultural land, particularly in developing countries. Consequently, managing the relationship between food security, urban construction and ecological conservation is vital in all countries [94].

4.2.3. Spatial Distribution of Outdoor Recreation Opportunity

The classification of LULC percentage in each ROS class (Figure 4) is based on the two factors of provision and accessibility. According to this classification, the easier the access and the more the provision, the higher the value of the recreational potential of the area would be. The total area percentage of these two categories in the region is 21%, 19% and 23% in the CU situation and BAU and PB scenarios, respectively. Based on the ROS map (Figure 5), the highest outdoor recreation opportunities were observed in the northeast, east and southeast parts and a few parts of the northwest upstream, in both future scenarios. The dominant coverage of these areas is natural habitats, water bodies and river areas, gardens and dense grassland. On the other hand, considering the downstream area of the region in both future scenarios, areas with high recreational value are distributed in parts of the north, southeast, southwest and a few parts of the centre that are urban parks. Although the spatial distribution of this service is the same in both future scenarios, the area of high recreational value is much more distributed in the PB scenario than in the BAU scenario. Overall, the identified recreation area is almost fine for both scenarios, despite obvious spatial heterogeneity. However, in the BAU scenario, compared to the PB scenario, the Karaj landscape would have lower recreational opportunities.
Outdoor recreation opportunities were highly influenced by topography. Due to its mountainous nature and other natural attractions in the upstream landscape, there are more recreation opportunities than downstream, which is located at lower elevations and is predominantly covered by the human-made class. Therefore, in confirmation of previous studies [12,19,40], outdoor recreation opportunities are affected by LULC changes.

4.3. The Impact of Urban Expansion on ESs

LULC is a determinative variable causing changes in ESs which are affected by the intensity of variations in the composition, patterns and structure of LULC [95]. When compared to the ESs in 2017 (CU situation), the water yield increases as urban expansion increases, whereas food production and recreational services decline as urban expansion increases, under the BAU scenario in 2028. On the other hand, in the PB scenario, water yield, food production and recreational opportunities increase.
Regarding the continuation of unsustainable urban development through extensive conversion of natural land cover to man-made uses, the ecological infrastructure of the studied metropolis has been threatened. This is because the management of natural assets, such as grassland, gardens, etc., is not in a favourable condition. Under these conditions, even with the implementation of protection scenarios, it is a difficult task to control LULC changes in the areas that are facing increasing demand for the creation of human and industrial infrastructures. However, in this study, it was shown that by adopting the conservation scenario, even if it is not possible to completely continue the current trend towards more sustainable LULC changes, it can be hoped that by preserving existing natural assets, the rate of deterioration of ESs and natural functions will be reduced as much as possible. Our modelling shows the PB scenario with fewer adverse consequences for ESs, indicating that the protection scenario is an approach that can establish a more sustainable form of urban development, compared to the scenario of the continuation of the existing situation in the future time perspective (year 2028).
Previous studies have demonstrated that the increase in the water yield due to LULC change, high precipitation and urban expansion [16,19,26,34,84,87] decreases outdoor recreation opportunity due to urban expansion and LULC change [39,40,96], as well as food production due to urban expansion [1,30,43,76,97].
In the current research, it was found that the rapid and wide variation of LULC types, urban expansion and the absence or weak implementation of sustainable urban LULC planning methods cause some specific changes to the spatial distribution of ESs. Undoubtedly, these changes will cause the Karaj landscape to move from having an ecological function to a sociological one and reduce the sustainability of ecological networks [98]. Therefore, by adopting effective management policies and creating a balance between ecological and sociological functions, it is possible to achieve the sustainability of the urban ecosystem and, consequently, reduce the effects of urban expansion on ESs. In this sense, it is worth mentioning that urban expansion is one of the most significant reasons for changes in ES functions (increasing water yield and reducing outdoor recreation opportunity and food production) in the Karaj landscape. These results validate the results of previous investigations [7,12,16,17,24,26,99,100]. Significantly, the increased water yield, which can increase nutrient transport and flood risk [16], will have negative effects on urban sustainability and social well-being. On the other hand, water balance and the regional water cycle (which are vital in urban areas [101]) have been disrupted in the Karaj landscape due to excessive water consumption. Therefore, planners and managers of water resources should implement appropriate strategies and policies to deal with water supply deficiencies in the Karaj landscape. In addition, recreation potential is important for citizens’ well-being [102]. Thus, due to the reduction of this service in the Karaj landscape, and in order to improve the quality of the recreational and mental comfort in society, urban expansion strategies should increasingly aim to strengthen the natural and artificial network of green spaces by planting more trees, increasing the diversity of plant combinations and properly managing green spaces. Finally, it is worth mentioning that food can be regarded as a basic material for a good life [15]. The lack of food production will further deteriorate food safety in the Karaj landscape. Considering that there is no possibility for agriculture in the upstream areas and the reduction of the area of these lands, along with the garden lands in the downstream areas (especially the eastern and western parts), a significant decrease will be experienced in the capacity of the land to provide food for the city’s residents. Thus, urban planners must provide appropriate protection and sustainable plans for these uses.
Urbanisation leads to the spatial heterogeneity of ESs as a result of urban growth and population settlement [30]. Therefore, regarding the urban growth process in the Karaj landscape, the loss of ESs that were affected by LULC changes can negatively influence urban sustainability and, consequently, human well-being. However, this negative effect in the PB scenario was significantly reduced. It is due to the fact that, in this scenario, future management policies and land use planning were implemented. In this regard, to achieve favourable welfare, the planners and managers of Karaj should end the continuation of the current process by defining more informed protection and management scenarios, such as our protection scenario.

4.4. Limitations

In this study, there are restrictions in the InVEST model and the ROS model that result in less accurate parameters. These tools were applied due to the limited available data and information for the case study area. Moreover, InVEST models have the potential to beget a basic underpinning for decision- and policy-making [103]. Although the InVEST annual water supply does not contain the precipitation patterns all over the year, it overrates runoff and neglects groundwater recharge [37]. Moreover, the limitation of the stout testing restricts their credit [103]. The ROS method focuses on the recreational activities of natural infrastructure (usually the water component) but overlooks the recreational value of artificial substructures in the human-made areas [19]. Therefore, these limitations can lead to wrong approximations of ES supply [38]. Furthermore, we were able to support the accuracy of our estimations with the results provided in the literature and the experimental data, arranged to downgrade the inaccuracies. In this study, we did not consider the demand for recreation and food due to a lack of data. We suggest that the demand for these ESs be considered in future studies.

5. Conclusions

The research presented proposes a framework to evaluate spatial-temporal variations of multiple ESs in the Karaj landscape from 2017 to 2028. Models which are used to quantify ESs in Iran, although previously used for natural areas, have not yet been used in the urban landscape. Therefore, this study can form a good model to highlight key research priorities in urban ESs and can be considered as a basic study in urban landscapes for other researchers in Iran.
According to the results, fast urban growth will lead to a kind of decline in provisioning and support services in the Karaj landscape in the future—since urban expansion will destroy the grassland, farmlands and gardens. In contrast, water yield increases and water balance is disrupted in the region because of the process of urban expansion. In this regard, changes in water yield increase in most of the Karaj landscape, while outdoor recreation opportunity and food production mainly occur in the downstream areas and have spatial consistency with urban expansion.
Herein, recommendations were provided for urban planners in order to manage ESs. Generally, urban planners should take measures to improve food production in the downstream, especially in the western parts; outdoor recreation opportunities in the downstream areas, especially in the central region; and water supply in the central region and the western and northwestern parts of the downstream. Hence, regarding the process of fast urbanisation, the government must efficiently protect the sustainable capacity of ESs and logically plan for LULC, especially in places where the urban ecosystem is adjacent to natural lands and changes the natural structures in the appearance of Karaj’s landscape.
Scenario analysis shows that the PB scenario has a better performance in providing ESs. Consequently, urban ESs are spatially heterogeneous within the region, vary in relation to different scenarios, and highlight important issues in ESs, amounting to sustainable urban expansion policies and schematisation. Overall, the results presented in this study justify further research to ensure multiple ESs in the Karaj landscape. In addition, the present study gives a comparative result to areas having a similar scale. Finally, it is hoped that the results presented in this study will help managers and urban planners to make sensible decisions in ecosystem management and achieve urban sustainability. Regarding future research, we will present the effects of urban expansion on ESs in the Karaj landscape in several conservation and management scenarios, to provide urban planners with guidelines for urban sustainability and balanced development.

Author Contributions

All authors (F.M., A.Z., M.M.M., J.S.V. and E.T.) contributed equally to the study, conception and design of this paper. Material preparation, data collection and analysis were performed by all authors. F.M. wrote the manuscript, and F.M., A.Z. and J.S.V. performed revisions. All authors (F.M., A.Z., M.M.M., J.S.V. and E.T.) contributed ideas to the study. All authors have read and agreed to the published version of the manuscript.

Funding

This research received no external funding.

Data Availability Statement

The datasets used or analysed during the current study are available from the corresponding author on reasonable request.

Acknowledgments

The authors of this article would like to thank the Department of Environmental Sciences at Malayer University, Research Centre for Environment and Sustainable Development (RCESD), Tehran and the Department of Geodesy and Cadaster, Vilnius Gediminas Technical University, for their support.

Conflicts of Interest

The authors declare no conflict of interest.

Appendix A

Table A1. Remoteness/accessibility (proximity) parameters.
Distance From Roads (KM)
Distance from human-made areas (KM) <11–55–10>10
<51224
5–102224
10–253334
25–503444
>504445
1Neighbourhood
2Proximity
3Almost far
4Remote
5Very remote

Appendix B

Table A2. Parameters for the recreational opportunity spectrum.
Recreation Potential Index (RPI)
Remoteness/accessibility (proximity) 123
<0.190.19–0.25>0.25
1Neighbourhood147
2Proximity147
3Almost far258
4Remote369
5Very remote369
1 Low provision—easily accessible
2 Low provision—accessible
3 Low provision—not easily accessible
4 Medium provision—easily accessible
5 Medium provision—accessible
6 Medium provision—not easily accessible
7 High provision—easily accessible
8 High provision—accessible
9 High provision—not easily accessible

References

  1. Das, M.; Das, A. Estimation of ecosystem services (EESs) loss due to transformation of Local climatic zones (LCZs) in Sriniketan-santiniketan planning area (SSPA) West Bengal, India. Sustain. Cities Soc. 2019, 47, 101474. [Google Scholar] [CrossRef]
  2. Wood, S.L.; Jones, S.K.; Johnson, J.A.; Brauman, K.A.; Chaplin-Kramer, R.; Fremier, A.; Girvetzg, E.; Gordon, L.; Kappel, C.; Mandle, L.; et al. Distilling the role of ecosystem services in the Sustainable Development Goals. Ecosyst. Serv. 2018, 29, 70–82. [Google Scholar] [CrossRef] [Green Version]
  3. Zhai, T.; Zhang, D.; Zhao, C. How to optimize ecological compensation to alleviate environmental injustice in different cities in the Yellow River Basin? A case of integrating ecosystem service supply, demand and flow. Sustain. Cities Soc. 2021, 75, 103341. [Google Scholar] [CrossRef]
  4. Connor, J.D.; Summers, D.; Regan, C.; Abbott, H.; Van Der Linden, L.; Frizenschaf, J. Sensitivity analysis in economic evaluation of payments for water and carbon ecosystem services. Ecosyst. Serv. 2022, 54, 101416. [Google Scholar] [CrossRef]
  5. Millennium Ecosystem Assessment (MEA). Ecosystems and Human Well-Being: Current State and Trends; Island Press: Washington, DC, USA, 2015. [Google Scholar]
  6. Sharon, O.; Fishman, S.N.; Ruhl, J.B.; Olander, L.; Roady, S.E. Ecosystem services and judge-made law: A review of legal cases in common law countries. Ecosyst. Serv. 2018, 32, 9–21. [Google Scholar] [CrossRef]
  7. Xie, Z.; Li, X.; Chi, Y.; Jiang, D.; Zhang, Y.; Ma, Y.; Chen, S. Ecosystem service value decreases more rapidly under the dual pressures of land use change and ecological vulnerability: A case study in Zhujiajian Island. Ocean Coast Manag. 2021, 201, 105493. [Google Scholar] [CrossRef]
  8. Balasubramanian, M. Economic value of regulating ecosystem services: A comprehensive global level review. Environ. Monit. Assess. 2019, 191, 616. [Google Scholar] [CrossRef]
  9. Blanco, E.; Raskin, K.; Clergeau, P. Towards regenerative neighbourhoods: An international survey on urban strategies promoting the production of ecosystem services. Sustain. Cities Soc. 2022, 80, 103784. [Google Scholar] [CrossRef]
  10. Athukorala, D.; Estoque, R.C.; Murayama, Y.; Matsushita, B. Ecosystem Services Monitoring in the Muthurajawela Marsh and Negombo Lagoon, Sri Lanka, for Sustainable Landscape Planning. Sustainability 2021, 13, 11463. [Google Scholar] [CrossRef]
  11. Karimi, F.; Sultana, S.; Shirzadi Babakan, A.; Suthaharan, S. An enhanced support vector machine model for urban expansion prediction. Comput. Environ. Urban Syst. 2019, 75, 61–75. [Google Scholar] [CrossRef]
  12. Sun, X.; Crittenden, J.C.; Li, F.; Lu, Z.; Dou, X. Urban expansion simulation and the spatio-temporal changes of ecosystem services, a case study in Atlanta Metropolitan area, USA. Sci. Total Environ. 2018, 622–623, 974–987. [Google Scholar] [CrossRef] [PubMed]
  13. Gao, J.; Tang, X.; Lin, S.; Bian, H. The influence of land use change on key ecosystem services and their relationships in a mountain region from past to future (1995–2050). Forests 2021, 12, 616. [Google Scholar] [CrossRef]
  14. Li, S.; He, Y.; Xu, H.; Zhu, C.; Dong, B.; Lin, Y.; Wang, K. Impacts of urban expansion forms on ecosystem services in urban agglomerations: A case study of Shanghai-Hangzhou Bay urban agglomeration. Remote Sens. 2021, 13, 1908. [Google Scholar] [CrossRef]
  15. Zhang, D.; Huang, Q.; He, C.H.; Wu, J. Impacts of urban expansion on ecosystem services in the Beijing-Tianjin- Hebei urban agglomeration, China: A scenario analysis based on the Shared Socioeconomic Pathways. Resour. Conserv. Recycl. 2017, 125, 115–130. [Google Scholar] [CrossRef]
  16. Wang, S.; Hu, M.; Wang, Y.; Xia, B. Dynamics of ecosystem services in response to urbanisation across temporal and spatial scales in a mega metropolitan area. Sustain. Cities Soc. 2022, 77, 103561. [Google Scholar] [CrossRef]
  17. Zarandian, A.; Baral, H.; Stork, N.E.; Ling, M.A.; Yavari, A.R.; Jafari, H.R.; Amirnejad, H. Modelling of ecosystem services informs spatial planning in lands adjacent to the Sarvelat and Javaherdasht protected area in northern Iran. Land Use Policy 2017, 61, 487–500. [Google Scholar] [CrossRef]
  18. Jopke, C.; Kreyling, J.; Maes, J.; Koellner, T. Interactions among ecosystem services across Europe: Bag plots and cumulative correlation coefficients reveal synergies, trade-offs, and regional patterns. Ecol. Indic. 2014, 49, 46–52. [Google Scholar] [CrossRef]
  19. Sun, X.; Li, F. Spatiotemporal assessment and trade-offs of multiple ecosystem services based on land use changes in Zengcheng, China. Sci. Total Environ. 2017, 609, 1569–1581. [Google Scholar] [CrossRef]
  20. Robinson, C.J.; Maclean, K.; Hill, R.; Bock, E.; Rist, P. Participatory mapping to negotiate indigenous knowledge used to assess environmental risk. Sustain. Sci. 2016, 11, 115–126. [Google Scholar] [CrossRef]
  21. Zhao, C.; Sander, H. Assessing the sensitivity of urban ecosystem service maps to input spatial data resolution and method choice. Landsc. Urban Plan. 2018, 175, 11–22. [Google Scholar] [CrossRef]
  22. Shoyama, K.; Kamiyama, C.; Morimoto, J.; Ooba, M.; Okuro, T. A review of modelling approaches for ecosystem services assessment in the Asian region. Ecosyst. Serv. 2017, 26, 316–328. [Google Scholar] [CrossRef]
  23. Xie, V.; Huang, Q.; He, C.H.; Zhao, X. Projecting the impacts of urban expansion on simultaneous losses of ecosystem services: A case study in Beijing, China. Ecol. Indic. 2018, 84, 183–193. [Google Scholar] [CrossRef]
  24. Mirsanjari, M.M.; Zarandian, A.; Mohammadyari, F.; Suziedelyte-visockiene, J. Investigation of the impacts of urban vegetation loss on the ecosystem service of air pollution mitigation in Karaj metropolis, Iran. Environ. Monit. Assess. 2020, 192, 501. [Google Scholar] [CrossRef] [PubMed]
  25. Nie, X.; Lu, B.; Chen, Z.; Yang, Y.; Chen, S.; Chen, Z.; Wang, H. Increase or decrease? Integrating the CLUMondo and InVEST models to assess the impact of the implementation of the Major Function Oriented Zone planning on carbon storage. Ecol. Indic. 2021, 118, 106708. [Google Scholar] [CrossRef]
  26. Ma, S.H.; Wang, L.J.; Zhu, D.; Zhang, J. Spatiotemporal changes in ecosystem services in the conservation priorities of the southern hill and mountain belt, China. Ecol. Indic. 2021, 122, 107225. [Google Scholar] [CrossRef]
  27. Pessacg, N.; Flaherty, S.; Brandizi, L.; Solman, C.; Pascual, M. Getting water right: A case study in water yield modelling based on precipitation data. Sci. Total Environ. 2015, 537, 225–234. [Google Scholar] [CrossRef]
  28. Gunnarsdottir, M.J.; Persson, K.M.; Andradottir, H.O.; Gardarsson, S.M. Status of small water supplies in the Nordic countries: Characteristics, water quality and challenges. Int. J. Hyg. Environ. Health 2017, 220, 1309–1317. [Google Scholar] [CrossRef]
  29. Levrel, H.; Cabral, P.; Feger, C.; Chambolle, M.; Basque, D. How to overcome the implementation gap in ecosystem services? A user-friendly and inclusive tool for improved urban management. Land Use Policy 2017, 68, 574–584. [Google Scholar] [CrossRef]
  30. Li, T.; Cui, Y.; Liu, A. Spatiotemporal dynamic analysis of forest ecosystem services using Big data: A case study of Anhui province, central-eastern China. J. Clean. Prod. 2017, 142, 589–599. [Google Scholar] [CrossRef]
  31. Peng, J.; Tian, L.; Liu, Y.; Zhao, M.; Hu, Y.; Wu, J. Ecosystem services response to urbanisation in metropolitan areas: Thresholds identification. Sci. Total Environ. 2017, 607–608, 706–714. [Google Scholar] [CrossRef]
  32. Sun, Y.; Liu, D.; Wang, P. Urban simulation incorporating coordination relationships of multiple ecosystem services. Sustain. Cities Soc. 2022, 76, 103432. [Google Scholar] [CrossRef]
  33. Li, R.; Shi, Y.; Feng, C.C.; Guo, L. The spatial relationship between ecosystem service scarcity value and urbanisation from the perspective of heterogeneity in typical arid and semi-arid regions of China. Ecol. Indic. 2021, 132, 108299. [Google Scholar] [CrossRef]
  34. Li, G.; Jiang, C.; Zhang, Y.; Jiang, G. Whether land greening in different geomorphic units are beneficial to water yield in the Yellow River Basin? Ecol. Indic. 2021, 120, 106926. [Google Scholar] [CrossRef]
  35. Hu, W.; Li, G.; Gao, Z.; Jia, G.; Wang, Z.; Li, Y. Assessment of the impact of the Poplar Ecological Retreat Project on water conservation in the Dongting Lake wetland region using the InVEST model. Sci. Total Environ. 2020, 733, 139423. [Google Scholar] [CrossRef] [PubMed]
  36. Cunha, J.; Elliott, M.; Ramos, S. Linking modelling and empirical data to assess recreation services provided by coastal habitats: The case of NW Portugal. Ocean Coast. Manag. 2018, 162, 60–70. [Google Scholar] [CrossRef]
  37. González-García, A.; Palomo, I.; González, J.; López, G.; Montes, G. Quantifying spatial supply-demand mismatches in ecosystem services provides insights for land-use planning. Land Use Policy 2020, 94, 104493. [Google Scholar] [CrossRef]
  38. Früh- Müller, A.; Hotes, S.; Breuer, L.; Wolters, V.; Koellner, T. Regional Patterns of Ecosystem Services in Cultural Landscapes. Land 2016, 5, 17. [Google Scholar] [CrossRef]
  39. Morse, W.C.; Stern, M.; Blahna, D.; Stein, T. Recreation as a transformative experience: Synthesizing the literature on outdoor recreation and recreation ecosystem services into a systems framework. J. Outdoor Recreat. Tour. 2022, 38, 100492. [Google Scholar] [CrossRef]
  40. Lavorel, S.; Rey, P.L.; Grigulis, K.; Zawada, M.; Byczek, G. Interactions between outdoor recreation and iconic terrestrial vertebrates in two French alpine national parks. Ecosyst. Serv. 2020, 45, 101155. [Google Scholar] [CrossRef]
  41. Lopes, R.; Videira, N. Modelling feedback processes underpinning management of ecosystem services: The role of participatory systems mapping. Ecosyst. Serv. 2017, 28, 28–42. [Google Scholar] [CrossRef]
  42. Baró, F.; Gómez-Baggethun, E.; Haase, D. Ecosystem service bundles along the urban-rural gradient: Insights for landscape planning and management. Ecosyst. Serv. 2017, 24, 147–159. [Google Scholar] [CrossRef] [Green Version]
  43. Gong, J.; Liu, D.; Zhang, J.; Xie, Y.; Cao, E.; Li, H. Trade-offs/synergies of multiple ecosystem services based on land use simulation in a mountain-basin area, Western China. Ecol. Indic. 2019, 99, 283–293. [Google Scholar] [CrossRef]
  44. Kain, J.H.; Larondelle, N.; Haase, D.; Kaczorowska, A. Exploring local consequences of two land-use alternatives for the supply of urban ecosystem services in Stockholm year 2050. Ecol. Indic. 2016, 70, 615–629. [Google Scholar] [CrossRef]
  45. Mexia, T.; Vieira, J.; Príncipe, A.; Anjos, A.; Silva, P.; Lopes, N.; Freitas, C.; Reis, M.S.; Correia, O.; Branquinho, C.; et al. Ecosystem services: Urban parks under a magnifying glass. Environ. Res. 2018, 160, 469–478. [Google Scholar] [CrossRef]
  46. Sharp, R.; Tallis, H.T.; Ricketts, T.; Guerry, A.D.; Wood, S.A.; Chaplin-Kramer, R.; Nelson, E.; Ennaanay, D.; Wolny, S.; Olwero, N.; et al. InVEST 3.7.0 User’s Guide; The Natural Capital Project; Stanford University, University of Minnesota, The Nature Conservancy, and World Wildlife Fund: Stanford, CA, USA, 2020; Available online: https://invest-userguide.readthedocs.io/en/3.5.0/ (accessed on 1 December 2022).
  47. Zulian, G.; Paracchini, M.L.; Maes, J.; Liquete, C. ESTIMAP: Ecosystem Services Mapping at European Scale; EUR 26474; Publications Office of the European Union: Luxembourg, 2013; p. JRC87585. [Google Scholar] [CrossRef]
  48. Heydari, S.H.; Mountrakis, G. Meta-analysis of deep neural networks in remote sensing: A comparative study of mono-temporal classification to support vector machines. ISPRS J. Photogramm. Remote Sens. 2019, 152, 192–210. [Google Scholar] [CrossRef]
  49. Alassery, F.; Alzahrani, A.; Khan, A.; Irshad, K.; Kshirsagar, S.R. An artificial intelligence-based solar radiation prophesy model for green energy utilization in energy management system. Sustain. Energy Technol. Assess. 2022, 52, 102060. [Google Scholar] [CrossRef]
  50. Zhang, Y.; Chang, X.; Liu, Y.; Lu, Y.; Wang, Y.; Liu, Y. Urban expansion simulation under constraint of multiple ecosystem services (MESs) based on cellular automata (CA)-Markov model: Scenario analysis and policy implications. Land Use Policy 2021, 108, 105667. [Google Scholar] [CrossRef]
  51. Mohammadyari, F.; Mirsanjari, M.M.; Suziedelyte Visockiene, J.; Zarandian, A. Evaluation of Change in Land-Usage and Land-Cover in IRAN, KARAJ City. In Proceedings of the Environmental Engineering 11th International Conference, Vilnius Gediminas Technical University, Vilnius, Lithuania, 21–22 May 2020; VGTU Press: Vilnius, Lithuania, 2020; pp. 1–8. [Google Scholar]
  52. Mohammadyari, F.; Purkhabbaz, H.; Aghdar, H.; Tavakoli, M. Predicted trends in land use City Behbahan years 2014 to 2028 Using LCM model. Geogr. Space 2019, 65, 37–56. [Google Scholar]
  53. Silva, L.P.; Xavier, A.; Silva, R.M.; Santos, G. Modelling land cover change based on an artificial neural network for a semi-arid river basin in north-eastern Brazil. Glob. Ecol. Conserv. 2019, 21, e00811. [Google Scholar] [CrossRef]
  54. Mohammad, A.; Worku, H. Simulating urban land use and cover dynamics using cellular automata and Markov chain approach in Addis Ababa and the surrounding. Urban Clim. 2020, 31, 100545. [Google Scholar] [CrossRef]
  55. Al Kafy, A.; Rahman, M.; Al- Faisal, A.; Hasan, M.M.; Islam, M. Modelling future land use land cover changes and their impacts on land surface temperatures in Rajshahi, Bangladesh. Remote Sens. Appl. Soc. Environ. 2020, 18, 100314. [Google Scholar] [CrossRef]
  56. Islam, N.; Irshad, K. Artificial ecosystem optimization with Deep Learning Enabled Water Quality Prediction and Classification model. Chemosphere 2022, 309, 136615. [Google Scholar] [CrossRef] [PubMed]
  57. Mirsanjari, M.M.; Visockienė, J.S.; Mohammadyari, F.; Zarandian, A. Modelling of expansion changes of Vilnius city area and impacts on landscape patterns using an Artificial Neural Network. Ecol. Chem. Eng. 2021, 28, 429–447. [Google Scholar] [CrossRef]
  58. Simwanda, M.; Murayama, Y.; Phiri, D.; Nyirenda, V.R.; Ranagalage, M. Simulating Scenarios of Future Intra-Urban Land-Use Expansion Based on the Neural Network–Markov Model: A Case Study of Lusaka, Zambia. Remote Sens. 2021, 13, 942. [Google Scholar] [CrossRef]
  59. Hajehforooshnia, S.; Soffianian, A.; Mahiny, A.; Fakheran, S. Multi objective land allocation (MOLA) for zoning Ghamishloo Wildlife Sanctuary in Iran. J. Nat. Conserv. 2011, 19, 254–262. [Google Scholar] [CrossRef]
  60. Quesada-Ruiz, L.C.; Perez, L.; Rodriguez-Galiano, V. Spatiotemporal analysis of the housing bubble′s contribution to the proliferation of illegal landfills—The case of Gran Canaria. Sci. Total Environ. 2019, 687, 104–117. [Google Scholar] [CrossRef]
  61. Rahimi, V.; Pourkhabbaz, H.R.; Aghdar, H.; Mohammadyari, F. Comparison of fuzzy AHP buckley and ANP models in forestry capability evaluation (Case Study: Behbahan City Fringe). Iran. J. Appl. Ecol. 2015, 4, 15–31. [Google Scholar] [CrossRef]
  62. Ghosh, P.; Lepcha, K. Weighted linear combination method versus grid-based overlay operation method—A study for potential soil erosion susceptibility analysis of Malda district (West Bengal) in India. Egypt. J. Remote Sens. Space Sci. 2019, 22, 95–115. [Google Scholar] [CrossRef]
  63. Seneviratne, S.I.; Corti, T.; Davin, E.L.; Hirschi, M.; Jaeger, B.; Lehner, I.; Orlowsky, B.; Teuling, A. Investigating soil moisture–climate interactions in a changing climate: A review. Earth Sci. Rev. 2010, 99, 125–161. [Google Scholar] [CrossRef]
  64. Cascone, S.; Coma, J.; Gagliano, A.; Perez, G. The evapotranspiration process in green roofs: A review. Build. Environ. 2019, 147, 337–355. [Google Scholar] [CrossRef]
  65. Nachtergaele, F.; Van Velthuizen, H.; Verelst, L.; Batjes, N.; Dijkshoorn, K.; VanEngelen, V.; Fischer, G.; Jones, A.; Montanarella, L.; Petri, M. Harmonized World Soil Database; Food and Agriculture Organization of the United Nations: Rome, Italy, 2008. [Google Scholar]
  66. Burkhard, B.; Kroll, F.; Nedkov, S.; Müller, F. Mapping supply, demand and budgets of ecosystem services. Ecol. Indic. 2012, 21, 17–20. [Google Scholar] [CrossRef]
  67. Burkhard, B.; Kroll, F.; Müller, F.; Windhorst, W. Landscapes′ capacities to provide ecosystem services-a concept for land-cover based assessments. Landsc. Online 2009, 15, 1–22. [Google Scholar] [CrossRef]
  68. Haines-Young, R.H.; Potschin, M.P. The links between biodiversity, ecosystem services and human well-being. In Ecosystem Ecology: A New Synthesis; Raffaelli, D.G., Frid, C.L.J., Eds.; Cambridge University Press: Cambridge, UK, 2010; p. 162. [Google Scholar] [CrossRef]
  69. Paracchini, M.L.; Zulian, G.; Kopperoinen, L.; Maes, J.; Schägner, J.P.; Termansen, M.; Zandersen, M.; Perez-Soba, M.; Scholefield, P.A.; Bidoglio, G. Mapping cultural ecosystem services: A framework to assess the potential for outdoor recreation across the EU. Ecol. Indic. 2014, 45, 371–385. [Google Scholar] [CrossRef] [Green Version]
  70. Maes, J.; Paracchini, M.L.; Zulian, G.; Dunbar, M.B.; Alkemade, R. Synergies and trade-offs between ecosystem service supply, biodiversity, and habitat conservation status in Europe. Biol. Conserv. 2012, 155, 1–12. [Google Scholar] [CrossRef]
  71. Kienast, F.; Degenhardt, B.; Weilenmann, B.; Waeger, Y.; Buchecker, M. GIS-assisted mapping of landscape suitability for nearby recreation. Landsc. Urban Plan. 2012, 105, 385–399. [Google Scholar] [CrossRef]
  72. Paracchini, M.L.; Capitani, C. Implementation of an EU Wide Indicator for the Rural-Agrarian Landscape: In Support of COM (2011) 508 Development of Agri-Environmental Indicators for Monitoring the Integration of Environmental Concerns into the Common Agricultural Policy; Publications Office: Luxembourg, 2011; ISBN 978929223952. [Google Scholar] [CrossRef]
  73. Tavakoli, M.; Mohammadyari, F. Modeling the spatial distribution of multiple ecosystem services in Ilam dam watershed, Western Iran: Identification of areas for spatial planning. Urban Ecosyst. 2022, 1–20. [Google Scholar] [CrossRef]
  74. Vallecillo, S.; La Notte, A.; Zulian, G.; Ferrini, S.; Maes, J. Ecosystem services accounts: Valuing the actual flow of nature-based recreation from ecosystems to people. Ecol. Model. 2019, 392, 196–211. [Google Scholar] [CrossRef] [PubMed]
  75. Ghermandi, A. Benefits of coastal recreation in Europe: Identifying trade-offs and priority regions for sustainable management. J. Environ. Manag. 2015, 152, 218–229. [Google Scholar] [CrossRef]
  76. Xiaonan, Y.; Zixiang, Z.; Jing, L.; Xin, F.; Xingmin, M.; Ting, L. Trade-offs between carbon sequestration, soil retention and water yield in the Guanzhong-Tianshui Economic Region of China. J. Geogr. Sci. 2016, 26, 1449–1462. [Google Scholar] [CrossRef]
  77. Shi, M.; Wu, H.; Fan, X.; Jia, H.; Dong, T.; He, P.; Jiang, P. Trade-offs and synergies of multiple ecosystem services for different land use scenarios in the yili river valley, China. Sustainability 2021, 13, 1577. [Google Scholar] [CrossRef]
  78. Wang, J.; Zhang, J.; Xiong, N.; Liang, B.; Wang, Z.; Cressey, E.L. Spatial and Temporal Variation, Simulation and Prediction of Land Use in Ecological Conservation Area of Western Beijing. Remote Sens. 2022, 14, 1452. [Google Scholar] [CrossRef]
  79. Baig, M.F.; Mustafa, M.R.U.; Baig, I.; Takaijudin, H.B.; Zeshan, M.T. Assessment of land use land cover changes and future predictions using CA-ANN simulation for selangor, Malaysia. Water 2022, 14, 402. [Google Scholar] [CrossRef]
  80. Gao, L.; Tao, F.; Liu, R.; Wang, Z.; Leng, H.; Zhou, T. Multi-scenario simulation and ecological risk analysis of land use based on the PLUS model: A case study of Nanjing. Sci. Total Environ. 2022, 85, 104055. [Google Scholar] [CrossRef]
  81. Lang, Y.Q.; Song, W.; Zhang, Y. Responses of the water-yield ecosystem service to climate and land use change in Sancha River Basin, China. Phys. Chem. Earth 2017, 101, 102–111. [Google Scholar] [CrossRef]
  82. Yang, D.; Liu, W.; Tang, L.; Chen, L.; Li, X.; Xu, X. Estimation of water provision service for monsoon catchments of South China: Applicability of the InVEST model. Landsc. Urban Plan. 2019, 182, 133–143. [Google Scholar] [CrossRef]
  83. Betru, T.; Tolera, M.; Sahle, K.; Kassa, H. Trends and drivers of land use/land cover change in Western Ethiopia. Appl. Geogr. 2019, 104, 83–93. [Google Scholar] [CrossRef]
  84. Chen, Y.L.; Wang, S.S.; Ren, Z.G.; Jingfeng, H.; Xiuzhen, W.; Shanshan, L.; Haijun, D.; Wenke, L. Increased evapotranspiration from land cover changes intensified water crisis in an arid river basin in northwest China. J. Hydrol. 2019, 574, 383–397. [Google Scholar] [CrossRef]
  85. Gaertner, B.A.; Zegre, N.; Warner, T.; Fernandez, R.; He, Y.; Merriam, E.R. Climate, forest growing season, and evapotranspiration changes in the central Appalachian Mountains, USA. Sci. Total Environ. 2019, 650, 1371–1381. [Google Scholar] [CrossRef]
  86. Aghsaei, H.; Dinan, N.M.; Moridi, A.; Asadolahi, Z.; Delavar, M.; Fohrer, N.; Wagner, P.D. Effects of dynamic land use/land cover change on water resources and sediment yield in the Anzali wetland catchment, Gilan, Iran. Sci. Total Environ. 2020, 712, 136449. [Google Scholar] [CrossRef]
  87. Chemura, A.; Rwasoka, D.; Mutanga, O.; Dube, T.; Mushore, T. The impact of land-use/land cover changes on water balance of the heterogeneous Buzi sub-catchment, Zimbabwe. Remote Sens. Appl. Soc. Environ. 2020, 18, 100292. [Google Scholar] [CrossRef]
  88. Zhan, C.S.; Xu, Z.X.; Ye, A.Z.; Su, H.B. LUCC and its impact on run-off yield in the Bai River catchment–upstream of the Miyun Reservoir basin. J Plant Ecol. 2011, 4, 61–66. [Google Scholar] [CrossRef] [Green Version]
  89. Daneshi, A.; Brouwer, R.; Najafinejad, A.; Panahi, M.; Zarandian, A.; Maghsood, F.F. Modelling the impacts of climate and land use change on water security in a semi-arid forested watershed using InVEST. J. Hydrol. 2021, 593, 125621. [Google Scholar] [CrossRef]
  90. Abera, W.; Tamene, L.; Abegaz, A.; Solomon, D. Understanding climate and land surface changes impact on water resources using Budyko framework and remote sensing data in Ethiopia. J. Arid Environ. 2019, 167, 56–64. [Google Scholar] [CrossRef]
  91. Zhang, H.; Wang, B.; Li Liu, D.; Zhang, M.; Feng, P.; Cheng, L.; Yu, Q.; Eamus, D. Impacts of future climate change on water resource availability of eastern Australia: A case study of the Manning River basin. J. Hydrol. 2019, 573, 49–59. [Google Scholar] [CrossRef]
  92. Zarandian, A.; Baral, H.; Yavari, A.R.; Jafari, H.R.; Stork, N.E.; Ling, M.A.; Amirnejad, H. Anthropogenic Decline of Ecosystem Services Threatens the Integrity of the Unique Hyrcanian (Caspian) Forests in Northern Iran. Forests 2016, 7, 51. [Google Scholar] [CrossRef]
  93. D′Amour, C.B.; Reitsma, F.; Baiocchi, G.; Barthel, S.; Güneralp, B.; Erb, K.; Haberl, H.; Creutzig, F.; Seto, K. Future urban land expansion and implications for global croplands. Proc. Natl. Acad. Sci. USA 2017, 114, 8939–8944. [Google Scholar] [CrossRef] [PubMed] [Green Version]
  94. Liu, J.; Zhang, G.; Zhuang, Z.; Cheng, Q.; Gao, Y.; Chen, T.; Huang, Q.; Xu, L.; Chen, D. A new perspective for urban development boundary delineation based on SLEUTH-InVEST model. Habitat Int. 2017, 70, 13–23. [Google Scholar] [CrossRef]
  95. Locher-Krause, K.E.; Lautenbach, S.; Volk, M. Spatio-temporal change of ecosystem services as a key to understand natural resource utilisation in Southern Chile. Reg. Environ. Chang. 2017, 17, 2477–2493. [Google Scholar] [CrossRef]
  96. Tolessa, T.; Senbeta, F.; Kidane, M. The impact of land use/land cover change on ecosystem services in the central highlands of Ethiopia. Ecosyst. Serv. 2017, 23, 47–54. [Google Scholar] [CrossRef]
  97. Van Vliet, J.; Eitelberg, D.A.; Verburg, P.H. A global analysis of land take in cropland areas and production displacement from urbanisation. Glob. Environ. Chang. 2017, 43, 107–115. [Google Scholar] [CrossRef]
  98. Mohammadyari, F.; Mirsanjari, M.M.; Zarandian, A. Evaluating Ecological Networks of Urban Landscape (Case Study: Karaj Metropolis). Town Ctry. Plan. 2018, 10, 225–247. [Google Scholar]
  99. Song, W.; Deng, X. Land-use/land-cover change and ecosystem service provision in China. Sci. Total Environ. 2017, 576, 705–719. [Google Scholar] [CrossRef] [PubMed]
  100. Yang, S.Q.; Zhao, W.W.; Liu, Y.X.; Wang, S.; Wang, J.; Zhai, R.J. Influence of land use change on the ecosystem service trade-offs in the ecological restoration area: Dynamics and scenarios in the Yanhe watershed, China. Sci. Total Environ. 2018, 644, 556–566. [Google Scholar] [CrossRef]
  101. Jie, X.; Yu, X.; Na, L.; Hao, W. Spatial and temporal patterns of supply and demand balance of water supply services in the Dongjiang Lake Basin and its beneficiary areas. J. Resour. Ecol. 2015, 6, 386–396. [Google Scholar] [CrossRef]
  102. Cortinovis, S.; Geneletti, D. Ecosystem services in urban plans: What is there, and what is still needed for better decisions. Land Use Policy 2018, 70, 298–312. [Google Scholar] [CrossRef]
  103. Redhead, J.W.; Stratford, C.; Sharps, K.; Jones, L.; Ziv, G.; Clarke, D.; Oliver, T.H.; Bullock, N.M. Empirical validation of the InVEST water yield ecosystem service model at a national scale. Sci. Total Environ. 2016, 569, 1418–1426. [Google Scholar] [CrossRef] [PubMed]
Figure 1. Location of the study area.
Land 12 00291 g001
Figure 2. The general structure of the models used for urban expansion simulation and quantifying ESs.
Land 12 00291 g002
Figure 3. Spatial distributions of LULC in the Karaj landscape under CU and different scenarios.
Land 12 00291 g003
Figure 4. Spatial patterns of the ESs in the Karaj landscape.
Land 12 00291 g004aLand 12 00291 g004b
Figure 5. Percentage of land within each ROS category and the indicator value of outdoor recreational opportunity index in the Karaj landscape.
Land 12 00291 g005
Table 1. The input data and sources for ES assessment and land use modelling.
Data TypesModelInput DataDescription
LULCSupport Vector Machines (SVM)
Markov Chain
MOLA
LULC dataLandsat 5 and Landsat 8 satellite images were downloaded for 2006, 2011 and 2017 from the United States Geological Survey (www.usgs.gov, 1 June 2006, 2011 and 2017).
Digital elevation modelAster satellite
Provisioning Service
Water yield
InVEST model
[46]
LULC mapA GIS raster dataset with an LULC code for each cell
Precipitation (mm)A GIS raster dataset with a non-zero value for average annual precipitation for each cell.
Average annual reference evapotranspiration (mm)A GIS raster dataset with an annual average evapotranspiration value for each cell.
Root restricting layer depth (mm)A GIS raster dataset with an average root restricting layer depth value for each cell.
Plant available water (PAWC)A GIS raster dataset with a plant available water content value for each cell.
WatershedsOne polygon per watershed (shape file).
Sub-watershedsA shape file with one polygon per sub-watershed within the main watersheds specified in the Watersheds shape file.
Biophysical TableTables of LULC classes, including data on biophysical coefficients used in this tool.
Demand TableA table of LULC classes showing consumption water use for each LULC type.
Food productionYield model
[19]
LULC mapA GIS raster dataset with an LULC code for each cell.
Cultural Service
Outdoor recreation opportunity
ROS model
[37,38,47]
Cultivated land Number of fruit-producing tressStatistical information on agricultural and garden products obtained from the Statistics Centre of Iran.
Natural areaDegree of naturalness: Hemeroby index
Water componentWater bodies (extracted from LULC)
River (extracted from LULC)
proximityRoad network
Urban areas (extracted from LULC)
Table 2. The shape of membership functions and control points of different factors.
CriteriaShape of Membership FunctionsControl Points
abcd
Distance from RiverDecreasing linear--5001000
Distance from Water bodiesDecreasing linear--302000
Distance from Human-MadeDecreasing linear--20005000
Distance from RoadsDecreasing linear--5005000
Table 3. Changes in LULC in the Karaj landscape under each scenario.
Land Use TypeArea (ha)
CUBAUPB
Human-made14,478.6618,729.6417,630.64
Agriculture6511.865199.856473.16
Garden7036.676834.296995.71
Water body326.97326.97325.5
Low dense grassland22,584.9620,197.9319,899.67
Dense grassland40,167.0939,810.5939,774.65
Barren227.43227.43226.63
Rocky outcrop24,393.7824,401.7824,402.09
Green space802.42801.36801.79
River990.36990.36990.36
Table 4. The effects of changes in precipitation and evapotranspiration on landscape water yield in CU and two scenarios.
Average Precipitation
(mm)
Average Evapotranspiration
(mm)
Water-Related
(Million m3/Year)
Water YieldWater SupplyWater Demand
CU523.21288.08235.10−105.62340.72
BAU523.19282.58240.61−106.98347.59
PB523.19283.75238.41−108.26346.67
Table 5. The volume of water production and other related variables in the water basins in the Karaj landscape.
Sub-Basin Code12345
Area (ha)76,114.00963.183131.21634,540.502771.277
Average Precipitation (mm/year)573.62407.49407.44431.46454.05
Evapotranspiration (mm/pixel)
Potential550.91127.31273.22450.4597.59
Actual338.7792.26139.98198.6245.32
Water yield volume (million m3/year)
CU 234.7315.2267.5232.9208.7
BAU scenario233.3331.9277.3253.1208.7
PB scenario234.6314.4269.4247.4208.7
Water supply (million m3/year)
CU 121.1−868.8−813.9−539.0134.4
BAU scenario119.8−666.1−698.1−556.7131.5
PB scenario120.0−871.6−830.5−610.3134.3
Water demand (million m3/year)
CU 113.61184.01081.4771.974.3
BAU scenario113.5998.0975.4809.877.2
PB scenario114.61186.01099.9857.775.4
Table 6. Changes in food production under different scenarios.
FoodLandscape DistrictArea Agriculture and Garden Land (ha)Production (Ton/ha)
CUBAUPBCUBAUPB
Grains (Agriculture land)upstream000000
downstream6511.85199.86473.1110,024.988,170.88109,271.3
Fruits
(Garden land)
upstream6105.96031.86035.756,602.356,759.2357,588.5
downstream930.7802.4959.91259.21015.151361.5
Disclaimer/Publisher’s Note: The statements, opinions and data contained in all publications are solely those of the individual author(s) and contributor(s) and not of MDPI and/or the editor(s). MDPI and/or the editor(s) disclaim responsibility for any injury to people or property resulting from any ideas, methods, instructions or products referred to in the content.

