
Study on Planning and Design of Blue-Green-Gray Transformation of Lakeside Cities to Deal with the Complex Urban Waterlogging Caused by Extreme Rainstorm
Abstract
:1. Introduction
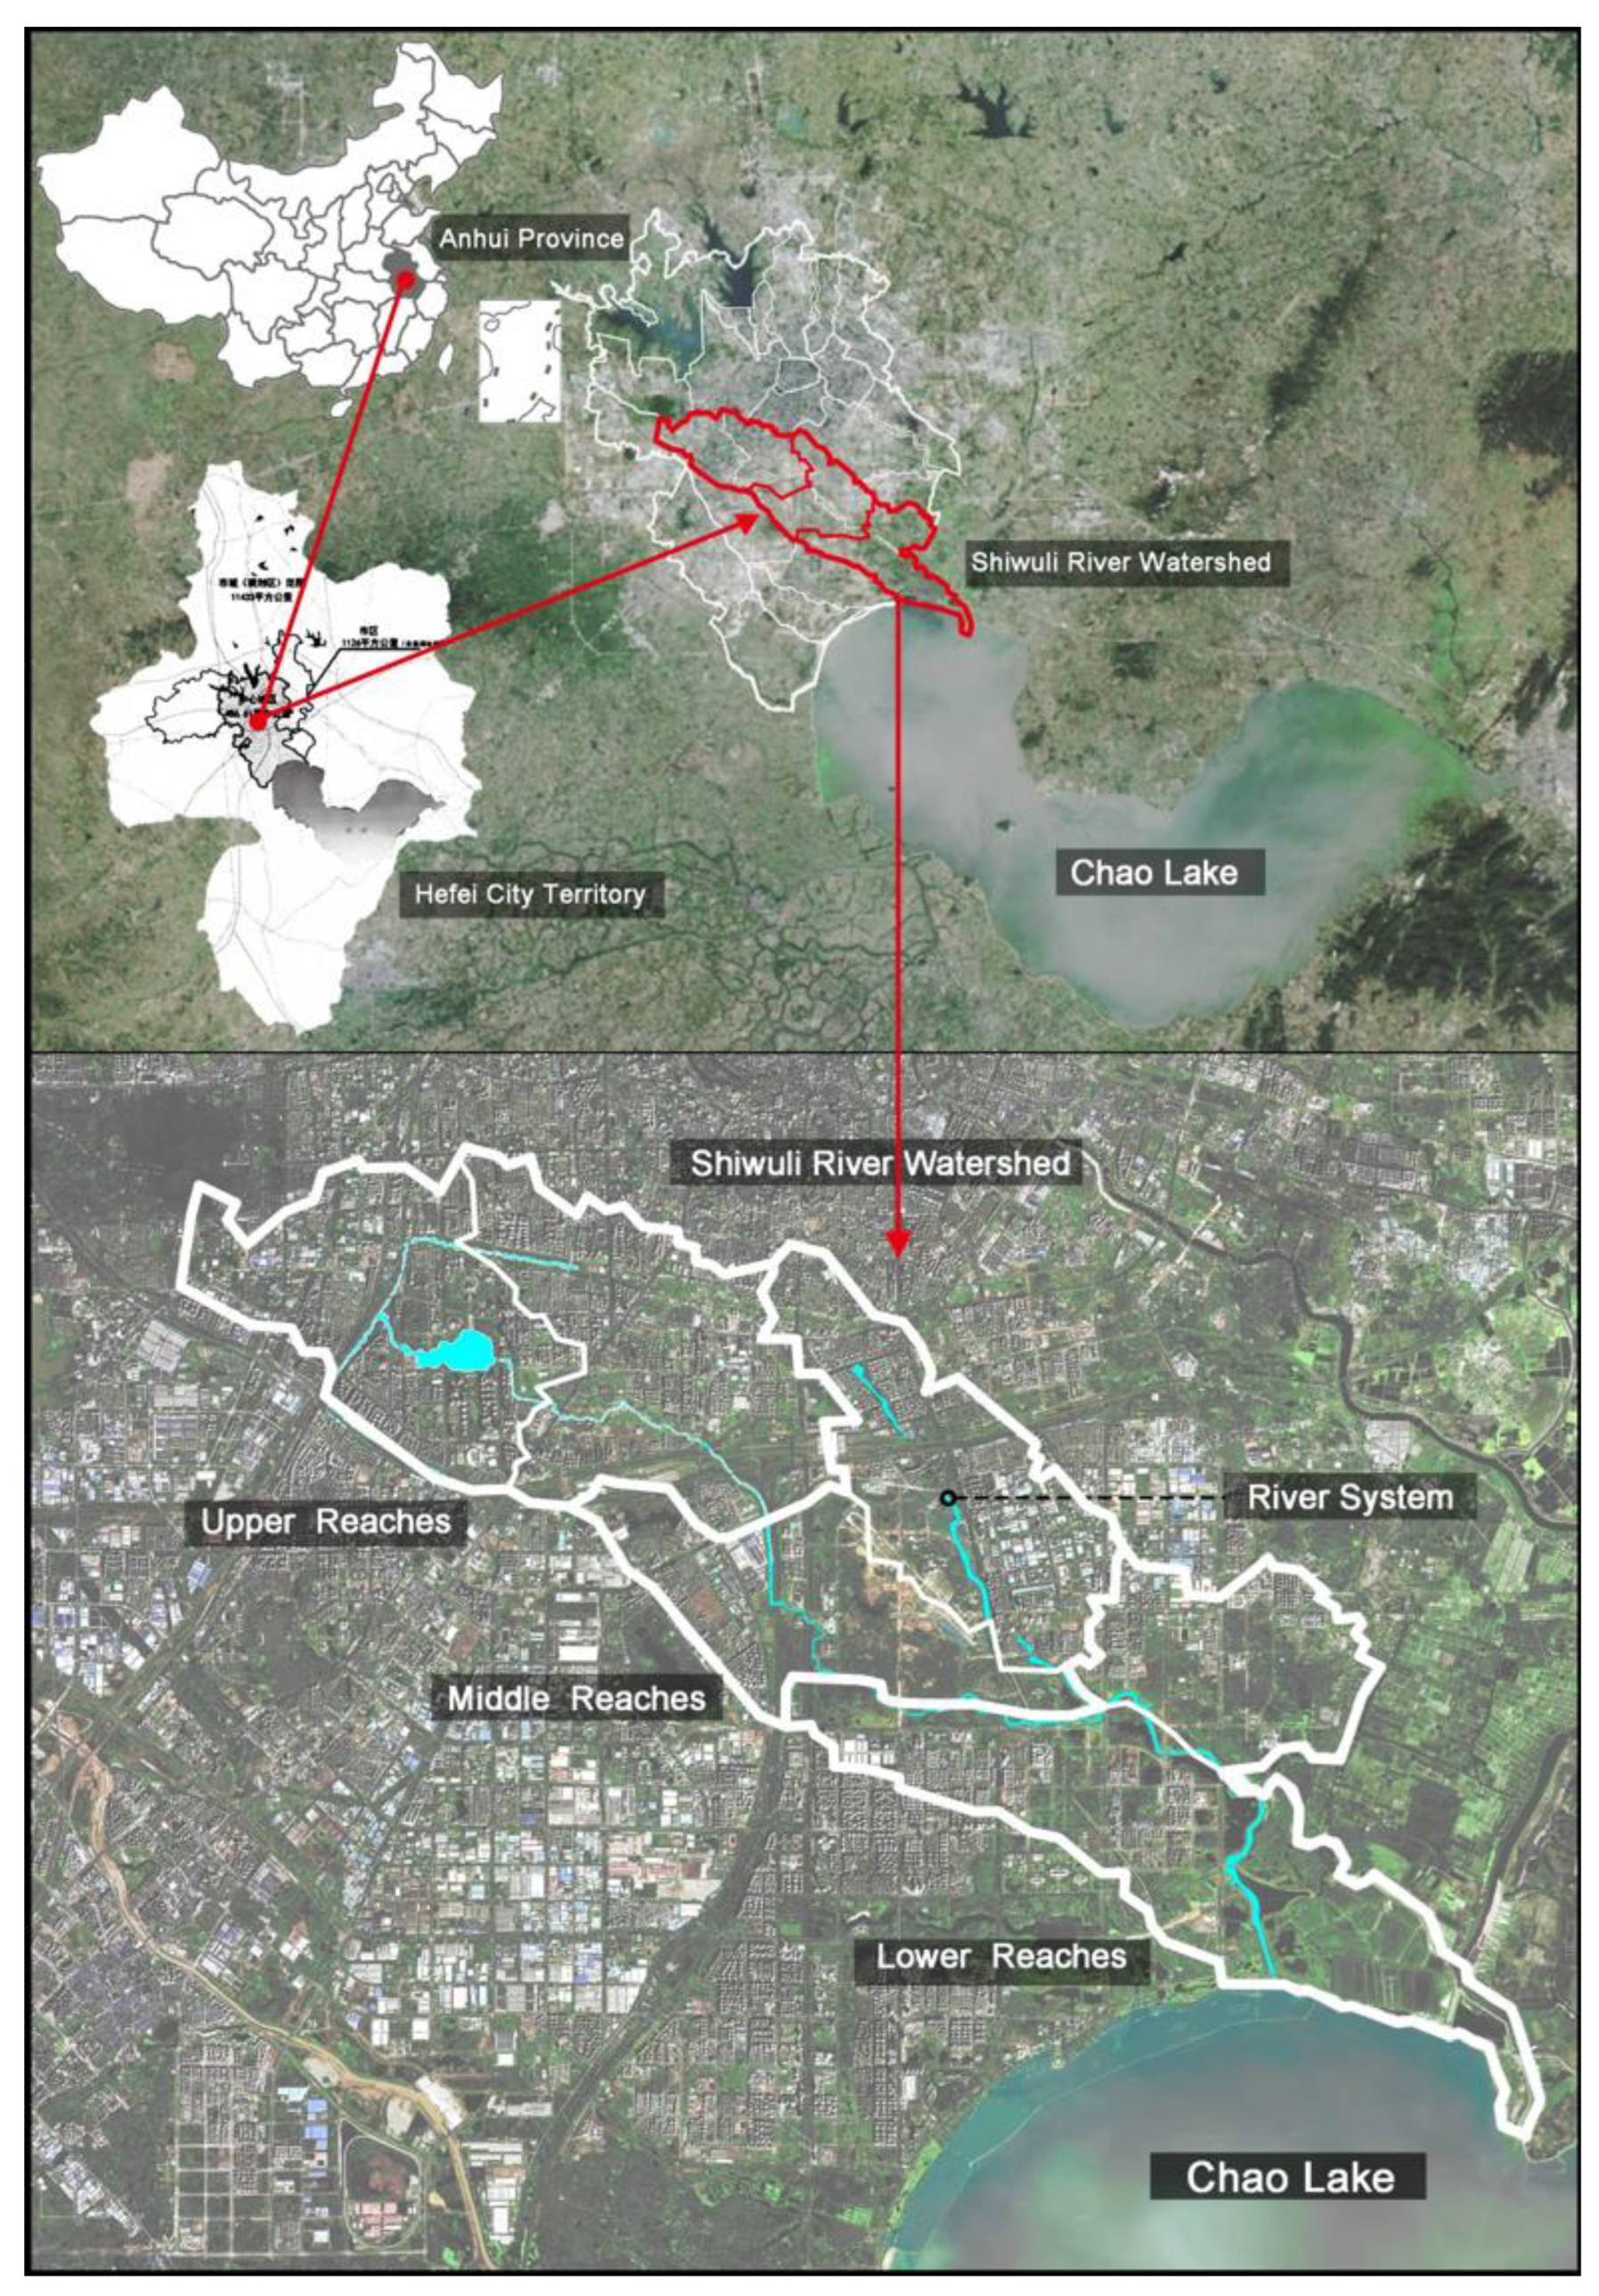
2. Case Study
3. Methods
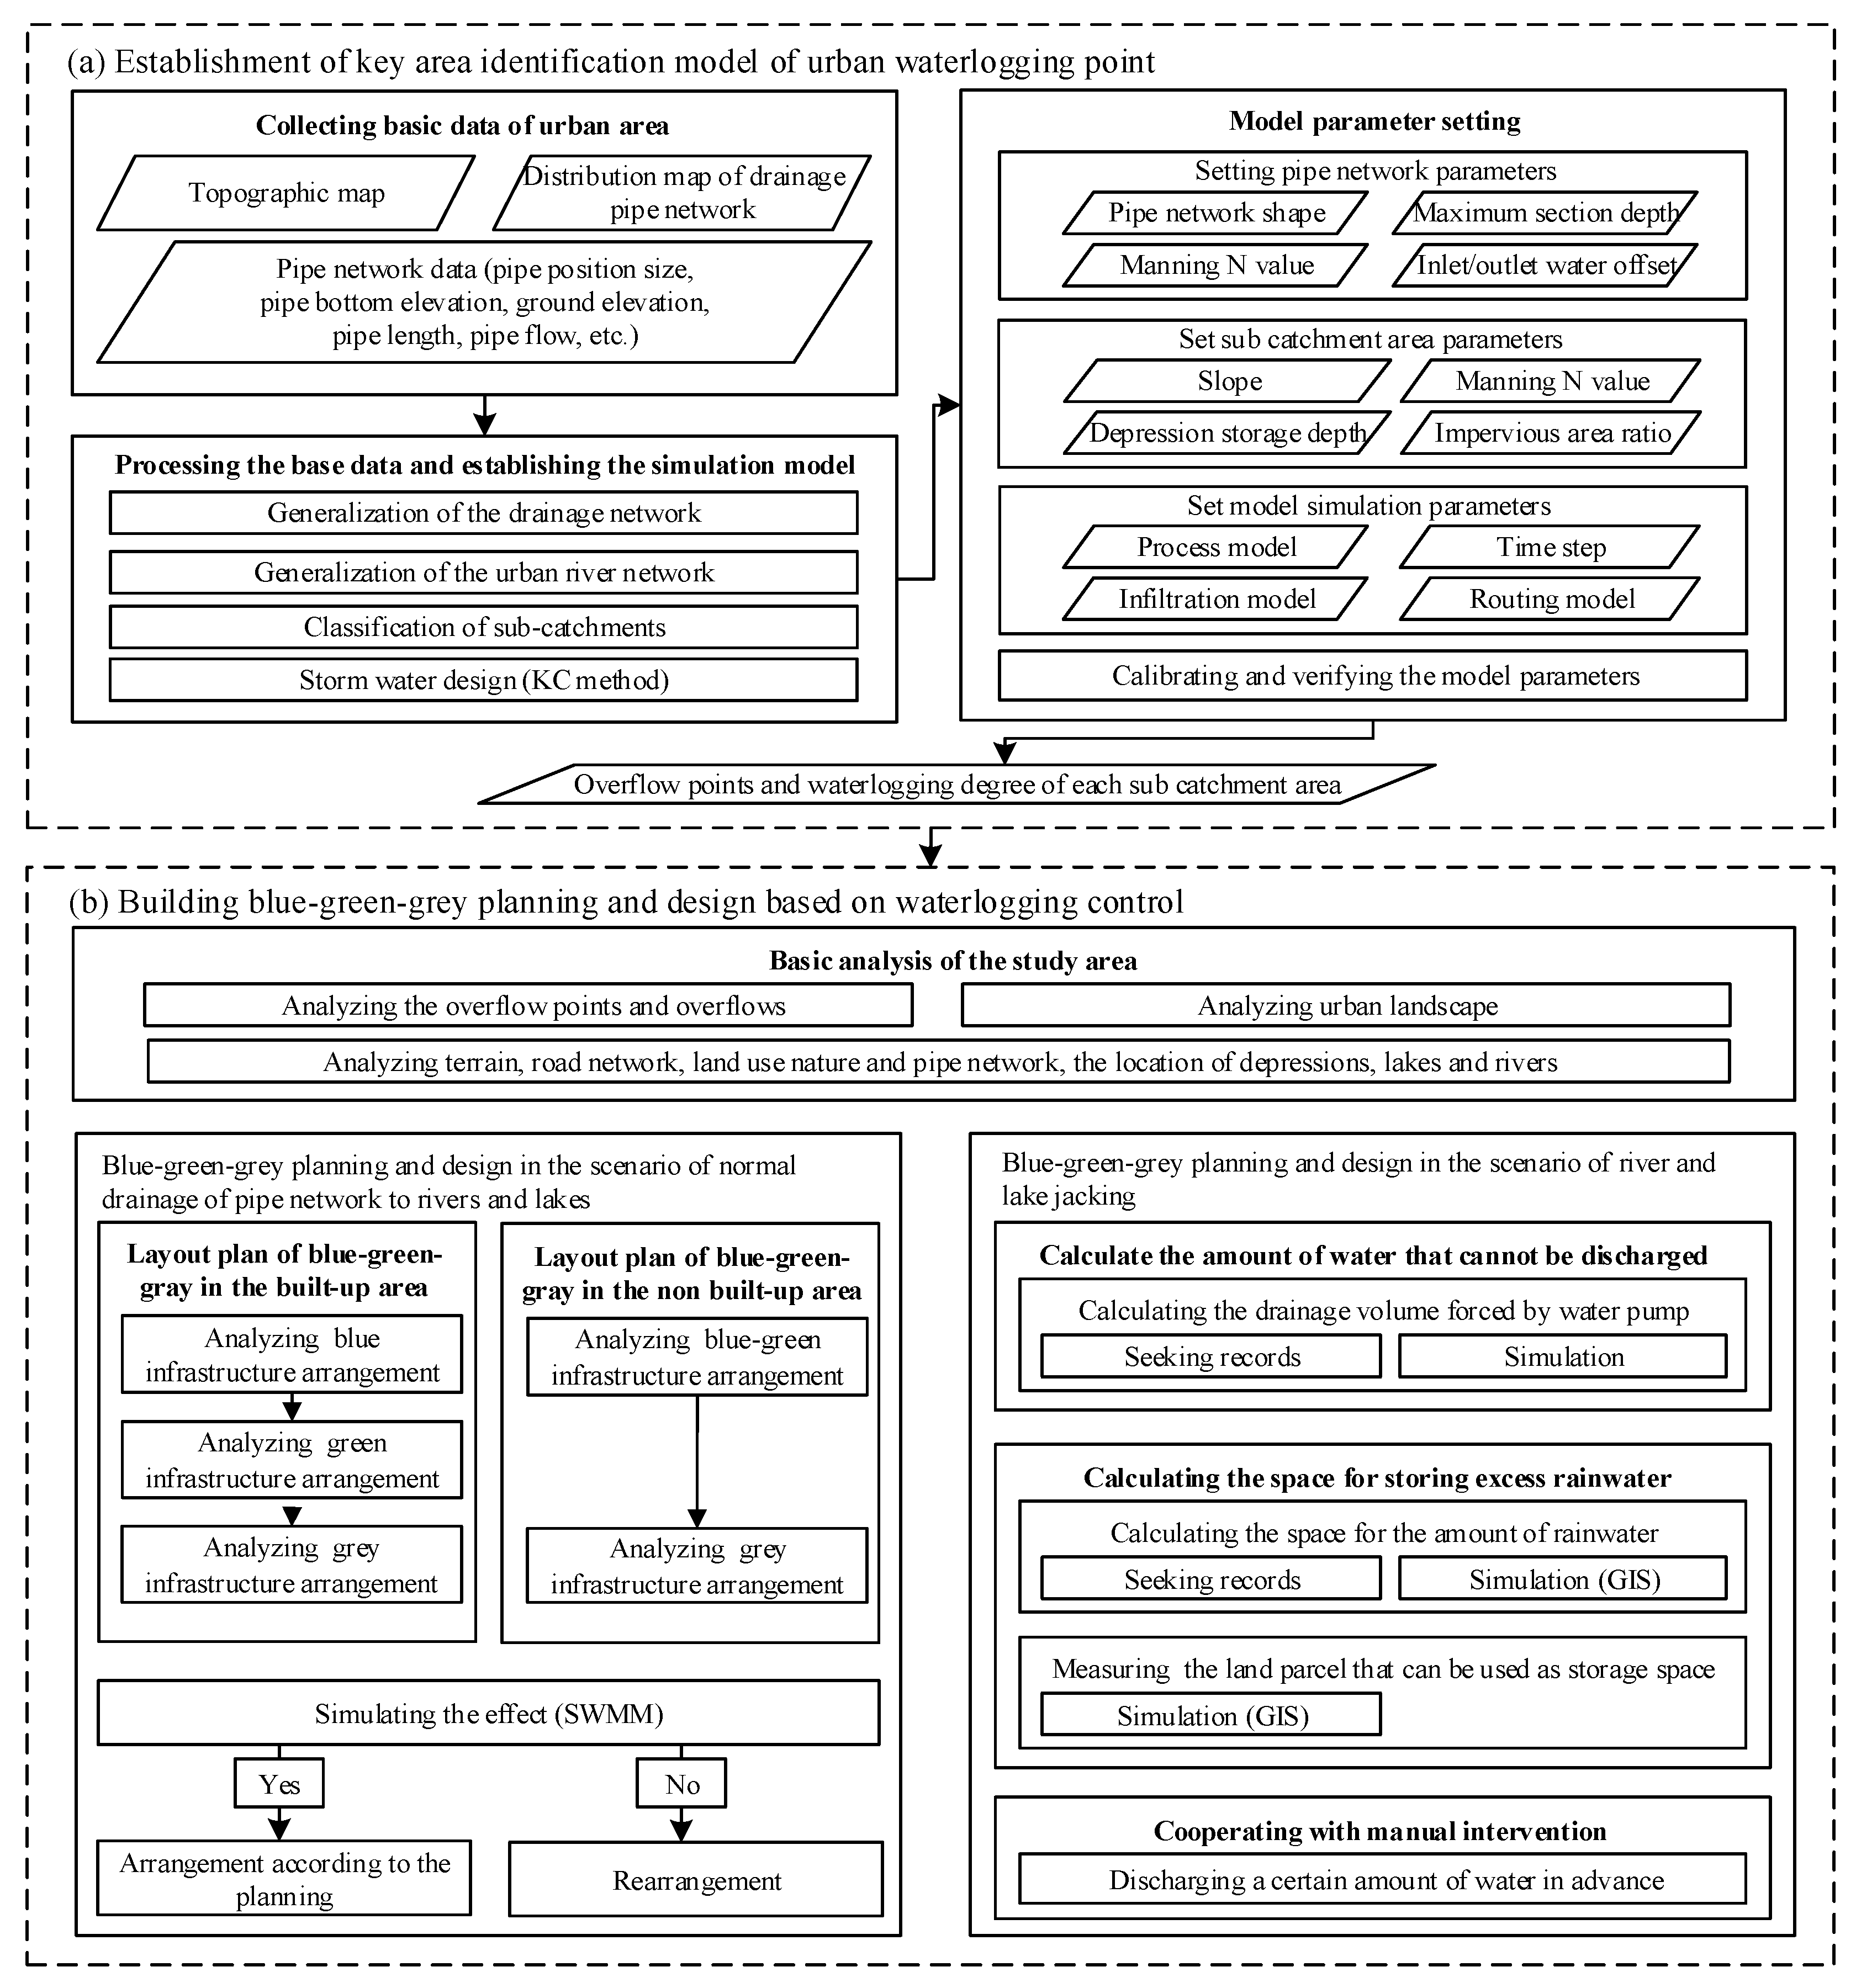
3.1. Establishment of Key Area Identification Model of Urban Waterlogging Point
3.2. Building Blue-Green-Grey Planning and Design Based on Waterlogging Control
- (1)
- Scenarios of normal drainage of pipe network to rivers and lakes
- (2)
- Scenarios of backwater effects of river and lake
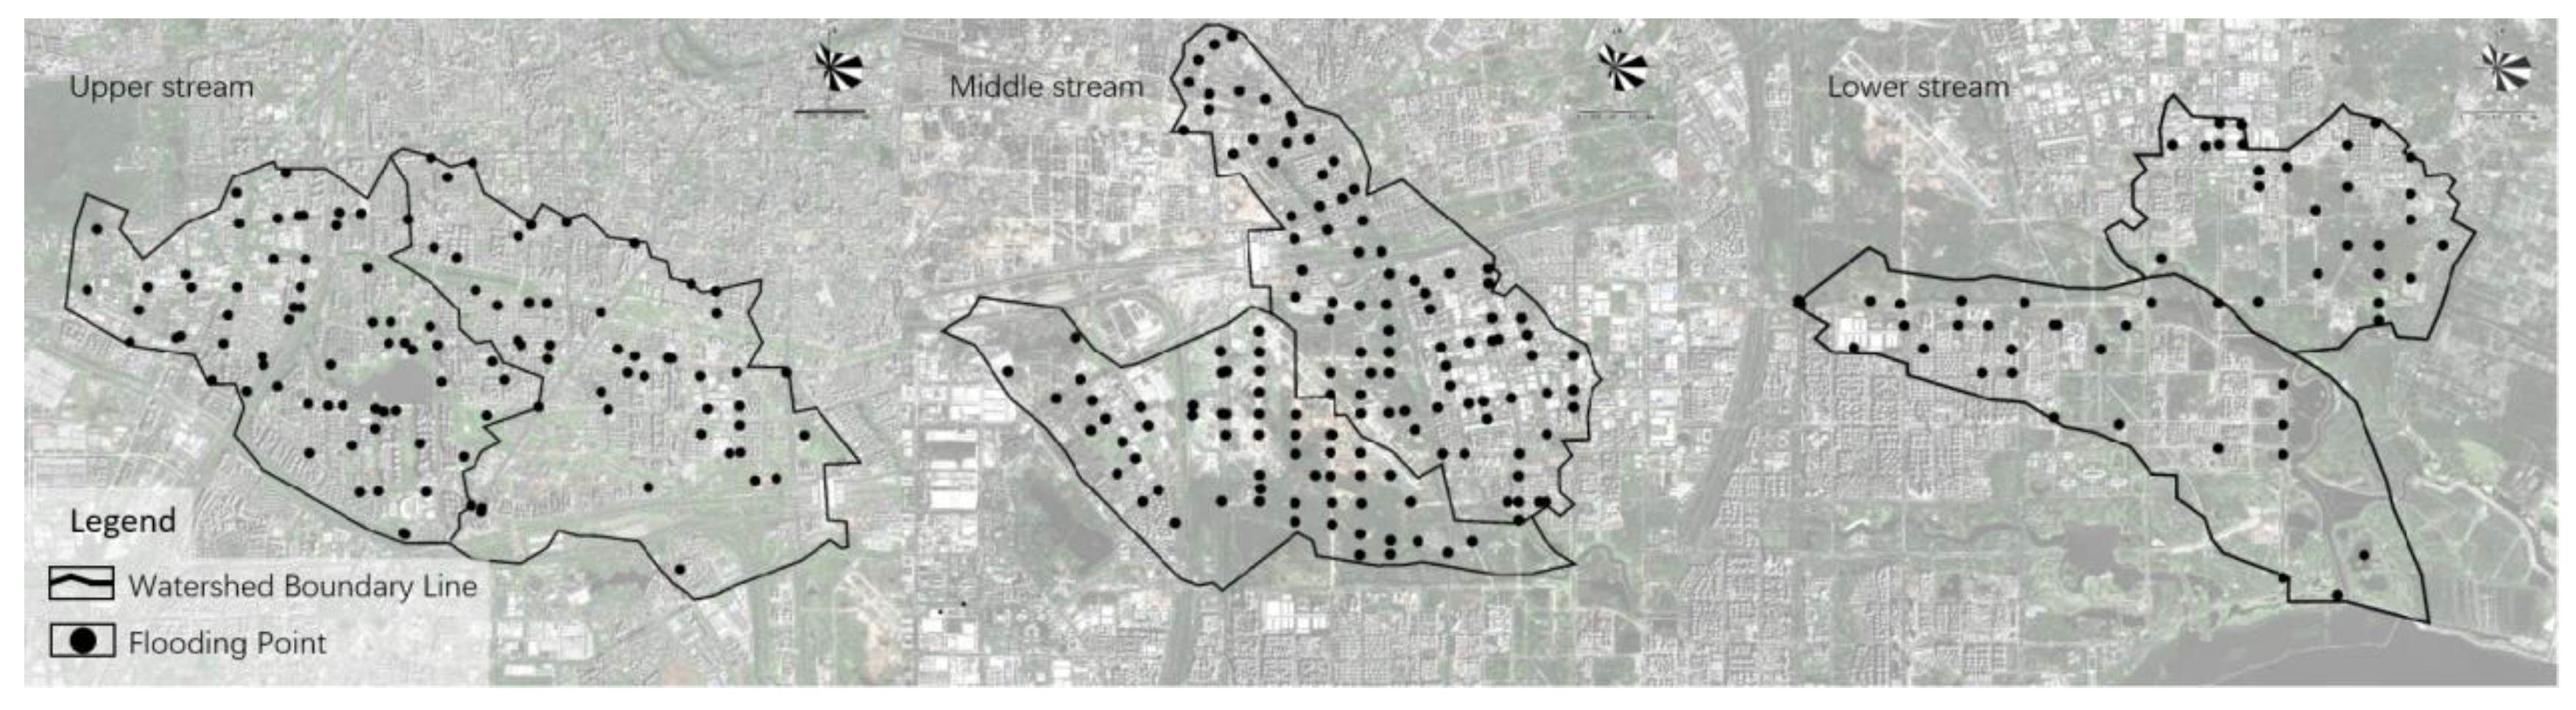
4. Results
4.1. Hydrological Simulation of the Shiwuli River
4.2. Reconstruction Planning for Blue-Green-Gray Infrastructure
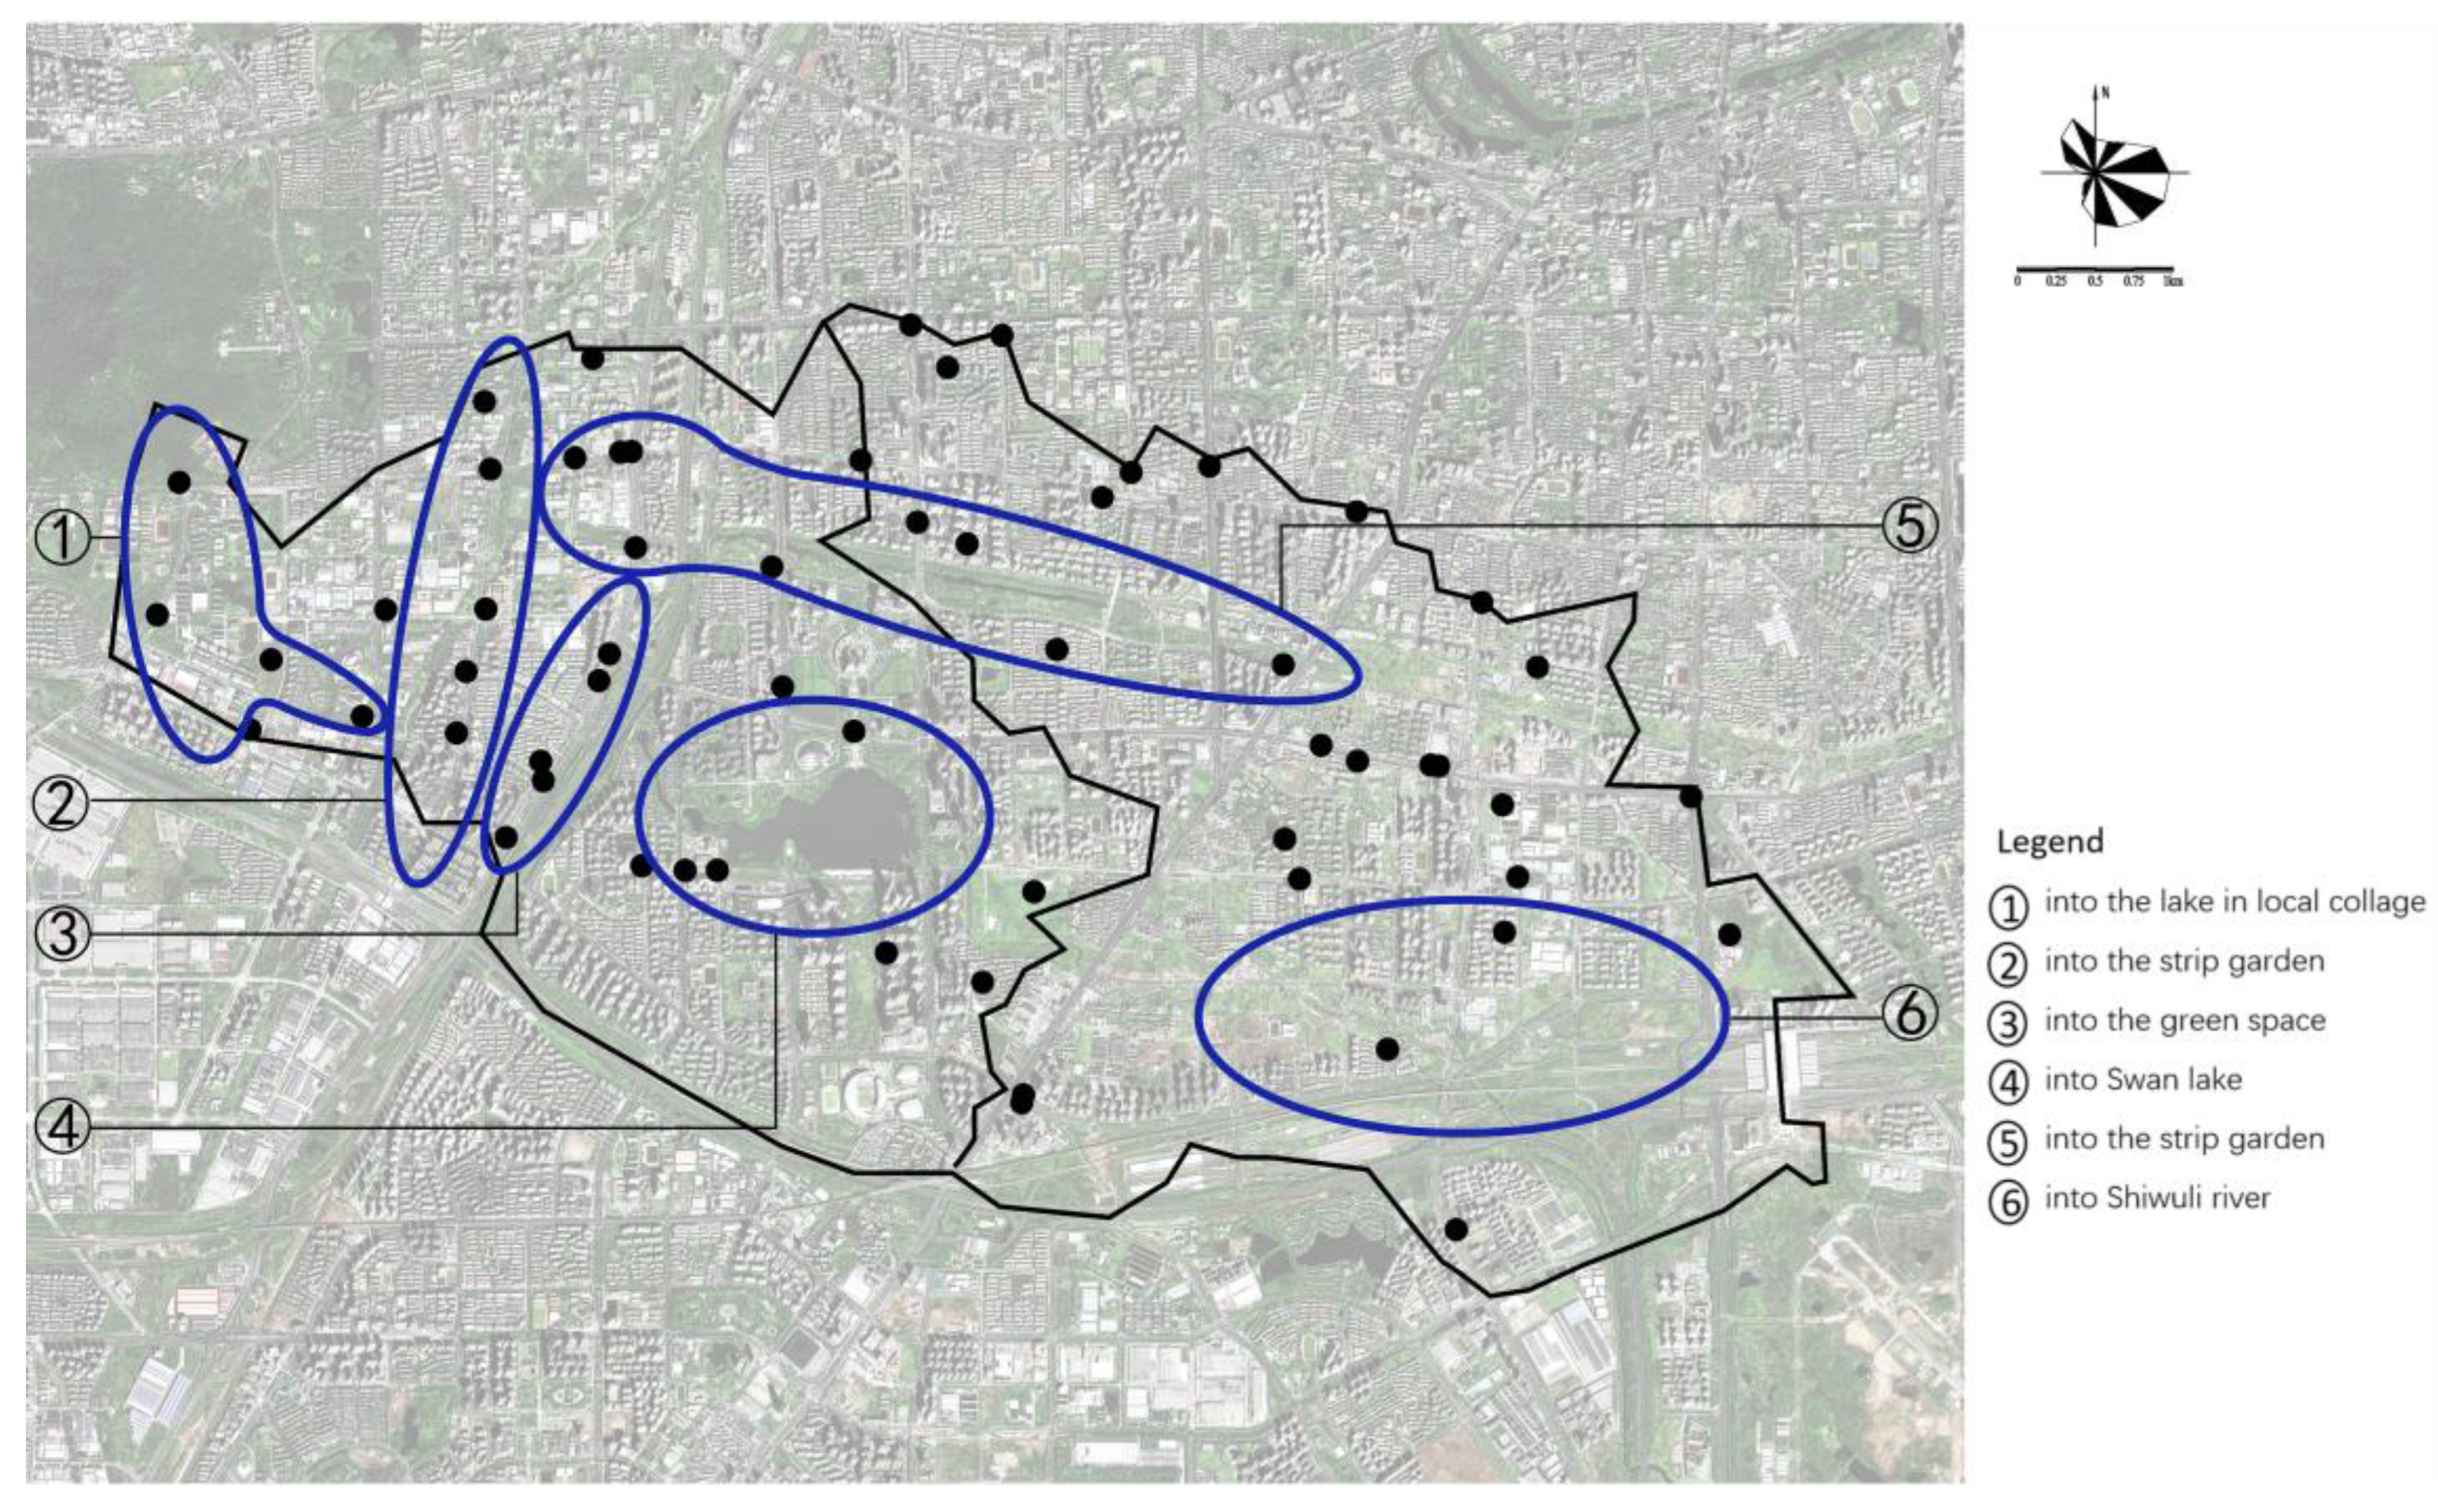
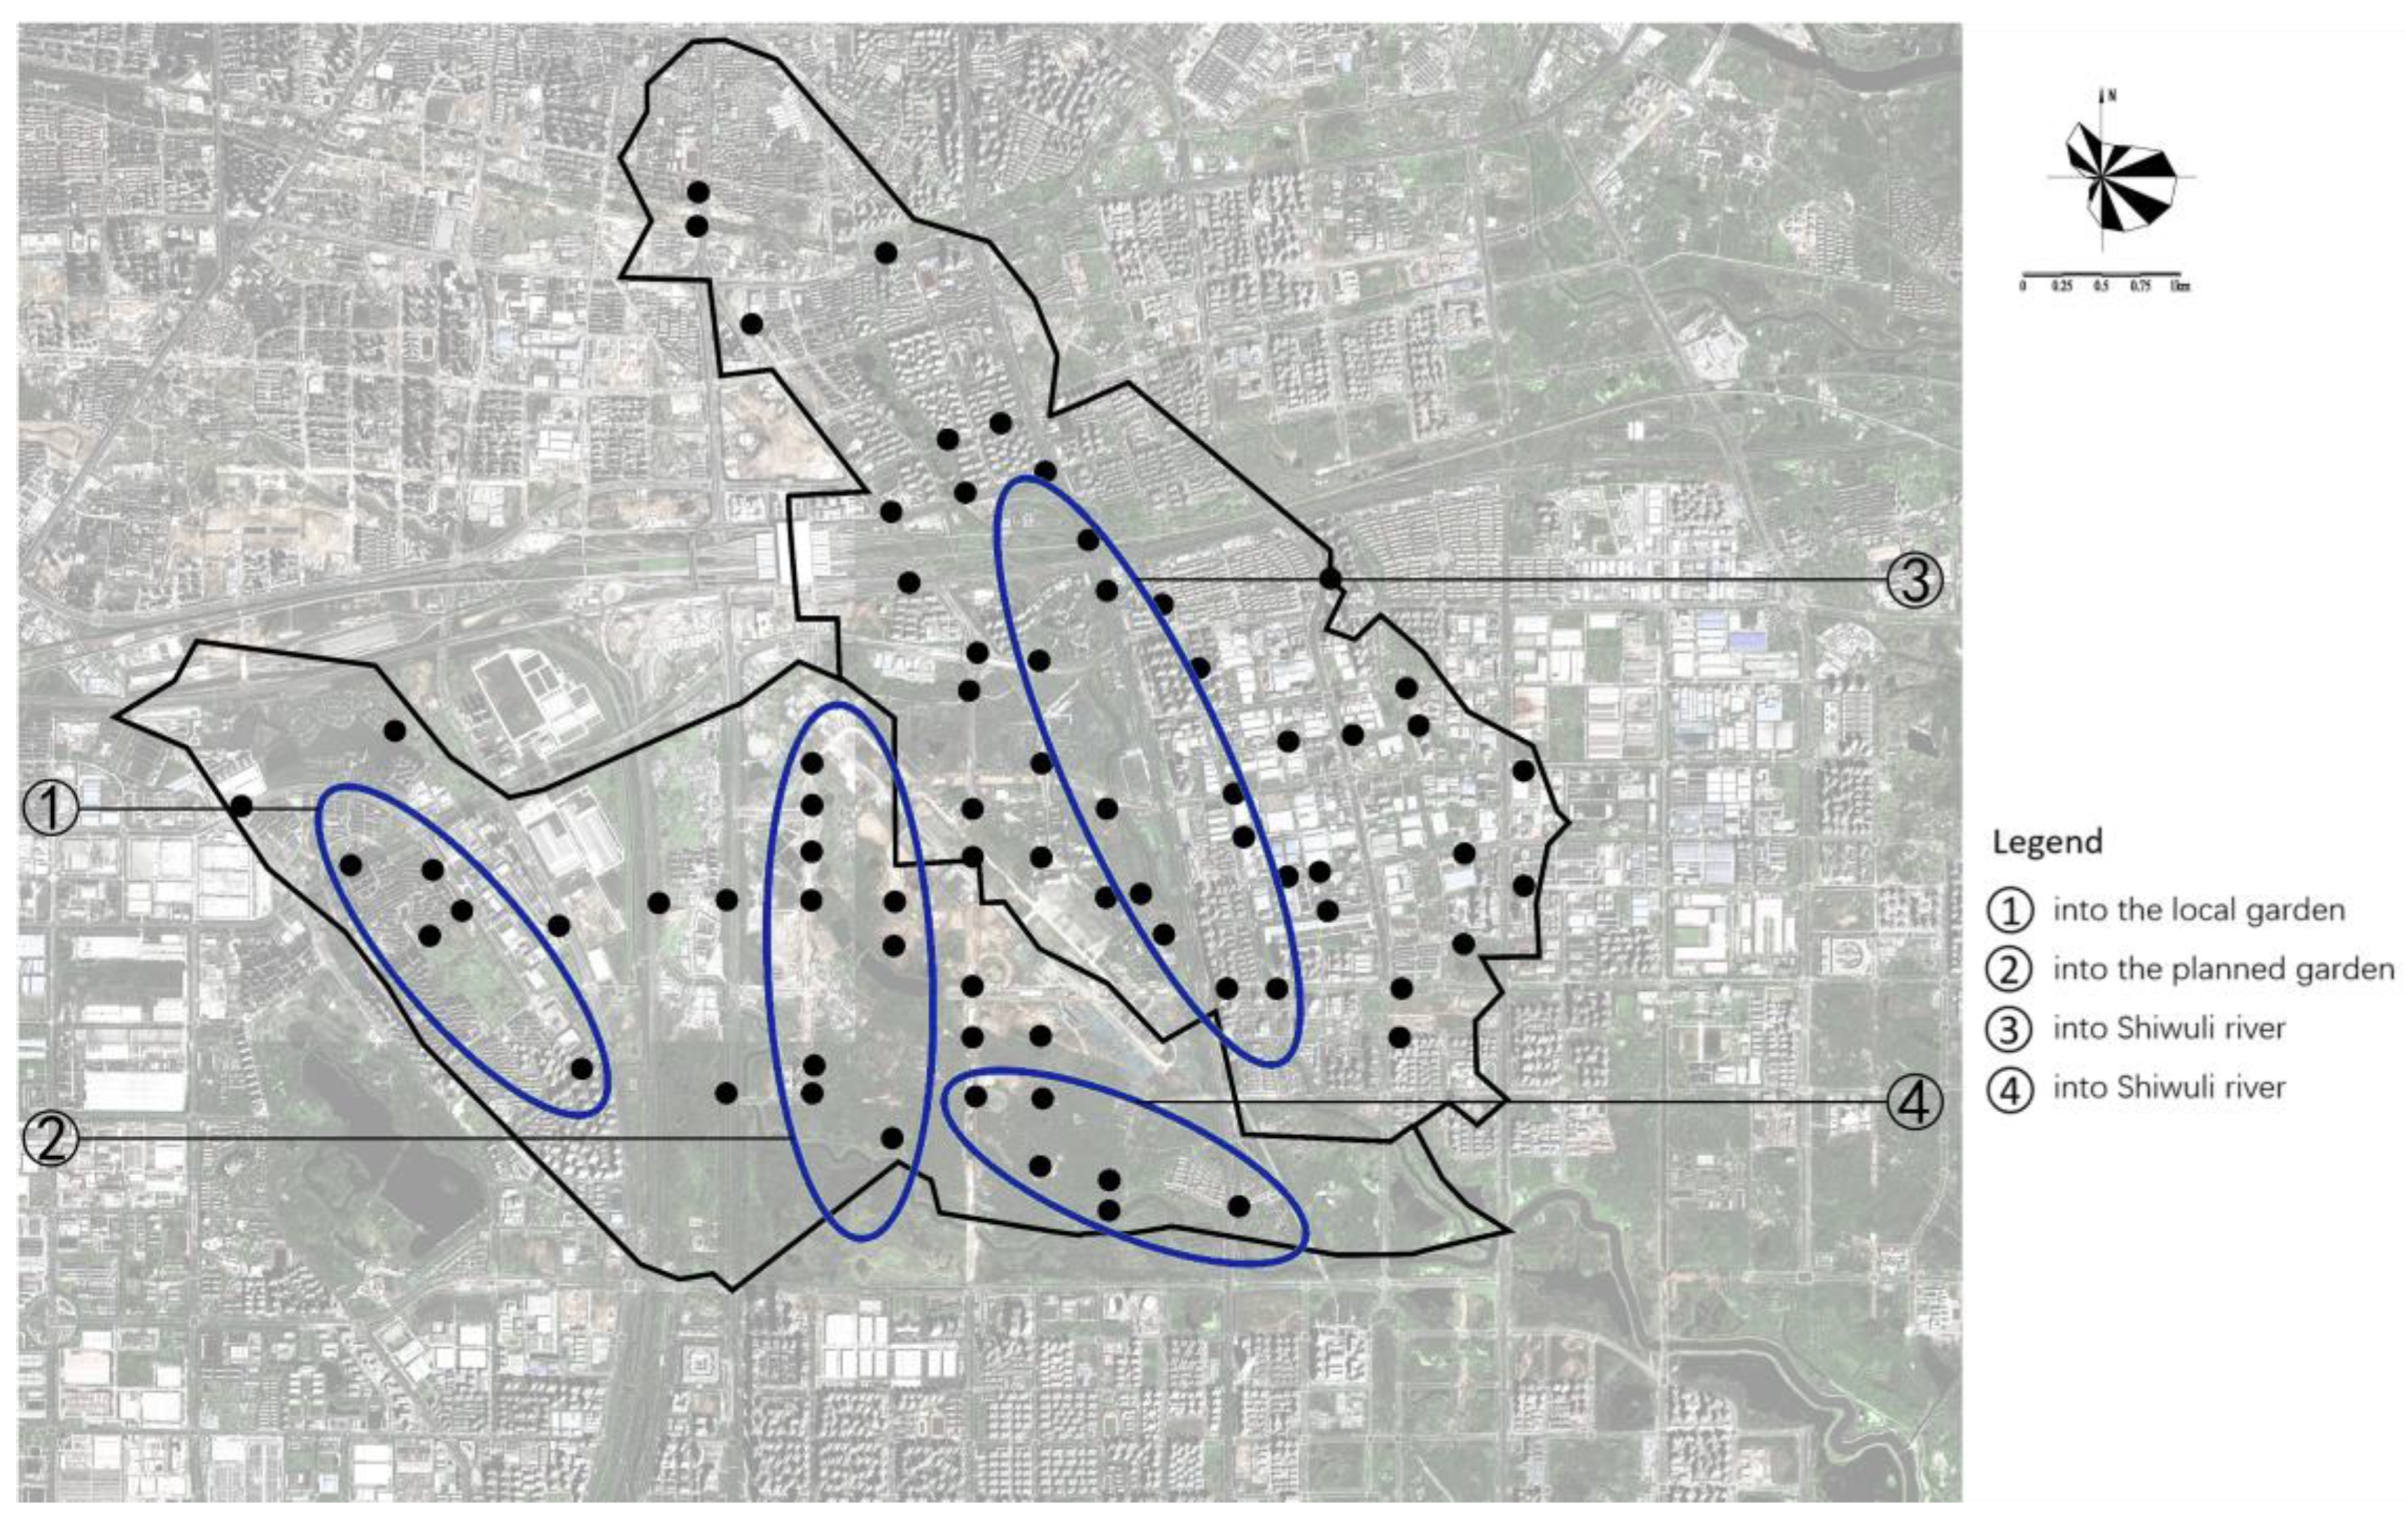
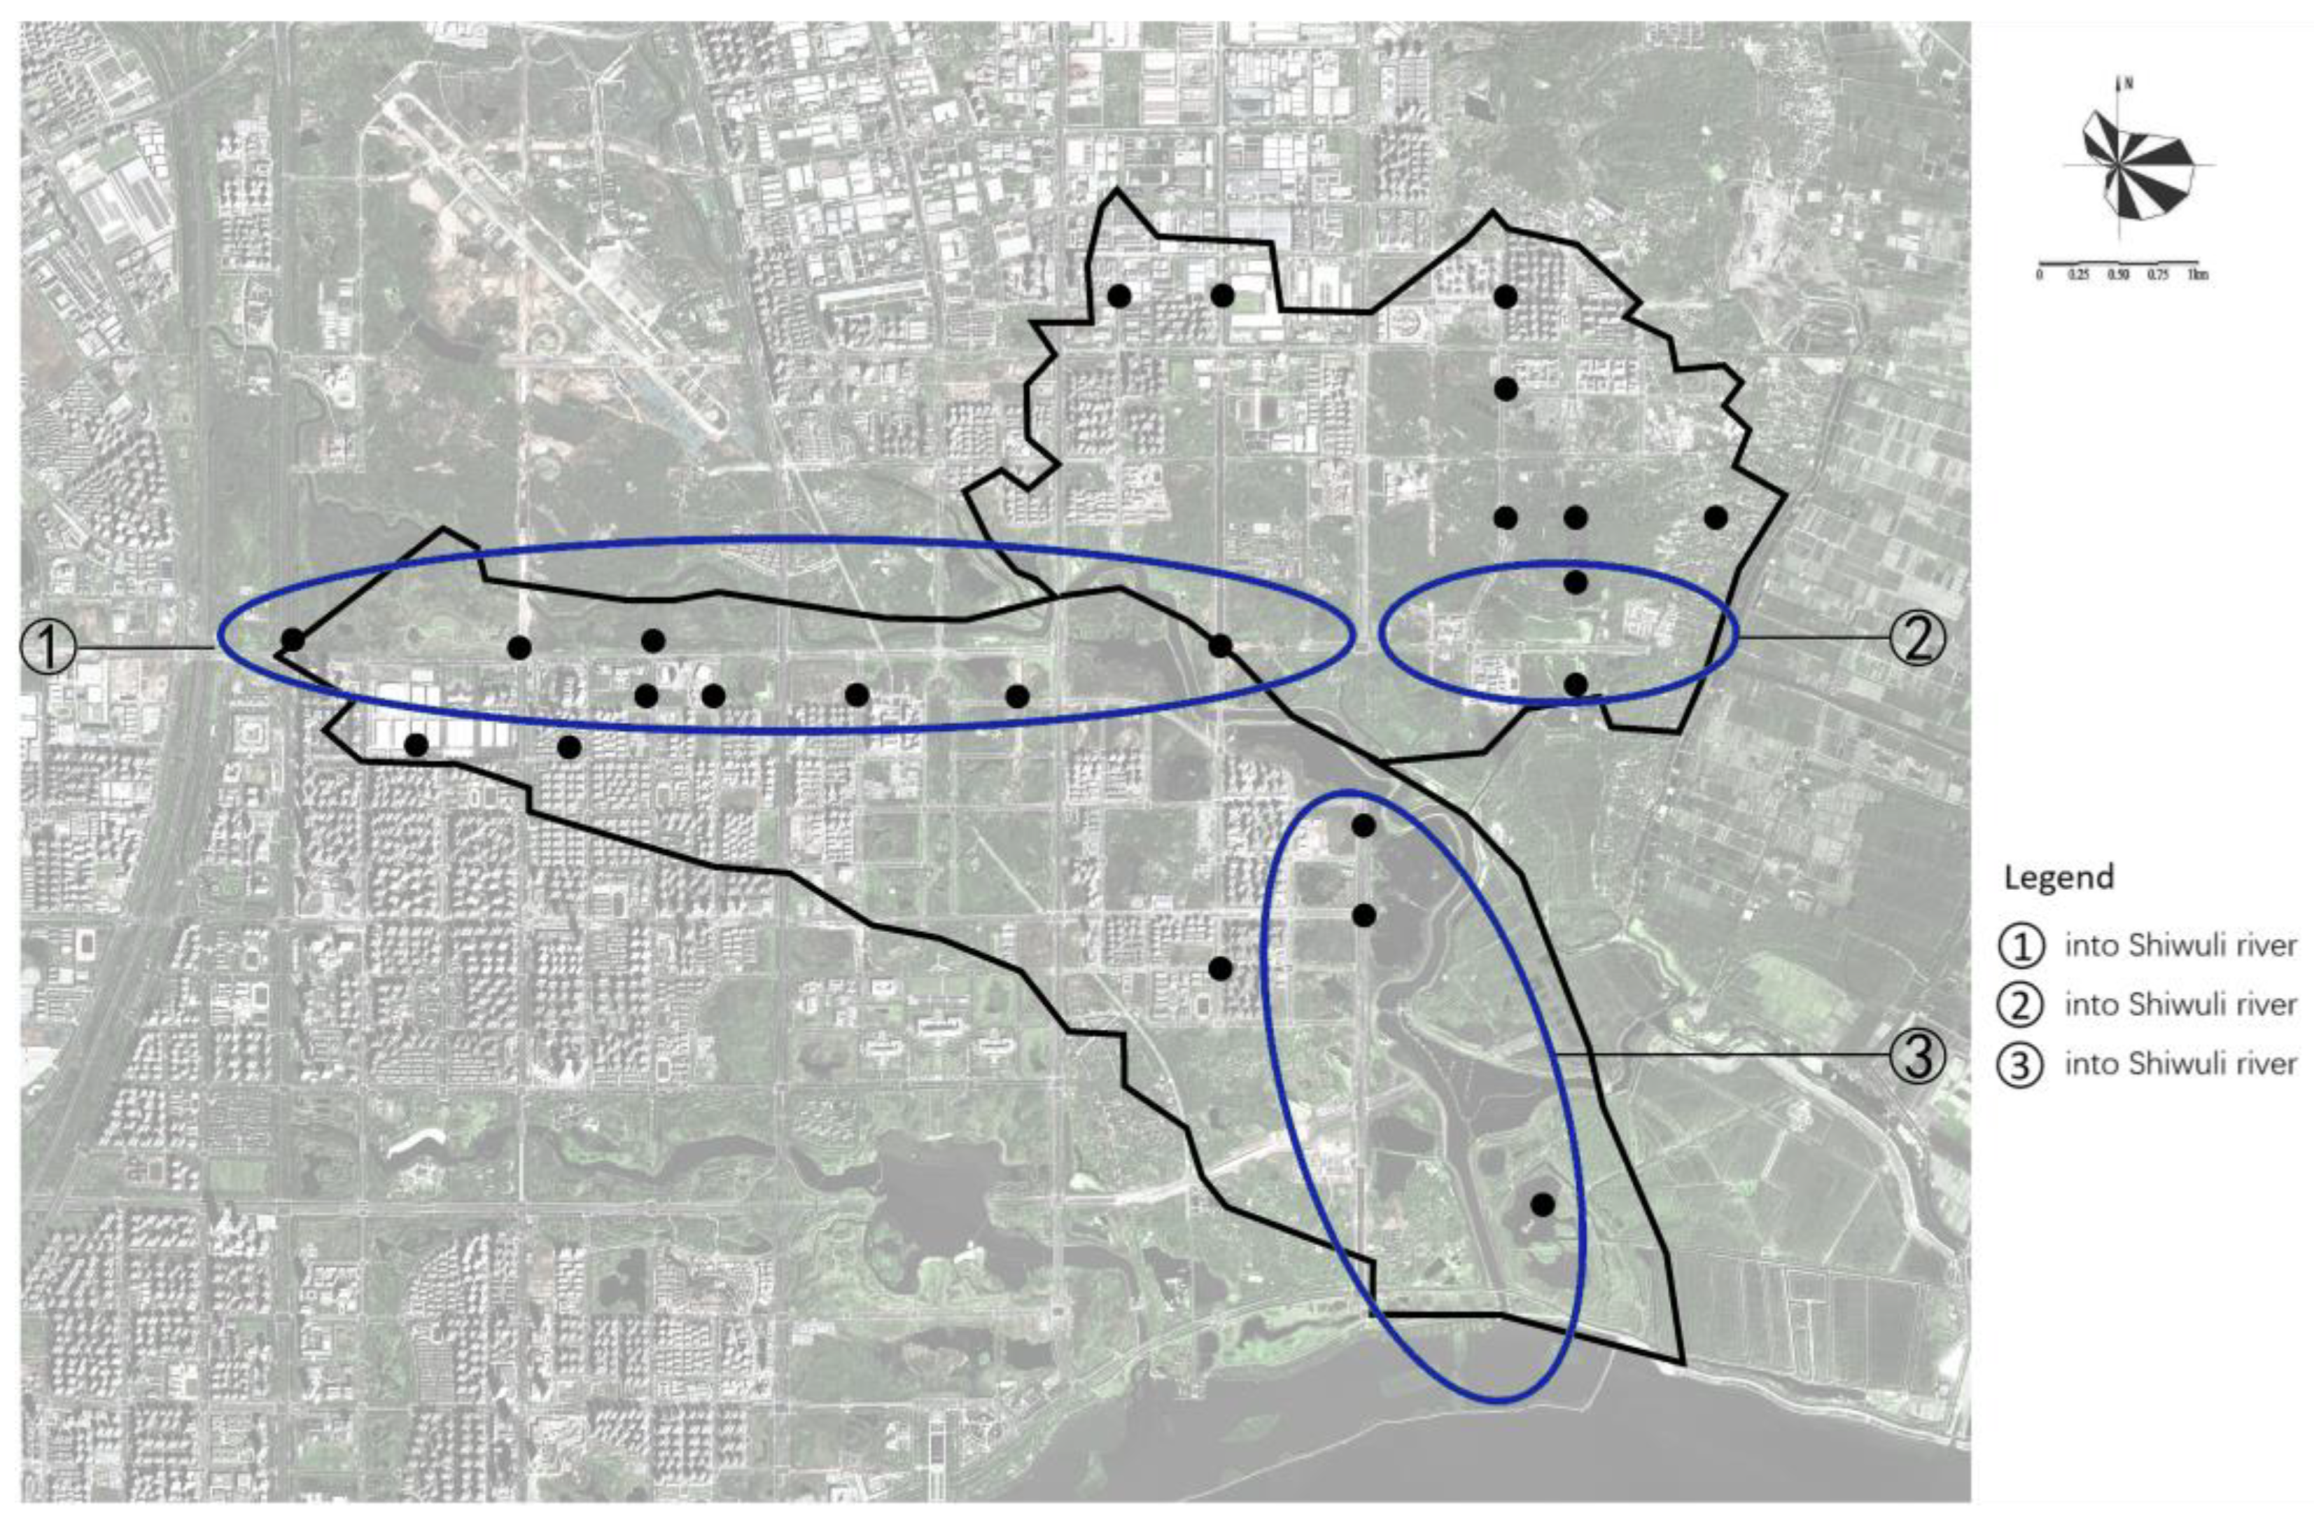
4.2.1. Scenarios of Urban Rainwater Flowing Smoothly into Rivers and Lakes
4.2.2. Scenarios of Backwater Effects of Lake
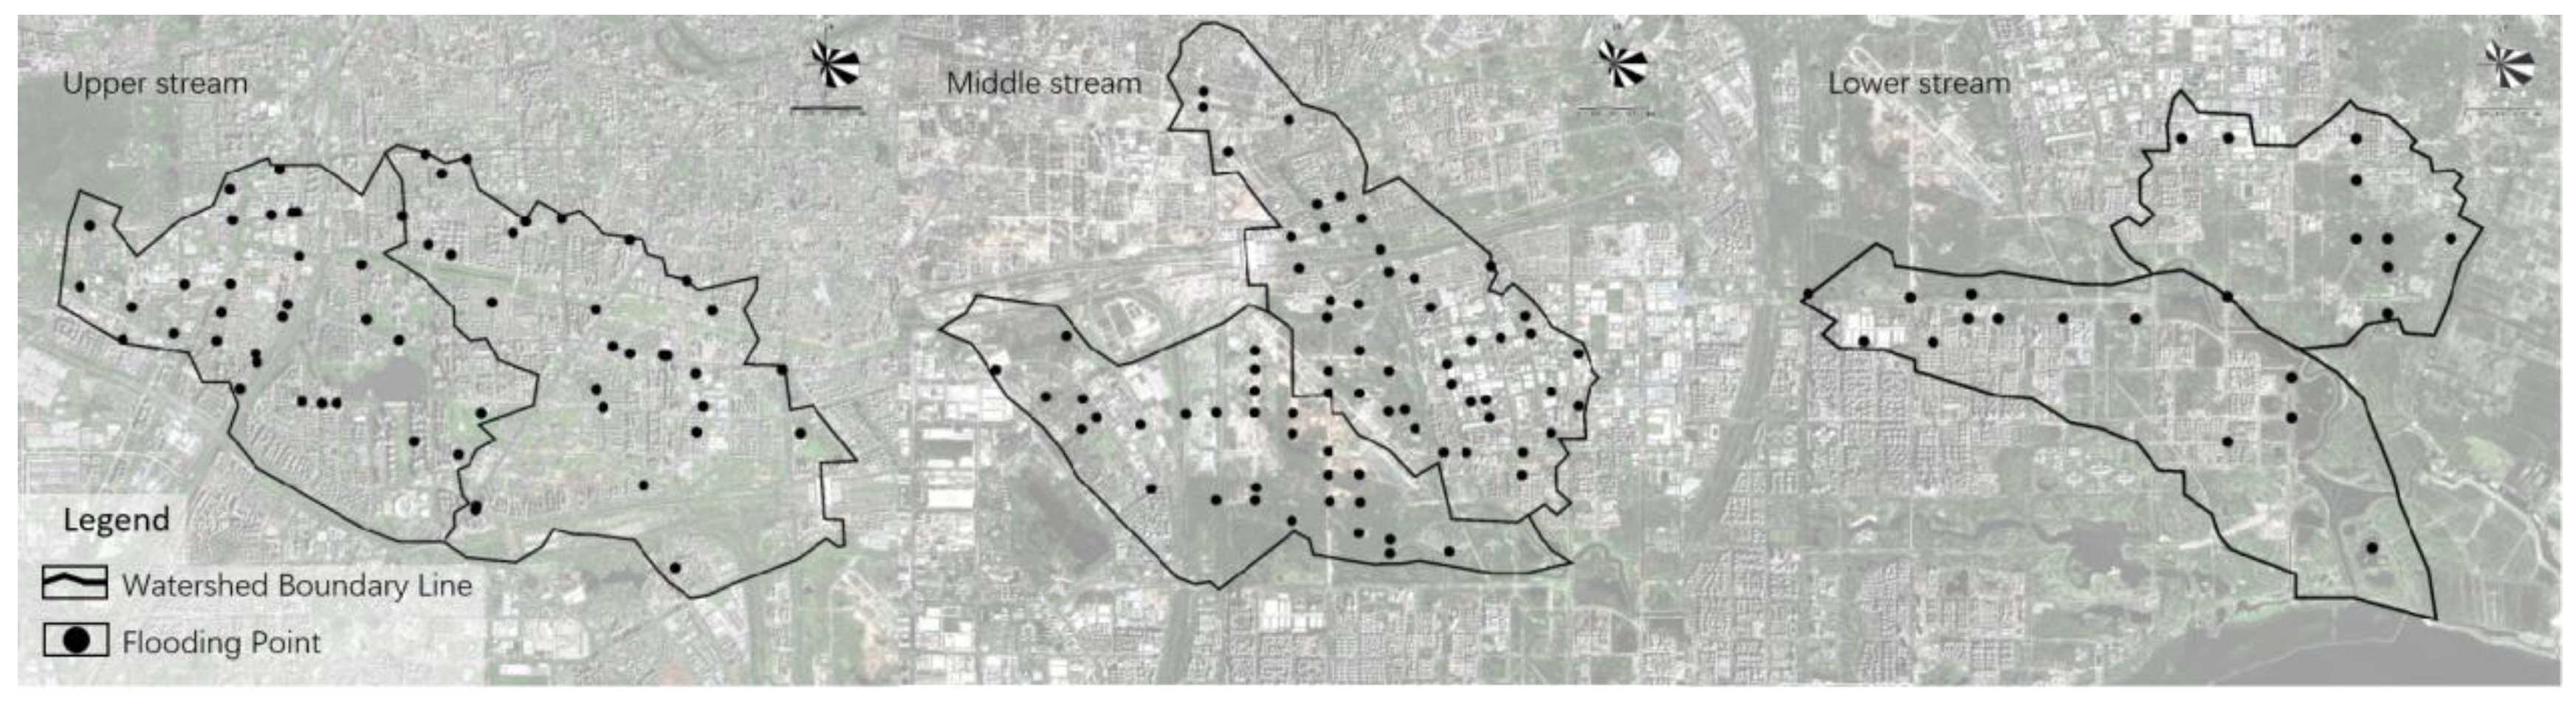
4.2.3. Post-Transformation Scenario
5. Discussion
- (1)
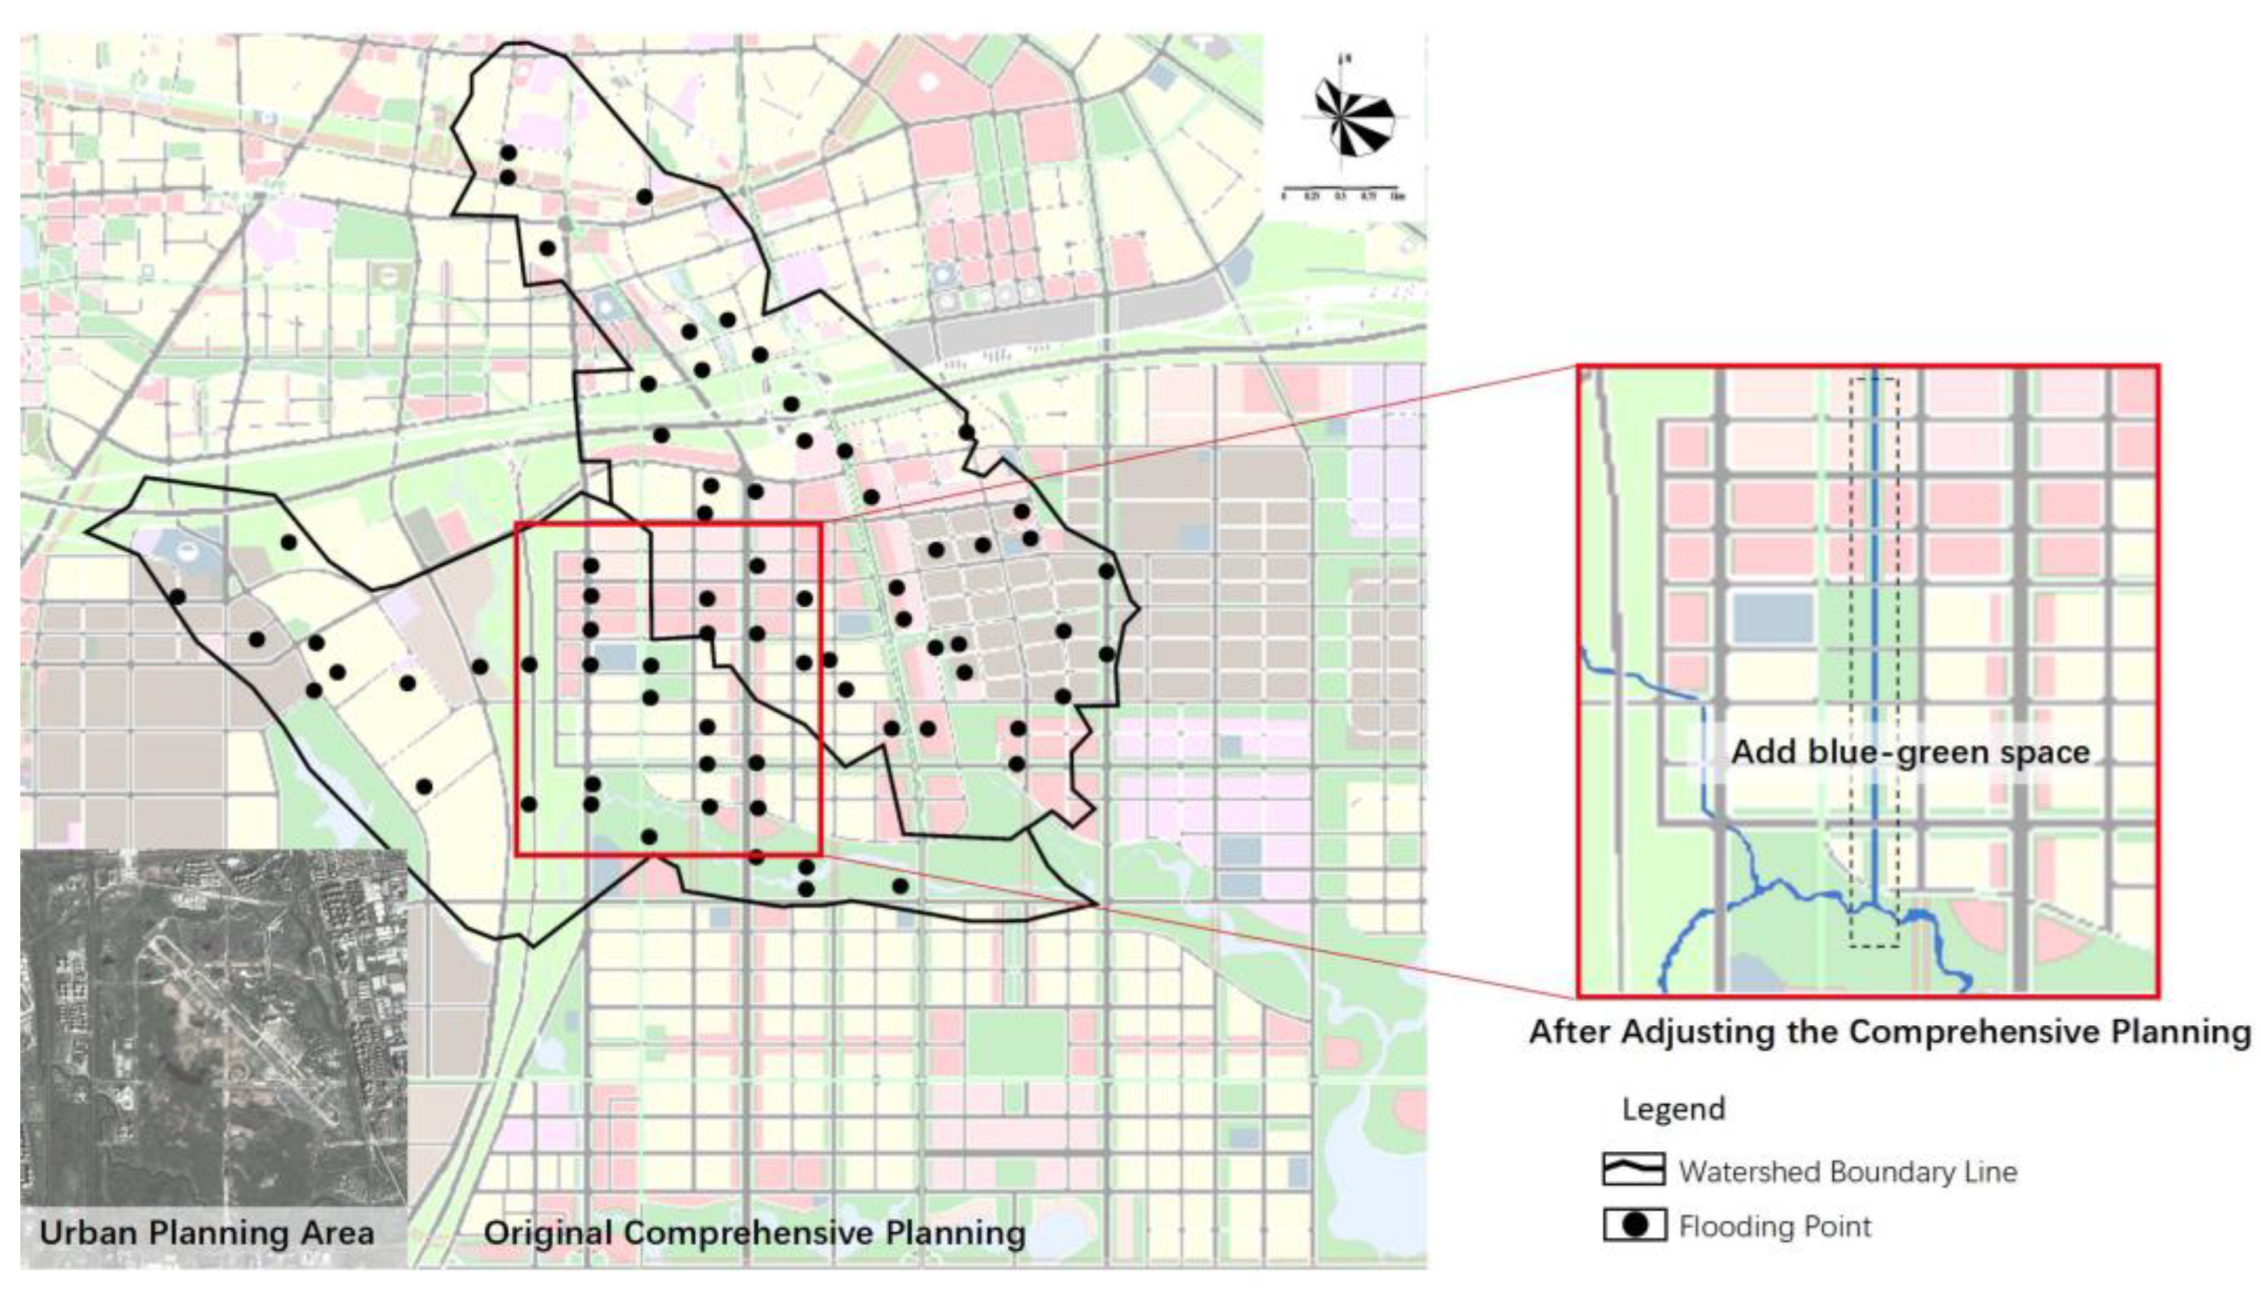
- With SWMM simulating the overflow point along with volume in the study area under the once-in-a-century rainstorm scenario, the blue-green-gray is the demarcated transformation area. There are 109 overflow nodes with overflows exceeding 5 × 10⁴ m3 and 59 overflow nodes with 10 × 104 m3 before the transformation, and in the SWMM simulation, all the overflow nodes vanish in the districts of blue-green transformation planning after the construction; it shows that there are significant reductions in the overflows of the upstream, middle and downstream nodes, and it always means that the ability of the lakeside city to cope with waterlogging could be greatly improved by the transformation. What is more, through setting the downstream ponds and wetlands as the spaces for accommodating the rainwater that cannot be discharged smoothly because of the backwater effects of the lake, the waterlogging risk of the city proper could be diminished and the capacity of the urban drainage system could also be improved. The study only defines the transformation scope but does not set the transformation degree of gray infrastructure.
- (2)
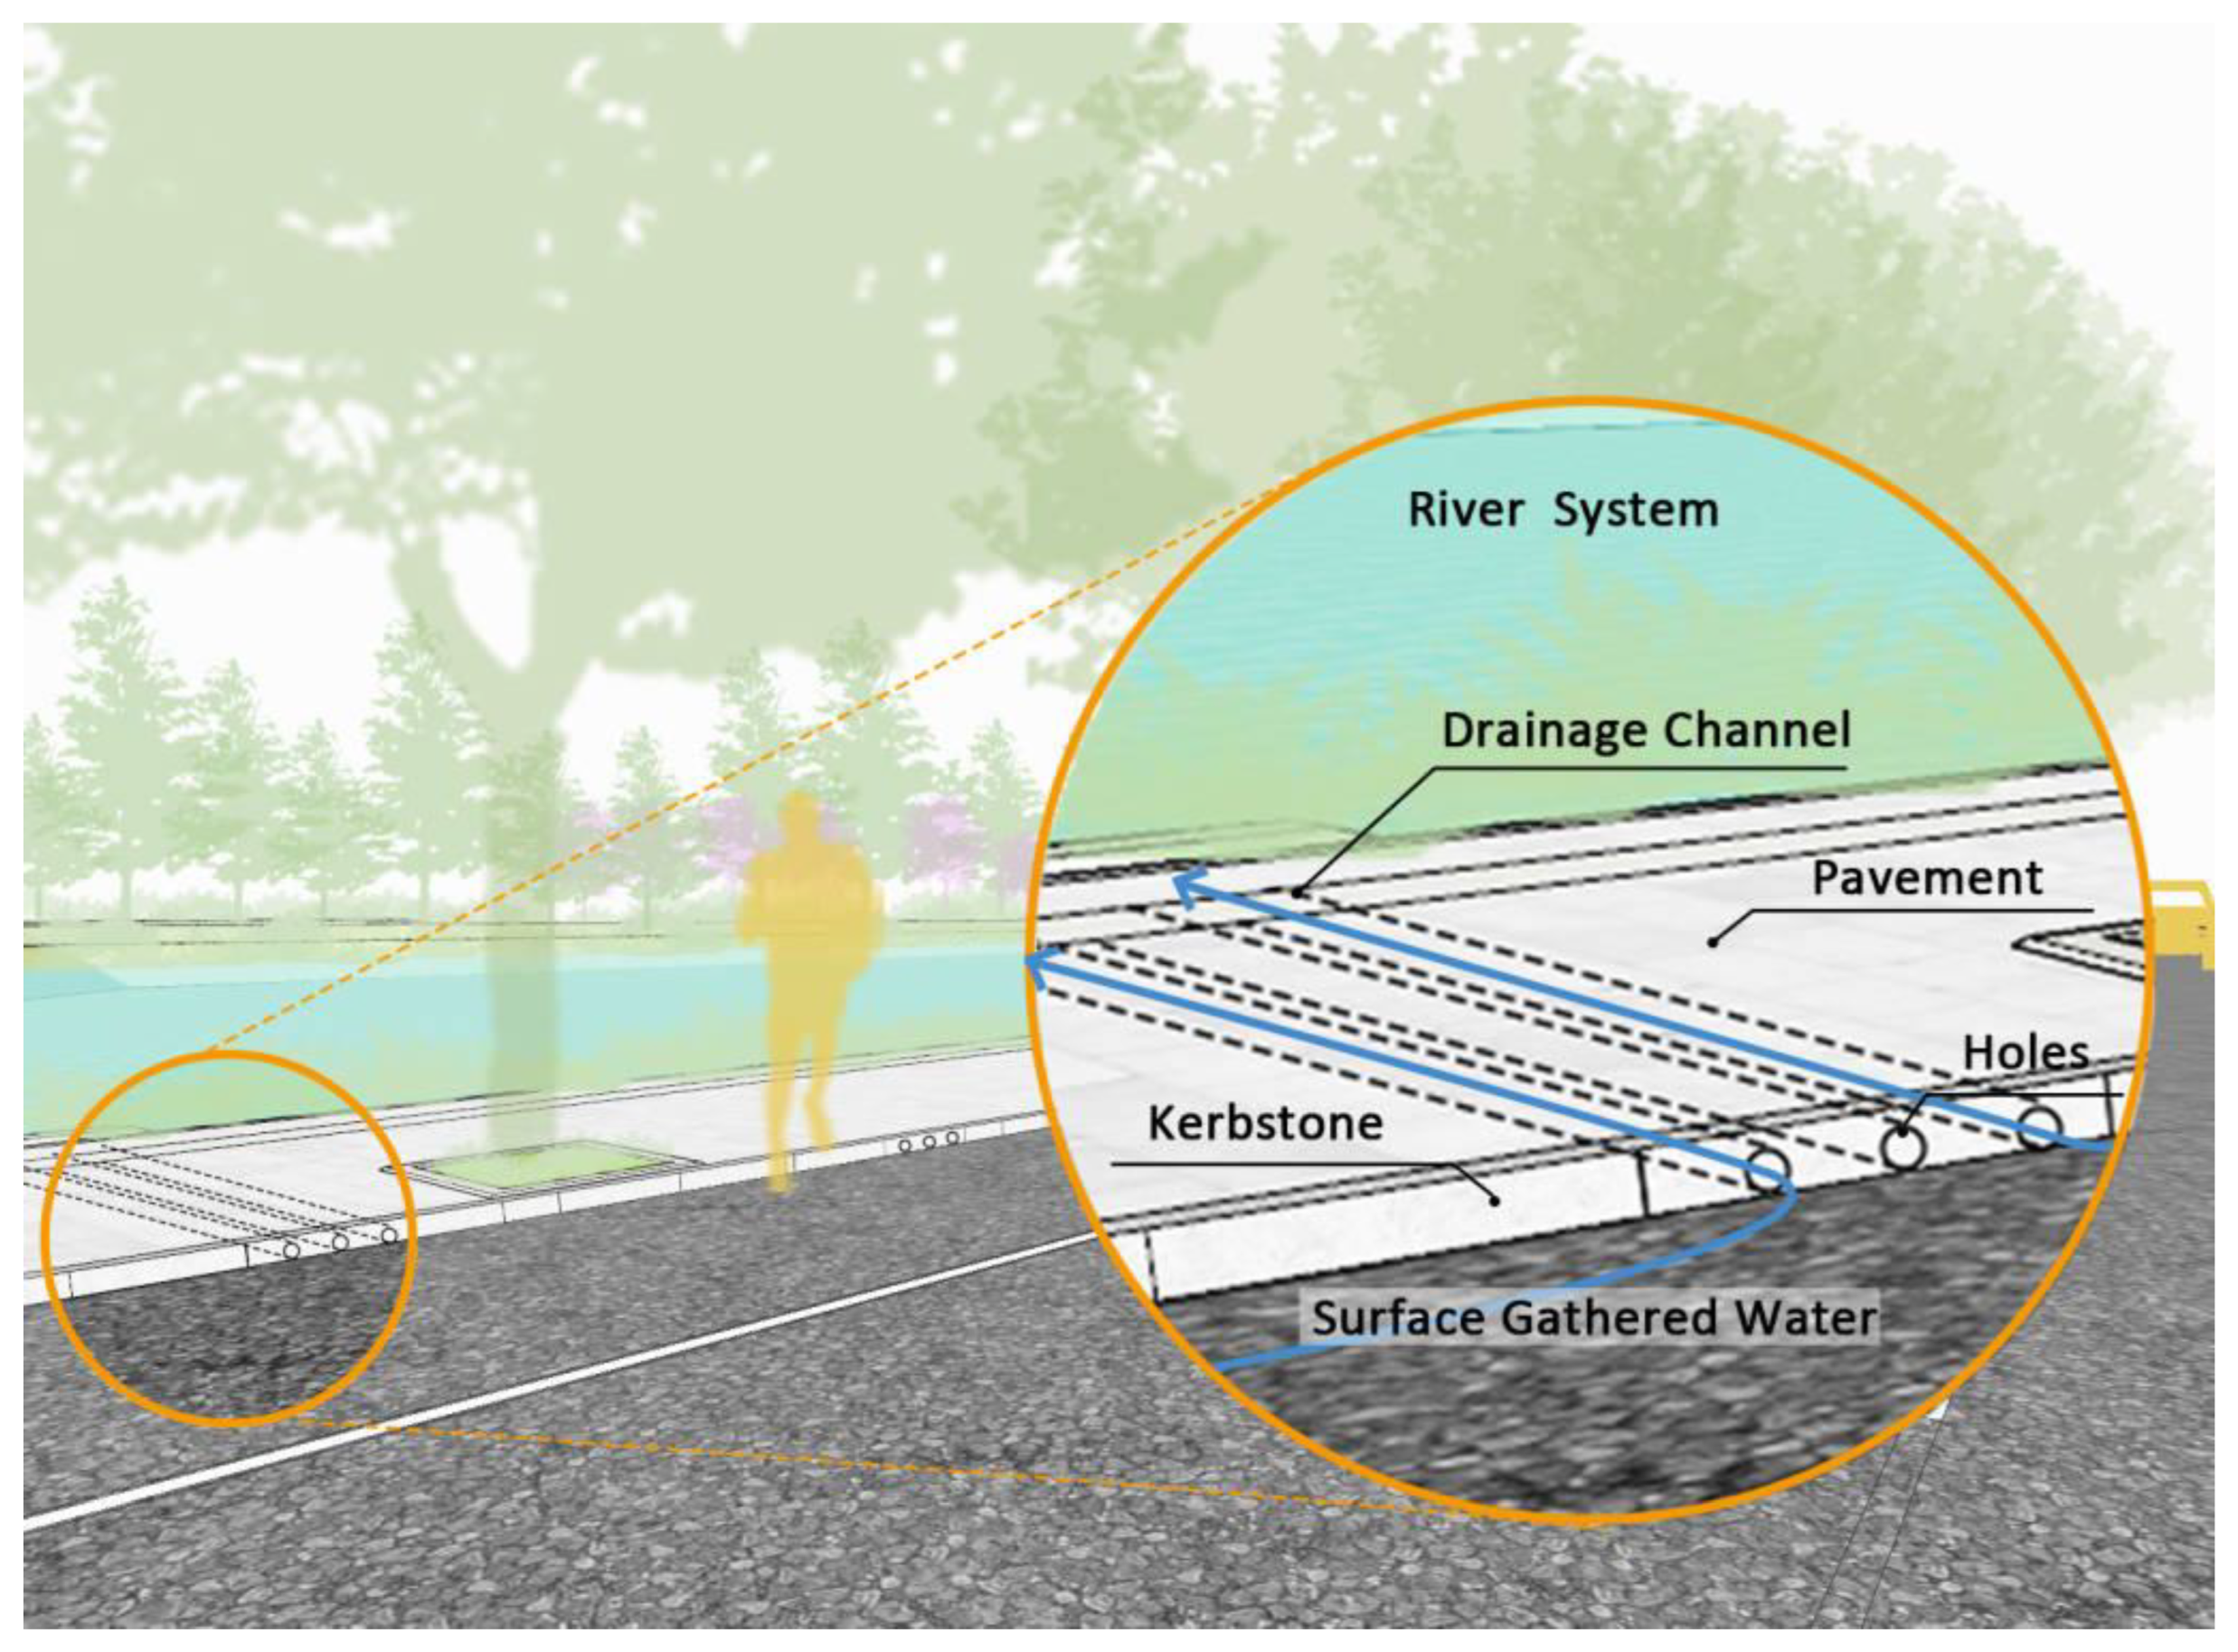
- In this study, the area near the river and lake is directly introduced into the lake by setting blue-green space. If there are roads blocking the area near the river and lake, the road near the river and lake is designed to be the form that rainwater can cross, while the area farther away from the river and lake lacks conditions to make the rainwater in the area overflow from the ground surface into the river and lake. It follows that the rest of the area is planned to be the area dominated by gray infrastructure, such as setting reservoirs or pipe network transformation.
- (3)
- This study failed to consider the problem of water pollution when the overflow rainwater was directly introduced into rivers and lakes through the blue-green space in the area adjacent to rivers and lakes, given that the rainwater with higher pollutants at the initial stage entered the rainwater pipe network, and the overflow rainwater only entered the rivers and lakes. In the extreme rainstorm scenario, the prevention of waterlogging needs more attention than water pollution.
- (4)
- In this study, the blue-green-gray reconstruction area is defined based on the overflow at the overflow point of the pipe network. Usually, the standard reflecting the degree of waterlogging is considered in combination with the overflow and the depth of ponding caused by the terrain at the overflow point. With the terrain of this study area relatively flat, this study directly calculates the overflow.
- (5)
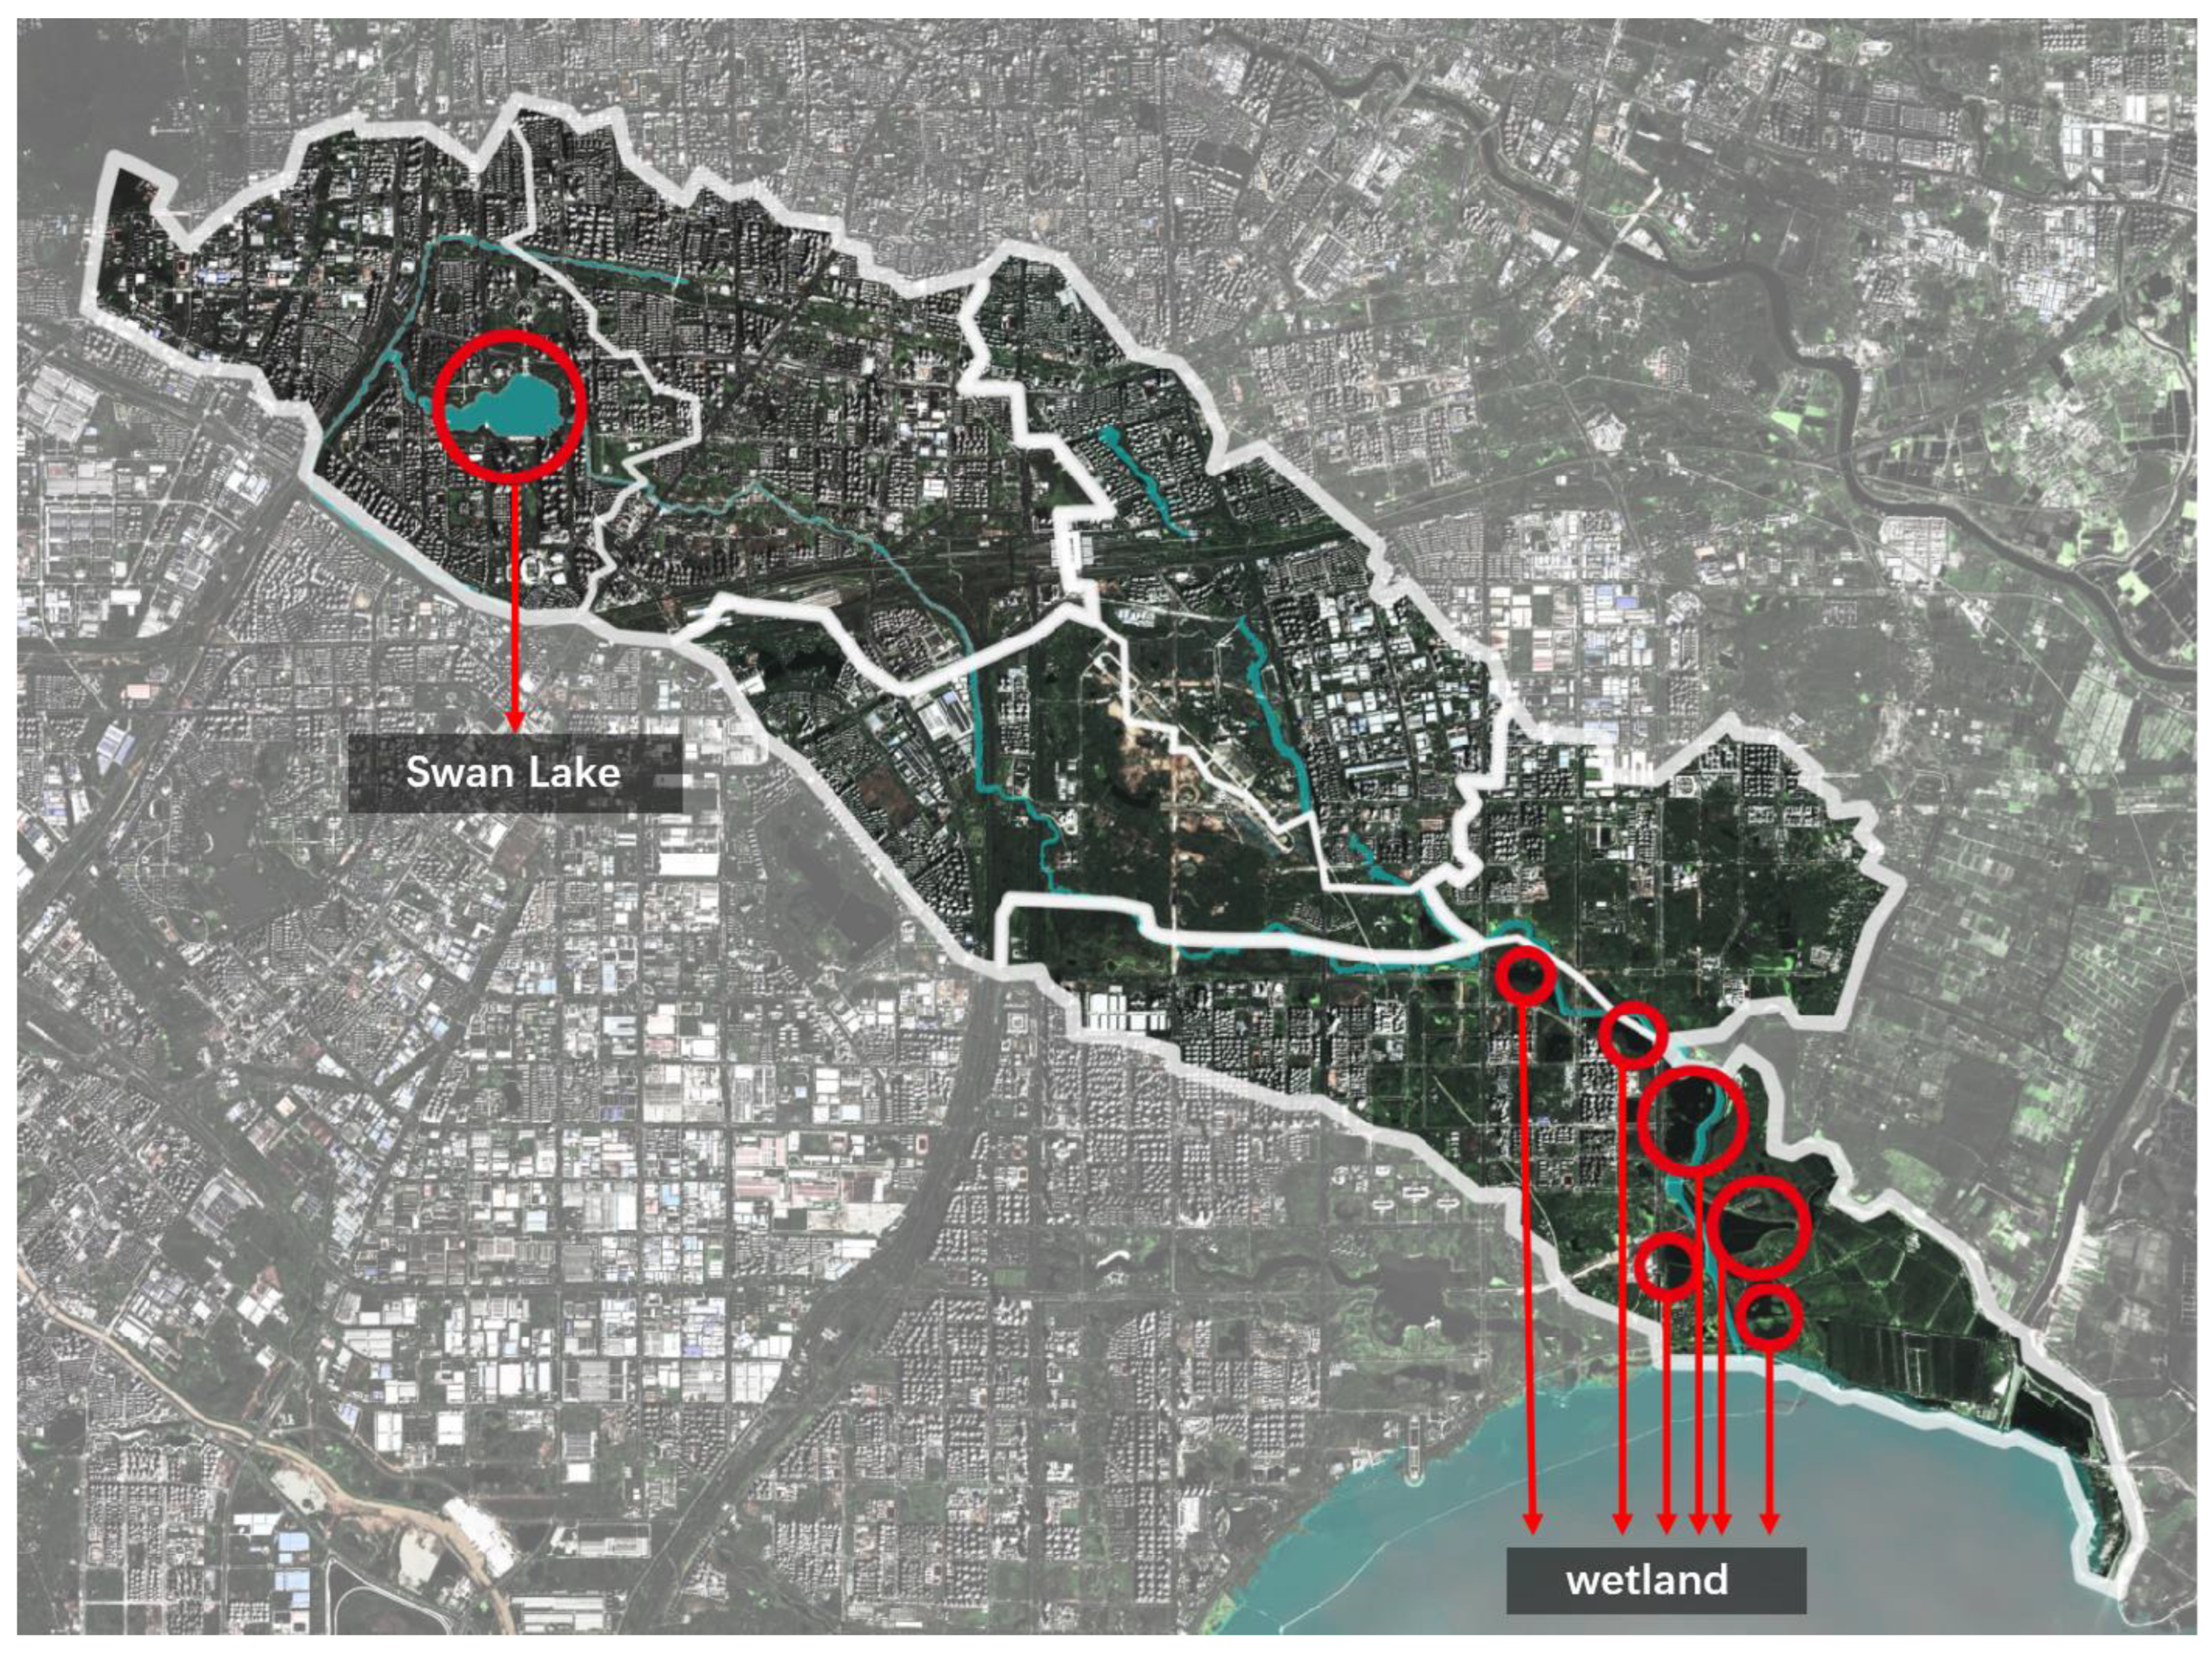
- This study provides a way for urban waterlogging prevention and control according to scenarios. In the case of a hundred-year flood in the basin, Swan Lake and the downstream wetland pond can be used as the regulation and storage pools under the backwater scenario of Chaohu Lake through calculations, but urban managers and Chaohu Lake managers should discharge water in advance to prevent waterlogging.
- (6)
- In this study, we did not select multiple scenarios such as the once-in-10-year or the once-in-50-year but only the once-in-a-century as the standard. As per the historical records, the scenarios that cause serious waterlogging are all once-in-10-years, with the blue-green space set up with the once-in-a-century scenario capable of being used as the drainage and storage space for rainstorms occurring as once-in-10-years or once-in-50-years. In the specific pipe network transformation and reservoir construction, the higher involved engineering transformation costs, as witnessed for the specific corresponding standard year, need to be considered.
- (7)
- In this study, there are built-up areas and unbuilt areas. In built-up areas, renewal planning is adopted. Therefore, the hazard of extreme rainfall shall be dealt with by changing the planning in the unbuilt area.
- (8)
- In the scenario of the backwater effects of the lake, because several rivers flow into Chaohu Lake in the downstream, and Chaohu Lake is also a space for flood storage to secure the important downstream cities during rainstorm times, it means that the water levels of Chaohu Lake are actually manually controlled, and it is difficult to calculate the precise water level simply according to the natural factors such as topography, inflow, etc., and it is also difficult to calculate the volume of the rainwater that cannot be discharged because of the backwater effect. The volume of rainwater that cannot be drained, in this study, is set in keeping with the pump discharge in the study area under extreme annual scenarios.
- (9)
- The storage space for the rainwater that cannot be discharged is accumulated by checking the information of the lake in the upper stream and calculating the space of the ponds and wetlands in the downstream with GIS software, and the method of the storage space could be accumulated accurately. Regardless of whether there is enough area of the upstream lake and downstream wetland pond in this study to store rainwater, on condition that there is not enough space in other areas to cope with the backwater effects of flood, the way to consider it remains to excavate earthwork in the downstream, or set up blue space and water conservancy facilities in the unbuilt area.
- (10)
- SWMM software, in this study, is used to simulate the hydrological conditions in the study area, which can accurately simulate the overflow point, as well as the flow of the urban pipe network, reflecting the waterlogging situation.
- (11)
- The limited data have witnessed unconsidered factors such as sewage interceptors in this study.
6. Conclusions
- (1)
- This study takes the Shiwuli River Basin in Hefei, a lakeside city, as the research object, with a view to providing strategies for eliminating waterlogging in the lakeside city through blue-green-gray infrastructure transformation planning. This study provides the blue-green-gray transformation planning paradigm of the lakeside city under the backwater effects of the downstream Chaohu Lake water along with the co-existence of built and unbuilt areas within the city. The innovation of this study lies in: (1) how to quickly deal with rainwater discharged from the city under the influence of the backwater effects of a lake; (2) how to plan the blue-green-gray facilities in the study area when there exist built-up areas and non-built-up areas.
- (2)
- The previous research on urban blue-green-gray transformation was mostly focused on urban built-up areas; this is not involved in the current research on how to update the blue-green-gray planning in the space where there are built-up areas with space constraints and the unbuilt areas, which is capable of modifying the planning. What is more, it is generally considered that urban rainwater can be discharged into rivers or lakes smoothly, but there is very little consideration is for the links between city and watershed. This study is for the limitation.
- (3)
- In this study, the urban land planning along with drainage pipe network planning in the urban planning period are taken as the research object, with the blue-green-gray transformation capable of effectively dealing with the waterlogging disaster that may be brought on by extreme rainfall in the future. SWMM hydrological software, in this study, can clearly and accurately simulate the hydrological process and waterlogging scenarios prior to and following the blue-green-gray transformation in the study area, being capable of clearly expressing the effect comparison before and after the transformation. The water quantity that can be stored in lakes and downstream wetlands in the basin can be accurately calculated by using historical data and GIS software.
- (4)
- The research path of this study is divided into scenario analysis, which is divided into an urban pipe network capable of a smoothly discharged rainwater scenario and the backwater effects of river and lake scenario. In the scenario where the rainwater can be discharged smoothly from the urban pipe network and the built-up area, the urban blocks near the river and lake represent mainly blue-green dredging, while in the non-riverside lake blocks, the gray infrastructure reconstruction remains mainly used. In the areas to be built, the blue-green space location can be mainly used by modifying the planning through which capital investment and construction quantities can be reduced in the high-density construction cities, with a good hydrological transformation effect to be achieved. In the backwater scenario, the water storage of lakes and wetlands in the study area in combination with artificial pre-drainage can resist the backwater effects of rivers and lakes.
- (5)
- It can clearly show how the city plans and transforms blue-green infrastructure in different scenarios and sites with different construction conditions by comparing different scenarios.
- (6)
- This study provides a solution to urban flooding in lakefront cities, which can be extended to other lakefront cities and also to riverine cities where top support exists.
- (7)
- However, this paradigm also has its own limitations, which lie in that there happens to be lakes and wetlands that can bear excessive rainfall and do not encroach on the area during the initial urban planning in the study area. However, on the condition that there exist no natural conditions in this study in other lakeside cities, it is necessary to use GIS terrain analysis technology to analyze whether the drainage basin can bear excessive rainfall.
- (8)
- Another limitation of this study is the use of the historical pump pumping capacity as the calculation model. In the calculation, more accurate methods can be used to generalize the river and lake setting scenarios to calculate the water volume that cannot be discharged because of the backwater effects.
Author Contributions
Funding
Institutional Review Board Statement
Informed Consent Statement
Data Availability Statement
Conflicts of Interest
References
- Cristiano, E.; Farris, S.; Deidda, R.; Viola, F. Comparison of blue-green solutions for urban flood mitigation: A multi-city large-scale analysis. PLoS ONE 2021, 16, e0246429. [Google Scholar] [CrossRef] [PubMed]
- Wang, Y.; Liu, Z.; Wang, G.; Xue, W. Cellular automata based framework for evaluating mitigation strategies of sponge city. Sci. Total Environ. 2021, 796, 148991. [Google Scholar] [CrossRef] [PubMed]
- Sun, Z.; Zhou, X.; Fan, J.; Xiong, H.; Tan, G. Stage discharge rating method considering backwater effect in river channel. Adv. Water Sci. 2021, 32, 259–270. (In Chinese) [Google Scholar]
- Castelltort, F.X.; Bladé, E.; Balasch, J.C.; Ribé, M. The backwater effect as a tool to assess formative long-term flood regimes. Quatern. Int. 2020, 538, 29–43. [Google Scholar] [CrossRef]
- Hu, C.; Xia, J.; She, D.; Song, Z.H.; Zhang, Y.; Hong, S. A new urban hydrological model considering various land covers for flood simulation. J. Hydrol. 2021, 603, 126833. [Google Scholar] [CrossRef]
- Chen, W.; Wang, W.; Huang, G.; Wang, Z.; Lai, C.; Yang, Z. The Capacity of Grey Infrastructure in Urban Flood Management: A Comprehensive Analysis of Grey Infrastructure and the Green-Grey Approach. Int. J. Disaster Risk Reduct. 2021, 54, 102045. [Google Scholar] [CrossRef]
- Wilbers, G.J.; Bruin, K.D.; Lekkerkerk, W.; Li, H.; Ballinas, B.P. Investing in Urban Blue-Green Infrastructure-Assessing the Costs and Benefits of Stormwater Management in a Peri-Urban Catchment in Oslo, Norway. Sustainability 2022, 14, 1934. [Google Scholar] [CrossRef]
- Pan, Z.; Brouwer, R. A Theoretical Modeling Framework to Support Investment Decisions in Green and Grey Infrastructure under Risk and Uncertainty. J. Forest Econ. 2021, 36, 407–440. [Google Scholar] [CrossRef]
- Kaize, Z.; Shen, J.; Guo, L.; Elizabeth, W.B.; Carlo, R.M.; Lan, P.; Liu, H.; Gao, J.; Fan, B. Flood Drainage Rights in Watersheds Based on the Harmonious Allocation Method. J. Hydrol. 2021, 601, 12667. [Google Scholar]
- Li, J.; Wang, Y.; Ni, Z.; Chen, S.; Xia, B. An integrated strategy to improve the microclimate regulation of green-blue-grey infrastructures in specific urban forms. J. Clean. Prod. 2020, 271, 122555. [Google Scholar] [CrossRef]
- Suligowski, R.; Ciupa, T.; Cudny, W. Quantity assessment of urban green, blue, and grey spaces in Poland. Urban For. Urban Green. 2021, 64, 127276. [Google Scholar] [CrossRef]
- Mzava, P.; Valimba, P.; Nobert, J. Quantitative analysis of the impacts of climate and land-cover changes on urban flood runoffs: A case of Dar es Salaam, Tanzania. J. Water Clim. Chang. 2021, 12, 2835–2853. [Google Scholar] [CrossRef]
- Huang, Q.; Wang, J.; Li, M.; Fei, M.; Dong, J. Modeling the influence of urbanization on urban pluvial flooding: A scenario-based case study in Shanghai, China. Nat. Hazards 2017, 87, 1035–1055. [Google Scholar] [CrossRef]
- Frantzeskaki, N.; Mcphearson, T.; Collier, M.J.; Kendal, D.; Bulkeley, H.; Dumitru, A.; Walsh, C.; Noble, K.; Wyk, E.; Ordóñez, C.; et al. Nature-based solutions for urban climate change adaptation: Linking science, policy, and practice communities for evidence-based decision-making. Bioscience 2019, 69, 455–466. [Google Scholar] [CrossRef] [Green Version]
- Alida, A.; Zoran, V.; Zoran, K.; Arlex, S.; Berry, G. Exploring trade-offs among the multiple benefits of green-blue-grey infrastructure for urban flood mitigation. Sci. Total Environ. 2020, 703, 134980. [Google Scholar]
- Mell, I.C. Green Infrstructure: Concepts and planning. Forum 2008, 8, 69–80. [Google Scholar]
- Deely, J.; Hynes, S.J.; Barquín, J.; Burgess, D.; Finney, G.; Silió, A.; Álvarez, J.; Bailly, D.; Ballé, J. Barrier identification framework for the implementation of blue and green infrastructures. Land Use Policy 2020, 99, 105108. [Google Scholar] [CrossRef]
- Haghighatafshar, S.; Nordlöf, B.; Roldin, M.; Gustafsson, L.G.; Jansen, J.; Jönsson, K. Efficiency of blue-green stormwater retrofits for flood mitigation-conclusions drawn from a case study in Malmö, Sweden. J. Environ. Manag. 2018, 207, 60–69. [Google Scholar] [CrossRef]
- Versini, P.A.; Kotelnikova, N.; Poulhes, A.; Tchiguirinskaia, I.; Schertzer, D.; Leurent, F. A distributed modelling approach to assess the use of Blue and Green Infrastructures to fulfil stormwater management requirements. Landsc. Urban Plan. 2018, 173, 60–63. [Google Scholar] [CrossRef] [Green Version]
- Kabisch, N.; Korn, H.; Stadler, J.; Bonn, A. Nature-Based Solutions to Climate Change Adaptation in Urban Areas; Springer Nature: Cham, Switzerland, 2017; pp. 1–11. [Google Scholar]
- Browder, G.; Ozment, S.; Rehberger Bescos, I.; Gartner, T.; Lange, G. Integrating Green and Gay: Creating Next Generation Infrastructure; World Bank and World Resources Institute: Washington, DC, USA, 2019; pp. 1–140. [Google Scholar]
- Xu, H.; Ma, C.; Xu, K.; Lian, J.; Long, Y. Staged optimization of urban drainage systems considering climate change and hydrological model uncertainty. J. Hydrol. 2020, 587, 124959. [Google Scholar] [CrossRef]
- Fletcher, T.D.; Shuster, W.; Hunt, W.F.; Ashley, R.; Butler, D.; Arthur, S.; Trowsdale, S.; Barraud, S.; Semadeni, A.; Bertrand, J.; et al. SUDS, LID, BMPs, WSUD and more—The evolution and application of terminology surrounding urban drainage. Urban Water J. 2014, 12, 525–542. [Google Scholar] [CrossRef]
- Hu, M.; Wu, W.; Yu, Q.; Wen, Y.; Zhao, F. Spatial-temporal variations in green, blue and gray water footprints of crops: How do socioeconomic drivers influence? Environ. Res. 2022, 17, 124024. [Google Scholar] [CrossRef]
- Lamond, J.; Everett, G. Sustainable Blue-Green Infrastructure: A social practice approach to understanding community preferences and stewardship. Landsc. Urban Plan. 2019, 191, 103639–103649. [Google Scholar] [CrossRef]
- Yu, Y.; Zhang, W.; Fu, P.; Huang, W.; Cao, Y. The Spatial Optimization and Evaluation of the Economic, Ecological, and Social Value of Urban Green Space in Shenzhen. Sustainability 2020, 12, 1844. [Google Scholar] [CrossRef]
- Gu, J.J.; Hu, H.; Wang, L.; Xuan, W.; Cao, Y. Fractional Stochastic Interval Programming for Optimal Low Impact Development Facility Category Selection under Uncertainty. Water Resour. Manag. 2020, 34, 1567–1587. [Google Scholar] [CrossRef]
- Chuang, M.; Chen, T.; Lin, Z. A review of resilient practice based upon flood vulnerability in New Taipei City, Taiwan. Int. J. Disaster Risk Reduct. 2020, 46, 101494. [Google Scholar] [CrossRef]
- Liao, K.H. The socio-ecological practice of building blue-green infrastructure in high-density cities: What does the ABC Waters Program in Singapore tell us? Socio-Ecol. Pract. Res. 2019, 1, 67–81. [Google Scholar] [CrossRef] [Green Version]
- Battemarco, B.P.; Tardin-Coelho, R.; Veról, A.P.; de Sousa, M.M.; da Fontoura, C.V.T.; Figueiredo-Cunha, J.; Barbedo, J.M.R.; Miguez, M.G. Water dynamics and blue-green infrastructure (BGI): Towards risk management and strategic spatial planning guidelines. J. Clean. Prod. 2022, 333, 129993. [Google Scholar] [CrossRef]
- Iftekhar, M.S.; Pannell, D.J. Developing an integrated investment decision-support framework for water-sensitive urban design projects. J. Hydrol. 2022, 607, 127532. [Google Scholar] [CrossRef]
- Sedrez, M.; Xie, J.; Cheshmehzangi, A. Integrating Water Sensitive Design in the Architectural Design Studio in China: Challenges and Outcomes. Sustainability 2021, 13, 4853. [Google Scholar] [CrossRef]
- Jato-Espino, D.; Toro-Huertas, E.I.; Güereca, L.P. Lifecycle sustainability assessment for the comparison of traditional and sustainable drainage systems. Sci. Total Environ. 2022, 817, 152959. [Google Scholar] [CrossRef] [PubMed]
- Gu, J.J.; Cao, Y.; Wu, M.; Song, M.; Wang, L. A Novel Method for Watershed Best Management Practices Spatial Optimal Layout under Uncertainty. Sustainability 2022, 14, 13088. [Google Scholar] [CrossRef]
- Quichimbo-Miguitama, P. Influence of Low-Impact Development in Flood Control: A Case Study of the Febres Cordero Stormwater System of Guayaquil (Ecuador). Sustainability 2022, 14, 7109. [Google Scholar] [CrossRef]
- Meredith, H.; Frederick, C.; Joseph, C.; Theodore, S.; Barbara, D.; Jack, J.; Daniel, L.; Michelle, L.; Bryan, E.; Thomas, P. Determining the costs, revenues, and cost-share payments for the “floodwise” program: Nature-based solutions to mitigate flooding in eastern, rural North Carolina. Nat.-Based Solut. 2022, 2, 100016. [Google Scholar]
- Zheng, Z.; Duan, X.; Lu, S. The application research of rainwater wetland based on the Sponge City. Sci. Total Environ. 2021, 771, 144475. [Google Scholar] [CrossRef]
- Suthirat, K.; Athit, P.; Patchapun, R.; Katja, B.; James, L.; Rob, M. AHP-GIS analysis for flood hazard assessment of the communities nearby the world heritage site on Ayutthaya Island, Thailand. Int. J. Disaster Risk Reduct. 2020, 48, 101612. [Google Scholar]
- Yang, Y.; Li, J.; Huang, Q.; Xia, J.; Liu, D.; Tan, Q. Performance assessment of sponge city infrastructure on stormwater outflows using isochrone and SWMM models. J. Hydrol. 2021, 597, 126151. [Google Scholar] [CrossRef]
- Zhang, C.; Wang, L.; Zhu, H.; Tang, H. Integrated hydrodynamic model for simulation of river-lake-sluice interactions. Appl. Math. Model. 2020, 83, 90–106. [Google Scholar] [CrossRef]
- Pyatkova, K.; Chen, A.S.; Butler, D.; Vojinovi, Z.; Djordjevi, S. Assessing the knock-on effects of flooding on road transportation. J. Environ. Manag. 2019, 244, 48–60. [Google Scholar] [CrossRef]
- Panagiotis-Stavros, C.A.; Evangelia, E.G. Urban Sustainability at Risk Due to Soil Pollution by Heavy Metals—Case Study: Volos, Greece. Land 2022, 11, 1016. [Google Scholar]
- Roy, S.; Bose, A.; Singha, N.; Basak, D.; Chowdhury, I.R. Urban waterlogging risk as an undervalued environmental challenge: An Integrated MCDA-GIS based modeling approach. Environ. Chall. 2021, 4, 100194. [Google Scholar] [CrossRef]


| Data Category | Data Category Name | Data Attribute | Data Source | |
|---|---|---|---|---|
| Spatial data | Topographic data | DEM | ASTER GDEM 30M | |
| Sub-catchment area | Calculation | |||
| Average slope | GIS | |||
| Pipe data | Node type, top and bottom elevation of nodes | Hefei drainage planning | ||
| Pipe type, pipe elevation (start and end point), pipe radius, pipe length, pipe texture | ||||
| Attribute data | Land-use data | Land-use type, range and area | Hefei master planning | |
| Soil data | Hefei land-use map | |||
| Runoff coefficient | Urban drainage design manual | |||
| Meteorological data | Storm frequency and duration | Scene simulation | ||
| Rainfall intensity | KC method | |||
| Model-related data | Deterministic parameters | Width | Sub-catchment area/the longest path of water spreading | |
| Imperv | Weighted average calculation for different land use runoff coefficient | |||
| Probabilistic parameters | N-Imperv | SWMM operation manual | ||
| N-Perv | SWMM operation manual | |||
| Dstore-Imperv | According to the surface condition, soil type and suggested scope of SWMM manual | |||
| Dstore-Perv | ||||
| Zero-Imperv | Empirical value (25%) | |||
| Infiltration Data (HORTON) | Max.Infil.Rate | According to the soil type and suggested scope of SWMM manual | ||
| Min.Infil.Rate | ||||
| Decay Constant | ||||
| Drying Time | ||||
| Roughness | According to the field research and suggested scope of SWMM manual | |||
| Flow Routing Continuity | Basin | Upper Stream | Middle Stream | Lower Stream |
|---|---|---|---|---|
| Wet-weather inflow | 842.11 | 301.15 | 301.52 | 239.44 |
| External outflow | 355.44 | 98.20 | 98.10 | 159.14 |
| Flooding loss | 477.14 | 189.63 | 204.45 | 83.06 |
| Final stored volume | 13.63 | 13.32 | 0 | 0.31 |
| Upper Stream | Middle Stream | Lower Stream | |
|---|---|---|---|
| The reduced overflow | 92.27 | 74.85 | 39.29 |
Disclaimer/Publisher’s Note: The statements, opinions and data contained in all publications are solely those of the individual author(s) and contributor(s) and not of MDPI and/or the editor(s). MDPI and/or the editor(s) disclaim responsibility for any injury to people or property resulting from any ideas, methods, instructions or products referred to in the content. |
© 2023 by the authors. Licensee MDPI, Basel, Switzerland. This article is an open access article distributed under the terms and conditions of the Creative Commons Attribution (CC BY) license (https://creativecommons.org/licenses/by/4.0/).
Share and Cite
Jinjin, G.; Xiaoqian, L.; Buyun, F.; Qiang, H.; Yuan, C. Study on Planning and Design of Blue-Green-Gray Transformation of Lakeside Cities to Deal with the Complex Urban Waterlogging Caused by Extreme Rainstorm. Land 2023, 12, 289. https://doi.org/10.3390/land12020289
Jinjin G, Xiaoqian L, Buyun F, Qiang H, Yuan C. Study on Planning and Design of Blue-Green-Gray Transformation of Lakeside Cities to Deal with the Complex Urban Waterlogging Caused by Extreme Rainstorm. Land. 2023; 12(2):289. https://doi.org/10.3390/land12020289
Chicago/Turabian StyleJinjin, Gu, Lyu Xiaoqian, Fang Buyun, Hui Qiang, and Cao Yuan. 2023. "Study on Planning and Design of Blue-Green-Gray Transformation of Lakeside Cities to Deal with the Complex Urban Waterlogging Caused by Extreme Rainstorm" Land 12, no. 2: 289. https://doi.org/10.3390/land12020289