Article

Wildfire Risk Assessment for Strategic Forest Management in the Southern United States: A Bayesian Network Modeling Approach

1
Southern Research Station, USDA Forest Service, 200 WT Weaver Blvd, Asheville, NC 28804, USA
2
Southern Research Station, USDA Forest Service, 4700 Old Kington Pike, Knoxville, TN 37919, USA
*
Author to whom correspondence should be addressed.
Land 2023, 12(12), 2172; https://doi.org/10.3390/land12122172
Submission received: 13 October 2023 / Revised: 10 December 2023 / Accepted: 13 December 2023 / Published: 16 December 2023
(This article belongs to the Special Issue Decision Support Tools for Land Management)

Abstract

:
Wildfire occurrences have increased and are projected to continue increasing globally. Strategic, evidence-based planning with diverse stakeholders, making use of diverse ecological and social data, is crucial for confronting and mitigating the associated risks. Prescribed fire, when planned and executed carefully, is a key management tool in this effort. Assessing where prescribed fire can be a particularly effective forest management tool can help prioritize efforts, reduce wildfire risk, and support fire-resilient lands and communities. We collaborated with expert stakeholders to develop a Bayesian network model that integrated a large variety of biophysical, socioecological, and socioeconomic spatial information for the Southeastern United States to quantify where risk is high and where prescribed fire would be efficient in mitigating risk. The model first estimated wildfire risk based on landscape-scale interactions among the likelihoods of fire occurrence and severity and the people and resources potentially exposed—accounting for socioeconomic vulnerabilities as well as key ecosystem services. The model then quantified the potential for risk reduction through prescribed fire, given the existing fuel load, climate, and other landscape conditions. The resulting expected risk estimates show high risk concentrated in the coastal plain and interior highland subregions of the Southern US, but there was considerable variation among risks to different ecosystem services and populations, including potential exposure to smoke emissions. The capacity to reduce risk through fuel reductions was spatially correlated with risk; where these diverged, the difference was largely explained by fuel load. We suggest that both risk and the capacity for risk reduction are important in identifying priorities for management interventions. The model serves as a decision support tool for stakeholders to coordinate large-landscape adaptive management initiatives in the Southern US. The model is flexible with regard to both empirical and expert-driven parameterizations and can be updated as new knowledge and data emerge. The resulting spatial information can help connect active management options to forest management goals and make management more efficient through targeted investments in priority landscapes.

1. Introduction

The nature of fire and its impacts in forest landscapes have undergone change during recent decades due to multiple interacting factors, including the accumulation of fuels from decades of fire suppression, a changing climate with more drought and rising temperatures, and rapid population growth along the wildland urban interface (WUI) [1,2,3]. Fire is an intrinsic part of most forest landscapes and is important for maintaining ecological diversity and function [4], but wildfires also pose increasing threats to people and resources and can be socially and economically catastrophic. Wildfires cause human fatalities, impose health and safety risks from smoke exposure, damage structures and property, and disrupt economic activities [5]. Wildfire also carries negative consequences for some forest ecosystem services. Increased runoff and erosion from severely burned areas can affect the quality and quantity of water supplies from forest land. Wildfires also release carbon stored in forest biomass to the atmosphere, contributing to greenhouse gas concentrations.
Strategic, evidence-based planning with diverse stakeholders will be crucial for confronting the ongoing wildfire crisis [2]. Managing wildfire risk is highly complex and subject to uncertainties, requiring information on where fires are likely to occur, the intensity at which they might occur, and the impacts they may have on vulnerable people and resources, at a minimum [6]. Quantitative wildfire risk assessments provide an integrated picture of the various social and ecological landscape conditions that influence the potential for hazardous fires and the possible social and ecological consequences if one occurs [7,8,9,10]. They support strategic planning for risk reduction by providing information, even when strong uncertainties exist, about where management interventions are most needed and what their likely outcomes would be [11].
Scenario-based risk assessment can be used to evaluate how wildfire risk may change in response to alternative management scenarios. This approach can serve as an important decision support tool for implementing cost-effective risk mitigation measures, such as planning for prescribed fire management decisions under uncertainty [11]. Prescribed fires are controlled applications of fire used to reduce woody and herbaceous fuels and suppress the potential for wildfires with far greater hazard potential. Prescribed fire is now widely used as a management tool to achieve the social, economic, and ecological benefits of fire while reducing the risks associated with uncontrolled wildfires [12,13,14,15]. Wildfires that burn in areas where prescribed fire has been used to suppress fuels can have lower intensities and extents, cause less damage, and be easier to control [16,17,18,19]. In WUI landscapes, prescribed fire can provide a buffer against wildfires and help create open spaces that allow for increased flexibility in wildfire management [18,20]. Assessing landscape conditions to understand where prescribed fire can be a particularly effective forest management tool can aid strategic planning to manage risk and support fire-resilient lands and communities.
Bayesian network (BN) models are used for problem solving in a wide range of disciplines, including natural resource management and policy, particularly where the focus is on the interface between science and management [21,22]. BN models have been used in wildfire management research, including efforts to model wildfire behavior and its drivers, the response of vegetation to fire, and the impacts of wildfires on people and ecological resources [23,24,25,26,27]. A BN model is a graphical structure that defines causal probabilistic relationships among variables within a system [28]. The use of BNs as a modeling tool in resource management decision making has been important for (i) integrating information about a system through combinations of empirical data and expert knowledge, (ii) graphically representing complex relationships and decision problems, (iii) addressing uncertainties in a structured way, (iv) allowing for the flexibility to adjust to new/missing data, and (v) fostering communication with a variety of audiences or project participants, including both expert and non-expert stakeholders [21,29,30].
These qualities make BN models ideal for risk analyses in complex environmental systems such as wildfires. Their capacity to quantify the possible outcomes of different management decisions probabilistically provides a robust way to assess options for risk reduction such as the application of prescribed fire and other fuel reduction methods. To date, BN models have rarely addressed spatial variability in the multiple socioeconomic and biophysical characteristics that influence wildfire risk [25]. Spatial information is crucial to inform risk management efforts, including targeting landscapes where enhanced active management investments are most needed and can be most effective [31,32]. Addressing the spatial dimension in a BN modeling framework can integrate the assessment of both where to focus active management and why from a data-driven, socioecological perspective.
We collaborated with regional fire management experts to develop a BN model that integrated spatial data to estimate wildfire risk for forests across the Southeastern United States and evaluate the role that prescribed fire can play in managing risk. The Southeastern US serves as a model region for the widespread use of prescribed fire to manage wildfire risks and forest ecological conditions [14,33]. Enhanced investments in risk management, including active management to reduce fuels in forest landscapes, will be required to confront growing risks. In particular, it is likely that the importance of prescribed fire for building resilience to wildfire will only increase, even as a changing climate and growing populations present increasing constraints on its use [3].
The main objective of this study was to produce spatial information to inform where management interventions, such as prescribed fire to reduce fuel loads, can most efficiently reduce risks associated with wildfire. Our model is tailored for analyses at large landscape scales to aid regional planning, recognizing that at more local scales, additional considerations not accounted for in our model are required for effective ecosystem management. In this sense, the model serves as a decision support tool for stakeholders to understand regional variability and coordinate large-landscape initiatives. We expect that the model will be updated as new social and ecological data inputs become available, as understandings of the drivers of risk and the impacts of management responses are advanced, and as landscape conditions change over time.

2. Materials and Methods
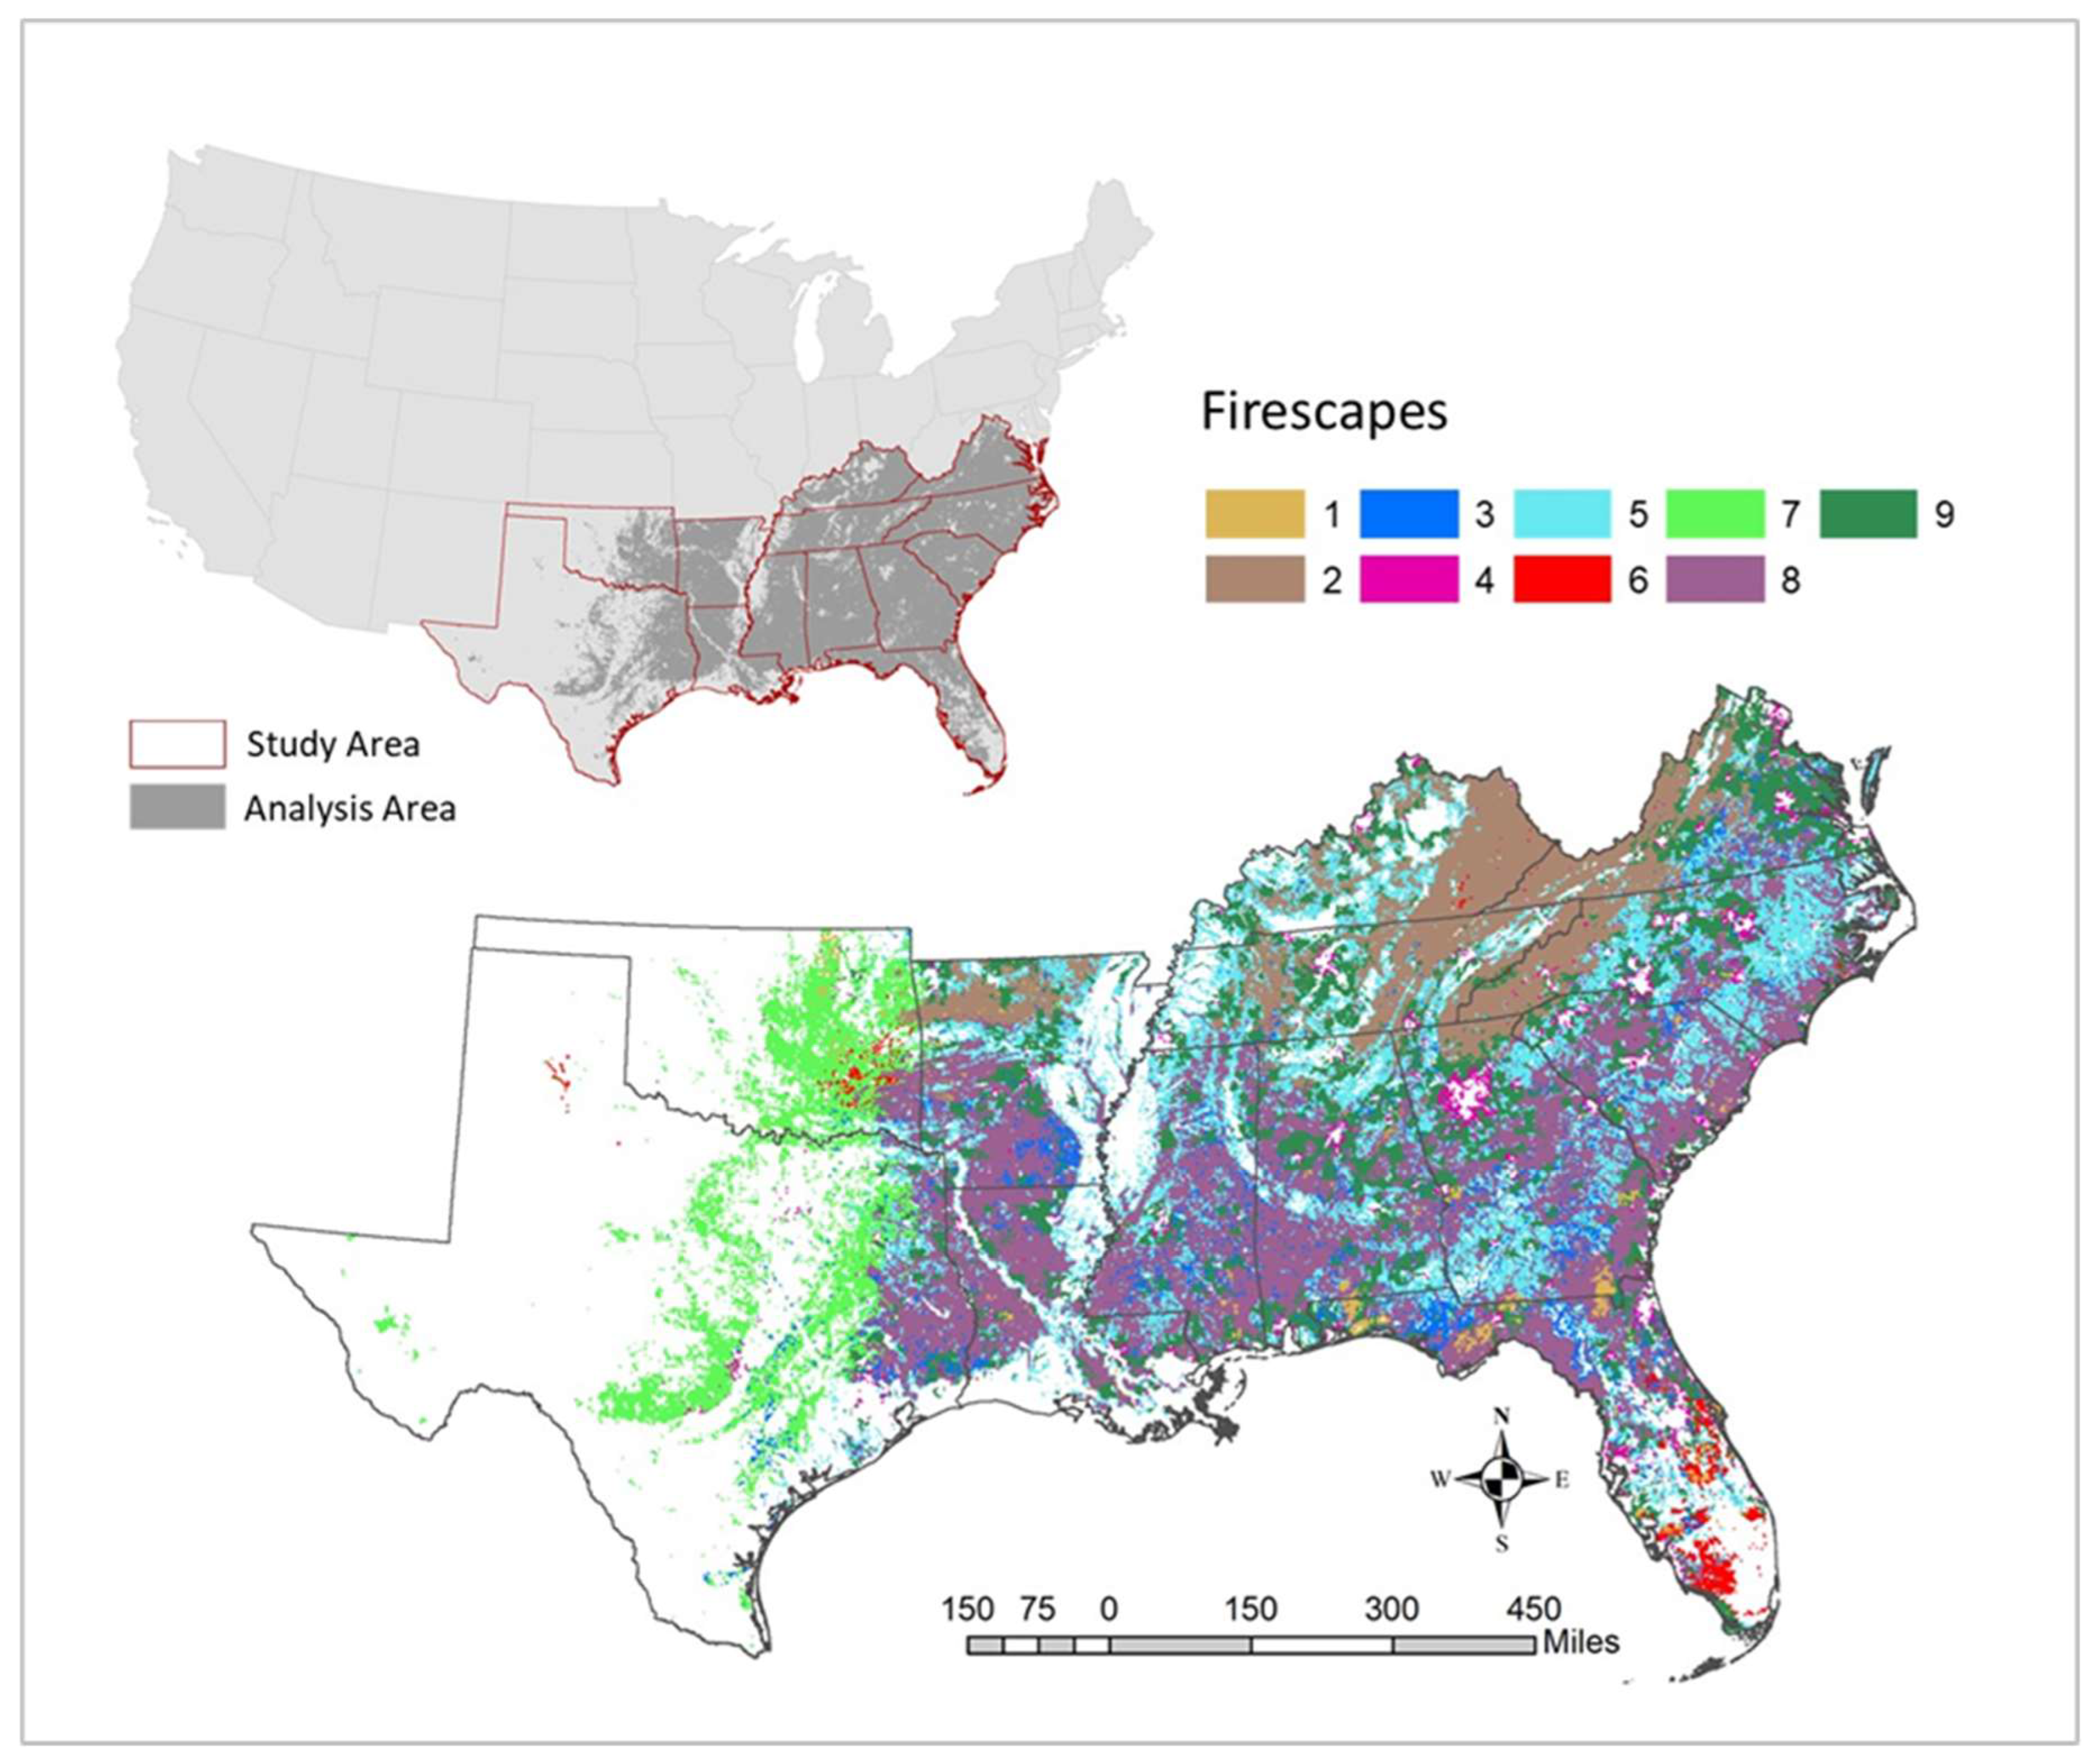
Figure 1 shows the conceptual model for this study. It consists of three major components: (i) expert elicitation; (ii) model development; and (iii) spatial application. Expert elicitation facilitated data aggregation and synthesis, model building, and an analysis plan for wildfire risk assessment. Working with expert participants, we developed a BN model structure to provide probabilistic estimates of risk, based primarily on the mental models of experts and literature review. We then fed the model spatial data, quantifying variables in the resulting model, and generated probabilistic spatial outputs for all landscapes in the study area. Experts provided feedback on the plausibility of the model’s parameterizations and provisional spatial outputs at multiple stages of the model’s development [34].

2.1. Study Area

The study area included the thirteen states in the Southern United States that comprise the Southern Region administrative unit of the USDA Forest Service (Figure 2). We limited our analysis to landscapes in the region with at least 25% forest cover. Forests in this region are among the most productive and biologically diverse in North America, providing a wide range of ecosystem services. Broadly speaking, the region’s forests are fire-adapted, and fire is an important driver of overall forest health. Contemporary fire regimes are governed primarily by management decisions, and prescribed fire is widely used to manage forest ecosystems, with 8 to 10 million acres burned annually [35,36]. Significant damages from wildfires nonetheless occur every year, and changes in climate and landscapes are heightening wildfire threats.
In a separate study, we classified the same landscapes evaluated in this study into distinct firescape classes [37]. Firescapes are landscape types defined by unique social and ecological characteristics, which, taken together, are important for understanding how fire and its associated risks operate as a human–environment system [38,39]. As such, firescapes provide a broad-scale context for considering risk and appropriate risk management strategies in different landscapes. We did not use the firescape classification directly in the present risk analysis, but to further characterize the firescapes and describe the geography of risk in the region, we summarize our spatial results for the firescapes. A brief description of each firescape class is presented in Table 1.

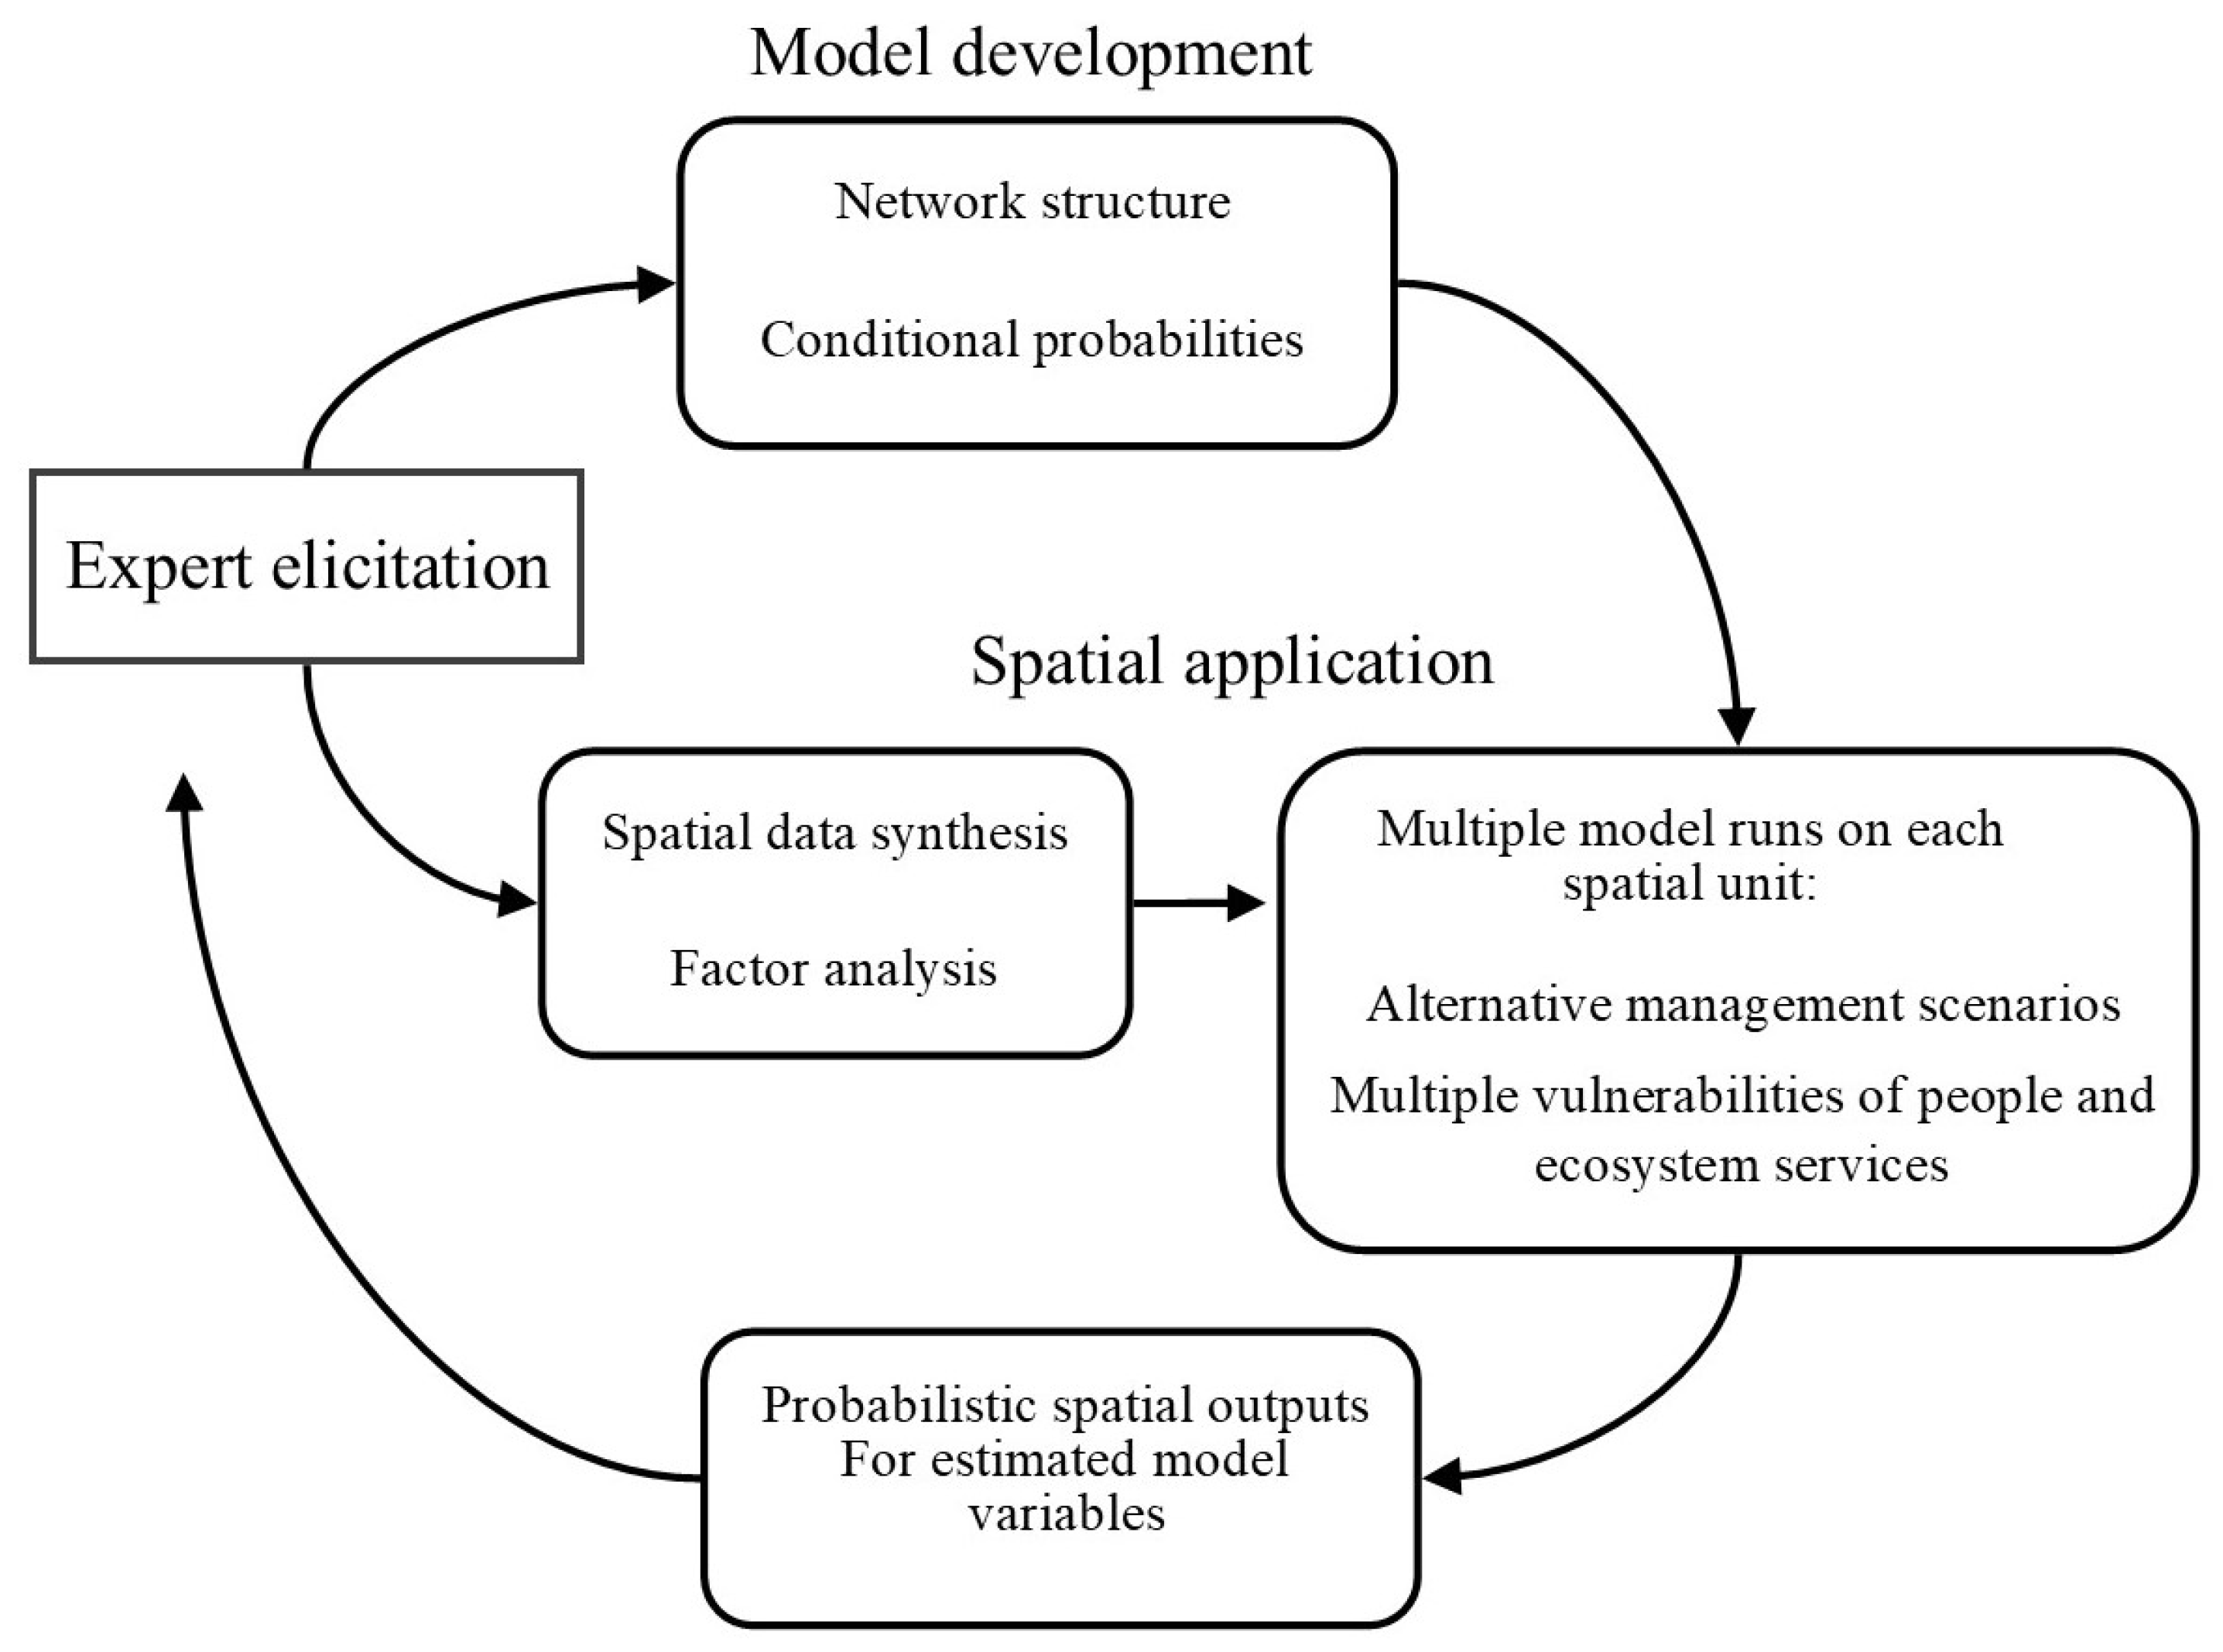
2.2. Expert Elicitation

Social–ecological systems research can be improved by integrating resource managers or other potential end-users in all stages of a project [40,41,42]. Ongoing engagement from such partners helps improve models when they are both data-driven and informed by the mental models of system experts; helps ensure that outputs are appropriate for specific decision-making contexts; and helps achieve buy-in from end-users [34]. We used an informal, start-to-finish expert elicitation process by including an interdisciplinary group of regional fire management experts in all project meetings. The group included key representatives from the Fire and Aviation Management and Regional Information Management programs of the USDA Forest Service Southern Region (Region 8) and the Southeast Regional Coordinator of the National Cohesive Wildland Fire Management Strategy [39]. Through this collaborative working group with weekly meetings, the experts helped identify important model variables and data sets and engaged in ongoing discussions that informed the model parameterizations on the basis of knowledge about variable influences, i.e., causality in the system. In concert with information from the available literature, experts’ advice on representing risk, management options and impacts, and uncertainties was important for structuring the model, interpreting the model outputs, updating provisional model versions, and identifying useful future research (next steps).

2.3. Data Aggregation and Synthesis

Informed by expert elicitation, we aggregated spatial data across all forest lands in the study region, as reported by Gould et al. [37]. The spatial data included indicators for components of social vulnerability, fire-adapted communities, fire dynamics and history, forest properties, forest watersheds, biodiversity, climate, and land use/land cover. We summarized the data on a grid of 1000 ha contiguous hexagons covering the study area and limited the analysis to hexagons with at least 25% forest cover. The complete data set included 73 variables [37].
Gould et al. [37] used a factor analysis to identify key dimensions of variability in the data set as a whole. The factor analysis produced eight factors explaining 45% of the total variance in the data. These factor variables generally corresponded to themes that were readily interpretable and relevant for assessing fire and fire-adapted landscapes in the region. We named and described the factors based on the loadings of the original variables to clearly convey the meaning and interpretation of each factor [37]. Of the eight factors, we identified four that corresponded to landscape properties important for constructing our BN model, as described below. Additional data inputs important for the BN were also drawn from the original set of variables.

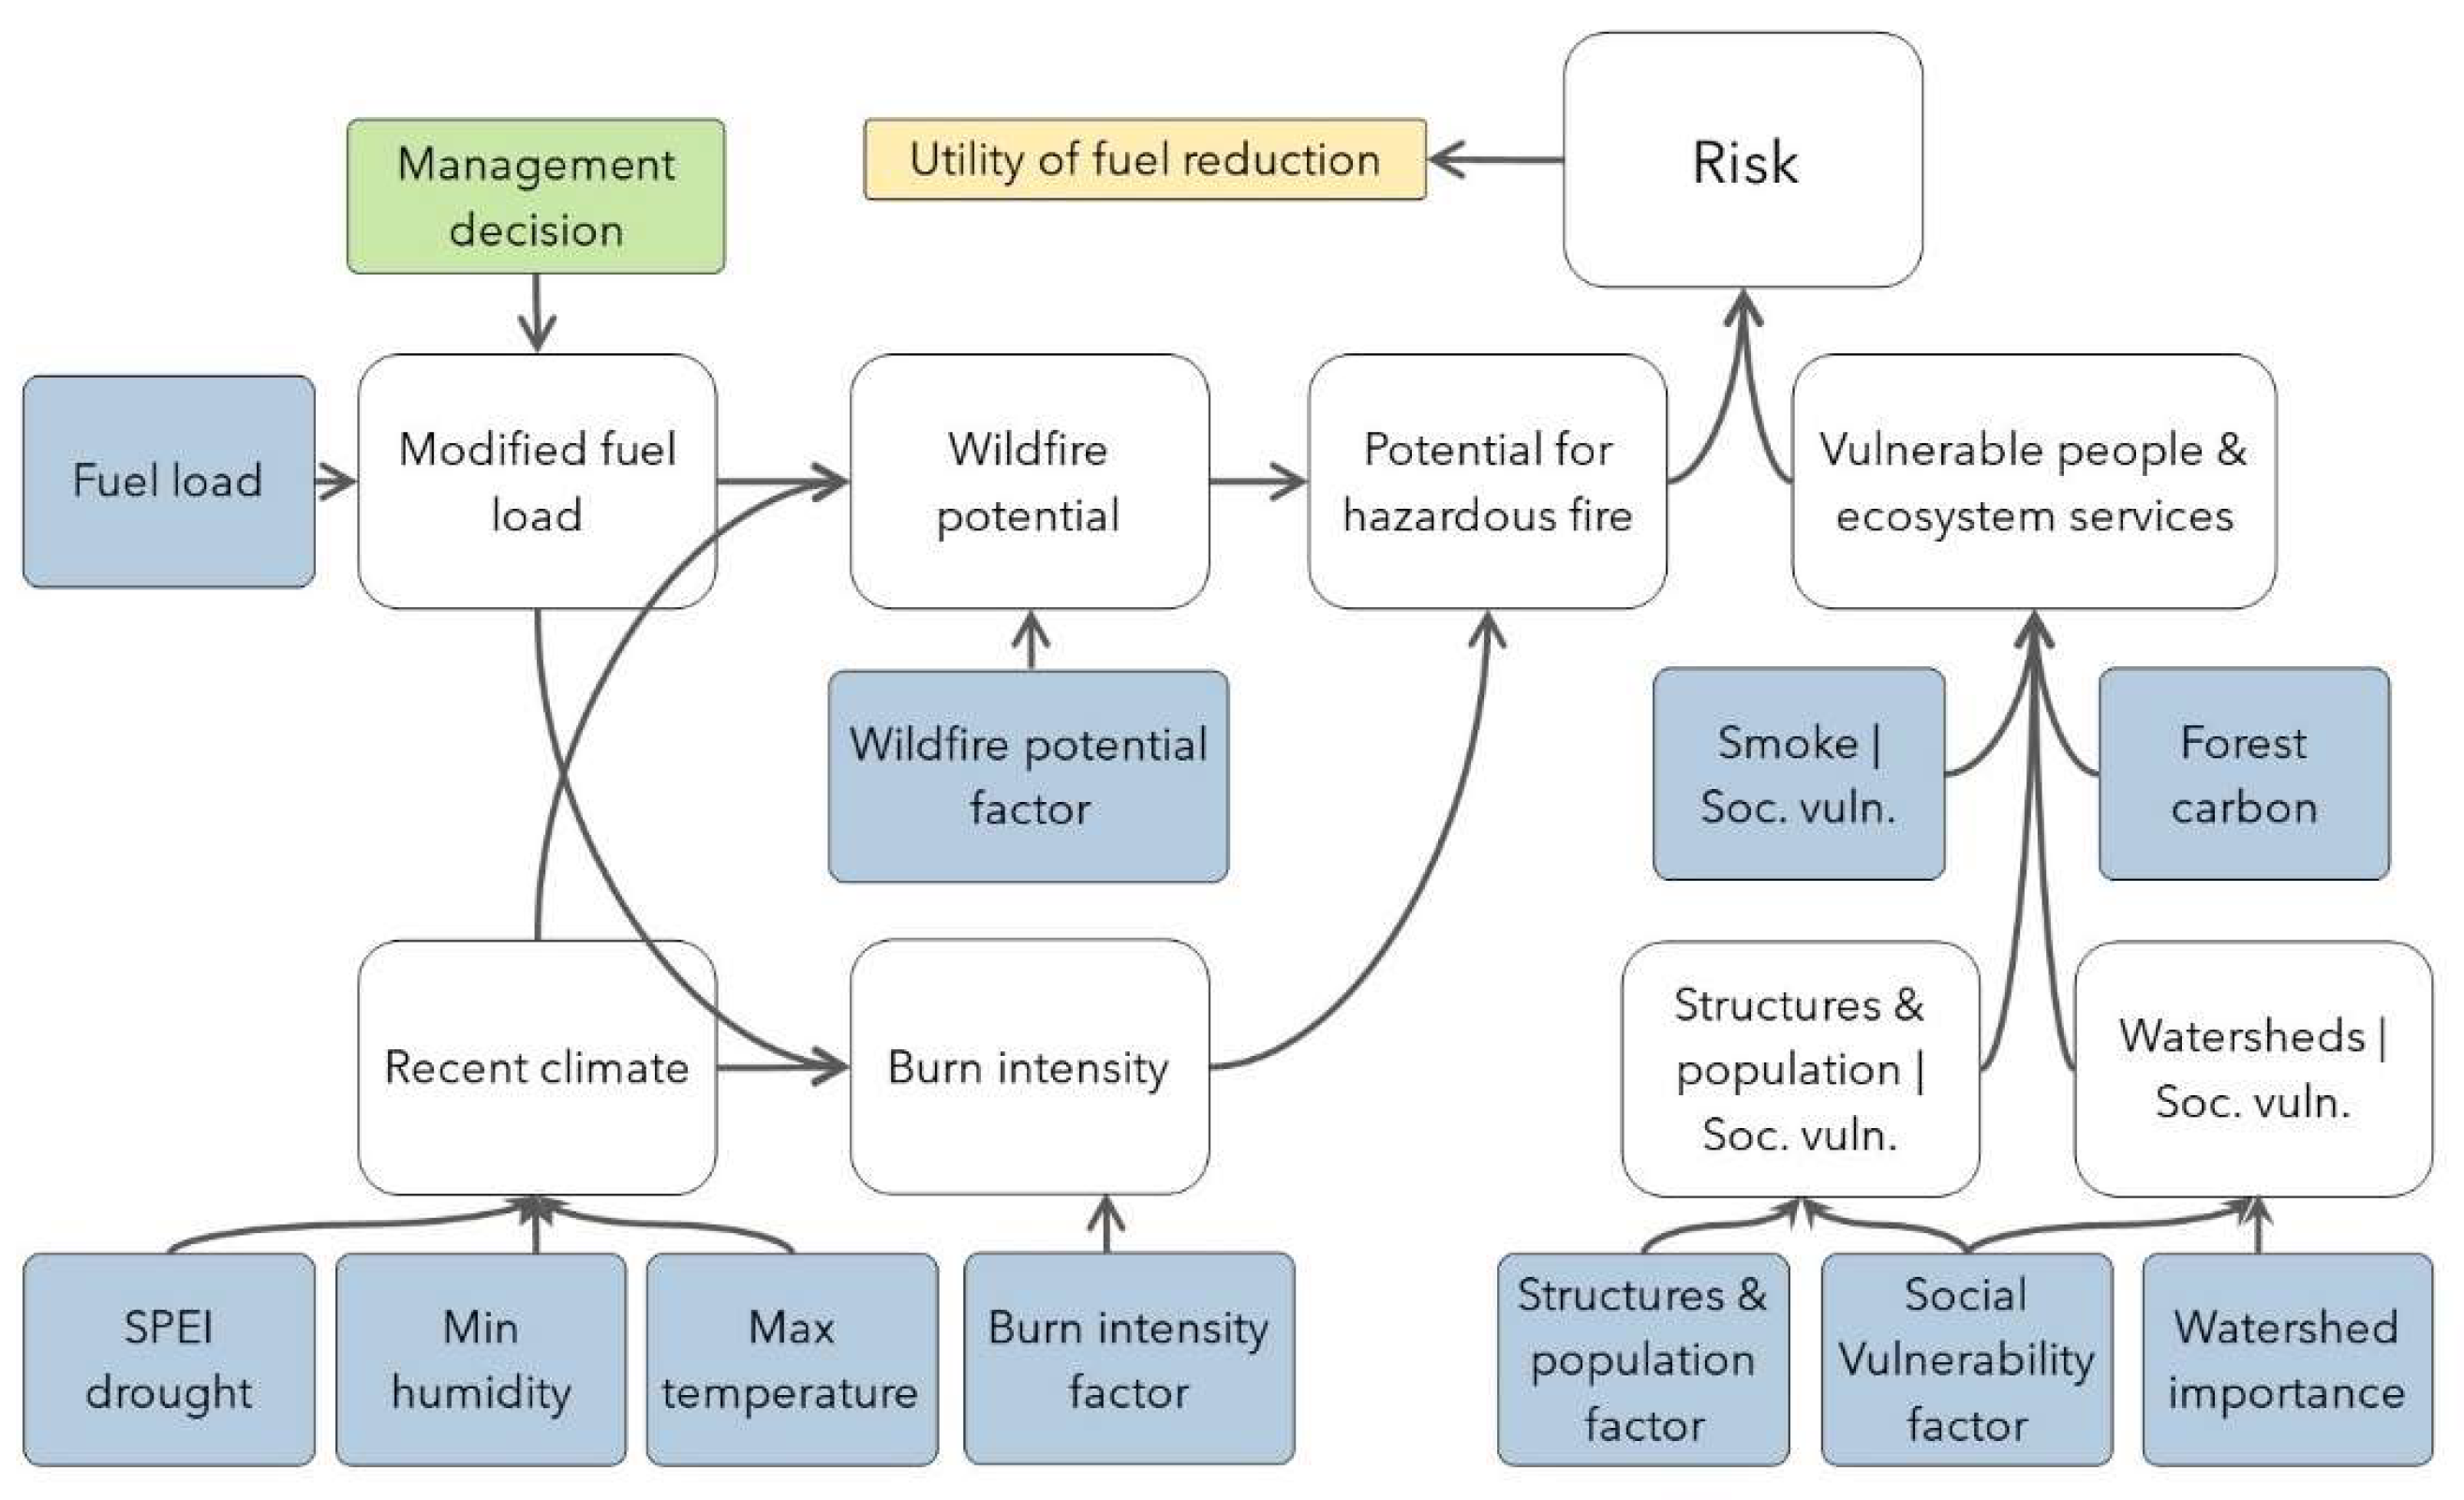
2.4. Bayesian Network Model

The first component of a BN is a graphical structure that qualitatively captures the components of the system and how they are related. The graphical structure consists of variables represented by nodes. If there are directional and functional relationships between two variables, the corresponding nodes are connected by an arc. The second component of a BN is the set of conditional probabilities that quantify these causal relationships among variables in the network. Conditional probabilities are particularly useful for handling uncertainty and are usually represented in conditional probability tables (CPTs). They can be drawn from expert knowledge or derived empirically from data [22,43]. The outcome of a BN model is a distribution over the possible values of each variable, given the data, from which we can estimate the expected value and the uncertainty associated with a prediction [44]. Probability distributions are therefore defined for each node in the graph, with the probabilities of ‘child’ nodes conditional on those of their ‘parent’, i.e., antecedent nodes.

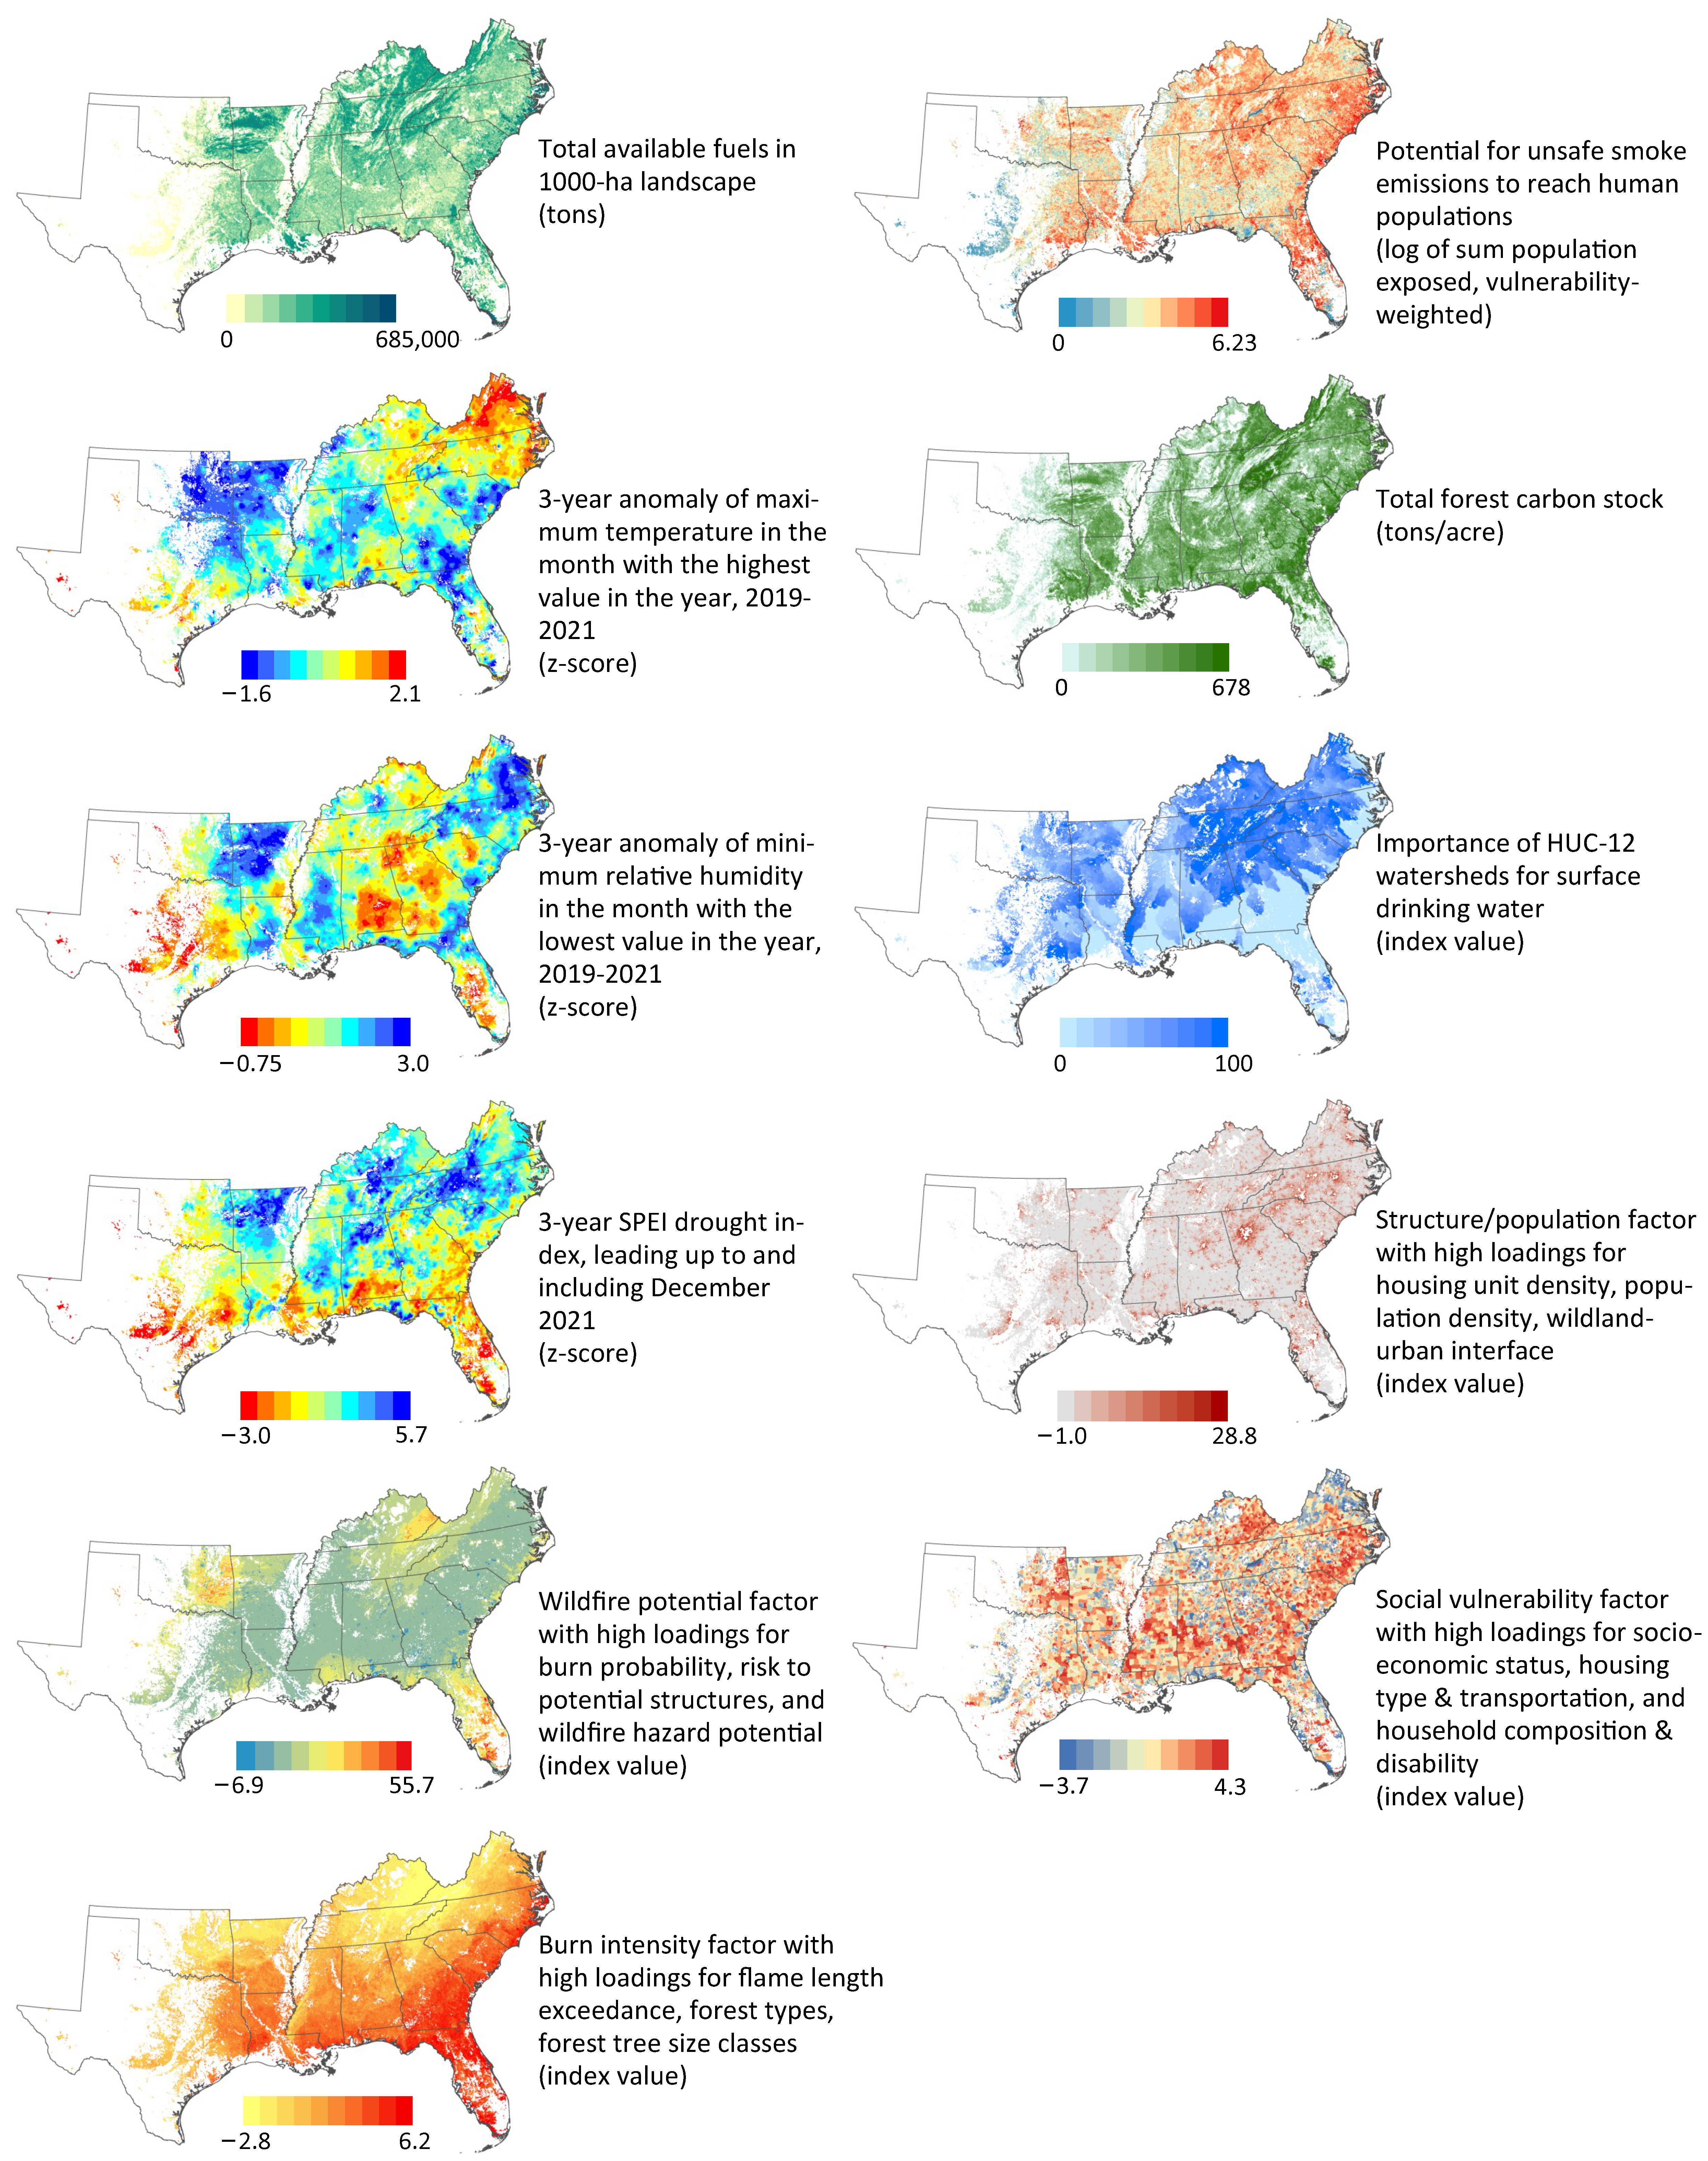
2.5. Model Components and Data

Expert knowledge and literature review resulted in a BN model structure (Figure 3) consisting of multiple nodes, whose connections represent hypotheses about the system’s function. Our intention was for as many model nodes as possible to be informed empirically by including variables in our data set that matched corresponding model nodes, including factors from the factor analysis (Figure 4). We set up the BN within a risk framework (Figure 3). The risk assessment in this study integrates biophysical and social risk subsystems that are key for evaluating and supporting fire-adapted landscapes [8]. Assessing risk involves quantifying the vulnerability of people and resources to fire and their potential exposure to hazardous fire, with risk being an outcome where vulnerability and exposure co-occur [6,45]. The model provides quantitative, probabilistic estimates of risk and the potential for risk reduction through management intervention, both conditional on the various landscape characteristics represented by variables in the BN. We built the model and performed model runs using Netica software (Netica 6.07) [46]. Netica is one of the most widely used platforms for BN analyses. A graphical user interface allows users to build a model structure and CPTs defining probabilistic relationships among variables. Netica can process large numbers of cases rapidly, even for complex models, and the software also provides tools for sensitivity analyses [47,48,49,50]. Our full model is available as a Netica file [51]. The following sections provide details for model components and input data.

2.5.1. Potential for Hazardous Fire

The potential for hazardous fire (Figure 3) is conditional on wildfire potential and probable burn intensity, which in turn are conditional on fuel load, recent climate, and related variables that helped to define the wildfire potential and burn intensity factors. Specifically, those two factors from the factor analysis by Gould et al. [37] had some of their highest loadings for variables directly representing burn probability and flame length exceedance (a proxy for burn intensity), but they also included high loadings for other associated variables, including forest types, forest diameter size classes, and long-term climate variables (Table A1 in Appendix A). The burn probability, flame length exceedance, and other fire related variables used in the factor analysis were obtained from already existing datasets, usually based on mechanistic and process-based fire modeling approaches (e.g., the Wildfire Risk to Communities project) [31]. Our integrated BN model is designed to leverage a combination of these multiple information sources for a broad-scale risk analysis.
To represent the forest fuel load (Figure 4), we used the total available fuels updated for the year 2022 within the Landfire project’s Fuel Characteristic Classification System (FCCS) [52]. The FCCS classifies various fuelbed components such as soil, litter, and understory available fuels; we summed all classes within the forest component of our landscapes. Climate also strongly influences hazardous fire potential, and we structured the model to capture the influence of climate anomalies and a drought index during the most recent three years [53]. Based on expert elicitation, we included 2019–2021 anomalies for the monthly minimum relative humidity, which influences fuel flammability, and the monthly maximum temperature. We also included the Standardized Precipitation–Evapotranspiration Index (SPEI), a standard drought index which has been correlated with wildfire occurrence and severity [54]. We used observed climate data from the downscaled MACAv2-METDATA dataset archived by the USDA Forest Service for use in the 2020 Resource Planning Act (RPA) Assessment, updated to include data through 2021 [55,56,57]. The details of the baseline 30-year climate normal development are in [37]. We calculated z-score anomalies for the most recent three years as the standardized difference between the recent and normal values. Similarly, a 3-year SPEI was modeled using the long-term baseline as the reference period [58]. Additional details of biophysical data preparation and the summarization of variables to the 1000 ha spatial units of analysis are provided by Gould et al. [37].

2.5.2. Vulnerable People and Ecosystem Services

We defined people and ecosystem services potentially at risk as (1) the human population and infrastructure/development directly exposed to wildfires, (2) people exposed to smoke from wildfires, (3) forest carbon stocks potentially lost during wildfires, and (4) important areas for surface-water-derived drinking water, where water quality could potentially be compromised. We implemented model runs to assess risk for each of these four vulnerabilities separately and for all four combined. For combined risk, we used the following weights based on expert elicitation: population and infrastructures (3.0); smoke exposure (2.0); forest carbon (1.0); and water (1.0). In this study, direct impacts on people and structures were considered to be the highest concern and smoke exposure to people the next-highest, whereas ecosystem services were considered important, but not as important, to managers tasked with protecting people and resources from wildfire impacts.
A key component of our model involved quantifying not only the human population density but also the social vulnerability of those populations. The potential harm to people from wildfires is not evenly distributed among populations, depending on vulnerabilities related to economic status, housing type, mobility, language and minority status, and other factors [59,60]. The factor analysis by Gould et al. [37] resulted in a social vulnerability factor (Table A1), which we used in the BN to condition the population and infrastructure variable and the watershed importance for drinking water variable (Figure 3). The factor analysis also produced a population and infrastructure density factor characterized by housing density, population density, and the proportion of the hexagon classified as WUI (Table A1). This factor was used in the BN to represent human populations and infrastructure potentially directly exposed to wildfires.
Smoke exposure was also conditioned by social vulnerability prior to inclusion in our model. This variable represented the potential for smoke plumes from simulated high-intensity fires in a given 1000 ha landscape to reach human populations at smoke concentrations above the EPA safety standards [60]. Simulated plumes could potentially affect populations in any nearby landscape, depending on the plume characteristics, population density, and social vulnerability; details of the smoke modeling effort are reported elsewhere [37].
For forest carbon stock estimates, we used a spatial data product modeled by the USDA Forest Service’s Forest Inventory and Analysis (FIA) program using field plot data under the FIA Big Data, Mapping, and Analytics Platform (BIGMAP) program [61,62]. BIGMAP is a collaboration between FIA and Esri that provides a cloud-based computing platform for the modeling, mapping, and analysis for US forests. We calculated the mean tons/ha using total live and dead forest carbon estimates [37]. The watershed importance for drinking water variable came directly from the USDA Forest Service’s Forests to Faucets 2.0 data product [63]. This index estimates the importance of local HUC12 watersheds based on the number of people who depend on downstream surface water outtakes from a watershed for drinking water. We used the mean importance value within our 1000 ha hexagons [37]. Additional details on data preparation and the summarization of variables to the 1000 ha spatial units of analysis are provided in Gould et al. [37].

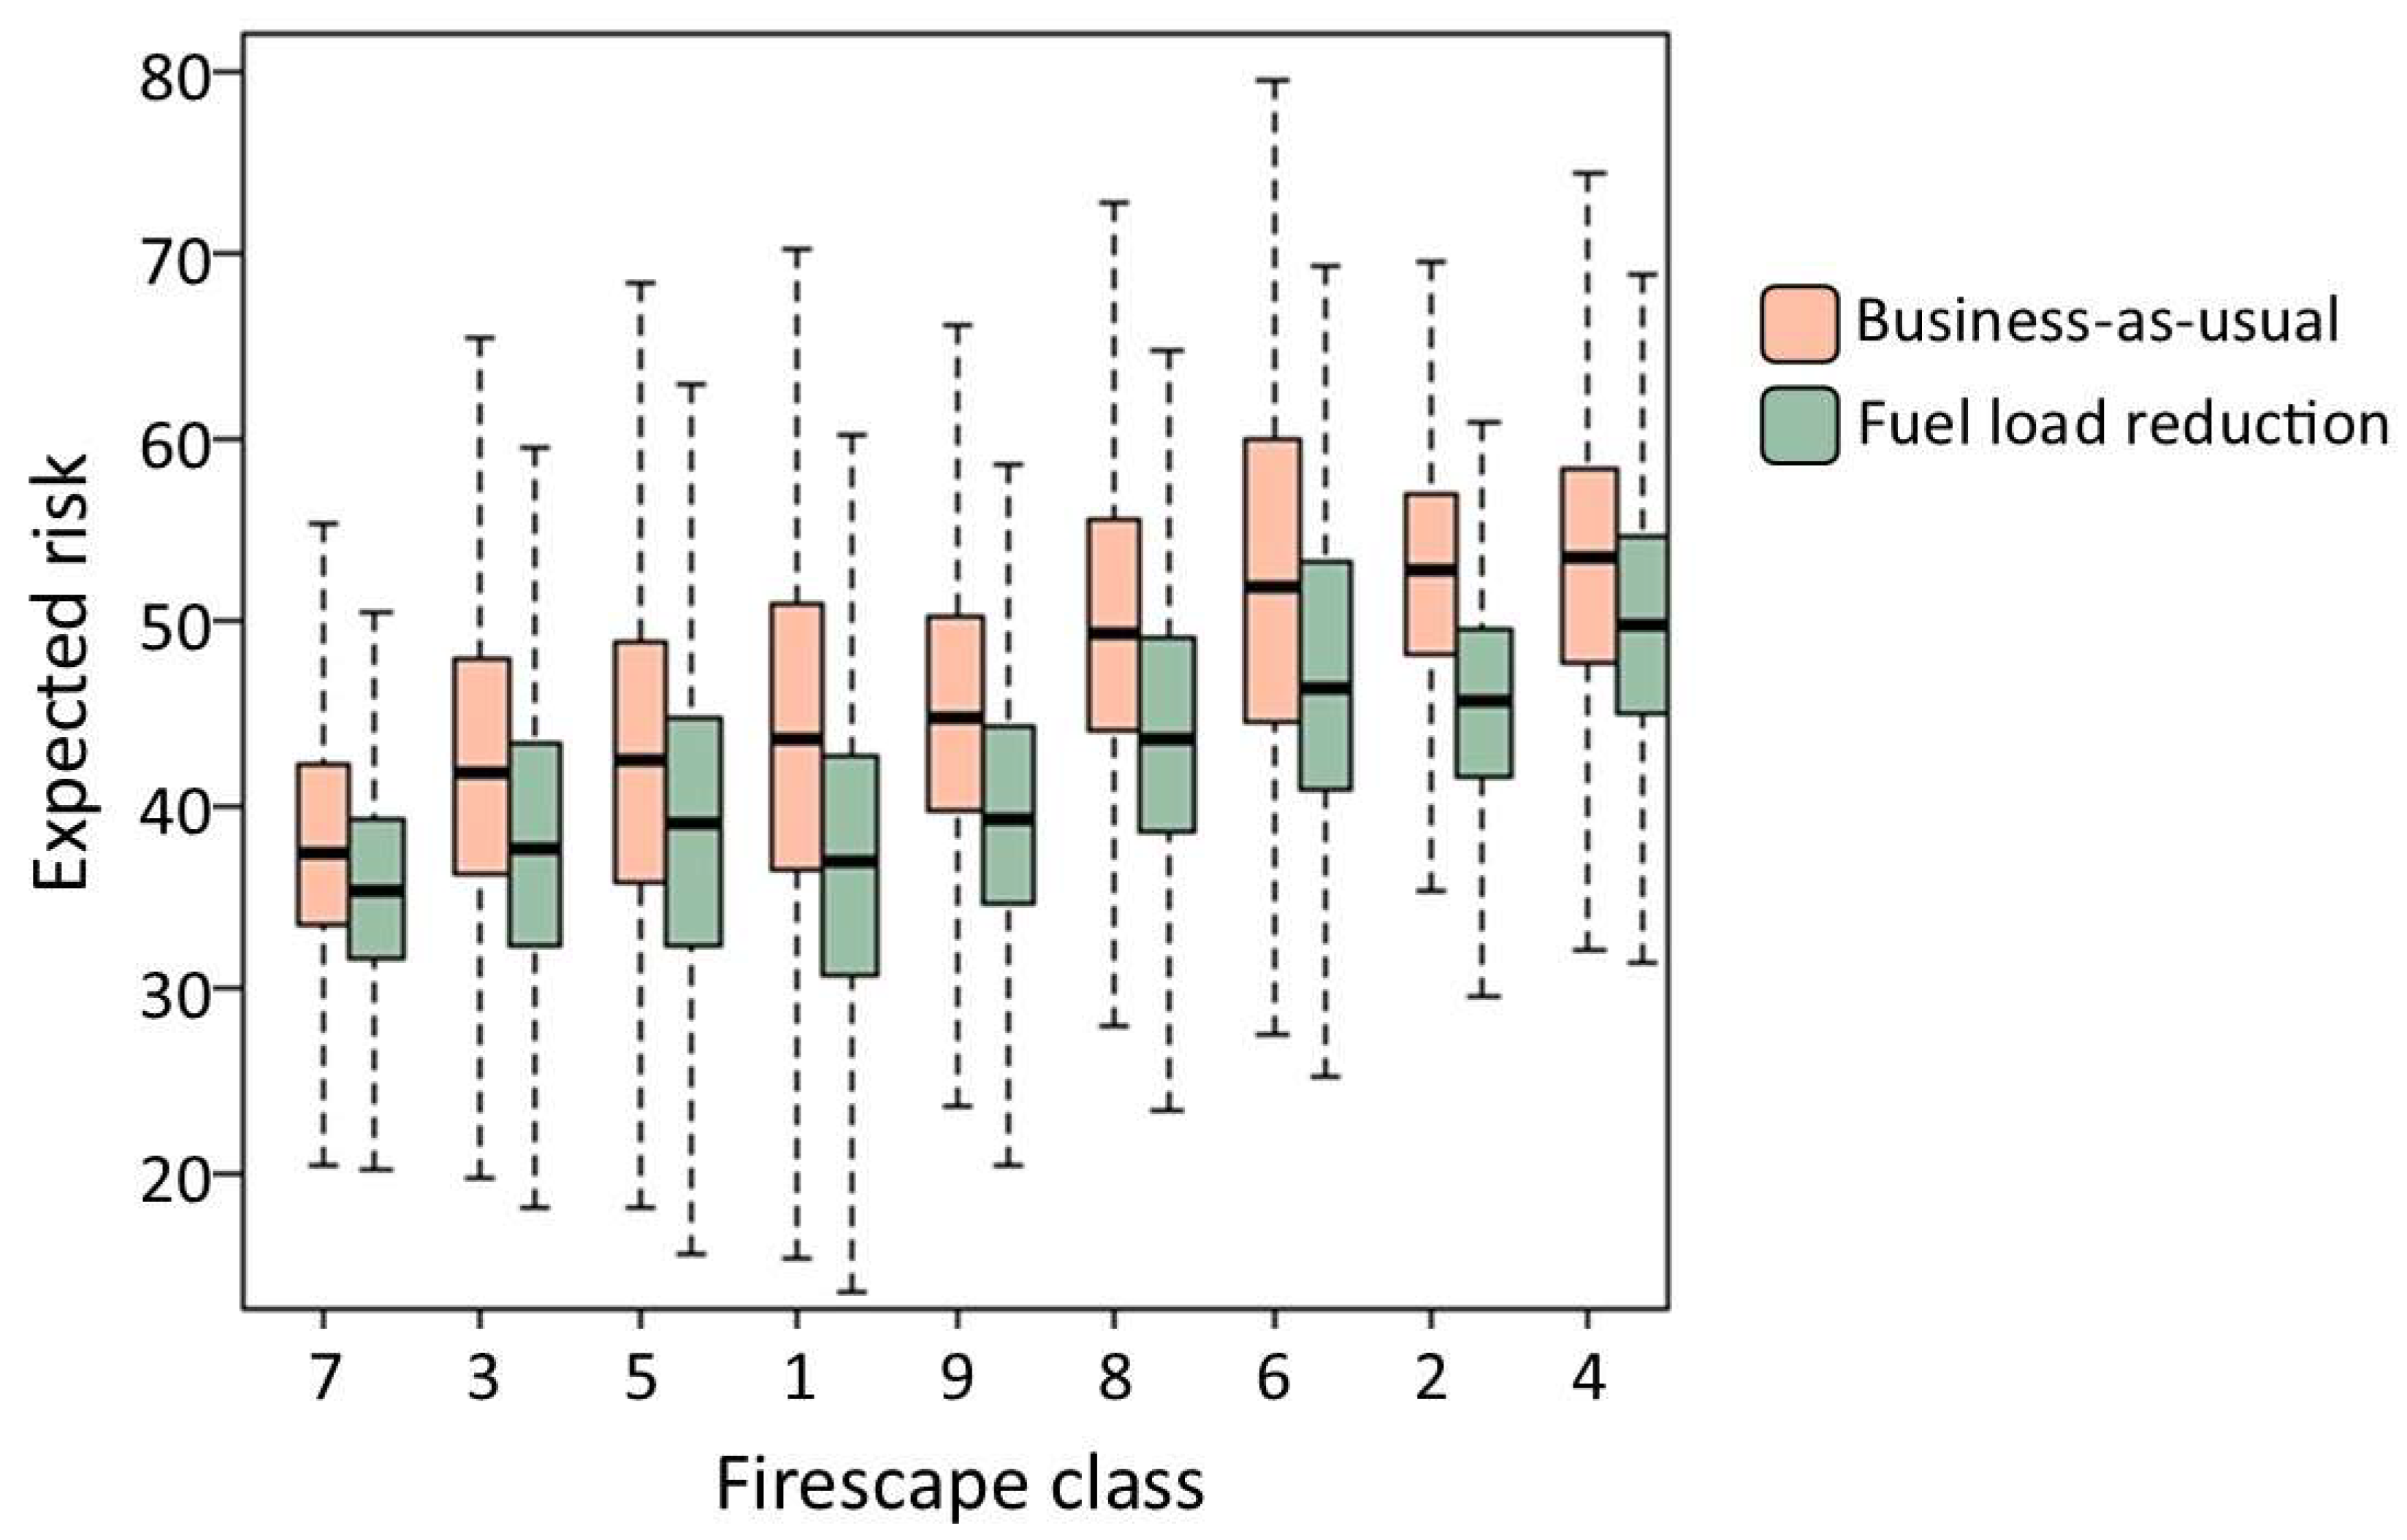
2.5.3. The Utility of Fuel Reduction to Reduce Risk

The model estimated the potential for risk reduction through active management (prescribed fire) through the implementation of a decision node that influenced the fuel load. The decision node represents the choices available to a decision maker that can influence outcomes (i.e., risk) through its influence on conditional probabilities in the BN [22]. Our model evaluated a simple binary choice to either enhance investment in prescribed fire in the landscape or not—the latter representing ‘business as usual’. The ‘enhanced investment’ decision was designed not to represent a single decision to implement a prescribed burn but instead represented a broader investment in prescribed fire in the landscape, which could include multiple burns over the next five to ten years. While highly generalized, this operational definition was considered appropriate in expert elicitation for aiding investment prioritizations at the regional scale. In the model, the ‘enhanced investment’ decision probabilistically reduced existing fuels by approximately half.
We implemented a utility node in the BN to represent the value attributed to the risk outcome, given the decision made (enhanced investment vs. business as usual). The utility of prescribed fire is therefore based on the estimated risk, with lower-risk outcomes suggesting a higher utility of the decision made. The relative utility quantifies the degree to which outcomes under one decision are more desirable than under the alternative decision.
R e l a t i v e   u t i l i t y = Utility   ( enhanced   investment ) Utility   ( business   as   usual )

2.6. Sensitivity Analysis

Relationships between input parameters and model outcomes are not known a priori. We assessed how sensitive the risk and utility estimates were to the model parameters and across the ranges of values in the input data. This allowed us to examine which input variables were the most critical to the results. We first conducted a basic model sensitivity analysis from the model itself based on the possible data ranges of the input variables and the model’s conditional probability tables. We recorded the ranges of variation in the estimated overall (combined) risk for the possible values of each input variable while holding all other inputs at their uninformed prior value. We used the mutual information metric to estimate the predictability of risk, given the variation in the input variable. Mutual information is a general measure of dependence between random variables that quantifies the amount of information one shares with the other [64,65]. It describes the uncertainty about a variable—or, conversely, its predictability—given the knowledge of another. It can be interpreted as a measure of correlation, but it is sensitive to any functional relationship, not just linear relationships [65]. We then further explored the roles of climate and fuel load—two of the most important factors driving hazardous fires—by examining scatter plots and the Pearson correlation between these data inputs and the model findings, using the full complement of data values across all landscapes.

3. Results

The results are focused primarily on the spatially explicit outputs from the BN model. We produced maps for the key model outputs, including the expected values for risk, the relative utility of fuel reductions for reducing risk, and antecedent model nodes influencing those. Model nodes aside from data inputs took a relative index value from 0 to 100; the expected values are the estimated highest-probability values in that range. We also summarize the risk results for the firescape classes shown in Figure 2 and present the model sensitivities to the input variables.

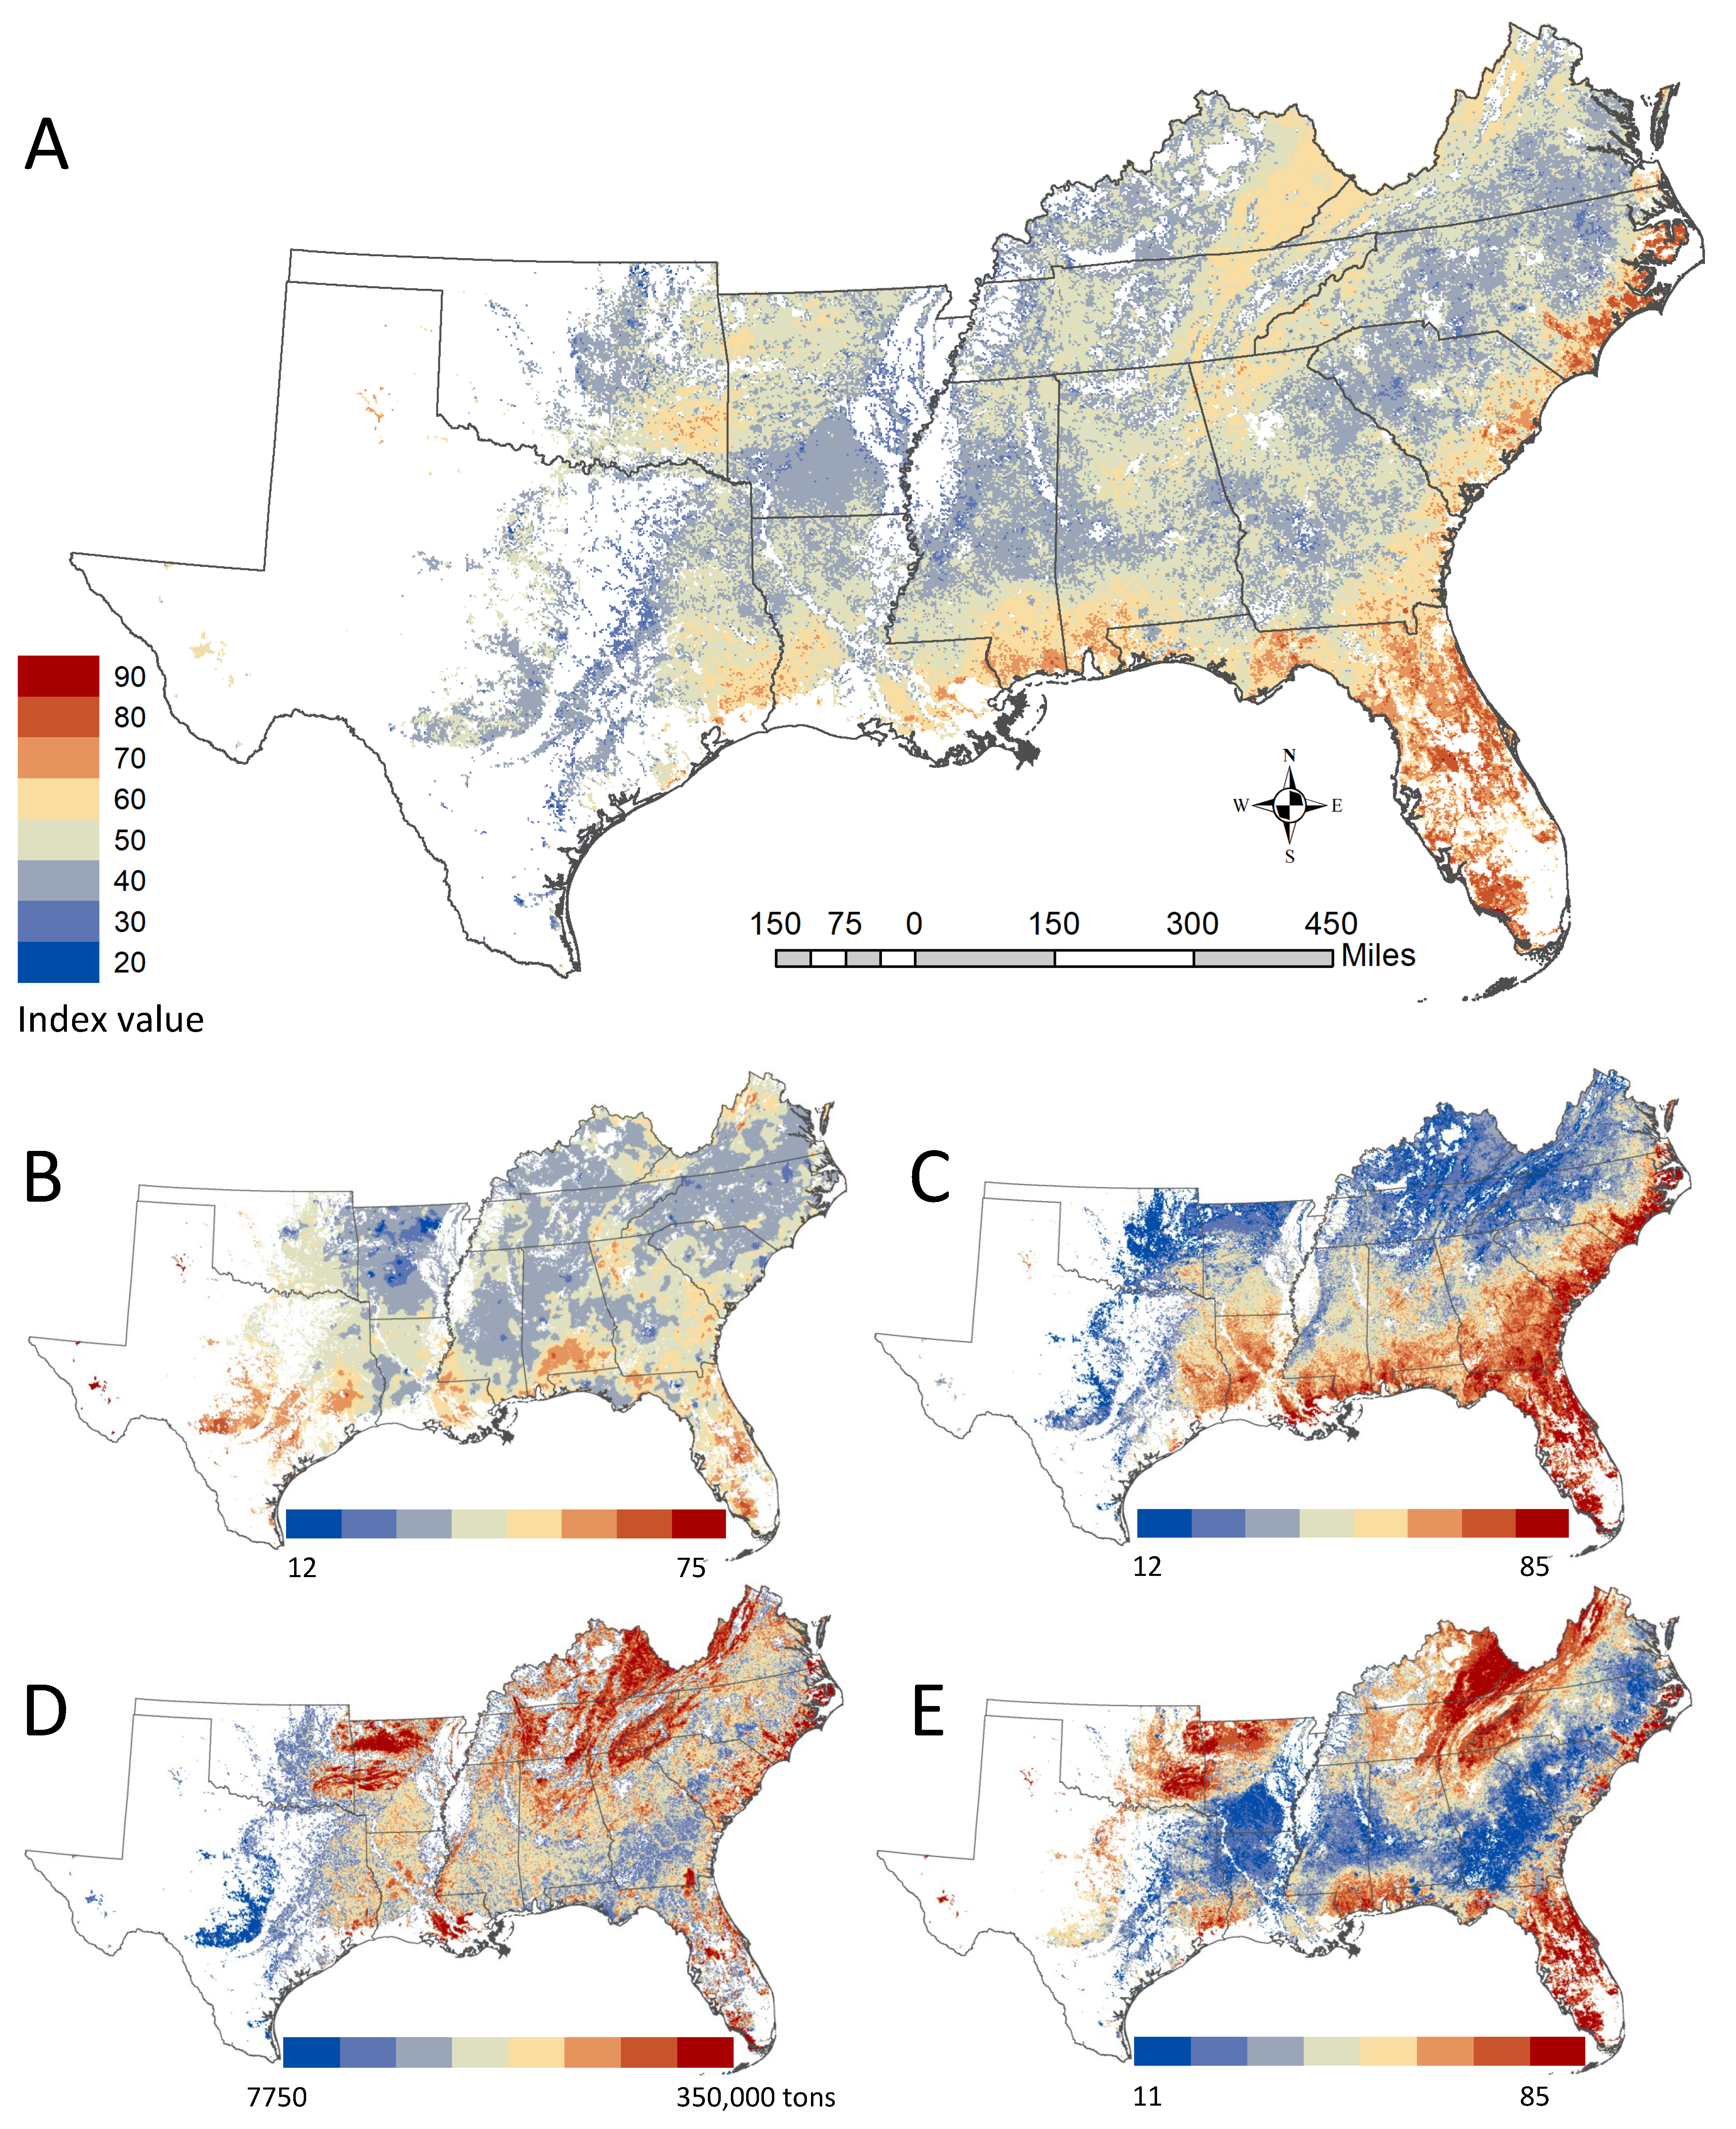
3.1. Potential for Hazardous Fire

The model results showed the highest values for hazardous fire potential concentrated in Florida and the Atlantic and Gulf coastal plains, extending into southeastern Texas (Figure 5A). Interior highlands subregions, including the Ouachita, Ozark, and southern Appalachian Mountains and eastern Kentucky, also had elevated hazardous fire potential, although generally lower than the coastal plains. Recent climate conditions—especially drought—and fuel load were both important drivers of hazardous fire potential (see sensitivity findings in Section 3.5). The model’s recent climate node (Figure 5B) was influenced by the 3-year SPEI drought index and anomalies for the minimum relative humidity and maximum temperature. During this period, unusually hot and dry conditions occurred in a band from south–central Texas along the Gulf Coast to south Florida. These conditions contributed to higher values for the estimated potential burn intensity and wildfire potential variables along the coastal plains (Figure 5C,E). In the interior highlands, a high fuel load and consequently high wildfire potential contributed to hazardous fire potential (Figure 5D,E). With some important exceptions, such as the North Carolina coastal plain forests, climate appeared to be a crucial driver of hazardous fire potential in the coastal plains and Texas, whereas the fuel load was more important in the interior highlands.

3.2. Vulnerable People and Ecosystem Services
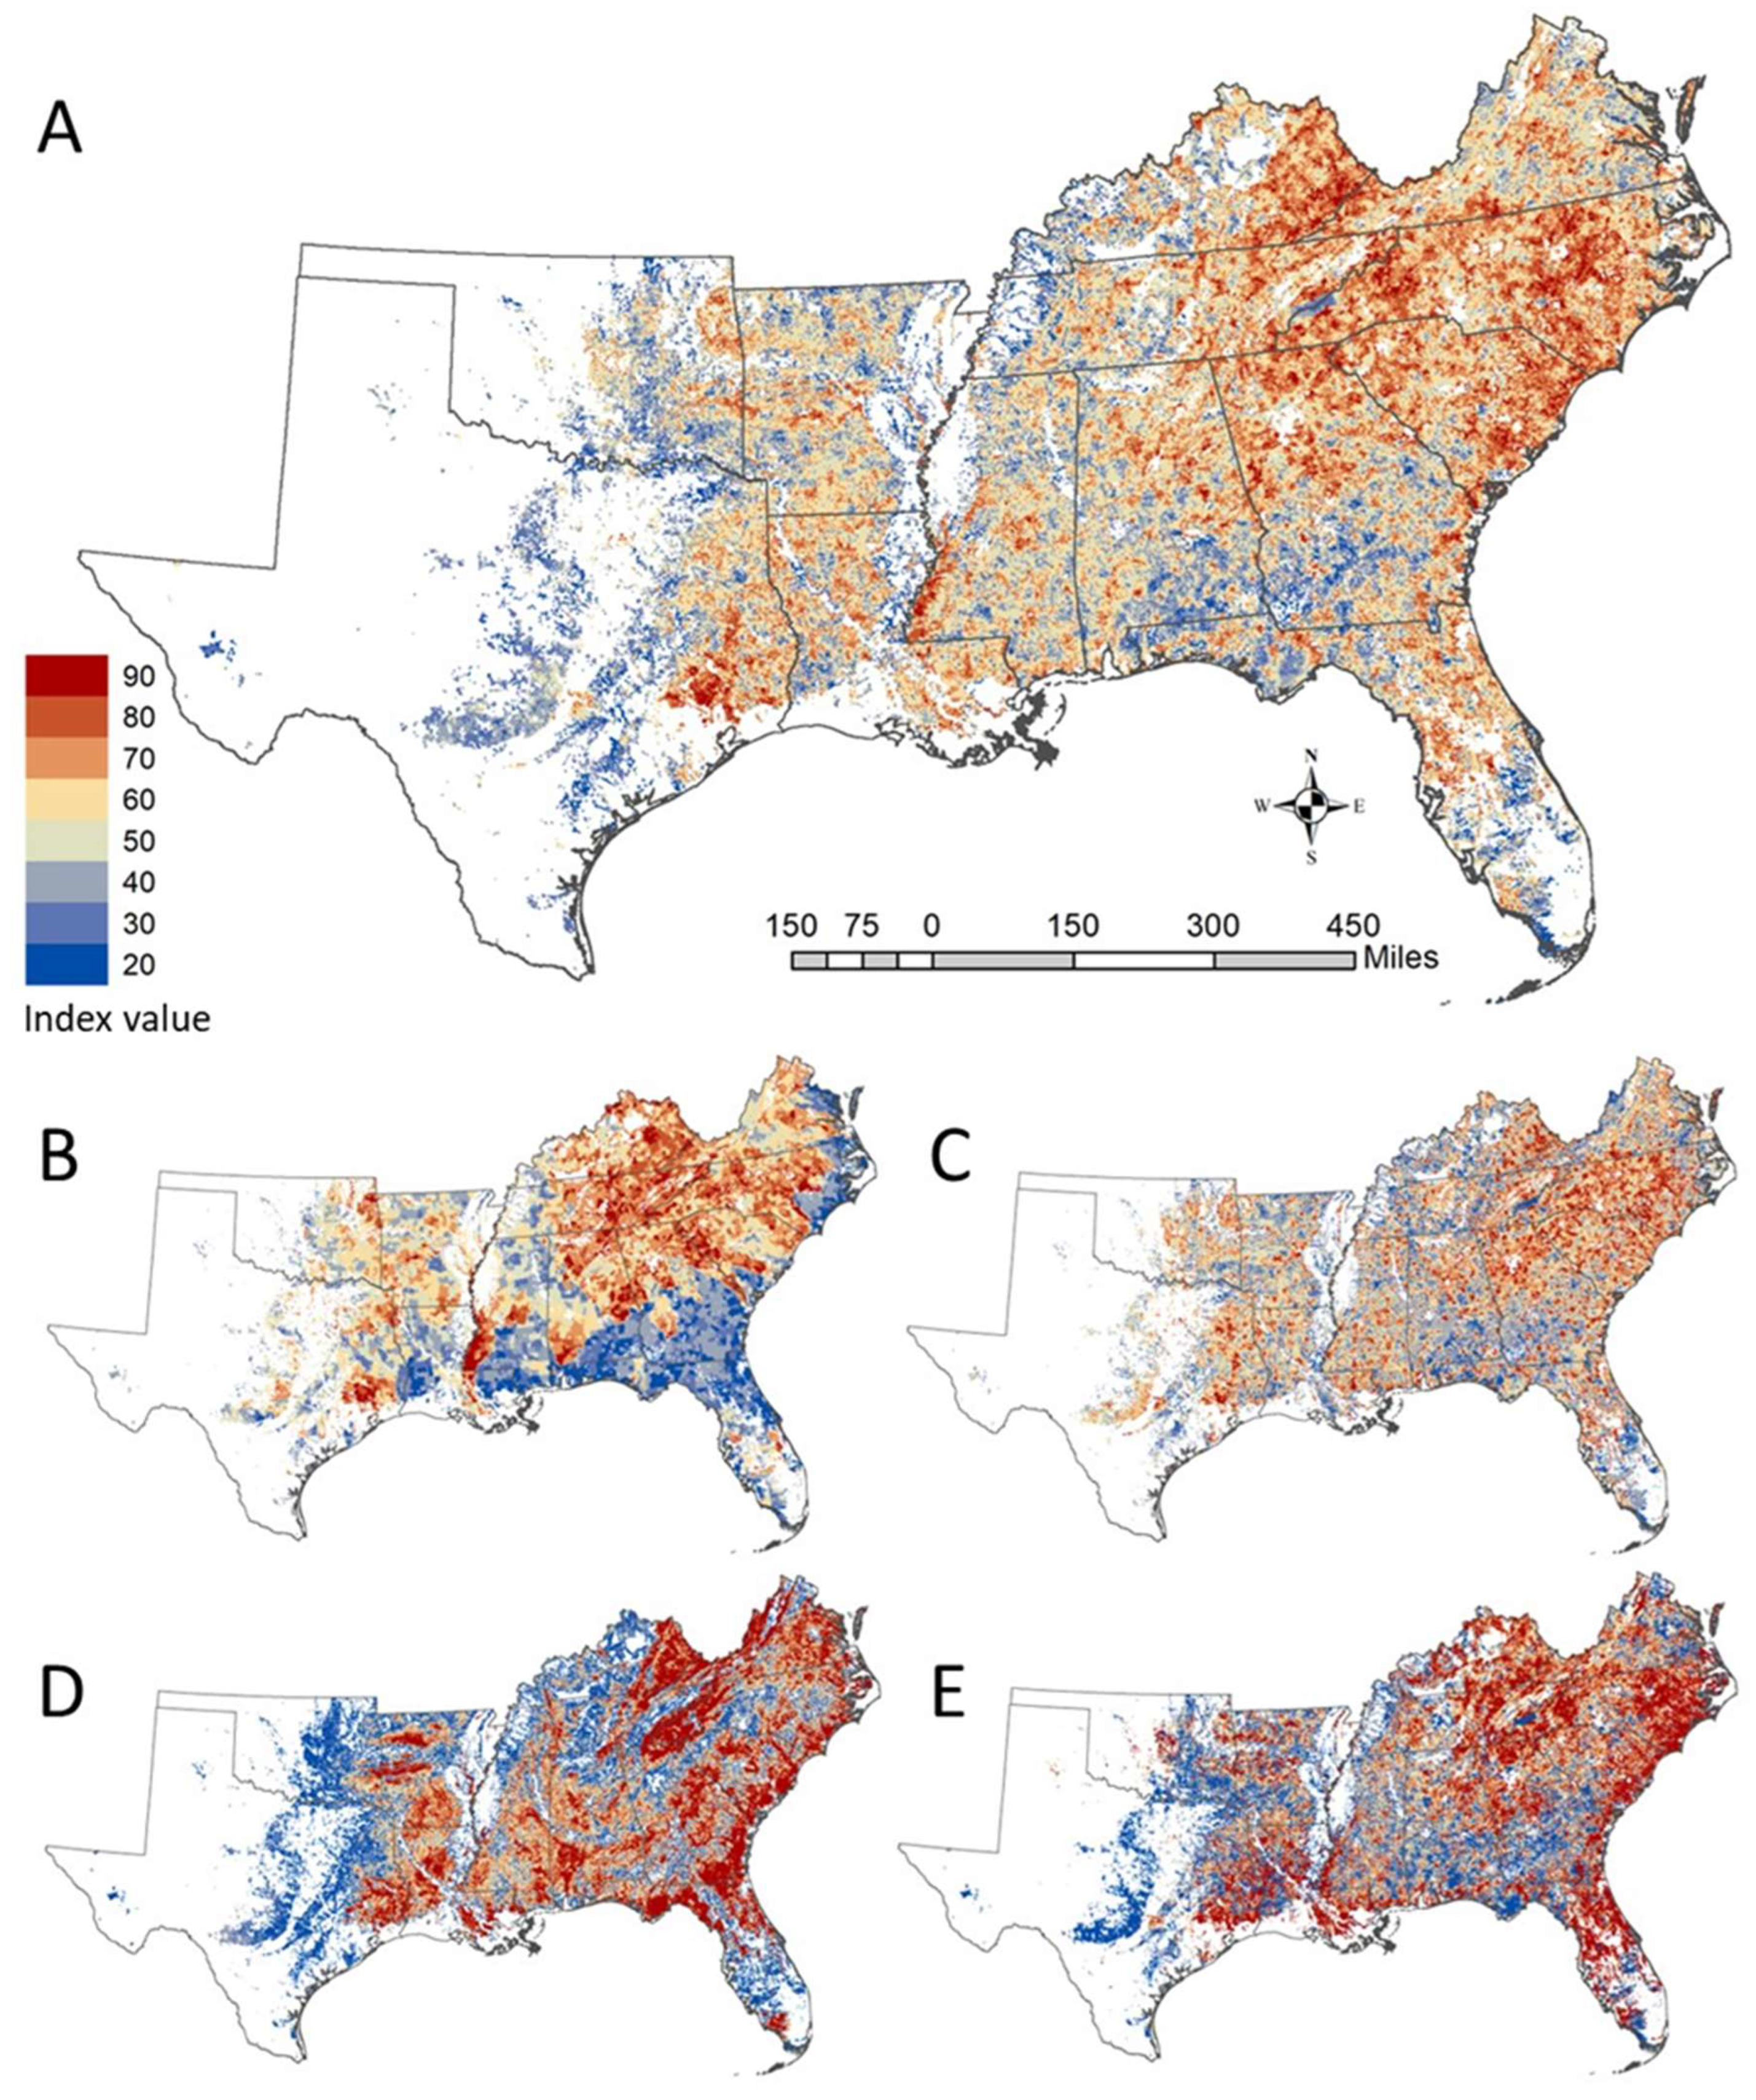
The results for the overall spatial distribution of vulnerable people, infrastructure, and ecosystem services across the study region (Figure 6A) are based on combined vulnerabilities, with the strongest weights on the potential for direct impacts on people and structures (Figure 6C) and the potential for smoke emissions that reach vulnerable populations at unsafe levels (Figure 6E). Many subregions with high vulnerabilities were in areas characterized by rural poverty, including parts of eastern Kentucky, eastern North Carolina, southeast Texas, and other areas. This was driven in part by the social vulnerability factor in the model (Figure 4), and that influence often only reinforced vulnerabilities resulting from the concentration of important watersheds, forest carbon, and the potential for hazardous smoke emissions in these same areas (Figure 6B–E).
The spatial correlation between vulnerable forest carbon and the potential for hazardous smoke emissions was largely related to heavily forested landscapes with mature (large diameter class) forests and high fuel loads. Differences between those two vulnerabilities (e.g., in eastern Virginia and North Carolina) arose from differences in the likelihood of forested landscapes contributing smoke to nearby populated places and from the social vulnerabilities of those populations. Important watersheds for drinking water were distributed mainly in uplands in the northeastern part of the region, in part because populations in the coastal plains rely more heavily on groundwater than surface water sources for drinking water supplies [63].

3.3. Wildfire Risk

The wildfire risk maps in Figure 7 show the estimated spatial distribution of wildfire risk, based on the exposure of vulnerable people and ecosystem services to hazardous wildfire potential. Landscapes with an unusually high estimated overall risk (i.e., all vulnerabilities combined) were concentrated in Florida and the Atlantic coastal plain. Southeastern Texas and the Gulf coastal plain, and the interior highlands, including the Ouachita, Ozark, and southern Appalachian Mountains and eastern Kentucky, also showed high risk. Our results suggest that wildfire risk in different subregions is driven by different biophysical and socio-economic factors. In Florida and the coastal plains, the expected risk generally follows the distribution of hazardous fire potential (Figure 5). In the interior highlands, where hazardous fire potential was more moderate, especially in eastern Kentucky and the southern Appalachians, risk was heightened by the concentration of vulnerable people and ecosystem services (Figure 6). There were exceptions to these patterns; for example, some parts of the Atlantic coastal plain were characterized by the co-occurrence of nearly all the contributing factors to risk that we quantified.
There was variation in risk among landscapes within any given firescape class and among the different firescape classes (Figure 8). High risk was mainly concentrated in firescape classes containing WUI-dominated peri-urban landscapes (firescape 4), coastal plain forests (firescapes 8 and 6), and broadleaf montane forests (firescape 2). The potential risk reduction under the enhanced investment in fuel reduction model scenario also varied within and among firescape classes (Figure 8). For example, in firescapes 4 and 7, the difference in the mean estimated risk between the two management scenarios was small. This resulted primarily from the total fuel loads being comparatively low in these two landscape types, with risk driven by other factors—mainly the density of people and housing (firescape 4) and the climate (firescape 7).

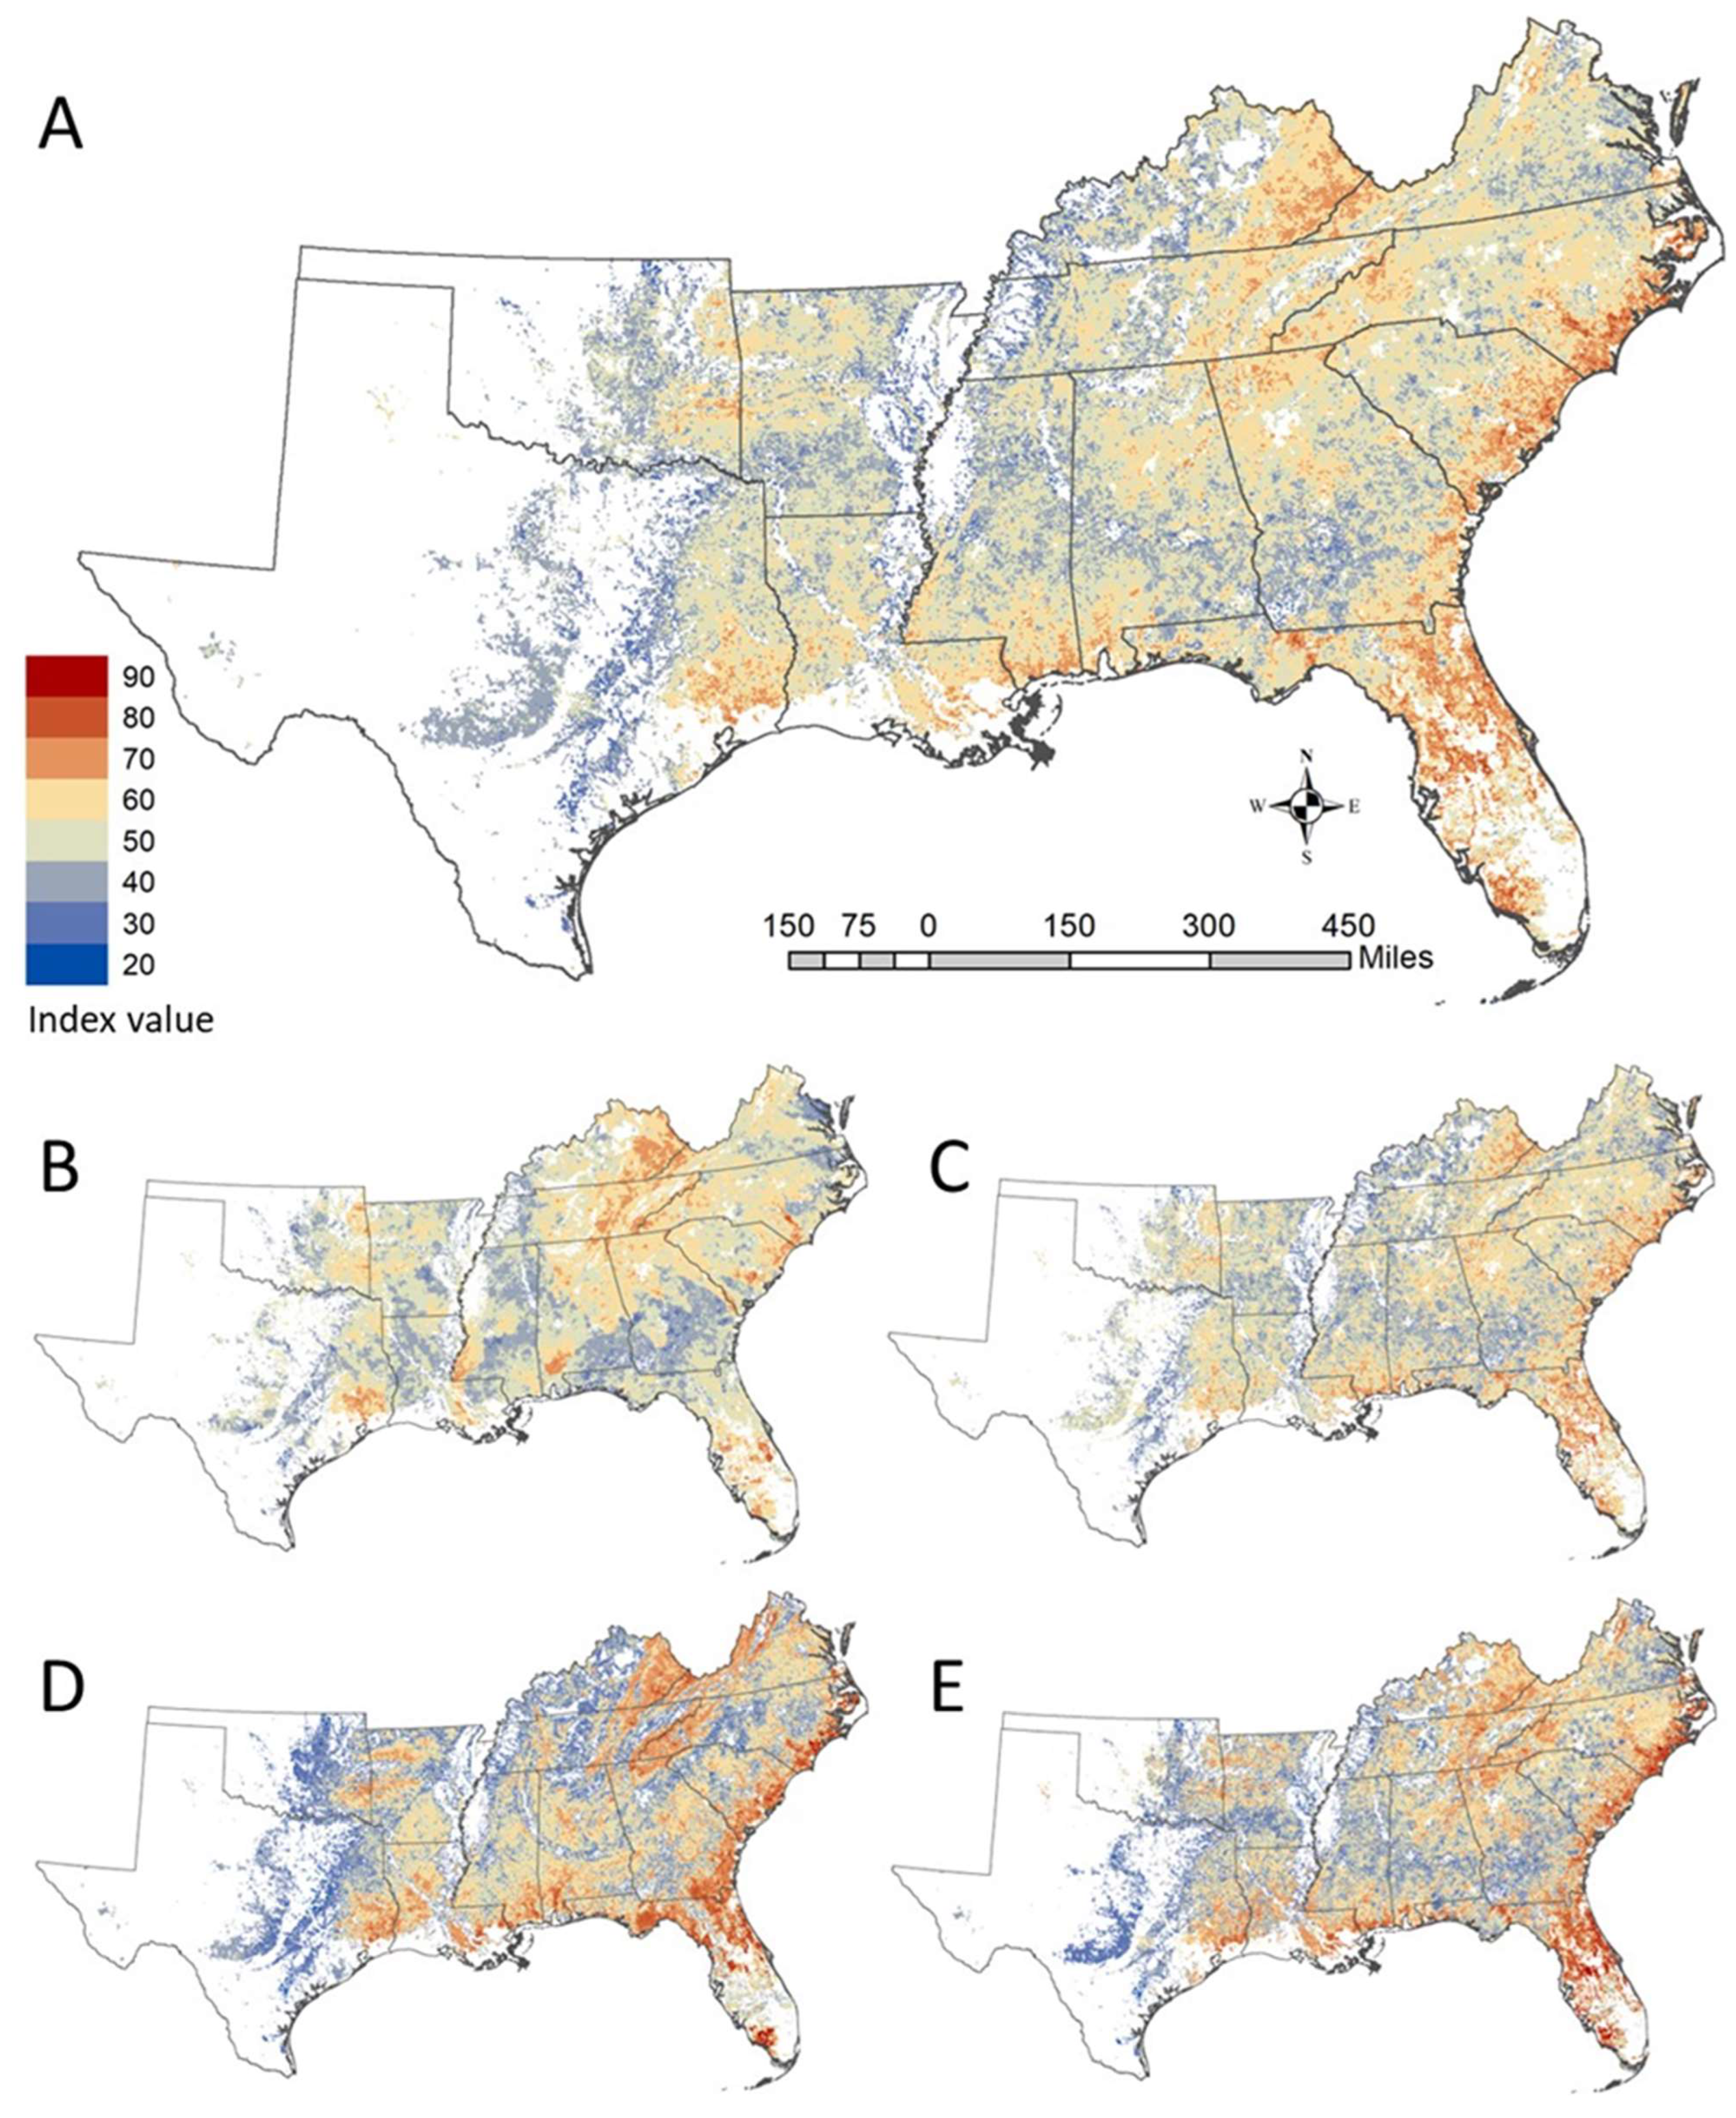
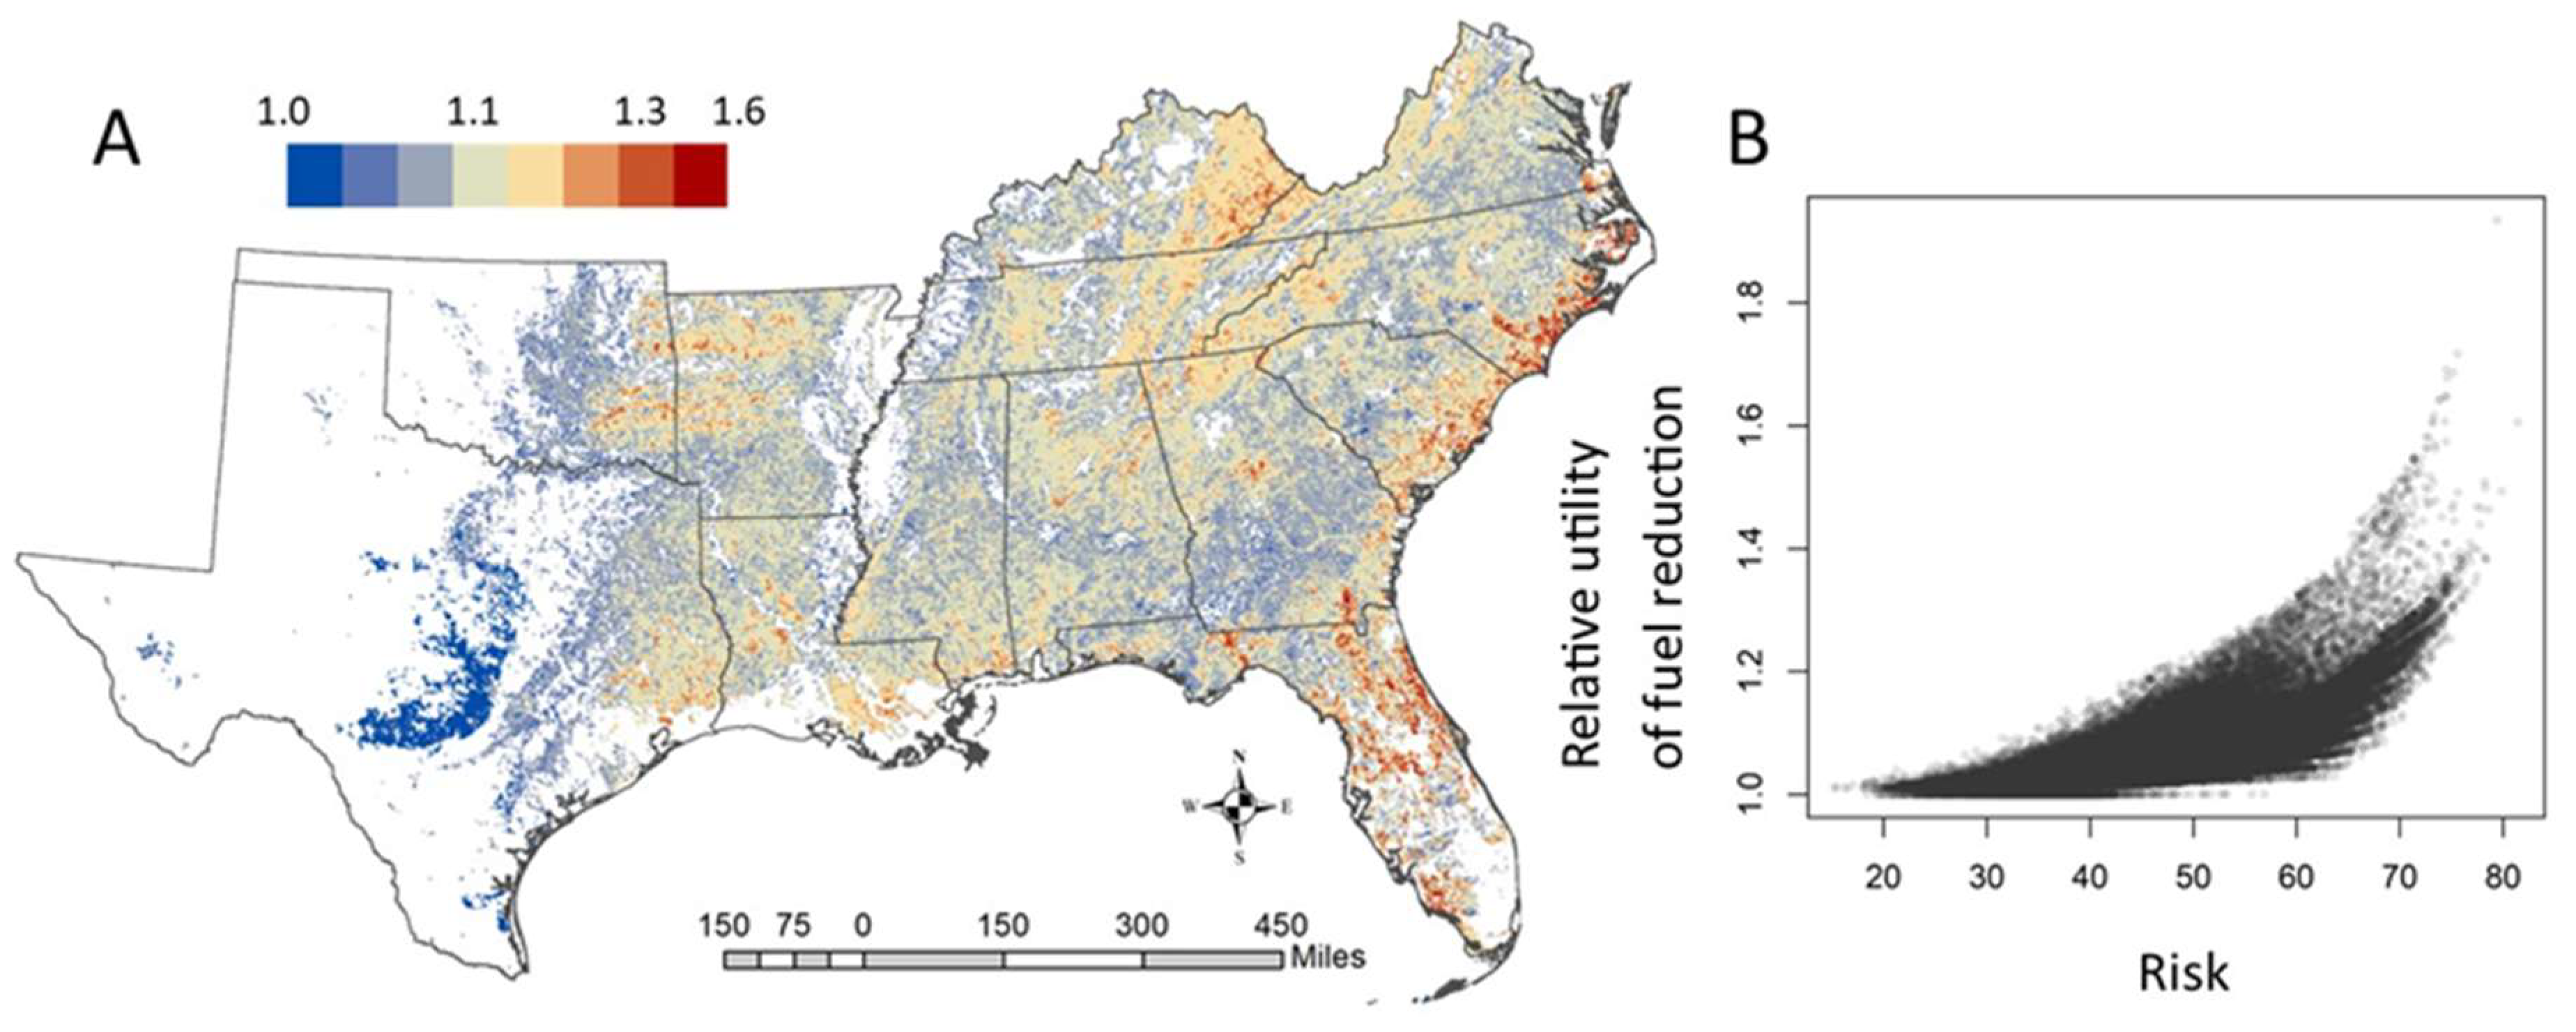
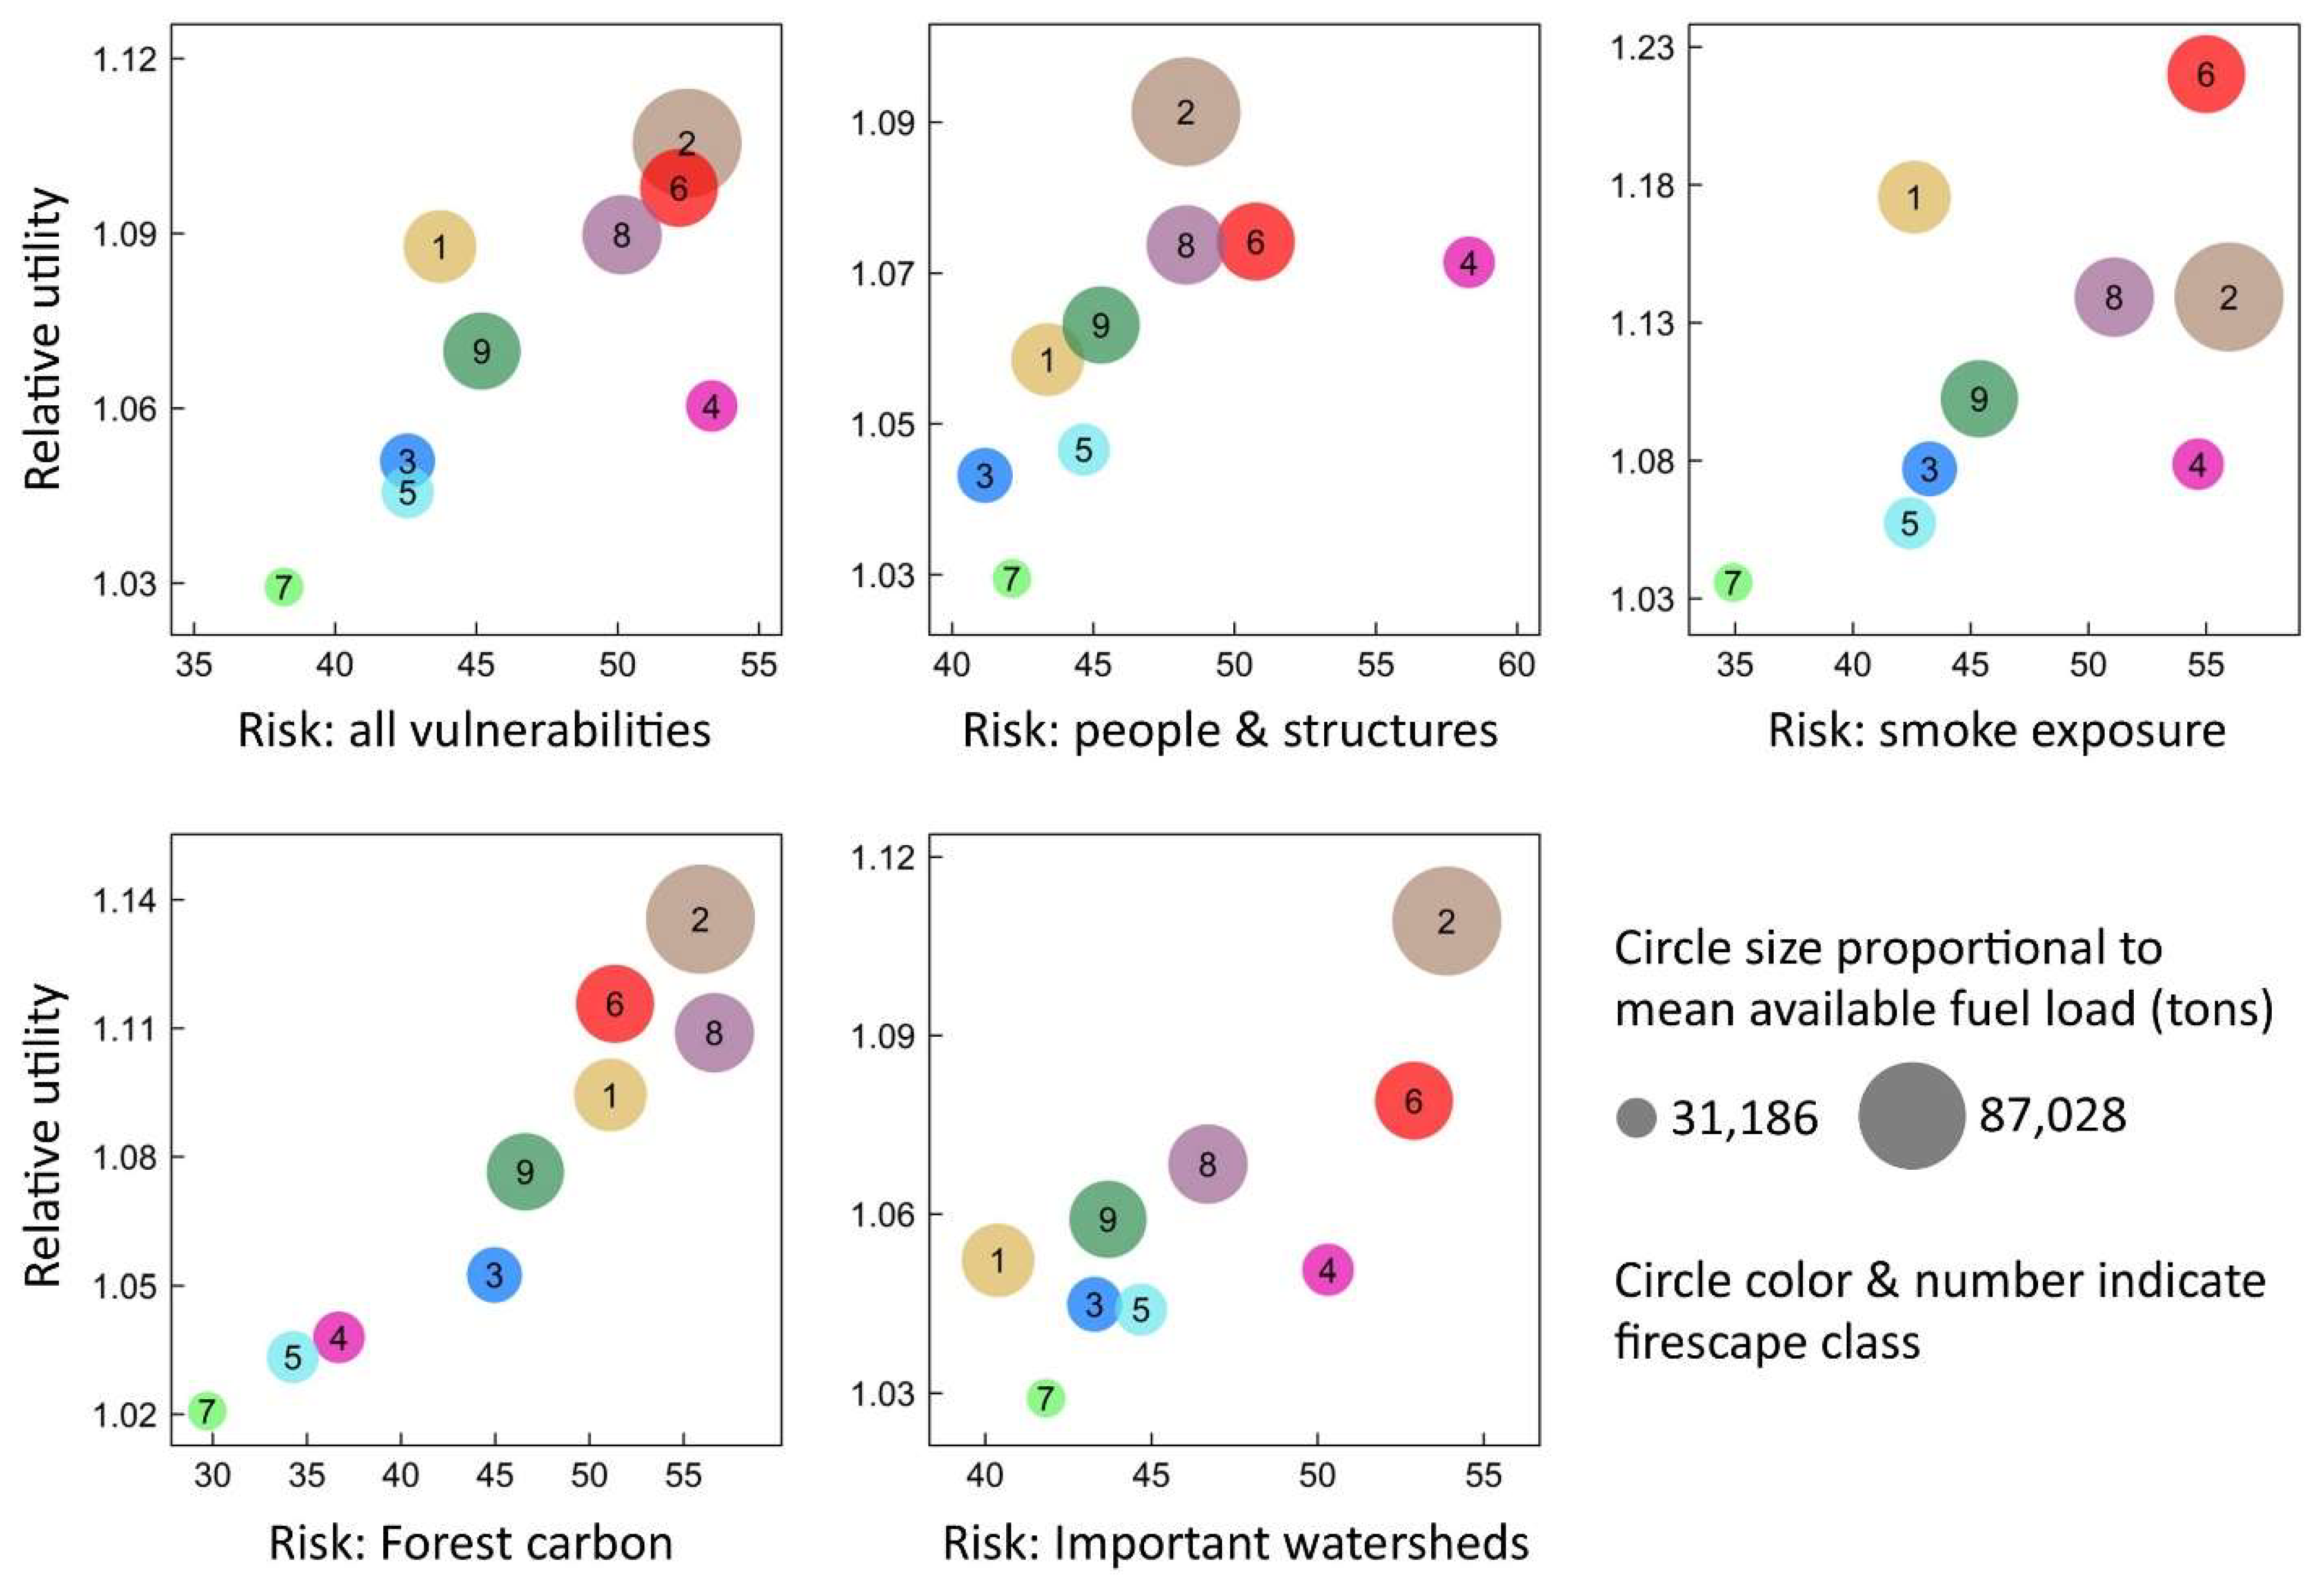
3.4. Utility of Fuel Reduction

The relative utility of fuel reductions for reducing risk (Figure 9) generally followed the spatial pattern of overall risk, as expected, given the parameterization of utility to favor risk reduction where risk was highest (compare Figure 7A and Figure 9A). Figure 9B shows this strong correlation (Pearson’s R = 0.76). However, there was variation in the relative utility among landscapes with similar levels of risk. For landscapes with above-average risk, this variation represented a considerable fraction of the total variation in relative utility (Figure 9B) (Appendix C shows the variation in relative utility among different vulnerabilities).
We also examined the variation in relative utility among firescape classes. The relative utility was positively correlated with risk among firescapes, but the relationship varied among the different social and ecosystem service vulnerabilities we examined (Figure 10). The relative utility was also positively associated with the mean fuel load among firescapes (also see fuel sensitivities, Section 3.5). For some vulnerabilities, the utility was lower or higher than expected on the basis of risk alone. For example, firescape 4 (peri-urban landscapes with high WUI proportions) showed a high risk for people and structures and for potential smoke exposure, but a lower than expected utility of fuel reductions to reduce these risks. This appeared to be related to the mean fuel load: low existing fuel loads constrained the capacity for fuel load reduction to influence the estimated risk.

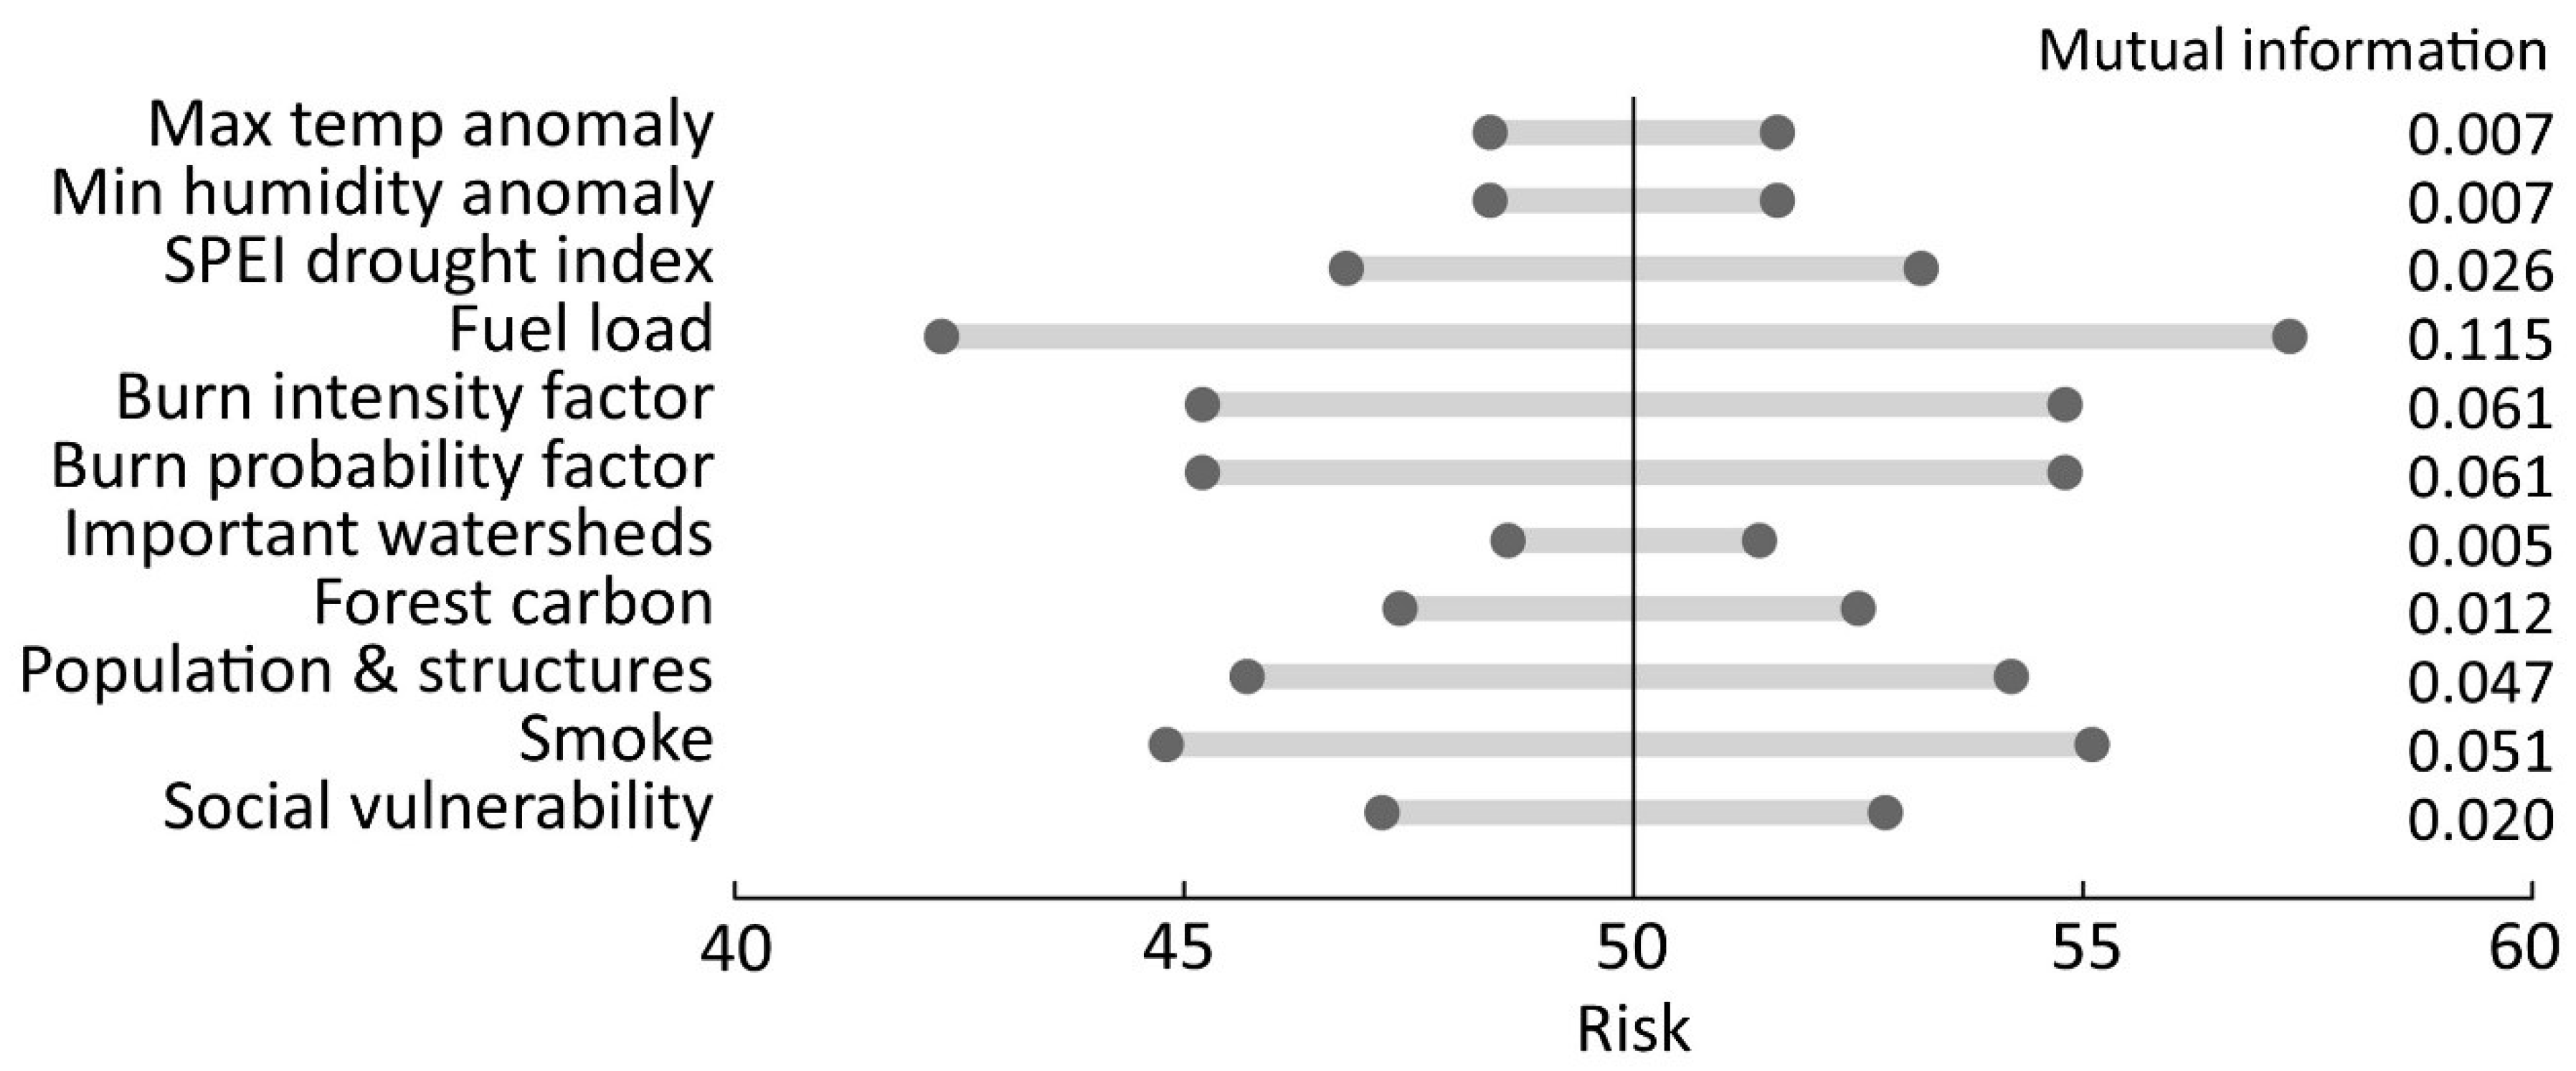
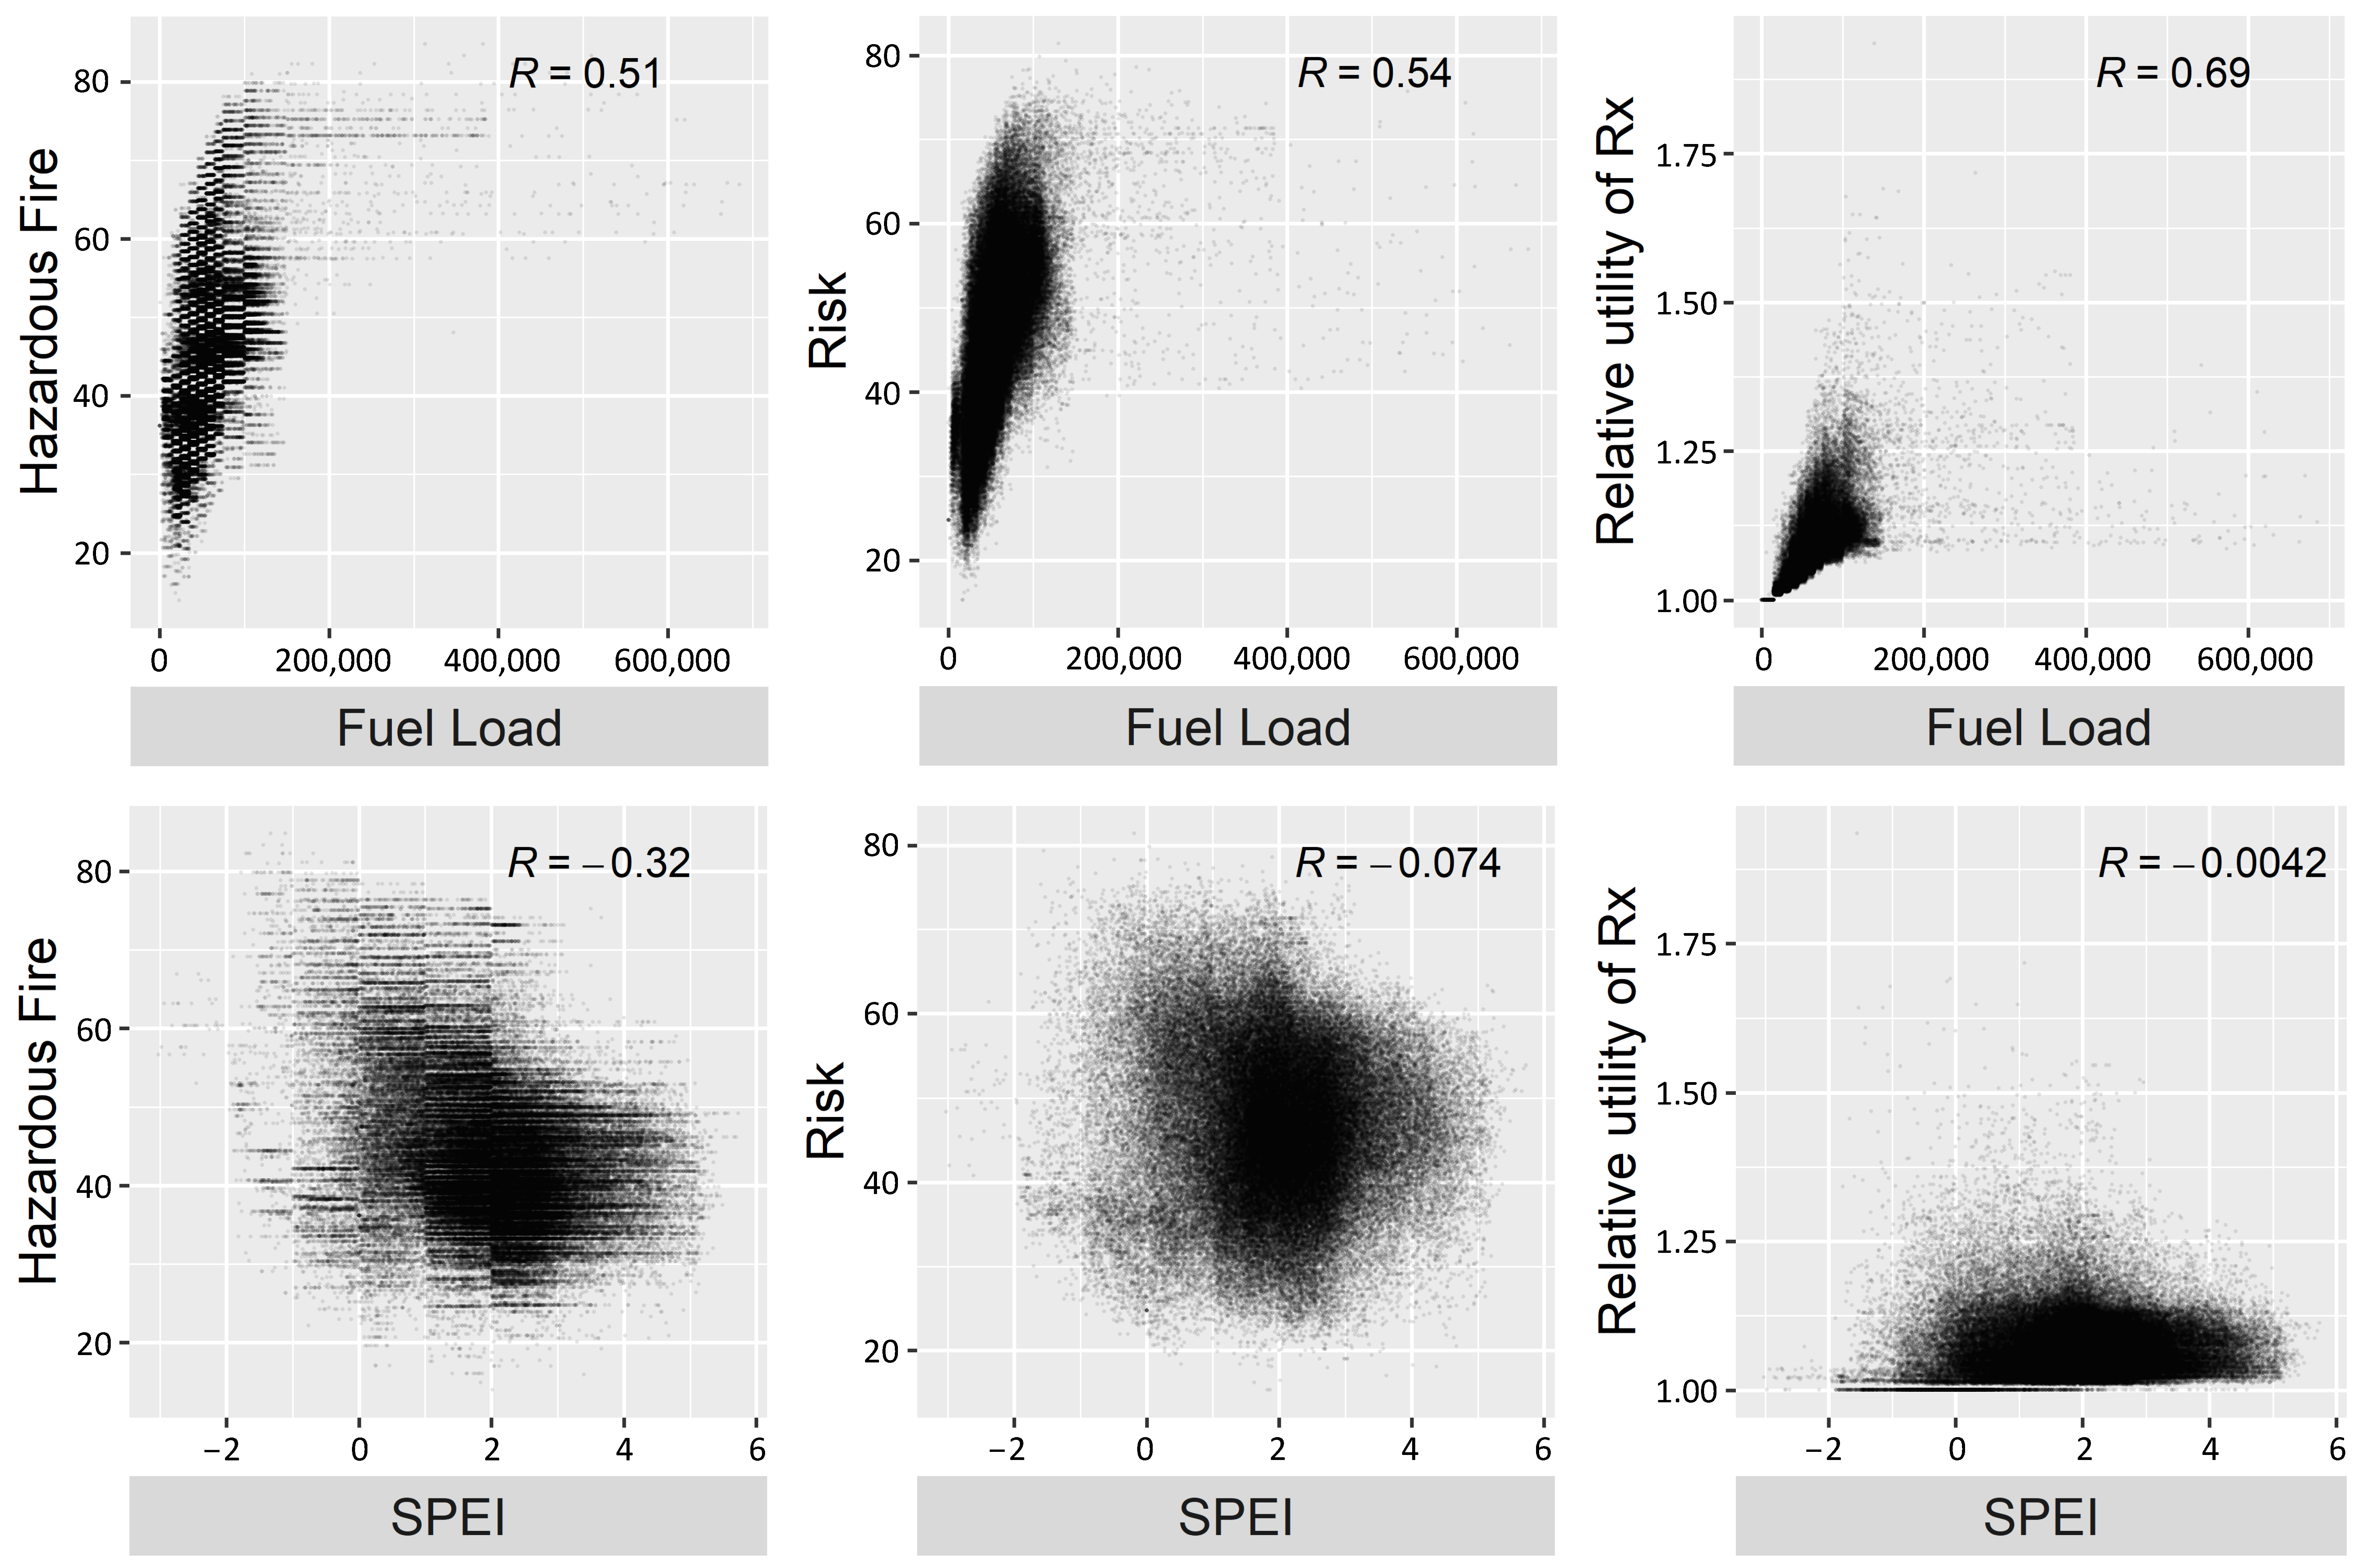
3.5. Sensitivity Analysis

The model sensitivity analysis showed that risk variation was most sensitive to changes in the fuel load (Figure 11), which is consistent with the observation of fuel sensitivities. Fuel load was clearly an important variable driving the model outputs, showing strong positive correlations with hazardous fire potential, all categories of wildfire risk, and the relative utility of fuel reduction (Table 2, Figure 12). The correlation with the relative utility of fuel reduction is consistent with the expectation that where a high fuel load is a driver of risk, there is the capacity to reduce risk by reducing those fuels. Among the variables representing recent climate extremes, the single strongest correlation was the negative correlation between the SPEI drought index and hazardous fire potential (Table 2, Figure 12). More-negative SPEI values indicate stronger drought. The monthly maximum temperature anomaly also showed moderate correlations with risk (Table 2).

4. Discussion

The model developed in this study and its associated spatial outputs can provide decision support for efforts to prioritize investments in wildfire risk management at broad spatial scales. The outputs quantify multiple distinctive spatial distributions of risk, depending on the different social and ecological values considered. Model estimates of the probable utility of fuel reduction suggest that the potential impact of fuel treatments also varies depending on landscape conditions, even among landscapes with similar levels of risk. Traditional risk assessment methods in the southern US region have been based on wildfire simulation models that examine fire likelihood and fire behavior but have not addressed spatial variation in socio-economic vulnerabilities, potential smoke exposure, or the role of fuel reduction in reducing risks to both people and ecosystem services [31,32,66,67,68]. We incorporated evidence from these and other studies to drive the BN model and quantify a broader set of risk measures, as well as potential outcomes from different management scenarios. We suggest that both traditional risk assessments, in which only risk is quantified, and explicit assessments of management scenarios are crucial for risk management decision making and provide complementary information [32,69].
Comparative risk assessments across landscapes are important because land management agencies have limited funds, typically insufficient to sustain treatments across all lands, and prioritizing landscapes becomes imperative to maximize effectiveness and efficiency [70]. Even if the funding and capacity to sustain treatments and other risk management strategies are significantly increased, decision support tools to inform strategic investment in those expanded efforts are still key for efficiency and accountability.
Florida and the Gulf and Atlantic coastal plains showed the highest values for hazardous fire potential and overall risk in the region. In the firescapes analysis that generated the factor variables used in our risk analysis, longleaf/slash pine and loblolly/shortleaf pine groups were important in the burn intensity factor, which also had its highest values in the coastal plains and Florida [37]. The pine-dominated forest and savannah systems in these areas have been considered to be among the most fire-prone systems in the world, and they depend on frequent, low-intensity fires (including prescribed fire) for the maintenance of system structure, function, and composition [71].
Although the mean precipitation can be high in these coastal plain systems, intermittent drought is an important factor driving fire frequency and severity, and climate change will likely continue to increase drought frequency and severity in the region [53]. Eastern Texas and Oklahoma also showed high values for hazardous fire potential and overall risk, partly driven by the hot and dry recent climate. This region experienced a historic drought in 2011, causing massive wildfire events, and again experienced a widespread drought in 2022 [72]. Climate change is a key factor driving growth in wildfire risk globally, and while we did not assess change over time in this study, it is plausible that the climate influences we quantified in these southern and western extremes of our study region are indicative of the future role of climate in some other parts of the region [53].
Because the estimated risk values are conditioned by social vulnerabilities, our results can help to identify communities at risk that are characterized by limited resources to prepare for, respond to, and recover from wildfire events. Social and infrastructure vulnerabilities weaken communities’ capacity to prevent and respond to the impacts of wildfire, and vulnerable communities are likely to need support before, during, and after wildfire events. Attention to broad-scale social vulnerability can inform risk management strategies, such as investments in prescribed fire in high-vulnerability landscapes. For example, the estimates of the relative utility of prescribed fire were comparatively high in the interior highlands of our study region, especially in the Ouachita, Ozark, and southern Appalachian Mountains. These areas are characterized by forests with high fuel loads, and there may therefore be a high capacity for risk reduction from a strictly biophysical perspective. These regions also show comparatively high social vulnerabilities (e.g., eastern Kentucky and eastern Oklahoma). Robust and carefully planned prescribed fire programs can be an important component of broader strategies in such locations to help communities prepare for, manage, and live safely with fire.
We used an all-forest-lands approach to estimate wildfire risks and the potential of fuel treatments to mitigate risk. Most forest lands in the Southern US are privately owned (86%), and ownership is highly fragmented, making it crucial to support coordinated landowner planning with public information resources that highlight the shared nature of wildfire risks in a landscape context [73,74]. Indeed, our findings suggest that while wildfire risks can vary locally across landscapes, the predominant drivers of risk operate at much larger spatial scales in the region, typically implying that the social and ecological drivers of risk and the capacities to manage risk are often shared across local ownership and jurisdictional boundaries.
The modeling approach used in this study is based on expert knowledge and stakeholder participation at all stages of research, with the goal of producing spatial information for prescribed fire planning in the Southern US. Given the diversity of forest landscapes, forest ownership, and forest management goals in the region, a collaborative approach can help identify shared or complementary objectives and structure an expert-driven and transparent analysis [39,75]. Collaboration not only tends to result in research outcomes that reflect the concerns of diverse stakeholders but can also improve planning coordination among groups [75,76]. Collaborative approaches to wildfire management have been shown to enhance community preparedness to confront risk, as well as the implementation of fuel reduction across different ownership types [77].
Prescribed fire management plans can be improved through the spatial and temporal scalability and transferability of the underlying analyses—both of which improve generalizability and adaptability [78]. Our model was designed with generality so it could be adapted to other geographic regions or scales or to different spatial units such as watersheds or other units commonly used for planning and decision making. However, the model’s variables, structure, and conditional probabilities are tailored to large landscape scales; we developed the model for a moderately broad level of spatial analysis (1000 ha hexagons). Its adaptation to finer scales might be parameterized differently depending on the operative variables and their causal relationships at those scales. Data availability may create limitations in regions where, for example, detailed fuel, social vulnerability, or smoke exposure data do not exist. But, key biophysical and social data, such as climate, wildfire potential, terrestrial carbon storage, population density, WUI, and urban development information, may be readily available from global or local products. Bayesian network models provide flexibility for such limitations, making them useful for adapting existing models to new contexts where more limited data can still be leveraged to provide meaningful wildfire risk information from simpler or coarser-scale models. Careful attention should be paid to potential re-parameterizations, informed by interactions with collaborating system experts and relevant empirical evidence, when considering model scalability and transferability.
A factor influencing the success of this assessment effort was the sufficiency and availability of scale-appropriate spatial data, given our goal of quantifying geographic gradients in risk and, ultimately, identifying target areas for fire management planning [79]. The BN model in this study combines spatial data from disparate sources, is flexible to the incorporation of new spatial variables, and is robust to missing values in the spatial inputs. The model can readily be updated as new spatial information becomes available, potentially representing changing conditions through time. For example, the model used recent climate inputs, but nodes for the climate variables can accept updated inputs in future years or inputs representing future climate projections. This makes the BN approach amenable to risk estimation in a monitoring framework or for projections under various scenarios of future change. The lack of representation of temporal variability (change over time) is indeed a limitation of our current model application. In addition to the possible monitoring and projection applications of our fixed model, a more detailed, explicitly dynamic BN model could be developed to quantify cumulative change across time steps. Dynamic BN models use time series probabilistic inference and still provide the advantages of network-based causal analyses under system uncertainty [80,81,82,83].

5. Summary

Assessing wildfire risk is a crucial component of wildfire management and risk mitigation planning. This study provides a systematic and flexible approach to evaluating comparative risk across landscapes and provides spatial information that can inform strategic investment in interventions such as prescribed fire. The collaborative, data-driven assessment approach leverages expert knowledge and rich regional landscape data to quantify spatial gradients in the potential impacts of wildfires on vulnerable people and ecosystem services. It also highlights the potential for cost-effective, targeted management investments to reduce risks. The model can serve as a decision support tool for stakeholders to coordinate strategic, large-landscape adaptive management efforts.
We found that, overall, wildfire risk is highly heterogenous across the Southeastern US, with the highest-risk landscapes concentrated in the coastal plains, Florida, and the interior highlands. Furthermore, the individual risk components (direct risk to people and structures, risk of smoke exposure, and risks to forest carbon and water) each showed distinctive distributions, potentially complexifying regional strategies to manage risks. The relative utility of fuel reductions for managing risk also showed strong spatial variability and could even vary locally among landscapes with similar levels of risk—suggesting that strategic targeting could improve the efficiency and effectiveness of management investments at broad scales.
The flexibility of our approach and model makes them adaptable to various contexts or extensions, including applications in other regions, at different spatial scales, at multiple time periods, and to evaluate different management objectives and options. The model could be applied in other geographic regions, subject to modification, to represent the most important dimensions of risk and landscape variability in the study region and to accommodate regional data availability. Even within a given region, as landscapes and climates continue to change, the approach can be used periodically to keep abreast of data updates and changing risk management challenges, to monitor management effectiveness, or to project dimensions of risk under future scenarios. Ecosystem management objectives and the tools for advancing those objectives also vary across landscapes and over time. These differences can be addressed through deliberation with stakeholders to implement appropriate model structures and management scenarios. In all cases, an integrated approach that makes full use of available knowledge and data, accounts for multiple dimensions of risk, and assesses potential risk management options is the key to moving forward.

Author Contributions

Conceptualization and methodology, D.C.L. and L.Y.P.; formal analysis and investigation, S.N., N.P.G. and L.Y.P.; data curation, S.N., N.P.G. and L.Y.P.; writing—original draft preparation, S.N. and L.Y.P.; writing—review and editing, S.N., N.P.G., D.C.L. and L.Y.P.; visualization, S.N. and L.Y.P.; project administration, D.C.L. and L.Y.P. All authors have read and agreed to the published version of the manuscript.

Funding

Funding provided by the USDA Forest Service.

Data Availability Statement

The data and model presented in this study are available in Zenodo and can be found in Nepal et al. [51].

Acknowledgments

This research was supported in part by an appointment to the United States Forest Service (USFS) Research Participation Program administered by the Oak Ridge Institute for Science and Education (ORISE) through an interagency agreement between the U.S. Department of Energy (DOE) and the U.S. Department of Agriculture (USDA). We thank Gary Wood, Southeast Regional Coordinator of the National Cohesive Wildland Fire Management Strategy; Andrew Baker, Brett Williams, Allan Hepworth, and Emrys Treasure at the USDA Forest Service Southern Region Regional Office; Scott Goodrick and Kristen Emmett at the USDA Forest Service Southern Research Station; and Curt Stripling at Texas A & M Forest Service, for their participation in developing an expert-driven analysis for wildfire risk assessment.

Conflicts of Interest

The authors declare no conflict of interest.

Appendix A

Factors used in Bayesian network model structure.
Table A1. Factor variables used in the Bayesian network model and their variable loadings, from Gould et al. [37]. Negative (inverse) loadings are indicated by negative values. Note that the Wildland urban interface (WUI) risk variable indicates higher risk with more negative values, so a negative loading indicates greater risk.
Factor 2: Wildfire Intensity and Fire-Prone ForestsLoadingsFactor 4: Population, Infrastructure and WUILoadingsFactor 6: Wildfire PotentialLoadingsFactor 7: Social VulnerabilityLoadings
Longleaf/Slash pine0.613Housing unit density0.989Risk to potential structures0.945SVI overall0.967
Proportion of watersheds with high-to-very high wildfire harzard potential0.557Population density0.989Burn Probability0.937SVI socio economic0.811
Flame length exceedance (8 ft)0.554Developed land cover0.856Wildfire hazard 0.718SVI housing and transportation0.755
Flame length exceedance (4 ft)0.536Proportion impervious0.672Threatened and endangered wildlife species0.341SVI household composition and disability0.604
Small non-stocked size class0.536Wildland urban interface0.350Threatened and endangered species total0.314SVI minority status and language0.428
Max downward radiation 0.463Wildland urban interface risk−0.651
Maximum temperature normal 0.436
Loblolly/Shortleaf pine0.409
Bottomland/Moist soil hardwood0.378
Wildfire hazard 0.344
SVI minority status and language0.343
Natural-caused fires, 2000–20180.330
Upland hardwood−0.819
Downstream drinking water population−0.719
Watershed importance for surface drinking water−0.623
Large forest stand size−0.407
SPEI normal (30-yr)−0.328

Appendix B

Bayesian network model in Netica software platform.
Figure A1. Bayesian network model as structured in the Netica software platform. Meter symbols indicate input variables represented as nodes with range of values for each input. The nodes are connected by arcs/links to show functional relationships between the variables. The decision node (blue box) includes two management scenarios: enhancement of fuel reduction program in the landscape, and no enhancement (business as usual) while the utility node (pink box) represents the value placed on a risk outcome, given a decision made.
Land 12 02172 g0a1

Appendix C

Relative utility of fuel reduction to reduce risk to people and ecosystem services.
Figure A2. Relative utility (i.e., the utility ratio) of fuel reduction for reducing risks to people and ecosystem services. Utility was positively correlated with mean risk, but this relationship varied among the different vulnerabilities we examined.
Land 12 02172 g0a2

References

  1. Radeloff, V.C.; Helmers, D.P.; Kramer, H.A.; Mockrin, M.H.; Alexandre, P.M.; Bar-Massada, A.; Butsic, V.; Hawbaker, T.J.; Martinuzzi, S.; Syphard, A.D.; et al. Rapid growth of the US wildland-urban interface raises wildfire risk. Proc. Natl. Acad. Sci. USA 2018, 115, 3314–3319. [Google Scholar] [CrossRef] [PubMed]
  2. USDA Forest Service. Confronting the Wildfire Crisis: A Strategy for Protecting Communities and Improving Resilience in America’s Forests; FS-1187a; USDA Forest Service: Washington, DC, USA, 2022.
  3. Vose, J.M.; Peterson, D.L.; Fettig, C.J.; Halofsky, J.E.; Hiers, J.K.; Keane, R.E.; Loehman, R.; Stambaugh, M.C. Fire and Forests in the 21st Century: Managing Resilience Under Changing Climates and Fire Regimes in USA Forests. In Fire Ecology and Management: Past, Present, and Future of US Forested Ecosystems; Greenberg, C.H., Collins, B., Eds.; Springer: Cham, Switzerland, 2021; pp. 465–502. [Google Scholar]
  4. Kelly, L.T.; Giljohann, K.M.; Duane, A.; Aquilue, N.; Archibald, S.; Batllori, E.; Bennett, A.F.; Buckland, S.T.; Canelles, Q.; Clarke, M.F.; et al. Fire and biodiversity in the Anthropocene. Science 2020, 370, eabb0355. [Google Scholar] [CrossRef] [PubMed]
  5. Reid, C.E.; Brauer, M.; Johnston, F.H.; Jerrett, M.; Balmes, J.R.; Elliott, C.T. Critical Review of Health Impacts of Wildfire Smoke Exposure. Environ. Health Perspect. 2016, 124, 1334–1343. [Google Scholar] [CrossRef] [PubMed]
  6. Thompson, M.P.; Calkin, D.E. Uncertainty and risk in wildland fire management: A review. J. Environ. Manag. 2011, 92, 1895–1909. [Google Scholar] [CrossRef] [PubMed]
  7. Dunn, C.J.; O’Connor, C.D.; Abrams, J.; Thompson, M.P.; Calkin, D.E.; Johnston, J.D.; Stratton, R.; Gilbertson-Day, J. Wildfire risk science facilitates adaptation of fire-prone social-ecological systems to the new fire reality. Environ. Res. Lett. 2020, 15, 025001. [Google Scholar] [CrossRef]
  8. Ager, A.A.; Kline, J.D.; Fischer, A.P. Coupling the Biophysical and Social Dimensions of Wildfire Risk to Improve Wildfire Mitigation Planning. Risk Anal. 2015, 35, 1393–1406. [Google Scholar] [CrossRef] [PubMed]
  9. Davies, I.P.; Haugo, R.D.; Robertson, J.C.; Levin, P.S. The unequal vulnerability of communities of color to wildfire. PLoS ONE 2018, 13, e0205825. [Google Scholar] [CrossRef]
  10. Palaiologou, P.; Ager, A.A.; Nielsen-Pincus, M.; Evers, C.R.; Day, M.A. Social vulnerability to large wildfires in the western USA. Landsc. Urban Plan 2019, 189, 99–116. [Google Scholar] [CrossRef]
  11. Scott, J.H.; Thompson, M.P.; Calkin, D.E. A Wildfire Risk Assessment Framework for Land and Resource Management; Gen. Tech. Rep. RMRS-GTR-315; USDA Forest Service, Rocky Mountain Research Station: Fort Collins, CO, USA, 2013; 83p.
  12. EPA. Comparative Assessment of the Impacts of Prescribed Fire versus Wildfire (CAIF): A Case Study in the Western U.S.; EPA: Washington, DC, USA, 2021.
  13. Hunter, M.E.; Robles, M.D. Tamm review: The effects of prescribed fire on wildfire regimes and impacts: A framework for comparison. For. Ecol. Manag. 2020, 475, 118435. [Google Scholar] [CrossRef]
  14. Ott, J.E.; Kilkenny, F.F.; Jain, T.B. Fuel treatment effectiveness at the landscape scale: A systematic review of simulation studies comparing treatment scenarios in North America. Fire Ecol. 2023, 19, 10. [Google Scholar] [CrossRef]
  15. Urza, A.K.; Hanberry, B.B.; Jain, T.B. Landscape-scale fuel treatment effectiveness: Lessons learned from wildland fire case studies in forests of the western United States and Great Lakes region. Fire Ecol. 2023, 19, 1. [Google Scholar] [CrossRef]
  16. Fernandes, P.M. Empirical Support for the Use of Prescribed Burning as a Fuel Treatment. Curr. For. Rep. 2015, 1, 118–127. [Google Scholar] [CrossRef]
  17. Stephens, S.L.; McIver, J.D.; Boerner, R.E.J.; Fettig, C.J.; Fontaine, J.B.; Hartsough, B.R.; Kennedy, P.L.; Schwilk, D.W. The Effects of Forest Fuel-Reduction Treatments in the United States. BioScience 2012, 62, 549–560. [Google Scholar] [CrossRef]
  18. Addington, R.N.; Hudson, S.J.; Hiers, J.K.; Hurteau, M.D.; Hutcherson, T.F.; Matusick, G.; Parker, J.M. Relationships among wildfire, prescribed fire, and drought in a fire-prone landscape in the south-eastern United States. Int. J. Wildland Fire 2015, 24, 778–783. [Google Scholar] [CrossRef]
  19. Arkle, R.S.; Pilliod, D.S.; Welty, J.L. Pattern and process of prescribed fires influence effectiveness at reducing wildfire severity in dry coniferous forests. For. Ecol. Manag. 2012, 276, 174–184. [Google Scholar] [CrossRef]
  20. Moritz, M.A.; Hazard, R.; Johnston, K.; Mayes, M.; Mowery, M.; Oran, K.; Parkinson, A.M.; Schmidt, D.A.; Wesolowski, G. Beyond a Focus on Fuel Reduction in the WUI: The Need for Regional Wildfire Mitigation to Address Multiple Risks. Front. For. Glob. Chang. 2022, 5, 848254. [Google Scholar] [CrossRef]
  21. Merritta, W.S.; Ticehursta, J.L.; Pollinoa, C.; Fua, B. The value of using Bayesian Networks in Environmental Decision Support Systems to support natural resource management. In Proceedings of the 5th International Congress on Environmental Modelling and Software, Ottawa, ON, Canada, 5–8 July 2010. [Google Scholar]
  22. Conroy, M.J.; Peterson, J.T. Decision Making in Natural Resource Management: A Structured, Adaptive Approach; Wiley-Blackwell: Oxford, UK, 2013; p. 456. [Google Scholar]
  23. Penman, T.D.; Cirulis, B.; Marcot, B.G. Bayesian decision network modeling for environmental risk management: A wildfire case study. J. Environ. Manag. 2020, 270, 110735. [Google Scholar] [CrossRef]
  24. Dlamini, W.M. A Bayesian belief network analysis of factors influencing wildfire occurrence in Swaziland. Environ. Model. Softw. 2010, 25, 199–208. [Google Scholar] [CrossRef]
  25. Carriger, J.F.; Thompson, M.; Barron, M.G. Causal Bayesian networks in assessments of wildfire risks: Opportunities for ecological risk assessment and management. Integr. Environ. Assess. 2021, 17, 1168–1178. [Google Scholar] [CrossRef]
  26. Sevinc, V.; Kucuk, O.; Goltas, M. A Bayesian network model for prediction and analysis of possible forest fire causes. For. Ecol. Manag. 2020, 457, 117723. [Google Scholar] [CrossRef]
  27. Zwirglmaier, K.; Papakosta, P.; Straub, D. Learning a Bayesian network model for predicting wildfire behavior. In Proceedings of the 11th International Conference on Structural Safety and Reliability, New York, NY, USA, 16–20 June 2013. [Google Scholar]
  28. Liu, S.; McGree, J.; Ge, Z.; Xie, Y. 2—Classification Methods. In Computational and Statistical Methods for Analysing Big Data with Applications; Liu, S., McGree, J., Ge, Z., Xie, Y., Eds.; Academic Press: San Diego, CA, USA, 2016; pp. 7–28. [Google Scholar]
  29. McCann, R.K.; Marcot, B.G.; Ellis, R. Bayesian belief networks: Applications in ecology and natural resource management. Can. J. For. Res. 2006, 36, 3053–3062. [Google Scholar] [CrossRef]
  30. Pollino, C.A.; Henderson, C. Bayesian networks: A guide for their application in natural resource management and policy. Landsc. Log. Tech. Rep. 2010, 14, 48. [Google Scholar]
  31. Scott, J.H.; Brough, A.M.; Gilbertson-Day, J.W.; Dillon, G.K.; Moran, C. Wildfire Risk to Communities: Methods for Geospatial Datasets for Populated Areas in the United States; USDA, Forest Service Research Data Archive: Fort Collins, CO, USA, 2020. [CrossRef]
  32. Thompson, M.P.; Scott, J.; Helmbrecht, D.; Calkin, D.E. Integrated wildfire risk assessment: Framework development and application on the Lewis and Clark National Forest in Montana, USA. Integr. Environ. Assess. Manag. 2013, 9, 329–342. [Google Scholar] [CrossRef] [PubMed]
  33. Kobziar, L.N.; Godwin, D.; Taylor, L.; Watts, A.C. Perspectives on trends, effectiveness, and impediments to prescribed burning in the southern US. Forests 2015, 6, 561–580. [Google Scholar] [CrossRef]
  34. Marcot, B.G.; Steventon, J.D.; Sutherland, G.D.; McCann, R.K. Guidelines for developing and updating Bayesian belief networks applied to ecological modeling and conservation. Can. J. For. Res. 2006, 36, 3063–3074. [Google Scholar] [CrossRef]
  35. Mitchell, R.J.; Liu, Y.; O’Brien, J.J.; Elliott, K.J.; Starr, G.; Miniat, C.F.; Hiers, J.K. Future climate and fire interactions in the southeastern region of the United States. For. Ecol. Manag. 2014, 327, 316–326. [Google Scholar] [CrossRef]
  36. Stanturf, J.A.; Goodrick, S.L. Fire. In The Southern Forest Futures Project; Gen. Tech. Rep. SRS-GTR-178; Wear, D.N., Greis, J.G., Eds.; U.S. Department of Agriculture, Forest Service, Southern Research Station: Asheville, NC, USA, 2013; pp. 509–542. [Google Scholar]
  37. Gould, N.P.; Pomara, L.Y.; Nepal, S.; Goodrick, S.L.; Lee, D.C. Mapping firescapes for wild and prescribed fire management: A landscape classification approach. Land 2023, in press. [Google Scholar]
  38. Smith, A.M.S.; Kolden, C.A.; Paveglio, T.B.; Cochrane, M.A.; Bowman, D.M.J.S.; Moritz, M.A.; Kliskey, A.D.; Alessa, L.; Hudak, A.T.; Hoffman, C.M.; et al. The Science of Firescapes: Achieving Fire-Resilient Communities. Bioscience 2016, 66, 130–146. [Google Scholar] [CrossRef]
  39. Wildland Fire Leadership Council. The National Strategy: The Final Phase in the Development of the National Cohesive Wildland Fire Management Strategy; United States Department of Agriculture and United States Department of the Interior: Washington, DC, USA, 2014; pp. 1–93.
  40. Brownell, K.D.; Roberto, C.A. Strategic science with policy impact. Lancet 2015, 385, 2445–2446. [Google Scholar] [CrossRef]
  41. Lemos, M.C.; Morehouse, B.J. The co-production of science and policy in integrated climate assessments. Glob. Environ. Chang. 2005, 15, 57–68. [Google Scholar] [CrossRef]
  42. Parviainen, T.; Kuikka, S.; Haapasaari, P. Enhancing science-policy interface in marine environmental governance: Oil spill response models as boundary objects in the Gulf of Finland, Baltic Sea. Mar. Policy 2022, 135, 104863. [Google Scholar] [CrossRef]
  43. Moe, S.J.; Carriger, J.F.; Glendell, M. Increased Use of Bayesian Network Models Has Improved Environmental Risk Assessments. Integr. Environ. Assess. Manag. 2021, 17, 53–61. [Google Scholar] [CrossRef] [PubMed]
  44. Kaikkonen, L.; Parviainen, T.; Rahikainen, M.; Uusitalo, L.; Lehikoinen, A. Bayesian Networks in Environmental Risk Assessment: A Review. Integr. Environ. Assess. Manag. 2021, 17, 62–78. [Google Scholar] [CrossRef] [PubMed]
  45. Turner, B.L.; Kasperson, R.E.; Matson, P.A.; McCarthy, J.J.; Corell, R.W.; Christensen, L.; Eckley, N.; Kasperson, J.X.; Luers, A.; Martello, M.L.; et al. A framework for vulnerability analysis in sustainability science. Proc. Natl. Acad. Sci. USA 2003, 100, 8074–8079. [Google Scholar] [CrossRef] [PubMed]
  46. Norsys Software Corp. Bayes Network Software. Available online: https://www.norsys.com/ (accessed on 28 August 2020).
  47. Havron, A.; Goldfinger, C.; Henkel, S.; Marcot, B.G.; Romsos, C.; Gilbane, L. Mapping marine habitat suitability and uncertainty of Bayesian networks: A case study using Pacific benthic macrofauna. Ecosphere 2017, 8, e01859. [Google Scholar] [CrossRef]
  48. Shojaei Estabragh, Z.; Riahi Kashani, M.M.; Jeddi Moghaddam, F.; Sari, S.; Taherifar, Z.; Moradi Moosavy, S.; Sadeghi Oskooyee, K. Bayesian network modeling for diagnosis of social anxiety using some cognitive-behavioral factors. Netw. Model. Anal. Health Inform. Bioinform. 2013, 2, 257–265. [Google Scholar] [CrossRef]
  49. Wilhere, G.F. Using Bayesian networks to incorporate uncertainty in habitat suitability index models. J. Wildl. Manag. 2012, 76, 1298–1309. [Google Scholar] [CrossRef]
  50. Zou, X.; Yue, W.L. A Bayesian Network Approach to Causation Analysis of Road Accidents Using Netica. J. Adv. Transp. 2017, 2017, 2525481. [Google Scholar] [CrossRef]
  51. Nepal, S.; Pomara, L.Y.; Gould, N.P.; Lee, D.C. Wildfire Risk Assessment for Strategic Forest Management in the Southern United States: A Bayesian Network Modeling Approach [Data Set]; Zenodo: Geneva, Switzerland, 2023. [Google Scholar] [CrossRef]
  52. LANDFIRE. Fuel Charactersistic Classification System Fuelbeds 2022, LANDFIRE 2.2.0. Available online: https://www.landfire.gov/version_download.php (accessed on 3 May 2022).
  53. Costanza, J.K.; Koch, F.H.; Reeves, M.C. Future exposure of forest ecosystems to multi-year drought in the United States. Ecosphere 2023, 14, e4525. [Google Scholar] [CrossRef]
  54. McEvoy, D.J.; Hobbins, M.; Brown, T.J.; VanderMolen, K.; Wall, T.; Huntington, J.L.; Svoboda, M. Establishing Relationships between Drought Indices and Wildfire Danger Outputs: A Test Case for the California-Nevada Drought Early Warning System. Climate 2019, 7, 52. [Google Scholar] [CrossRef]
  55. Joyce, L.A.; Coulson, D.P. RPA Historical Observational Data (1979–2015) for the Conterminous United States at the 1/24 Degree Grid Scale Based on MACA Training Data (METDATA), 2nd ed.; U.S. Department of Agriculture: Washington, DC, USA, 2020. [CrossRef]
  56. Abatzoglou, J.T. Development of gridded surface meteorological data for ecological applications and modelling. Int. J. Climatol. 2013, 33, 121–131. [Google Scholar] [CrossRef]
  57. Abatzoglou, J.T.; Brown, T.J. A comparison of statistical downscaling methods suited for wildfire applications. Int. J. Climatol. 2012, 32, 772–780. [Google Scholar] [CrossRef]
  58. Vicente-Serrano, S.M.; Beguería, S.; López-Moreno, J.I. A multiscalar drought index sensitive to global warming: The standardized precipitation evapotranspiration index. J. Clim. 2010, 23, 1696–1718. [Google Scholar] [CrossRef]
  59. Kondo, M.C.; Reid, C.E.; Mockrin, M.H.; Heilman, W.E.; Long, D. Socio-demographic and health vulnerability in prescribed-burn exposed versus unexposed counties near the National Forest System. Sci. Total Environ. 2022, 806, 150564. [Google Scholar] [CrossRef] [PubMed]
  60. Gaither, C.; Goodrick, S.; Murphy, B.; Poudyal, N. An Exploratory Spatial Analysis of Social Vulnerability and Smoke Plume Dispersion in the U.S. South. Forests 2015, 6, 1397–1421. [Google Scholar] [CrossRef]
  61. Wilson, B.T.; Knight, J.F.; McRoberts, R.E. Harmonic regression of Landsat time series for modeling attributes from national forest inventory data. ISPRS J. Photogramm. Remote Sens. 2018, 137, 29–46. [Google Scholar] [CrossRef]
  62. Wilson, B.T.; Lister, A.J.; Riemann, R.I. A nearest-neighbor imputation approach to mapping tree species over large areas using forest inventory plots and moderate resolution raster data. For. Ecol. Manag. 2012, 271, 182–198. [Google Scholar] [CrossRef]
  63. Mack, E.; Lilja, R.; Claggett, S.; Sun, G.; Caldwell, P. Forests to Faucets 2.0: Connecting Forests, Water, and Communities; GTR-WO-99; United States Department of Agriculture Forest Service: Washington, DC, USA, 2022; p. 19.
  64. Pearl, J. Probabilistic Reasoning in Intelligent Systems: Networks of Plausible Inference; Revised Second Printing, Revised & Updated Edition; Morgan Kaufmann Publishers: San Francisco, CA, USA, 1988. [Google Scholar]
  65. Steuer, R.; Kurths, J.; Daub, C.O.; Weise, J.; Selbig, J. The mutual information: Detecting and evaluating dependencies between variables. Bioinformatics 2002, 18, S231–S240. [Google Scholar] [CrossRef]
  66. Wear, D.N.; Greis, J.G. The Southern Forest Futures Project: Technical Report; SRS-178; US Department of Agriculture Forest Service: Washington, DC, USA, 2013; p. 542.
  67. Gramley, M. Fire in the South: A Report by the Southern Group of State Foresters; Southern Group of State Foresters: Winder, GA, USA, 2005; Volume 177. [Google Scholar]
  68. Dillon, G.K.; Menakis, J.; Fay, F. Wildland fire potential: A tool for assessing wildfire risk and fuels management needs. In Proceedings of the Large Wildland Fires Conference, Missoula, MT, USA, 19–23 May 2014; pp. 60–76. [Google Scholar]
  69. Finney, M.A.; McHugh, C.W.; Grenfell, I.C.; Riley, K.L.; Short, K.C. A simulation of probabilistic wildfire risk components for the continental United States. Stoch. Environ. Res. Risk Assess. 2011, 25, 973–1000. [Google Scholar] [CrossRef]
  70. Kreitler, J.; Thompson, M.P.; Vaillant, N.M.; Hawbaker, T.J. Cost-effective fuel treatment planning: A theoretical justification and case study. Int. J. Wildland Fire 2020, 29, 42–56. [Google Scholar] [CrossRef]
  71. Noss, R.F. Fire Ecology of Florida and the Southeastern Coastal Plain; University Press of Florida: Gainesville, FL, USA, 2018. [Google Scholar]
  72. National Drought Mitigation Center. Percent Area in U.S. Drought Monitor Categories. Available online: https://droughtmonitor.unl.edu/About.aspx (accessed on 26 October 2022).
  73. Hoover, K.; Riddle, A.A. U.S. Forest Ownership and Management: Background and Issues for Congress; CRS Report-R46976; Congressional Research Service: Washington, DC, USA, 2021.
  74. Stroman, D.A.; Kreuter, U.P.; Wonkka, C.L. Landowner perceptions of woody plants and prescribed fire in the Southern Plains, USA. PLoS ONE 2020, 15, e0238688. [Google Scholar] [CrossRef] [PubMed]
  75. Palsa, E.; Bauer, M.; Evers, C.; Hamilton, M.; Nielsen-Pincus, M. Engagement in local and collaborative wildfire risk mitigation planning across the western U.S.-Evaluating participation and diversity in Community Wildfire Protection Plans. PLoS ONE 2022, 17, e0263757. [Google Scholar] [CrossRef] [PubMed]
  76. Abreu, S.J.D. Toward a Holistic Approach: Considerations for Improved Collaboration in Wildfire Management. Open J. For. 2022, 12, 107–121. [Google Scholar] [CrossRef]
  77. Sturtevant, V.; Jakes, P. Collaborative Planning to Reduce Risk. In Wildfire Risk: Human Perceptions and Management Implications; Martin, W.E., Raish, C., Kent, B., Eds.; Routledge: New York, NY, USA, 2007; pp. 44–64. [Google Scholar]
  78. Schultz, C.A.; Thompson, M.P.; McCaffrey, S.M. Forest Service fire management and the elusiveness of change. Fire Ecol. 2019, 15, 13. [Google Scholar] [CrossRef]
  79. Thompson, M.P.; Bowden, P.; Brough, A.; Scott, J.H.; Gilbertson-Day, J.; Taylor, A.; Anderson, J.; Haas, J.R. Application of Wildfire Risk Assessment Results to Wildfire Response Planning in the Southern Sierra Nevada, California, USA. Forests 2016, 7, 64. [Google Scholar] [CrossRef]
  80. Wang, H.; Khan, F.; Chen, B.; Lu, Z. An Approximate Modelling Method for Industrial l-lysine Fermentation Process. In Computer Aided Chemical Engineering; Gernaey, K.V., Huusom, J.K., Gani, R., Eds.; Elsevier: Amsterdam, The Netherlands, 2015; Volume 37, pp. 461–466. [Google Scholar]
  81. Chee, Y.E.; Wilkinson, L.; Nicholson, A.E.; Quintana-Ascencio, P.F.; Fauth, J.E.; Hall, D.; Ponzio, K.J.; Rumpff, L. Modelling spatial and temporal changes with GIS and Spatial and Dynamic Bayesian Networks. Environ. Model. Softw. 2016, 82, 108–120. [Google Scholar] [CrossRef]
  82. Marcot, B.G.; Penman, T.D. Advances in Bayesian network modelling: Integration of modelling technologies. Environ. Model. Softw. 2019, 111, 386–393. [Google Scholar] [CrossRef]
  83. Rachid, G.; Alameddine, I.; Najm, M.A.; Qian, S.; El-Fadel, M. Dynamic Bayesian Networks to Assess Anthropogenic and Climatic Drivers of Saltwater Intrusion: A Decision Support Tool Toward Improved Management. Integr. Environ. Assess. Manag. 2021, 17, 202–220. [Google Scholar] [CrossRef]
Figure 1. Wildfire risk assessment with Bayesian network modeling included expert elicitation, model development, and spatial application of the model using a large-landscape, regional data synthesis.
Land 12 02172 g001
Figure 2. The study area included all lands in thirteen states in the Southern United States with at least 25% forest cover within 1000-hectare landscapes. In a separate analysis, landscapes were classified into nine firescapes, each having distinct social and ecological characteristics relevant to fire and its associated risks [37]. Firescape class numbers correspond to the descriptions in Table 1.
Land 12 02172 g002
Figure 3. Graphical structure of Bayesian network model with variables that influence wildfire risk and the utility of fuel reductions for reducing risk. Blue boxes represent data inputs—the model incorporates both individual variables and factors from the factor analysis [37]. A decision node (green box) includes two management scenarios: enhanced fuel reduction efforts, or no change (business as usual). A utility node (yellow box) quantifies the value placed on a risk outcome, given a decision made. Netica version of the BN model is included in Appendix B.
Land 12 02172 g003
Figure 4. Input variables for the Bayesian network model quantifying wildfire risk. These variables are shown in blue in Figure 3. The four variables described as factors are results of the factor analysis of a large set of relevant spatial variables [37].
Land 12 02172 g004
Figure 5. Potential wildfire exposure and its determinants corresponding to latent BN model nodes with the same names as in Figure 3. (A) Potential for hazardous fire conditioned on wildfire potential and probable burn intensity; (B) recent climate; (C) burn intensity; (D) fuel load; and (E) wildfire potential.
Land 12 02172 g005
Figure 6. Vulnerable people and ecosystem services. (A) Combined vulnerability conditioned on the following four components: (B) important watersheds, weighted by social vulnerability; (C) population and structures, weighted by social vulnerability; (D) forest carbon stocks; and (E) unsafe smoke emissions reaching human populations, weighted by social vulnerability. Legend applies to all five maps.
Land 12 02172 g006
Figure 7. Expected wildfire risk given the existing landscape conditions. (A) Combined risk conditioned on the following four components: (B) risk to important watersheds, weighted by social vulnerability; (C) risk to population and structures, weighted by social vulnerability; (D) risk to forest carbon stocks; and (E) risk from unsafe smoke emissions reaching human populations, weighted by social vulnerability. Legend applies to all five maps.
Land 12 02172 g007
Figure 8. Variation in estimated wildfire risk (all vulnerabilities combined) among and within firescape classes. Boxplots indicate the distribution of risk values among landscapes within a given firescape class (Figure 2), with classes ordered by increasing median risk. Under the assumptions of our model, new investments in fuel reduction had the potential to reduce risk in each firescape class, but this varied among classes.
Land 12 02172 g008
Figure 9. Relative utility of fuel reduction for reducing wildfire risks. (A) Relative utility for reducing combined risks from smoke exposure and direct fire exposure to people and structures, forest carbon, and important watersheds. (B) Relative utility was generally high where risk was high, but considerable variation in utility existed for a given level of risk. Each point in the chart is an individual 1000 ha landscape with at least 25% forest cover.
Land 12 02172 g009
Figure 10. Variation among firescape classes in the mean relative utility of fuel reductions for reducing risk (y-axes). Utility was positively correlated with mean risk (x-axes) among firescapes, but this relationship varied among the different vulnerabilities we examined. Low utility was generally associated with low fuel load. Circle numbers and colors correspond to firescapes (Figure 2).
Land 12 02172 g010
Figure 11. Sensitivity to model input variables of the overall (combined) wildfire risk in the BN model. Bars show the range of values risk takes across the range of possible values in the input variable, holding other variables at their uninformed prior values. Mutual information is an estimator of how well the distribution of values in the outcome variable can be predicted from the distribution of values in the input variable.
Land 12 02172 g011
Figure 12. Relationships between model outcomes, climate variables, and total available fuels. Points are individual 1000 ha landscapes. The SPEI drought index is for the 2019–2021 period. Forest fuel load is in tons. Risk is overall risk, combining the four people and ecosystem service vulnerabilities examined in this study. Relative utility of Rx refers to the utility of fuel reductions (via prescribed fire) for reducing overall risk.
Land 12 02172 g012
Table 1. Firescape classification of landscapes with at least 25% forest cover in the Southern US, generated from factor and cluster analyses of 73 spatial variables, as described by Gould et al. [37]. Spatial distributions of these firescape classes are shown in Figure 2. We summarize risk assessment results for these firescape classes to help support their interpretation and use by natural resource managers.
Firescape Description
1History of wildfire, potential for intense fire
2Cool and wet broadleaf mountain forests
3Rural pine forest, conversion to agricultural lands
4Urban periphery landscapes
5Rural agriculture, vulnerable communities, and low wildfire potential
6Rural mixed forests with hazardous fire potential
7Warm and dry, mixed woodlands
8Rural pine forests, intense fire and vulnerable communities
9Semi-rural with low social vulnerability and moderate climate
Table 2. Pearson correlation coefficients between (1) major BN model outputs representing hazardous fire potential, various components of wildfire risk, and the utility of fuel reduction for reducing risk; and (2) inputs representing total available fuels and recent climate extremes. Monthly minimum relative humidity and maximum temperature are both 3-year anomalies (2019–2021), and the SPEI drought index is over the same time period.
Model OutputMinimum
Rel. Humidity
SPEI DroughtMaximum
Temperature
Total Fuel Load
Potential for hazardous fire−0.01−0.320.060.51
Overall risk0.064−0.0740.130.54
Risk to people and structures0.022−0.110.0750.30
Risk to people from smoke0.075−0.0420.120.51
Risk to forest carbon stocks0.12−0.0770.110.61
Risk to important watersheds−0.0420.0710.130.40
Relative utility of fuel reduction0.09−0.00420.0770.69
Disclaimer/Publisher’s Note: The statements, opinions and data contained in all publications are solely those of the individual author(s) and contributor(s) and not of MDPI and/or the editor(s). MDPI and/or the editor(s) disclaim responsibility for any injury to people or property resulting from any ideas, methods, instructions or products referred to in the content.

