1. Introduction
Land is one of the most important resources that supports human activities and supplies essential materials. With the growth of the global population and socio-economic development, the level of global urbanization is expected to further increase. Rapid urbanization has led to the continuous expansion of construction land, and the sharp reductions in agriculture land and ecological land have placed great pressure on world food security and ecological protection [
1,
2]. In the context of rapid urbanization, knowing how to maintain socio-economic development while safeguarding food security and the eco-environment, so as to coordinate the development and joint promotion of the three, is crucial to sustainable development [
3]. Coordinating the land use relationships between agricultural food production, ecosystem services, and urbanization is required to improve the efficiency of land use and deal with the trade-off between the three for land demand [
4,
5].
Research on the trade-offs among the three types of land use function have mostly focused on the conflicts between two of them. In particular, the competition between agriculture land and construction land is the most frequently researched. Due to reform and opening up, under the situation of increasing competition for construction land, agriculture food production is bound to be at a disadvantage, which directly leads to the large-scale conversion of agriculture land to urban land in China [
6]. More than 58.5 × 10
3 ha of high-producing agriculture land is replaced by low-productivity agriculture land annually [
7]. Studies have also pointed out that urban expansion is one of the important reasons for the decline in agriculture land use intensity [
8,
9]. Regarding the conflict between food production and ecosystem service, studies on the transformation of land use types in China have pointed out that more than half of China’s newly added agriculture land in the past few decades was converted from forests and grasslands [
10]. In addition, newly added agriculture land mainly appeared in the north area, which led to the center of China’s grain production gradually shifting from the economically developed south to the relatively underdeveloped northern regions [
11], and the degradation of the northern eco-environment and the declination of the overall quality of agriculture land in China [
12,
13]. As for the trade-offs between agriculture land and ecological land, the Chinese Grain for Green (GFG) program was implemented to reduce the damage to the eco-environment caused by agriculture land expansion. To a certain extent, the GFG reduced the serious soil erosion caused by blind deforestation for reclamation and cultivation on steep slopes, but it also led to a decrease in the productivity of some agriculture land [
14,
15,
16,
17].
Assessing the potential of natural resources is a very important task that can help to better understand the links between economic activities and the potentials of the land and ecosystems to improve land resource management [
18]. As a quantitative indicator to measure the degree of land use, the land use efficiency index can effectively reflect the situation of land use efficiency of the three functions of agricultural food production, ecosystem services, and urbanization [
19], which has a positive significance in balancing the relationships among them. There is currently no unified definition proposed about land use efficiency; existing studies generally define it for different research purposes. From an economic point of view, some researchers defined it as “the ratio of the total output value of secondary and tertiary industries to the area of urban land” [
20,
21,
22,
23]. From the perspective of land use development, researchers have defined it as the ratio of the current situation of land use and the exploitable potential of land use [
24,
25,
26,
27]. At present, research on land use efficiency is mainly focused on a single land use type. Urban land use is mostly related to the efficiency of industrial land use [
27,
28,
29], construction land efficiency [
30], and urbanization efficiency [
31,
32]. Research on agriculture land utilization efficiency generally focuses on crop yield [
33], agricultural intensification [
34], and land production potential [
35]. Land use efficiency is the result of multiple factors which are influenced by society, nature, economy, and humanity [
24,
36]. However, the current research on land use efficiency is mostly separate from research on food production, ecological services, and urbanization. These studies are thus limited, lacking comprehensive research on the trade-offs among them.
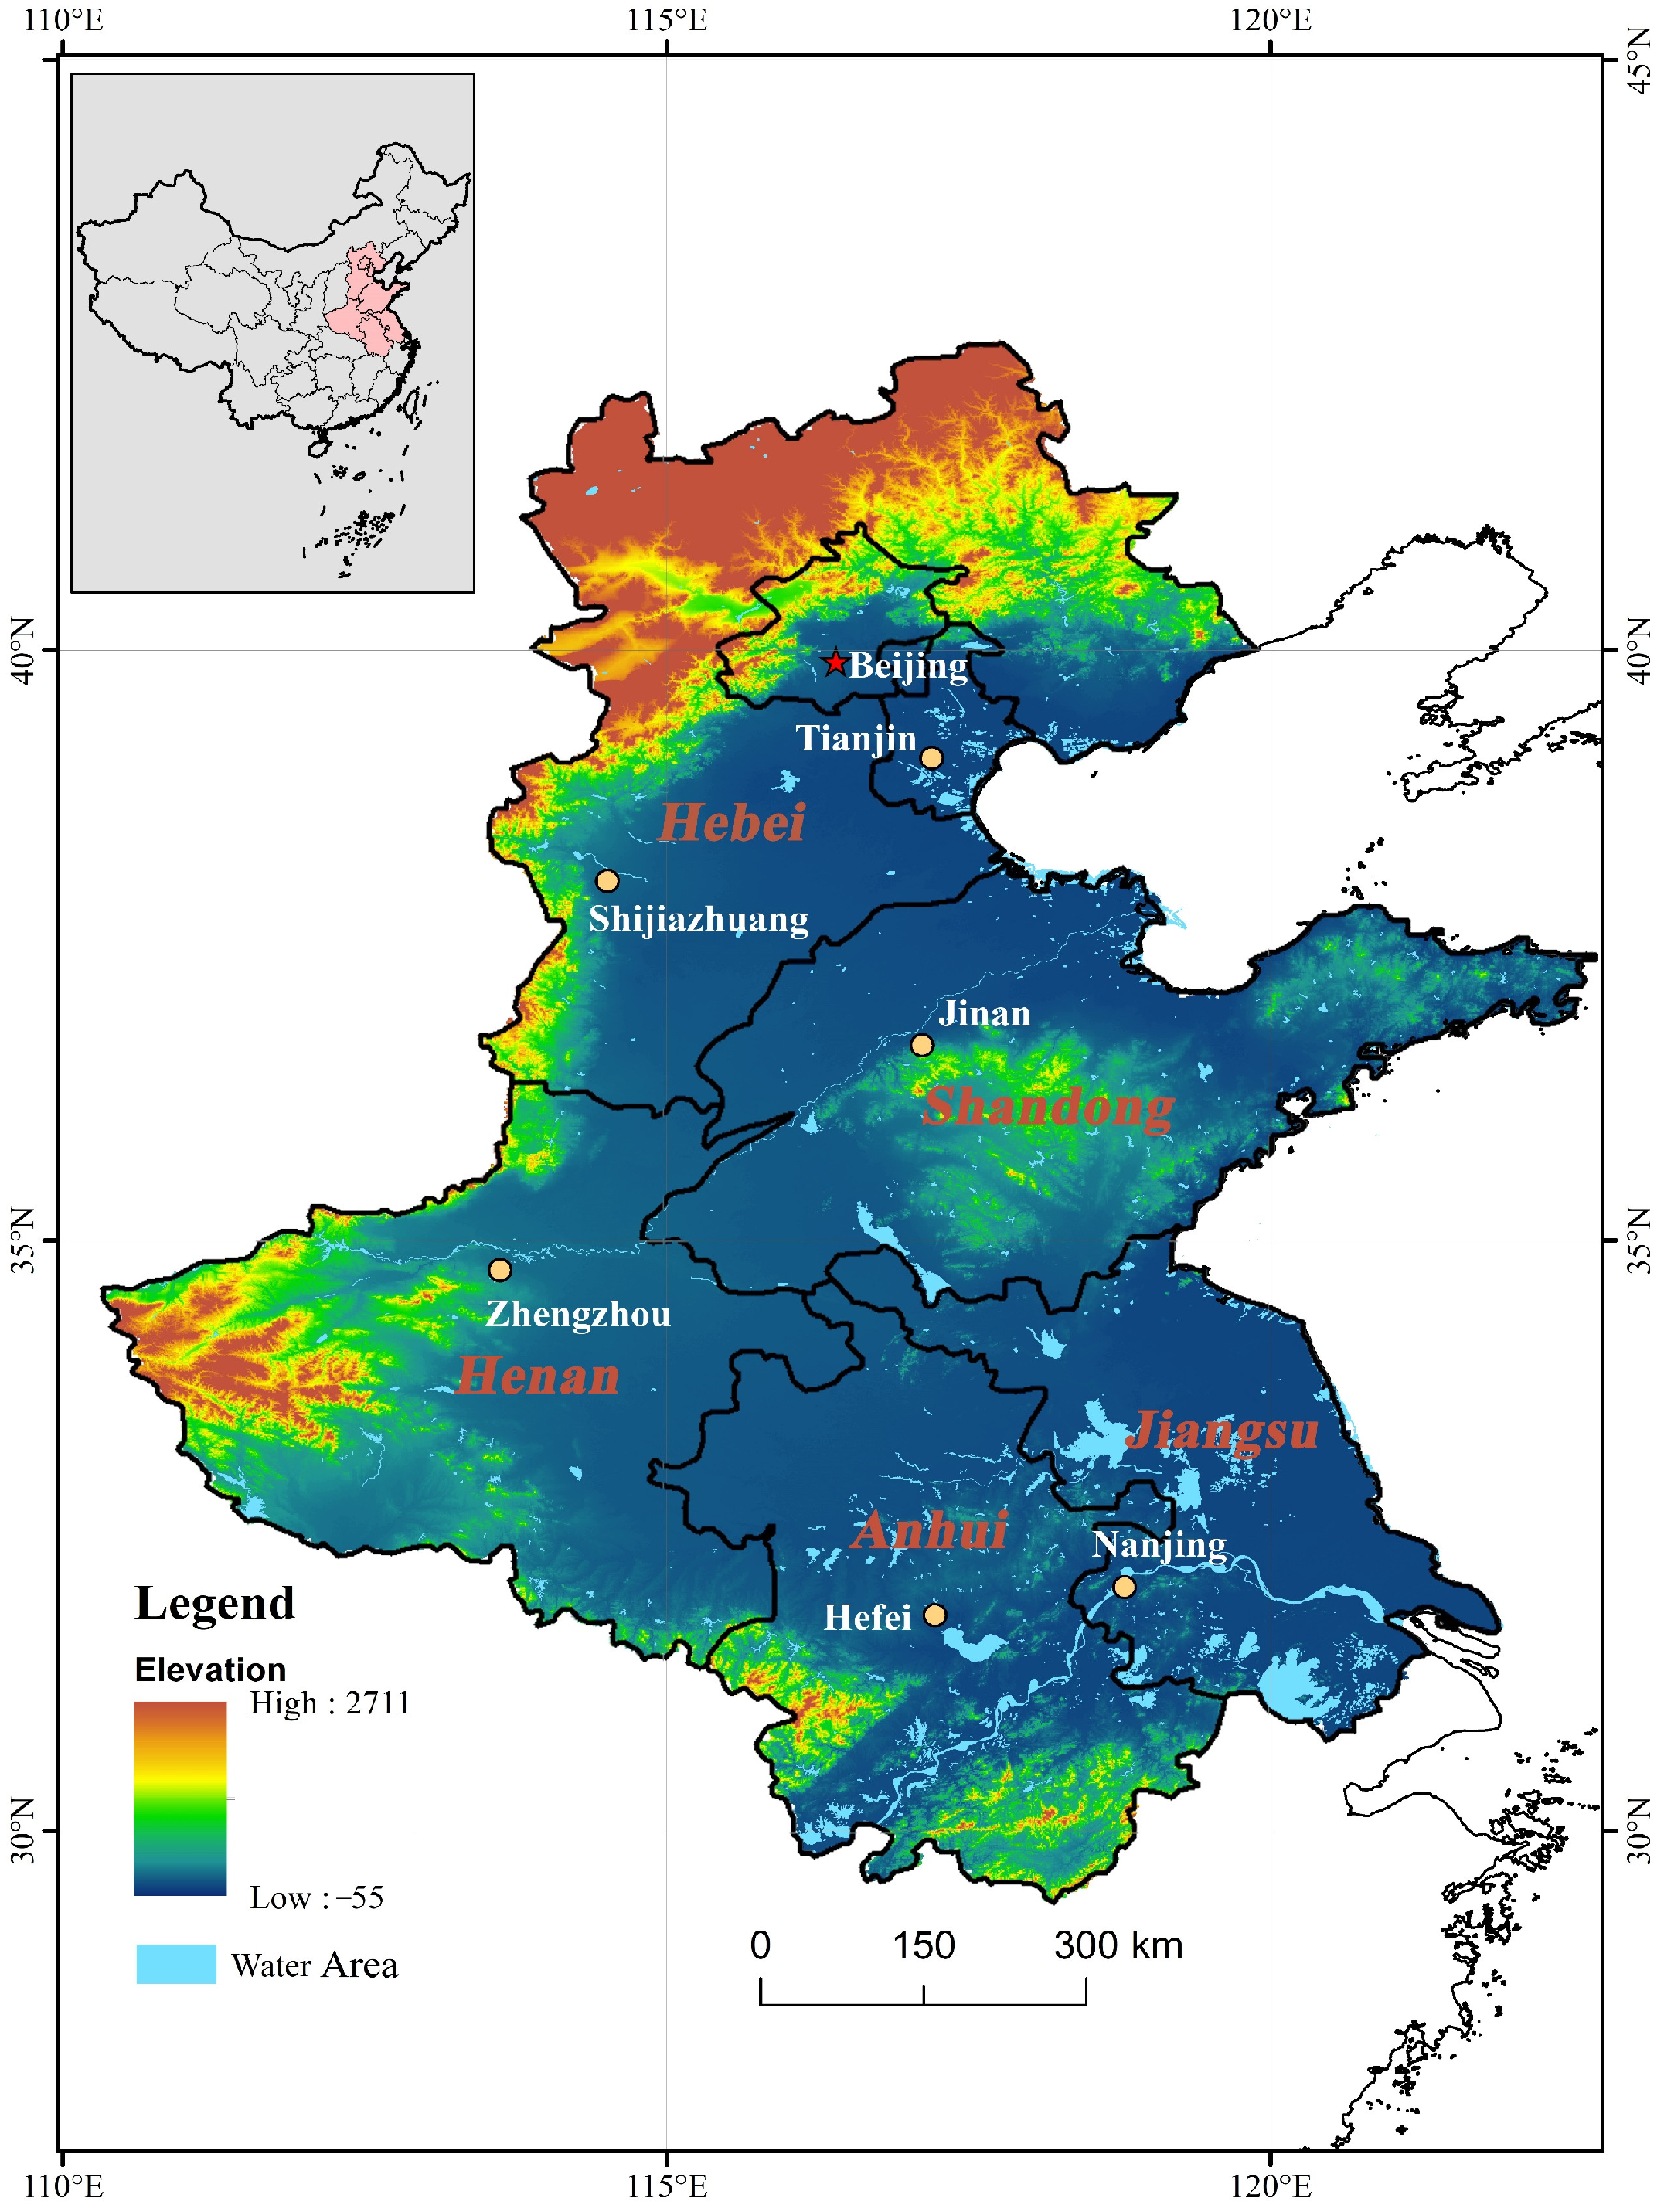
Carrying out research on the internal links and optimal land use type in different functional areas is important for natural resource management and sustainable development. The goal of the Chinese national territorial development plan is to comprehensively upgrade the level of territorial space governance by 2035 and form a territorial space pattern featuring intensive, efficient, and sustainable development. At this stage, the research should not be limited to the conflict or mutual influence between two types of land use. Calculating the potential and efficiency of three land use functions in a scientific way, then obtaining the tradeoff relationship among them, and forming a smart and efficient land use strategy represent the focus of the following research. To achieve this goal, this study takes the Huang-Huai-Hai (HHH) Plain as the study area and proposes a new analytical framework combining multiple models to analyze the potential and efficiency of food–ecological–urban land use functions, and then analyze the spatial disparities, trade-offs, relationships, and impact factors of land use sub-categories’ efficiency among food, economy, and ecology at the grid level.
3. Methodology
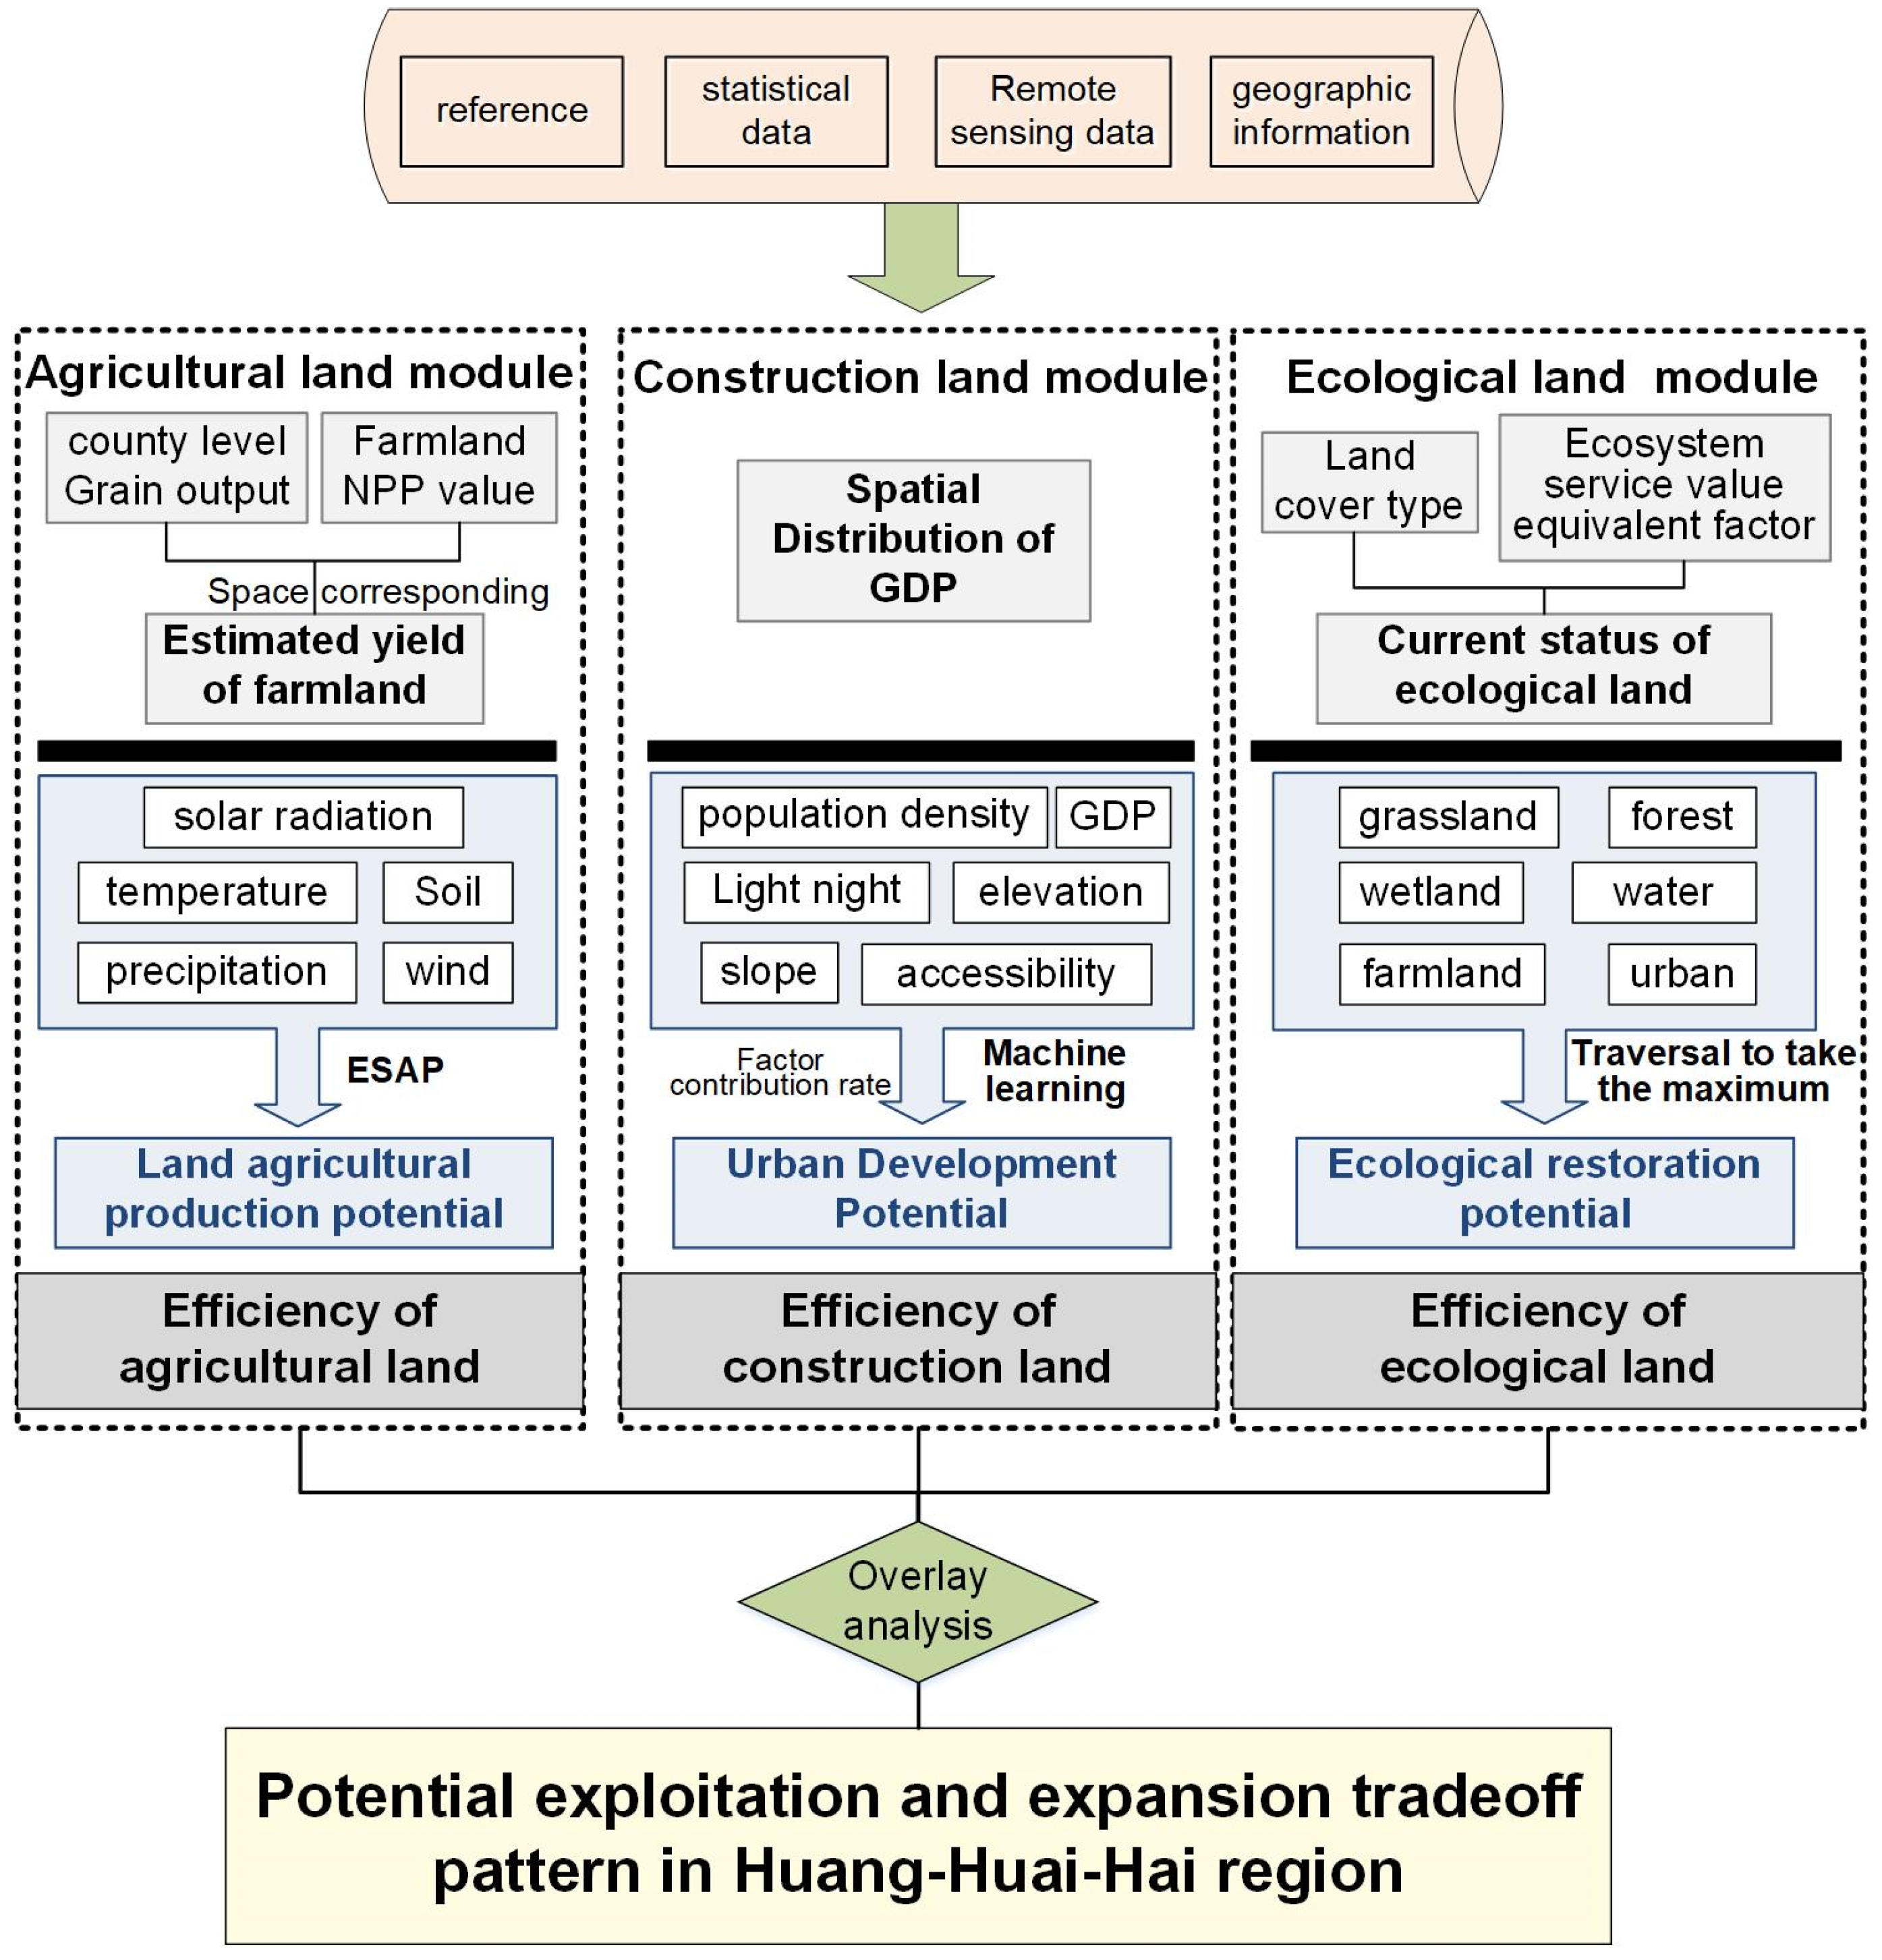
As we all know, the utilization attributes of land are constantly changing; for example, in the past, a piece of land may have been forestland, with its main function being ecological, and, under the action of mankind, this piece of land may have changed from forestland to arable land or land for construction, and then the function of this piece of land may have changed to an agricultural or construction function. This means land use and trade-offs are also in a dynamic process of constant change, and the utilization potential and efficiency can be used to analyze the state of land use from a more comprehensive dynamic perspective. In this study, the potential of land use refers to the maximum effectiveness of a land use function that can be exerted on the land, and this maximum effectiveness is obtained through the historical changes in the function of the land and model simulation. The efficiency of land use is the ratio between the effectiveness of the current land use function and the maximum effectiveness, and the higher the efficiency is, the higher the degree of development of this function under the land. In accordance with this idea, this study, based on remote sensing and social statistics data, carried out calculations and analyses on three land use function modules, namely, agriculture, ecology, and construction. Firstly, the ESLP model was used to calculate the agricultural production potential of different parcels of land, and then the actual situation of agricultural production on the parcel of land was used to calculate the ratio with the potential to obtain the efficiency of agricultural production. Secondly, the machine learning method was used to calculate the construction potential of the land of the town, and GDP was used to calculate the construction potential of the land of the town. The construction potential of urban land was then calculated using machine learning methods, and the construction efficiency of the land was obtained by dividing the GDP value, as a characterization of the current construction status, by the construction potential. Finally, the ecological value function was used to calculate the ecological potential of the parcel, and the ecological efficiency was obtained by comparing the ecological value of the parcel with the highest ecological value of the parcel in history. Finally, the potential and efficiency of multiple land functions were analyzed together by means of a stacked analysis to explore the trade-off status of different regions.
3.1. Estimating Land Use Potential
3.1.1. ESLP Model for Simulating Agriculture Land Potential
In this study, agriculture land potential is defined as the maximum production of crops that can be produced per unit area of land, and the ESLP was used to simulate the productive potential of crops. ESLP uses detailed agronomic knowledge and large-scale multi-source data (including land use data, climate data, radiation parameters, soil properties, climate, soil and tillage intensity, etc.) to model agricultural production availability and utilization levels of land resources and to characterize the results at a fine raster scale. Up to now, the ESLP model has been successfully used in many studies to estimate agricultural productive potential [
37,
38].
The ESLP model includes five functional modules: photosynthetic productive potential, light-temperature productive potential, climate productive potential, land productive potential, and land productivity. It uses environmental factors to revise the model piece by piece, and the model estimates the agricultural productive potential by gradually revising the solar radiation, temperature, moisture, land suitability, and input level during the growth period of crops. The core modules of the ESLP model include land resource stock estimation, land use type and land use intensity determination, crop growth demand for climate resources such as light, temperature, and water, and land suitability assessment (including the potential maximum yield of the crops and the limiting factors affecting crop yields) [
39]. Considering the substitutability of land use types and crop types, the ESLP model introduces a multi-objective planning method to improve the accuracy of the estimation results [
40]. Due to the diversity of crops grown on the HHH plains, in this study, we selected five different crop types to calculate the land productivity of the 25 land use/cover types, where paddy fields are mainly used for rice cultivation, and drylands are mainly used for maize, beans, sorghum, and millet. The average production potential of these five crops calculated using the ESLP model is then considered as the production potential of the agricultural land.
3.1.2. Random Forest Model for Estimating Construction Land Potential
Urban development potential refers to the value that a unit of land may create and its ability to expand outward. Traditional methods generally use indicators to evaluate the development potential of land-use units, but the factors and importance that determine urban development and expansion vary from region to region. Therefore, this study uses machine learning algorithms to train the historical expansion data set of cities, and then obtains the weights of various urban development and expansion factors in order to objectively evaluate the urban development potential of the land units.
Random forest is an ensemble classification algorithm that uses the bootstrap method for aggregation and simultaneously trains a specific subset of training data to generate multiple decision trees for classification combination [
41]. The combined effect of the randomness of the training set and the randomness of the optimal attributes of node splitting ensure that the random forest algorithm reduces the possibility of over-fitting data and increase the stability of the model [
42]. During the training of the RF algorithm, the sample dataset
Xi (
i = 1, 2…,
n-tree), which contains
n-tree items, is acquired by the bootstrap sampling method to replace the sampling from the original dataset
X. The other data, which do not appear in the
Xi dataset, are called out-of-bag (OOB) data. The RF model can use the OOB dataset for an OOB prediction and to estimate the OOB error and evaluate the importance of spatial variables [
41,
43,
44]. Breiman (2001) proved that OOB estimation is an unbiased estimation, so using OOB estimation can achieve the same effect as N-fold cross-validation. There are two commonly used methods to measure the importance of variables with OOB data: the average precision reduction measurement and the average Gini reduction measurement [
45]. This study adopts the average precision reduction measurement used by Breiman. The average precision reduction measures the value of a variable as a random number. Under the condition that other variables remain unchanged, the average precision reduction is obtained by analyzing the decrease in the accuracy of random forest prediction. The larger the value, the more important the variable is.
Previous studies [
7,
35,
46] have found that changes in built-up areas have been primarily driven by population growth, economic growth, and natural forces. Therefore, this study randomly selected 5000 urban land units that expanded between 2000 and 2015, and used population density, GDP, night lights, slope, elevation, and traffic accessibility related to urban expansion as factors to drive the random forest model. The contribution rate of each factor was then calculated to determine the urban development potential of the HHH region.
3.1.3. Estimation of the Ecological Land Potential
In this study, the ecological land potential does not specifically refer to the land with ecological functions as the main function but instead examines the extent of the ecological functions that all land in the study area may provide. Ecological services refer to the products and services obtained directly or indirectly through the structure, processes, and functions of the ecosystem [
47,
48]. To some extent, the ecosystem services provided by the ecosystem carried by the land represent the ecological capacity of the land. Therefore, in this study, we used the ecosystem service function potential to measure the ecological land potential. According to Burkhard et al. (2012), ecosystem service potential is the hypothetical maximum yield of ecosystem services, and this potential could be estimated using an ecosystem service potential matrix based on land cover types [
49,
50,
51]. In this context, we defined the potential of ecosystem services in the study area as the maximum value of ecosystem services per unit area of land in the past 40 years. The specific formula is as follows:
where
represents the ecological land use potential,
is the type of ecosystem service function,
n is the total number of ecosystem service function types,
y represents the number of years of land cover traversing the land unit,
Lc represents different land cover types, and
Di represents the equivalent value factor of the system service function type. The value equivalent factor of the ecosystem service function in the formula is taken from previous research [
52] and has a high degree of credibility when carried out in China.
3.2. Estimation of Land Use Efficiency
In this study, land use efficiency is defined as the ratio of current land use to land use potential. The larger the ratio is, the higher the land use efficiency of the unit of land; the smaller the ratio is, the lower the land use efficiency of the unit. Under this assumption, the urban land use efficiency (
ULUE) can be expressed as
where
represents the urban land use efficiency of unit
i,
represents the urban land use potential of unit
i, and
represents the current status of the urban land use of unit
i. Among them,
is characterized by the GDP produced per unit area of land at this stage. The current status of ecological land use efficiency is directly expressed by the total value of ecosystem service functions of the land use unit at this stage.
The current production capacity of agriculture land is allocated by the total grain output at the county level in 2015 times the 2015 NPP on the agriculture land unit to obtain the estimated value of the grain output on each agriculture land unit in 2015. The specific formula is expressed as
where
is the efficiency of agriculture land use,
represents the current status of agriculture land use on the
i-th agriculture land unit in county
c, yield
c represents the total grain production in county
c,
represents the npp value on the
i-th agriculture land unit in county
c, and area represents the total amount of agriculture land in county
c.
3.3. Trade-Off Judgment Method for Land Use
In order to comprehensively analyze the state of land use trade-offs, this section uses the overlay analysis method in ARCGIS, the potential and efficiency of agriculture land, ecological land, and the construction land calculated above and the current land use status are superimposed and classified to comprehensively identify the relationship between land use efficiency, land use potential, and land use trade-offs in the HHH area.
This part is divided into three main steps, where the first step is to determine the current status of land use. Based on the land use type data, the various types of land use types are divided into agriculture land, including paddy fields and dry land; construction land, including urban land and industrial and mining land; and ecological land, which refers to land types other than agriculture land and construction land, including forestland, grassland, wetland, water bodies, and wasteland. In the second stage, we judge whether the land use efficiency is in the appropriate range. Since this study is based on the overall perspective of the HHH Plain, the units with the top 40% of specific land use types are judged as efficient land use, and the units with the bottom 60% are determined as inefficient land use. The third stage judges the trade-off relationship between land use, starting from the relationship between the potential of the noncurrent land use type and the current land use. When the potential of the noncurrent land use type exceeds 80% of the land unit, it is concluded that the optimal land use type and the current land use type are different. There is a trade-off relationship, and no more than 80% of the land units should have no trade-off relationship.
4. Results
4.1. Assessment of Agricultural Productive Potential
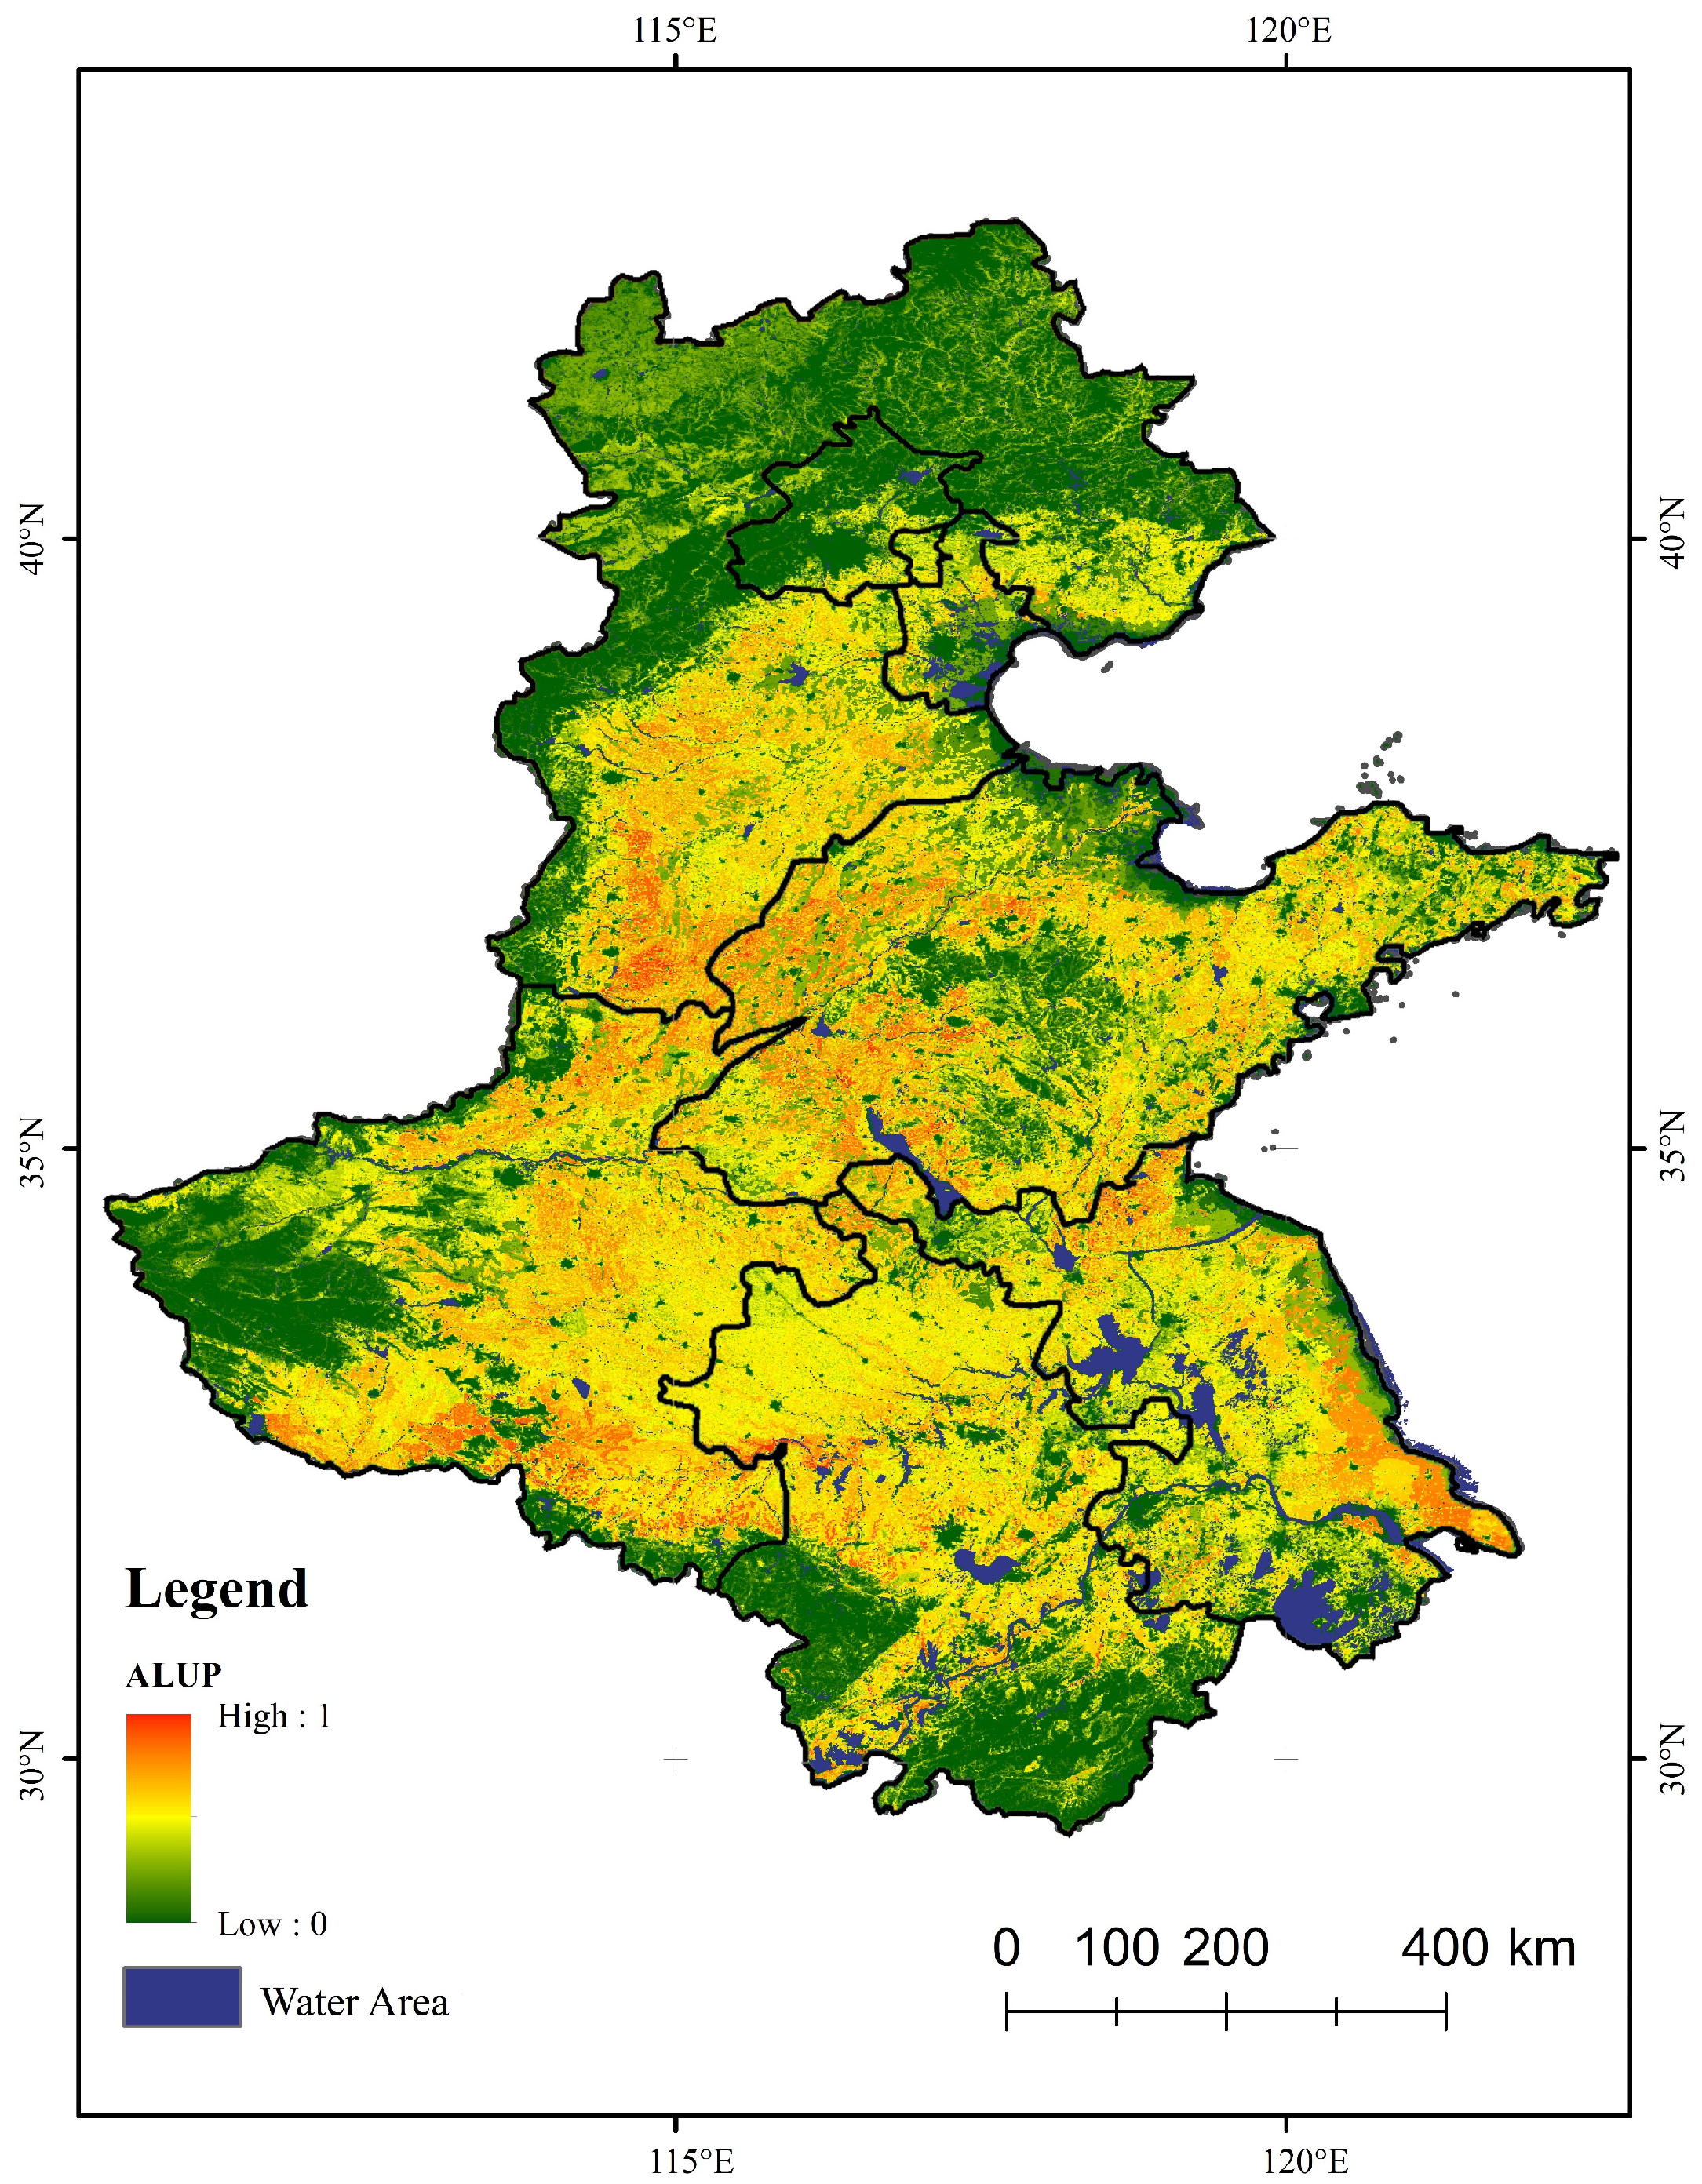
The result of the
ESLP model is shown in
Figure 3. The maximum agricultural productive potential of the HHH Plain is 15,058.9 kg/hm
2, and the average value is approximately 5123.23 kg/hm
2. The agricultural productive potential generally shows a gradual increase from north to south, and it is very similar to the results of several previous studies [
53]. To facilitate subsequent analysis and comparison, the agricultural productive potential of the land is normalized. Places with great agricultural productive potential are in the central and southern parts of the HHH Plain, which have better soil conditions and rich radiation and temperature resources. In addition, adequate water conservancy facilities and irrigation conditions make up for the disadvantage of insufficient rainfall in the area, making the area present a higher potential for agricultural production. Correspondingly, relatively poor radiation and temperature conditions lead to low productive potential in the central and northern HHH Plain. In addition, the northern mountainous areas of Hebei, the southern and western mountainous areas of Henan, and the central mountainous areas of Shandong all show low agriculture land productive potential. The main reason is that these areas are not suitable for farming activities with large terrain undulations.
4.2. Assessment of Construction Land Potential
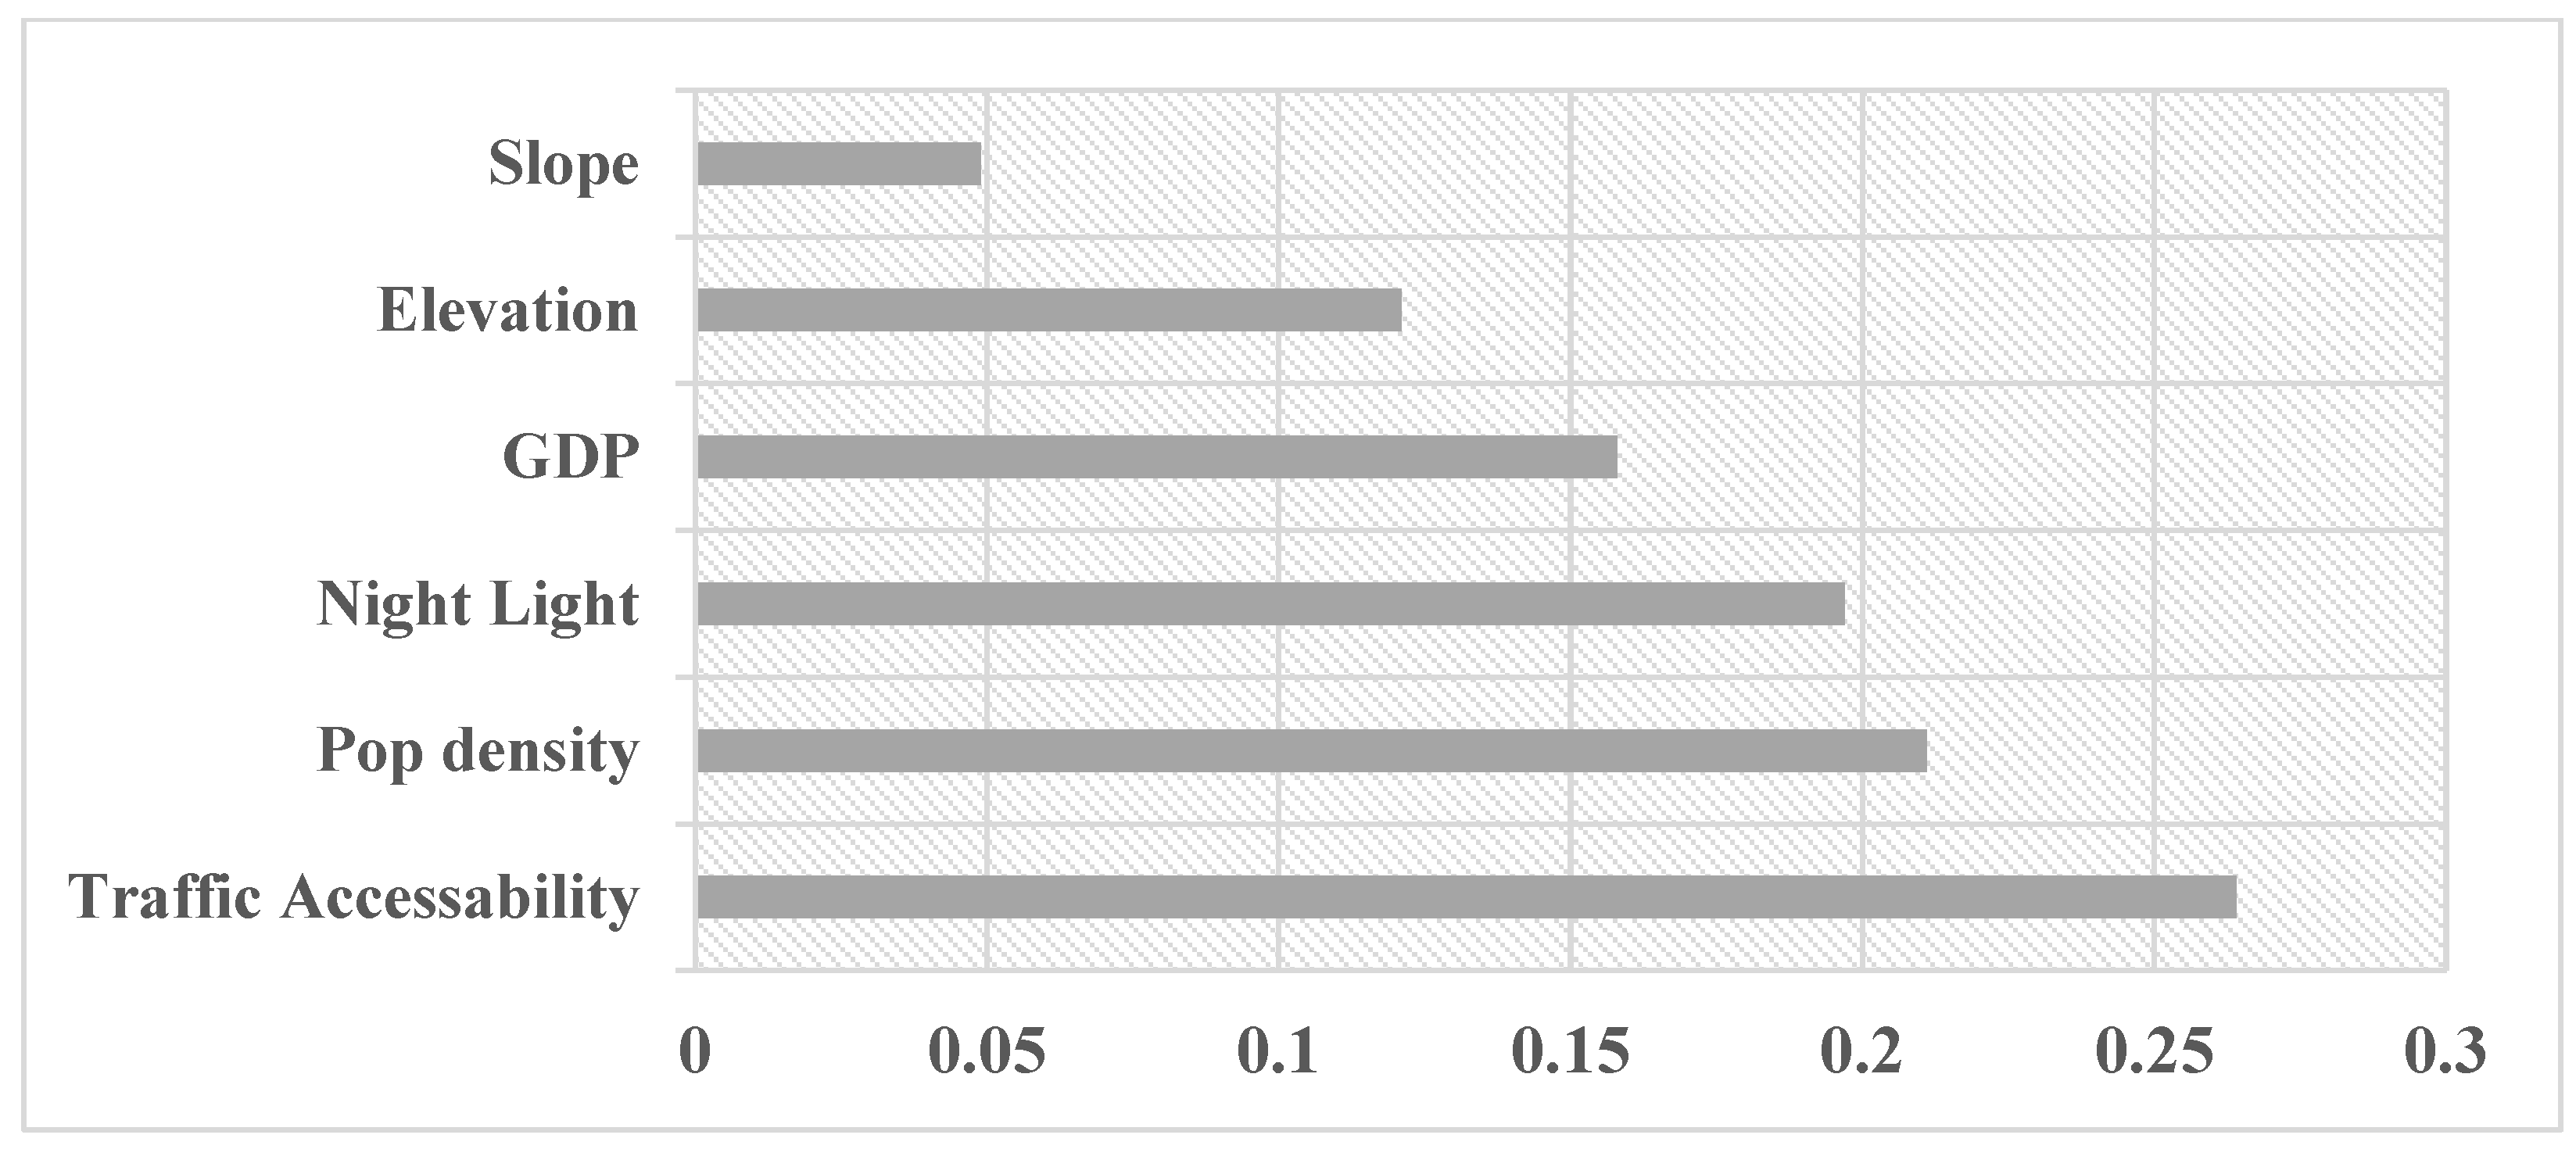
As mentioned above, 5000 sample points were randomly selected from the construction land units that expanded from 2000 to 2015, and 90% of the sample points participated in the training while another 10% were used for accuracy verification. The verification results show that the prediction accuracy of urban expansion from 2000 to 2015 was 80.5%, indicating that the random forest method can accurately predict urban expansion and reasonably explain the impact of various potential driving factors on urban development. The importance ranking of each driving factor to urban development potential is shown in
Figure 4. The contribution rate is used to represent the land urban development potential, and the higher the value is, the greater the urban development potential. Among the indicators, traffic accessibility has the greatest impact on urban development potential, with a contribution rate of 0.264, followed by population density and night lights, with contribution rates of 0.211 and 0.197, respectively. The influence of topographical factors on the urban development potential is limited, and the contribution rates of elevation and slope are 0.121 and 0.049, respectively. In the follow-up comparison and calculation, the urban development potential is also normalized.
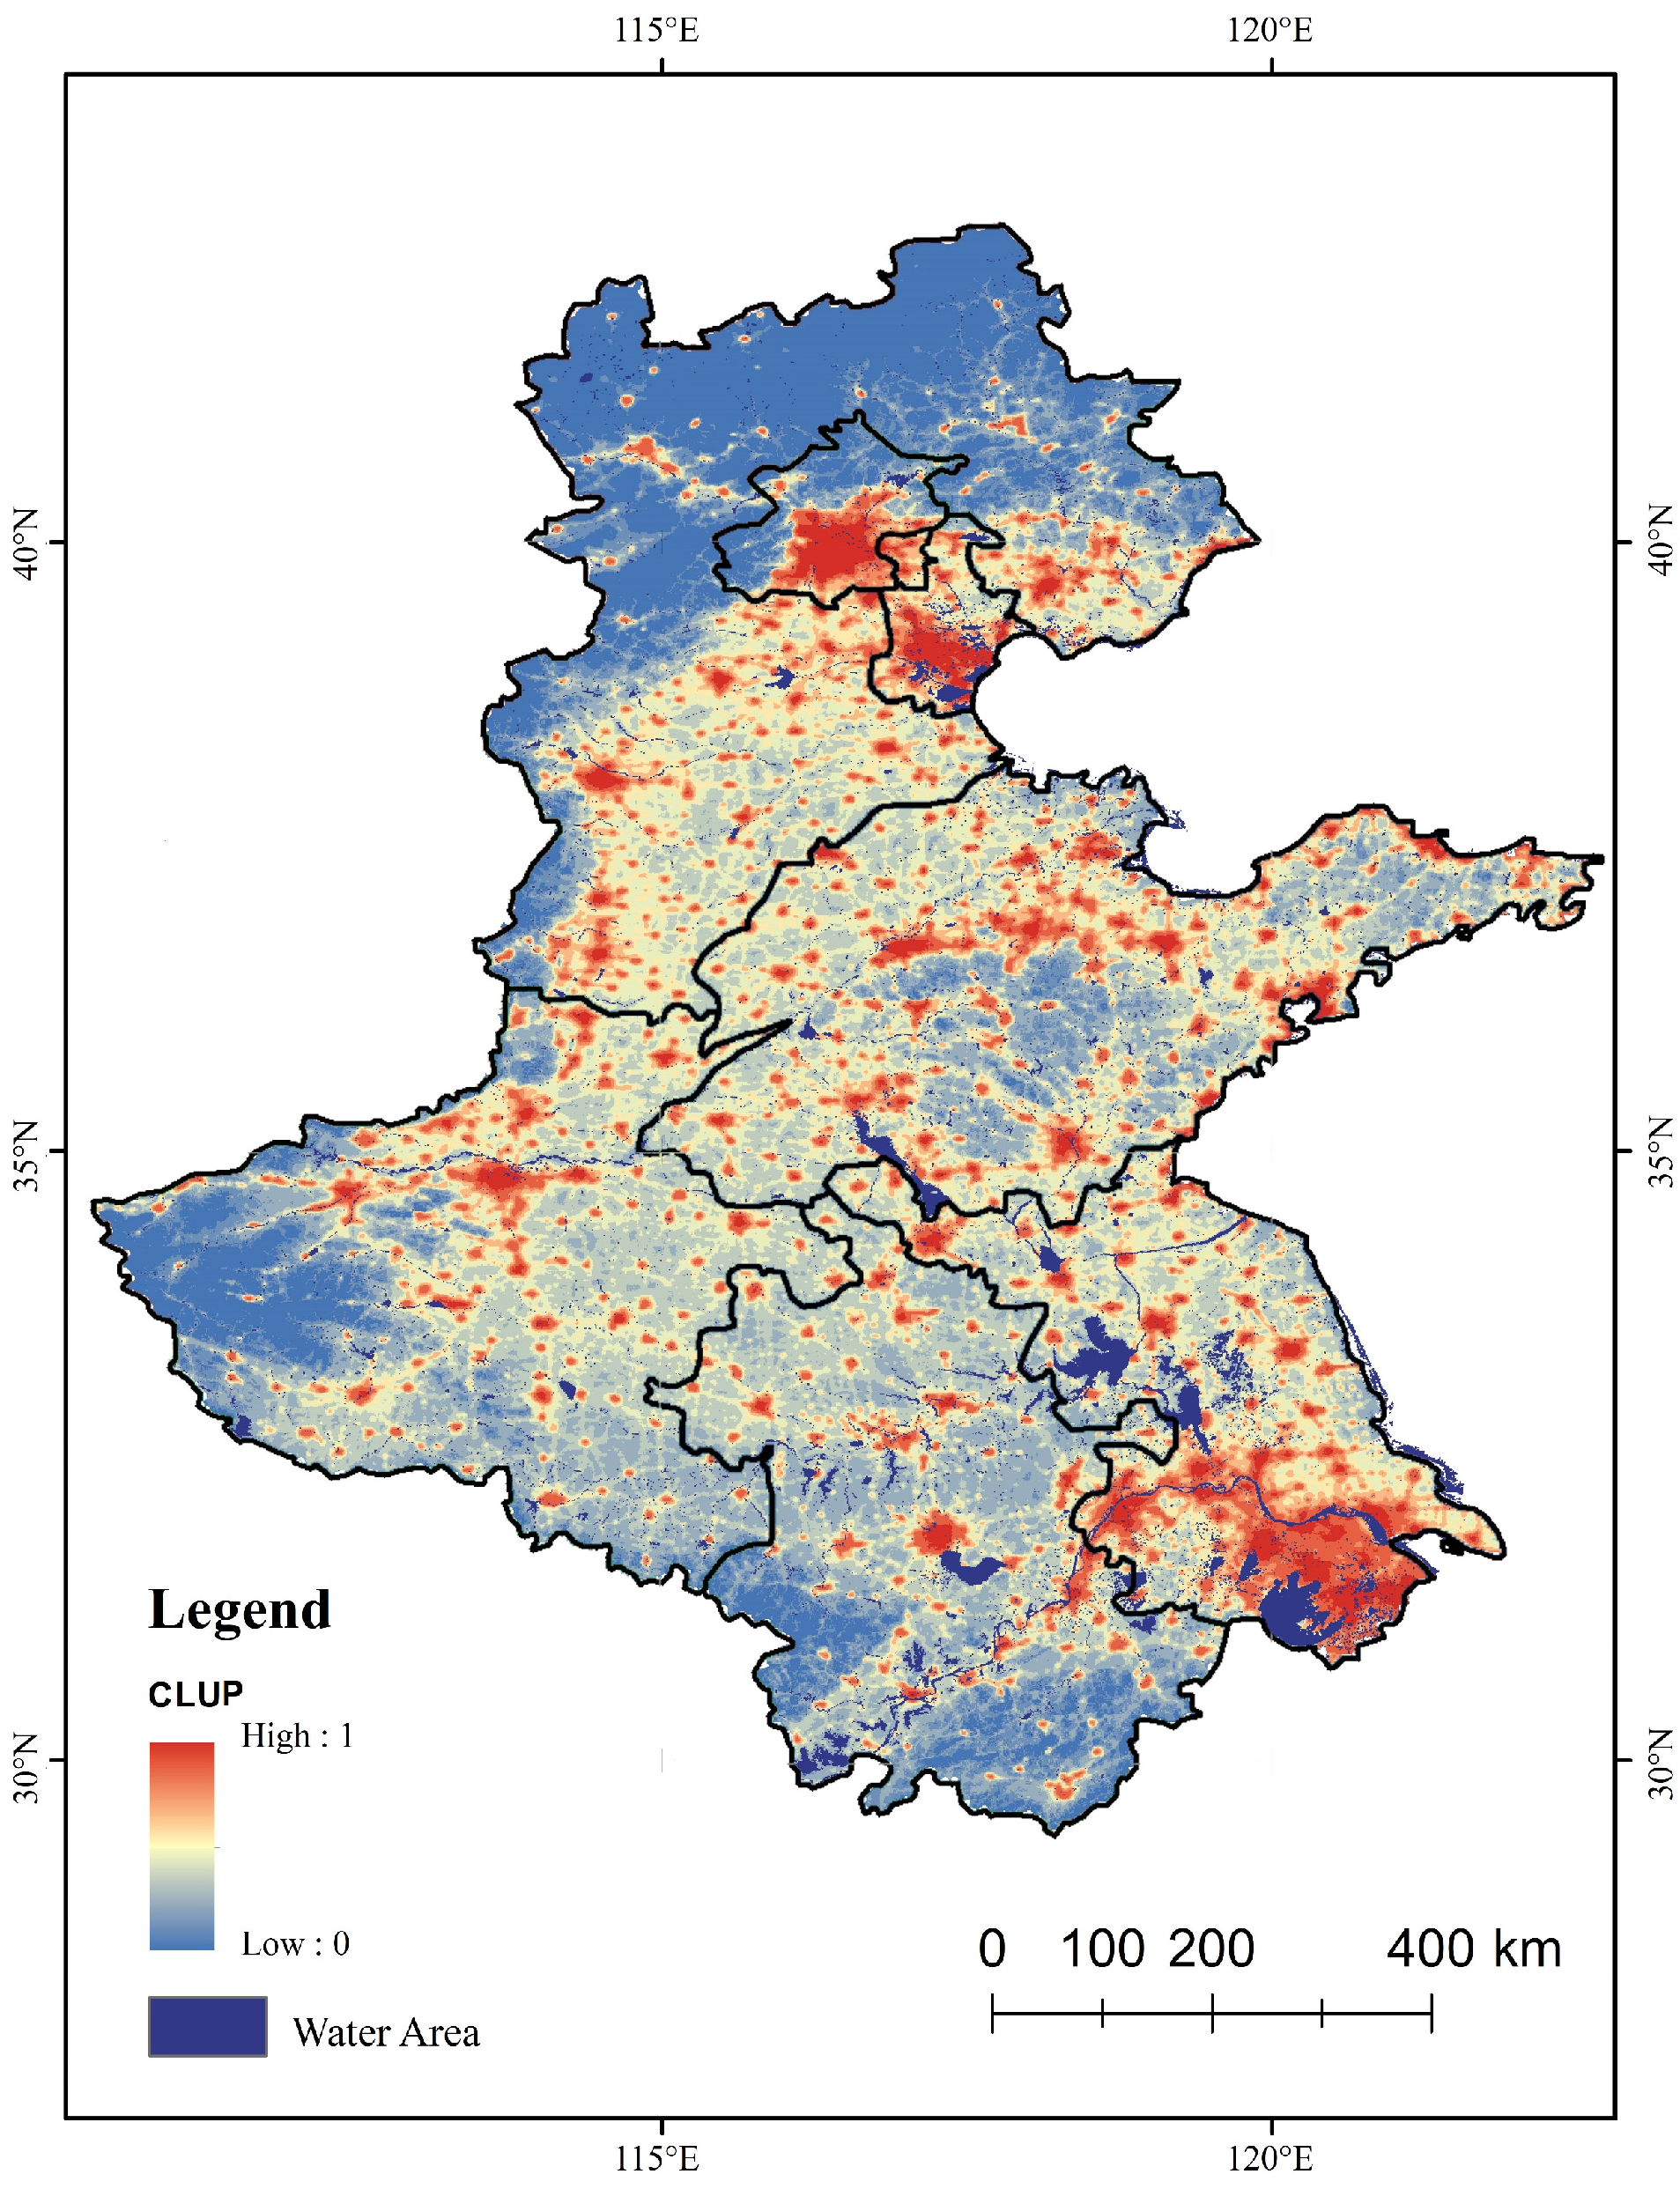
The results (
Figure 5) show that places with great urban development potential are mainly distributed in Beijing, Tianjin, southern Jiangsu, and the capital regions of all provinces. These areas always have high traffic accessibility, high population density, and a strong economic foundation. The remaining prefecture-level city centers also have a certain potential for urban development, but their urbanization area is relatively small. Others, such as the northern mountainous area of Hebei and the western mountainous area of Henan, show a low urban development potential.
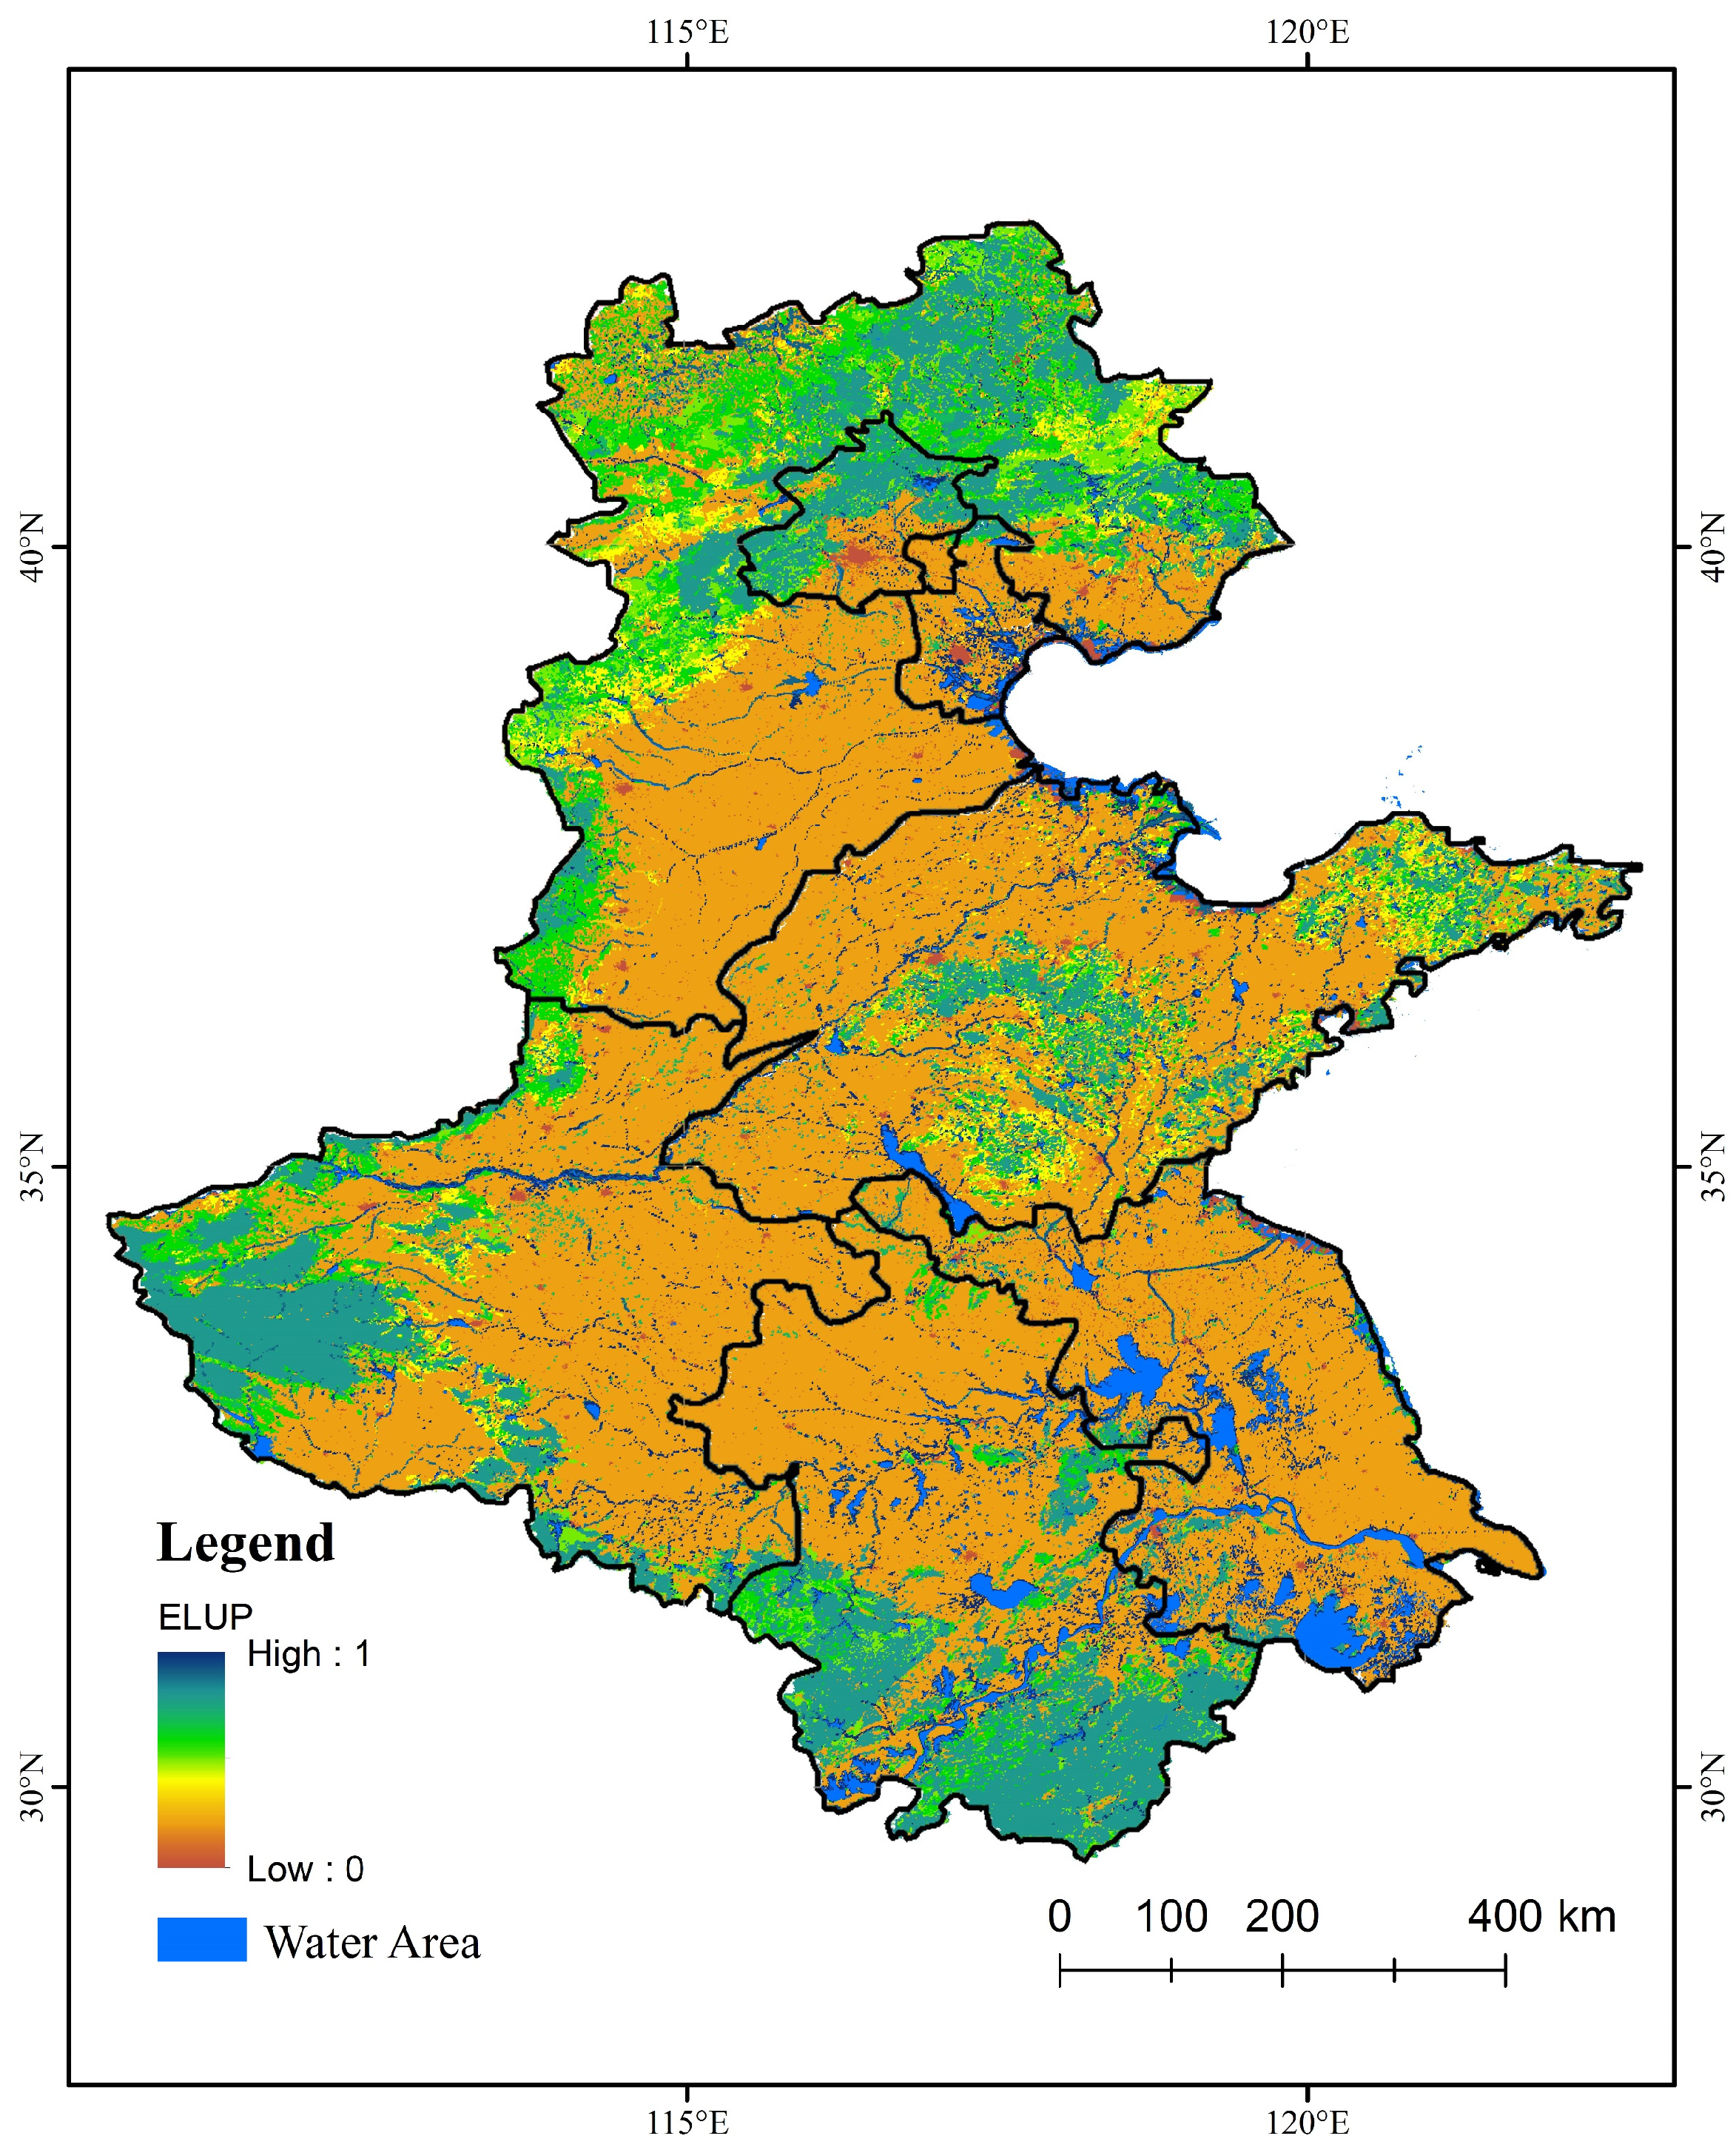
4.3. Assessment of Ecological Land Use Potential
In this study, the largest ecosystem service value that the land unit has ever had in the past 40 years was used to represent the ecological land potential, and the results are shown in
Figure 6. The areas with the greatest ecological land potential are mainly concentrated in the wetland areas around rivers, lakes, and coastal zones. The mountainous area in the HHH Plain is covered by forests and has great ecological land potential too. The mountainous areas in western Henan and southern Anhui have higher ecological land potential, while the mountainous areas in northern Hebei and central Shandong have low ecological land potential as there are too many shrubs and grasslands. Most of the remaining HHH area is composed of agriculture land and has lower ecological land potential, and some areas occupied by urban land have very low ecological land potential.
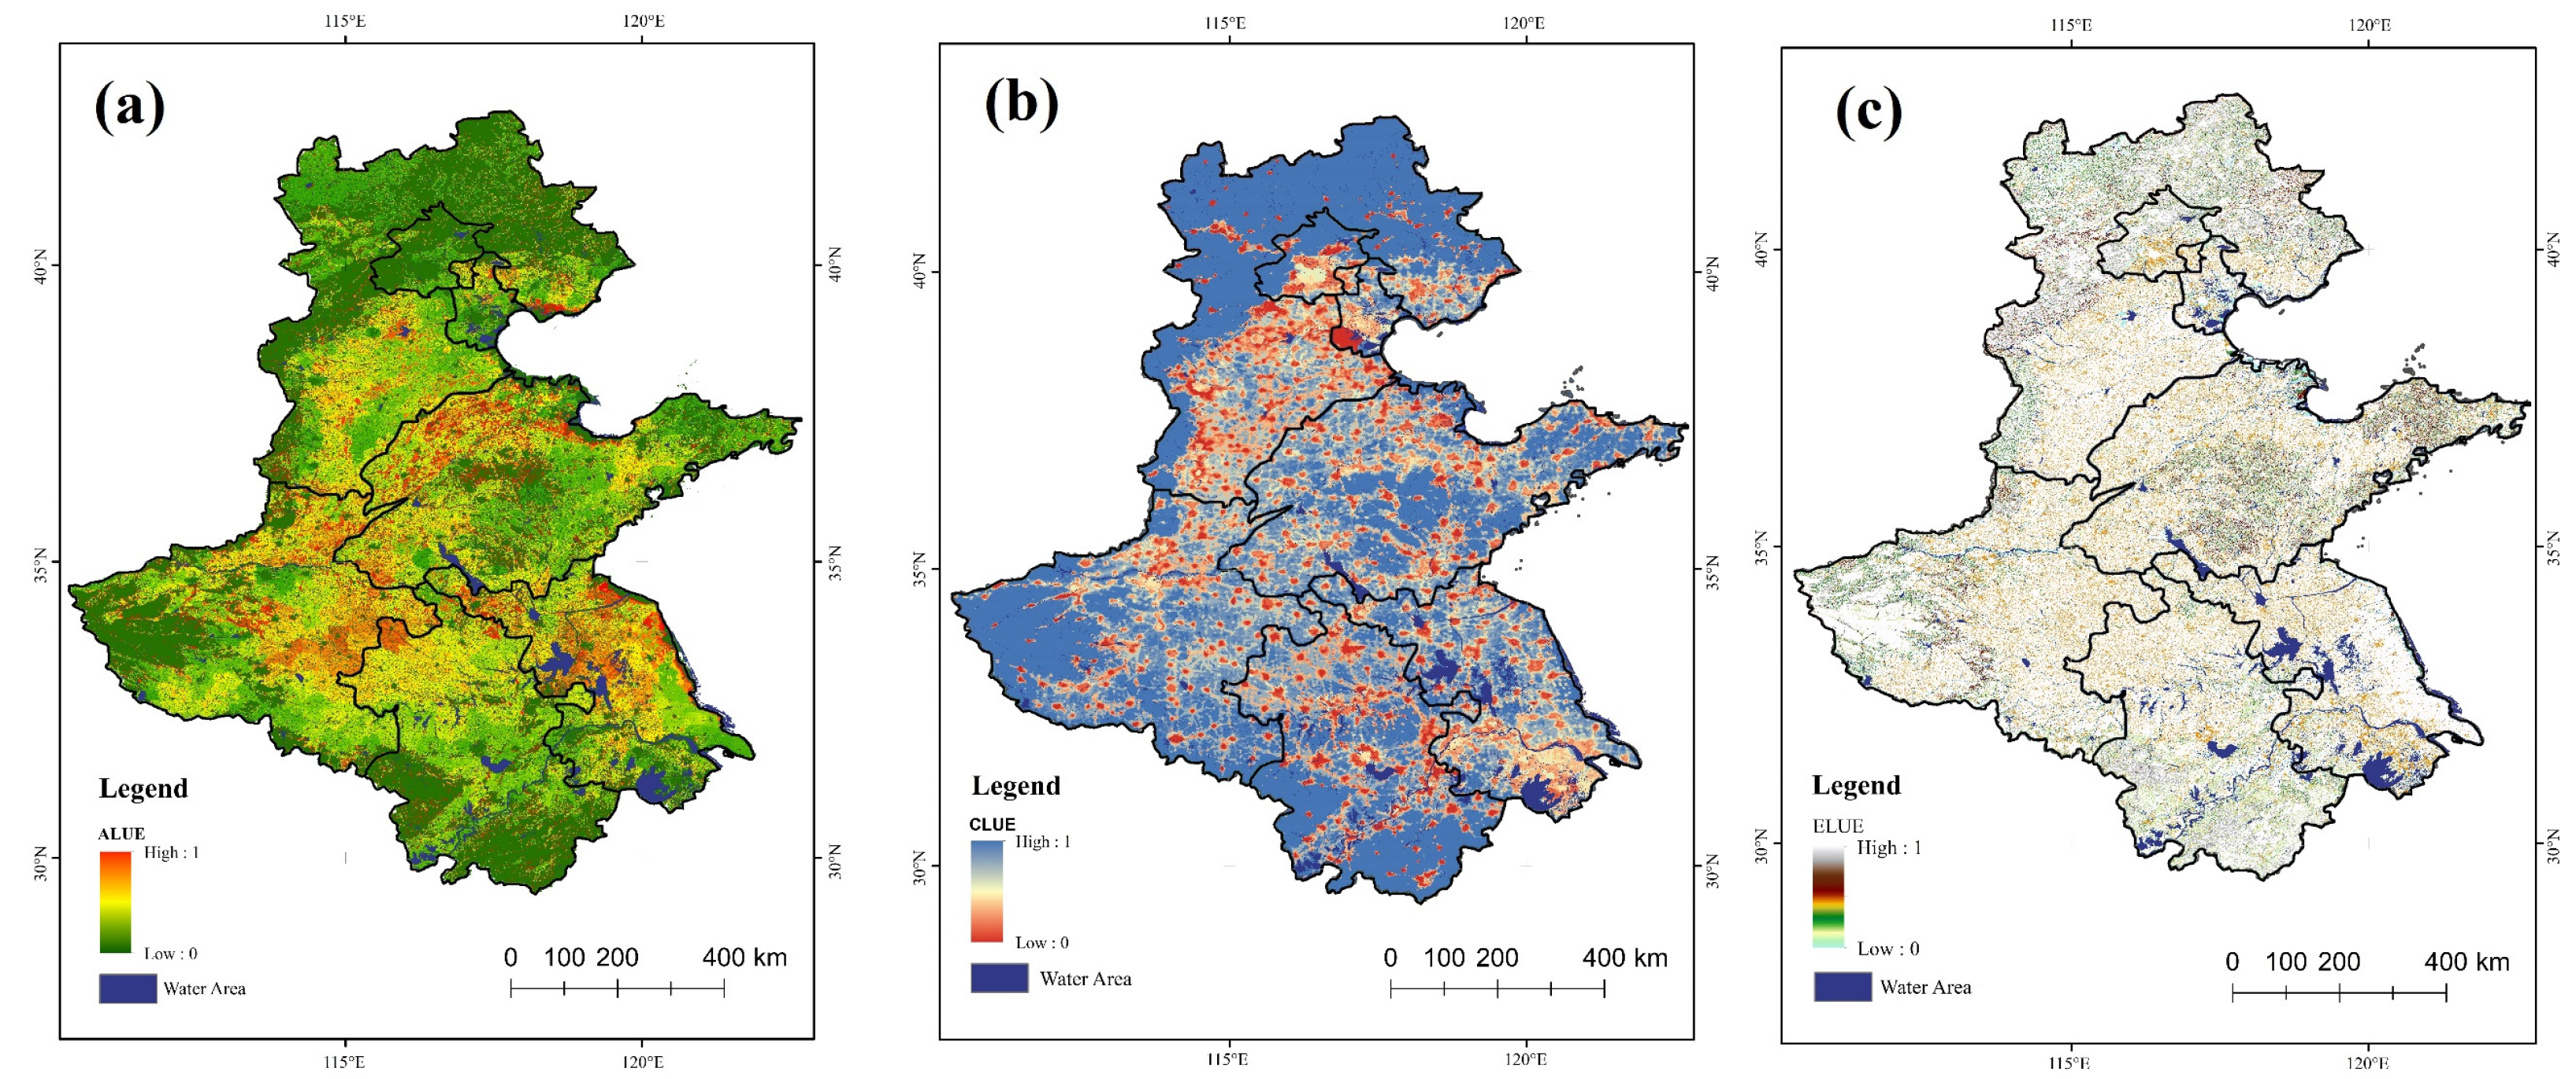
4.4. Spatial Characteristics of the State of Land Use Efficiency
Using the county-level food production data, the NPP (net primary productivity) data retrieved from remote-sensing images, and the agricultural productive potential data calculated above, the agricultural land use efficiency in 2015 was calculated, as shown in
Figure 7a, and for comparison purposes, a normalization operation was carried out. The results show that the production efficiency of more than 60% of agriculture land is less than 1, and the median is 0.78, while the average is 1.029, which indicates that there is still room for further improvement in the agricultural land use efficiency in most areas.
Table 2 shows that there is high agricultural land use efficiency in Shandong, Henan, and Jiangsu, while low efficiency is mainly distributed in the southern Anhui and northern Hebei regions. Among these, Anhui has the lowest efficiency as Anhui is dominated by paddy fields and has the best light, temperature, water, and heat conditions, but the total agricultural production is not as good as in Henan and Shandong, which are dominated by dry land. There is much room for improvement in agricultural land use efficiency.
The results of urban land use efficiency are shown in
Figure 7b. The results show that the efficiency of about 60% of urban land is less than 1, with an average value of 0.853 and a median of 0.838, which indicates that most urban land has the potential for improvement. The areas with high urban land use efficiency are mainly distributed in Beijing, Tianjin, Zhengzhou, Shijiazhuang, Jinan, Qingdao, Hefei, and cities of southern Jiangsu, where the highest efficiency is 1.157 in Beijing. These areas are basically provincial capital areas; they have sound infrastructure, dense populations, and a strong economic foundation. In addition, places with relatively high urban land use efficiency appear in northern Shandong, northern Henan, and the areas bordering Hebei–Beijing–Tianjin. These areas have relatively complete infrastructure and strong connectivity to developed regions. With the basic conditions for urban development in place, the efficiency of urban land can be further tapped. Areas with significantly lower urban land use efficiency appear in southwestern Tianjin, at the southern border of Beijing and Hebei, southern Anhui, and in the center of the study area, as well as the mountainous areas. The urban land use efficiency of these areas is obviously low, indicating that although these areas have some basic elements of urban development, such as infrastructure, population, and economic foundation, they have not yet formed an industrial agglomeration and cannot achieve efficient economic output. Except for that of urban land, the efficiency of rural residential areas and other constructed land generally exceeds one, where their socio-economic foundations are not perfect, but they have achieved a certain economic value, and they are also efficient regions.
For the ecological land, areas with the lowest efficiency are mainly concentrated in the wetland and mountainous areas (
Figure 7c), among which, the central part of the mountainous area in northern Hebei has been converted from forest to agriculture land, resulting in a decrease in ecological land use efficiency. A similar situation exists in the mountainous area of central Shandong. In addition, there is another way in which forests are degrading in the mountainous areas, such as through the conversion of high-coverage forest to a mix of low-coverage forest and grassland. The remaining areas with higher ecological land use efficiency are mostly concentrated in southwestern Hebei and in the eastern hilly areas of the Shandong Peninsula. In most areas of the HHH Plain, the ecological efficiency shows a moderate trend as a large amount of agriculture land is converted into construction land, which leads to a decline in ecosystem services. The areas with an ecological efficiency greater than one are those where the land cover has not changed, being mainly forestland and water bodies.
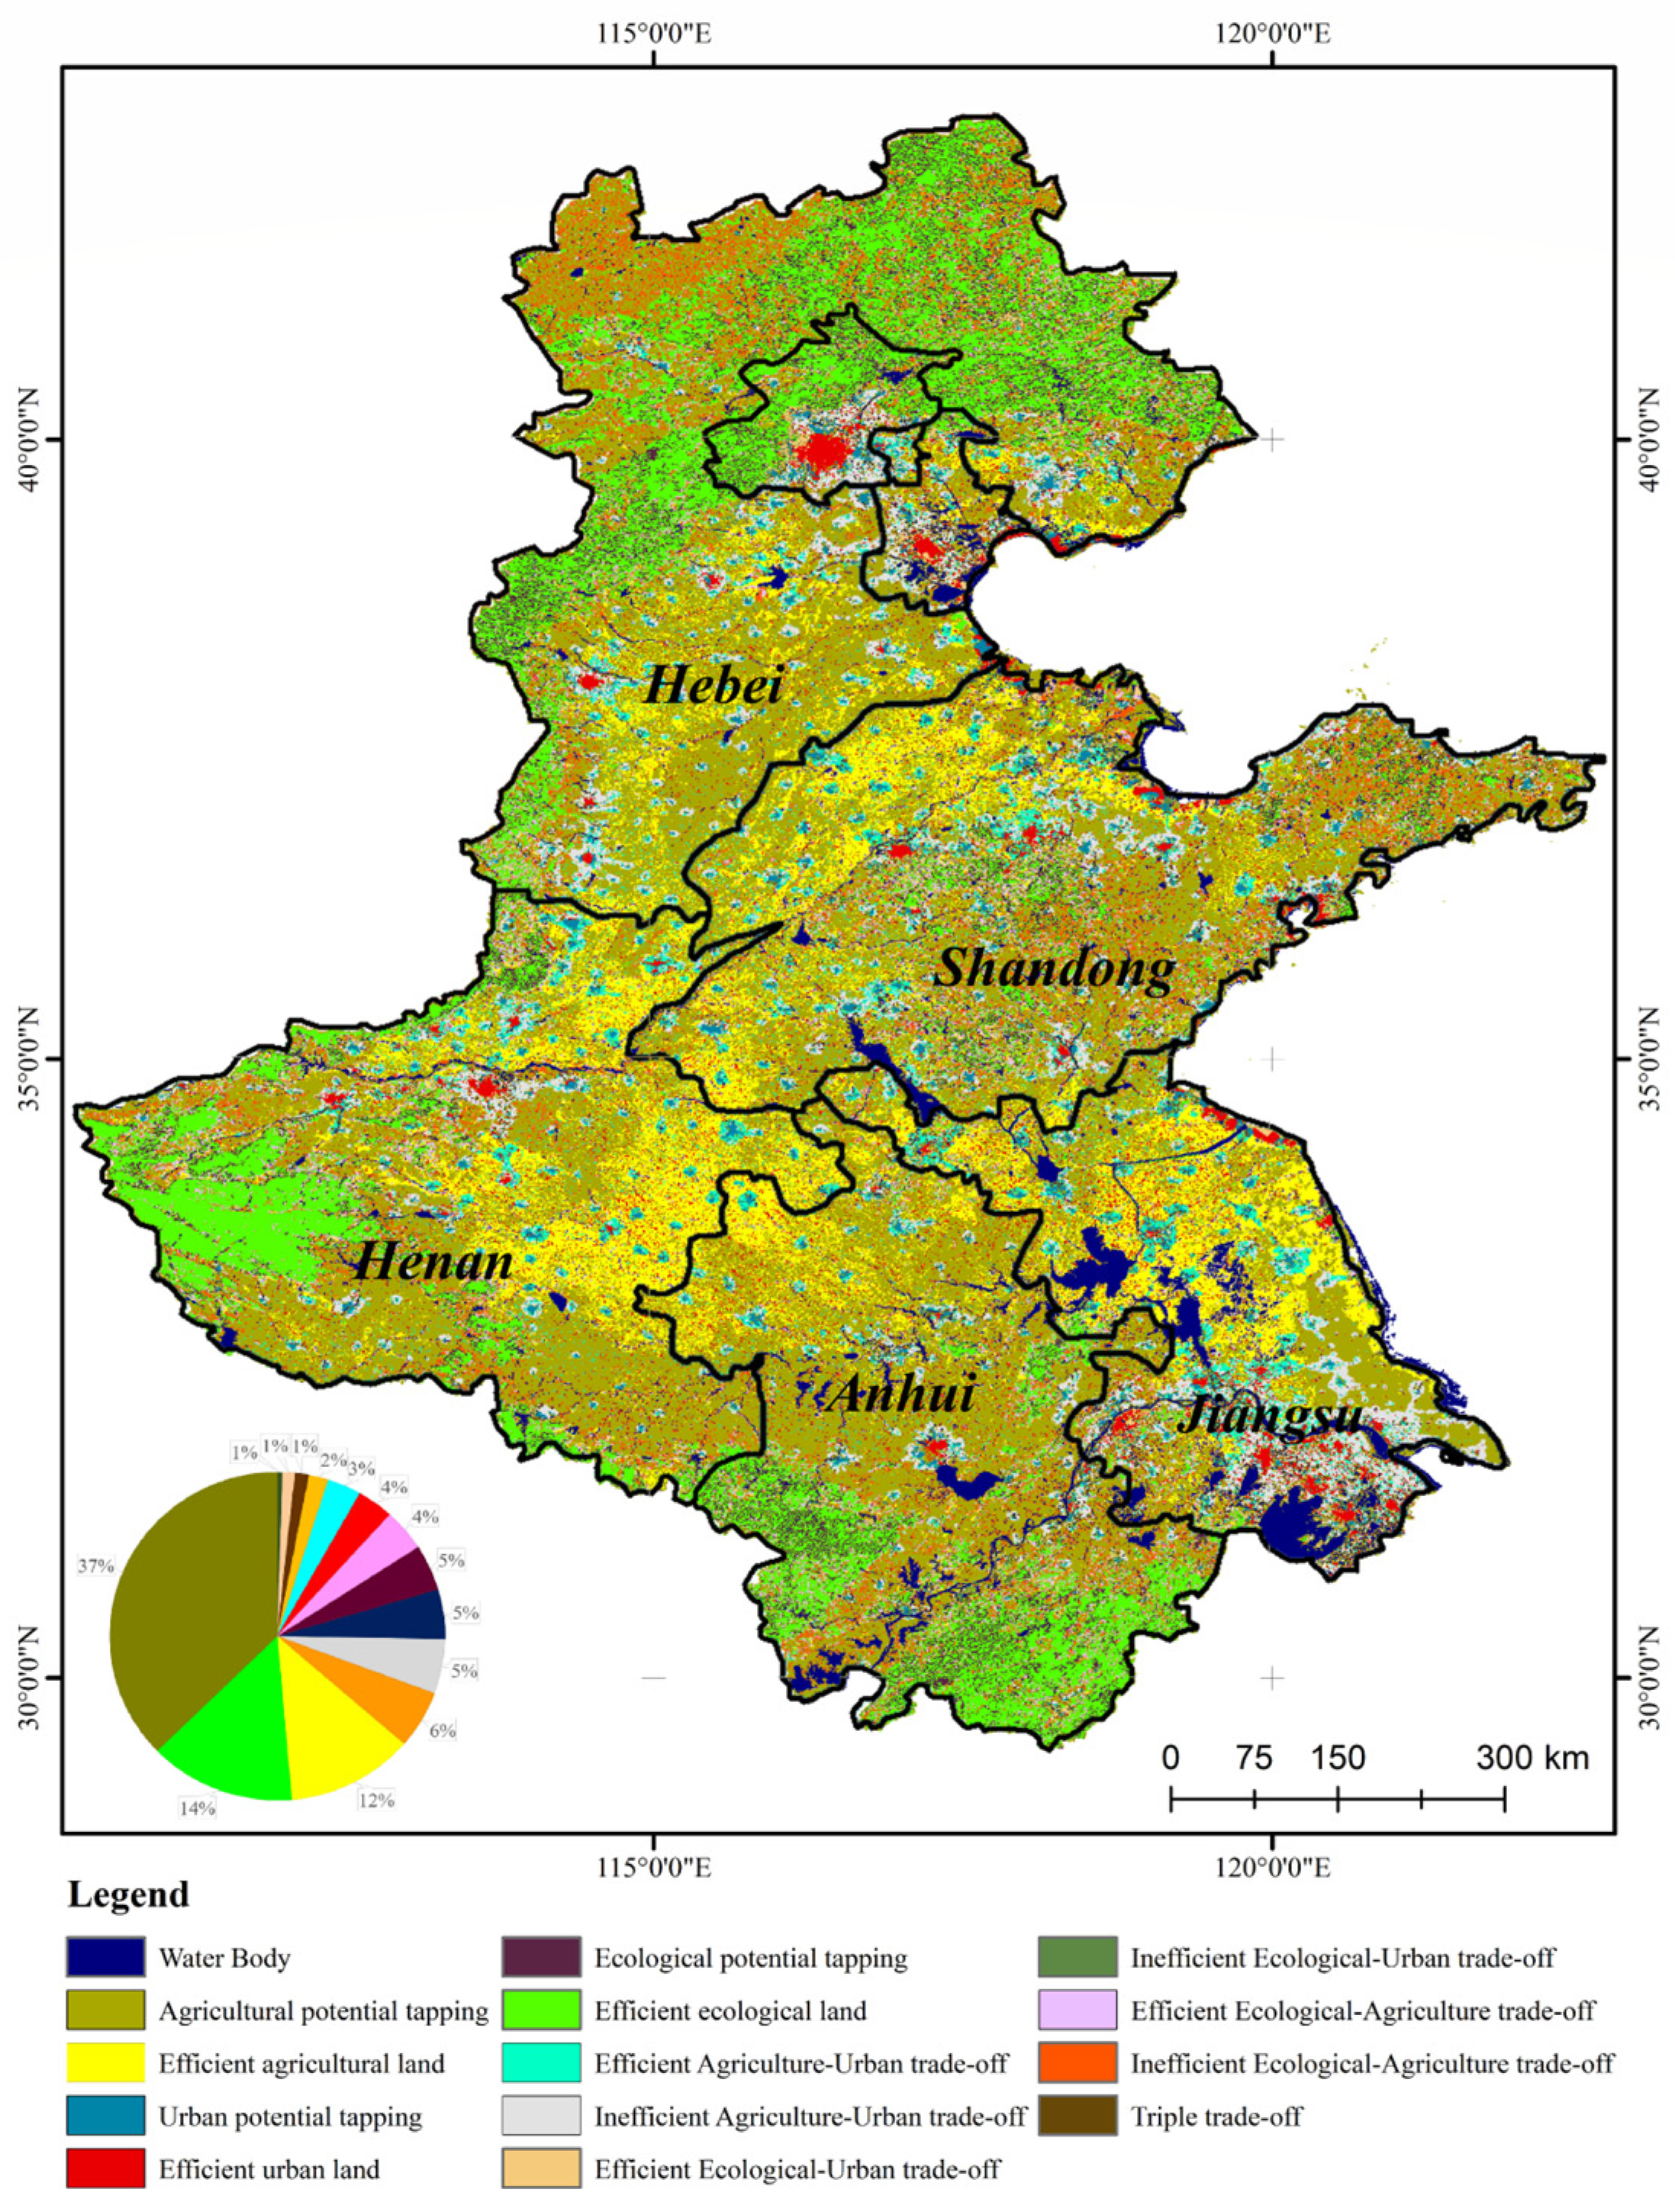
4.5. Zoning Trade-Offs among Land Space Utilization Efficiencies
To obtain a clearer and more comprehensive understanding of the potential and efficiency of the three land use functions, according to the classification criteria mentioned in 3.3, this section analyzes the trade-off attributes of the land units. Taken together, these results portray the conflicts and connections of various land use types and provide a reference for the land use trade-off analysis. The results are shown in
Figure 8.
The area with the largest proportion is the agricultural potential tapping area, which accounts for 14% of the total area, and is spread all over the study area. The ecologically efficient area accounted for 11%, and the land use types that maintained the greatest value of ecosystem services from 1980 to 2015 were mainly forest distributed in the mountainous areas. The high-efficiency agricultural production area accounts for approximately 7% of the study area and is mainly distributed in southern Hebei, northern Shandong, eastern Henan, and northern Jiangsu. Although the land in these regions does not have the best agricultural production conditions, the grain output is the highest, which shows the full exploitation of the potential of grain production. The ecological efficiency tapping area closely follows, accounting for approximately 5% of the study area, and it is mainly distributed in mountainous areas. Ecological land use efficiency in northern Hebei has much room for improvement. A considerable proportion of ecological land use efficiency tapping areas also exist in the mountainous areas of Shandong, where there is a certain degree of vegetation degradation. Due to the relatively flat terrain, there is competition between agriculture land and ecological land, which occupy approximately 64% of this region.
Additionally, the type that accounts for the largest proportion is the trade-off area between agriculture and urban land, accounting for approximately 8% of the study area, among which, the high-efficiency trade-off area represents the original land use function with higher efficiency (top 40%), and the low-efficiency trade-off area represents the low functional efficiency of the original land use (the last 60%). Among them, the low-efficiency trade-off area of the rural city accounts for approximately 70% of the rural–urban trade-off area, which is concentrated in the Beijing–Tianjin–Hebei connection area and the Yangtze River Delta area in southern Jiangsu. The common feature of these areas is that they have good agricultural production conditions and are also economically developed, and thus the agricultural productive potential has not been fully tapped, but the city still needs to expand further, which has led to land trade-offs between food production and urban expansion in these regions. The high-efficiency rural–urban competition area is mainly concentrated in the central area of the HHH Plain. These areas include many small- and medium-sized cities, and there is a certain demand for urban development. At the same time, these areas are also traditional agricultural production areas. Planting makes agriculture land use more efficient. In addition, as mentioned above, high-efficiency construction land is mainly concentrated in large cities and residential areas, while industrial and mining land is concentrated in the countryside, and the land to be further developed is mainly distributed in many small- and medium-sized cities in the middle of the HHH Plain. These cities were mainly created by population agglomeration, and their land use efficiency is relatively low.
In addition to the centralized land use types already mentioned, the remaining three functional trade-off types and the ecological–urban trade-off type account for only a small proportion, approximately 6% of the study area, of which the ecological–construction land competition type accounts for 1%, mainly distributed in urban areas adjacent to mountainous areas, and the balance of the three accounts for approximately 1%, concentrated in northern Hebei and southern Anhui.
5. Discussion
At present, when discussing different land use functions, scholars tend to pay more attention to their potential or suitability. The stronger the suitability of a certain land use mode is, the more suitable the land will be for this function. This can indeed directly represent the sequence of different land use functions, but it cannot effectively reflect the competitive relationship between them. Land use potential is a constant representation, which cannot reflect the characteristics of land use status. In this study, the combination of potential and efficiency effectively represented information on the land use function constant and the current situation. When a land use mode of a certain land has high potential but low land use efficiency, it means that this land function has been encroached upon by other functions. When the relationship between this potential and efficiency is expressed qualitatively or quantitatively, we can clearly judge the competition and tradeoff relationship between different land use functions. Such information can be added to the discussion of the dialectical relationship between land use potential and efficiency in subsequent planning and decision-making. This is where the innovation of this study is reflected. Different from using correlation relations to characterize land use trade-offs and synergies [
54,
55,
56], it is based on the mining of model simulation results and historical data, and it uses the evaluation framework of potential and efficiency to quantitatively describe the status quo of certain land use functions, characterizing the competition and tradeoff between different land use functions based on this quantitative status quo. Thus, it can provide a reference for land use planning or land use management more directly.
5.1. Land Use Potential and Land Use Efficiency
Land is a scarce resource, and the best approach is to improve the efficiency of resource utilization as it is believed that efficiency plays an important role in the trade-off relationships between different land uses. The results show that as an important grain-producing area in China, the HHH Plain is rich in agriculture land, but more than half of it should be used to improve crop yields and reduce environmental impacts through improved land management and agriculture practices [
57,
58,
59,
60]. In terms of urban expansion, outside of Beijing, Tianjin, southern Jiangsu, and several provincial capitals, the urban land use efficiency of most small- and medium-sized cities does not exceed 0.5, which indicates that, to a large extent, economic development and urbanization level improvement do not depend on the expansion of urban areas [
61]. Knowing how to make good use of the existing construction land and how to develop industries represent the top priorities for these cities. Overall, land use potential and efficiency are two important aspects of land use trade-off analysis. Only by taking these two parts into consideration can we achieve scientific planning and smart development and achieve the efficient use of limited land resources.
5.2. Trade-Off in Land and Space Planning
Limited land resources support the three major functions of human social production, life, and ecology, so the trade-offs are inevitable among them. Previous researchers found that China is in an important period of simultaneous urbanization and ruralization [
62,
63,
64], and this phenomenon is particularly obvious in the HHH area. Unplanned urban expansion will encroach on agriculture land, and previous studies have shown that global urban expansion will reduce global agriculture land by 1.8–2.4% by 2030. In addition to the trade-off between urban and agriculture land, there are also trade-offs between agriculture land and ecology land and between ecology land and urban land. This study found that the trade-off between ecology land and agriculture land is mainly distributed in the mountainous areas. The ecological land in northern Hebei and central Shandong tends to shift to agriculture land. The potential of agriculture land in the mountainous areas in the northern part of the HHH Plain is not high, but the agricultural production efficiency is close to one, which indicates that the agriculture land efficiency in the mountainous areas has little room for further improvement but has a relatively high ecological potential. Although the HHH Plain is not the main area of the Chinese Grain for Green (GFG) program, withdrawing agriculture land in mountainous areas to further strengthen the ecological functions and improve ecological efficiency should be implemented. Presently, China has entered a stage of high-quality development. The intensive and efficient use of land has been a basic requirement, and it also must be considered in space planning. Land uses with multiple types of suitability lead to conflicts, and thus trade-off analyses should be added to the space planning from a more scientific and objective perspective.
5.3. Policy Implications
This research reveals the spatial distribution of the potential, efficiency, and subtypes of land use trade-offs of the three land use functions in the HHH Plain, and there is still room for further improvement in land use efficiency; therefore, relevant policies should be carried out. In terms of the construction land, its efficiency in small- and medium-sized cities and rural areas needs to be improved. In the past 30 years, the HHH Plain has experienced rapid urban expansion, resulting in a large stock of construction land, and the government should aim at saving and controlling its increase, and actively improve the efficiency of construction land. Additionally, it is necessary to establish and improve relevant inventory and supervision measures to effectively solve the problem of idle land. Insufficient agricultural infrastructure and a low level of agricultural management are the two main reasons for the low efficiency of agriculture land in some regions. At present, the Chinese government is vigorously promoting the construction of high-standard agriculture land, which is aimed at improving the level of agricultural facilities and improving the efficiency of agriculture land. At the same time, policies should also focus on improving the overall quality of farmers, for example, regular training in agriculture land management, strengthening the promotion of smart agriculture, exposing farmers to advanced agricultural technologies, and applying them in practice to improve the efficiency of agriculture land use. As for the ecological land use efficiency, most inefficient ecological land use is in mountainous areas, where ecological land and agriculture land present a clear trade-off phenomenon. Therefore, in the areas with a low efficiency of ecological land use, the policy of returning agriculture land to forest or grassland still needs to be strengthened, and more conservation measures should be implemented in the areas with high ecological potential.
Land consolidation is an important policy tool to improve the efficiency of land use and coordinate the contradiction of land use functions. Based on the present situation of land use, land consolidation can obtain the coordination of the land by adjusting the structure and re-distribution of the land, which will promote the sustainable utilization of land resources and socio-economic sustainable development. Therefore, the HHH Plain should use land consolidation as a platform to improve the existing construction land approval system, strictly implement the agriculture land and ecological land protection system to realize the allocation and management of land resources, and refine the types of land use trade-offs to rationally excavate the potential benefits of land space utilization in agricultural production, economic development, and ecological protection.
6. Conclusions
This research integrated the ESLP model, machine learning, and ecosystem service evaluation method to construct a land use trade-off analysis framework that takes land use potential and efficiency as the starting points. An analysis of the trade-off relationships among three functions provides a scientific reference for land and space planning and smart land use in the HHH area, and has certain scientific value and practical significance.
The results reflect the basic land use status in the study area. As an important agricultural production area in China, the HHH area, plays an important role in ensuring China’s food security, and more than 80% of the study area is made up of agricultural land. At the same time, as one of the fastest growing urbanization areas in China, the HHH area is also facing important conflicts between grain production and constructed land, especially in the 19 national-level urban agglomerations included in China’s future plans. All urban agglomerations are included in the study area, which will make the conflict between food production and urban expansion in this region more acute in the future. In the context of ecological civilization construction and carbon neutrality, ecological land restoration is also of great significance, and policies must be made to slow down the degradation of the ecological land use functions and to reduce the interference of human activities in the ecosystem. The results obtained in this study are consistent with the actual situation and have a high degree of credibility.
This analysis framework is not only applicable to the HHH area, but also to other regions with certain historical data accumulation. In essence, the evaluation of potential and efficiency in this study is based on the results obtained from mining historical and current data, and such data mining is universal, rather than only applicable to a certain region.


