
Multi-Temporal Assessment of Remotely Sensed Autumn Grass Senescence across Climatic and Topographic Gradients


Abstract
:1. Introduction
2. Materials and Methods
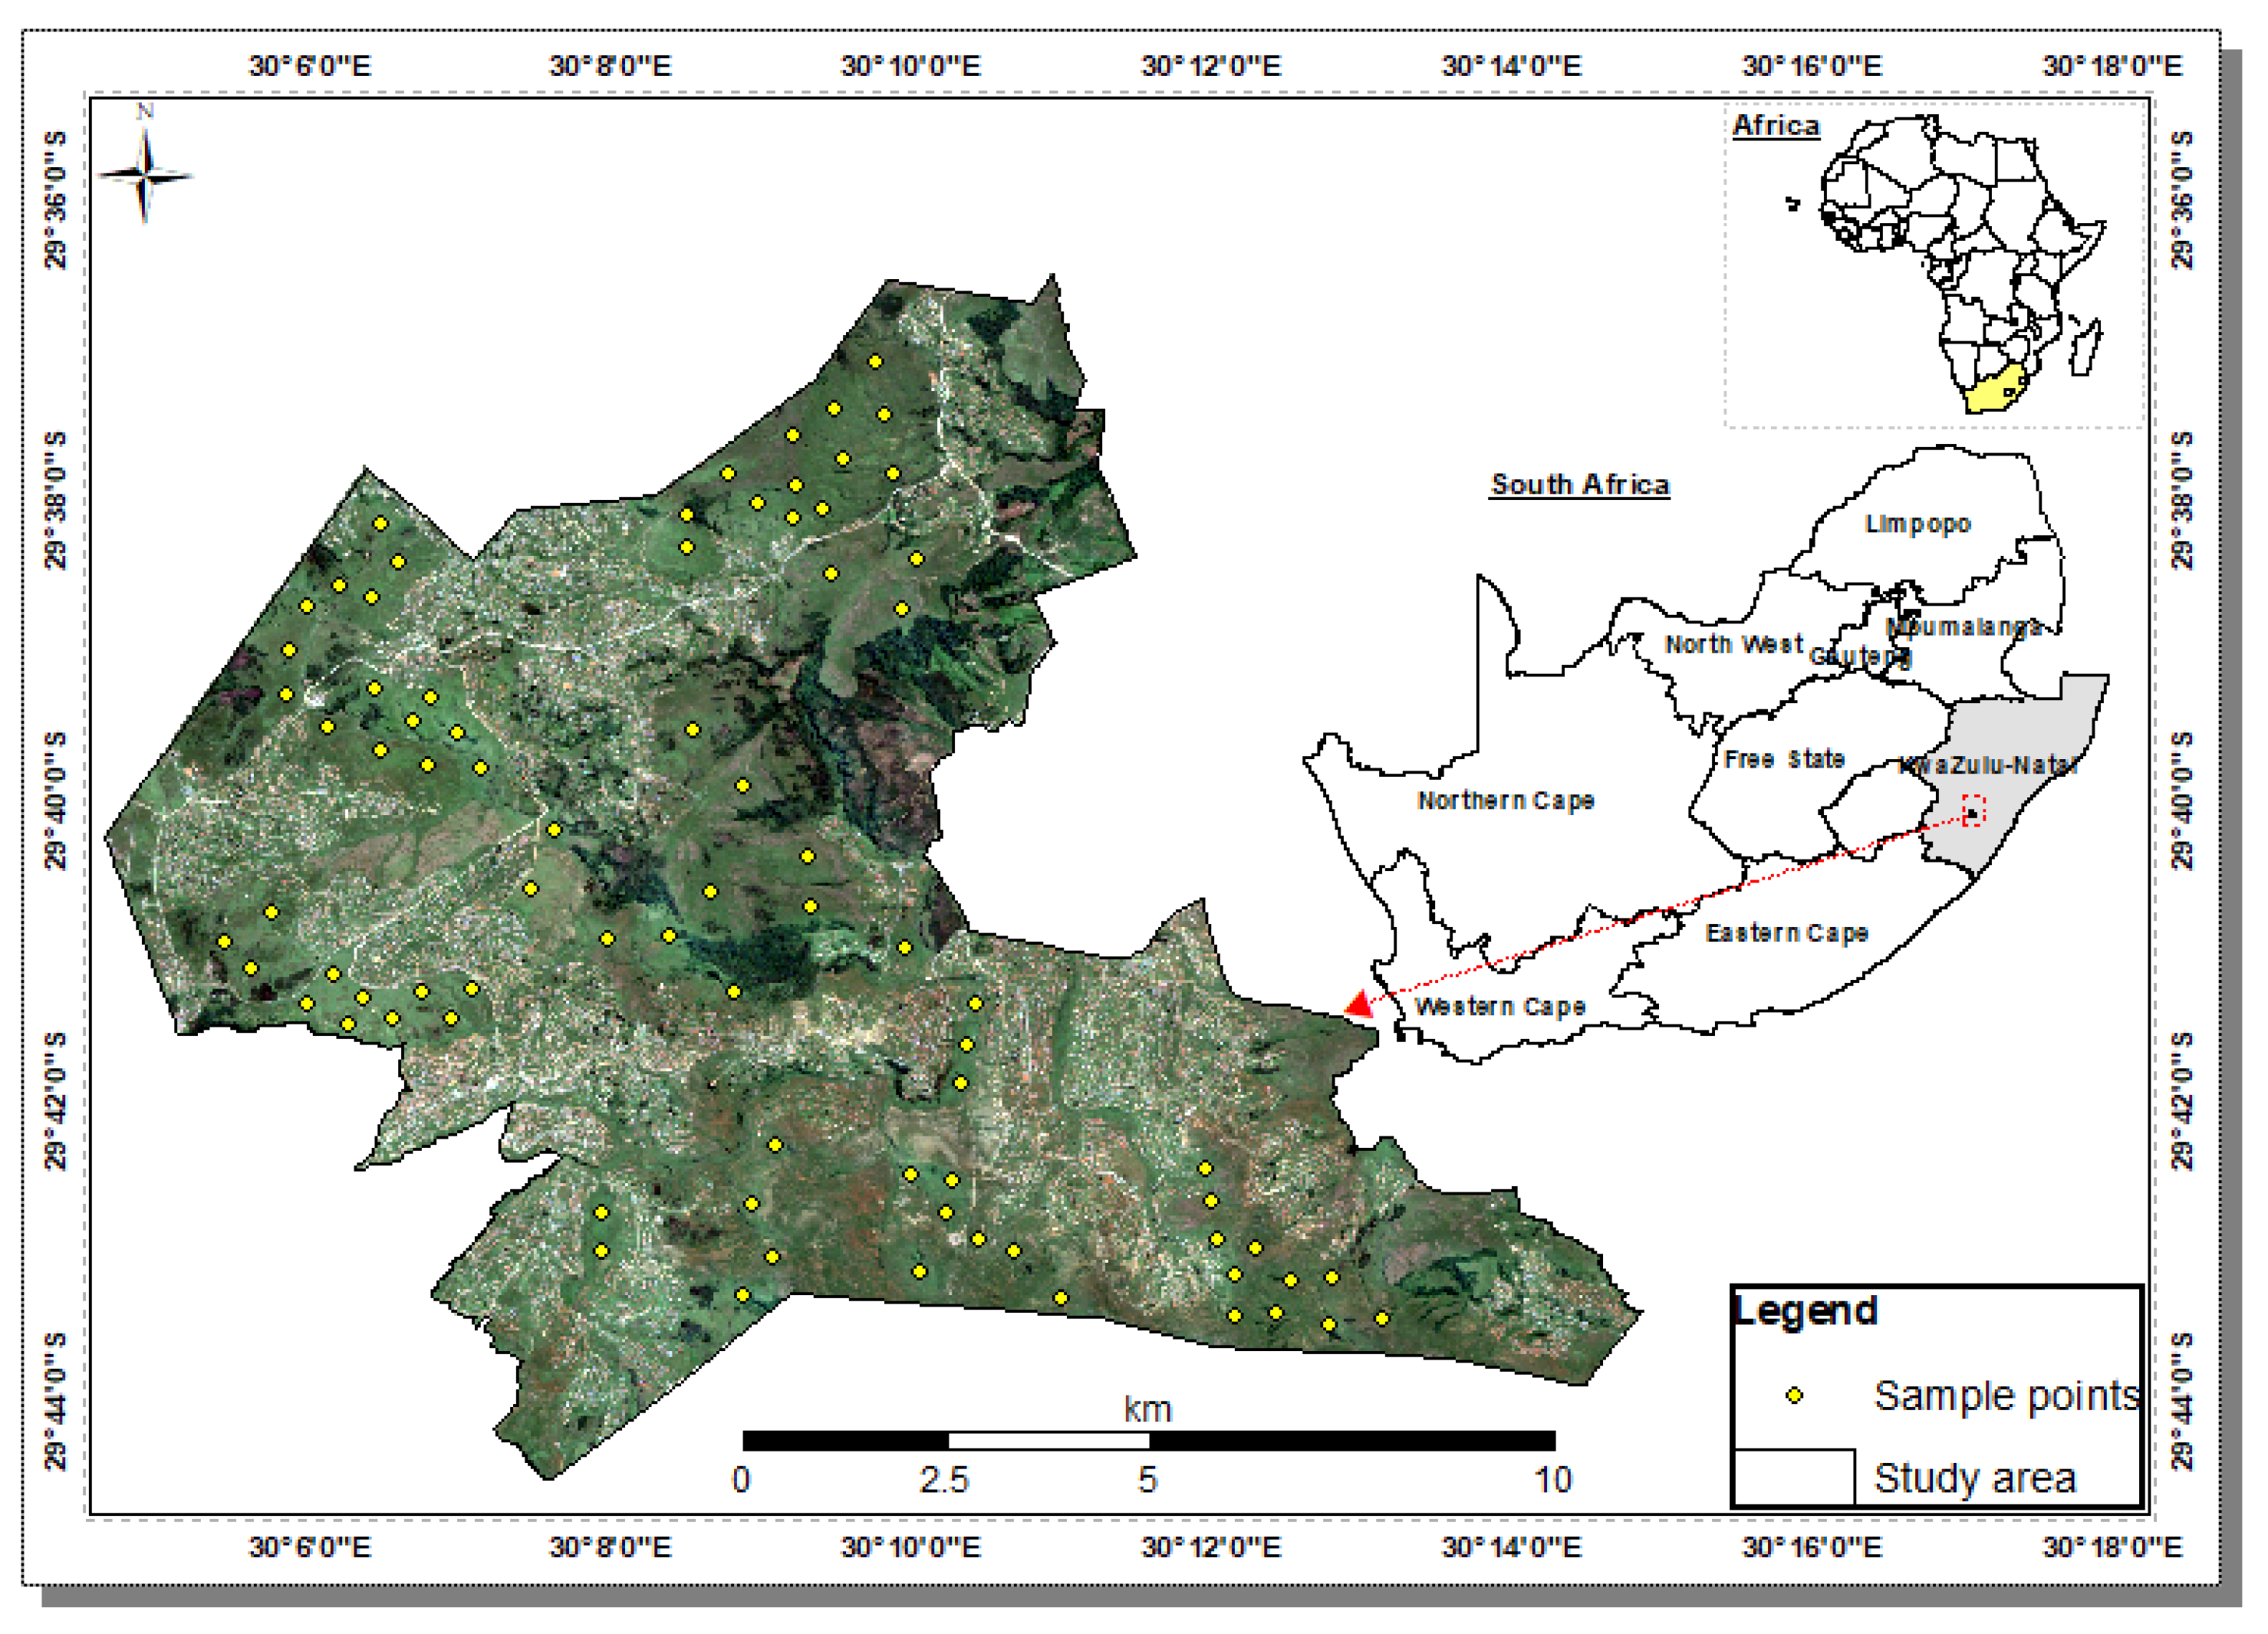
2.1. The Study Site
2.2. Field Data Collection
2.3. Remotely Sensed Autumn Grass Senescence
2.4. Climatic and Topographic Variables
2.5. Data Processing and Statistical Analysis
2.6. Model Optimization and Identification of Key Environmental Determinants of Autumn Grassland Senescence
3. Results
3.1. Descriptive Statistics
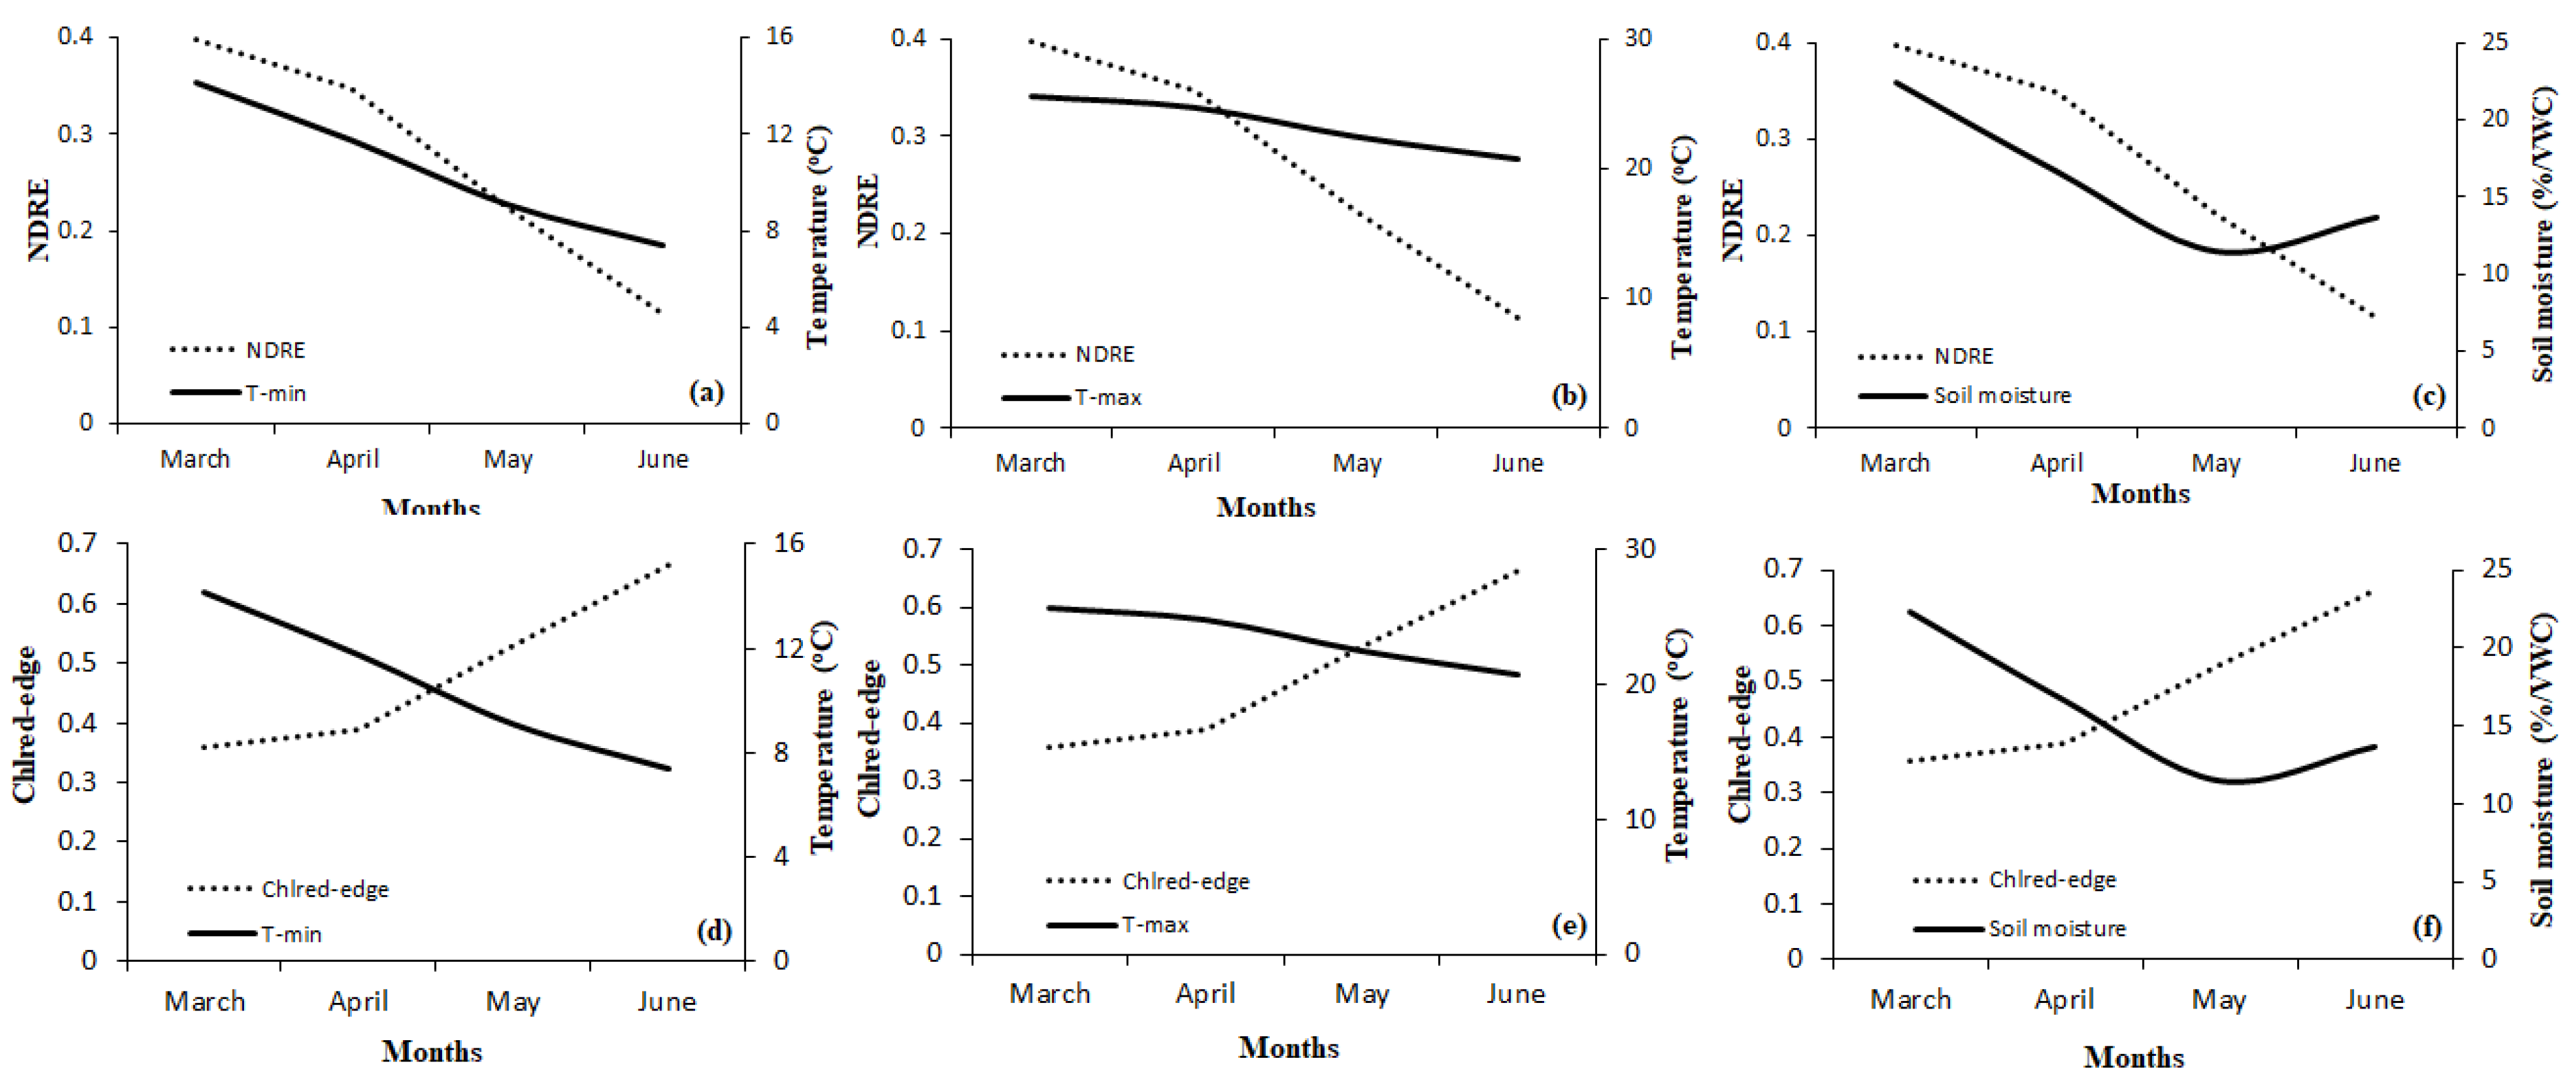
3.2. Remotely Sensed Autumn Grass Senescence with Climatic and Topographic Variables
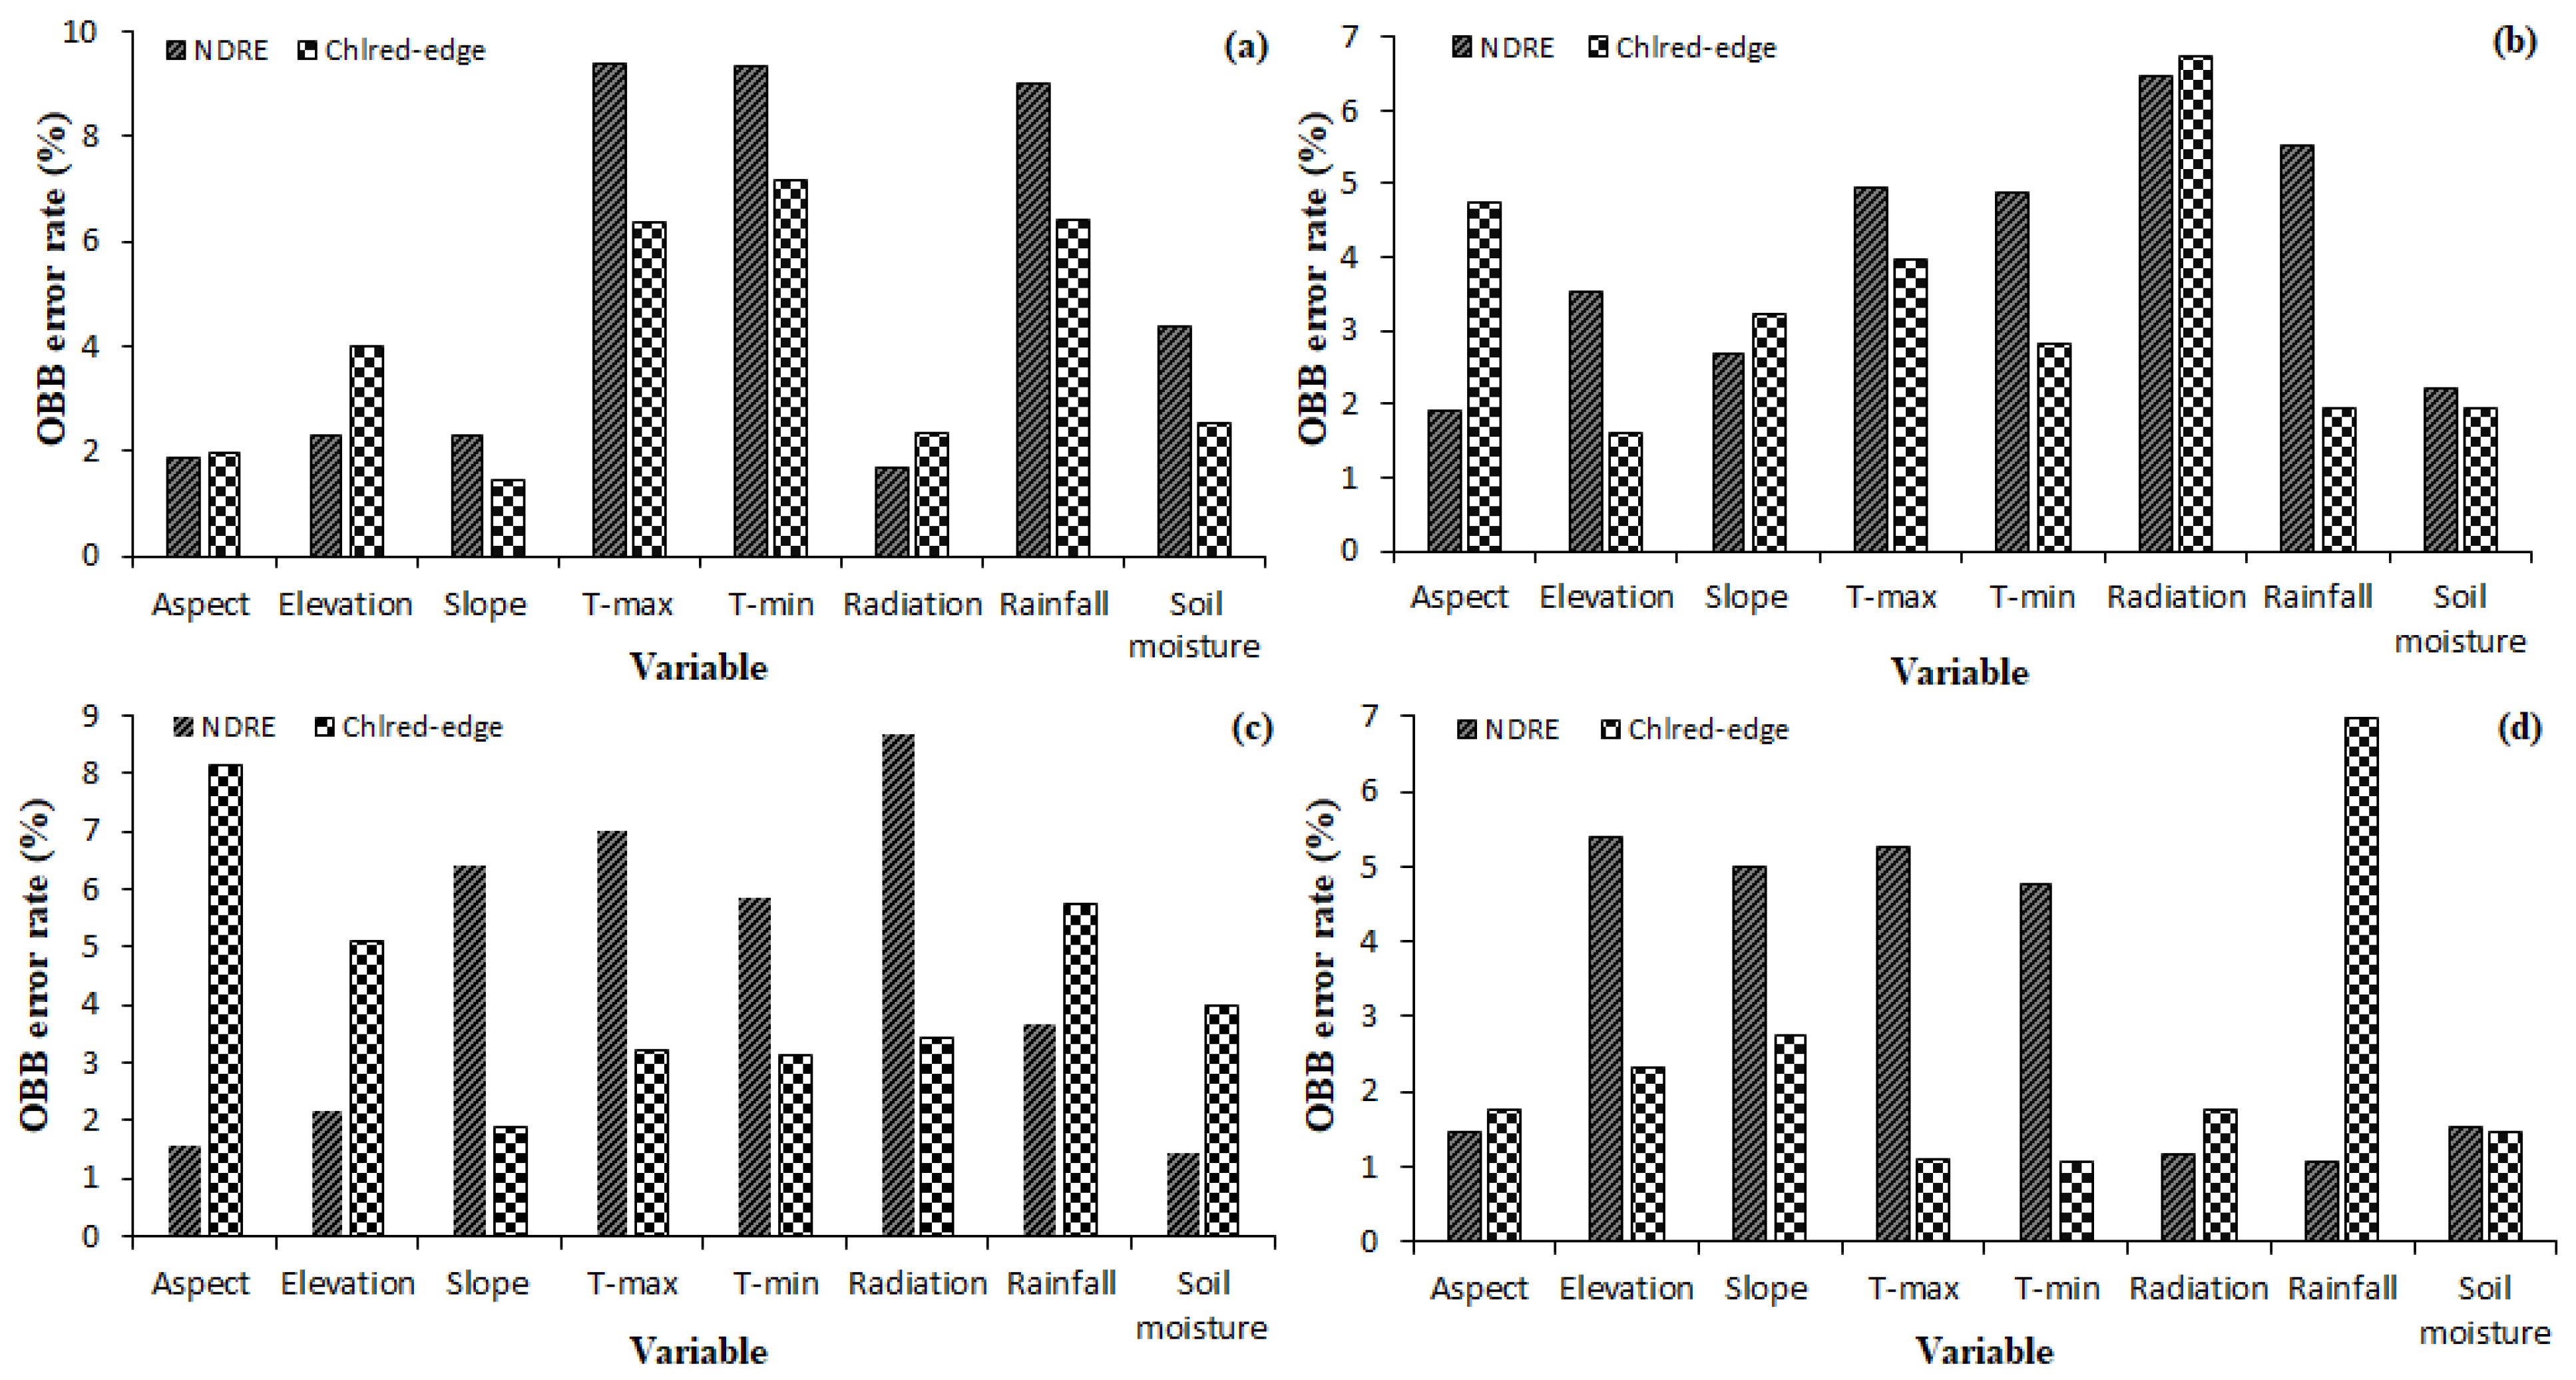
3.3. Climatic and Topographic Drivers of the Autumn Grassland Senescence
4. Discussion
5. Conclusions
Author Contributions
Funding
Data Availability Statement
Acknowledgments
Conflicts of Interest
References
- Tao, Z.; Ge, Q.; Wang, H.; Dai, J. The important role of soil moisture in controlling autumn phenology of herbaceous plants in the Inner Mongolian steppe. Land Degrad. Dev. 2021, 32, 3698–3710. [Google Scholar] [CrossRef]
- Shoko, C.; Mutanga, O.; Dube, T. Remotely sensed C3 and C4 grass species aboveground biomass variability in response to seasonal climate and topography. Afr. J. Ecol. 2019, 57, 477–489. [Google Scholar] [CrossRef]
- Wu, C.; Wang, X.; Wang, H.; Ciais, P.; Peñuelas, J.; Myneni, R.B.; Desai, A.R.; Gough, C.M.; Gonsamo, A.; Black, A.T. Contrasting responses of autumn-leaf senescence to daytime and night-time warming. Nat. Clim. Change 2018, 8, 1092–1096. [Google Scholar] [CrossRef] [Green Version]
- Liu, G.; Chen, X.; Zhang, Q.; Lang, W.; Delpierre, N. Antagonistic effects of growing season and autumn temperatures on the timing of leaf coloration in winter deciduous trees. Glob. Change Biol. 2018, 24, 3537–3545. [Google Scholar] [CrossRef] [PubMed]
- Tao, Z.; Wang, H.; Dai, J.; Alatalo, J.; Ge, Q. Modeling spatiotemporal variations in leaf coloring date of three tree species across China. Agric. For. Meteorol. 2018, 249, 310–318. [Google Scholar] [CrossRef]
- Liu, Q.; Fu, Y.H.; Zeng, Z.; Huang, M.; Li, X.; Piao, S. Temperature, precipitation, and insolation effects on autumn vegetation phenology in temperate China. Glob. Change Biol. 2016, 22, 644–655. [Google Scholar] [CrossRef] [PubMed]
- McKean, J.; Buechel, S.; Gaydos, L. Remote sensing and landslide hazard assessment. Photogramm. Eng. Remote Sens. 1991, 57, 1185–1193. [Google Scholar]
- Gepstein, S.; Sabehi, G.; Carp, M.J.; Hajouj, T.; Nesher, M.F.O.; Yariv, I.; Dor, C.; Bassani, M. Large-scale identification of leaf senescence-associated genes. Plant J. 2003, 36, 629–642. [Google Scholar] [CrossRef]
- Royimani, L.; Mutanga, O.; Dube, T. Progress in remote sensing of plant senescence: A review on the challenges and opportunities. IEEE J. Sel. Top. Appl. Earth Obs. Remote Sens. 2021, 14, 7714–7723. [Google Scholar] [CrossRef]
- Royimani, L.; Mutanga, O.; Odindi, J.; Sibanda, M.; Chamane, S. Determining the onset of autumn grass senescence in subtropical sour-veld grasslands using remote sensing proxies and the breakpoint approach. Ecol. Inform. 2022, 69, 101651. [Google Scholar] [CrossRef]
- Anderegg, J.; Yu, K.; Aasen, H.; Walter, A.; Liebisch, F.; Hund, A. Spectral vegetation indices to track senescence dynamics in diverse wheat germplasm. Front. Plant Sci. 2020, 10, 1749. [Google Scholar] [CrossRef] [PubMed]
- Munné-Bosch, S.; Alegre, L. Die and let live: Leaf senescence contributes to plant survival under drought stress. Funct. Plant Biol. 2004, 31, 203–216. [Google Scholar] [CrossRef] [PubMed]
- Mariën, B.; Dox, I.; De Boeck, H.J.; Willems, P.; Leys, S.; Papadimitriou, D.; Campioli, M. Does drought advance the onset of autumn leaf senescence in temperate deciduous forest trees? Biogeosciences 2021, 18, 3309–3330. [Google Scholar] [CrossRef]
- Royimani, L.; Mutanga, O.; Odindi, J.; Dube, T.; Matongera, T.N. Advancements in satellite remote sensing for mapping and monitoring of alien invasive plant species (AIPs). Phys. Chem. Earth Parts A/B/C 2019, 112, 237–245. [Google Scholar] [CrossRef]
- Royimani, L.; Mutanga, O.; Odindi, J.; Zolo, K.S.; Sibanda, M.; Dube, T. Distribution of Parthenium hysterophoru L. with variation in rainfall using multi-year SPOT data and random forest classification. Remote Sens. Appl. Soc. Environ. 2019, 13, 215–223. [Google Scholar] [CrossRef]
- Sibanda, M.; Mutanga, O.; Rouget, M. Comparing the spectral settings of the new generation broad and narrow band sensors in estimating biomass of native grasses grown under different management practices. GISci. Remote Sens. 2016, 53, 614–633. [Google Scholar] [CrossRef]
- Makanza, R.; Zaman-Allah, M.; Cairns, J.E.; Magorokosho, C.; Tarekegne, A.; Olsen, M.; Prasanna, B.M. High-throughput phenotyping of canopy cover and senescence in maize field trials using aerial digital canopy imaging. Remote Sens. 2018, 10, 330. [Google Scholar] [CrossRef] [Green Version]
- Renier, C.; Waldner, F.; Jacques, D.C.; Ebbe, M.A.B.; Cressman, K.; Defourny, P. A dynamic vegetation senescence indicator for near-real-time desert locust habitat monitoring with MODIS. Remote Sens. 2015, 7, 7545–7570. [Google Scholar] [CrossRef] [Green Version]
- Sibanda, M.; Onisimo, M.; Dube, T.; Mabhaudhi, T. Quantitative assessment of grassland foliar moisture parameters as an inference on rangeland condition in the mesic rangelands of southern Africa. Int. J. Remote Sens. 2021, 42, 1474–1491. [Google Scholar] [CrossRef]
- Singh, L.; Mutanga, O.; Mafongoya, P.; Peerbhay, K.Y. Multispectral mapping of key grassland nutrients in KwaZulu-Natal, South Africa. J. Spat. Sci. 2018, 63, 155–172. [Google Scholar] [CrossRef]
- Delta-T Devices. Thetakit User Guide: ML3-Kit. Available online: https://delta-t.co.uk/wp-content/uploads/2016/09/ML3_Kit_User_Guide_ver_1.0.pdf (accessed on 22 February 2021).
- Dube, T.; Mutanga, O. The impact of integrating WorldView-2 sensor and environmental variables in estimating plantation forest species aboveground biomass and carbon stocks in uMgeni Catchment, South Africa. ISPRS J. Photogramm. Remote Sens. 2016, 119, 415–425. [Google Scholar] [CrossRef]
- Ruiz-Arias, J.; Tovar-Pescador, J.; Pozo-Vázquez, D.; Alsamamra, H. A comparative analysis of DEM-based models to estimate the solar radiation in mountainous terrain. Int. J. Geogr. Inf. Sci. 2009, 23, 1049–1076. [Google Scholar] [CrossRef]
- Kumar, L.; Skidmore, A.K.; Knowles, E. Modelling topographic variation in solar radiation in a GIS environment. Int. J. Geogr. Inf. Sci. 1997, 11, 475–497. [Google Scholar] [CrossRef]
- R Core Team. R: A Language and Environment for Statistical Computing; R Foundation for Statistical Computing: Vienna, Austria, 2021; Available online: https://www.R-project.org/ (accessed on 5 April 2022).
- Ndlovu, M.; Clulow, A.D.; Savage, M.J.; Nhamo, L.; Magidi, J.; Mabhaudhi, T. An assessment of the impacts of climate variability and change in KwaZulu-Natal Province, South Africa. Atmosphere 2021, 12, 427. [Google Scholar] [CrossRef]
- Ismail, R.; Crous, J.; Sale, G.; Morris, A.R.; Peerbhay, K.Y. Developing a satellite-based frost risk model for the Southern African commercial forestry landscape. South. For. A J. For. Sci. 2021, 83, 10–18. [Google Scholar] [CrossRef]
- Fracheboud, Y.; Luquez, V.; Bjorken, L.; Sjodin, A.; Tuominen, H.; Jansson, S. The control of autumn senescence in European aspen. Plant Physiol. 2009, 149, 1982–1991. [Google Scholar] [CrossRef] [Green Version]
- Sade, N.; del Mar Rubio-Wilhelmi, M.; Umnajkitikorn, K.; Blumwald, E. Stress-induced senescence and plant tolerance to abiotic stress. J. Exp. Bot. 2018, 69, 845–853. [Google Scholar] [CrossRef]
- Van der Walt, A.J.; Fitchett, J.M. Statistical classification of South African seasonal divisions on the basis of daily temperature data. S. Afr. J. Sci. 2020, 116, 1–15. [Google Scholar] [CrossRef]
- Mutanga, O.; Adam, E.; Cho, M.A. High density biomass estimation for wetland vegetation using WorldView-2 imagery and random forest regression algorithm. Int. J. Appl. Earth Obs. Geoinf. 2012, 18, 399–406. [Google Scholar] [CrossRef]


| Variable | Units of Measurement | Source |
|---|---|---|
| Topographic factors | ||
| Aspect | Degrees North (°N) | ASTER DEM |
| Elevation | Miters (m) | ASTER DEM |
| Slope | Degrees (°) | ASTER DEM |
| Climatic factor | ||
| Tmin | Degrees Celsius (°C) | SAWS, KZN-SRI |
| Tmax | Degrees Celsius (°C) | SAWS, KZN-SRI |
| Rainfall | Millimeters (mm) | SAWS, KZN-SRI |
| Radiation | Watts Hours per square meter (Wh/m2) | ASTER DEM |
| Month | Variable | Min | Max | Mean | Stdv |
|---|---|---|---|---|---|
| March | NDRE | 0.248 | 0.532 | 0.396 | 0.057 |
| Chlred-edge | 0.239 | 0.519 | 0.357 | 0.058 | |
| Aspect | 7.723 | 340.649 | 144.777 | 87.127 | |
| Elevation | 1273 | 1412 | 1340 | 30.359 | |
| Slope | 0.512 | 19.411 | 5.702 | 3.860 | |
| Tmax | 25.5 | 25.85 | 25.65 | 0.131 | |
| Tmin | 13.68 | 14.66 | 14.13 | 0.398 | |
| Radiation | 22,878 | 232,161 | 150,843 | 65,496.12 | |
| Rainfall | 69.44 | 87.65 | 79.39 | 7.095 | |
| Soil moisture | 12.5 | 34.9 | 22.43 | 3.764 | |
| April | NDRE | 0.182 | 0.477 | 0.346 | 0.051 |
| Chlred-edge | 0.266 | 0.562 | 0.390 | 0.056 | |
| Aspect | 7.723 | 340.649 | 144.777 | 87.127 | |
| Elevation | 1273 | 1412 | 1340 | 30.359 | |
| Slope | 0.512 | 19.411 | 5.702 | 3.860 | |
| Tmax | 24.51 | 25.08 | 24.78 | 0.217 | |
| Tmin | 11.25 | 12.21 | 11.71 | 0.387 | |
| Radiation | 20,736 | 256,029 | 138,918 | 75,657.96 | |
| Rainfall | 58.5 | 64.74 | 62.04 | 2.137 | |
| Soil moisture | 10.1 | 30.1 | 16.36 | 4.505 | |
| May | NDRE | 0.108 | 0.291 | 0.223 | 0.034 |
| Chlred-edge | 0.266 | 0.562 | 0.390 | 0.049 | |
| Aspect | 7.723 | 340.649 | 144.777 | 87.127 | |
| Elevation | 1273 | 1412 | 1340 | 30.359 | |
| Slope | 0.512 | 19.411 | 5.702 | 3.860 | |
| Tmax | 22.2 | 22.85 | 22.51 | 0.262 | |
| Tmin | 8.481 | 9.672 | 9.057 | 0.488 | |
| Radiation | 19,653 | 304,608 | 137,763 | 87,583.85 | |
| Rainfall | 13.86 | 15.25 | 14.64 | 0.401 | |
| Soil moisture | 0.685 | 21.030 | 11.269 | 4.289 | |
| June | NDRE | −0.004 | 0.203 | 0.113 | 0.050 |
| Chlred-edge | 0.522 | 1.076 | 0.666 | 0.111 | |
| Aspect | 7.723 | 340.649 | 144.777 | 87.127 | |
| Elevation | 1273 | 1412 | 1340 | 30.359 | |
| Slope | 0.512 | 19.411 | 5.702 | 3.860 | |
| Tmax | 20.43 | 21.14 | 20.77 | 0.283 | |
| Tmin | 6.876 | 7.919 | 7.379 | 0.418 | |
| Radiation | 22,430 | 303,014 | 131,301 | 89,098.69 | |
| Rainfall | 30.46 | 37.7 | 34.34 | 2.862 | |
| Soil moisture | 10.8 | 26.7 | 18.97 | 3.898 |
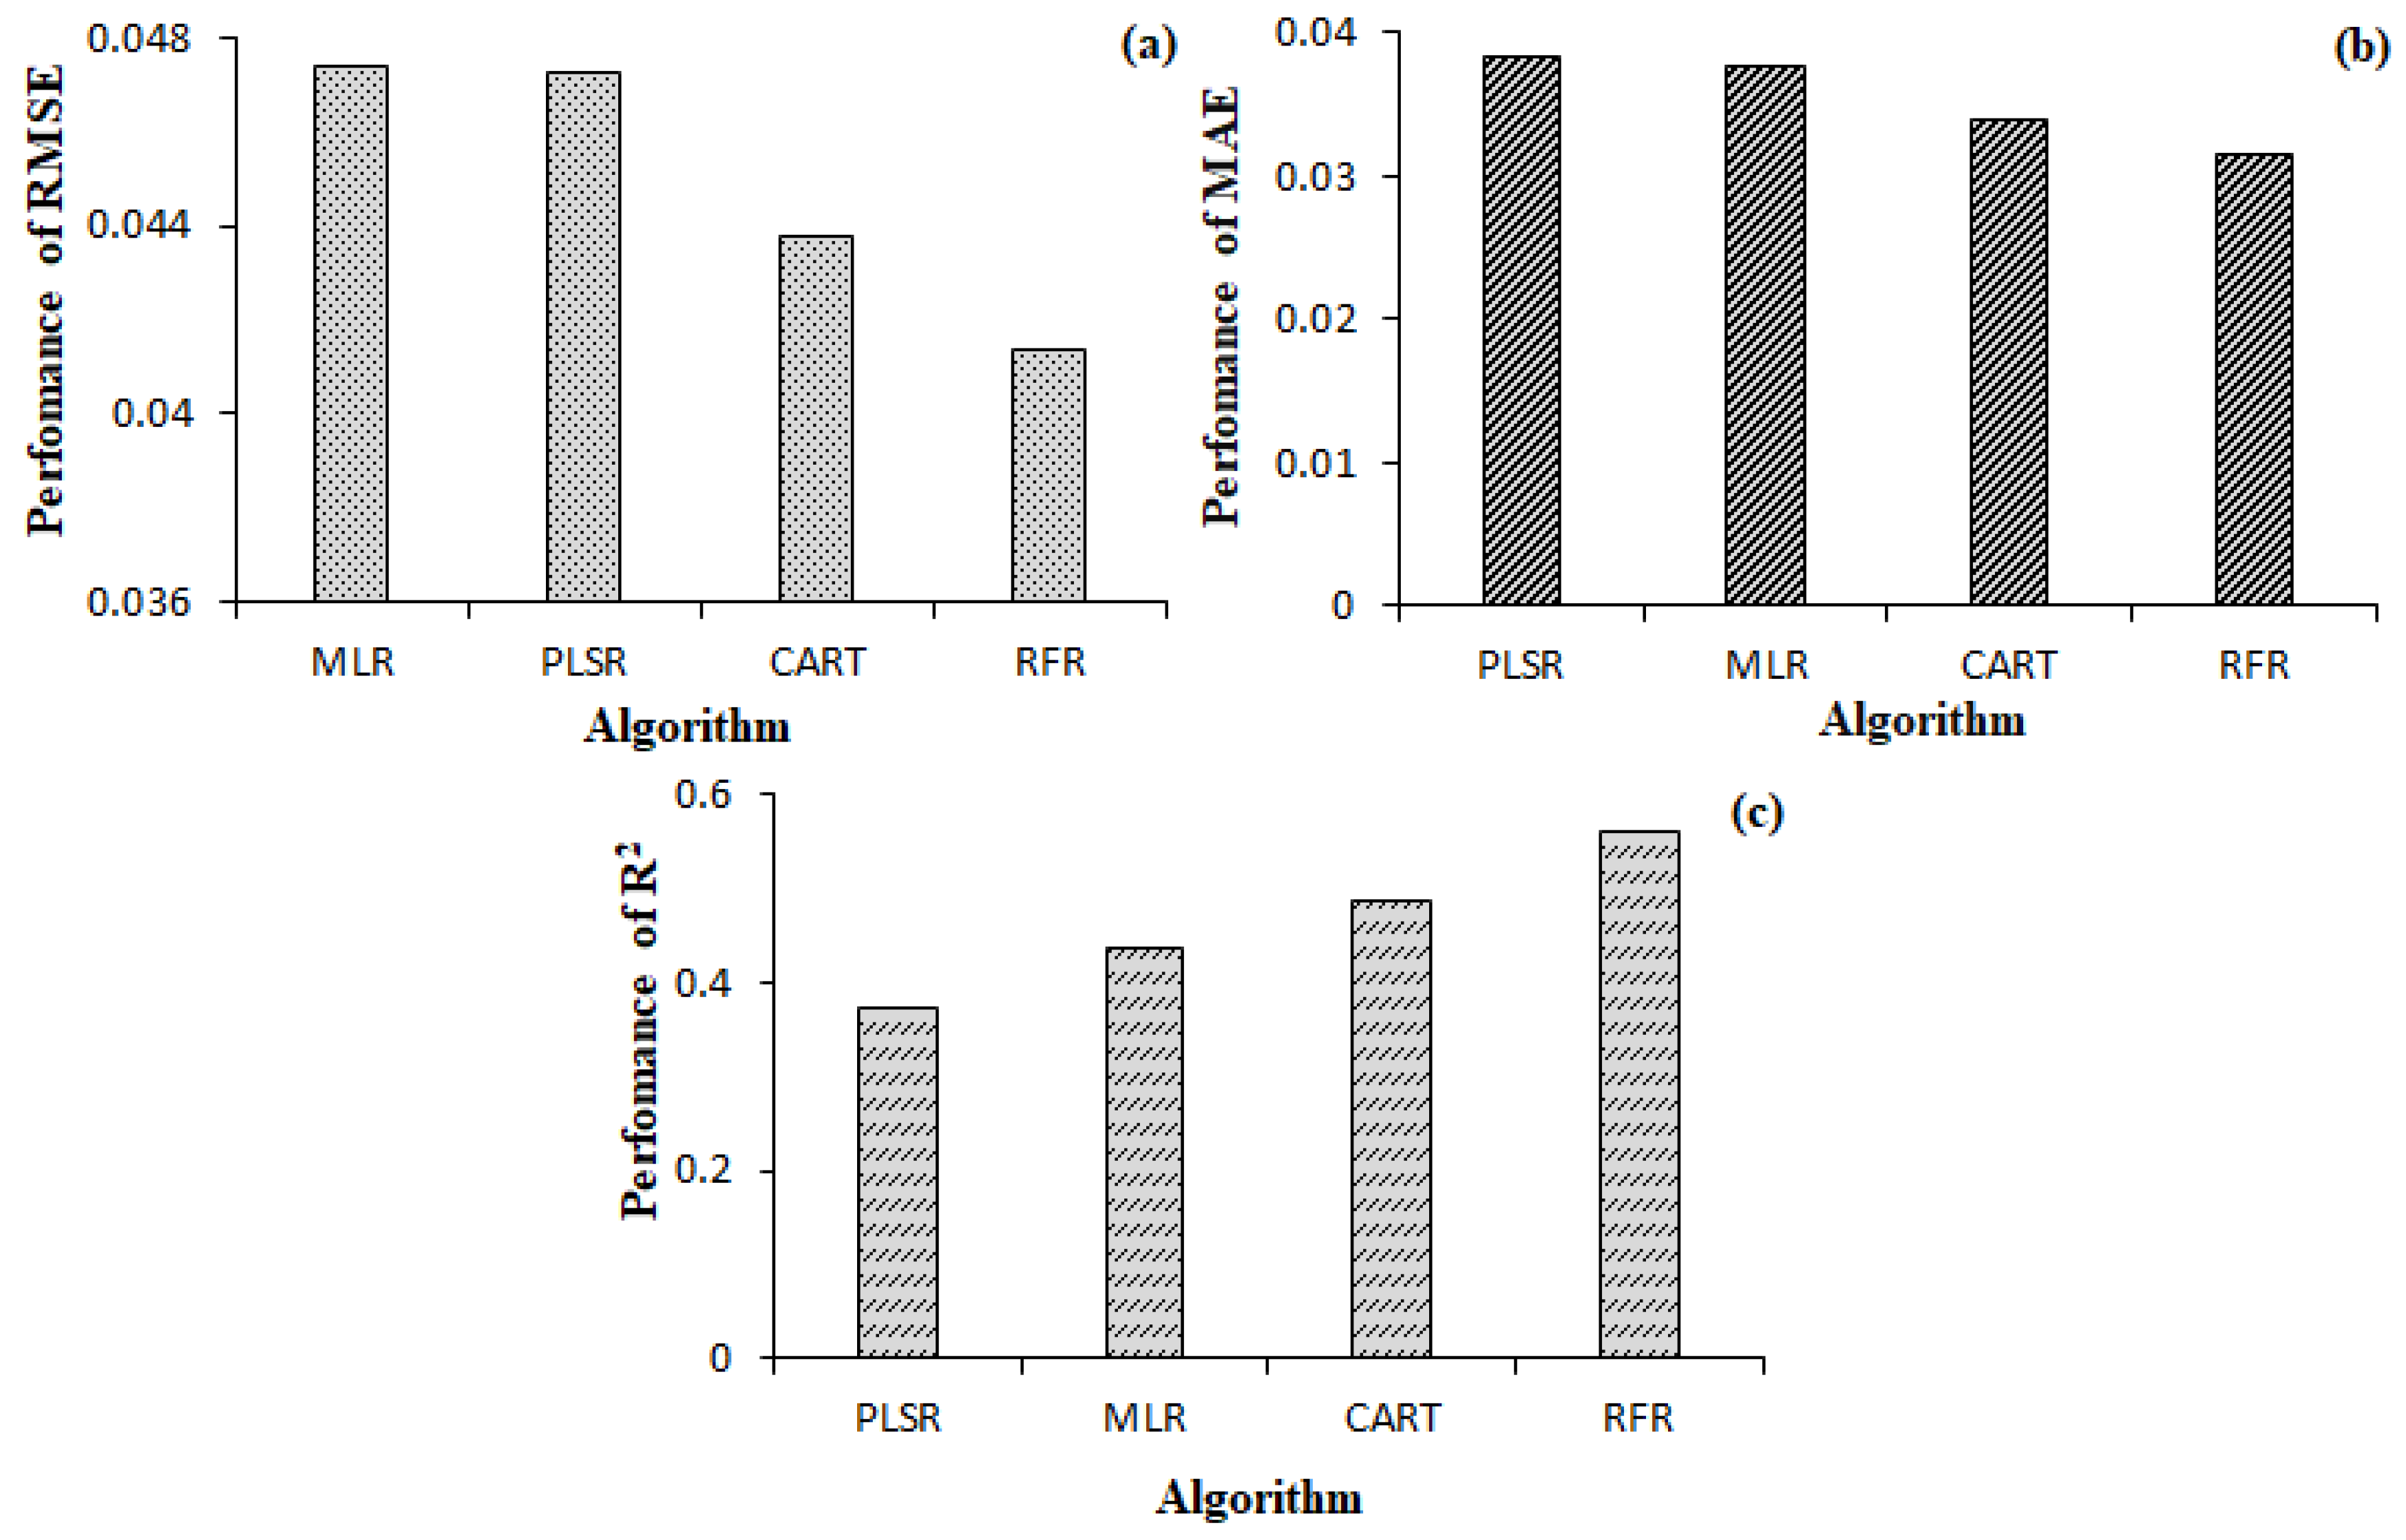
| Month | Predictor Variable | Algorithm | RMSE | R2 | MAE |
|---|---|---|---|---|---|
| March | NDRE | PLS | 0.046 | 0.39 | 0.037 |
| CART | 0.042 | 0.47 | 0.033 | ||
| MLR | 0.041 | 0.46 | 0.032 | ||
| RFR | 0.039 | 0.50 | 0.031 | ||
| Chlred-edge | PLS | 0.053 | 0.38 | 0.042 | |
| CART | 0.045 | 0.45 | 0.037 | ||
| MLR | 0.046 | 0.46 | 0.036 | ||
| RFR | 0.044 | 0.50 | 0.035 | ||
| April | NDRE | PLS | 0.038 | 0.35 | 0.031 |
| CART | 0.034 | 0.63 | 0.028 | ||
| MLR | 0.038 | 0.50 | 0.030 | ||
| RFR | 0.035 | 0.62 | 0.026 | ||
| Chlred-edge | PLS | 0.042 | 0.34 | 0.034 | |
| CART | 0.041 | 0.42 | 0.031 | ||
| MLR | 0.043 | 0.42 | 0.034 | ||
| RFR | 0.041 | 0.55 | 0.032 | ||
| May | NDRE | PLS | 0.024 | 0.52 | 0.020 |
| CART | 0.024 | 0.50 | 0.018 | ||
| MLR | 0.026 | 0.49 | 0.021 | ||
| RFR | 0.022 | 0.53 | 0.017 | ||
| Chlred-edge | PLS | 0.043 | 0.30 | 0.033 | |
| CART | 0.036 | 0.46 | 0.029 | ||
| MLR | 0.043 | 0.36 | 0.036 | ||
| RFR | 0.036 | 0.56 | 0.028 | ||
| June | NDRE | PLS | 0.041 | 0.36 | 0.033 |
| CART | 0.046 | 0.42 | 0.035 | ||
| MLR | 0.041 | 0.47 | 0.034 | ||
| RFR | 0.033 | 0.68 | 0.026 | ||
| Chlred-edge | PLS | 0.091 | 0.35 | 0.077 | |
| CART | 0.082 | 0.53 | 0.060 | ||
| MLR | 0.101 | 0.33 | 0.078 | ||
| RFR | 0.081 | 0.60 | 0.058 |
| NDRE | Chlred-Edge | |||
|---|---|---|---|---|
| Month | RMSE | R2 | RMSE | R2 |
| March | 0.017 | 0.69 | 0.023 | 0.59 |
| April | 0.012 | 0.71 | 0.018 | 0.60 |
| May | 0.056 | 0.56 | 0.014 | 0.69 |
| June | 0.013 | 0.71 | 0.056 | 0.72 |
| Variable | NDRE | Chlred-Edge | ||||
|---|---|---|---|---|---|---|
| t-Statistics | p-Value | R2 | t-Statistics | p-Value | R2 | |
| Topographic factors | ||||||
| Aspect | −0.597 | 0.611 | −0.39 | 0.492 | 0.672 | 0.33 |
| Elevation | 0.163 | 0.886 | 0.11 | −0.276 | 0.809 | −0.19 |
| Slope | −1.865 | 0.203 | −0.80 | 1.588 | 0.253 | 0.75 |
| Climatic factors | ||||||
| Tmax | 55.095 | 0.000 | 1.00 | −14.388 | 0.005 | −1.00 |
| Tmin | 6.832 | 0.021 | 0.98 | −4.806 | 0.041 | −0.96 |
| Radiation | 3.502 | 0.073 | 0.93 | −2.852 | 0.104 | −0.90 |
| Rainfall | 1.881 | 0.201 | 0.80 | −1.661 | 0.239 | −0.76 |
| Soil moisture | 6.579 | 0.031 | 0.81 | −4.461 | 0.040 | −0.78 |
Disclaimer/Publisher’s Note: The statements, opinions and data contained in all publications are solely those of the individual author(s) and contributor(s) and not of MDPI and/or the editor(s). MDPI and/or the editor(s) disclaim responsibility for any injury to people or property resulting from any ideas, methods, instructions or products referred to in the content. |
© 2023 by the authors. Licensee MDPI, Basel, Switzerland. This article is an open access article distributed under the terms and conditions of the Creative Commons Attribution (CC BY) license (https://creativecommons.org/licenses/by/4.0/).
Share and Cite
Royimani, L.; Mutanga, O.; Odindi, J.; Slotow, R. Multi-Temporal Assessment of Remotely Sensed Autumn Grass Senescence across Climatic and Topographic Gradients. Land 2023, 12, 183. https://doi.org/10.3390/land12010183
Royimani L, Mutanga O, Odindi J, Slotow R. Multi-Temporal Assessment of Remotely Sensed Autumn Grass Senescence across Climatic and Topographic Gradients. Land. 2023; 12(1):183. https://doi.org/10.3390/land12010183
Chicago/Turabian StyleRoyimani, Lwando, Onisimo Mutanga, John Odindi, and Rob Slotow. 2023. "Multi-Temporal Assessment of Remotely Sensed Autumn Grass Senescence across Climatic and Topographic Gradients" Land 12, no. 1: 183. https://doi.org/10.3390/land12010183