
A Topographic Perspective on the Propensity for Degradation of Plateau Swampy Meadows in Maduo County, West China
Abstract
:1. Introduction
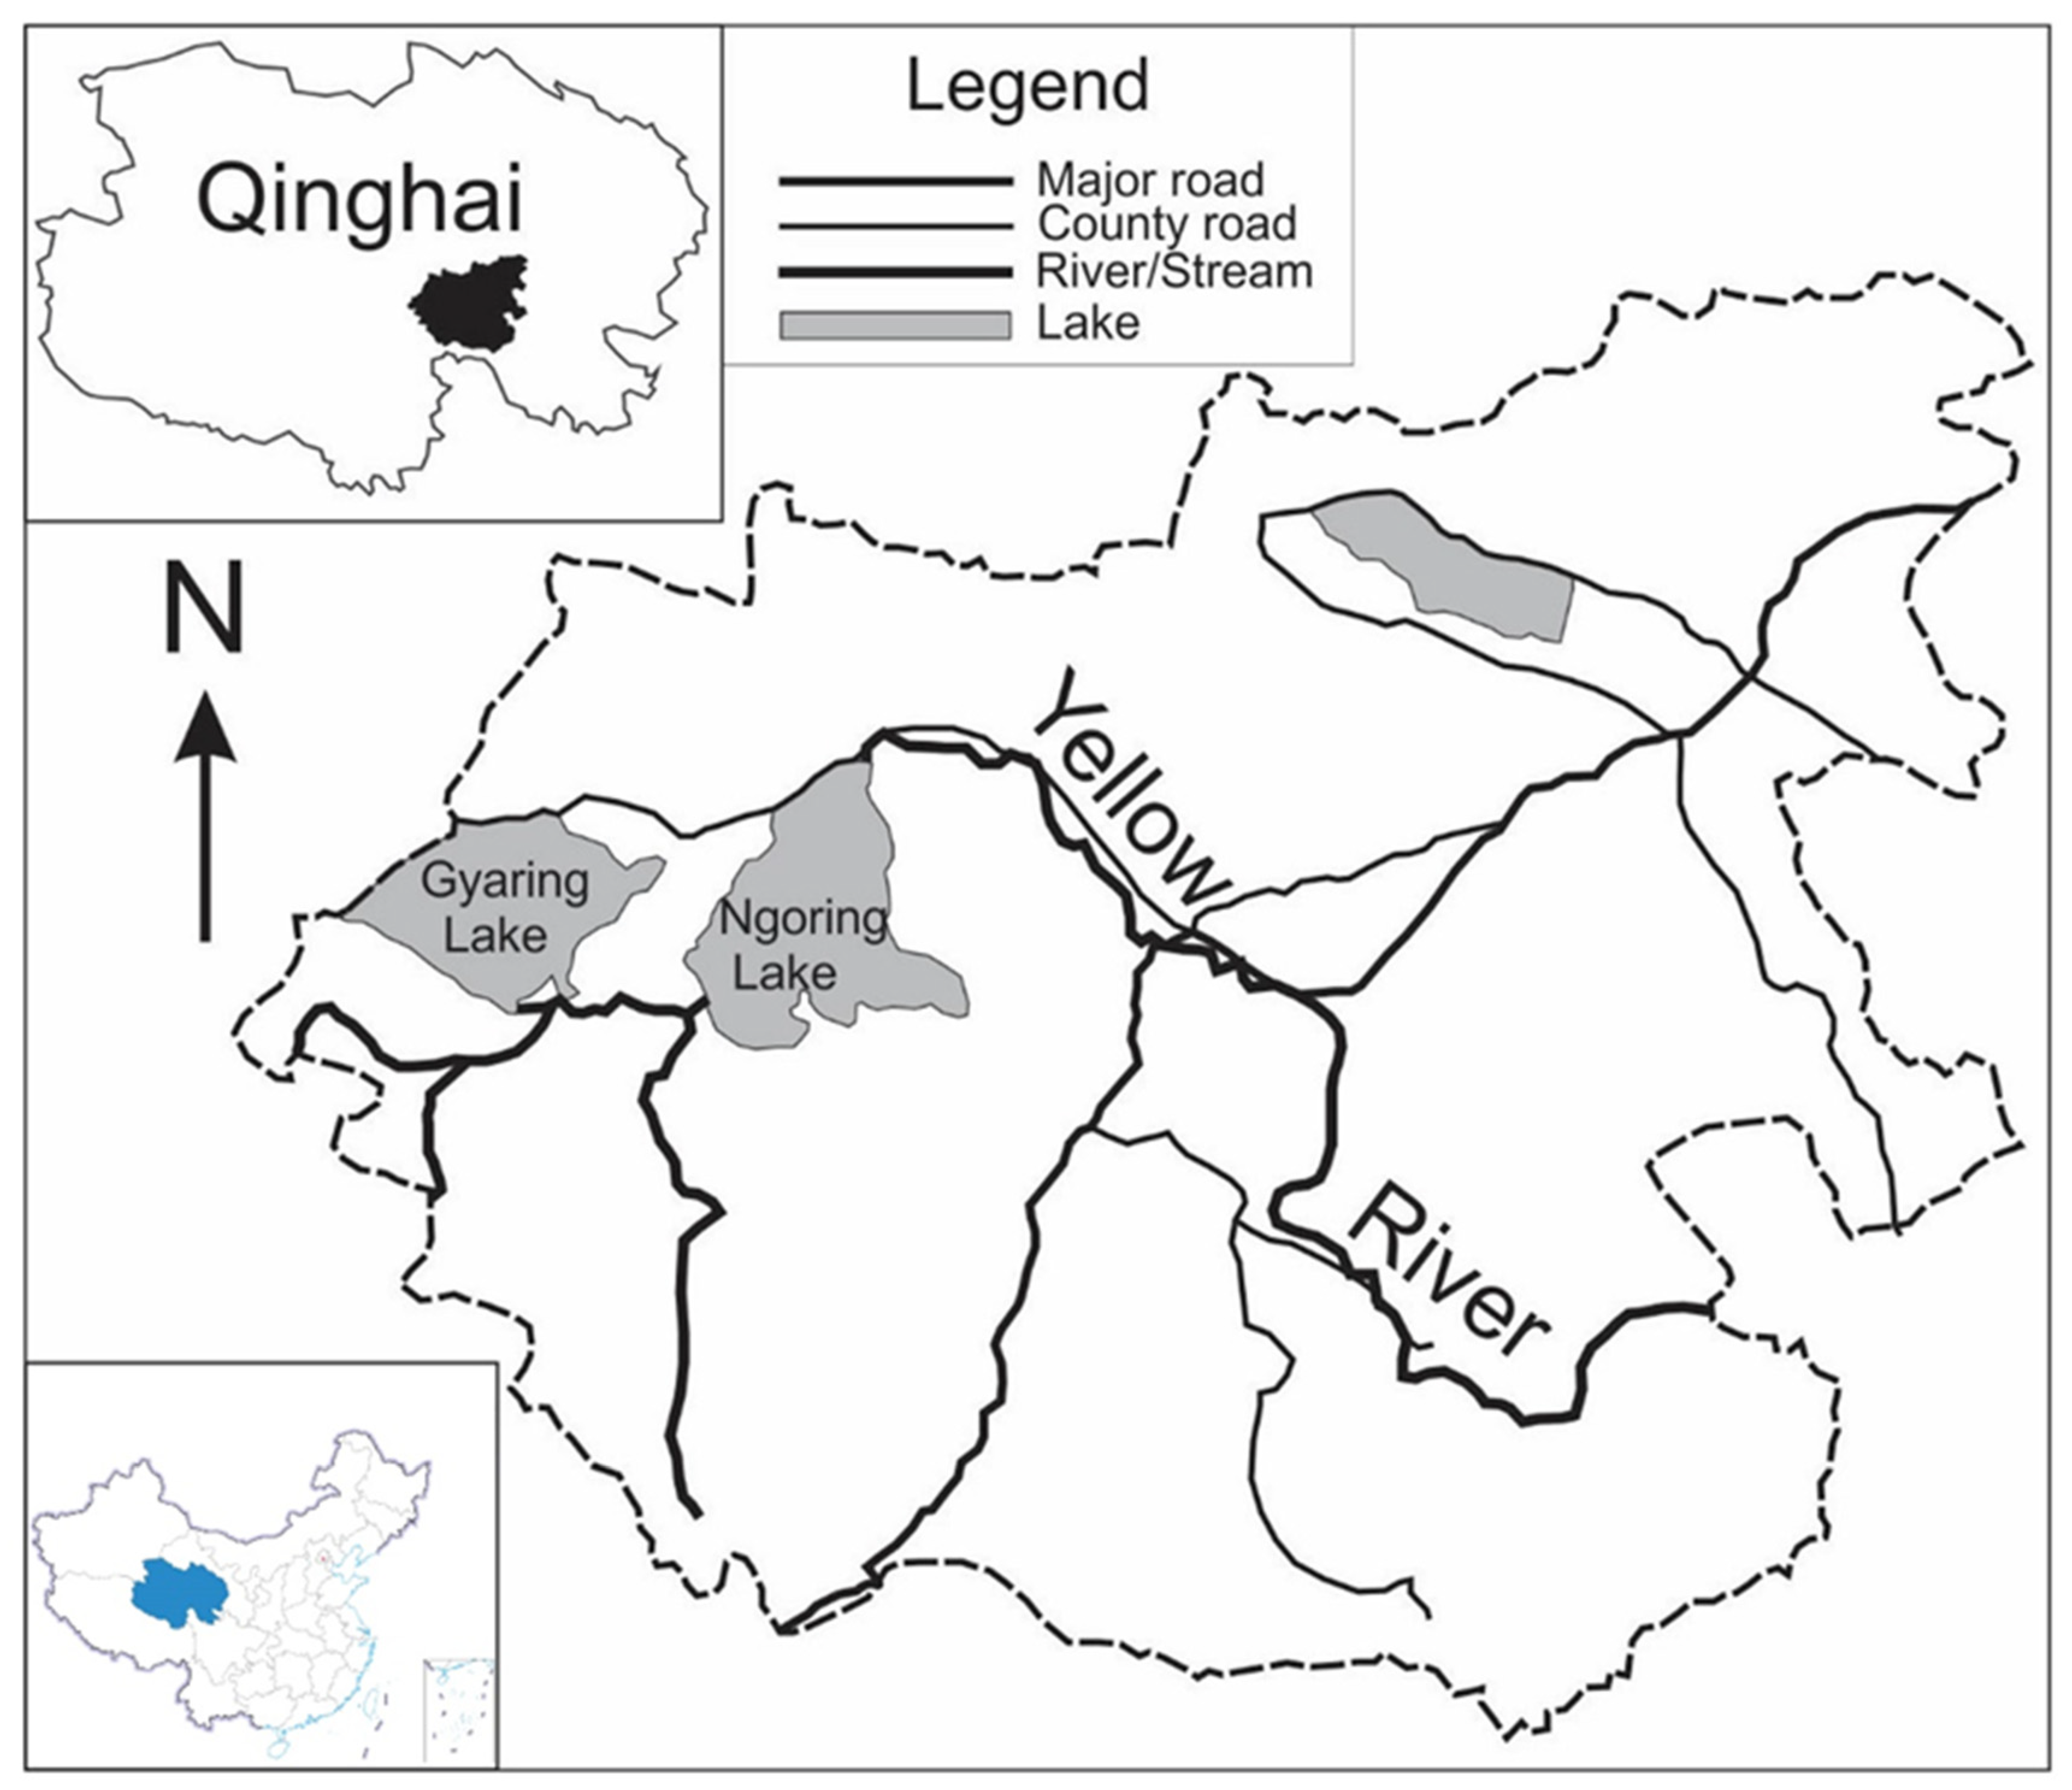
2. Study Area
3. Grading of Swampy Meadow Degradation Severity
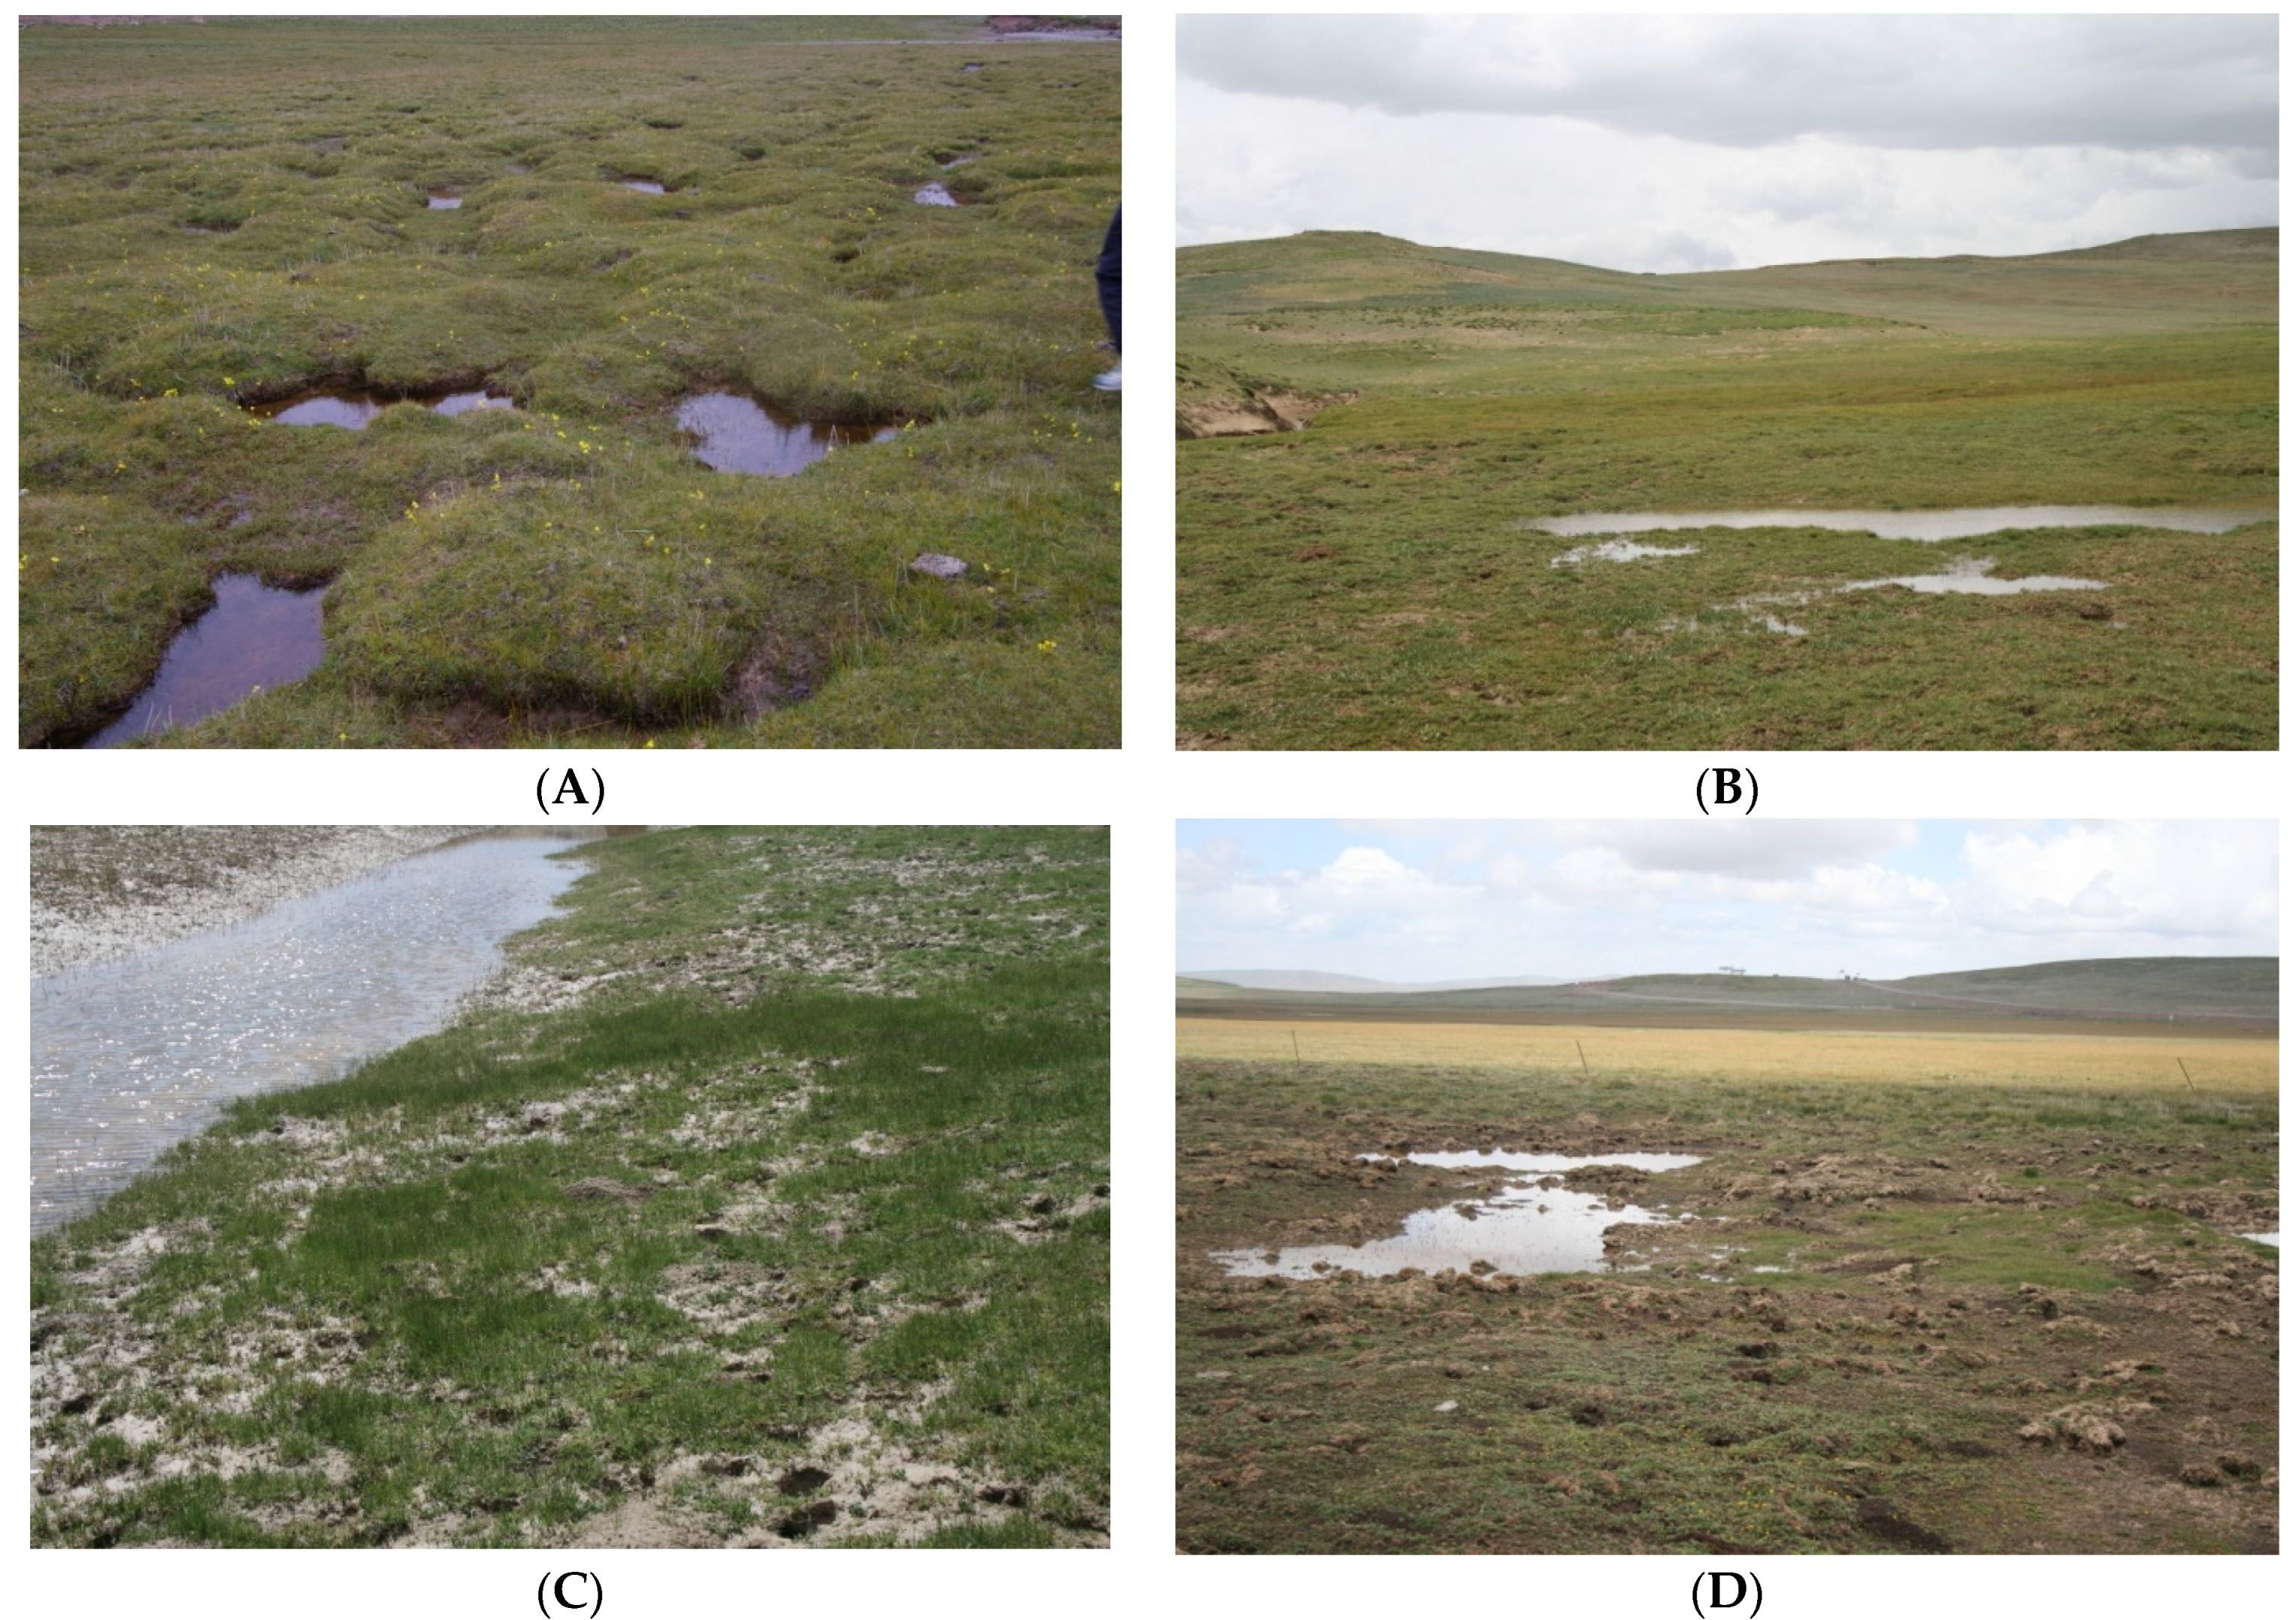
3.1. Swampy Meadow Types
3.2. Selection of Degradation Indicators
3.3. Grading of Degradation Severity
4. Data and Analysis
4.1. Data Collection
4.2. Data Analysis
5. Results
5.1. Propensity for Degradation by Swampy Meadow Type
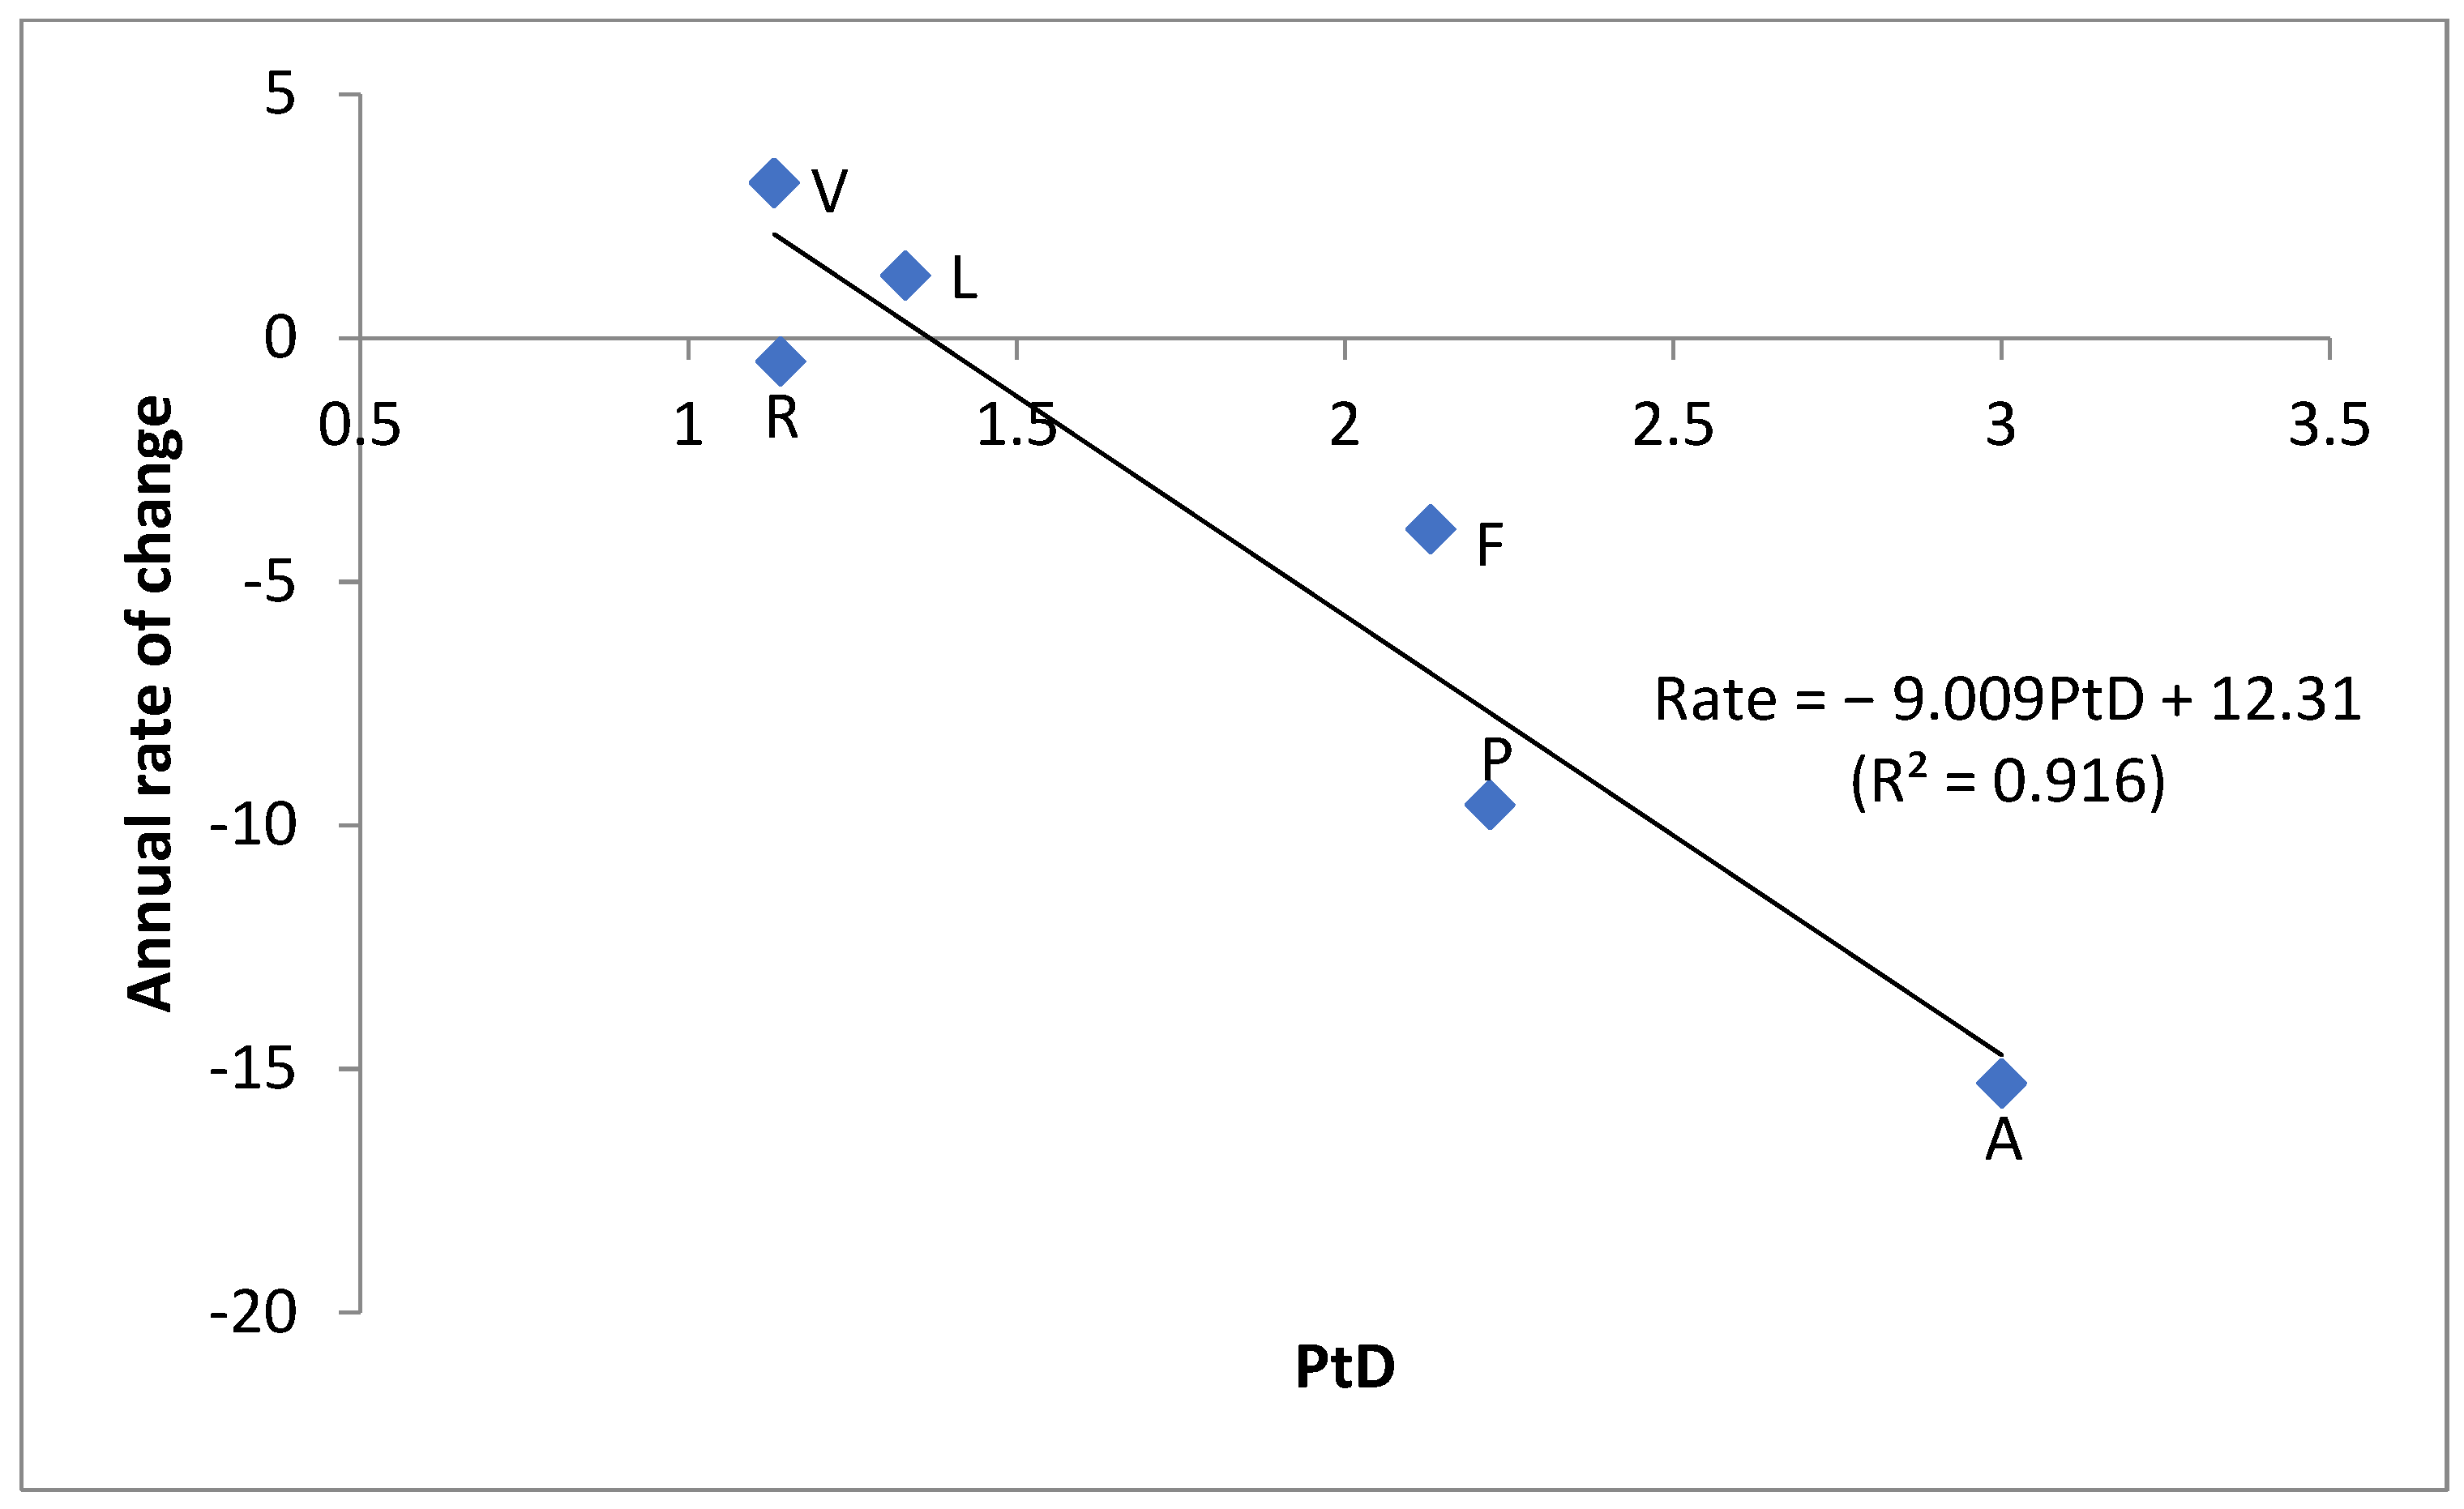
5.2. Validation of the Propensity to Degrade Index
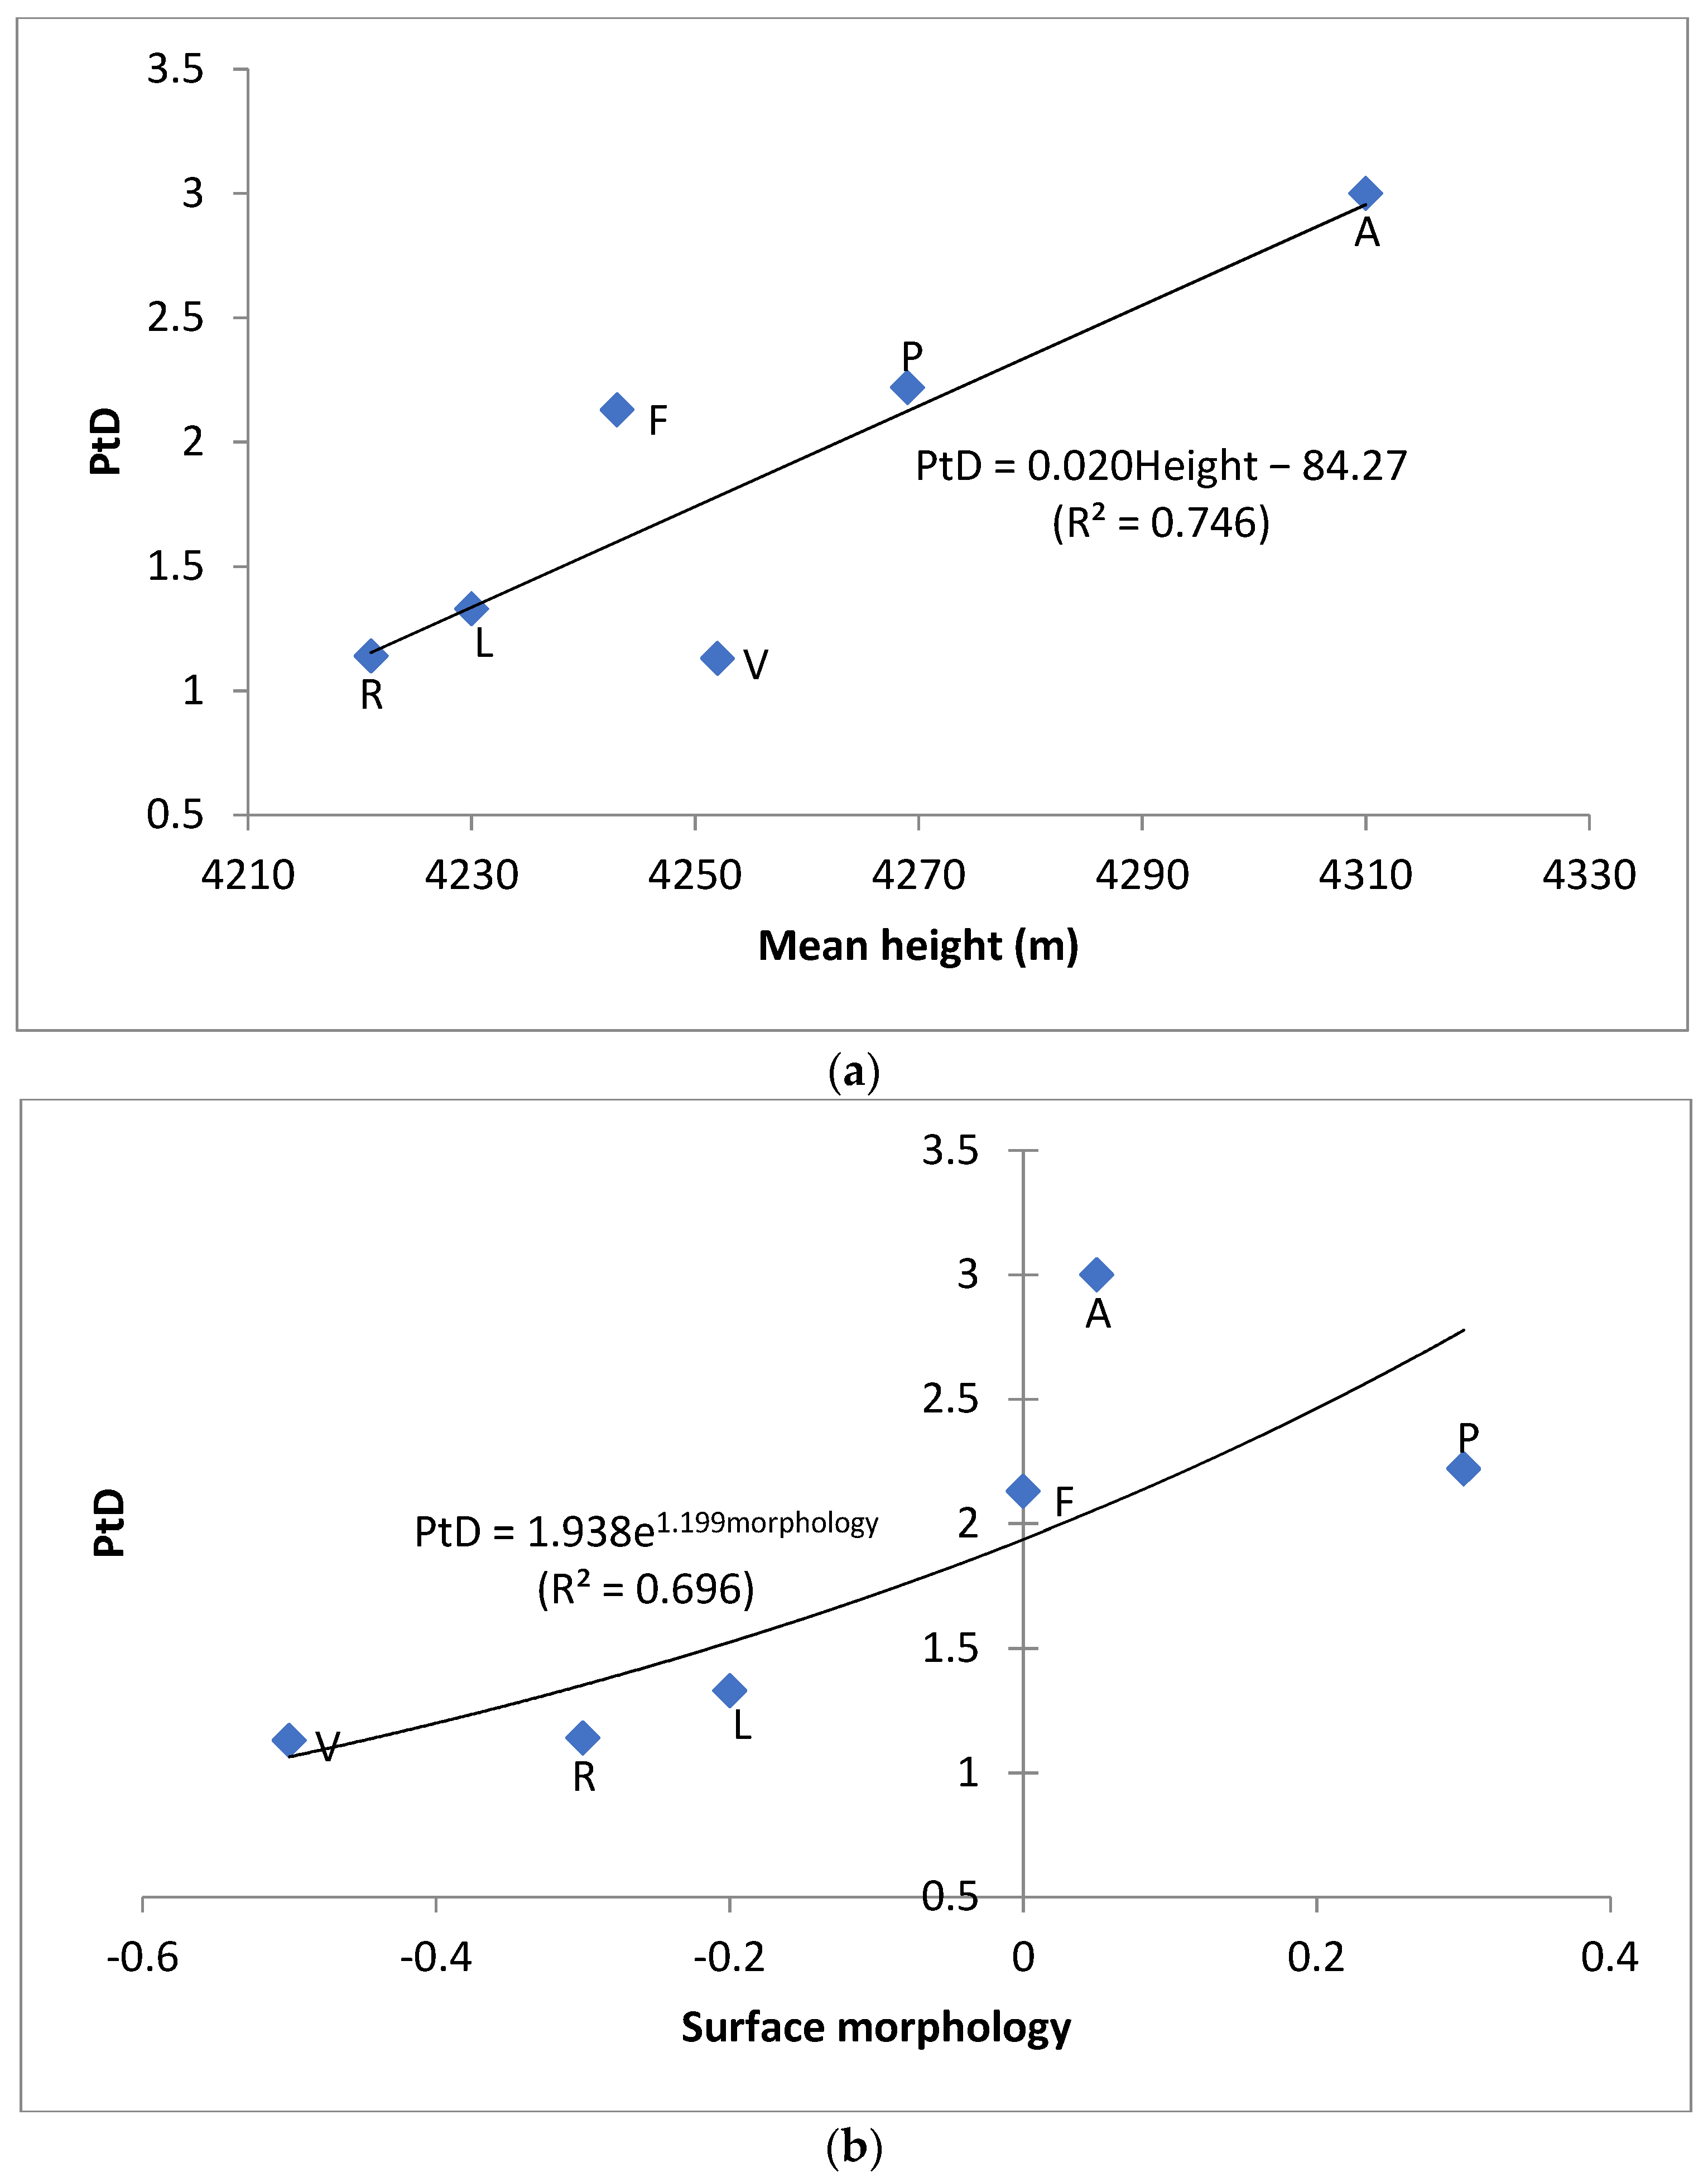
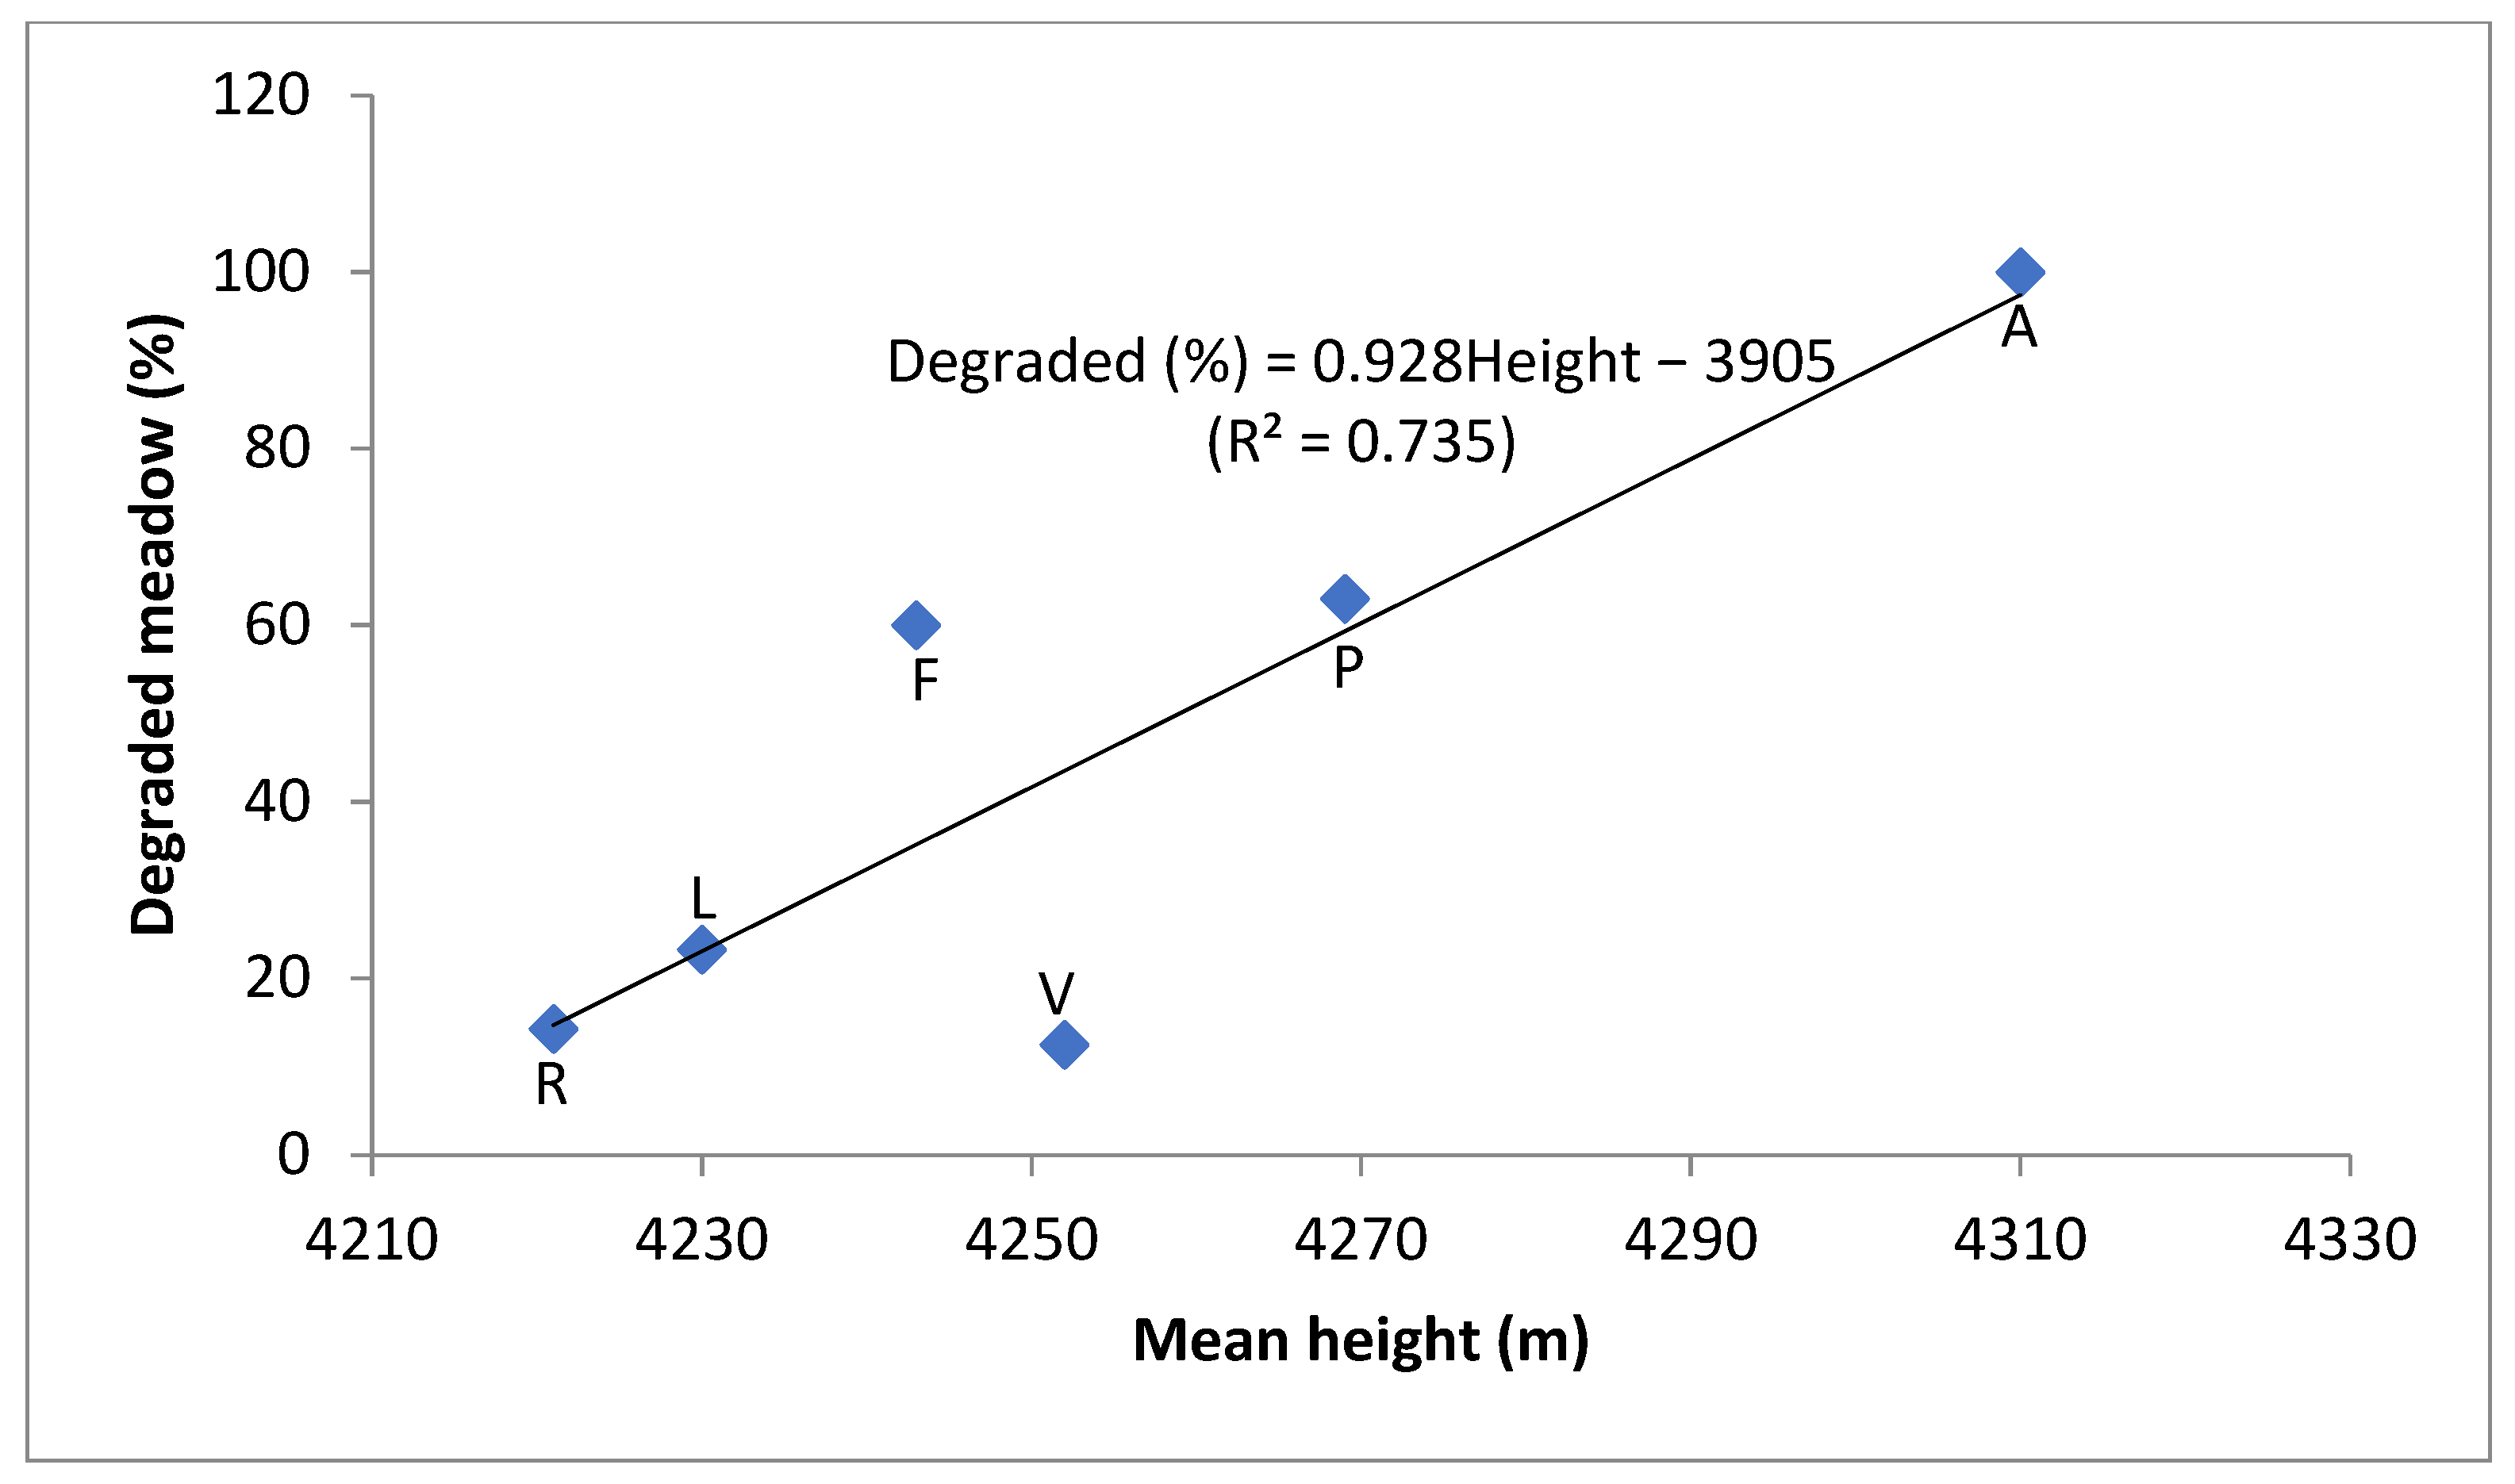
5.3. Influence of Topographic Variables on Degradation Propensity
6. Discussion
6.1. PtD and Topography
6.2. Reference State of Degradation
7. Conclusions
Author Contributions
Funding
Data Availability Statement
Acknowledgments
Conflicts of Interest
References
- Hu, S.; Niu, Z.; Chen, Y.; Li, L.; Zhang, H. Global wetlands: Potential distribution, wetland loss, and status. Sci. Total Environ. 2017, 586, 319–327. [Google Scholar] [CrossRef]
- Mao, D.; Wang, Z.; Wu, J.; Wu, B.; Zeng, Y.; Song, K.; Yi, K.; Luo, L. China’s wetlands loss to urban expansion. Land Degrad. Dev. 2018, 29, 2644–2657. [Google Scholar] [CrossRef]
- Wang, G.; Li, Y.; Wang, Y.; Chen, L. Typical alpine wetland system changes on the Qinghai-Tibet Plateau in recent 40 years. Acta Geogr. Sin. 2007, 62, 481–491. (In Chinese) [Google Scholar]
- Li, G.Q.; Kan, A.K.; Wang, X.B.; Li, G.M.; Gao, Z.Y.; Wang, H.; Yong, Z. Distribution of degraded wetlands and their influence factors in Qomolangma National Nature Reserve. Wetl. Sci. 2010, 8, 110–114. (In Chinese) [Google Scholar]
- Hou, Y.; Guo, Z.G.; Long, R.J. Changes of plant community structure and species diversity in degradation process of Shouqu wetland of Yellow River. Chin. J. Appl. Ecol. 2009, 20, 27–32. (In Chinese) [Google Scholar]
- Gao, Y.H.; Schumann, M.; Zeng, X.Y.; Chen, H. Changes of plant communities and soil properties due to degradation of alpine wetlands on the Qinghai-Tibetan plateau. J. Environ. Prot. Ecol. 2011, 12, 788–798. [Google Scholar]
- Song, C.C.; Wang, L.L.; Guo, Y.D.; Song, Y.; Yang, G.S.; Li, Y.C. Impacts of natural wetland degradation on dissolved carbon dynamics in the Sanjiang Plain, Northeastern China. J. Hydrol. 2011, 398, 26–32. [Google Scholar] [CrossRef]
- Ma, W.; Alhassan, A.-R.M.; Wang, Y.; Li, G.; Wang, H.; Zhao, J. Greenhouse gas emissions as influenced by wetland vegetation degradation along a moisture gradient on the eastern Qinghai-Tibet Plateau of North-West China. Nutr. Cycl. Agroecosyst. 2018, 112, 335–354. [Google Scholar] [CrossRef]
- Bezabih, B. Review on distribution, importance, threats and consequences of wetland degradation in Ethiopia. Int. J. Water Resour. Environ. Eng. 2017, 9, 64–71. [Google Scholar] [CrossRef] [Green Version]
- Wang, C.T.; Long, R.J.; Wang, Q.L.; Jing, Z.C.; Shi, J.J. Changes in plant diversity, biomass and soil C, in alpine meadows at different degradation stages in the headwater region of three rivers, China. Land Degrad. Dev. 2009, 20, 187–198. [Google Scholar] [CrossRef]
- Niu, B.; He, Y.; Zhan, X.; Fu, G.; Shi, P.; Du, M.; Zhang, Y.; Zong, N. Tower-based validation and improvement of MODIS gross primary production in an alpine swamp meadow on the Tibetan Plateau. Remote Sens. 2016, 8, 592. [Google Scholar] [CrossRef] [Green Version]
- Yang, Y.; Wang, J.; Chen, Y.; Cheng, F.; Liu, G.; He, Z. Remote-sensing monitoring of grassland degradation based on the GDI in Shangri-La, China. Remote Sens. 2019, 11, 3030. [Google Scholar] [CrossRef] [Green Version]
- Wu, G.L.; Gao, J.; Li, H.L.; Ren, F.; Liang, D.F.; Li, X.L. Shifts in plant and soil C, N, and P concentrations and C:N:P stoichiometry associated with environmental factors in alpine marshy wetlands in West China. Catena 2023, 221 Pt B, 106801. [Google Scholar] [CrossRef]
- Wu, G.L.; Li, X.L.; Gao, J. The evolution of hummock-depression micro-topography in an alpine marshy wetland in Sanjiangyuan as inferred from vegetation and soil characteristics. Ecol. Evol. 2021, 11, 3901–3916. [Google Scholar] [CrossRef] [PubMed]
- Li, C.Y.; Li, X.L.; Yang, Y.W.; Shi, Y.; Li, H.L.; Yang, P.N.; Duan, C.W. The influence of degradation of alpine marshy wetland on ecosystem respiration and its components. Wetlands 2022, 42, 62. [Google Scholar] [CrossRef]
- Lin, C.Y.; Li, X.L.; Zhang, J.; Sun, H.F.; Zhang, J.; Han, H.B.; Wang, Q.H.; Ma, C.B.; Li, C.Y.; Zhang, Y.X.; et al. Effects of degradation succession of alpine wetland on soil organic carbon and total nitrogen in the Yellow River source zone, west China. J. Mt. Sci. 2021, 18, 694–705. [Google Scholar] [CrossRef]
- Ma, F.; Kan, A.; Li, J.; Lei, G.; Chen, X. Distribution and potential degradation risk evaluation of marsh wetland in the Mt. Qomolangma National Nature Reserve. J. Geo-Inf. Sci. 2011, 13, 594–600. (In Chinese) [Google Scholar] [CrossRef]
- Wójcicki, K.J.; Woskowicz-Ślęzak, B. Anthropogenic causes of wetland loss and degradation in the lower kłodnica valley (southern Poland). Environ. Socio-Econ. Stud. 2015, 3, 20–29. [Google Scholar] [CrossRef] [Green Version]
- Zhou, B.; Jian, Y.; Jin, B.; Lei, Z. Degradation of Wuchang Lake wetland and its causes during 1980–2010. Acta Geogr. 2014, 69, 1697–1706. [Google Scholar] [CrossRef]
- Gao, J. Wetland and its degradation in the Yellow River Source Zone. In Landscape and Ecosystem Diversity, Dynamics and Management in the Yellow River Source Zone; Brierley, G.J., Li, X., Cullum, C., Gao, J., Eds.; Springer: Berlin/Heidelberg, Germany, 2016; pp. 209–232. [Google Scholar]
- Gao, J.; Li, X.L. Degradation of frigid swampy meadows on the Qinghai–Tibet Plateau: Current status and future directions of research. Prog. Phys. Geogr. 2016, 40, 794–810. [Google Scholar] [CrossRef]
- Li, X.; Xue, Z.P.; Gao, J. Dynamic changes of plateau wetlands in Madou County, the Yellow River Source Zone of China: 1990–2013. Wetlands 2016, 36, 299–310. [Google Scholar] [CrossRef]
- Kearney, M.S.; Roger, A.S. Forecasting sites of future coastal marsh loss using topographical relationships and logistic regression. Wetl. Ecol. Manag. 2010, 18, 449–461. [Google Scholar] [CrossRef]
- Ludwig, C.; Walli, A.; Schleicher, C.; Weichselbaum, J.; Riffler, M. A highly automated algorithm for wetland detection using multi-temporal optical satellite data. Remote Sens. Environ. 2019, 224, 333–351. [Google Scholar] [CrossRef]
- Chignell, S.M.; Laituri, M.J.; Young, N.E.; Evangelista, P.H. Afroalpine wetlands of the Bale Mountains, Ethiopia: Distribution, dynamics, and conceptual Flow Model. Ann. Am. Assoc. Geogr. 2019, 109, 791–811. [Google Scholar] [CrossRef]
- Nungesser, M.K. Reading the landscape: Temporal and spatial changes in a patterned peatland. Wetl. Ecol. Manag. 2011, 19, 475–493. [Google Scholar] [CrossRef]
- Miehe, G.; Miehe, S.; Bach, K.; Nölling, J.; Hanspach, J.; Reudenbach, C.; Kaiser, K.; Wesche, K.; Mosbrugger, V.; Yang, Y.P.; et al. Plant communities of central Tibetan pastures in the Alpine Steppe/Kobresiapygmaea ecotone. J. Arid. Environ. 2011, 75, 711–723. [Google Scholar] [CrossRef]
- Liu, D.; Wang, T.; Shen, W.; Lin, N.; Zou, C. Dynamic of the alpine wetlands and its response to climate change in the YarlungZangbo River Valley in recent 30 years. J. Ecol. Rural. Environ. 2016, 32, 243–251. (In Chinese) [Google Scholar] [CrossRef]
- Gao, J.; Li, X.L.; Brierley, G.; Cheung, A.; Yang, Y.W. Geomorphic-centered classification of wetlands on the Qinghai-Tibet Plateau, Western China. J. Mt. Sci. 2013, 10, 632–642. [Google Scholar] [CrossRef] [Green Version]
- Yu, S.W.; Zhou, A.G. Geoindicator system of wetland degradation. Geol. Bull. China 2011, 30, 1757–1762. (In Chinese) [Google Scholar]
- Hou, Y.; Shang, Z.H.; Ouyang, F.; Wang, L.; Wu, G.L.; Liu, Z.H.; Long, R.J. Analytic hierarchy process on problems and threatening factors of wetland environment in Maqu County, Gansu Province. Wetl. Sci. 2009, 7, 11–15. (In Chinese) [Google Scholar]
- Rebelo, A.J.; Emsens, W.-J.; Meire, P.; Esler, K.J. The impact of anthropogenically induced degradation on the vegetation and biochemistry of South African palmiet wetlands. Wetl. Ecol. Manag. 2018, 26, 1157–1171. [Google Scholar] [CrossRef]
- Li, X.; Perry, G.L.W.; Brierley, G.; Sun, H.; Li, C.; Lu, G. Quantitative assessment of degradation classifications for degraded alpine meadows (heitutan), Sanjiangyuan, Western China. Land Degrad. Dev. 2014, 25, 417–427. [Google Scholar] [CrossRef]
- Gao, J.; Li, X.L.; Cheung, A.; Yang, Y.W. Degradation of wetlands on the Qinghai-Tibet Plateau: A comparison of the effectiveness of three indicators. J. Mt. Sci. 2013, 10, 658–667. [Google Scholar] [CrossRef] [Green Version]
- Hu, G.; Dong, Z.; Lu, J.; Yan, C. Desertification and change of landscape pattern in the source region of Yellow River. Acta Ecol. Sin. 2011, 31, 3872–3881. (In Chinese) [Google Scholar]
- Swanson, K.M.; Drexler, J.Z.; Schoellhamer, D.H.; Thorne, K.M.; Casazza, M.L.; Overton, C.T.; Callaway, J.C.; Takekawa, J.Y. Wetland accretion rate model of ecosystem resilience (WARMER) and its application to habitat sustainability for endangered species in the San Francisco estuary. Estuaries Coasts 2014, 37, 476–492. [Google Scholar] [CrossRef]


| Severity Level | Vegetation | Hydrology | Soil Erosion | Pest Damage (Pika Burrows/9 m2) | ||
|---|---|---|---|---|---|---|
| Cover (%) | Indicator Species * | Water Reserve | Moisture Content at 10 cm | |||
| Reference | >90 | K. tibetica | Ponds & pools | >50% | Absent | <1 |
| Slight | >80 | K. pygmaea, K humilis | Small pools | >40% | Sod layer damaged | 2–3 |
| Moderate | ≥50 | Poaannua, Stipacapillata | Wet surface | ≥25% | Piles of loosened soil | 4–5 |
| Severe | <50 | Pedicularis | Dry surface | <25% | >50 sod layer gone | ≥5 |
| Swampy Meadow Type | Severity of Degradation (si) | Sum (N) | PtD Score | ||||||
|---|---|---|---|---|---|---|---|---|---|
| Intact (1) | Slight (2) | Moderate (3) | Severe (4) | Elevation (m) | Morphology | Tendency to Degrade | |||
| Terrace * | 2 | 3 | 5 | 3.60 | 4248 | 0.2 | |||
| Alpine | 2 | 3 | 2 | 7 | 3.00 | 4310 | 0.05 | Vulnerable | |
| Piedmont | 10 | 8 | 2 | 7 | 27 | 2.22 | 4269 | 0.3 | |
| Floodplain | 6 | 3 | 4 | 2 | 15 | 2.13 | 4243 | 0 | Stable |
| Valley | 7 | 1 | 8 | 1.13 | 4252 | −0.5 | |||
| Lacustrine | 23 | 5 | 1 | 1 | 30 | 1.33 | 4230 | −0.2 | Resilient |
| Riverine | 12 | 2 | 14 | 1.14 | 4221 | −0.3 | |||
Disclaimer/Publisher’s Note: The statements, opinions and data contained in all publications are solely those of the individual author(s) and contributor(s) and not of MDPI and/or the editor(s). MDPI and/or the editor(s) disclaim responsibility for any injury to people or property resulting from any ideas, methods, instructions or products referred to in the content. |
© 2022 by the authors. Licensee MDPI, Basel, Switzerland. This article is an open access article distributed under the terms and conditions of the Creative Commons Attribution (CC BY) license (https://creativecommons.org/licenses/by/4.0/).
Share and Cite
Li, X.; Zhang, J.; Gao, J. A Topographic Perspective on the Propensity for Degradation of Plateau Swampy Meadows in Maduo County, West China. Land 2023, 12, 80. https://doi.org/10.3390/land12010080
Li X, Zhang J, Gao J. A Topographic Perspective on the Propensity for Degradation of Plateau Swampy Meadows in Maduo County, West China. Land. 2023; 12(1):80. https://doi.org/10.3390/land12010080
Chicago/Turabian StyleLi, Xilai, Jing Zhang, and Jay Gao. 2023. "A Topographic Perspective on the Propensity for Degradation of Plateau Swampy Meadows in Maduo County, West China" Land 12, no. 1: 80. https://doi.org/10.3390/land12010080