Article

Monitoring Long-Term Spatiotemporal Dynamics of Urban Expansion Using Multisource Remote Sensing Images and Historical Maps: A Case Study of Hangzhou, China

1
School of Earth Sciences, Zhejiang University, Hangzhou 310058, China
2
Division of Landscape Architecture, Faculty of Architecture, University of Hong Kong, Hong Kong, China
3
Department of Real Estate and Construction, Faculty of Architecture, University of Hong Kong, Hong Kong, China
4
School of Statistics and Mathematics, Zhejiang Gongshang University, Hangzhou 310018, China
*
Author to whom correspondence should be addressed.
These authors contributed equally to this work.
Land 2023, 12(1), 144; https://doi.org/10.3390/land12010144
Submission received: 8 November 2022 / Revised: 24 December 2022 / Accepted: 29 December 2022 / Published: 1 January 2023
(This article belongs to the Special Issue Modeling Land Use Change Using Historical and Archaeological Datasets)

Abstract

:
The spatiotemporal patterns of urban expansion have attracted worldwide attention and have been generalized into several prevalent hypotheses, such as the diffusion–coalescence hypothesis and the three-growth-type hypothesis. Although many studies have examined the applicability of these hypotheses, long-term research and evidence are still lacking. This study incorporated a compiled dataset of multisource remote sensing images and historical maps covering nine snapshots of the urban built-up area from 1914 to 2018 to monitor the urban expansion process in Hangzhou, China. A fractal analysis of the area–radius relationship was employed for areal demarcation to explore the heterogenous patterns across different intra-city spatial extents. The results show that (1) Hangzhou has experienced a turbulent period of primitive urbanization in the pre-reform era and a consecutive period of market-oriented urbanization after the economic reform; (2) the urban expansion pattern characterized by landscape metrics demonstrates the existence of multiple alternations between diffusion and coalescence phases with peculiarities across different intra-city spatial extents; (3) the analysis of urban growth types documents a consistent predominance of edge-expansion with wax and wane between infilling and leapfrogging; and (4) institutional reform, industrial development, and administrative division adjustment are the main drivers of urban expansion in Hangzhou. Our findings suggest that effective planning policies need to be raised to curb urban sprawl. Differentiated planning strategies should be proposed to accommodate unique conditions in different urban subregions. The integrated-analysis approach based on multisource remote sensing images and historical maps establishes a feasible pathway for long-term urban research.

1. Introduction

The last centuries have witnessed an unprecedented process of urbanization around the world, during which the proportion of the urban population has grown from merely 10% in 1900 to 55% in 2018, and by 2050, the rate is expected to reach 68% [1,2]. At the same time, rapid urbanization has brought severe challenges to humankind, such as urban sprawl, environmental pollution, and ecological degradation [3]. The drastic socioeconomic and environmental effects of urbanization have widely affected human well-being and urban sustainability [4]. Among these effects, urban expansion, which usually refers to the growth and extension of urban built-up area, has been one of the most significant human-dominated impacts on the global biosphere due to its close relationship with land-use and land-cover change (LULCC), farmland loss, and urban environmental change, as well as socioeconomic dynamics [5,6,7,8]. Thus, understanding the trajectories, spatiotemporal patterns, and driving forces associated with urban expansion becomes the scientific foundation for addressing urban development challenges [9].
Remote sensing (RS) technologies provide spatially explicit and temporally consistent land-use data, while Geographic Information Systems (GIS) build a powerful platform for various spatial analyses, facilitating urban dynamics monitoring [10]. On top of that, landscape metrics provide a range of effective measurements to quantify the composition and configuration of urban land-use patterns [11]. Building upon a large number of studies on urban expansion, several hypotheses have been proposed to generalize the spatiotemporal patterns of urban expansion, such as the diffusion–coalescence hypothesis and the three-growth-type hypothesis. The diffusion–coalescence hypothesis suggests that the evolution of urban expansion is a result of a harmonic oscillation between phases of diffusion and coalescence, and the harmonic cycle can be reflected by the co-evolution of multiple landscape metrics [12]. Several empirical analyses have been conducted to confirm the existence of such an oscillation [13,14]. However, the generality of the hypothesis is still under debate. Some studies did not observe two distinct urban expansion phases [15], while others revealed that the diffusion–coalescence dichotomy represented the endpoint rather than the alternate state of urban expansion [16,17]. The discrepant results of these studies may be ascribed to the spatiotemporal scales, as well as the characteristics of the cities (e.g., morphology, history, or institutional background) [18]. In addition to the diffusion–coalescence hypothesis, the three-growth-type hypothesis has been further proposed to better characterize the pattern of urban expansion, which is described as a spiraling process of shifting dominance among three urban growth types (i.e., infilling, edge-expansion, and leapfrogging) [19,20]. Specifically, infilling refers to new urban expansion occurring in an area surrounded mostly by existing built-up area; edge-expansion refers to new urban expansion taking place at the fringe of the existing built-up area; and leapfrogging (also known as spontaneous [19] or outlying [20]) refers to new urban expansion taking place in an area that is distant and not directly connected to the existing built-up area [21]. To verify and enlighten the two urban expansion hypotheses, more research across cities with diverse physical conditions, developing levels, and socioeconomic contexts is urgently needed.
Nevertheless, single-source remote sensing data are insufficient for long-term urban-dynamics monitoring due to their limitation regarding timescales. For instance, the most widely used Landsat series images (including MSS, TM, ETM+, and OLI) are only available after the 1980s. Therefore, most studies on urban expansion only cover the past 20 to 40 years, while very little research provides a holistic assessment of urbanization over 100 years. Recently, some studies explored the long-term urbanization process and landscape dynamics through the integration of multisource data, such as historical topographic maps and historical land-use archives [22,23,24,25,26]. Long-term research is of great importance to obtain an in-depth understanding of the spatiotemporal dynamics of urbanization and to provide empirical evidence for the urban expansion hypotheses.
In addition to the timescale, the spatial scale also plays a crucial role in urbanization patterns. It is well documented that there are significant discrepancies in patterns, processes, and driving mechanisms of urban expansion at different spatial scales [27,28]. Therefore, it is of great theoretical significance and practical value to understand the impact of scale effects on urban expansion based on multiscale studies, which provide compelling evidence either through inter-city comparisons (macroscale) or intra-city investigations (microscale). The current studies mainly focus on the spatial heterogeneity of different cities at the global [29,30], national [18,31], urban agglomeration [32,33,34], and metropolitan levels [35,36]. However, research on the heterogeneity among different intra-city spatial extents is still insufficient. As a multiscale complex system, cities usually exhibit unique spatiotemporal patterns in different spatial extents [37,38]. In previous studies, urban administrative hierarchy or stratified buffer zones were used for areal demarcation to analyze multiscale dynamic growth patterns [39,40]. However, such demarcation criteria were mainly based on experiential judgment, ignoring the self-similarity nature of cities. Fractal geometry provides a quantitative method to reveal the principles of urban spatial organization [41]. The area–radius scaling method can be used to investigate the relationship between the built-up area and the radius from the city center, indicating a core–periphery pattern of the urban landscape [42,43]. The existence of a kink is noted in area–radius scaling. The kink divides the urban area into two scaling extents: a steeper inner zone near the urban core where the urbanization process is essentially completed and a flatter outer zone at the urban periphery where the urbanization is still fully active with unstable urban patterns [43]. This method can also be applied for empirical assessments of urban expansion hypotheses and provide critical insights from a multiscale perspective.
As one of the largest developing countries in the world, China’s urbanization has received increasing attention in the past decades [44]. China has experienced a long-term and far-reaching urbanization process, especially after the Reform and Opening Up, which has promoted the rise of a large number of cities [31,45]. Numerous studies have been conducted to characterize the urbanization pattern and test the applicability of urban expansion hypotheses in China [18], especially in large urban agglomerations such as the Yangtze River Delta [17,33], the Guangdong–Hong Kong–Macao Greater Bay Area [35,46], and the Beijing–Tianjin–Hebei Urban Agglomeration [32,47]. However, research on long-term urban expansion at multiple intra-urban extents is still lacking.
In this study, we chose Hangzhou, which is the capital of Zhejiang Province and one of the nucleus cities of the Yangtze River Delta, as our case, given its long-standing history, rapid development, and representativeness of similar large cities in China [48,49,50]. By integrating multisource remote sensing images and historical maps, this study aims to explore the long-term spatiotemporal dynamics of urban expansion over the past 100 years. The objectives of this study were to (1) monitor the spatiotemporal patterns and landscape dynamics of urban expansion in Hangzhou from 1914 to 2018; (2) examine the validity of the diffusion–coalescence hypothesis and the three-growth-type hypothesis based on landscape metric analysis; (3) employ area–radius scaling method to detect the scaling range of urban area, quantify the spatiotemporal patterns at different spatial extents, and assess the urban expansion hypotheses from a multiscale perspective that encompasses both city-wide and intra-city scales; and (4) analyze possible driving forces and related policies of urban expansion in different periods.

2. Materials and Methods
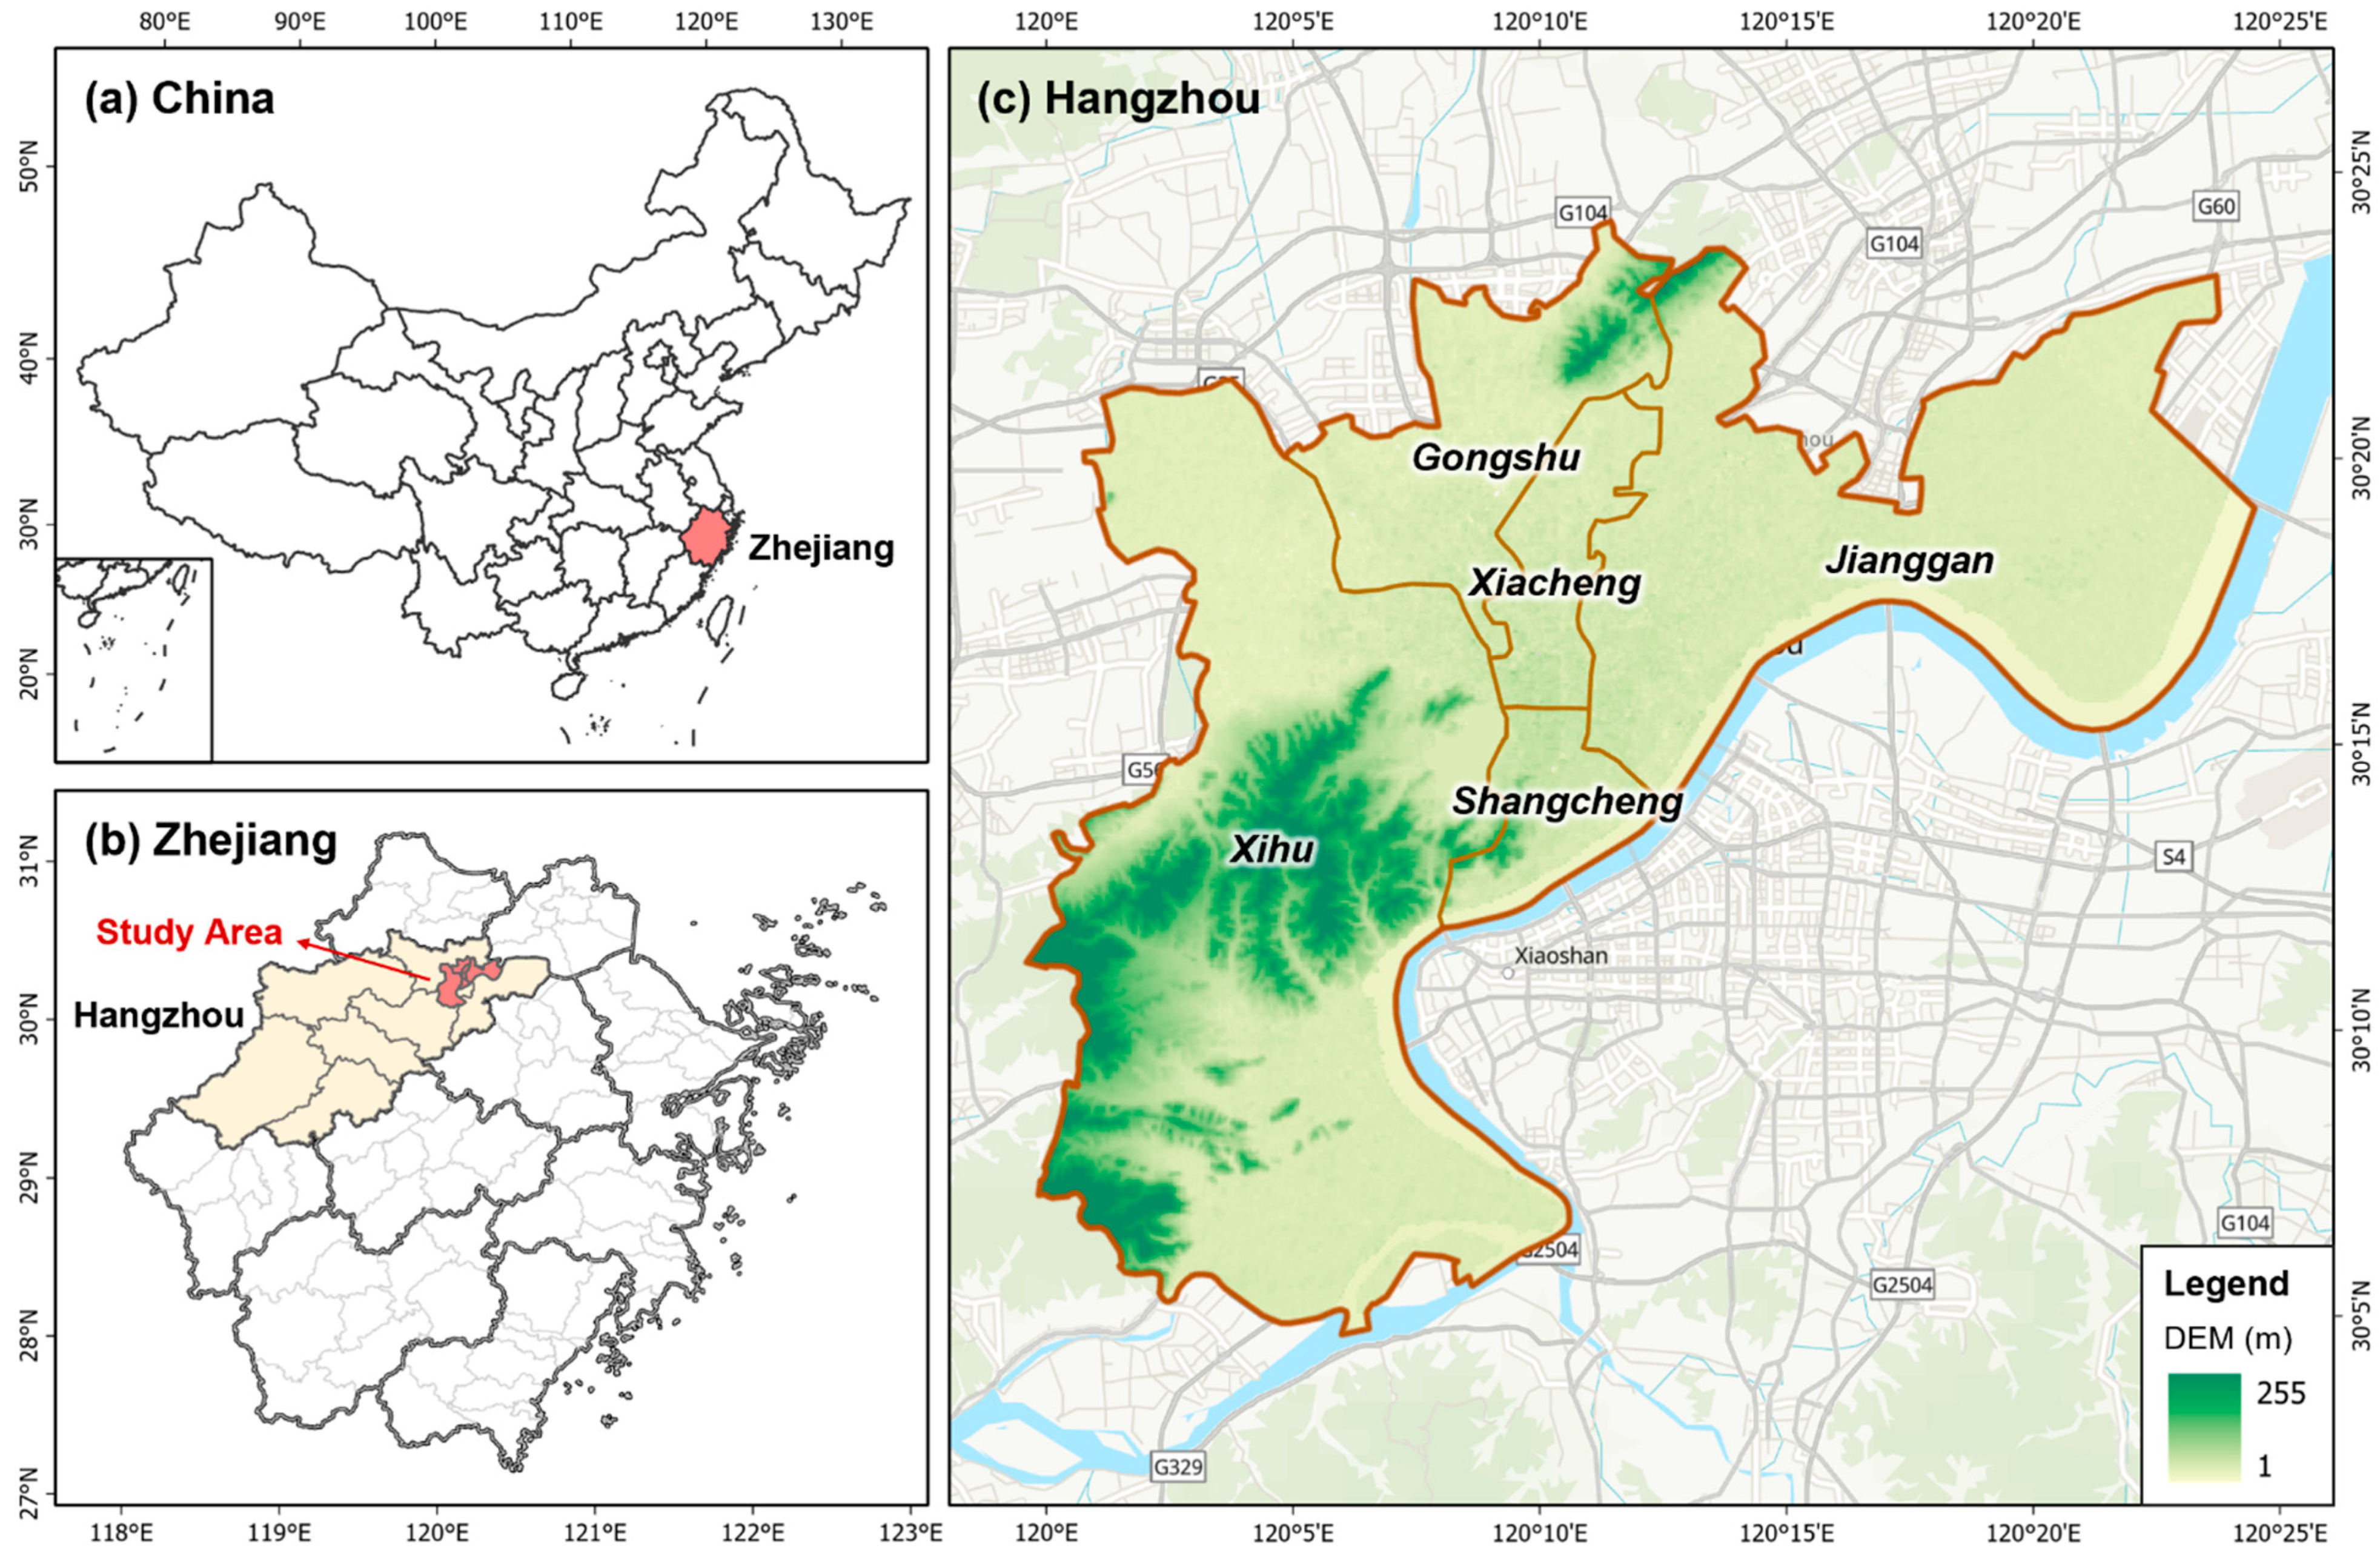
2.1. Study Area

Hangzhou (118°21′–120°30′ E, 29°11′–30°33′ N), the capital of Zhejiang Province, is located on the east coast of China and the south wing of the Yangtze River Delta (Figure 1a,b). The total area of the city is 16,850 km2, with 8289 km2 as the urban area. It has a total population of 9.81 million, with 77.4% being the urban population, and its gross domestic product (GDP) per capita was RMB 140,180 yuan in 2018 (equivalent to USD 21,184) [51]. Hangzhou is one of the seven ancient capitals of China and has been renowned for its scenic beauty, cultural heritage, and glorious history spanning more than 2200 years. The picturesque natural landscapes (e.g., the West Lake, the Qiantang River, the Grand Canal, and the Xixi National Wetland Park) not only attract a large number of tourists but also shape the early spatial form of the city. Driven by industrialization and significant economic development, the city has witnessed a rapid urbanization process and transformed from a historic cultural city to a medium-sized light industrial city and then to a prosperous megacity identified by its digital economy in recent decades [52]. To a large extent, Hangzhou represents a typical urbanization process that is taking place in the transforming period throughout China in the past century. Currently, Hangzhou consists of 10 districts (i.e., Shangcheng, Xiacheng, Gongshu, Jianggan, Xihu, Binjiang, Xiaoshan, Yuhang, Fuyang, and Lin’an) and 3 counties (i.e., Tonglu, Jiande, and Chun’an). In view of the availability and comparability of multisource data, we selected the classical city proper as our study area (including Shangcheng, Xiacheng, Gongshu, Jianggan, and Xihu districts) (Figure 1c), which is an appropriate range to explore the long-term urbanization process of Hangzhou.

2.2. Data Sources and Preprocessing

Based on the urban development history of Hangzhou and the availability of relevant land-use datasets, 9 snapshots (i.e., 1914, 1934, 1969, 1978, 1985, 1991, 2000, 2010, and 2018) were selected for our analysis. By integrating multisource remote sensing images and historical maps, we acquired a continuous dataset spanning over 100 years. Specifically, we incorporated three sets of data sources into this study, i.e., historical topographic maps, CORONA satellite imagery, and Landsat series satellite imagery. The historical topographic maps in 1914 and 1931–1934 were surveyed and mapped by the Zhejiang Civil Affairs Bureau in the Republic of China. Unlike ancient Chinese maps, these topographic maps can accurately depict geographical objectives based on modern surveying techniques. The CORONA satellite imagery, as almost the earliest historical remote sensing dataset, is the product of the CORONA reconnaissance satellite program implemented by the United States in the 1960s. CORONA images have been used for scientific research since its declassification in 1995. We obtained the CORONA KH-4B satellite image in 1969 from the United States Geological Survey (USGS). In addition, we also employed a series of Landsat satellite images, including Landsat 3 MSS (1978), Landsat 5 TM (1985 and 1991), Landsat 7 TM (2000 and 2010), and Landsat 8 OLI (2018), which were acquired from the Geospatial Data Cloud offered by the Chinese Academy of Sciences (CAS). Detailed parameters of the data source are listed in Table 1.
In order to achieve a continuous analysis of multisource data, some necessary preprocessing was performed to convert the data into a consistent format. The historical topographic maps were digitized manually by the authors through image stitching, geometric correction, and digital remapping. Evenly distributed geographical objects with fixed positions, such as water bodies and roads, were selected as control points for geometric correction, and the urban built-up area was thereafter extracted through visual interpretation. In addition, satellite images were also atmospherically and geometrically correlated with Google Earth Digital Globe image as the base map. Fixed geographic objectives were selected as control points with the root mean square errors (RMSE) less than 1 (shown in Table 1). Land-use classification was then performed to extract urban built-up areas for each period. Since the objective of this study focuses on urban expansion, the satellite images were only classified into built-up and non-built-up areas. Landsat 3 MSS (1978) and Landsat 5 TM (1985 and 1991) images were classified by maximum likelihood methods in ENVI 4.8. CORONA KH-4B (1969), Landsat 7 TM (2000 and 2010), and Landsat 8 OLI (2018) images were classified by the object-oriented method through multiscale segmentation, categorical feature selection, and decision tree classification, using eCognition 9.02. The object-oriented method was confirmed to have higher classification accuracy on high-resolution images than other methods. The Kappa coefficients of the classification results for each period are shown in Table 1. All extracted land-use data were resampled to a spatial resolution of 30 m, using the nearest neighborhood method. Finally, we obtained 9 snapshots of urban-land (i.e., urban built-up area) data, as plotted in Figure 2.

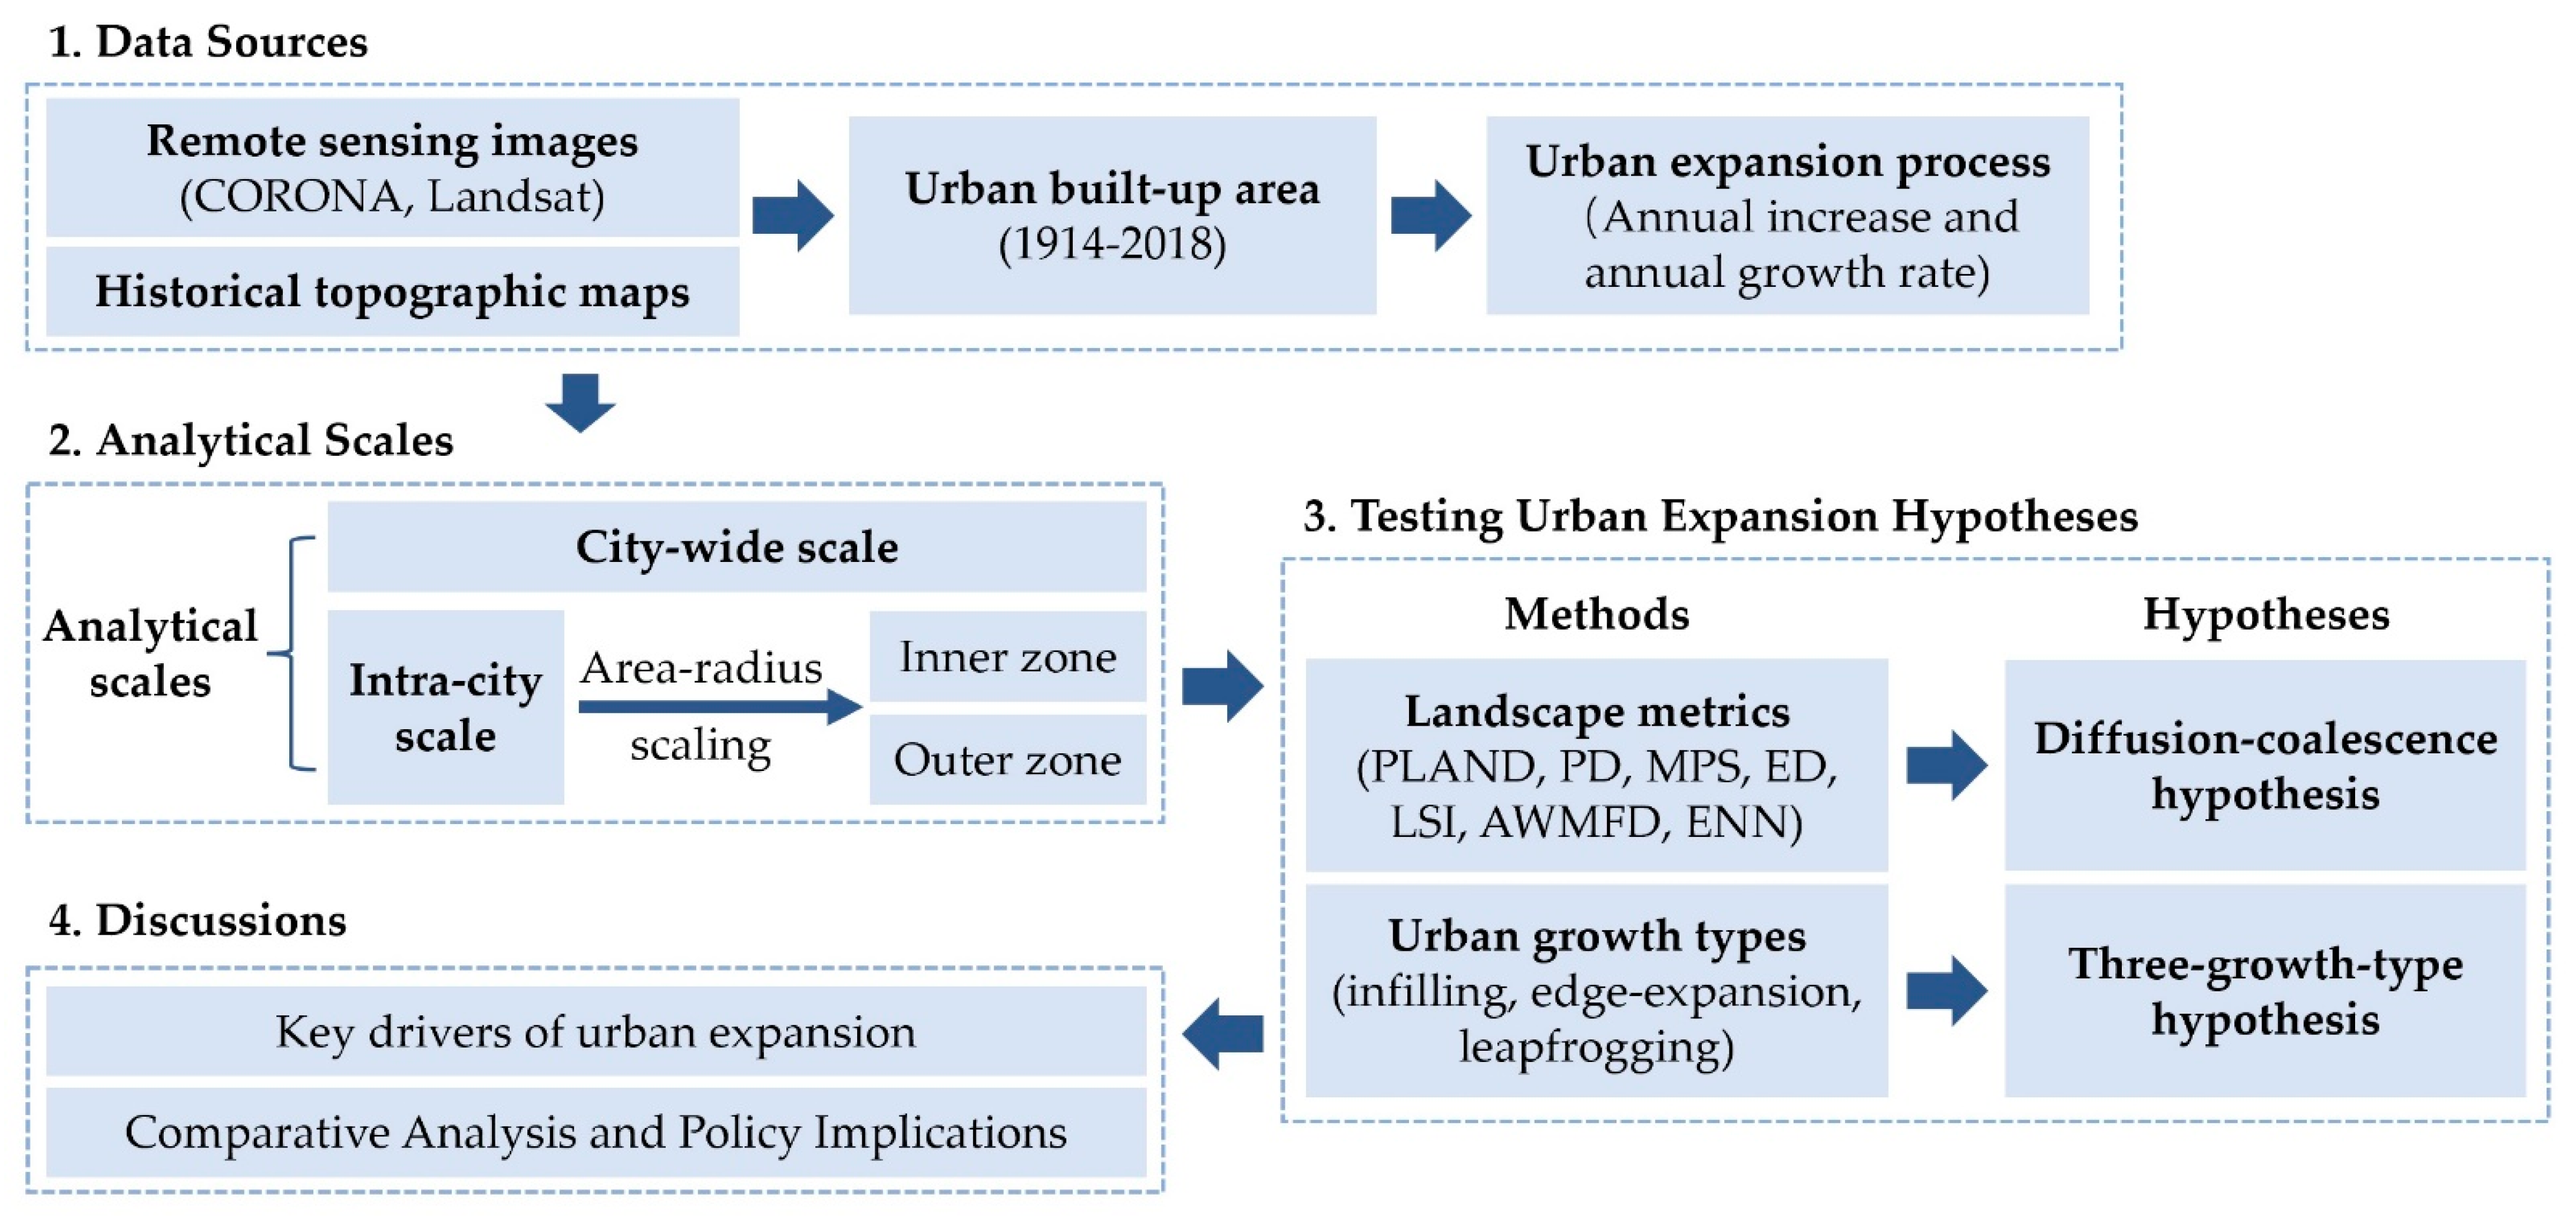
2.3. Research Steps and Methods

The general research framework and steps of this study are presented in Figure 3. Based on the urban built-up area obtained above, two metrics (i.e., annual increase and annual growth rate) were used to characterize the general process of urbanization. We then examined the spatiotemporal pattern of urban expansion from two analytical scales, i.e., the city-wide scale and the intra-city scale. The area–radius scaling method was used for areal demarcation to divide the urban extent into inner and outer zones. Two prevalent urban expansion hypotheses, i.e., the diffusion–coalescence hypothesis and the three-growth-type hypothesis, were examined by using landscape metrics and urban growth types, respectively. Finally, key drivers of urban expansion, comparative analysis with other cities, and relevant policy implications were provided based on the study results.

2.3.1. Annual Increase and Annual Growth Rate

To quantify the magnitude of urban expansion, we calculated two indexes—the Annual Increase (AI) and the Annual Growth Rate (AGR). The AI measures the annual number of changes in urban built-up area and can be used to compare the speed of urban expansion across different periods in the same city. The AGR removes the size effect of cities and is more effective for comparison between different cities [5,47]. The definition of the two indexes are as follows:
A I = A e n d A s t a r t d  
A G R = A e n d A s t a r t d 1 × 100 %  
where A I (km2 per year) and A G R (%) are the Annual Increase and Annual Growth Rate of the urban built-up area; A s t a r t and A e n d are the areas of the urban built-up area at the start and end period, respectively; and d is the time span of the period in years.

2.3.2. Area–Radius Scaling

In order to explore the discrepant pattern of urban expansion in different urban subregions, the relationship between the urban built-up area and the distance from the city center (i.e., area–radius scaling) is evaluated based on fractal geometry to divide the urban spatial extent. Geographically, the area–radius scaling represents the core–periphery pattern of the urban landscape, and the radial dimension defined by the law of distance decay is usually used to quantify this relationship. By making concentric circles around the city center, we can calculate the urban built-up area in each concentric circle. If the city is considered to be fractal, it should follow a scaling rule in the form of the following [37]:
S = k r D  
where r is the number of concentric circles, S represents the total urban built-up area that lays within the number r concentric circle from the city center, D is the radial dimension, and k is the coefficient.
Based on the abovementioned fractal rule, the city can be divided into the inner zone and the outer zone in accordance with the bi-fractal structure. The bi-fractal structure has been widely discovered in many cities around the world. It reveals that the area–radius relationship of the city displays two scaling extents: a steeper inner zone close to the city center with almost completed urbanization and intensive land use and a flatter outer zone representing the urban–rural transition area with active urbanization and vacant space for future growth [43]. Thereupon, three spatial extents are available for further analysis on the spatiotemporal dynamics of urban expansion: the whole study area, the inner zone, and the outer zone.

2.3.3. Landscape Metrics

Landscape metrics are quantitative measurements of urban landscape patterns and can effectively evaluate the phases of diffusion and coalescence [12]. The choice of landscape metrics should effectively satisfy the research objectives and enhance the comparability with relevant studies [13,15]. For this purpose, eight metrics at the class level were selected to characterize the area, shape, and spatial distribution patterns of urban built-up area in the process of urban expansion: (1) area metrics—percentage of landscape (PLAND), patch density (PD), mean patch size (MPS), and patch size standard deviation (PSSD); (2) shape metrics—edge density (ED), shape index (LSI), and area-weighted mean fractal dimension (AWMFD); and (3) spatial distribution metrics—mean Euclidean nearest neighbor distance (ENN). The definitions and descriptions of landscape metrics are listed in Table 2. FRAGSTATS 4.2 was used to calculate the value of landscape metrics [53].

2.3.4. Urban Growth Types

Urban growth types can be identified as infilling, edge-expansion, and leapfrogging in order to gain an in-depth understanding of urban expansion patterns [19,20,21]. Infilling denotes that the new urban land is surrounded by existing urban patches, that is, filling the gaps within original built-up area. Edge-expansion represents the newly developed area expanding from the edge of the existing urban patches. Leapfrogging indicates the independent occurrence of new urban expansion without direct connection with existing urban built-up areas. To distinguish the three types of urban growth, a quantitative index, S , is calculated based on the following equation [19]:
S = L C / P  
where L C is the length of the common boundary between a new urban patch and existing urban patches, and P is the perimeter of this new urban patch. S ranges from 0 to 1. Urban growth type is identified as infilling when S 0.5 , edge-expansion when 0 < S < 0.5 , and leapfrogging when S = 0 , which indicates no common boundary.

3. Results

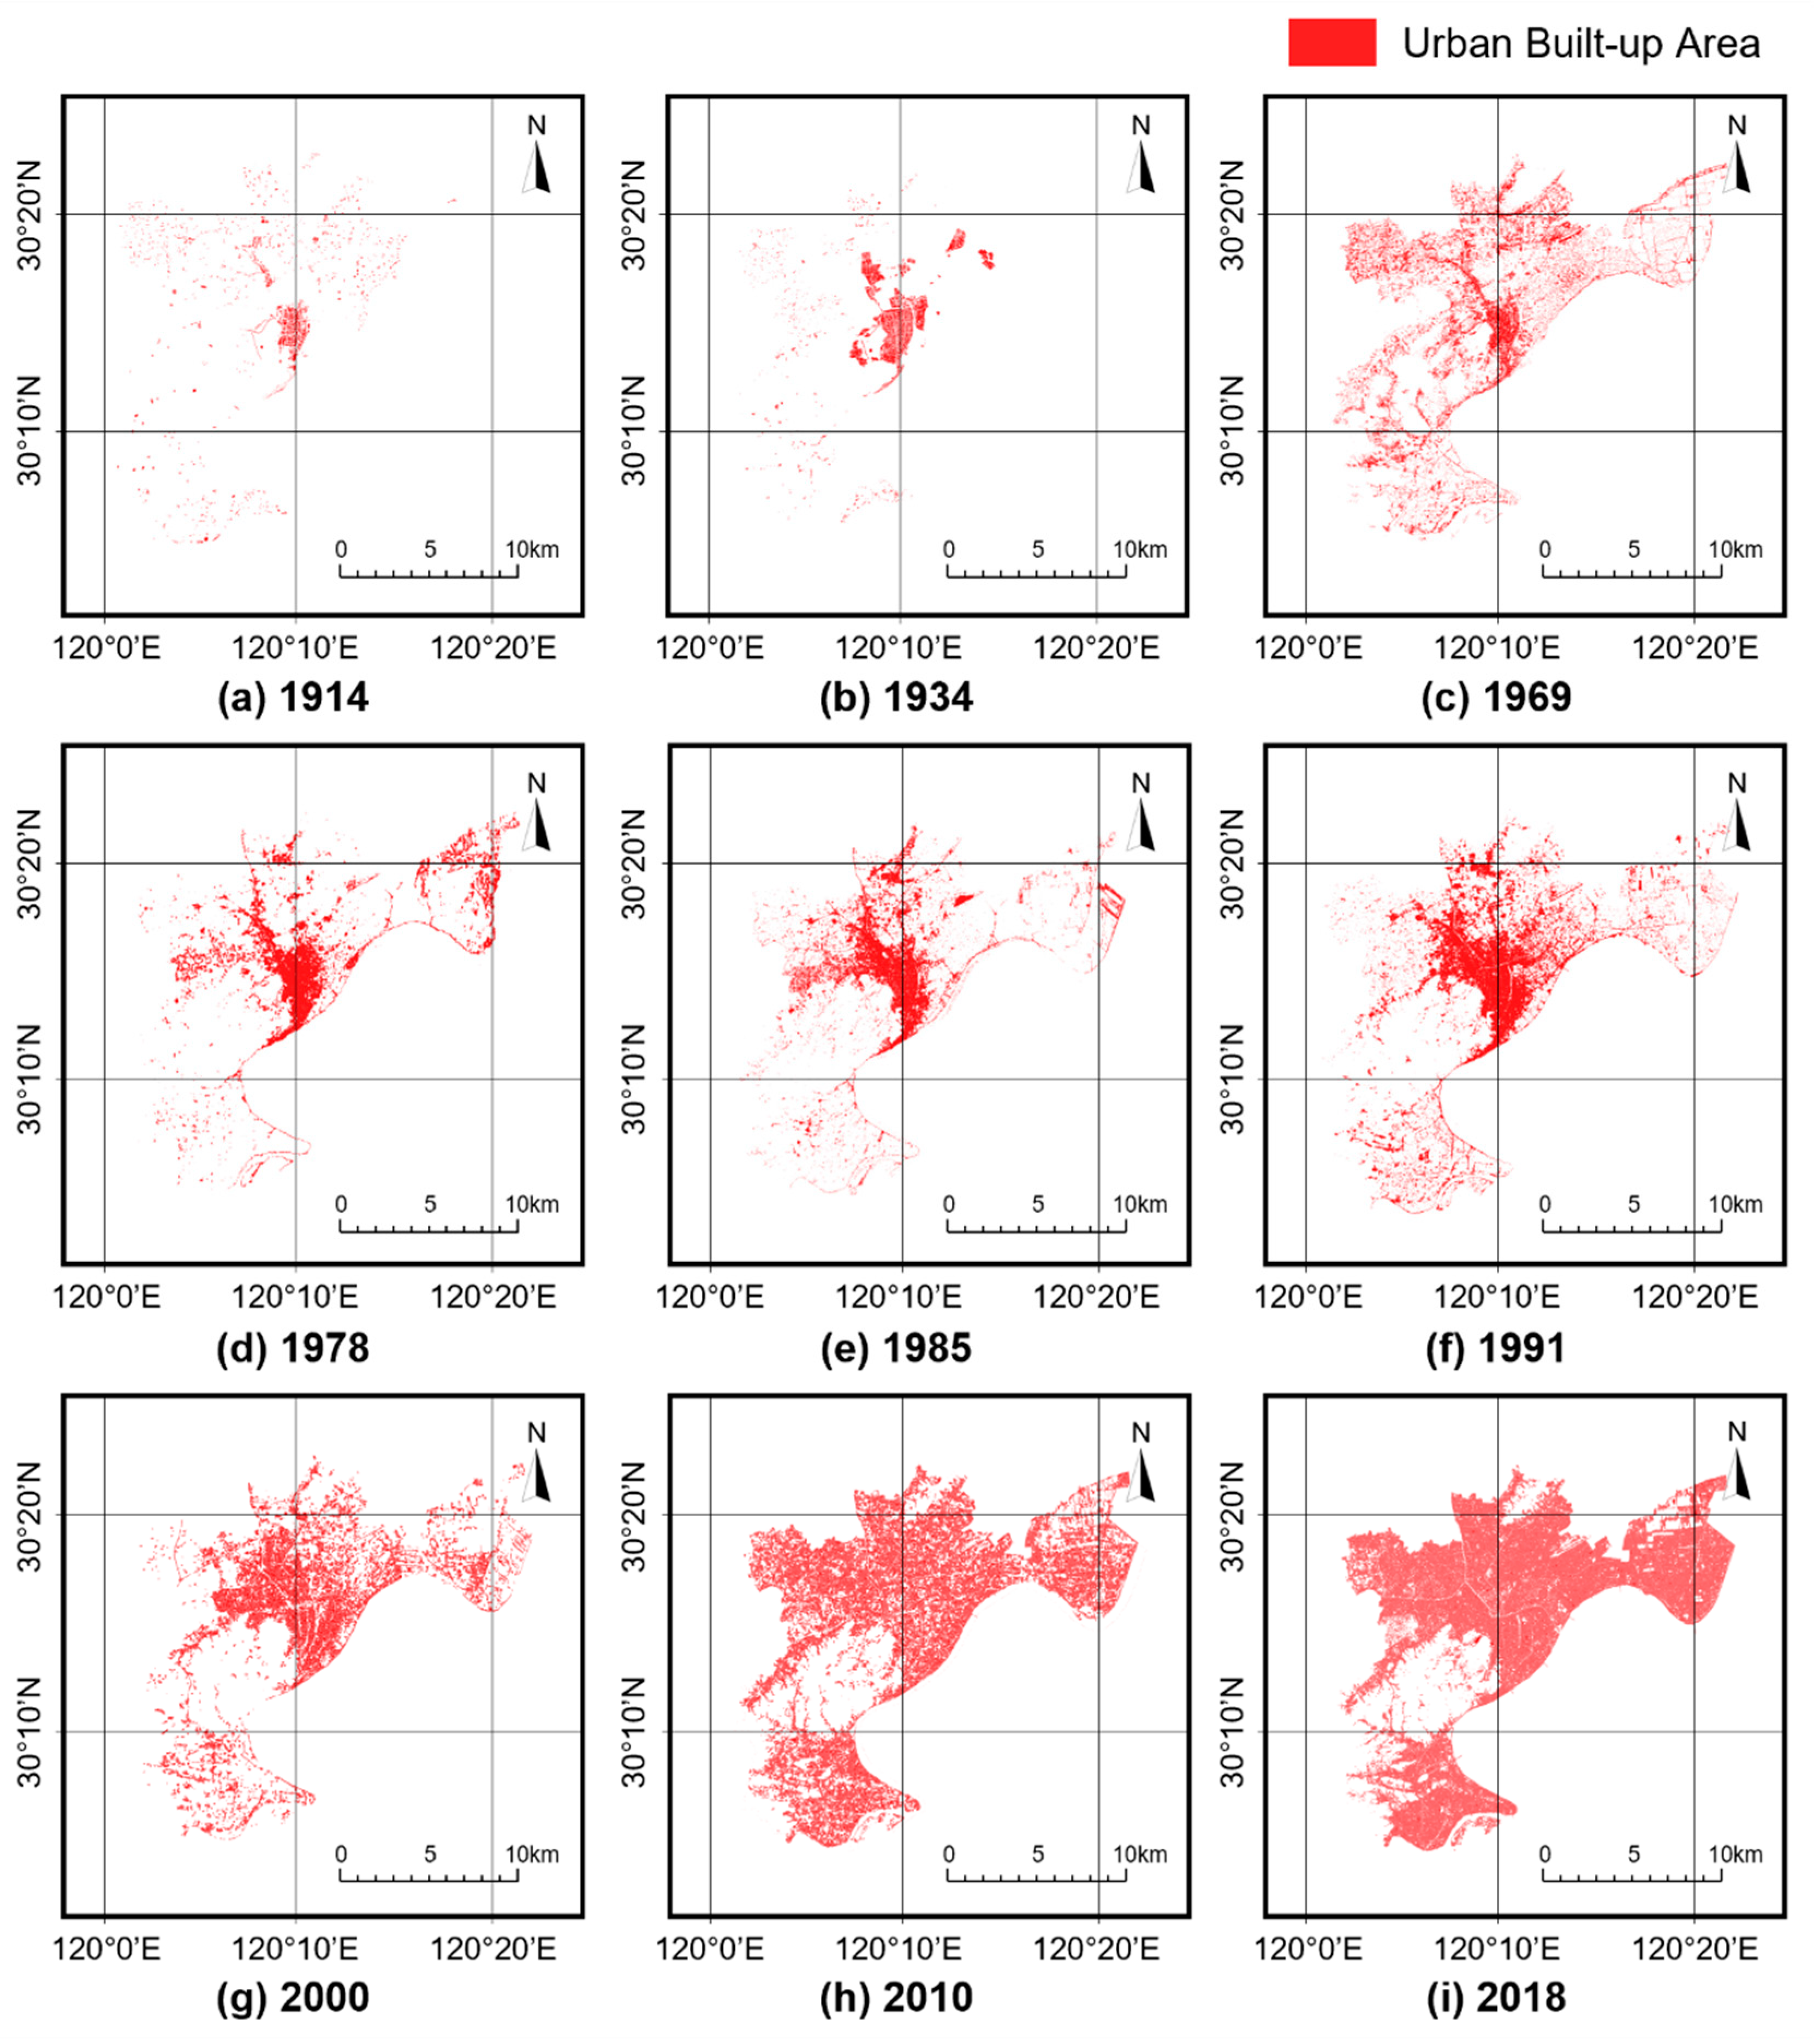
3.1. The Process of Urban Expansion

The temporal changes of the Annual Increase ( A I ) and the Annual Growth Rate ( A G R ) for Hangzhou are listed in Table 3 by time periods. Hangzhou has experienced a magnificent urban expansion during the past hundred years. Specifically, the urban built-up area increased from 17.58 km2 in 1914 to 518.40 km2 in 2018, with an increase of about 29.49 times. Among these periods, the largest A I and A G R emerged from 2000 to 2010, while the smallest appeared from 1969 to 1978.
At the very beginning, Hangzhou experienced initial urban expansion during the Republic of China after the old city wall was demolished in 1914. By 1934, the urban built-up area had almost doubled compared to 1914, which could be attributed to industry development and rapid population growth. The continual wars since 1937 brought the urbanization process into stagnation until the founding of the People’s Republic of China in 1949. Due to the lack of data around 1949, we cannot determine the built-up area changes during the wars. However, since there was almost no increase in the population during this period, it can be inferred to a certain extent that the built-up area may not have changed significantly [55]. The following 20 years witnessed urban development under the planned economic system, which was considered a rough and bumpy period with moderative urban expansion. Nonetheless, due to the influence of the Culture Revolution from the late 1960s to the late 1970s, urban development once again fell into stagnation. Since the Reform and Opening Up in 1978, China has entered an era centered on economic development, promoting rapid urbanization progress. Many heavy industrial factories in Hangzhou were moved northward to create an industrial zone, freeing up space in the city center and reducing the environmental pollution. After the 1990s, the establishment of economic development zones became the most prominent phenomenon in urbanization and played a decisive role in promoting urban expansion. Entering the 21st century, rapid economic development led to unprecedented urban expansion in Hangzhou from 2000 to 2010, with an A I of 20.77 km2 and an A G R of 7.17%, as is consistent with the performance of other major cities in China, such as Shanghai, Guangzhou, and Shenzhen [18]. After 2010, the rate of urban expansion slowed down due to topographical restrictions, and urban land development reached a near-saturation state in the study area. Overall, Hangzhou’s urban expansion concentrated after the Reform and Opening Up, especially in the fast-growing period after 2000.

3.2. Area–Radius Relationship

The detection of the area–radius relationship of urban landscape follows the following steps: (1) designating the city center—in this study, we defined the city center as the location of the Hangzhou Municipal Government in the Republic of China before 1949 and as the location of the Zhejiang Province Government after 1949; (2) making concentric circles around the city center with a radius tolerance of 500 m and numbering the concentric circles from inside to outside (e.g., 1, 2, 3…); (3) calculating the urban built-up area within each concentric circle; (4) plotting the data in the area–radius coordinates; and (5) fitting the data with the power function shown in Equation (3) and recording the concentric circle number ( r ), radial dimension ( D ), and goodness of fit ( R 2 ). ArcGIS Desktop 10.2 was used to complete the above operation.
The breakpoint between the inner and outer zone can be detected by the fractal signature (i.e., r , D , and R 2 ) based on specific criteria [43]. The goodness of fit, R 2 0.996 , and standard error, δ 0.04 , are often used as the criteria for where the city is fractal [41]. In this study, we set a threshold to detect the scaling extents with reference to the above criteria. As the radial dimension represents the core–periphery pattern of the urban landscape, the derivative of Equation (3) can be written as follows:
d S d r = k D r D 1
where d S / d r denotes the rate of change of urban built-up area, S , with the radius, r . Then we take the second derivative of the above equation:
d 2 S d r 2 = k D D 1 r D 2
where d 2 S / d r 2 denotes the changes in the rate of change of urban built-up area, S , with radius, r . When D 1 , then d 2 S / d r 2 0 , and the rate of change of urban built-up area increases, which indicates a steeper agglomeration pattern near the city center; on the contrary, when 0 < D < 1 , then d 2 S / d r 2 < 0 , and the rate of change of urban built-up area decreases, which reflects a flatter outer zone of the urban landscape. Therefore, we chose D 1 and R 2 0.996 as the criteria for detecting the optimal breakpoint between the inner and outer zones. In this case, the breakpoint (or kink) demarcates the urban area into two scaling extents with dissimilar urbanization patterns (i.e., stabilized urbanization and active urbanization) [37].
Following the above procedure and criteria, the fitted power function formulas for the inner and outer zones and the radius of the breakpoint separating the two scaling extents are listed in Table 4.
In the above table, the inner zone satisfies our fractal criteria (i.e., D 1 and R 2 0.996 ), representing the completed urbanization and intensive land use. In contrast, the outer zone dissatisfies our criteria and is still undergoing active development of natural land into urban uses. The optimal breakpoint that separates the inner and outer zones is located at the maximum radius under the premise of the above fractal criteria. The last column records the radius from the city center to the optimal breakpoint. At most temporal snapshots, the urban landscape of Hangzhou showed two scaling extents corresponding to the inner and outer zones, as is consistent with the bi-fractal city model [43]. However, the urban landscape in 1985 and 1991 exhibited more than one extent that satisfied our fractal criteria, so we combined them together as the inner zone.
Overall, the breakpoint displayed a strong outward expansion tendency over time, accompanied by a persistent increase in the breakpoint radius and the expansion of the inner zone. The results suggest that Hangzhou became cumulatively urbanized, with a higher proportion of completed and intensive urban land uses, especially after 2000. In addition, the inner and outer zones divided by the fractal breakpoints here are used for the following landscape analysis.

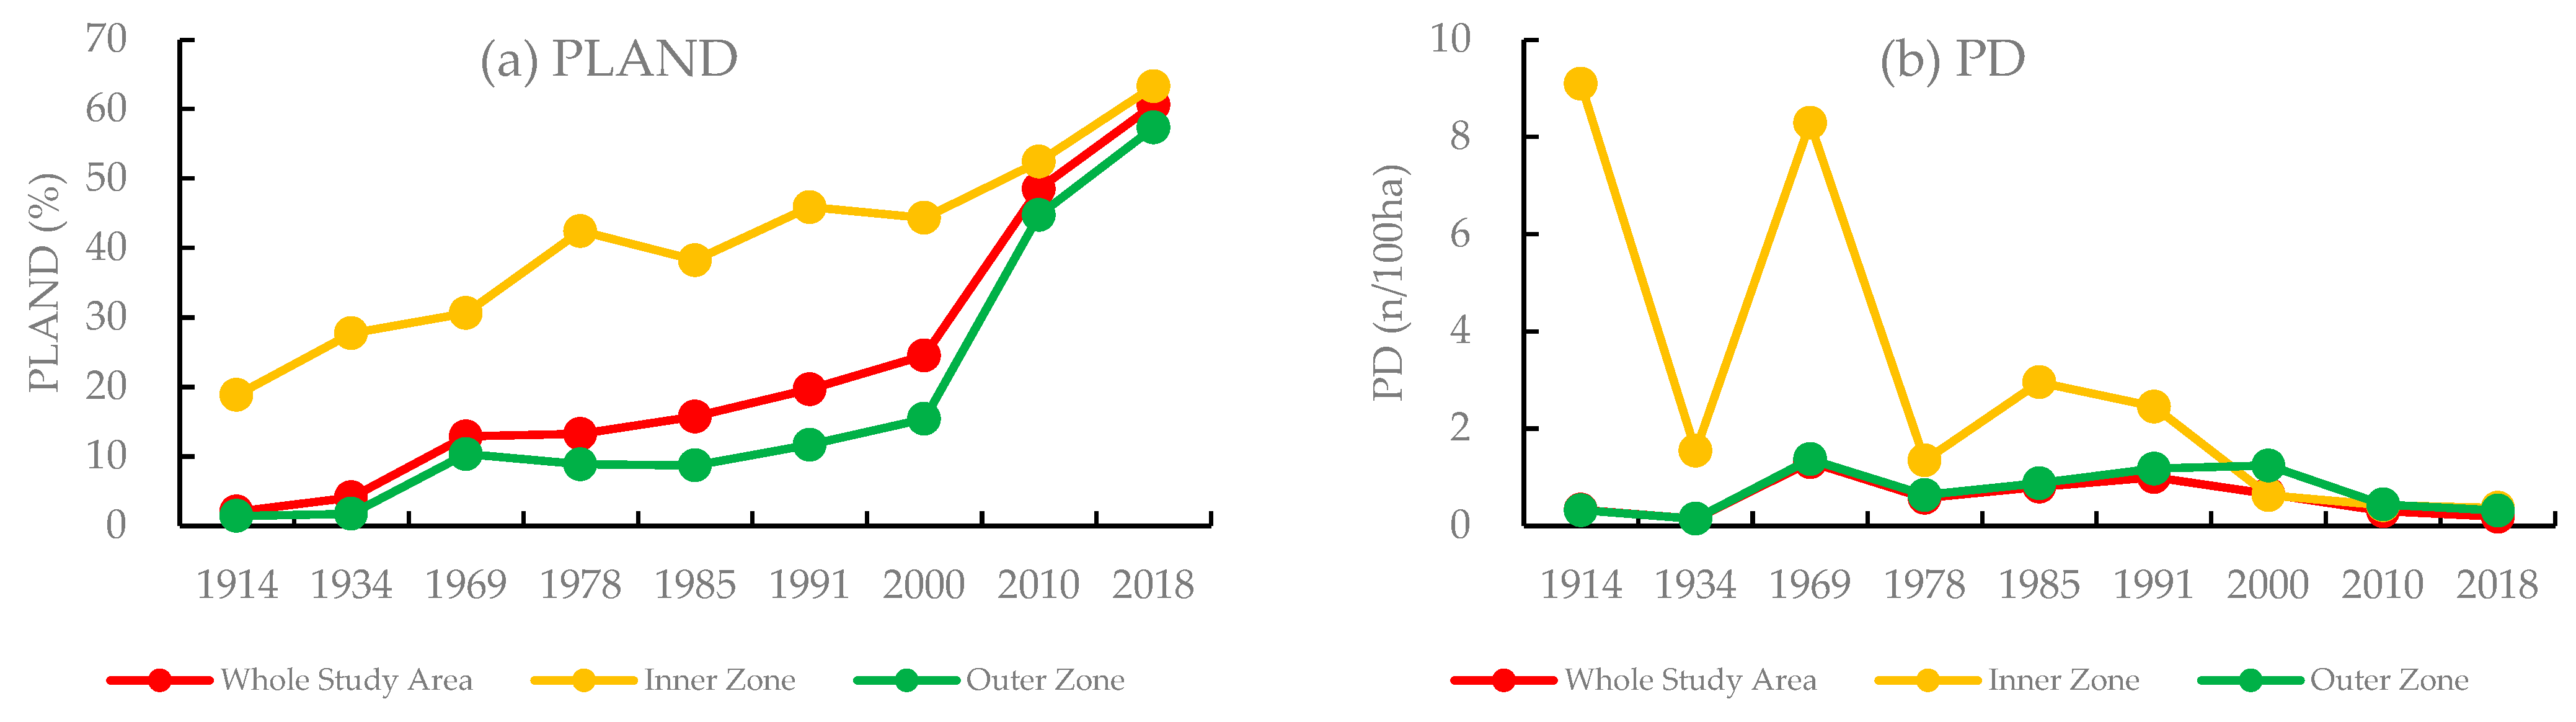
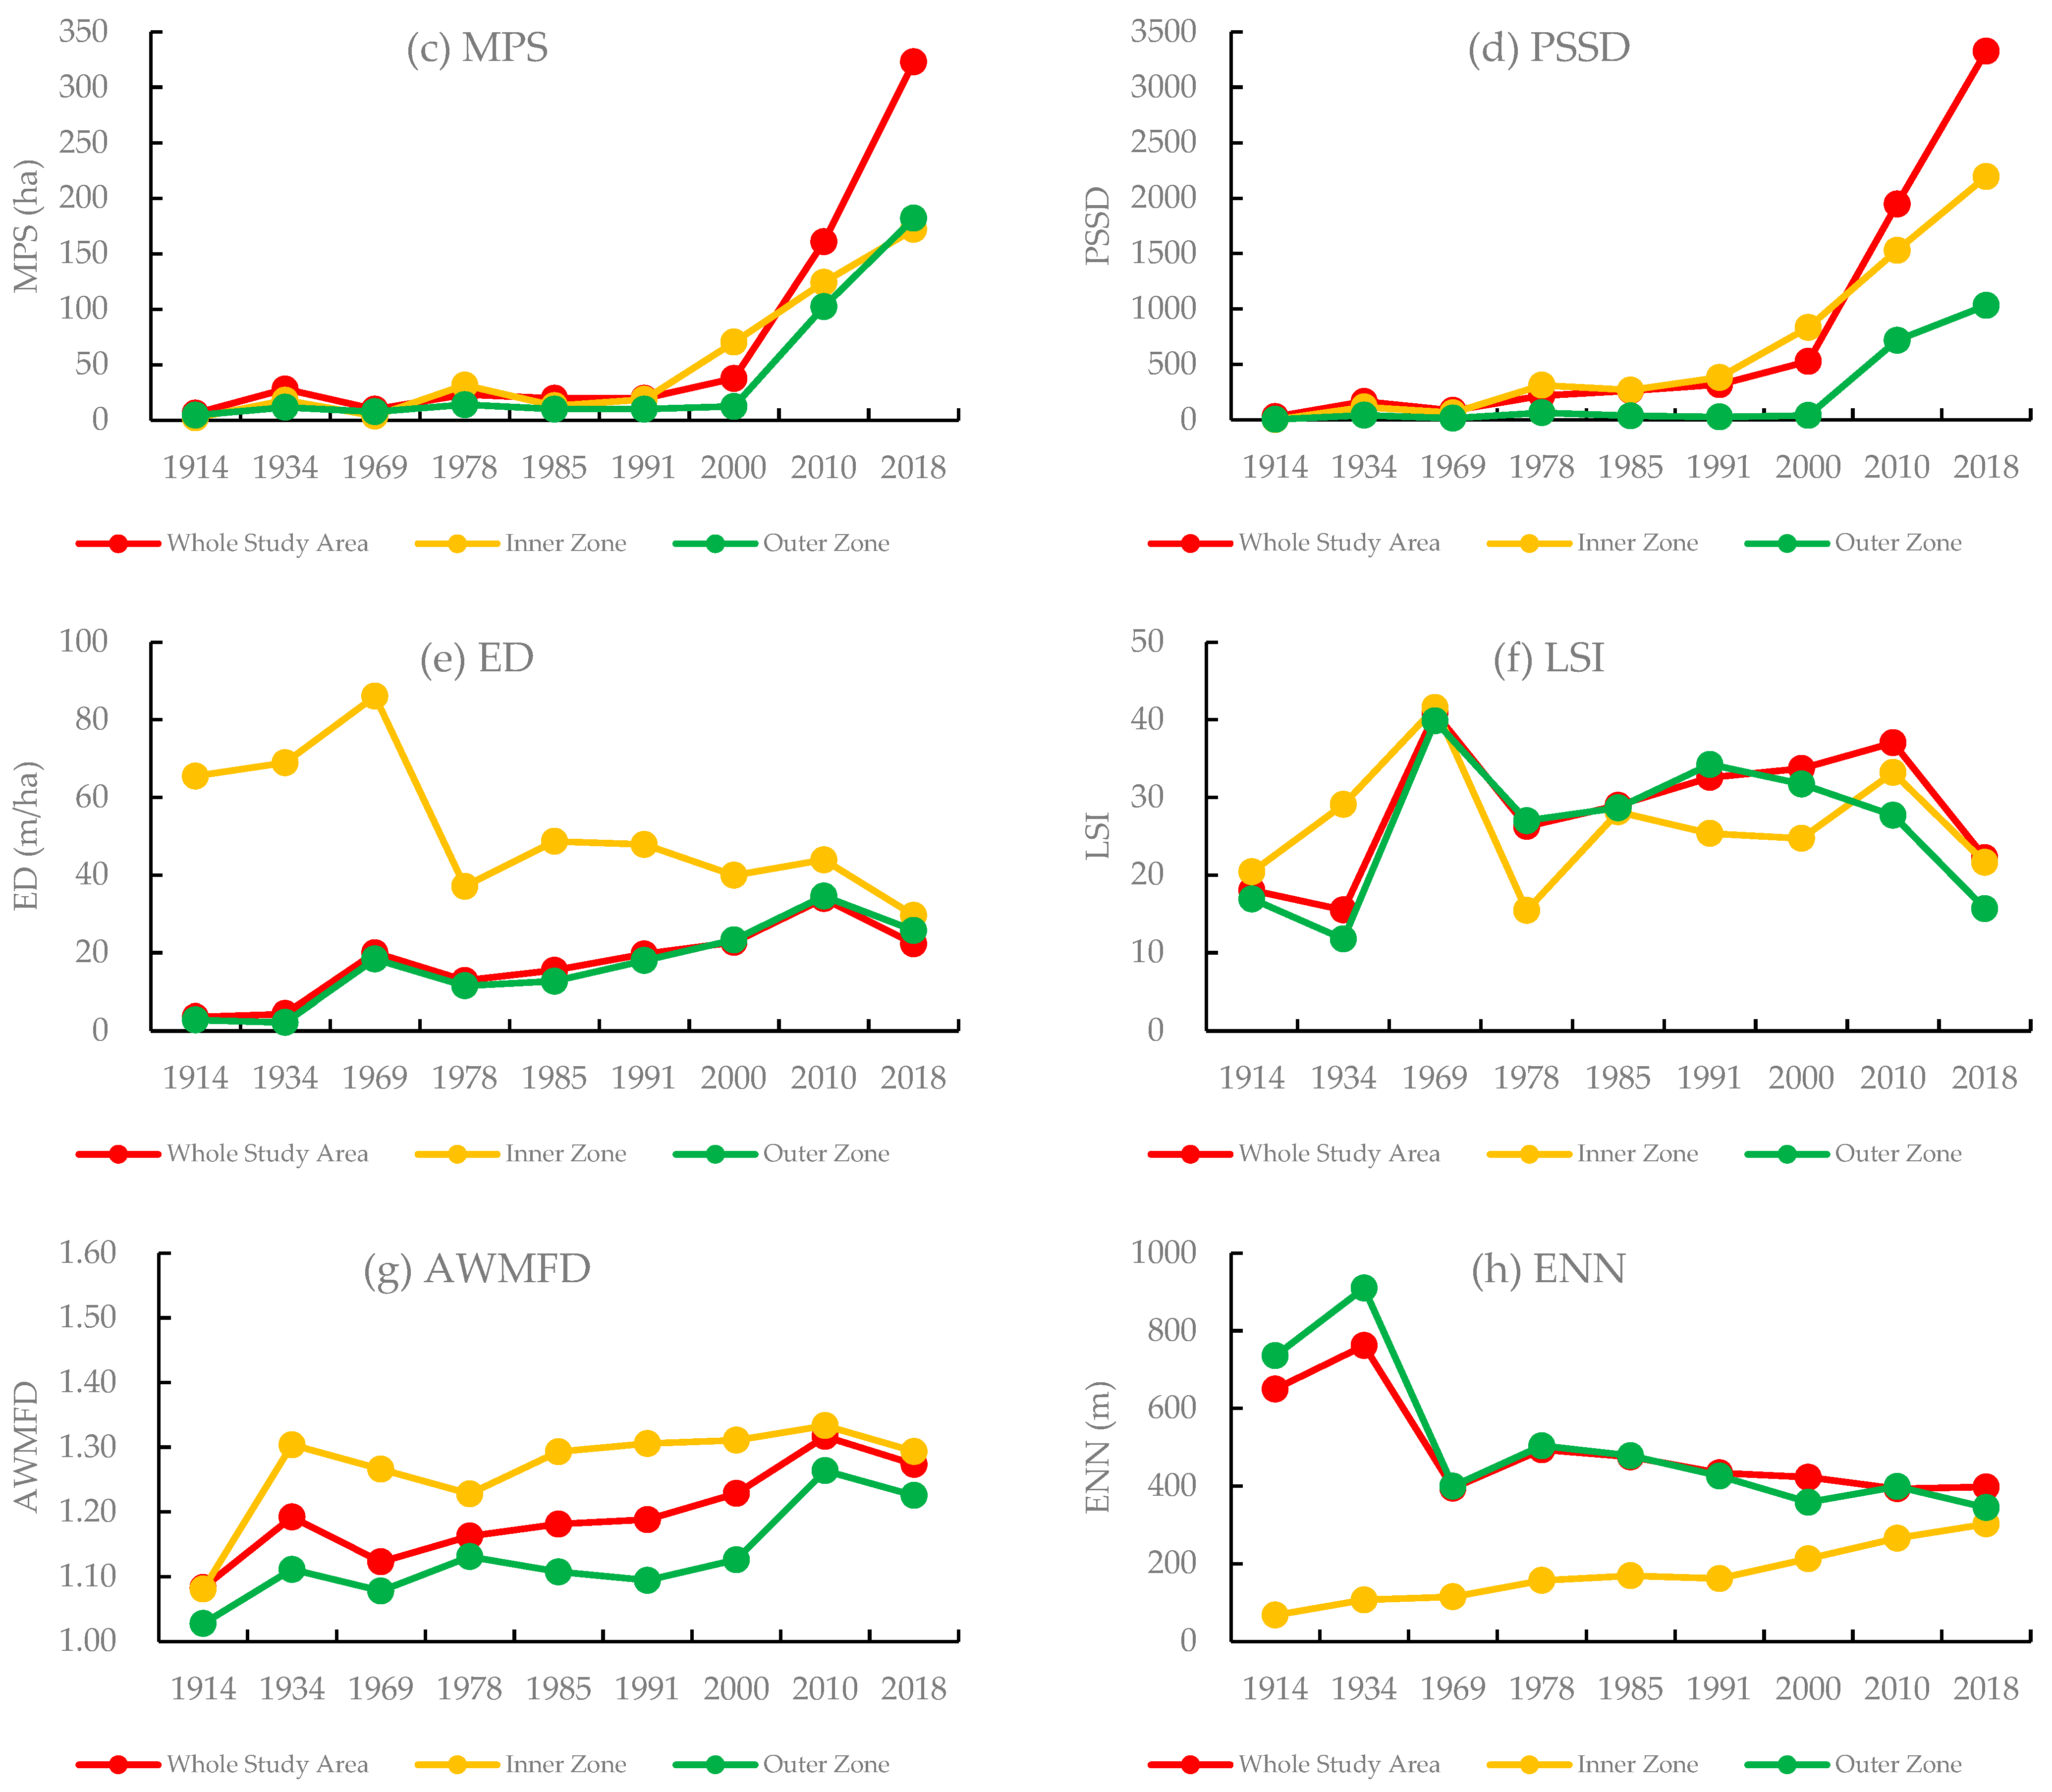
3.3. Landscape Dynamics in the Process of Urban Expansion

In order to investigate the landscape characteristics in different urban areas, the landscape metrics of the urban built-up area were computed in three spatial extents, namely the whole study area, the inner zone, and the outer zone. Figure 4 demonstrates the trends in the landscape changes at each spatial extent during the study period.
The time series of landscape metrics can be used to explore the applicability of the diffusion–coalescence hypothesis in different urban extents during urban expansion. The oscillatory process between the two alternating phases (i.e., diffusion and coalescence) can be measured by the temporal dynamics of landscape metrics. Generally, during the diffusion phase, the patch density (PD), edge density (ED), and mean Euclidean nearest neighbor distance (ENN) will increase, while the coalescence phase shows opposite trends [17,19]. Additionally, patch shape tends to be fragmented during the diffusion phase but regularized in the coalescence phase, which can be indicated by the rise and fall of landscape shape index (LSI) and area-weighted mean fractal dimension (AWMFD).
We examined the diffusion and coalescence processes based on the long-term time series of landscape metrics at multiple urban extents. At the very beginning, the built-up area spread out from the city center associated with an increase in ED and ENN in 1914–1934. The inner zone displayed a more pronounced diffusion trend than the outer zone. Meanwhile, as shown by the LSI and AWMFD, the patch shape became irregular and fragmented, which aligns with the characteristics of early urbanization. The period 1934–1969 witnessed a complex development period against the war since 1937 and the planned economy after the founding of the People’s Republic of China in 1949. In this period, the urbanization pattern presents a combination of diffusion and coalescence, as suggested by an increase in PD and ED and a decline in ENN. However, due to the lack of data around 1949, we cannot characterize the urbanization pattern in more detail. In 1969–1978, economic growth became stagnant due to the impact of the Cultural Revolution. The decrease of PD, ED, LSI, and AWMFD indicated a coalescence process of urban development, especially in the inner zone. After the Reform and Opening Up in 1978, all urban extents showed an evident diffusion trend, with increases of PD, ED, LSI, and AWMFD. In the inner zone, PD and ED reached an apex in 1985 and then declined, suggesting that the inner zone was undergoing a transition phase between diffusion and coalescence. However, PD and ED exhibited consecutive ascending trends in the outer zone from 1978 to 2000, showing a continuous diffusion process. This phenomenon demonstrates a discrepant pattern of urbanization in different urban extents. The inner zone entered the coalescence phase after the previous diffusion, while the outer zone showed a thriving diffusion trend, indicating that active urbanization was spreading from the urban core to the periphery. In 2000–2010, under rapid urbanization, the landscape metrics showed mixed support for diffusion and coalescence. The city underwent a transitional period in which two phases of diffusion and coalescence coexisted. After 2010, as indicated by the decrease of PD, ED, LSI, and AWMFD, all urban extents showed salient coalescence trends, reflecting the consolidation and integration tendency in the terminal stage of urbanization.

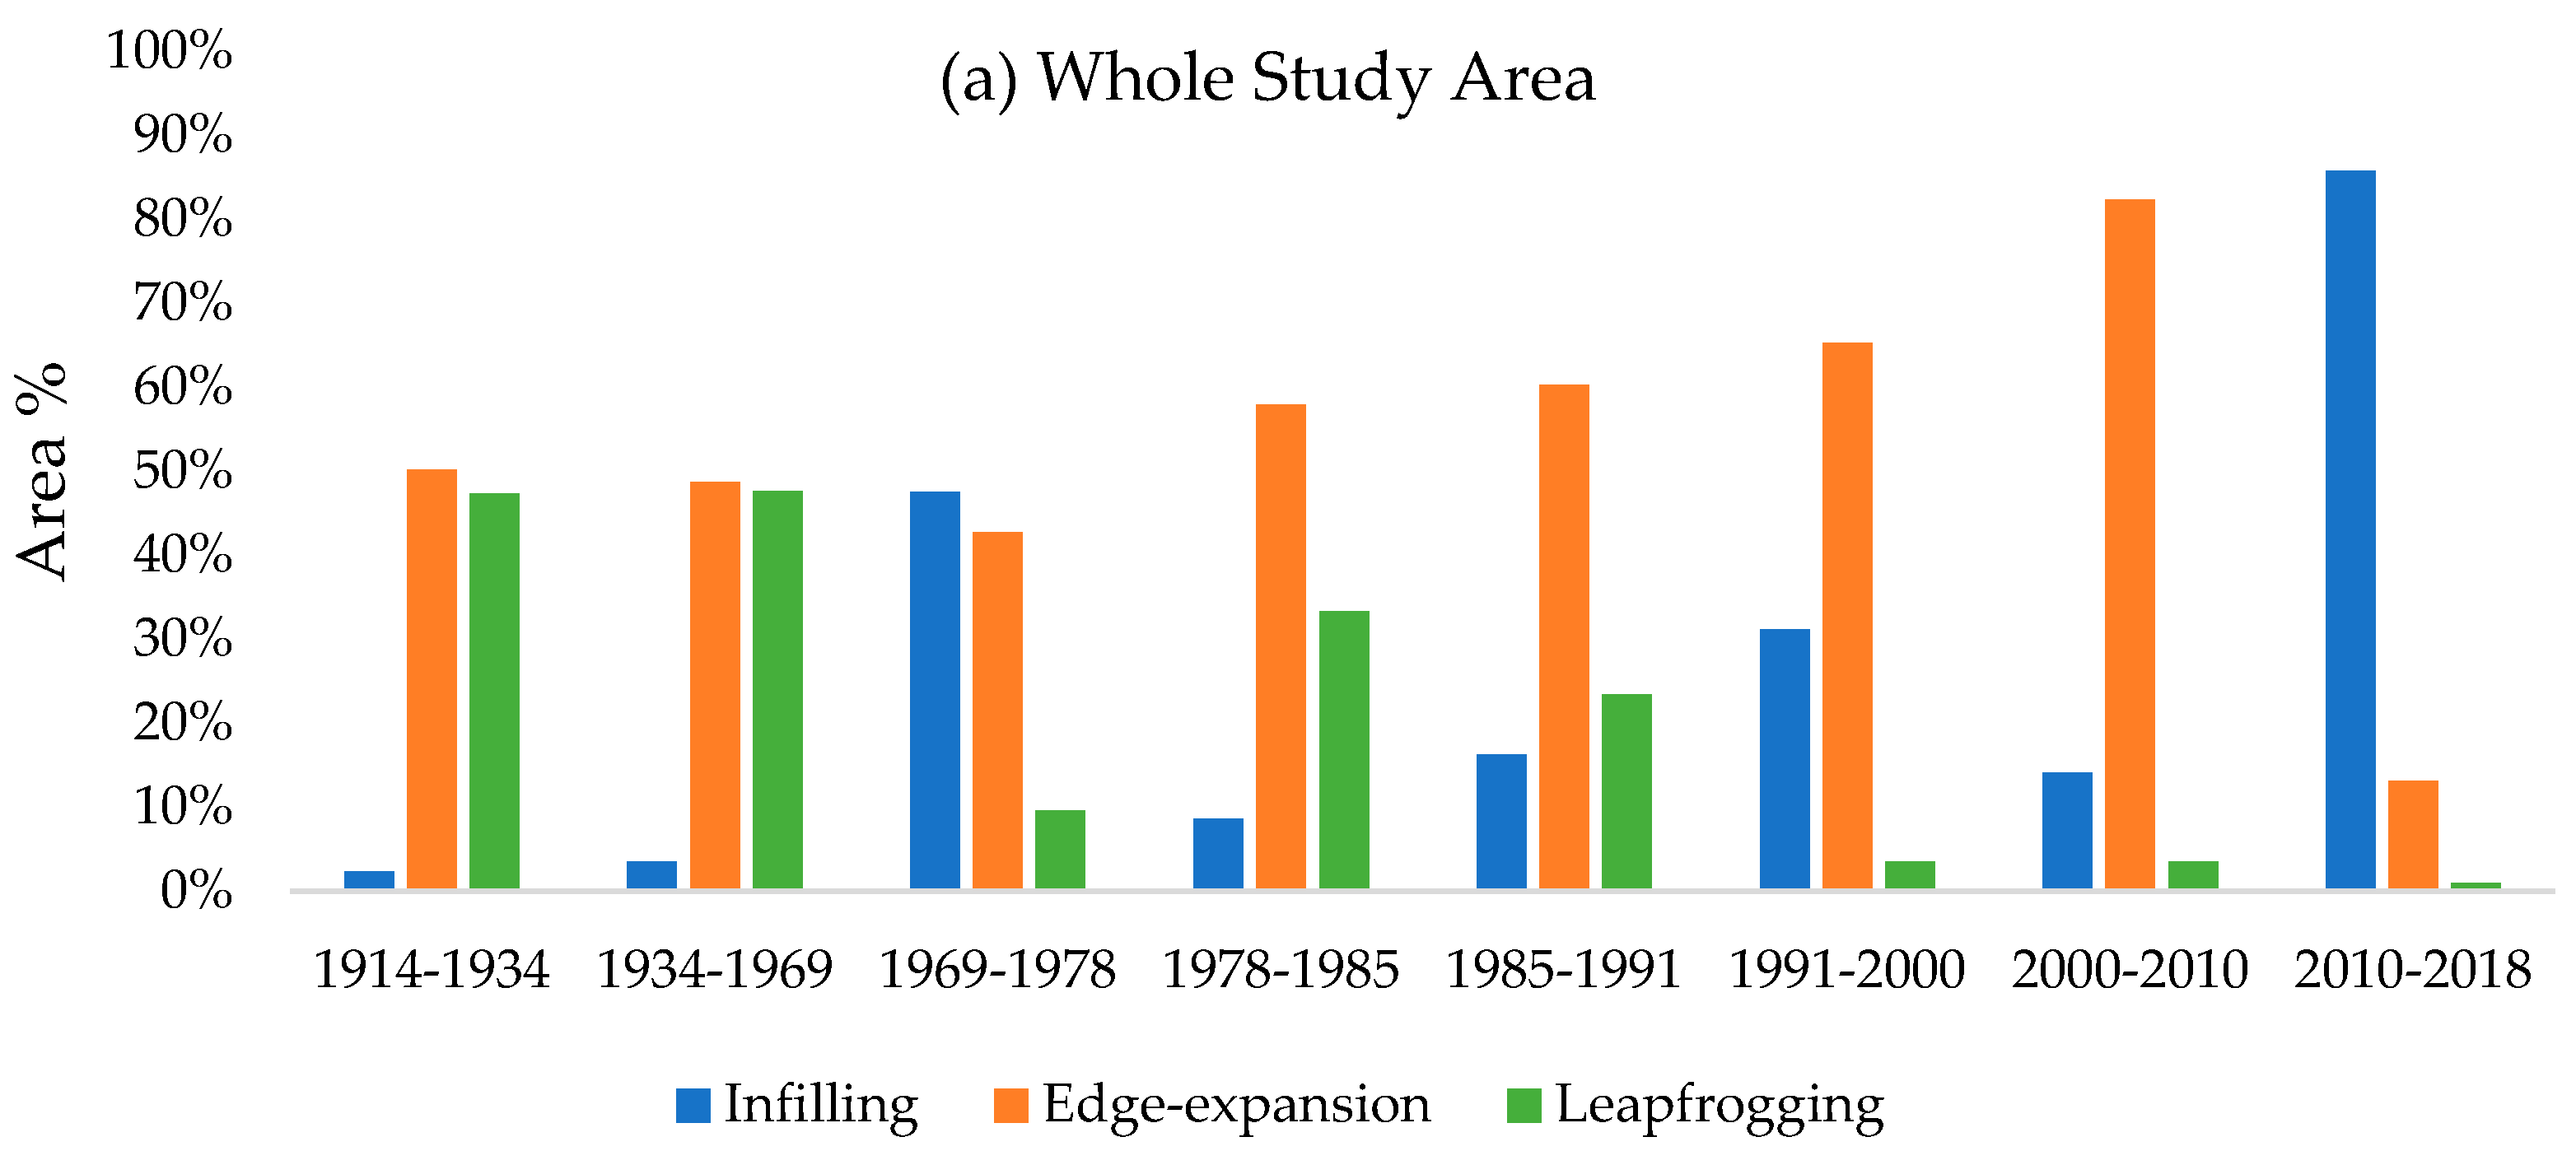
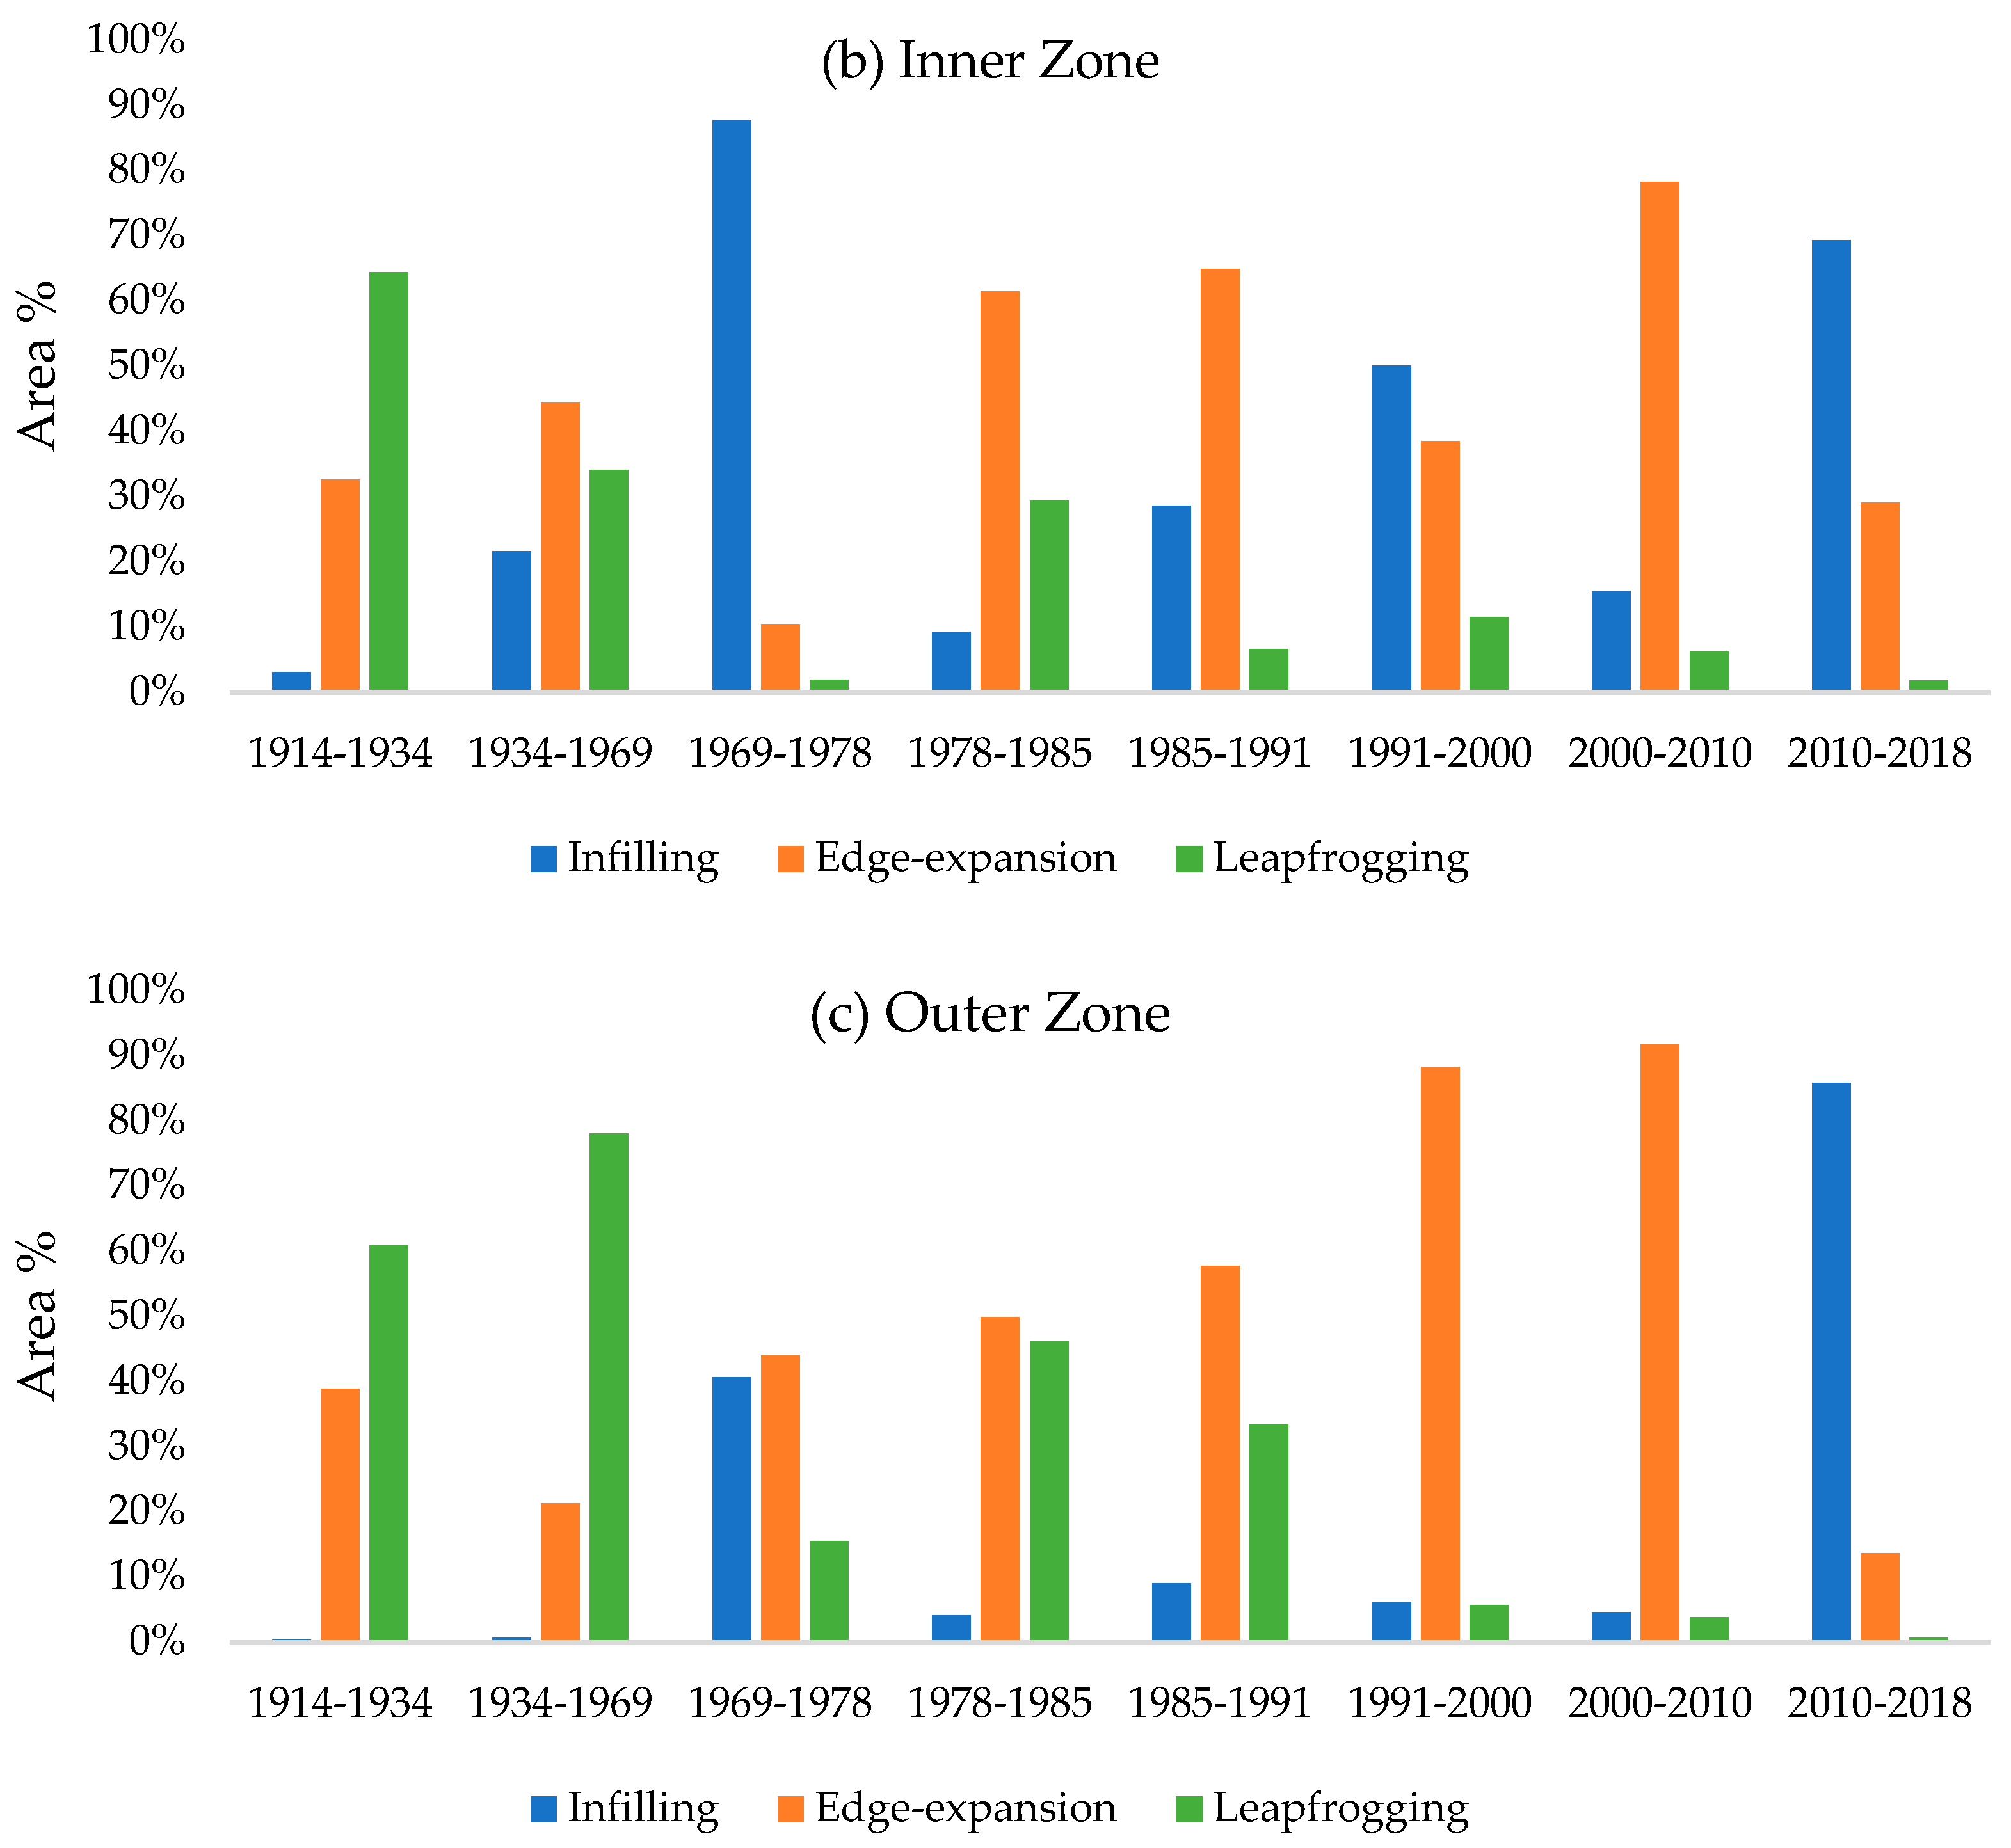
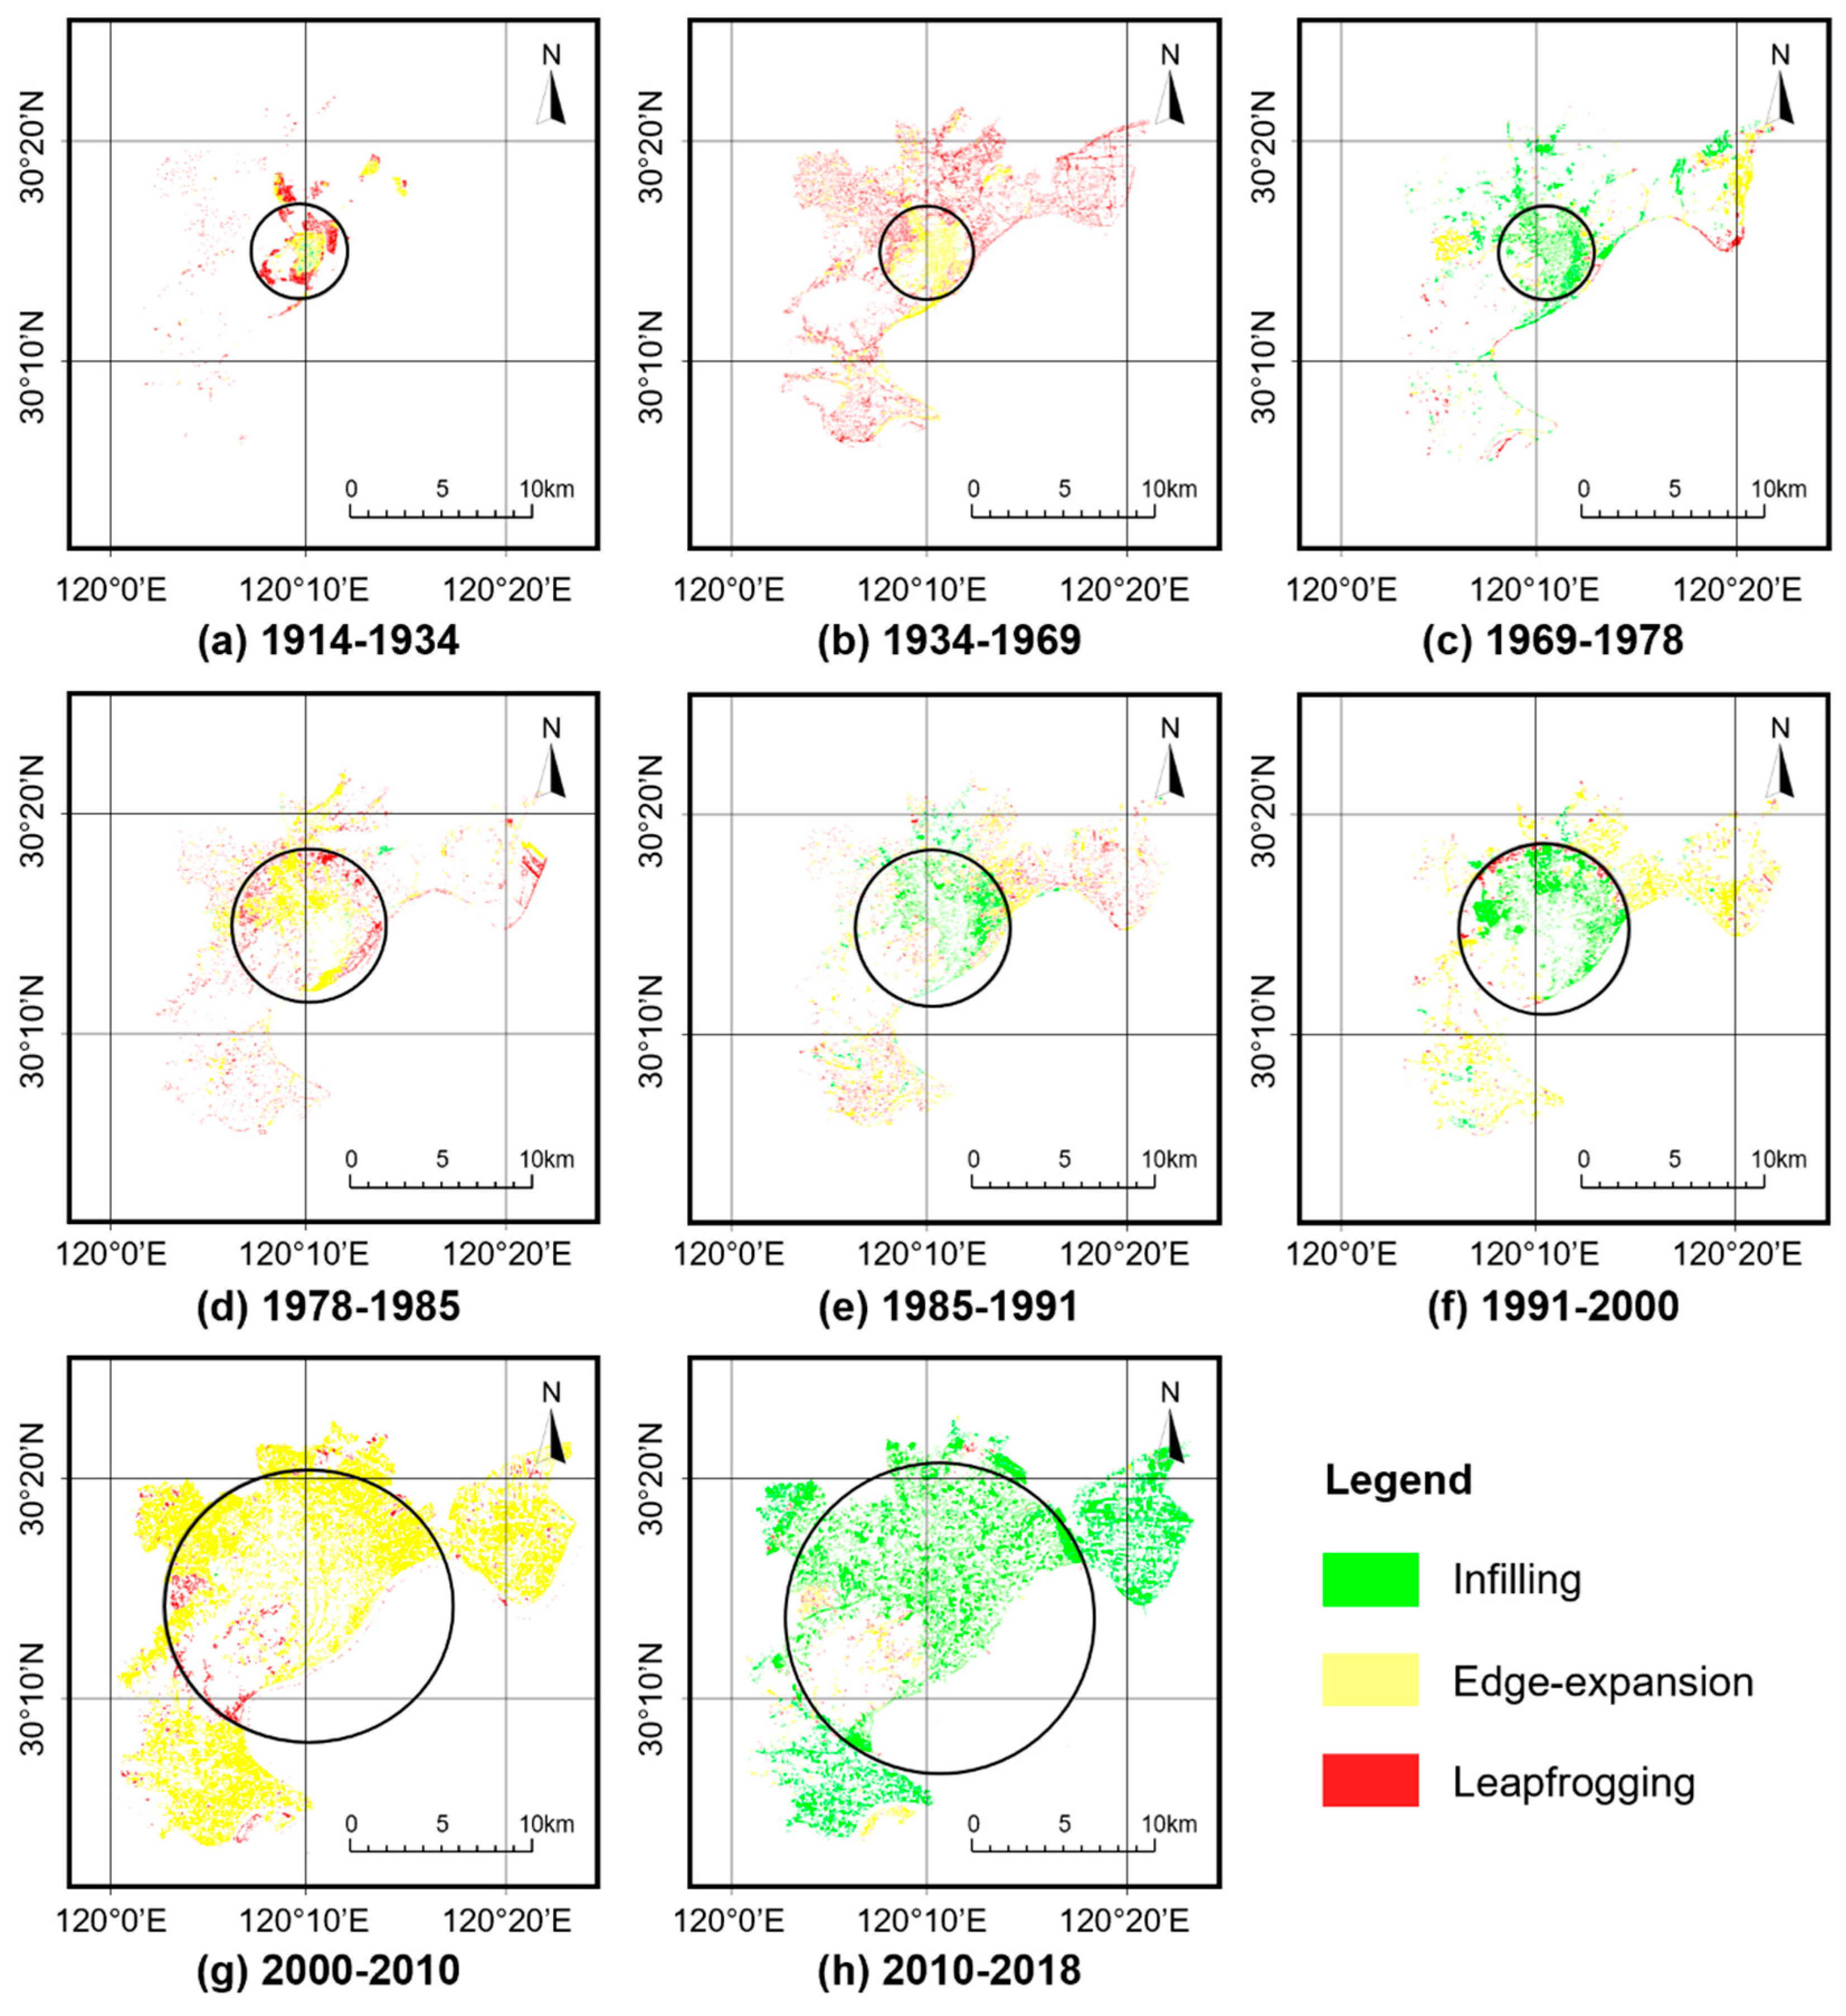
3.4. Spatiotemporal Dynamics of Urban Growth Types

Figure 5 shows the change in the relative dominance of the three urban growth types, namely infilling, edge-expansion, and leapfrogging, over the study period. Figure 6 demonstrates the spatial distribution of the three urban growth types within different urban extents.
Regarding the whole study area, edge-expansion and leapfrogging were the dominant growth types in 1914–1934 and 1934–1969, while infilling was almost invisible, reflecting a significant outward expansion trend in the initial urbanization process. In 1969–1978, infilling overtook leapfrogging and became the dominant growth type. Since 1978, edge-expansion has long dominated due to rapid urbanization, with a gradual increase in infilling and a decline in leapfrogging. Moreover, edge-expansion peaked in 2000–2010, accounting for more than 80% of new urban expansion. Infilling then overtook edge-expansion and has dominated since 2010, as urbanization was nearing completion with the almost fully occupied urban built-up area and limited untapped space.
In the inner zone, the proportion of leapfrogging was relatively lower, except for the initial period, i.e., 1914–1934. Edge-expansion had prominent influences in 1934–1969, 1978–1991, and 2000–2010. The most distinctive feature of the inner zone is the pivotal role of infilling in the process of urban expansion, especially in 1969–1978, 1991–2000, and 2010–2018. Two consecutive rising trends of infilling are also observed: one is from 1978 to 2000, and the other is from 2000 to 2018. Regarding the spatial pattern of urban-growth types, infilling was mainly concentrated in urban centers, leapfrogging was located at the periphery of the inner zone, and edge-expansion was distributed between infilling and leapfrogging.
In the outer zone, leapfrogging was more observable than in other extents. Leapfrogging was the dominant growth type during the initial urban development from 1914 to 1969 and also played a prominent role in the early stages of rapid urbanization from 1978 to 1991. A consistent increment of edge-expansion has been observed since 1969, with a subsequent decline of leapfrogging. Edge-expansion occupied a remarkable dominant position in the fast-growing period from 1978 to 2010. Infilling had a relatively weak influence in the outer zone over a long period but peaked at the end of urbanization in 2010–2018, when edge-expansion and leapfrogging were nearly extinct.
In summary, edge-expansion had prominent and consecutive influences at all three urban extents over the study period. Leapfrogging played a notable role in the outer zone and the early stages of urbanization. Infilling was more observable in the inner zone and the later stages of urbanization.

4. Discussion

4.1. Testing Urban Expansion Hypotheses

4.1.1. Diffusion–Coalescence Hypothesis

The notion that urban expansion is an alternating process of two phases (i.e., diffusion and coalescence) was proposed by Dietzel et al. [12]. In the initial stage of urbanization, urban patches are concentrated around the city center with relatively regular and compact urban landscapes. As urban expansion begins, more urban patches disperse to new growth poles away from the city center, creating a more fragmented and heterogenous landscape. With the advancement of urbanization, new urban patches tend to appear at the fringe of the existing urban built-up areas and fill the gaps within them. This densification process transforms heterogeneous landscapes into homogenous ones with regularized and agglomerated urban patches.
In general, the urban expansion process in Hangzhou conformed with the diffusion–coalescence hypothesis, showing oscillations between two alternating phases. In the primitive stage of urbanization from 1914 to 1978, Hangzhou exhibited a biphasic wave-like process with an initial diffusion phase followed by a transitory period of coalescence. However, due to the complex political and economic background, the urbanization process in this period was not market oriented. The transitory coalescence phase in 1969–1978 was caused by the Cultural Revolution, which stagnated economic growth and urban development. After 1978, Hangzhou experienced a continuous market-driven urbanization process with a notable alternation between diffusion and coalescence indicated by unimodal patterns of PD and ED. However, there are significant divergences at different spatial extents. The inner zone entered the coalescence phase in 1985, which is much earlier than the outer zone in 2010. This shows that the inward densification phase at the urban core and the outward diffusion phase at the urban fringe have coexisted for a long period during the last 40 years of urbanization. The results of this study are generally in line with the diffusion–coalescence hypothesis, especially during the 1978–2018 urbanization wave. However, we do not support the viewpoint proposed by Jenerette and Potere [16] that “the diffusion–coalescence dichotomy represents endpoints rather than alternate states of urban growth.” On longer timescales, cities may exhibit multiple alternations between diffusion and coalescence (which is also known as “diffusion rejuvenation”), since urbanization processes are often fraught with discontinuities and turbulence [21]. As our case shows, affected by the political and economic turmoil in different historical periods, Hangzhou has undergone multiple transitions between the two phases rather than a unimodal trajectory. Moreover, due to the discrepancies in the development stages, the sequence, intensity, and duration of the two phases can vary widely across different urban spatial extents. Therefore, it is difficult to draw a clear boundary between diffusion and coalescence for the whole city. Cities are likely to present a coexisting pattern with oscillating alternation between diffusion and coalescence in the process of urbanization.

4.1.2. Three-Growth-Type Hypothesis

As the diffusion–coalescence dichotomy has been criticized for being oversimplistic, three types of urban growth (i.e., infilling, edge-expansion, and leapfrogging) have been identified to better characterize the urbanization process [19,20]. Li et al. [21] described this growth model as a spiraling process of shifting dominance among three growth types. They also pointed out that edge-expansion is likely to retain its importance throughout the process, while leapfrogging and infilling tend to alternate on their relative dominance. The results of this study are generally consistent with this model. At the whole urban area, edge-expansion occupied a high proportion throughout the study period, while leapfrogging was more prominent in the early stage and infilling emerged in the later period. However, urban-growth-type patterns may also vary significantly across different spatial extents, depending upon intra-city variations in development stages and land availability. For our case, leapfrogging had a more pronounced importance in the outer zone, especially in the early days when there was ample spare land for scattered and dispersed growth, whereas infilling occupied a larger proportion in the inner zone where there was only limited interspace amongst the compact built-up area.
By and large, Hangzhou conforms to the theoretical assumptions of the three-growth-type hypothesis, i.e., the predominance of edge-expansion with wax and wane between infilling and leapfrogging, especially in the successive development period from 1978 to 2010. This growth model is also defined by Chakraborty et al. [56] as an oscillating/ping pong pathway, which is followed by most megacities worldwide. It is worth pointing out that the alternation between growth types is not an absolute replacement but a shift in relative dominance based on coexistence (concurrent operation). This is evidenced by the simultaneous prominence of multiple growth types during certain periods in our study. Nonetheless, our findings also echo Bosch et al.’s [37] observation that infilling does not necessarily diminish but becomes increasingly pivotal over time. Our case confirms that infilling took a notable dominance in all spatial extents at the terminal stage of urbanization. To some extent, this evidence also supports the sequential co-occurrence model proposed by Novotný et al. [30], stating that cities follow a sequential alternation from leapfrogging through edge-expansion to infilling along the process of urban expansion. Overall, our study documents a typical urbanization pattern in which edge-expansion remains consistent in importance, while leapfrogging and infilling alternate their relative dominance with significant inter-temporal and intra-city variations. In this alternation, leapfrogging prevails in the initial stage of urbanization, as well as in the urban periphery, while infilling predominates in the terminal period of urbanization and concentrates near the urban core. Such findings also call for additional consideration of spatiotemporal scales when examining the generality of the presumptive trajectory of urban expansion postulated by the three-growth-type hypothesis.

4.1.3. Comparison of the Two Prevalent Hypotheses

The two prevalent hypotheses employ unique metrics to characterize the general trajectory of urban expansion. In addition to the above analysis, we also find close connections between them, as well as discrepancies with their respective merits and defects. First, the alternative dominance pattern of infilling, edge-expansion, and leapfrogging was closely linked to the diffusion–coalescence model of urban expansion. Leapfrogging usually emerges extensively during the diffusion phase, while infilling plays a prominent role when cities start to coalesce. A typical case is the evident coalescence period (e.g., 1969–1978 and 2010–2018), during which infilling reached an apex, leading to the densification and regularization of the urban landscape. Second, when investigating the diffusion/coalescence phases, landscape metrics should be selected with great caution, as different metrics may indicate opposite trends. For example, in our study, ENN often showed opposite directions with PD, ED, or LSI. This could be attributed to the complex topography of Hangzhou. Since ENN gauges the average distance between urban patches, large landforms, such as mountains and lakes (e.g., the West Lake), may bring huge biases into ENN calculations. Therefore, since a single metric may lead to misjudgment, it is necessary to investigate multiple metrics when determining diffusion/coalescence trends. Moreover, landscape metrics are highly sensitive to data resolution. Since our study incorporates multisource datasets (including historical topographic maps and remote sensing images) with great differences in data resolution, although we implemented resampling before running the analysis, this may still bring some biases to the landscape metric calculations. Thus, we mainly focus on the evolutionary trends of landscape metrics rather than their absolute values. Third, the specific meaning and implications of edge-expansion may require further exploration. Unlike leapfrogging and infilling, which have explicit meanings in the process of urbanization (i.e., leapfrogging corresponds to diffusion, and infilling corresponds to coalescence), edge-expansion may provide an ambiguous concept. Edge-expansion may indicate an outward dispersion trend but may also represent an inward densification process. Therefore, it may be too vague to generalize urbanization as a process dominated by edge-expansion, especially in the periods when it occupies a large proportion (which is not uncommon in many cases). The integrated analysis of urban growth types and landscape metrics may provide more valuable insights for urban expansion.

4.2. Key Drivers of Urban Expansion

The spatiotemporal changes of urban expansion showed clear footprints of a series of socioeconomic changes over the past century that have shaped diverse urban landscapes at different stages. Since the underlying driving forces of urban expansion are intricate and complex, we only briefly summarize several pivotal factors to help explain the aforementioned urbanization process.

4.2.1. Political Revolution and Institutional Reform

Before the 20th century, Hangzhou was an unindustrialized ancient city with its urban area concentrated in the Manchu City (mancheng), which was established in the Qing Dynasty. After the “Treaty of Shimonoseki” forced Hangzhou to become a trading port in 1895, the Gongchen Bridge area in the north of the city was designated as a Japanese concession, compelling the initial development of modern manufacturing and commerce. Around 1914, the Manchu City was demolished and replaced by the New Market (xinshichang), which became the most prosperous commercial center at that time. In the early period of the Republic of China (the 1910s–1930s), Hangzhou experienced an initial urban expansion with sporadic leapfrogging and fragmented landscape. After the war began in 1937, urban development came into stagnation. During the 1950s, driven by the socialist planned economic system established since the founding of the People’s Republic of China, Hangzhou made some preliminary achievements in economic growth and urban development. However, the unprecedented political movement, i.e., the Three-Year Disaster (1959–1961) and the Cultural Revolution (1966–1976), led to another economic retrogression and stagnation of urban development. In a nutshell, Hangzhou was a compact city in the pre-reform era, with a built-up area clustered around the main center and dispersed gradually to the north and east. Before the Reform and Opening Up in 1978, urban growth was mainly driven by the top-down force based on a planned economy, while after the reform, the dual forces of top-down government administration and bottom-up market economy jointly facilitated urbanization [57]. The Reform and Opening Up period has established the socialist market economic system and promoted economic dynamism and industrial development, bringing Hangzhou into a consecutive rapid urbanization period that has taken place since the 1980s. The following reforms of the land and housing systems have profoundly affected the urbanization process. In 1990, Hangzhou established a “dual-track land system” that enabled planned land allocation and free-market land leasing to operate simultaneously [58]. In 1997, Hangzhou employed a land reserve (or land-banking) system to monopolize land expropriation and land leasing. Subsequently, new regulations introduced in 2001 required all residential and commercial land to be leased by public tender, auction, or listing (guapai) [59]. The housing system reform implemented in 1998 replaced the original allocated public housing with market-oriented private housing, creating a prosperous housing market. The establishment of the open land and housing market became the main driver of urban sprawl. Local government typically tended to lease large-scale land in the suburb for industrial enterprises at a low price to attract investment and increase employment, thereby attracting real-estate developers to build residential properties for new residents [48]. The low-density industrial investment and large-scale suburban housing development caused rampant urban expansion in the 1990s and 2000s. Therefore, institutional-driven land development has played a salient role in the post-reform era, exerting a far-reaching impact on China’s urbanization.

4.2.2. Industrial Development and Population Movement

Industry-oriented suburbanization and consequent population migration are also crucial drivers of urban expansion. Before industrialization, Hangzhou was a famous city featured in its history, culture, and scenic tourism. In the pre-reform era, the primitive development of commerce and manufacturing promoted urban expansion, but on a limited magnitude. The household registration system launched in 1958 strictly controlled the movement of people, leading to low-intensity rural–urban movement and little leapfrogging growth [60]. Since the economic reform, Hangzhou has witnessed three phases of industrial transformation, all of which have evidently contributed to urbanization [52]. The first phase was driven by resource- and labor-intensive industries from 1978 to 1992, when many factories were still located near the urban core with high population density. The second phase was a capital- and technology-intensive period that was characterized by incipient industrial diffusion and suburbanization between 1992 and 2000. Hangzhou’s suburbanization started as a result of the government-sponsored relocation of factories to the urban periphery, leading to a large amount of agricultural land being converted for industrial or residential uses, as well as a massive migration of workers to the suburbs [61]. The land market induced factories to capture considerable compensation by releasing inner-city land for high-value uses (e.g., commercial and residential development) and acquiring large and low-cost land in the peri-urban area, leading to massive low-density leapfrogging growth and strong centrifugal forces of urban expansion [62]. The third phase since the 2000s is a rapid growth period led by capital-, technology-, and knowledge-intensive industries. The primary manifestation is the transformation from the tourism economy and light industry to the high-tech-focused industries, such as the digital economy, biomedicine, and advanced equipment, as well as the cultural and creative industry [63]. The pace of suburbanization has further accelerated under industrial upgrading, establishing more industrial parks and university towns in the urban periphery. Moreover, since the housing registration system has weakened since the 1990s, many migrant workers have flown into Hangzhou, searching for work, leading to significant population increases in the suburbs [64]. This also brought another distinctive feature of urbanization at that time, the semi-urbanized villages, which accommodated floating migrant populations and lacked systematic planning [48]. The resulting fragmented urban landscape was improved after the extensive urban renewal in the 2000s to 2010s. Thereafter, the compact and well-planned urban landscape gradually dominated the late period of urbanization.

4.2.3. Administrative Division Adjustment and New Development Zones

The administrative divisions of Hangzhou have undergone great transitions in the past century. At the beginning of the Republic of China, the former Qiantang and Renhe counties were merged into Hangxian county in 1912. The urban part of Hangxian and its neighboring areas were grouped into Hangzhou in 1927, recording the official establishment of Hangzhou City. When the People’s Republic of China was founded in 1949, Hangzhou had eight districts with an urban area of 283 km2. Since then, the administrative divisions have been adjusted many times, along with the continuous expansion of urban areas. Among these adjustments, the most influential was the annexation of several neighboring counties under the “city leading county” system [65]. In 1996, an area of 72 km2 in the original territory of Xiaoshan county was divided into a new Binjiang district. After that, the Xiaoshan and Yuhang counties were annexed into urban districts in 2001, followed by Fuyang and Lin’an counties in 2014 and 2017, respectively. The newly annexed districts created several urban growth hotspots and subcenters, facilitating the setting up of industrial zones and university campuses, as well as commercial and residential development. Moreover, the municipal government has set up four national development zones to accommodate new industrial clustering, including the Hangzhou High Technological Development Zone, Hangzhou Economic and Technological Development Zone, Yuhang Economic and Technological Development Zone, Xiaoshan Economic and Technological Development Zone, and Zhijiang Tourism and Holiday Development Zone. These administrative annexation and development zones have transformed Hangzhou from a single-centric structure to a polycentric pattern, leading new built-up areas to grow in the form of edge-expansion and infilling along the core transit corridor between subcenters [66].

4.3. Comparative Analysis and Policy Implications

As urban expansion is a prominent topic of global concern, many scholars have conducted research all over the world to explore the spatial pattern of urban expansion and examine relevant hypotheses. The discrepant and unique patterns of different cities can provide additional insights for urban expansion theories through a comparative analysis of city profiles and spatiotemporal scales. First, the urbanization pattern is closely related to the level of urban development. Most studies in developed regions (e.g., the USA [15], Switzerland [37], and Dubai [67]) confirmed the existence of the alternation of diffusion and coalescence. In general, large cities in developed regions have already completed the diffusion process and are currently in the stage of coalescence dominated by infilling and edge-expansion growth. However, many studies in developing regions (e.g., Thailand [68] and Ethiopia [69]) still documented notable diffusion patterns with eminent leapfrogging growth. Chakraborty et al. [70] concluded that most cities in the Global North experience inward expansion, while cities in the Global South experience comparatively outward expansion. This phenomenon has also been discovered in China, where large cities have entered the state of inward densification, while small- and medium-sized cities are still in the process of outward dispersion [33]. In our case, Hangzhou has entered the stage of coalescence, like other large cities in the world. Second, the diffusion–coalescence hypothesis seems to be effective during a relatively short duration but is too simplistic over a long period of time. In our study, Hangzhou exhibited multiple alternations between diffusion and coalescence during the past century. Our findings also echo those of other studies (e.g., Guangzhou [46] and Idaho [71]) reporting the coexistence or circulation of diffusion and coalescence. Liu et al.’s [29] long-term study of 16 world cities also demonstrated the coexistence of diffusion and coalescence phases, as well as three urban growth types. This phenomenon is closely related to cities’ unique physical and socioeconomic profiles, including topography, institutional background, and land-management policies. Third, urban expansion patterns vary widely across different intra-city spatial extents. Our study shows that the inner zone of Hangzhou entered the coalescence phase much earlier than the outer zone. From a city-wide perspective, the inward coalescence phase near the urban core and the outward diffusion phase at the urban periphery have coexisted for a long time. Nonetheless, during the alternation of urban growth types, leapfrogging prevailed in the early stage of urbanization and was centered in the urban periphery, while infilling predominated in the later period and concentrated near the urban core. These patterns have also been revealed in other multiscale analyzes around the world (e.g., Switzerland [37] and India [38]). Therefore, the two prevalent urban expansion hypotheses may not be fully applicable to all spatial extents within cities. In addition, some scholars have summarized and proposed more complex and diverse urban expansion models, such as the five urban expansion types introduced by Camagni et al. [72] and the four pathways of urban growth patterns proposed by Chakraborty et al. [56].
Through the analysis of urban expansion patterns, we can also gain some conducive implications for spatial-planning and land-management policies. Our study documents prominent leapfrogging growth in the urban fringe during the market-oriented urbanization period after the economic reform. A related study in Hangzhou by Yue et al. [48] revealed that leapfrogging growth contributes significantly to urban sprawl, which is characterized by low-density industrial development zones and semi-urbanized villages. By comparing metropolises in China and in the USA, He et al. [73] found that the outlying urban sprawl is more extensive in China than the USA, while the infilling compact growth is considerably more dominant in the USA than in China. Since infilling growth has been justified to be positively related to land-use efficiency [70], high-quality infilling growth should be promoted in large cities such as Hangzhou. Effective planning policies need to be raised to curb disordered and inefficient urban sprawl, such as planning controls and land-use regulations. Moreover, our findings on heterogeneous patterns within different intra-city extents suggest that differentiated planning strategies should be proposed to accommodate their unique development conditions. For example, detailed planning policies with efficient land-use schemes and reasonable construction plans will be beneficial to the development of suburbs, especially new development zones. Urban-renewal programs can promote the revitalization of urban cores and improve the life quality and well-being of local residents. Targeted planning strategies, rather than traditional one-size-fits-all policies, can help address the unique challenges in different urban subregions.

5. Conclusions

Based on a complied dataset of multisource remote sensing images and historical maps covering nine snapshots of the urban built-up area from 1914 to 2018, this study investigated the long-term spatiotemporal dynamics of urban expansion in Hangzhou and examined the validity of prevalent urban expansion hypotheses in different intra-city spatial extents based on a landscape metric analysis.
Hangzhou experienced a turbulent period of primitive urbanization in the pre-reform era and a consecutive period of market-oriented urbanization after the economic reform. The urban expansion process generally conformed with the diffusion–coalescence hypothesis. However, unlike other cases, our study demonstrates the existence of multiple alternations between diffusion and coalescence rather than a unimodal trajectory (i.e., from diffusion to coalescence). Besides, we discovered that the sequence, intensity, and duration of the diffusion–coalescence process varied widely across different intra-city spatial extents. The inner zone entered the coalescence phase much earlier than the outer zone. From a city-wide perspective, the inward coalescence phase near the urban core and the outward diffusion phase at the urban periphery have coexisted for a long time. Moreover, we documented a consistent predominance of edge-expansion with alternation between infilling and leapfrogging. During the alternation, leapfrogging prevailed in the early stage of urbanization and was centered in the urban periphery, while infilling predominated in the later period and concentrated near the urban core. Therefore, this study demonstrates that the simple diffusion–coalescence dichotomy and the sequential alternation of three growth types may not be universally applicable in long-term and multiscale contexts.
The urban expansion pattern is closely related to spatiotemporal scales and cities’ socioeconomic profiles. Hangzhou’s tortuous urbanization process is rooted in China’s unique social background and is significantly affected by political and economic changes. Wars, political movements, and the planned economic system hindered the pace of urbanization and led to stagnation, while the economic reform and the market-oriented land system triggered unprecedented urban expansion. The low-density industrial development zones and semi-urbanized villages caused severe urban sprawl in the urban fringe. We propose that effective planning policies need to be raised to curb disordered and inefficient urban sprawl. Our findings also suggest that differentiated planning strategies should be proposed to address unique challenges in different urban subregions. However, due to data limitations, we cannot obtain detailed land-use classifications and socioeconomic data; thus, there is a lack of in-depth quantitative studies on the drivers and impacts of urban expansion. More investigations of different cities around the world are needed to provide more diversified evidence for urban expansion models.

Author Contributions

Conceptualization, H.L. and J.F.; methodology, H.L. and R.W.; software, H.L.; validation, R.W., R.Y. and J.F.; formal analysis, H.L. and R.W.; investigation, H.L. and R.W.; resources, R.Y. and J.F.; data curation H.L.; writing—original draft preparation, R.W.; writing—review and editing, H.L., R.Y. and J.F.; visualization, H.L. and R.W.; supervision, J.F.; project administration, R.Y. and J.F.; funding acquisition, R.Y. and J.F. All authors have read and agreed to the published version of the manuscript.

Funding

This research was funded by the Zhejiang Cultural Research Project (No. 19WH50061ZD), the Postdoctoral Science Foundation at Zhejiang Gongshang University (No. 1020XJ2221003), and the Research Funding of School of Earth Sciences at Zhejiang University.

Data Availability Statement

The CORONA KH-4B satellite image was obtained from the United States Geological Survey (USGS) (http://www.usgs.gov/). The Landsat series satellite images (including Landsat 3 MSS, Landsat 5 TM, Landsat 7 TM, and Landsat 8 OLI) were downloaded from the Geospatial Data Cloud, Chinese Academy of Sciences (http://www.gscloud.cn/). The historical topographical maps were digitalized manually from Zhejiang Topographic Map in the Republic of China and Hangzhou Dutu Atlas (1931–1934) published by Zhejiang Guji Publishing House in 2013 and 2018, respectively.

Acknowledgments

We would like to express our earnest appreciation to the editors and reviewers for their professional comments and insightful suggestions.

Conflicts of Interest

The authors declare no conflict of interest.

References

  1. United Nations, Department of Economic and Social Affairs, Population Division. World Urbanization Prospects 2018: Highlights; United Nations: New York, NY, USA, 2019. [Google Scholar]
  2. Grimm, N.B.; Faeth, S.H.; Golubiewski, N.E.; Redman, C.L.; Wu, J.; Bai, X.; Briggs, J.M. Global Change and the Ecology of Cities. Science 2008, 319, 756–760. [Google Scholar] [CrossRef] [PubMed] [Green Version]
  3. Seto, K.C.; Sánchez-Rodríguez, R.; Fragkias, M. The New Geography of Contemporary Urbanization and the Environment. Annu. Rev. Environ. Resour. 2010, 35, 167–194. [Google Scholar] [CrossRef] [Green Version]
  4. Wu, J. Urban Ecology and Sustainability: The State-of-the-Science and Future Directions. Landsc. Urban Plan. 2014, 125, 209–221. [Google Scholar] [CrossRef]
  5. Seto, K.C.; Fragkias, M.; Güneralp, B.; Reilly, M.K. A Meta-Analysis of Global Urban Land Expansion. PLoS ONE 2011, 6, e23777. [Google Scholar] [CrossRef] [PubMed]
  6. Song, Y.; Chen, B.; Kwan, M.-P. How Does Urban Expansion Impact People’s Exposure to Green Environments? A Comparative Study of 290 Chinese Cities. J. Clean. Prod. 2020, 246, 119018. [Google Scholar] [CrossRef]
  7. Tu, Y.; Chen, B.; Yu, L.; Xin, Q.; Gong, P.; Xu, B. How Does Urban Expansion Interact with Cropland Loss? A Comparison of 14 Chinese Cities from 1980 to 2015. Landsc. Ecol. 2021, 36, 243–263. [Google Scholar] [CrossRef]
  8. Zhu, C.; Yang, L.; Xu, Q.; Fu, J.; Lin, Y.; Sun, L.; He, S.; Yuan, S. A Comparative Analysis of Farmland Occupation by Urban Sprawl and Rural Settlement Expansion in China. Land 2022, 11, 1738. [Google Scholar] [CrossRef]
  9. Kuang, W. 70 Years of Urban Expansion across China: Trajectory, Pattern, and National Policies. Sci. Bull. 2020, 65, 1970–1974. [Google Scholar] [CrossRef]
  10. Li, X.; Yeh, A.G.-O. Analyzing Spatial Restructuring of Land Use Patterns in a Fast Growing Region Using Remote Sensing and GIS. Landsc. Urban Plan. 2004, 69, 335–354. [Google Scholar] [CrossRef]
  11. Herold, M.; Scepan, J.; Clarke, K.C. The Use of Remote Sensing and Landscape Metrics to Describe Structures and Changes in Urban Land Uses. Environ. Plan. Econ. Space 2002, 34, 1443–1458. [Google Scholar] [CrossRef]
  12. Dietzel, C.; Herold, M.; Hemphill, J.J.; Clarke, K.C. Spatio-temporal Dynamics in California’s Central Valley: Empirical Links to Urban Theory. Int. J. Geogr. Inf. Sci. 2005, 19, 175–195. [Google Scholar] [CrossRef]
  13. Dietzel, C.; Oguz, H.; Hemphill, J.J.; Clarke, K.C.; Gazulis, N. Diffusion and Coalescence of the Houston Metropolitan Area: Evidence Supporting a New Urban Theory. Environ. Plan. B Plan. Des. 2005, 32, 231–246. [Google Scholar] [CrossRef] [Green Version]
  14. Schneider, A.; Woodcock, C.E. Compact, Dispersed, Fragmented, Extensive? A Comparison of Urban Growth in Twenty-Five Global Cities Using Remotely Sensed Data, Pattern Metrics and Census Information. Urban Stud. 2008, 45, 659–692. [Google Scholar] [CrossRef]
  15. Wu, J.; Jenerette, G.D.; Buyantuyev, A.; Redman, C.L. Quantifying Spatiotemporal Patterns of Urbanization: The Case of the Two Fastest Growing Metropolitan Regions in the United States. Ecol. Complex. 2011, 8, 1–8. [Google Scholar] [CrossRef]
  16. Jenerette, G.D.; Potere, D. Global Analysis and Simulation of Land-Use Change Associated with Urbanization. Landsc. Ecol. 2010, 25, 657–670. [Google Scholar] [CrossRef]
  17. Tian, G.; Jiang, J.; Yang, Z.; Zhang, Y. The Urban Growth, Size Distribution and Spatio-Temporal Dynamic Pattern of the Yangtze River Delta Megalopolitan Region, China. Ecol. Model. 2011, 222, 865–878. [Google Scholar] [CrossRef]
  18. Zhao, S.; Zhou, D.; Zhu, C.; Qu, W.; Zhao, J.; Sun, Y.; Huang, D.; Wu, W.; Liu, S. Rates and Patterns of Urban Expansion in China’s 32 Major Cities over the Past Three Decades. Landsc. Ecol. 2015, 30, 1541–1559. [Google Scholar] [CrossRef]
  19. Xu, C.; Liu, M.; Zhang, C.; An, S.; Yu, W.; Chen, J.M. The Spatiotemporal Dynamics of Rapid Urban Growth in the Nanjing Metropolitan Region of China. Landsc. Ecol. 2007, 22, 925–937. [Google Scholar] [CrossRef]
  20. Liu, X.; Li, X.; Chen, Y.; Tan, Z.; Li, S.; Ai, B. A New Landscape Index for Quantifying Urban Expansion Using Multi-Temporal Remotely Sensed Data. Landsc. Ecol. 2010, 25, 671–682. [Google Scholar] [CrossRef]
  21. Li, C.; Li, J.; Wu, J. Quantifying the Speed, Growth Modes, and Landscape Pattern Changes of Urbanization: A Hierarchical Patch Dynamics Approach. Landsc. Ecol. 2013, 28, 1875–1888. [Google Scholar] [CrossRef]
  22. Petit, C.C.; Lambin, E.F. Impact of Data Integration Technique on Historical Land-Use/Land-Cover Change: Comparing Historical Maps with Remote Sensing Data in the Belgian Ardennes. Landsc. Ecol. 2002, 17, 117–132. [Google Scholar] [CrossRef]
  23. Xiao, J.; Shen, Y.; Ge, J.; Tateishi, R.; Tang, C.; Liang, Y.; Huang, Z. Evaluating Urban Expansion and Land Use Change in Shijiazhuang, China, by Using GIS and Remote Sensing. Landsc. Urban Plan. 2006, 75, 69–80. [Google Scholar] [CrossRef]
  24. Skaloš, J.; Weber, M.; Lipský, Z.; Trpáková, I.; Šantrůčková, M.; Uhlířová, L.; Kukla, P. Using Old Military Survey Maps and Orthophotograph Maps to Analyse Long-Term Land Cover Changes–Case Study (Czech Republic). Appl. Geogr. 2011, 31, 426–438. [Google Scholar] [CrossRef]
  25. Dahal, K.R.; Benner, S.; Lindquist, E. Urban Hypotheses and Spatiotemporal Characterization of Urban Growth in the Treasure Valley of Idaho, USA. Appl. Geogr. 2017, 79, 11–25. [Google Scholar] [CrossRef]
  26. Kuang, W.; Yan, F. Urban Structural Evolution over a Century in Changchun City, Northeast China. J. Geogr. Sci. 2018, 28, 1877–1895. [Google Scholar]
  27. Batty, M. The Size, Scale, and Shape of Cities. Science 2008, 319, 769–771. [Google Scholar] [CrossRef] [Green Version]
  28. Wang, R.; Feng, Y.; Tong, X.; Zhao, J.; Zhai, S. Impacts of Spatial Scale on the Delineation of Spatiotemporal Urban Expansion. Ecol. Indic. 2021, 129, 107896. [Google Scholar] [CrossRef]
  29. Liu, Z.; He, C.; Wu, J. General Spatiotemporal Patterns of Urbanization: An Examination of 16 World Cities. Sustainability 2016, 8, 41. [Google Scholar] [CrossRef] [Green Version]
  30. Novotný, J.; Chakraborty, S.; Maity, I. Urban Expansion of the 43 Worlds’ Largest Megacities: A Search for Unified Macro-Patterns. Habitat Int. 2022, 129, 102676. [Google Scholar] [CrossRef]
  31. Liu, F.; Zhang, Z.; Shi, L.; Zhao, X.; Xu, J.; Yi, L.; Liu, B.; Wen, Q.; Hu, S.; Wang, X.; et al. Urban Expansion in China and Its Spatial-Temporal Differences over the Past Four Decades. J. Geogr. Sci. 2016, 26, 1477–1496. [Google Scholar] [CrossRef]
  32. Sun, Y.; Zhao, S. Spatiotemporal Dynamics of Urban Expansion in 13 Cities across the Jing-Jin-Ji Urban Agglomeration from 1978 to 2015. Ecol. Indic. 2018, 87, 302–313. [Google Scholar] [CrossRef]
  33. Fang, C.; Zhao, S. A Comparative Study of Spatiotemporal Patterns of Urban Expansion in Six Major Cities of the Yangtze River Delta from 1980 to 2015. Ecosyst. Health Sustain. 2018, 4, 95–114. [Google Scholar] [CrossRef] [Green Version]
  34. Zhang, B.; Shao, D.; Zhang, Z. Spatio-Temporal Evolution Dynamic, Effect and Governance Policy of Construction Land Use in Urban Agglomeration: Case Study of Yangtze River Delta, China. Sustainability 2022, 14, 6204. [Google Scholar] [CrossRef]
  35. Gong, J.; Hu, Z.; Chen, W.; Liu, Y.; Wang, J. Urban Expansion Dynamics and Modes in Metropolitan Guangzhou, China. Land Use Policy 2018, 72, 100–109. [Google Scholar] [CrossRef]
  36. Ouyang, D.; Zhu, X.; Liu, X.; He, R.; Wan, Q. Spatial Differentiation and Driving Factor Analysis of Urban Construction Land Change in County-Level City of Guangxi, China. Land 2021, 10, 691. [Google Scholar] [CrossRef]
  37. Bosch, M.; Jaligot, R.; Chenal, J. Spatiotemporal Patterns of Urbanization in Three Swiss Urban Agglomerations: Insights from Landscape Metrics, Growth Modes and Fractal Analysis. Landsc. Ecol. 2020, 35, 879–891. [Google Scholar] [CrossRef]
  38. Chakraborty, S.; Maity, I.; Patel, P.P.; Dadashpoor, H.; Pramanik, S.; Follmann, A.; Novotný, J.; Roy, U. Spatio-Temporal Patterns of Urbanization in the Kolkata Urban Agglomeration: A Dynamic Spatial Territory-Based Approach. Sustain. Cities Soc. 2021, 67, 102715. [Google Scholar] [CrossRef]
  39. Li, J.; Li, C.; Zhu, F.; Song, C.; Wu, J. Spatiotemporal Pattern of Urbanization in Shanghai, China between 1989 and 2005. Landsc. Ecol. 2013, 28, 1545–1565. [Google Scholar] [CrossRef]
  40. Seto, K.C.; Fragkias, M. Quantifying Spatiotemporal Patterns of Urban Land-Use Change in Four Cities of China with Time Series Landscape Metrics. Landsc. Ecol. 2005, 20, 871–888. [Google Scholar] [CrossRef]
  41. Benguigui, L.; Czamanski, D.; Marinov, M.; Portugali, Y. When and Where Is a City Fractal? Environ. Plan. B Plan. Des. 2000, 27, 507–519. [Google Scholar] [CrossRef] [Green Version]
  42. Batty, M.; Longley, P.A. Fractal Cities: A Geometry of Form and Function; Academic Press: London, UK, 1994. [Google Scholar]
  43. White, R.; Engelen, G. Cellular Automata and Fractal Urban Form: A Cellular Modelling Approach to the Evolution of Urban Land-Use Patterns. Environ. Plan. Econ. Space 1993, 25, 1175–1199. [Google Scholar] [CrossRef]
  44. Gu, C.; Wu, L.; Cook, I. Progress in Research on Chinese Urbanization. Front. Archit. Res. 2012, 1, 101–149. [Google Scholar] [CrossRef] [Green Version]
  45. Chen, M.; Liu, W.; Tao, X. Evolution and Assessment on China’s Urbanization 1960–2010: Under-Urbanization or over-Urbanization? Habitat Int. 2013, 38, 25–33. [Google Scholar] [CrossRef]
  46. Meng, L.; Sun, Y.; Zhao, S. Comparing the Spatial and Temporal Dynamics of Urban Expansion in Guangzhou and Shenzhen from 1975 to 2015: A Case Study of Pioneer Cities in China’s Rapid Urbanization. Land Use Policy 2020, 97, 104753. [Google Scholar] [CrossRef]
  47. Wu, W.; Zhao, S.; Zhu, C.; Jiang, J. A Comparative Study of Urban Expansion in Beijing, Tianjin and Shijiazhuang over the Past Three Decades. Landsc. Urban Plan. 2015, 134, 93–106. [Google Scholar] [CrossRef]
  48. Yue, W.; Liu, Y.; Fan, P. Measuring Urban Sprawl and Its Drivers in Large Chinese Cities: The Case of Hangzhou. Land Use Policy 2013, 31, 358–370. [Google Scholar] [CrossRef]
  49. Deng, J.S.; Wang, K.; Hong, Y.; Qi, J.G. Spatio-Temporal Dynamics and Evolution of Land Use Change and Landscape Pattern in Response to Rapid Urbanization. Landsc. Urban Plan. 2009, 92, 187–198. [Google Scholar] [CrossRef]
  50. Feng, J.; Chen, Y. Spatiotemporal Evolution of Urban Form and Land-Use Structure in Hangzhou, China: Evidence from Fractals. Environ. Plan. B Plan. Des. 2010, 37, 838–856. [Google Scholar] [CrossRef]
  51. Hangzhou Statistical Bureau. Hangzhou Statistical Yearbook 2019; China Statistics Press: Beijing, China, 2019.
  52. Qian, Z. Hangzhou. Cities 2015, 48, 42–54. [Google Scholar] [CrossRef]
  53. McGarigal, K.; Marks, B.J. FRAGSTATS: Spatial Pattern Analysis Program for Quantifying Landscape Structure; U.S. Department of Agriculture, Forest Service, Pacific Northwest Research Station: Portland, OR, USA, 1995.
  54. McGarigal, K. FRAGSTATS Help; University of Massachusetts: Amherst, MA, USA, 2015. [Google Scholar]
  55. Zhejiang History Research Center of the Republic of China; Hangzhou Literature and History Research Association. Hangzhou Historical Materials of the Republic of China; National Library of China Publishing House: Beijing, China, 2011. [Google Scholar]
  56. Chakraborty, S.; Dadashpoor, H.; Novotný, J.; Maity, I.; Follmann, A.; Patel, P.P.; Roy, U.; Pramanik, S. In Pursuit of Sustainability–Spatio-Temporal Pathways of Urban Growth Patterns in the World’s Largest Megacities. Cities 2022, 131, 103919. [Google Scholar] [CrossRef]
  57. Feng, J.; Chen, Y. Modeling Urban Growth and Socio-Spatial Dynamics of Hangzhou, China: 1964–2010. Sustainability 2021, 13, 463. [Google Scholar] [CrossRef]
  58. Zhang, X.Q. Urban Land Reform in China. Land Use Policy 1997, 14, 187–199. [Google Scholar] [CrossRef]
  59. Qian, Z. Empirical Evidence from Hangzhou’s Urban Land Reform: Evolution, Structure, Constraints and Prospects. Habitat Int. 2008, 32, 494–511. [Google Scholar] [CrossRef]
  60. Wei, Y.D.; Li, W. Reforms, Globalization, and Urban Growth in China: The Case of Hangzhou. Eurasian Geogr. Econ. 2002, 43, 459–475. [Google Scholar] [CrossRef]
  61. Liu, Y.; Yue, W.; Fan, P.; Song, Y. Suburban Residential Development in the Era of Market-Oriented Land Reform: The Case of Hangzhou, China. Land Use Policy 2015, 42, 233–243. [Google Scholar] [CrossRef]
  62. Liu, Y.; Yue, W.; Fan, P. Spatial Determinants of Urban Land Conversion in Large Chinese Cities: A Case of Hangzhou. Environ. Plan. B Plan. Des. 2011, 38, 706–725. [Google Scholar] [CrossRef]
  63. Zhu, W.; Chen, J. The Spatial Analysis of Digital Economy and Urban Development: A Case Study in Hangzhou, China. Cities 2022, 123, 103563. [Google Scholar] [CrossRef]
  64. Feng, J.; Zhou, Y. Suburbanization and the Changes of Urban Internal Spatial Structure in Hangzhou, China. Urban Geogr. 2005, 26, 107–136. [Google Scholar] [CrossRef]
  65. Zhang, J.; Wu, F. China’s Changing Economic Governance: Administrative Annexation and the Reorganization of Local Governments in the Yangtze River Delta. Reg. Stud. 2006, 40, 3–21. [Google Scholar] [CrossRef]
  66. Yue, W.; Liu, Y.; Fan, P. Polycentric Urban Development: The Case of Hangzhou. Environ. Plan. Econ. Space 2010, 42, 563–577. [Google Scholar] [CrossRef]
  67. Nassar, A.K.; Alan Blackburn, G.; Duncan Whyatt, J. Developing the Desert: The Pace and Process of Urban Growth in Dubai. Comput. Environ. Urban Syst. 2014, 45, 50–62. [Google Scholar] [CrossRef]
  68. Estoque, R.C.; Murayama, Y. Intensity and Spatial Pattern of Urban Land Changes in the Megacities of Southeast Asia. Land Use Policy 2015, 48, 213–222. [Google Scholar] [CrossRef]
  69. Terfa, B.K.; Chen, N.; Liu, D.; Zhang, X.; Niyogi, D. Urban Expansion in Ethiopia from 1987 to 2017: Characteristics, Spatial Patterns, and Driving Forces. Sustainability 2019, 11, 2973. [Google Scholar] [CrossRef] [Green Version]
  70. Chakraborty, S.; Maity, I.; Dadashpoor, H.; Novotnẏ, J.; Banerji, S. Building in or out? Examining Urban Expansion Patterns and Land Use Efficiency across the Global Sample of 466 Cities with Million+ Inhabitants. Habitat Int. 2022, 120, 102503. [Google Scholar] [CrossRef]
  71. Dahal, K.R.; Benner, S.; Lindquist, E. Analyzing Spatiotemporal Patterns of Urbanization in Treasure Valley, Idaho, USA. Appl. Spat. Anal. Policy 2018, 11, 205–226. [Google Scholar] [CrossRef]
  72. Camagni, R.; Gibelli, M.C.; Rigamonti, P. Urban Mobility and Urban Form: The Social and Environmental Costs of Different Patterns of Urban Expansion. Ecol. Econ. 2002, 40, 199–216. [Google Scholar] [CrossRef]
  73. He, Q.; Zeng, C.; Xie, P.; Tan, S.; Wu, J. Comparison of Urban Growth Patterns and Changes between Three Urban Agglomerations in China and Three Metropolises in the USA from 1995 to 2015. Sustain. Cities Soc. 2019, 50, 101649. [Google Scholar] [CrossRef]
Figure 1. Study area. (a) The location of Zhejiang Province in China. (b) The location of Hangzhou in Zhejiang Province. (c) The location of study area in Hangzhou.
Land 12 00144 g001
Figure 2. Urban built-up area in Hangzhou from 1914 to 2018.
Land 12 00144 g002
Figure 3. Research framework and steps.
Land 12 00144 g003
Figure 4. The changing trends of landscape metrics of urban built-up area in Hangzhou from 1914 to 2018: (a) percentage of landscape (PLAND); (b) patch density (PD); (c) mean patch size (MPS); (d) patch size standard deviation (PSSD); (e) edge density (ED); (f) landscape shape index (LSI); (g) area-weighted mean fractal dimension (AWMFD); (h) mean Euclidean nearest neighbor distance (ENN).
Land 12 00144 g004aLand 12 00144 g004b
Figure 5. The relative dominance of urban growth types (infilling, edge-expansion, and leapfrogging) in Hangzhou from 1914 to 2018.
Land 12 00144 g005aLand 12 00144 g005b
Figure 6. The spatial distribution of urban growth types (infilling, edge-expansion, and leapfrogging) in Hangzhou from 1914 to 2018. The black circles divide the entire urban area into inner and outer zones according to the area–radius relationship shown in Table 4.
Land 12 00144 g006
Table 1. Detailed parameters of data sources and classification accuracy of remote sensing images.
TimeData TypeData SourceSpatial ResolutionRMSEKappa
1914Topographic MapZhejiang Topographic Map
in the Republic of China *
1:50,000--
1931–1934Topographic MapHangzhou Dutu Atlas
(1931–1934) *
1:50,000--
11 February 1969CORONA KH-4BUnited States Geological
Survey (USGS)
1.83 m0.890.83
5 July 1978Landsat 3 MSSGeospatial Data Cloud,
Chinese Academy of Sciences
(CAS)
78 m0.920.86
11 January 1985Landsat 5 TM30 m0.940.90
4 February 1991Landsat 5 TM30 m0.960.94
4 May 2000Landsat 7 TM15 m0.920.88
21 September 2010Landsat 7 TM15 m0.980.97
2 May 2018Landsat 8 OLI15 m0.860.75
* Zhejiang Topographic Map in the Republic of China and Hangzhou Dutu Atlas (1931–1934) were compiled by Hangzhou Archives and published by Zhejiang Guji Publishing House in 2013 and 2018, respectively.
Table 2. Selected landscape metrics used in this study.
AcronymName of Landscape MetricsDescriptionUnits
Area metrics
PLANDPercentage of landscapeThe percentage of the landscape comprising the corresponding class type%
PDPatch densityThe number of patches of the corresponding class type per unit arean/100 ha
MPSMean patch sizeAverage patch size for the corresponding class typeha
PSSDPatch size standard deviationThe standard deviation of area for the corresponding class type
Shape metrics
EDEdge densityThe edge length of the corresponding class type per unit aream/ha
LSILandscape shape indexThe degree of deviation of the landscape from a single square patch; a measurement of irregularity for the corresponding class type
AWMFDArea-weighted mean fractal dimensionMean patch fractal dimension weighted by relative patch area; a measurement of complexity for the corresponding class type
Spatial distribution metrics
ENNMean Euclidean nearest neighbor distanceMean Euclidean shortest edge-to-edge distance from a patch to the nearest patchm
The corresponding class type refers to the urban built-up area in this study. Detailed descriptions of landscape metrics can be found in relevant documents of FRAGSTATS [54].
Table 3. Annual increase ( A I , km2) and Annual growth rate ( A G R , %) of urban land of Hangzhou across 9 periods, from 1914 to 2018.
PeriodsUrban Built-Up Area (km2)
A I   ( km 2 )
A G R   ( % )
191417.58--
193434.780.863.47
1969111.152.183.38
1978113.350.240.22
1985133.22.842.34
1991166.075.473.74
2000208.144.672.54
2010415.8520.777.17
2018518.4012.822.79
Table 4. Fitted formulas for the inner and outer zones and breakpoint radius separating the two scaling extents.
YearInner ZoneOuter ZoneBreakpoint Radius
(km)
FormulaR2FormulaR2
1914 Y = 0.618 X 2.031 0.9988 Y = 3.136 X 0.557 0.98983
1934 Y = 1.421 X 1.771 0.9977 Y = 8.757 X 0.567 0.99725
1969 Y = 2.157 X 1.621 0.9964 Y = 7.933 X 0.851 0.99656
1978 Y = 2.630 X 1.686 0.9964 Y = 24.669 X 0.452 0.96896
1985 Y = 2.851 X 1.747
Y = 8.233 X 1.076
0.9961
0.9984
Y = 44.469 X 0.331 0.92958
1991 Y = 2.862 X 1.814
Y = 11.055 X 1.021
0.9960
0.9982
Y = 43.426 X 0.407 0.97228
2000 Y = 2.434 X 1.814 0.9971 Y = 40.485 X 0.495 0.98229.5
2010 Y = 1.810 X 1.925 0.9962 Y = 22.860 X 0.889 0.997214
2018 Y = 3.095 X 1.774 0.9962 Y = 26.748 X 0.903 0.996515
Disclaimer/Publisher’s Note: The statements, opinions and data contained in all publications are solely those of the individual author(s) and contributor(s) and not of MDPI and/or the editor(s). MDPI and/or the editor(s) disclaim responsibility for any injury to people or property resulting from any ideas, methods, instructions or products referred to in the content.

