3.1.1. Time Dimension Analysis
Based on the principal component analysis method and using SPSS 22.0, this paper first standardized the raw data of various indicators of water ecological civilization in Jiangxi Province, eliminating the influence of different dimensions on the evaluation results; secondly, the correlation matrix eigenvalue, variance contribution rate, and cumulative variance contribution rate were calculated, as shown in
Table 3. We can see that the eigenvalues of the first four principal components are 8.888, 6.369, 2.289, and 1.925, which are all greater than 1, and the cumulative variance contribution rate is 92.715%, indicating that the information represented by the four principal components can better reflect the water ecological civilization construction level of Jiangxi Province from 2011 to 2020, so the first four principal components are selected to replace the 21 indicators in
Table 2.
In order to further analyze the correlation between each indicator and each principal component, and obtain the principal component score, we need to use the principal component factor loading. The principal component factor loading matrix can be obtained by SPSS 22.0, as shown in
Table 4.
From
Table 4, we can see that the first principal component Z1 has a larger load on indicators such as the total water consumption, ecological environment water consumption ratio, groundwater exploitation coefficient, ammonia nitrogen emission of urban domestic sewage, chemical oxygen demand discharge of urban domestic sewage, number of wastewater treatment facilities, the water consumption per 10,000 USD of added value of manufacturing, the water consumption per 10,000 USD of GDP, sewage treatment rate, the density of drainage pipes, water penetration rate, and the per capita park green space area. The above indicators mainly reflect the development level of water resources, sewage discharge, water use efficiency, and water conservancy project construction. It can be seen from
Table 3 that the variance contribution rate of the first principal component Z1 is 42.322%, indicating that the development level of water resources, sewage discharge, water use efficiency, and water conservancy project construction have a huge impact on the water ecological civilization score in Jiangxi Province, and are important indicators that affect Jiangxi Province’s water ecological civilization.
The second principal component Z2 has a larger load on indicators, such as annual precipitation, surface water resources, groundwater resources, the average water consumption per mu of farmland irrigation, the utilization ratio of water resources, and per capita water consumption. The above indicators mainly reflect the natural endowment of water resources and the utilization rate of water resources. The variance contribution rate of the second principal component is 30.328%, which indicates that the natural endowment of water resources and the utilization efficiency of water resources have a great impact on the water ecological civilization score in Jiangxi Province and are the basic indicators affecting the water ecological civilization in Jiangxi Province.
The third principal component Z3 and the fourth principal component Z4 have higher loads on proportion of investment in water-related affairs in general budget revenue and wastewater treatment facility treatment capacity, respectively. The former is a prerequisite for ensuring the continuous advancement of the construction of water ecological civilization, and it is also an important measure to improve the level of water ecological civilization; the latter is the key to ensuring the reuse of water resources.
According to the results of principal component analysis and the data in
Table 3 and
Table 4, the proportion of the variance contribution rate of each principal component to the total variance contribution rate is used as the weight to calculate the comprehensive score of Jiangxi Province’s water ecological civilization. The calculation formula is as follows:
where the Z value is the comprehensive score of water ecological civilization in Jiangxi Province. The higher the Z value, the higher the level of water ecological civilization and vice versa. The results are shown in
Table 5 and
Figure 2.
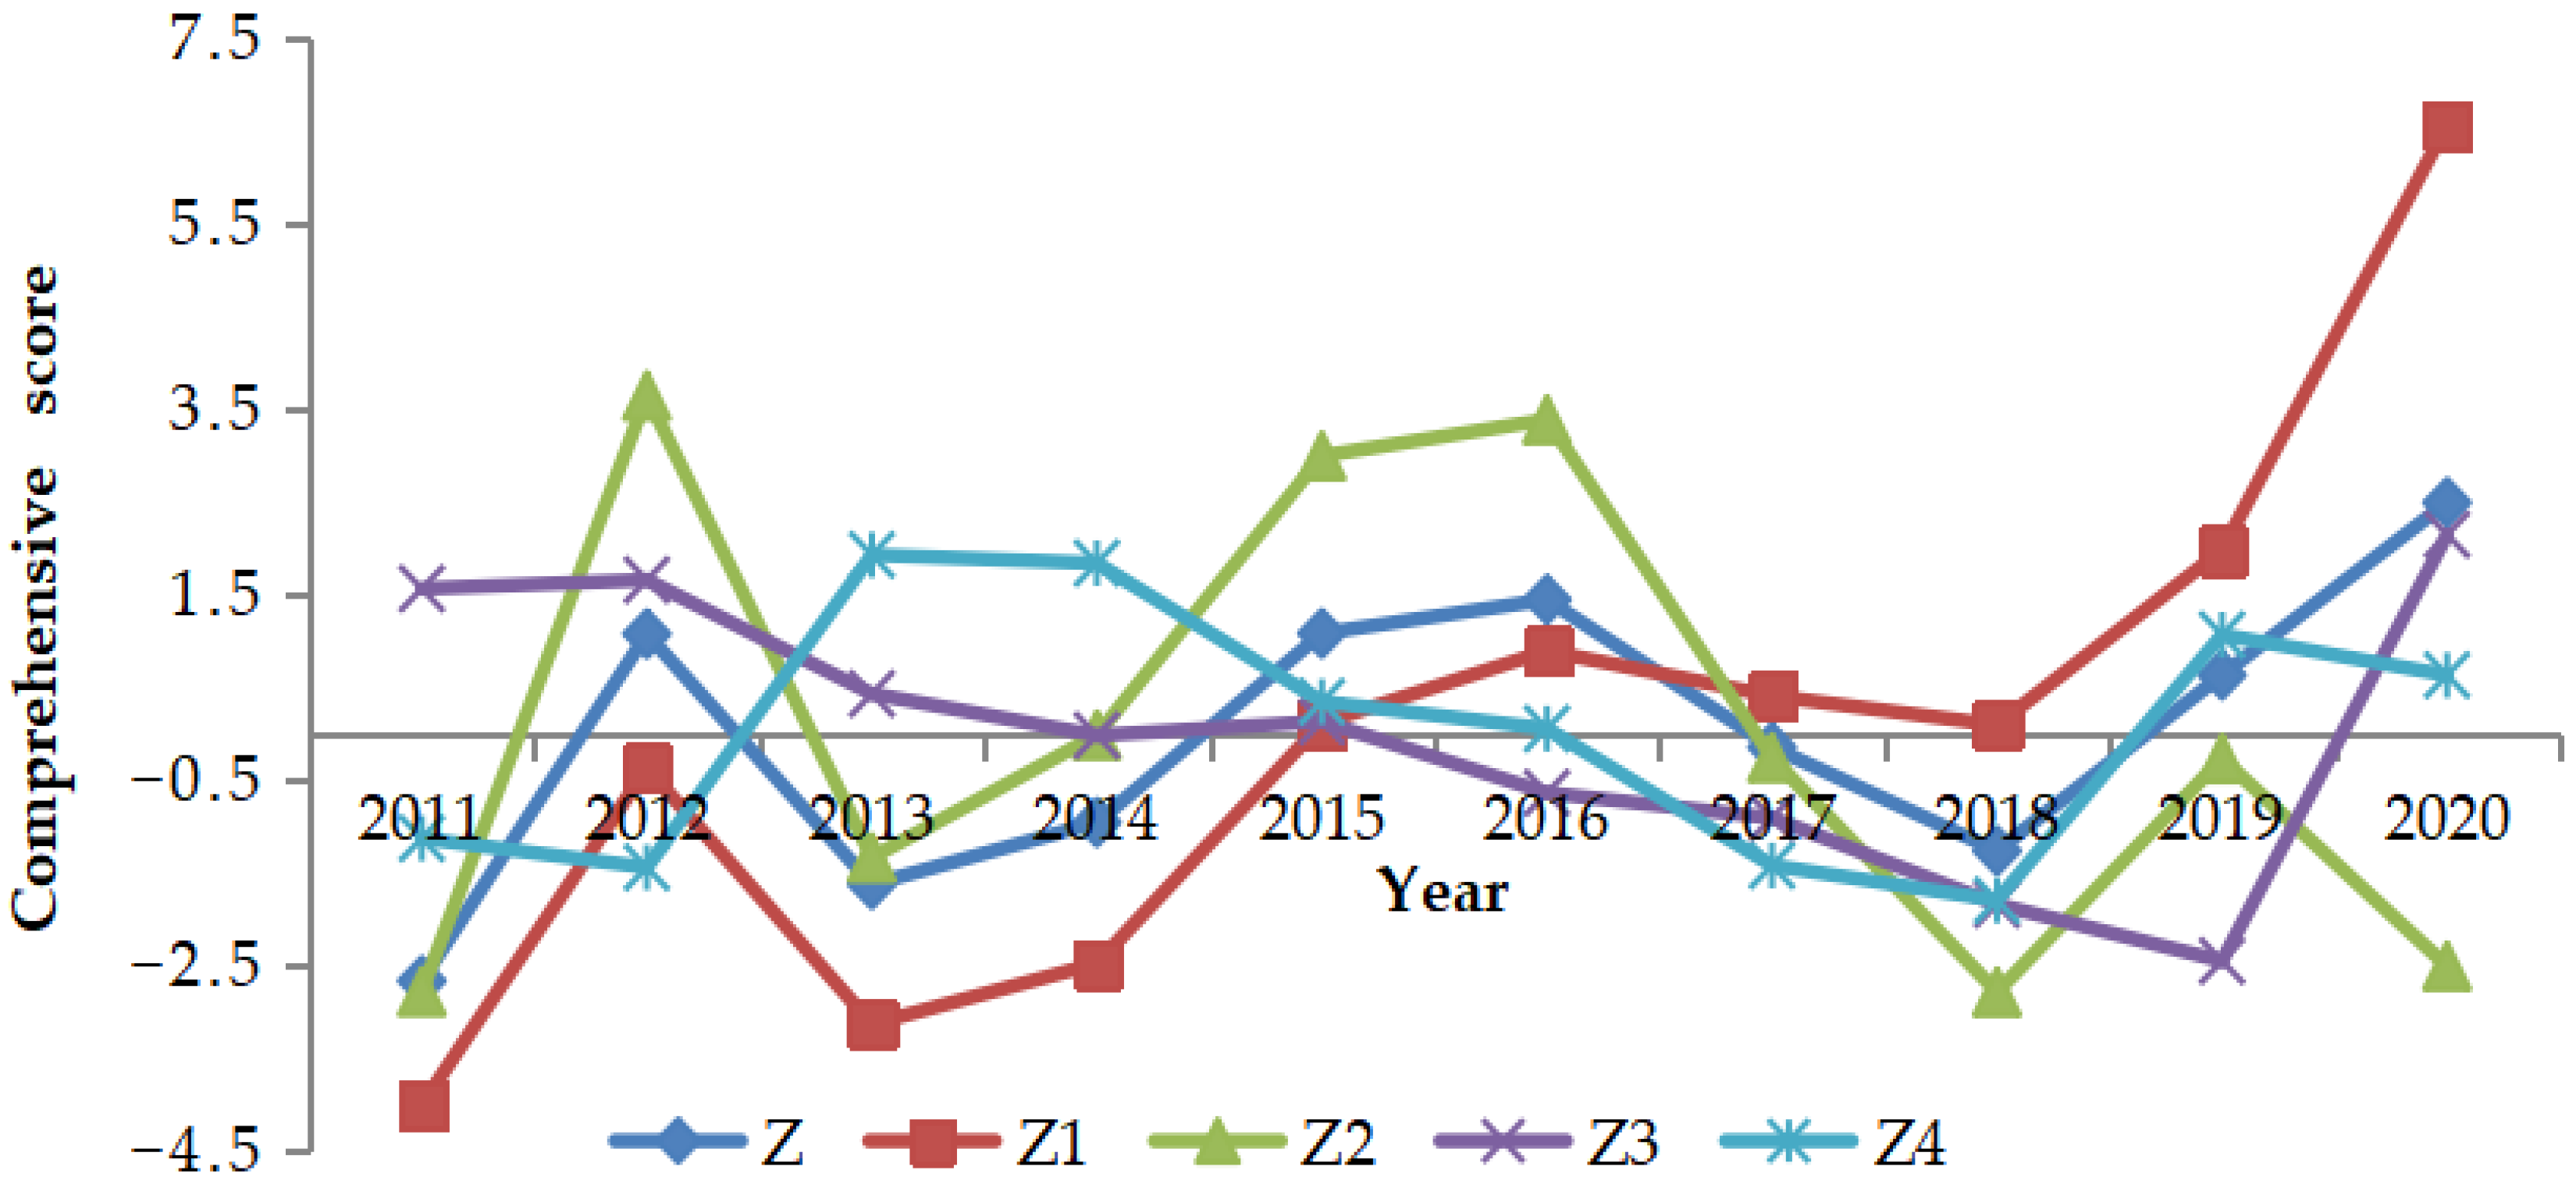
Firstly, from
Table 5 and
Figure 2, we can see that the evaluation scores of water ecological civilization in Jiangxi Province show a fluctuating upward trend, in which the score of water ecological civilization first increased, then decreased, and then increased from 2013 to 2020. The reason is that the Ministry of Water Resources started the pilot construction of water ecological civilization nationwide in 2013, and the main work includes implementing the strictest water resource management system, optimizing water resource allocation, strengthening water conservation management, strengthening water resource protection, promoting the protection and restoration of water ecosystems, strengthening ecological protection in water conservancy construction, improving guarantee and support capacity, and widely carrying out publicity and education. At the same time, in order to actively promote the “three red lines” of the strictest water resources management regulations, the Jiangxi Provincial Department of Water Resources has fully implemented the “River Chief System”, revised the “Water Resources Regulations of Jiangxi Province”, “Water Quotas for Main Products of Industrial Enterprises in Jiangxi Province”, “Jiangxi Province Domestic Water Quota”, and other documents, thus standardizing the utilization and development of water resources, so that the score of water ecological civilization rises first in this stage. However, as the marginal effects of the above-mentioned policies and documents decreased, the score of water ecological civilization declined. In 2018, due to the implementation of environmental protection policies and regulations, such as the Environmental Protection Tax Law, the Reform Plan for Compensation for Ecological Environmental Damage, and the newly revised Water Pollution Prevention and Control Law, the score of water ecological civilization rose again.
Second, from
Table 5 and
Figure 2, we can see that the positive and negative directions of the total score Z and the first principal component score Z1 are basically the same, because the first principal component accounts for a relatively large proportion. It reflects the impact of the development level of water resources, sewage discharge, water use efficiency, and water conservancy project construction on water ecological civilization. The reason for the gradual increase of the first principal component score Z1 is that the government attaches great importance to the construction of water ecological civilization; increases investment in water conservancy projects in the province; uses various media to promote water-saving culture, cultivate public awareness of water saving, and lay a good foundation for building a water-saving society; speeds up the laying of drainage pipes and the construction of sewage treatment plants; and improves the treatment rate of domestic sewage. Enterprises have improved the industrial reuse water rate by optimizing industrial structure, fulfilled their corporate social responsibility, and actively undertaken the treatment of industrial wastewater.
Third, from
Table 5 and
Figure 2, we can see that only in 2012, 2015, and 2016, the second principal component score Z2 was higher than the average level, because the second principal component reflects the impact of natural endowment of water resources and utilization rate of water resources on water ecological civilization, the surface water resources and groundwater resources in the natural endowment of water resources provide an important guarantee for economic and social development, and the abundant water resources formed by them have improved the score of water ecological civilization to a certain extent. The annual precipitation in 2012, 2015, and 2016 were 3614.53 × 108 m
3, 3464.76 × 108 m
3, and 3333.48 × 108 m
3, respectively, which were higher than the average level of 2902.07 × 108 m
3. Since 2016, the second principal component score Z2 has dropped sharply and is all negative. The reason is that the annual precipitation has decreased after 2016, and the average water consumption per mu of farmland irrigation, the utilization ratio of water resources, and per capita water consumption have all increased, which together restrict the score of the second principal component.
Fourth, from
Table 5 and
Figure 2, we can see that the third principal component score Z3 showed a downward trend as a whole during the pilot period of water ecological civilization construction from 2013 to 2019, but after 2019 it began to rise linearly to a certain extent, which reflects that under the background of water ecological civilization construction, Jiangxi Province’s water ecological civilization construction has achieved remarkable results.
Finally, from
Table 5 and
Figure 2, we can also see that the fourth principal component score Z4 showed a gradual downward trend from 2013 to 2018, because with the advancement of industrialization, the increase in wastewater discharge far exceeded the treatment capacity of wastewater treatment facilities; while the fourth principal component scores Z4 in 2019 and 2020 were positive, because the number of wastewater treatment facilities increased from 3252 in 2018 to 4707 in 2020, which greatly improved the efficiency of wastewater treatment, thereby improving the score.
3.1.2. Spatial Dimension Analysis
In order to have a more comprehensive understanding of the water ecological civilization in Jiangxi Province, farmland effective irrigation coefficient is added to the water economic system; the indicator is added to make the number of indicators of the water ecological system and the water economic system the same, so that the impact of the water ecological system and the water economic system on the water ecological civilization can be compared more reasonably (considering the availability of data, the farmland effective irrigation coefficient was not included in the water economic system when analyzing the situation of water ecological civilization in Jiangxi Province from 2011 to 2020). In the water social system, forest coverage rate and the number of national-level water conservancy scenic spots were added (the two indicators have not changed much in a short period of time and the availability of data is considered; therefore, they were not included in the water social system when analyzing the situation of water ecological civilization in Jiangxi Province from 2011 to 2020). We used the principal component analysis method to calculate the water ecological civilization of 11 prefecture-level cities in Jiangxi Province in 2020. The results are shown in
Table 6. We can see that Ganzhou has the highest comprehensive score of water ecological civilization among 11 prefecture-level cities in Jiangxi Province in 2020, with a score of 1.7298, and Yingtan has the lowest score, with a score of −2.0697. The gap is significant, indicating that the development of water ecological civilization is not balanced among the various cities in Jiangxi Province.
First, from
Table 6, we can see that Ganzhou ranks first, Shangrao second, and Yichun third in the score of water ecological system, but there is little difference between Shangrao and Yichun. In terms of the natural endowment of water resources, the annual precipitation in Ganzhou and Shangrao is higher than that in Yichun. The reason is that the annual precipitation in Ganzhou and Shangrao is relatively abundant, which provides innate conditions for the surface water resources and groundwater resources of the two cities. Therefore, the natural endowment of water resources in the two cities is better than that in Yichun; in terms of the development of water resources, Ganzhou and Shangrao have lower total water consumption than Yichun, but higher water consumption in the ecological environment than Yichun. The reason is that Ganzhou and Shangrao pay more attention to ecological environmental protection, which is similar to Ganzhou and Shangrao being rated as national forest cities. This is in line with Ganzhou and Shangrao being rated as national forest cities, so Ganzhou and Shangrao have better water resources development than Yichun, but in terms of sewage treatment capacity, Yichun is not only lower than Shangrao in terms of ammonia nitrogen emission of urban domestic sewage and chemical oxygen demand of urban domestic sewage, but also higher than Shangrao in terms of the number of wastewater treatment facilities and the treatment capacity of wastewater treatment facilities; this is the reason why there is little difference between Shangrao and Yichun.
Secondly, from
Table 6, we can see that Jiujiang ranks first, Ji’an second, and Fuzhou third in the score of water economy system. In terms of water resource utilization efficiency, Jiujiang’s average water consumption per mu for farmland irrigation, utilization rate of water resources, water consumption per 10,000 USD of added value of manufacturing, water consumption per 10,000 USD of GDP and per capita water consumption are all lower than the provincial average level. Jiujiang’s farmland effective irrigation coefficient, sewage treatment rate, density of drainage pipeline, and water penetration rate are all higher than the provincial average level, especially the average water consumption per mu of farmland irrigation, the farmland effective irrigation coefficient, and the utilization rate of water resources are all the best in the province. These indicators together make Jiujiang ranked first in the water economic system; Nanchang’s water consumption per 10,000 USD GDP is 339.29 m
3/10
4 $, which is the best in the province. However, the average water consumption per mu of farmland irrigation and the utilization rate of water resources are higher than the average level of the province. Nanchang’s utilization rate of water resources is the highest in the province, at 31.99%, which is much higher than the province’s average level of 15.96%. These indicators together have lowered Nanchang’s ranking in the water economy system. In terms of water management, Yingtan and Jingdezhen ranked as the last two, which were lower than the provincial average in the three indicators of proportion of investment in water-related affairs in general budget revenue, sewage treatment rate, and density of drainage pipe, resulting in the lower ranking of the two cities.
Third, from
Table 6, we can see that Jingdezhen ranks first, Ganzhou second, and Shangrao third in the score of water social system, but the gap is not large. Jingdezhen has three national-level water conservancy scenic spots, which is lower than Ganzhou’s six national-level water conservancy scenic spots, but its per capita park green space area and the green coverage rate of built-up areas are higher than Ganzhou. Shangrao has eight national-level water conservancy scenic spots and is the city with the largest number of national-level water conservancy scenic spots in Jiangxi Province. However, it’s per capita park green space area is lower than that of Jingdezhen, and it’s the green coverage rate of built-up areas and forest coverage rate are lower than those of Jingdezhen and Ganzhou, thus lowering the ranking. As the most economically developed city in Jiangxi Province, Nanchang has a score of −2.4479 in the water social system, ranking at the bottom. All four indicators in its water social system are lower than the provincial average.
Finally, from
Table 6, it can be found that the comprehensive score ranking of water ecological civilization is basically the same as the score ranking of water ecological system, indicating that water ecology is the key to affecting water ecological civilization. Cities with richer natural endowments of water resources also rank high in the score of water ecological system, which indirectly indicates that there is a certain correlation between water ecological civilization and natural endowments of water resources. As for the top cities in the comprehensive score of water ecological civilization, the ranking of the water economy system score is opposite to that. The reason may be that these cities have caused certain damage to the ecological environment while improving water use efficiency and increasing investment in water conservancy projects, which affects the score of the water ecological system and indirectly affects the comprehensive score of water ecological civilization.
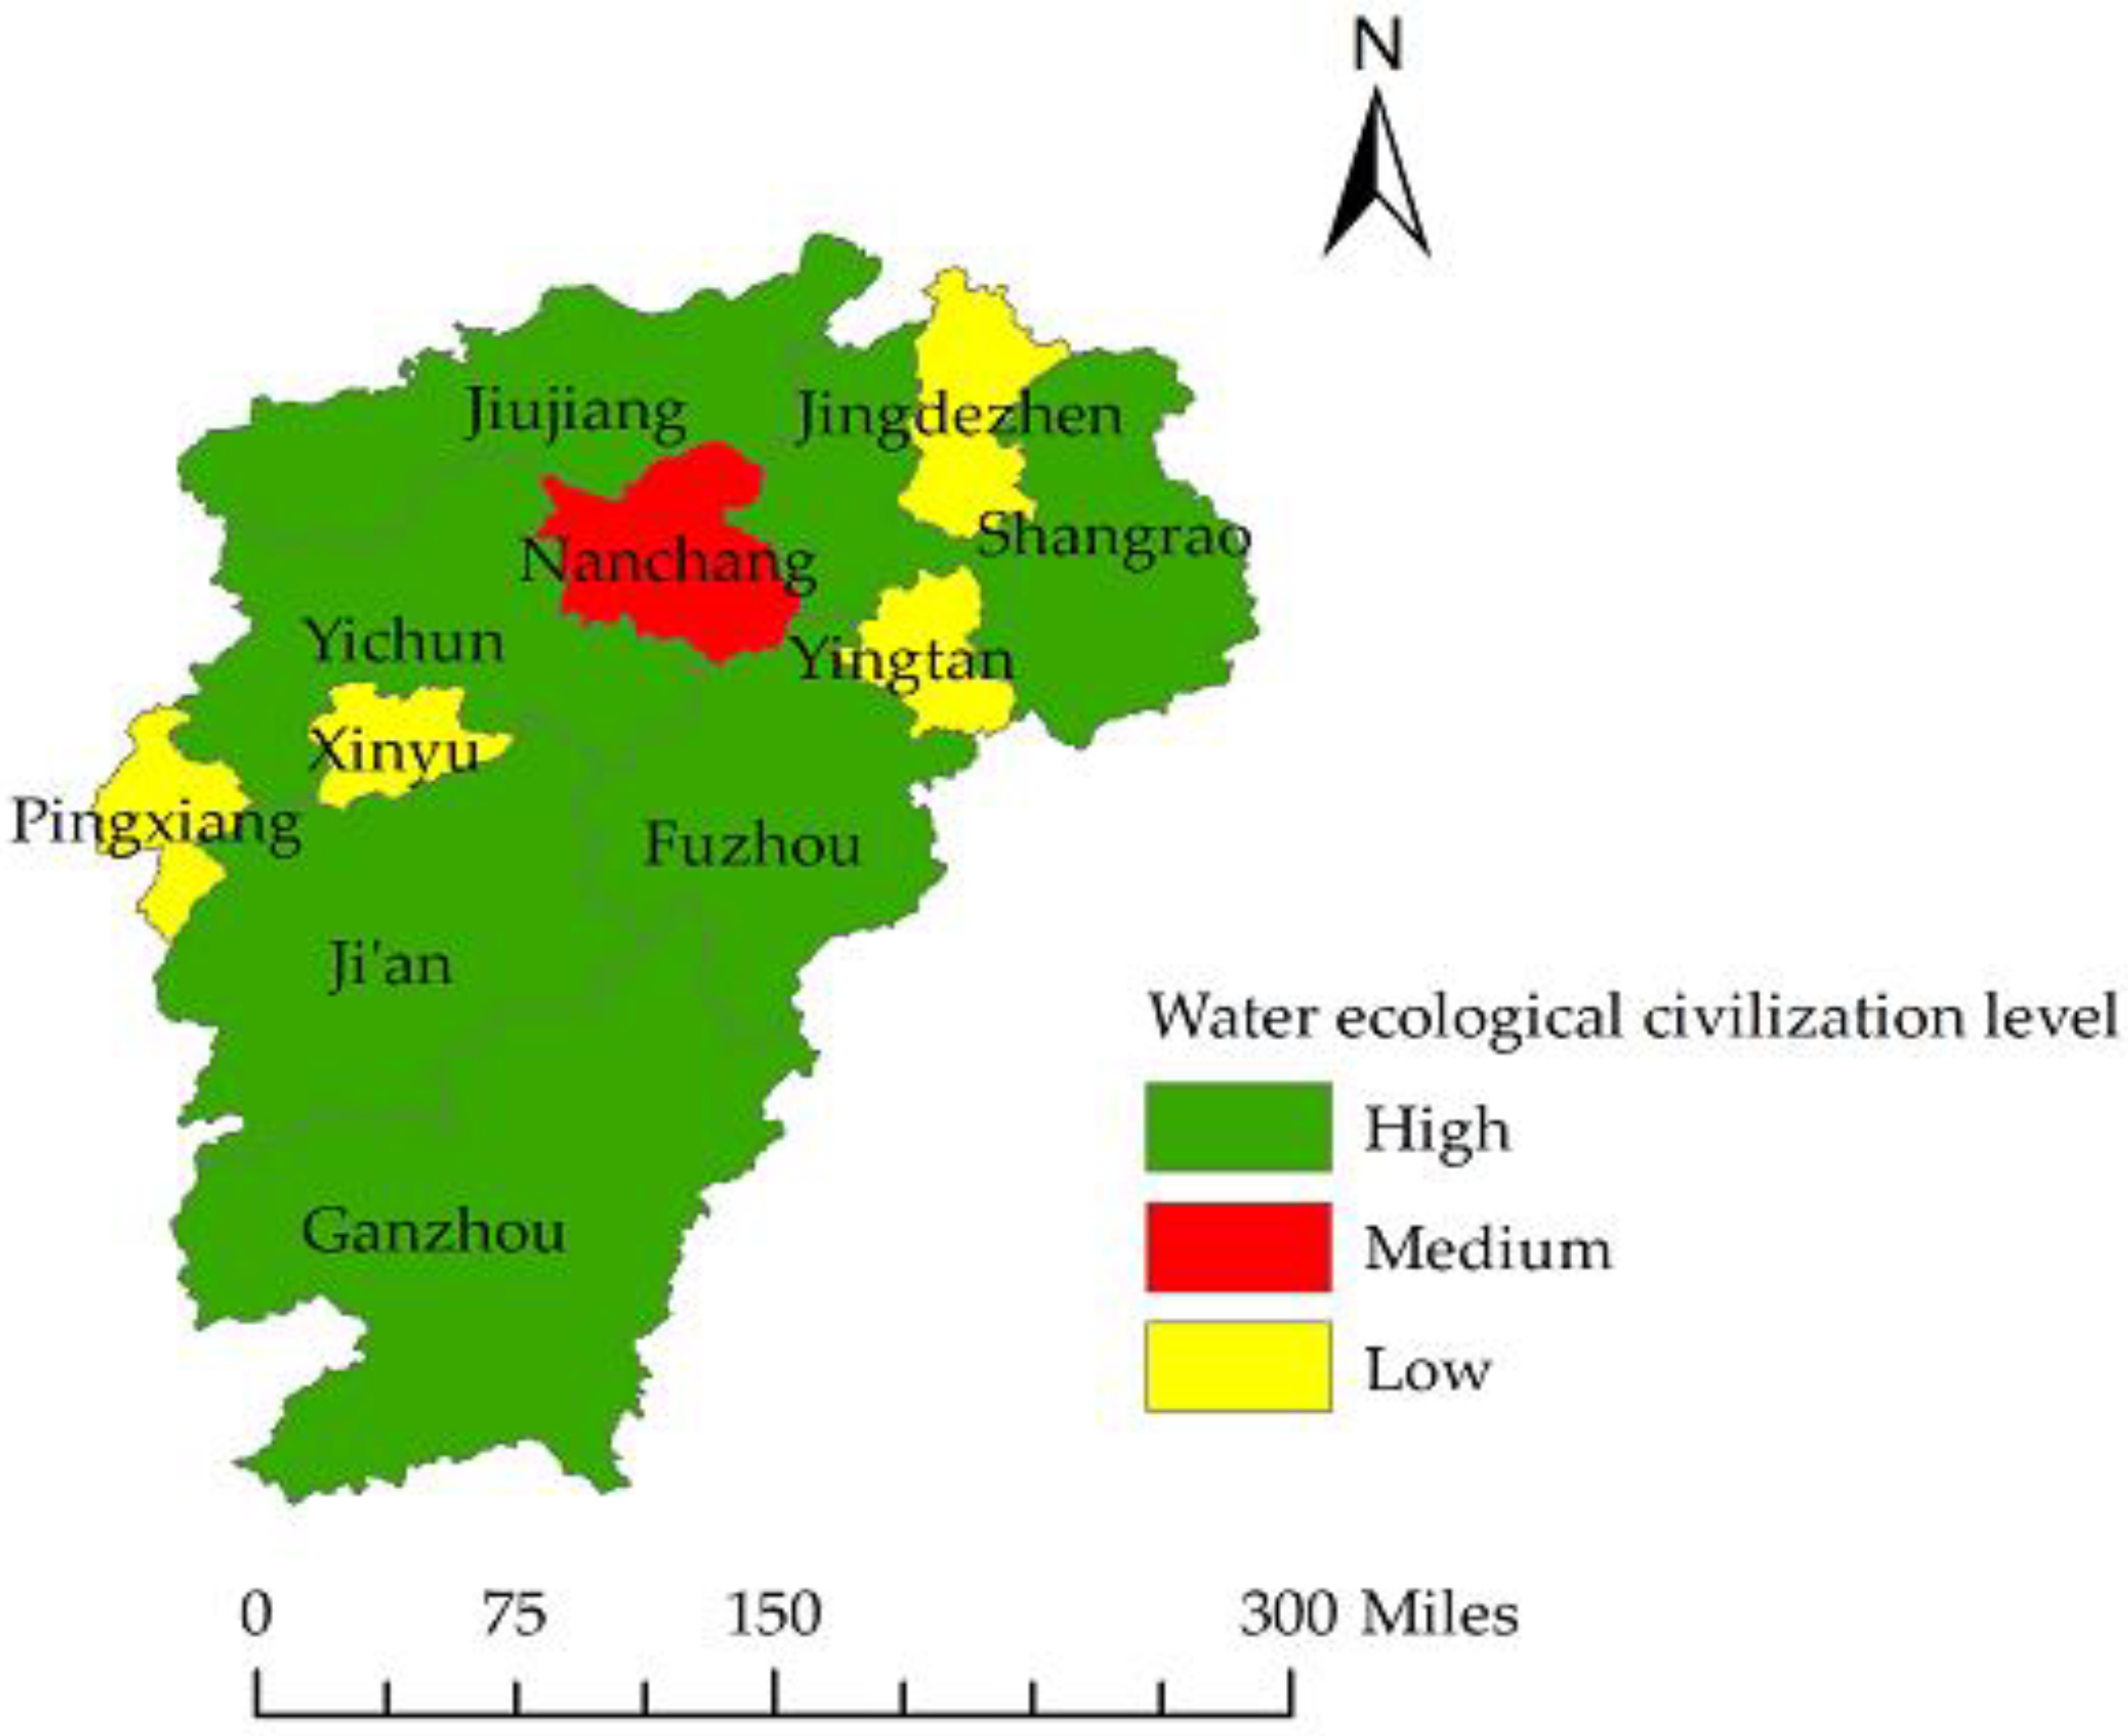
In order to more intuitively reflect the gap in the construction level of water ecological civilization in 11 prefecture-level cities in Jiangxi Province, we used the systematic clustering method to conduct cluster analysis on the comprehensive score of water ecological civilization, water ecological system score, water economic system score, and water social system score, and used ArcGIS 17.0 to draw the spatial pattern of water ecological civilization in Jiangxi Province in 2020, which are divided into three categories: high, medium, and low, and the colors are green, red, and yellow, respectively, as shown in
Figure 3. The green areas include Ji’an, Fuzhou, Jiujiang, Yichun, Ganzhou, and Shangrao, the red areas only include Nanchang, while Pingxiang, Xinyu, Yingtan, and Jingdezhen belong to the yellow areas. It is found that the water ecological civilization in southern and central Jiangxi is generally higher than that in northern Jiangxi. The reason is that the annual precipitation in southern and central Jiangxi is rich, which provides innate advantages for surface water resources and groundwater resources, so that the total amount of water resources is higher than other regions, ensuring the safety of water for residents. At the same time, northern Jiangxi is an area with good economic growth in Jiangxi Province. However, due to the high proportion of low-end and middle-end industries in the industrial structure, the economic growth is mostly non-intensive growth, and there are high pollution, high consumption, and high discharge in the process of water utilization, resulting in a low level of water ecological civilization.


