

Evaluation of Cultivated Land Quality in Semiarid Sandy Areas: A Case Study of the Horqin Zuoyihou Banner
Abstract
:1. Introduction
2. Materials and Methods
2.1. Materials
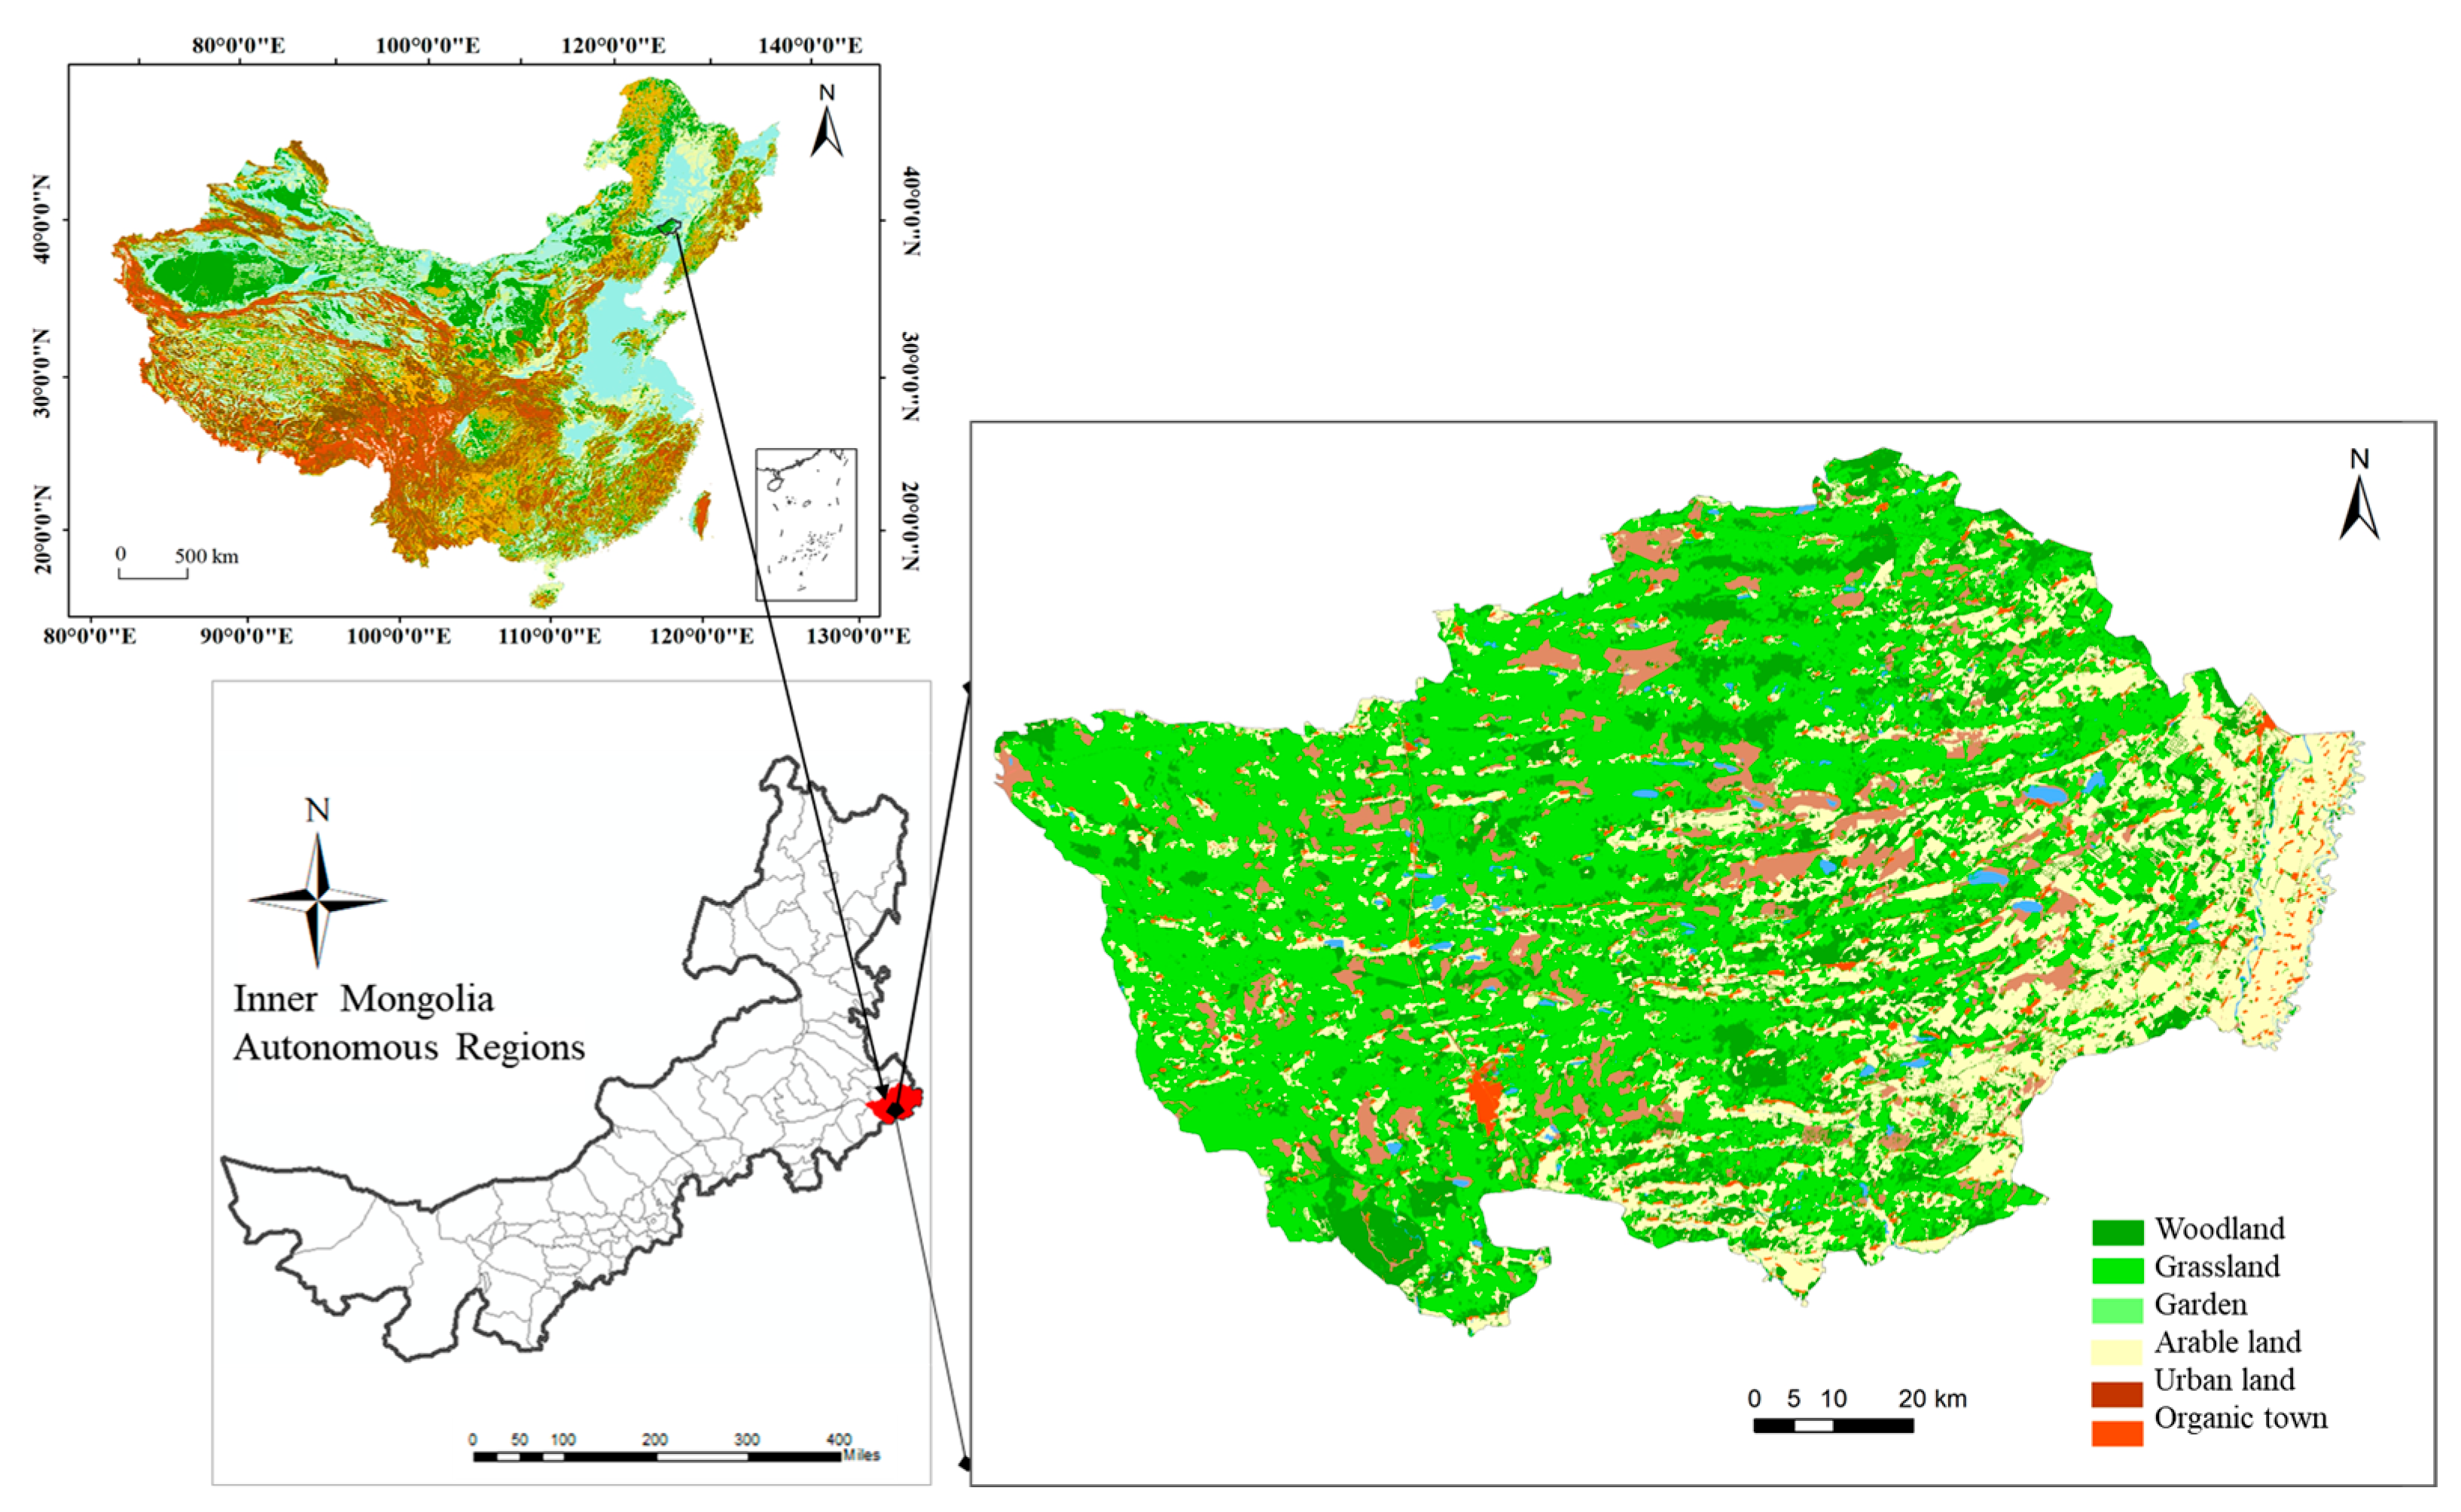
2.1.1. Study Area
2.1.2. Data Sources
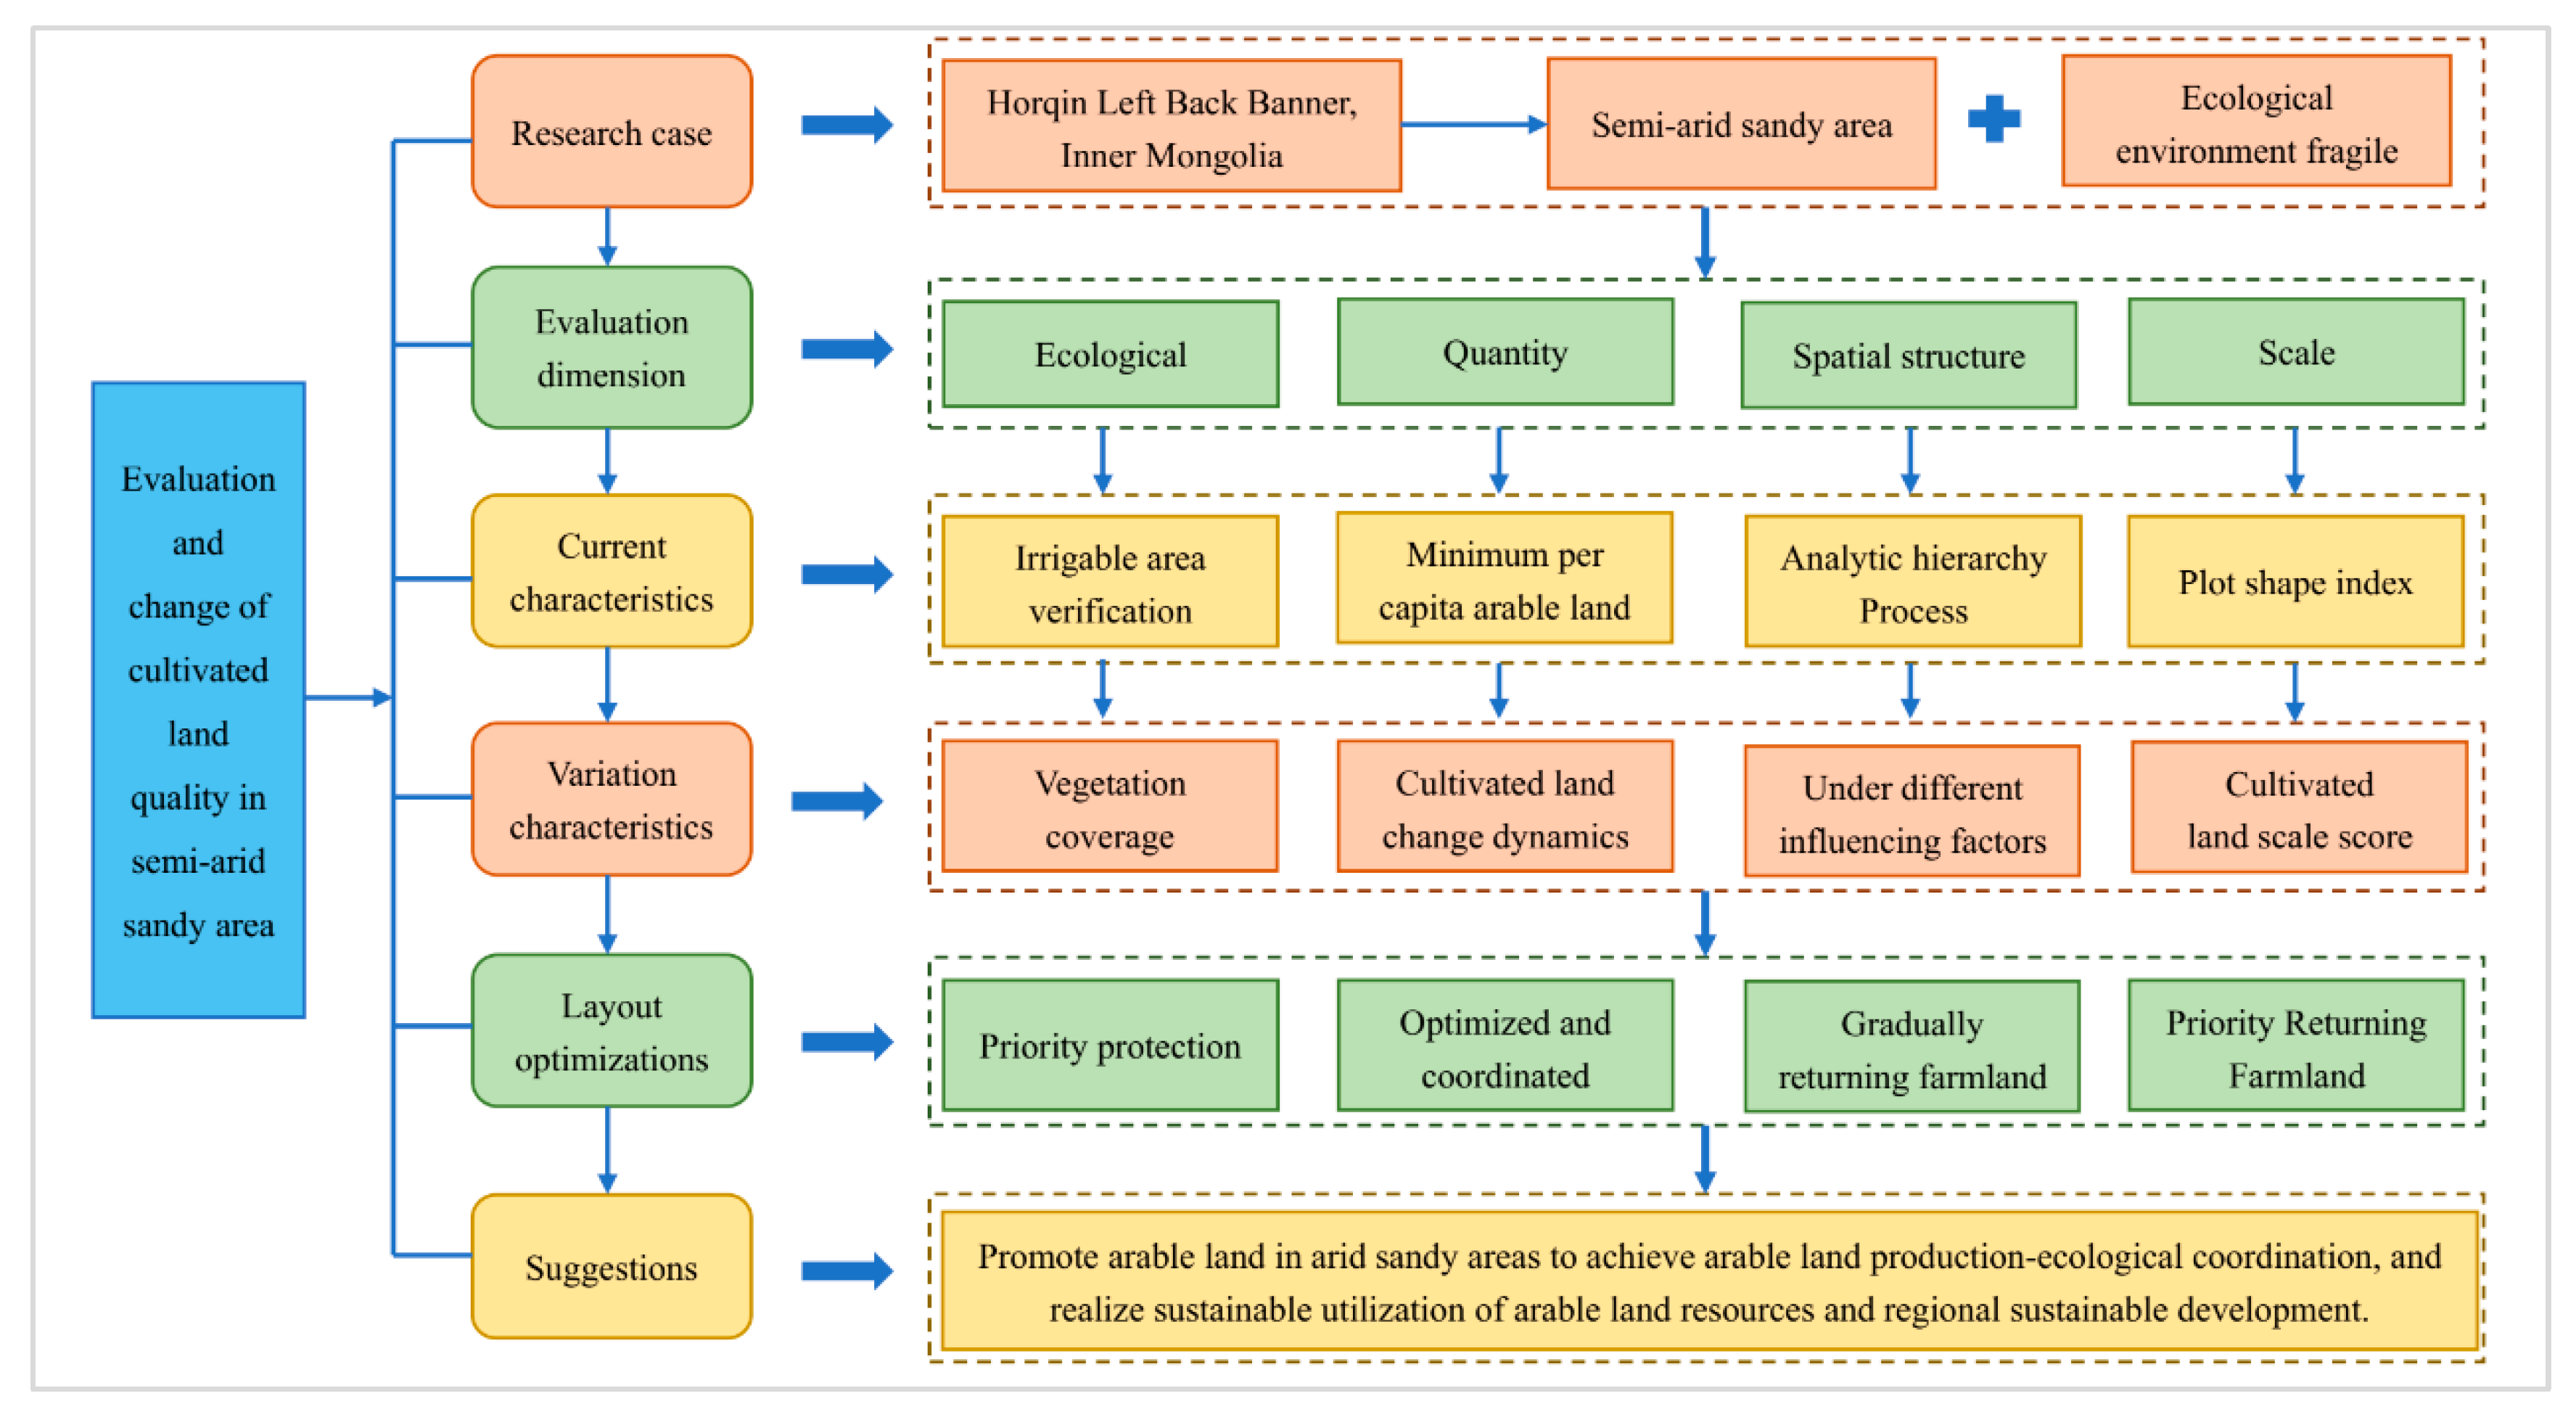
2.2. Research Framework
2.3. Research Methods
2.3.1. Cultivated Land Quality Evaluation Method
- (1)
- Ecological dimension
- (2)
- Quantity dimension
- (3)
- Spatial structure dimension
- (4)
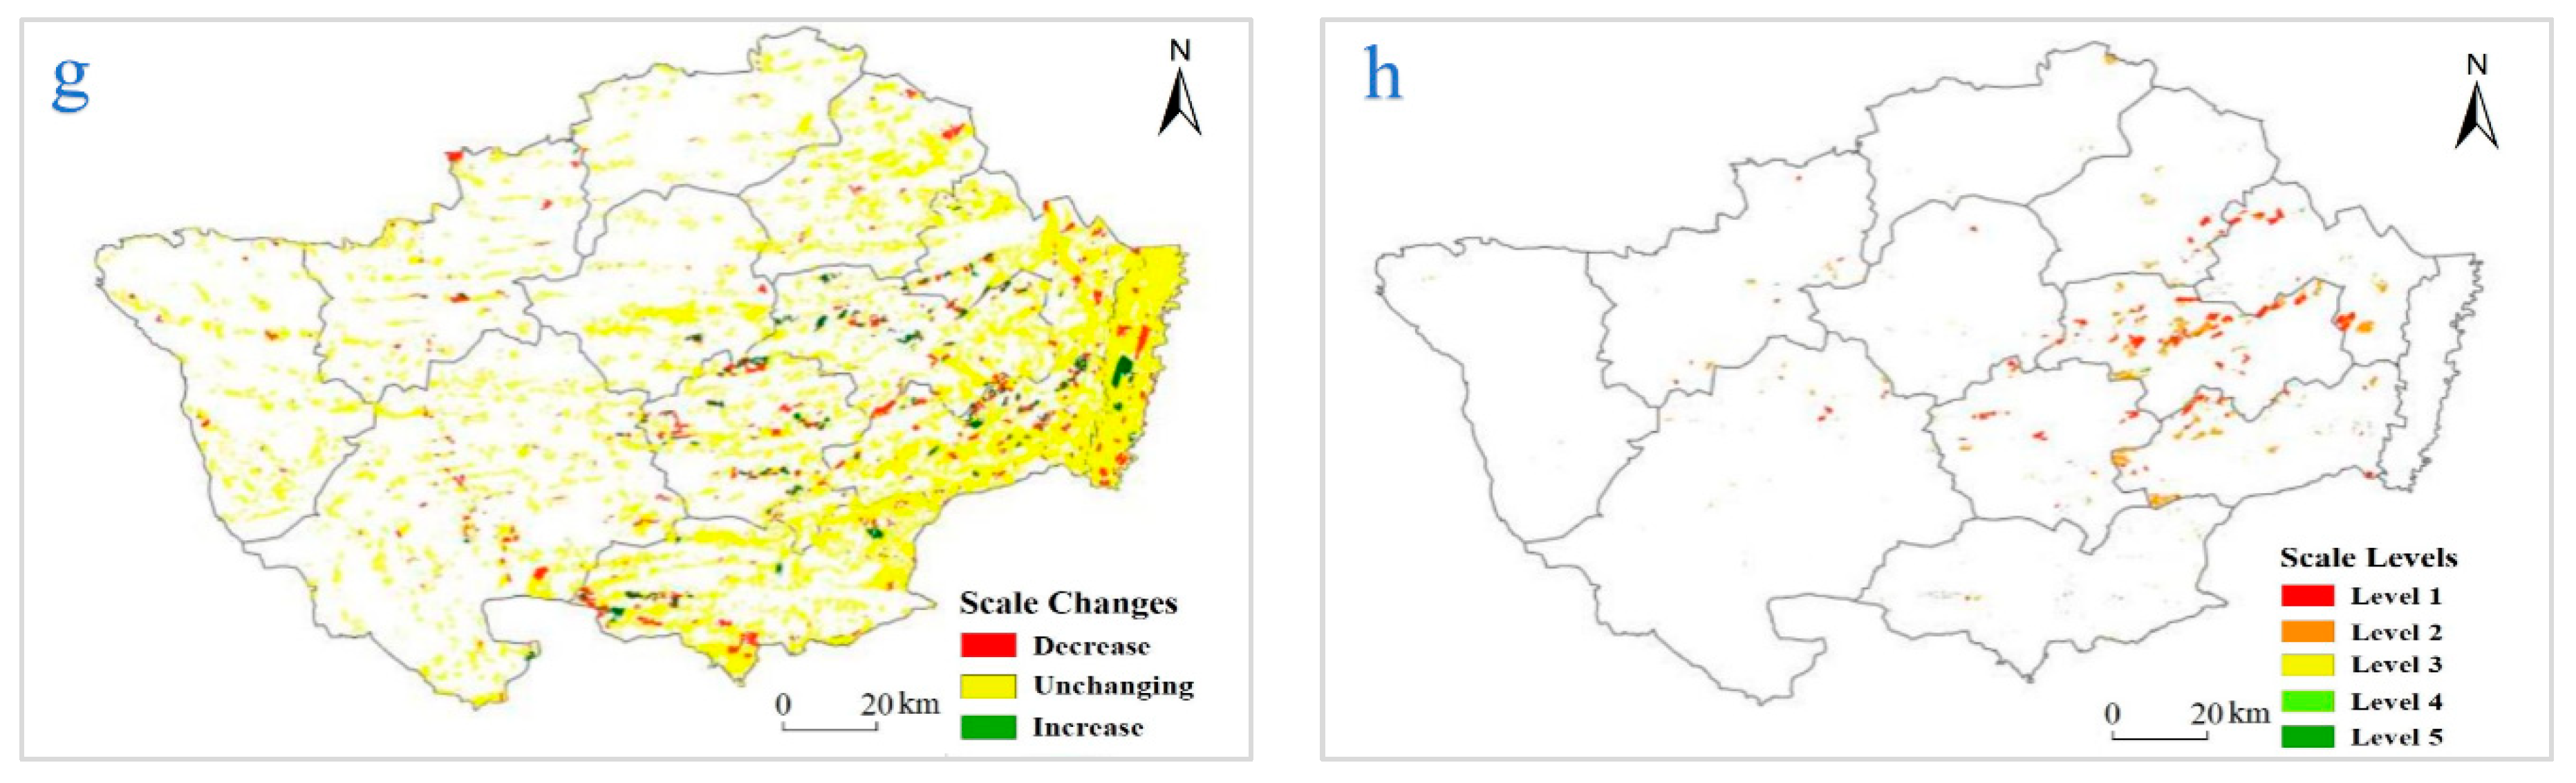
- Scale dimension
2.3.2. Cultivated Land Quality Change Evaluation
- (1)
- Ecological dimension
- (2)
- Quantity dimension
- (3)
- Spatial structure dimension
- (4)
- Scale dimension
2.3.3. Optimization of Cultivated Land Resources
3. Results
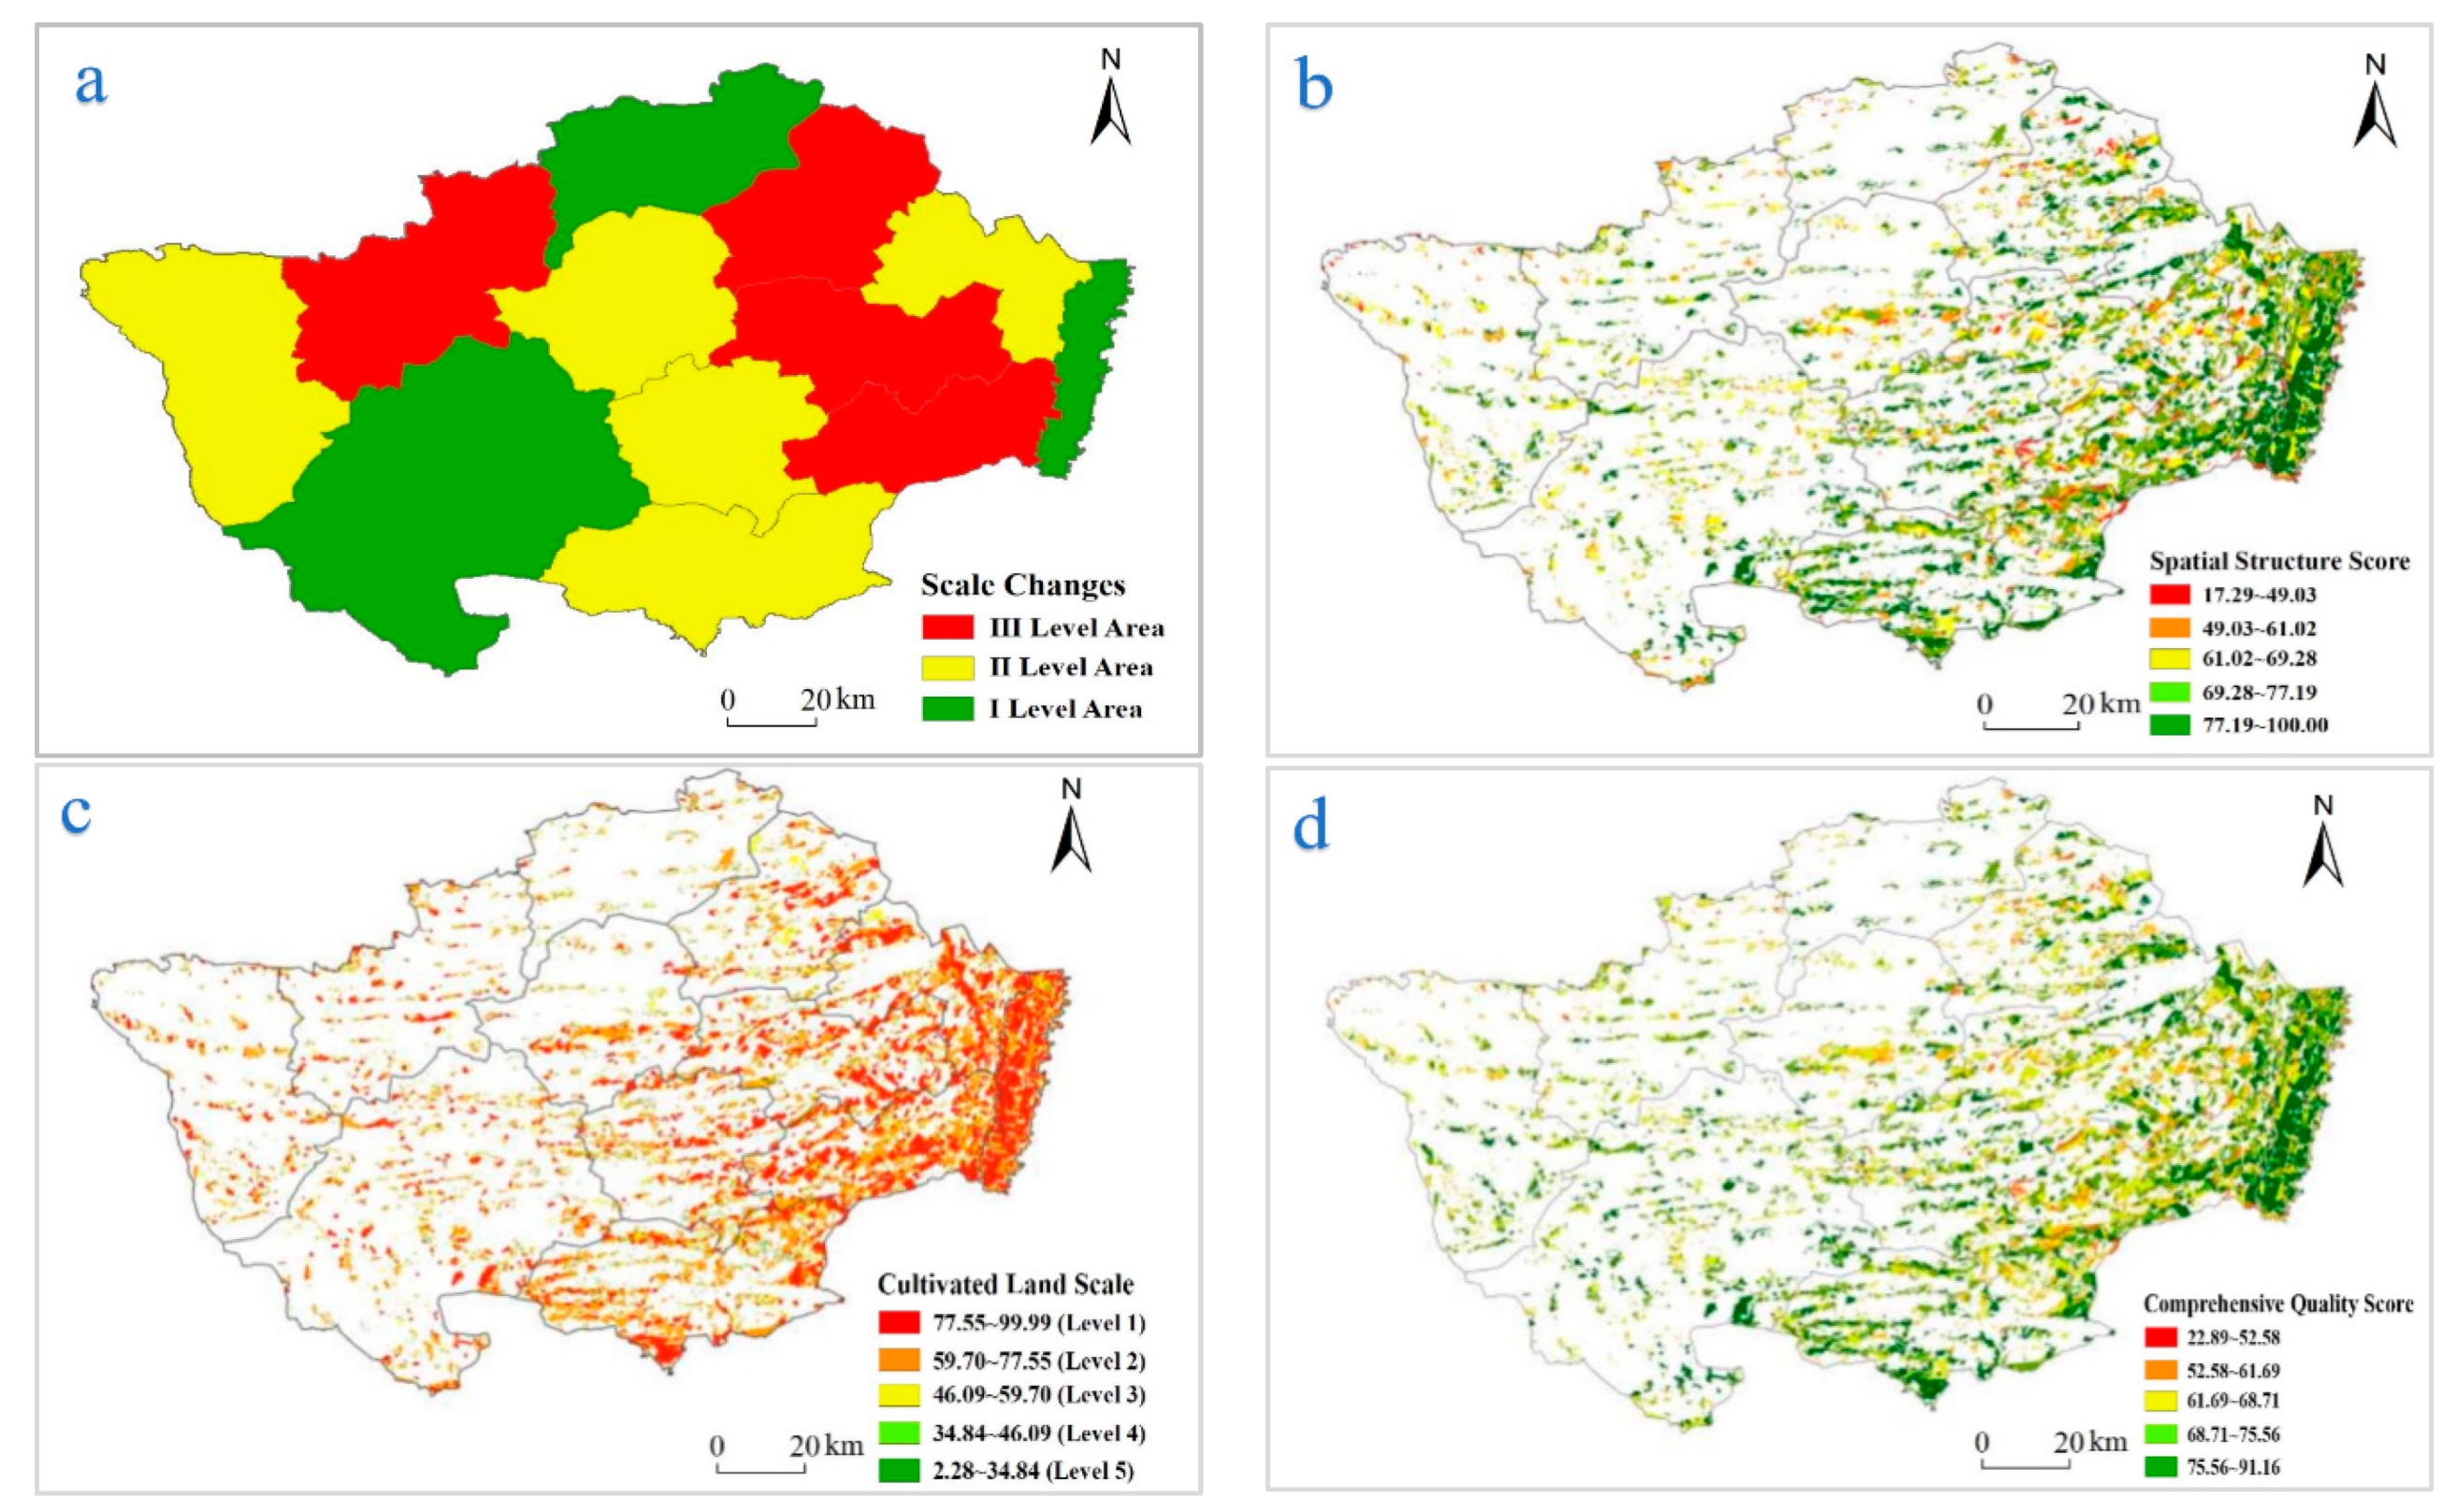
3.1. Current Cultivated Land Quality Evaluation
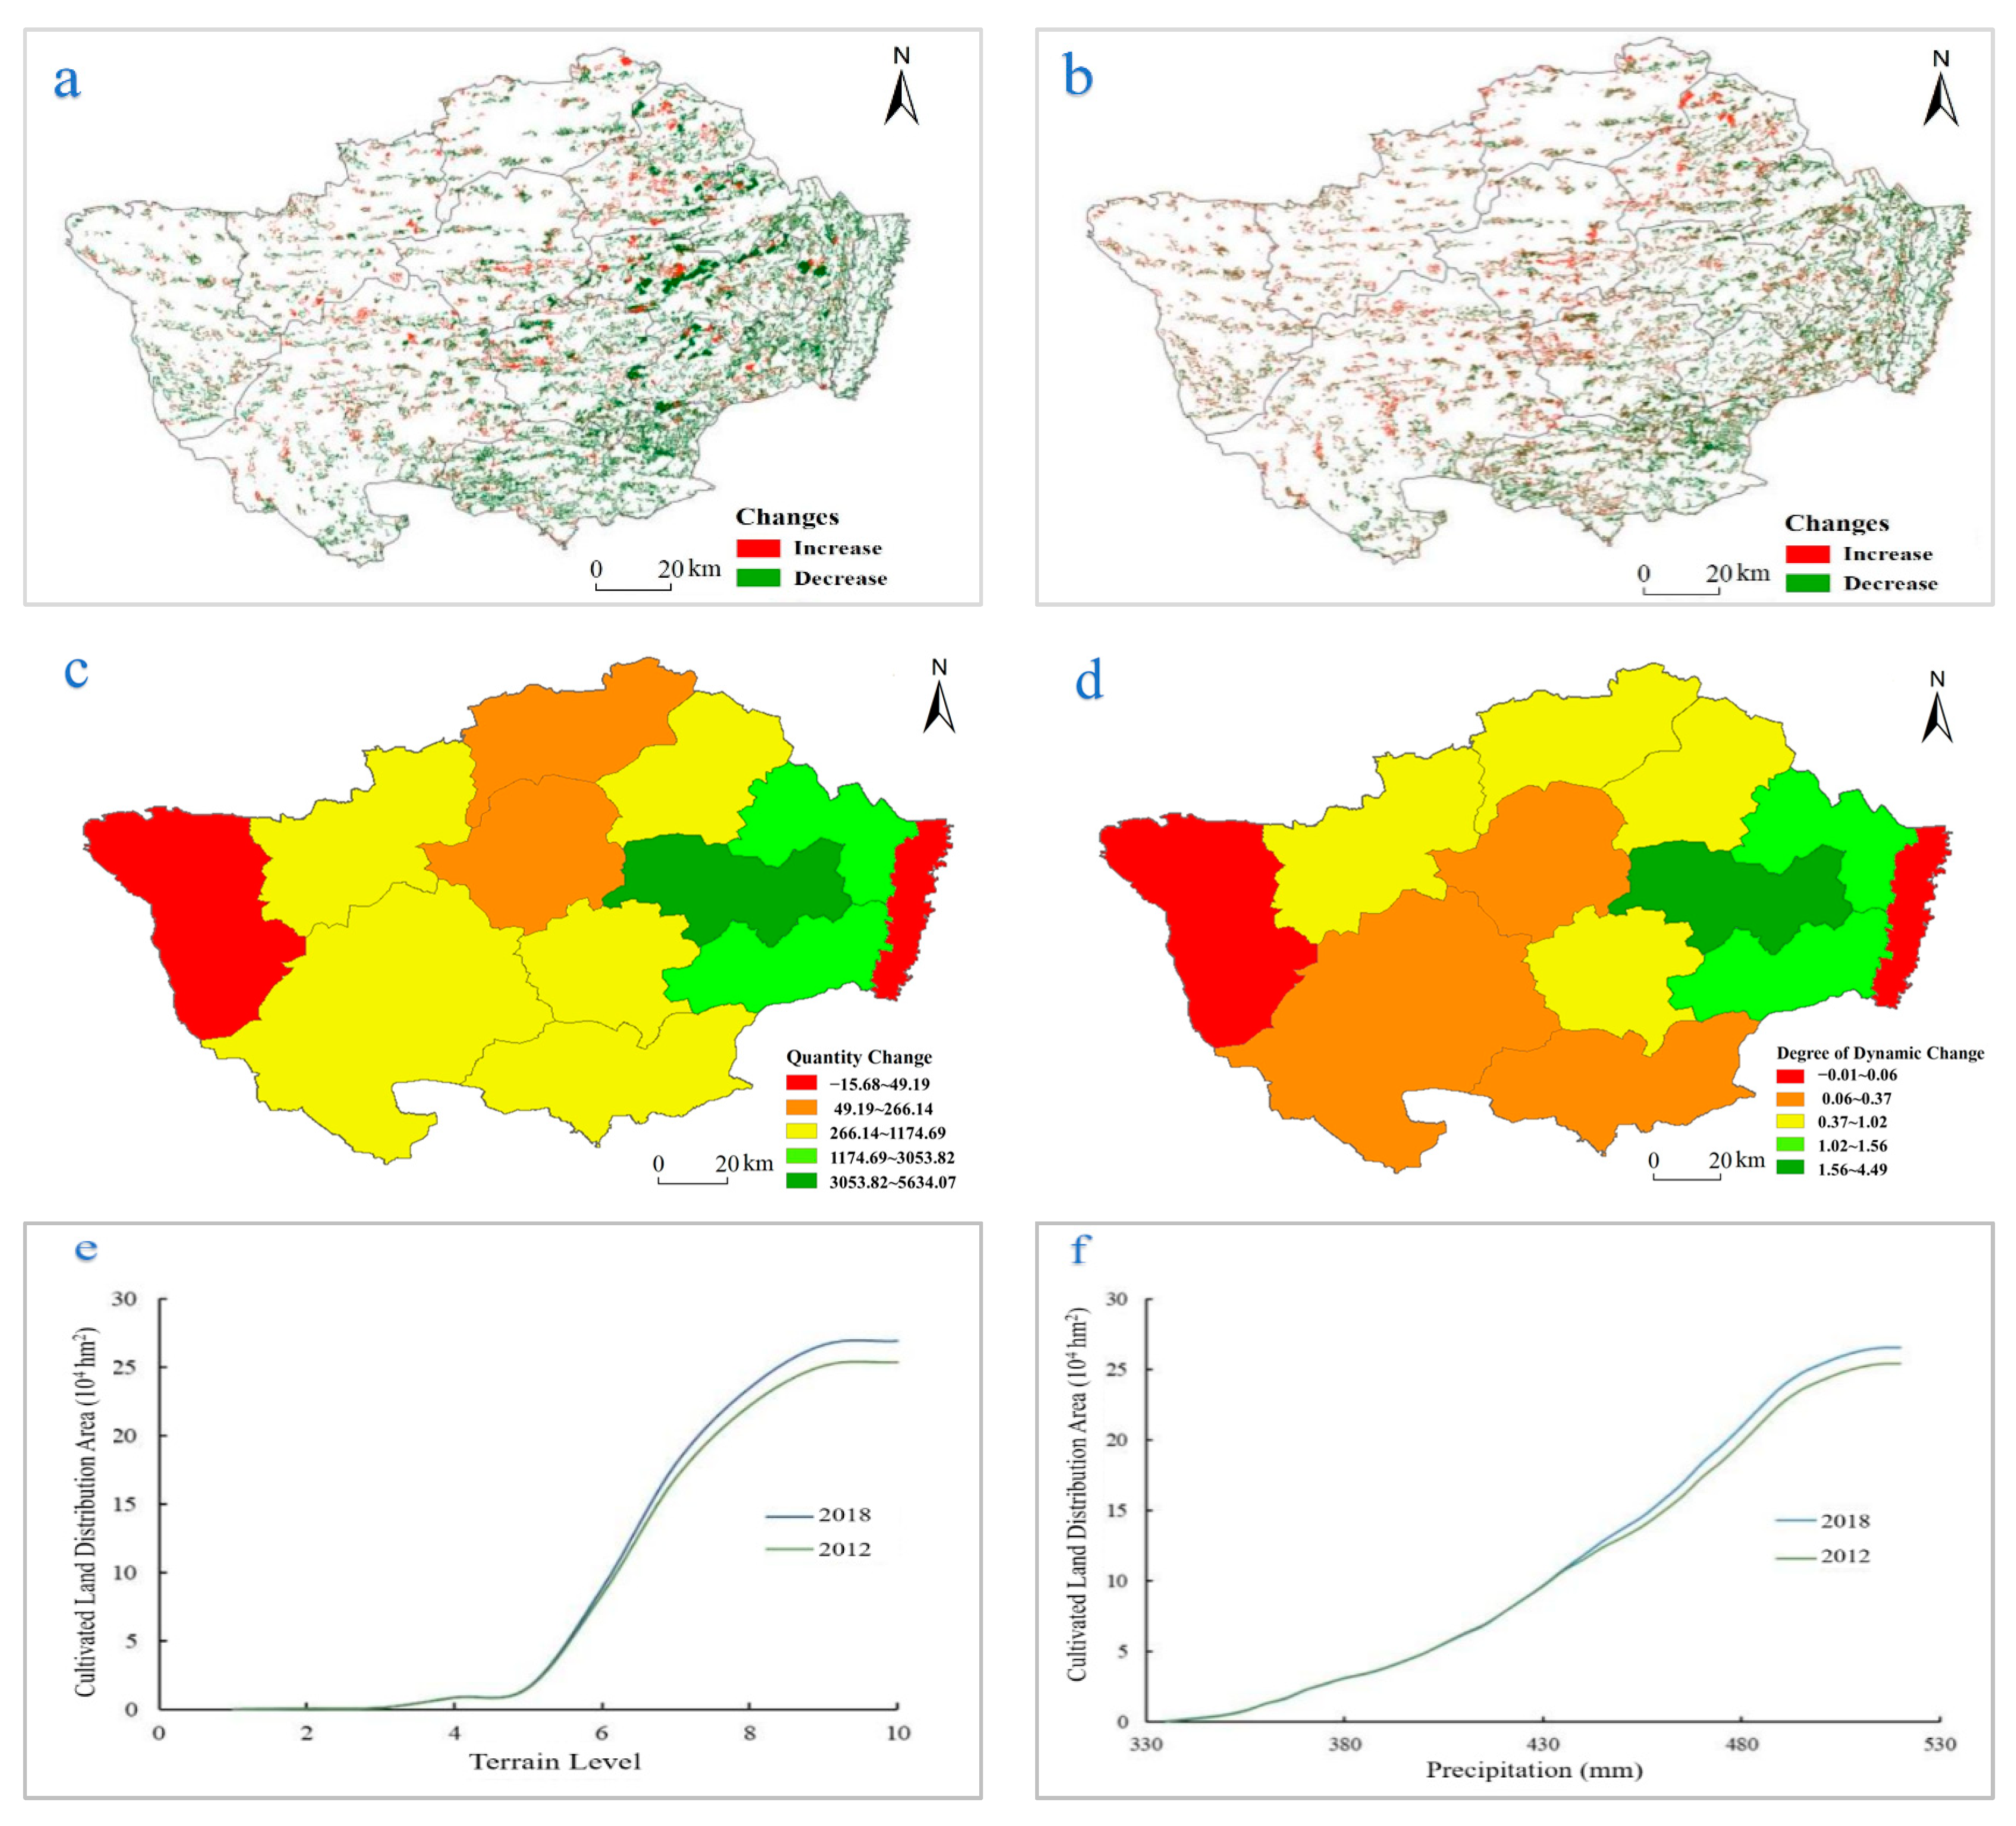
3.2. Cultivated Land Quality Change Evaluation
3.3. Cultivated Land Resource Optimization
4. Discussion
5. Conclusions
Author Contributions
Funding
Institutional Review Board Statement
Informed Consent Statement
Data Availability Statement
Acknowledgments
Conflicts of Interest
References
- Zhou, Y.; Li, X.; Liu, Y. Cultivated land protection and rational use in China. Land Use Policy 2021, 106, 105454. [Google Scholar] [CrossRef]
- Liu, Y.; Fang, F.; Li, Y. Key issues of land use in China and implications for policy making. Land Use Policy 2014, 40, 6–12. [Google Scholar] [CrossRef]
- Wang, Y.; Bai, L.X.; Zhao, J.; Li, X. Dynamic variations of soil moisture in field and water use efficiency of maize under sprinkler irrigation. Soc. Agric. Eng. 2012, 28, 92–97, (In Chinese with English abstract). [Google Scholar]
- Liu, L.; Zhou, D.; Chang, X.; Lin, Z. A new grading system for evaluating China’s cultivated land quality. Land Degrad. Dev. 2020, 31, 1482–1501. [Google Scholar] [CrossRef]
- Shi, Y.; Duan, W.; Fleskens, L.; Li, M.; Hao, J. Study on evaluation of regional cultivated land quality based on resource-asset-capital attributes and its spatial mechanism. Appl. Geogr. 2020, 125, 102284. [Google Scholar] [CrossRef]
- Sun, Z.; Wu, F.; Shi, C.; Zhan, J. The impact of land use change on water balance in Zhangye city, China. Phys. Chem. Earth Parts A/B/C 2016, 96, 64–73. [Google Scholar] [CrossRef]
- Li, H.; Wu, Y.; Huang, X.; Sloan, M.; Skitmore, M. Spatial-temporal evolution and classification of marginalization of cultivated land in the process of urbanization. Habitat Int. 2017, 61, 1–8. [Google Scholar] [CrossRef]
- Li, W.; Wang, D.; Liu, S.; Zhu, Y.; Yan, Z. Reclamation of Cultivated Land Reserves in Northeast China: Indigenous Ecological Insecurity Underlying National Food Security. Int. J. Environ. Res. Public Health 2020, 17, 1211. [Google Scholar] [CrossRef]
- Foley, J.A.; Ramankutty, N.; Brauman, K.A.; Cassidy, E.S.; Gerber, J.S.; Johnston, M.; Mueller, N.D.; O’Connell, C.; Ray, D.K.; West, P.C.; et al. Solutions for a cultivated planet. Nature 2011, 478, 337–342. [Google Scholar] [CrossRef] [PubMed]
- Klíngebiel, A.A.; Montgomery, P.H. Land-Capability Classification. In Agriculture Handbook; USDA: Washington, DC, USA, 1961; p. 210. [Google Scholar]
- Chen, L.; Song, G.; Meadows, M.E.; Zou, C. Spatio-temporal evolution of the early-warning status of cultivated land and its driving factors: A case study of Heilongjiang Province, China. Land Use Policy 2018, 72, 280–292. [Google Scholar] [CrossRef]
- Liu, Y.; Zhang, Y.; Guo, L. Towards realistic assessment of cultivated land quality in an ecologically fragile environment: A satellite imagery-based approach. Appl. Geogr. 2010, 30, 271–281. [Google Scholar] [CrossRef]
- Zhao, C.; Zhou, Y.; Jiang, J.; Xiao, P.; Wu, H. Spatial characteristics of cultivated land quality accounting for ecological environmental condition: A case study in hilly area of northern Hubei province, China. Sci. Total Environ. 2021, 774, 145765. [Google Scholar] [CrossRef]
- Qiu, X.; Zhu, A.; Hu, Y.; Guo, Y.; Shen, X. Error checking of large land quality databases through data mining based on low frequency associations. Land Degrad. Dev. 2020, 31, 2146–2155. [Google Scholar] [CrossRef]
- Santé-Riveira, I.; Crecente-Maseda, R.; Miranda-Barrós, D. GIS-based planning support system for rural land-use allocation. Comput. Electron. Agric. 2008, 63, 257–273. [Google Scholar] [CrossRef]
- Song, W.; Pijanowski, B.C. The effects of China’s cultivated land balance program on potential land productivity at a national scale. Appl. Geogr. 2014, 46, 158–170. [Google Scholar] [CrossRef]
- Chen, L.; Zhao, H.; Song, G.; Liu, Y. Optimization of cultivated land pattern for achieving cultivated land system security: A case study in Heilongjiang Province, China. Land Use Policy 2021, 108, 105589. [Google Scholar] [CrossRef]
- Wang, Z.; Wang, L.; Xu, R.; Huang, H.; Wu, F. GIS and RS based Assessment of Cultivated Land Quality of Shandong Province. Procedia Environ. Sci. 2012, 12, 823–830. [Google Scholar] [CrossRef]
- Yuan, X.F.; Shao, Y.J.; Wei, X.D.; Hou, R.; Ying, Y.; Zhao, Y.H. Study on the potential of cultivated land quality improvement based on a geological detector. Geol. J. 2018, 53, 387–397. [Google Scholar] [CrossRef]
- Zhang, C.; Qiao, M.; Yun, W.J.; Liu, J.; Zhu, D.; Yang, J. Trinity comprehensive regulatory system about quantity, quality and ecology of cultivated land. Trans. Chin. Soc. Agric. Mach. 2017, 48, 1–6, (In Chinese with English abstract). [Google Scholar]
- Zhang, H.; Gao, Y.; Sun, D.; Liu, L.; Cui, Y.; Zhu, W. Wind erosion changes in a semi-arid sandy area, inner Mongolia, China. Sustainability 2019, 11, 188. [Google Scholar] [CrossRef]
- Li, Y.; Awada, T.; Zhou, X.; Shang, W.; Chen, Y.; Zuo, X.; Wang, S.; Liu, X.; Feng, J. Mongolian pine plantations enhance soil physico-chemical properties and carbon and nitrogen capacities in semi-arid degraded sandy land in China. Appl. Soil Ecol. 2012, 56, 1–9. [Google Scholar] [CrossRef]
- Dorji, U.; Olesen, J.E.; Seidenkrantz, M.S. Water balance in the complex mountainous terrain of Bhutan and linkages to land use. J. Hydrol. Reg. Stud. 2016, 7, 55–68. [Google Scholar] [CrossRef] [Green Version]
- Zhou, J.; Zhang, F.; Xu, Y.; Gao, Y.; Xie, Z. Evaluation of land reclamation and implications of ecological restoration for agro-pastoral ecotone: Case study of Horqin Left Back Banner in China. Chin. Geogr. Sci. 2017, 27, 772–783. [Google Scholar] [CrossRef]
- Xu, D.L.; Li, T.S.; Xue, X.J.; Zhu, J.W. Study on the sustainable development of different agricultural and pastoral land patterns in the northern agro-pastoral ecotone: A case study of Tongliao City, Inner Mongolia. Res. Soil Water Conserv. 2017, 24, 219–225, (In Chinese with English abstract). [Google Scholar]
- Zhang, M.; Wang, J.; Li, S.; Feng, D.; Cao, E. Dynamic changes in landscape pattern in a large-scale opencast coal mine area from 1986 to 2015: A complex network approach. Catena 2020, 194, 104738. [Google Scholar] [CrossRef]
- Gong, X.; Du, S.; Li, F.; Ding, Y. Study of mesoscale NDVI prediction models in arid and semiarid regions of China under changing environments. Ecol. Indic. 2021, 131, 108198. [Google Scholar] [CrossRef]
- Huang, B.; Huang, J.; Pontius, R.G., Jr.; Tu, Z. Comparison of Intensity Analysis and the land use dynamic degrees to measure land changes outside versus inside the coastal zone of Longhai, China. Ecol. Indic. 2018, 89, 336–347. [Google Scholar] [CrossRef]
- Aslan, T.A. Evaluation of land consolidation projects with parcel shape and dispersion. Land Use Policy 2021, 105, 105401. [Google Scholar] [CrossRef]
- Li, M.; Fu, Q.; Singh, V.P.; Liu, D.; Li, T.X.; Zhou, Y. Managing agricultural water and land resources with tradeoff between economic, environmental, and social considerations: A multi-objective non-linear optimization model under uncertainty. Agric. Syst. 2020, 178, 102685. [Google Scholar] [CrossRef]
- Wang, K.; Deng, L.; Shangguan, Z.; Chen, Y.; Lin, X. Sustainability of eco-environment in semi-arid regions: Lessons from the Chinese Loess Plateau. Environ. Sci. Policy 2021, 125, 126–134. [Google Scholar] [CrossRef]
- Salvati, L.; Kosmas, C.; Kairis, O.; Karavitis, C.; Acikalin, S.; Belgacem, A.; Solé-Benet, A.; Chaker, M.; Fassouli, V.; Gokceoglu, C.; et al. Assessing the effectiveness of sustainable land management policies for combating desertification: A data mining approach. J. Environ. Manag. 2016, 183, 754–762. [Google Scholar] [CrossRef]
- Varghese, N.; Singh, N.P. Linkages between land use changes, desertification and human development in the Thar Desert Region of India. Land Use Policy 2016, 51, 18–25. [Google Scholar] [CrossRef]
- Hao, L.; Su, X.; Singh, V.P.; Zhang, L.; Zhang, G. Suitable oasis and cultivated land scales in arid regions based on ecological health. Ecol. Indic. 2019, 102, 33–42. [Google Scholar] [CrossRef]
- Su, Y.Z.; Zhao, W.Z.; Su, P.X.; Zhang, Z.H.; Wang, T.; Ram, R. Ecological effects of desertification control and desertified land reclamation in an oasis–desert ecotone in an arid region: A case study in Hexi Corridor, northwest China. Ecol. Eng. 2007, 29, 117–124. [Google Scholar] [CrossRef]
- Yang, B.; Wang, Z.Q.; Zou, L.; Zou, L.L.; Zhang, H.W. Exploring the eco-efficiency of cultivated land utilization and its influencing factors in China’s Yangtze River Economic Belt, 2001–2018. J. Environ. Manag. 2021, 294, 112939. [Google Scholar] [CrossRef]
- Xiong, L.; Xu, X.; Engel, B.; Xiong, Y.; Huang, Q.; Huang, G. Predicting agroecosystem responses to identify appropriate water-saving management in arid irrigated regions with shallow groundwater: Realization on a regional scale. Agric. Water Manag. 2021, 247, 106713. [Google Scholar] [CrossRef]
- Lu, H.; Xie, H.; Lv, T.; Yao, G. Determinants of cultivated land recuperation in ecologically damaged areas in China. Land Use Policy 2018, 81, 160–166. [Google Scholar] [CrossRef]
- Wang, S.; Yin, N.; Yang, Z. Factors affecting sustained adoption of irrigation water-saving technologies in groundwater over-exploited areas in the North China Plain. Environ. Dev. Sustain. 2020, 23, 10528–10546. [Google Scholar] [CrossRef]


| Variables | Weights | Index Grading Standard | |||||||||
|---|---|---|---|---|---|---|---|---|---|---|---|
| 100 | 90 | 80 | 70 | 60 | 50 | 40 | 30 | 20 | 10 | ||
| Terrain level | 0.27 | 3–6 | 7–8 | 1–2 | 9–10 | ||||||
| Precipitation | 0.39 | >490 | 410–490 | 350–410 | ≤350 | ||||||
| Tillage distance | 0.18 | ≤200 | 200–600 | 600–1000 | >1000 | ||||||
| Proportion of agricultural and pastoral land | 0.16 | ≤1/7 | 1/5–1/7 | 1/5–1 | >1 | ||||||
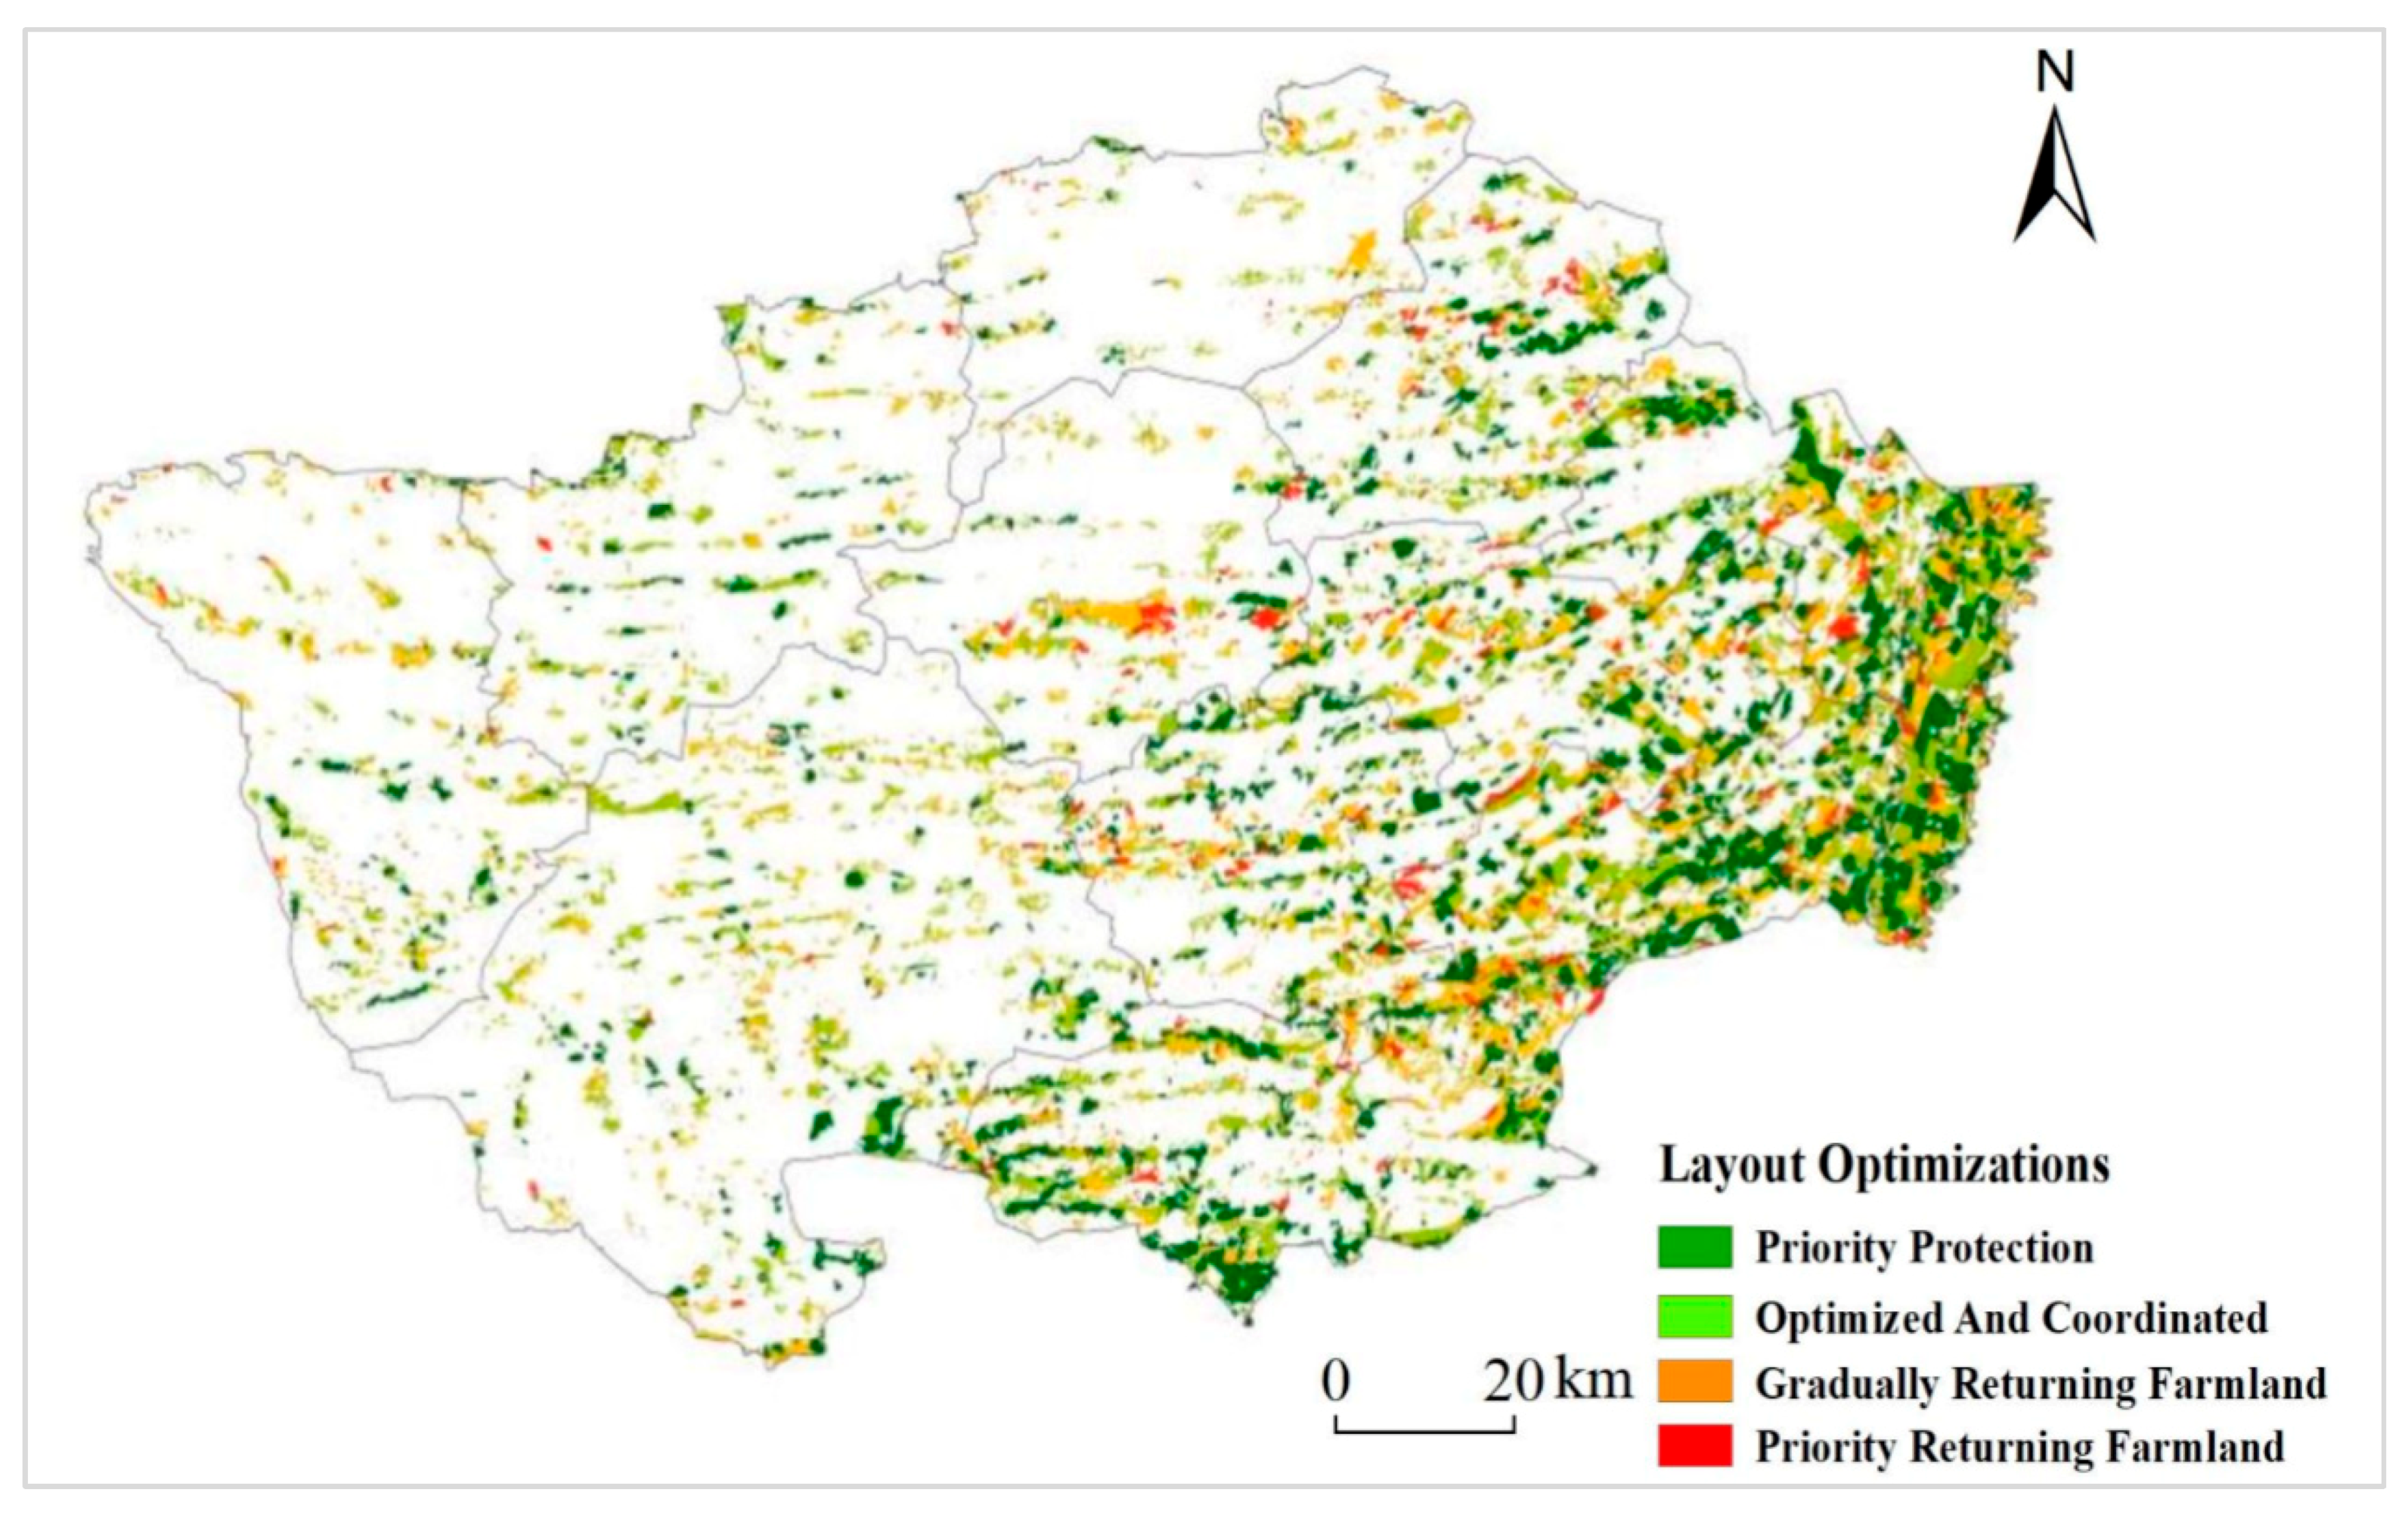
| Optimization Types | Classification Standard and Grade Combination |
|---|---|
| Priority protection | (1,1), (1,2), (2,1), (2,2) |
| Optimized and coordinated | (1,3), (1,4), (2,3), (3,1), (3,2) |
| Gradually returning farmland | (1,5), (2,4), (2,5), (3,3), (3,4), (4,1), (4,2), (4,3), (5,1), (5,2) |
| Priority returning farmland | (3,5), (4,4), (4,5), (5,3), (5,4), (5,5) |
| Towns | Priority Protection/hm2 | Optimized and Coordinated/hm2 | Gradually Returning Farmland/hm2 | Priority Returning Farmland/hm2 |
|---|---|---|---|---|
| Haitulu | 6321.80 | 10,124.21 | 7539.18 | 2541.25 |
| Charisu | 12,637.83 | 12,345.39 | 8148.55 | 4727.22 |
| Jinbaotun | 8505.52 | 8413.46 | 5238.30 | 3445.44 |
| Jiergalang | 5250.63 | 6674.70 | 5488.78 | 2901.13 |
| Aduqin | 4726.50 | 6835.61 | 5037.37 | 1744.78 |
| Ganqika | 8635.62 | 11,827.93 | 8281.03 | 2173.71 |
| Nugusitai | 3841.20 | 4044.30 | 2898.06 | 1431.79 |
| Changsheng | 14,441.26 | 10,803.82 | 10,835.17 | 4345.36 |
| Agula | 3334.52 | 3460.78 | 3452.83 | 1958.35 |
| Maodaotu | 596.78 | 2219.04 | 3037.95 | 755.94 |
| Chaolutu | 2854.03 | 3402.03 | 1902.99 | 4906.50 |
| Shuangsheng | 11,690.97 | 5703.42 | 4510.12 | 3348.60 |
| Total | 82,836.66 | 85,854.69 | 66,370.33 | 34,280.07 |
Publisher’s Note: MDPI stays neutral with regard to jurisdictional claims in published maps and institutional affiliations. |
© 2022 by the authors. Licensee MDPI, Basel, Switzerland. This article is an open access article distributed under the terms and conditions of the Creative Commons Attribution (CC BY) license (https://creativecommons.org/licenses/by/4.0/).
Share and Cite
Liang, J.; Zheng, H.; Cai, Z.; Zhou, Y.; Xu, Y. Evaluation of Cultivated Land Quality in Semiarid Sandy Areas: A Case Study of the Horqin Zuoyihou Banner. Land 2022, 11, 1457. https://doi.org/10.3390/land11091457
Liang J, Zheng H, Cai Z, Zhou Y, Xu Y. Evaluation of Cultivated Land Quality in Semiarid Sandy Areas: A Case Study of the Horqin Zuoyihou Banner. Land. 2022; 11(9):1457. https://doi.org/10.3390/land11091457
Chicago/Turabian StyleLiang, Jie, Huihui Zheng, Zhaoyang Cai, Yimin Zhou, and Yan Xu. 2022. "Evaluation of Cultivated Land Quality in Semiarid Sandy Areas: A Case Study of the Horqin Zuoyihou Banner" Land 11, no. 9: 1457. https://doi.org/10.3390/land11091457