Article

How to Price Ecosystem Water Yield Service and Determine the Amount of Compensation?—The Wei River Basin in China as an Example

1
College of Economics and Management, Northwest A&F University, Xianyang 712100, China
2
College of Economics and Management, Nanjing Forestry University, Nanjing 210037, China
*
Author to whom correspondence should be addressed.
Land 2022, 11(7), 1118; https://doi.org/10.3390/land11071118
Submission received: 15 June 2022 / Revised: 17 July 2022 / Accepted: 18 July 2022 / Published: 21 July 2022
(This article belongs to the Special Issue Water Resources and Land Use Planning)

Abstract

:
Determining the price of water yield service is the core of watershed compensation. This is necessary to establish a reasonable and scientific compensation mechanism and achieve the efficient management of water. Unlike previous studies, this study establishes a theoretical model of pricing and a compensation mechanism for achieving a balance between the supply and demand of water yield service. A panel threshold model is used to estimate the production elasticity of water for pricing water yield service. Then, we analyze the spatial and temporal changes of the price and the compensation amounts of water yield service in the Wei River basin, China. The results show that: (1) The water marginal contribution to regional GDP meets the law of diminishing marginal return in the form of the threshold effect. When water input amounts (logarithm) are on both sides of 9.449, the marginal contribution is significantly different. (2) The price of water yield service shows an increasing trend. It was CNY 47.27/m3 in 2015, increasing by 472.94% compared with 2000 (CNY 8.24/m3). The spatial distribution was “high in the southeast and low in the northwest”. (3) Total payment amounts increased from CNY 33.1955 billion in 2000 to CNY 227.1302 billion in 2015 and were mainly distributed in relatively developed areas. The acceptance areas were concentrated in relatively undeveloped areas. Total acceptance amounts increased from CNY 2922.2 million in 2000 to CNY 16,398.6 million in 2015. This study can provide scientific basis for ecological compensation practices and promote high-quality development of the socio-economy of the watershed.

1. Introduction

Ecosystem services (ES), from which human beings can benefit directly or indirectly, refers to a variety of environmental conditions and products that are significant to the survival and development of human beings [1,2]. Assessing the ecosystem services’ value can aid a better understanding of the importance of various services provided by ecosystems for human beings. Furthermore, it can provide a basis for decision making that better co-ordinates human–land relations and promotes sustainable development [3,4]. Among these services, water yield service plays an important role in maintaining the stability of ecosystems and the production and life of human beings [5]. However, with the rapid development of economies, the acceleration of urbanization and the influence of global climate change, problems relating to the ecological environment of water [6], such as over-exploitation and serious pollution, have emerged in many areas of the world, such as North America [7], western Europe [8] and southeast Asia [9]. The environmental problems of river basins are the most prominent. As the largest developing country in the world, China is facing the same problem. The total amount of freshwater in China as ranks the fourth largest in the world, accounting for 6% of the global water. However, China is one of the countries with the poorest per capita water availability in the world, at one quarter of the world average [10]. Due to the low water price in China, water has always been regarded as “welfare”. Thus, it is difficult to reflect the market relationship between supply and demand and the severe shortage of water. This leads to the inefficient allocation of water [11,12]. Furthermore, water demand has increased rapidly, resulting in severe water shortages in China. In addition, water use competition among regions has been aggravated, which has increased the utilization intensity of water and affected sustainable development in river basins [13]. Therefore, the question of how to realize the optimal allocation of water will be an urgent problem facing the sustainable development of the economy and ecology of river basins.
The ecological compensation of a watershed acts as a policy method to harmonize the relationship between the ecological environment and economic interests [14,15]. It plays a key role in achieving fairness and the efficient use of resource allocation. At present, numerous scholars and governments have carried out research on the ecological compensation of a watershed. In general, foreign scholars have usually used the travel expenditure method, the conditional value evaluation method and the emergy analysis method to estimate the compensation standard of river basins [16,17,18,19]. However, the current watershed ecological compensation methods in China mainly include vertical compensation and horizontal compensation [20,21,22]. Vertical compensation refers to the transfer payment from central government to local government. However, the scale is too small to meet the needs of local governments in implementing the ecological compensation in China [13], causing inefficiency. When it comes to horizontal ecological compensation between local governments, it is difficult to coordinate responsibilities between the damaged party and the beneficiary party due to the great differences of the regions involved in river basins. Thus, most areas are in a non-institutionalized and spontaneous exploratory stage that lacks clarity [23]. Specifically, most studies of China have measured compensation standards from the perspectives of pay-willingness, ecosystem service value, cost-benefit, etc. Although the pay-willingness method [24,25] has a strong theoretical basis, it is difficult to apply to the design of cross-regional watershed ecological compensation because it takes micro individuals as the research object, focusing more on their basic conditions and preferences. The ecosystem service value method is relatively simple, using a basis of ecosystem service value to determine the compensation standard. However, the calculated compensation amounts are too large to be accepted by the public [26,27]. Although the adjustment coefficient, sharing ratio and allocation coefficient have been successively applied to the adjustment of ecological compensation [28], the determination of these coefficients largely depends on people’s subjective intention and lacks a firm theoretical basis [29]. Opportunity cost method, as an input method, is relatively reasonable. However, it is impossible to determine whether providers have input resources according to the contract requirements and whether resources have produced environmental services required by the contract or not. In addition, the ecological compensation standard calculated by the input method lacks cost effectiveness compared with the output method [30,31]. To sum up, the existing algorithms on watershed ecological compensation amounts at home and abroad have mostly analyzed only the supply or demand of ecosystem service. However, the core of sustainable development in river basins is to realize the balance between supply and demand of ecosystem services. Therefore, this study proposed a new idea, considering the supply and demand of water yield service of regional ecosystem comprehensively. Moreover, we have used the output method to construct the pricing and compensation model to realize the balance between supply and demand of water yield service in river basins.
First, this study selected the Wei River basin as the research object and calculated the water supply and demand of each county in the basin by referring to existing study [32]. Then, we estimated the production elasticity of water by constructing a panel threshold model and calculated the price of water in different counties. Finally, the ecological compensation amount was calculated according to the gap between water supply and demand in the region to realize the optimal allocation of water yield service in space. This study aims at providing a scientific basis for the reasonable evaluation and guidance of ecological compensation practice and further promoting high-quality and sustainable development in river basins.

2. Materials and Methods

2.1. Methods

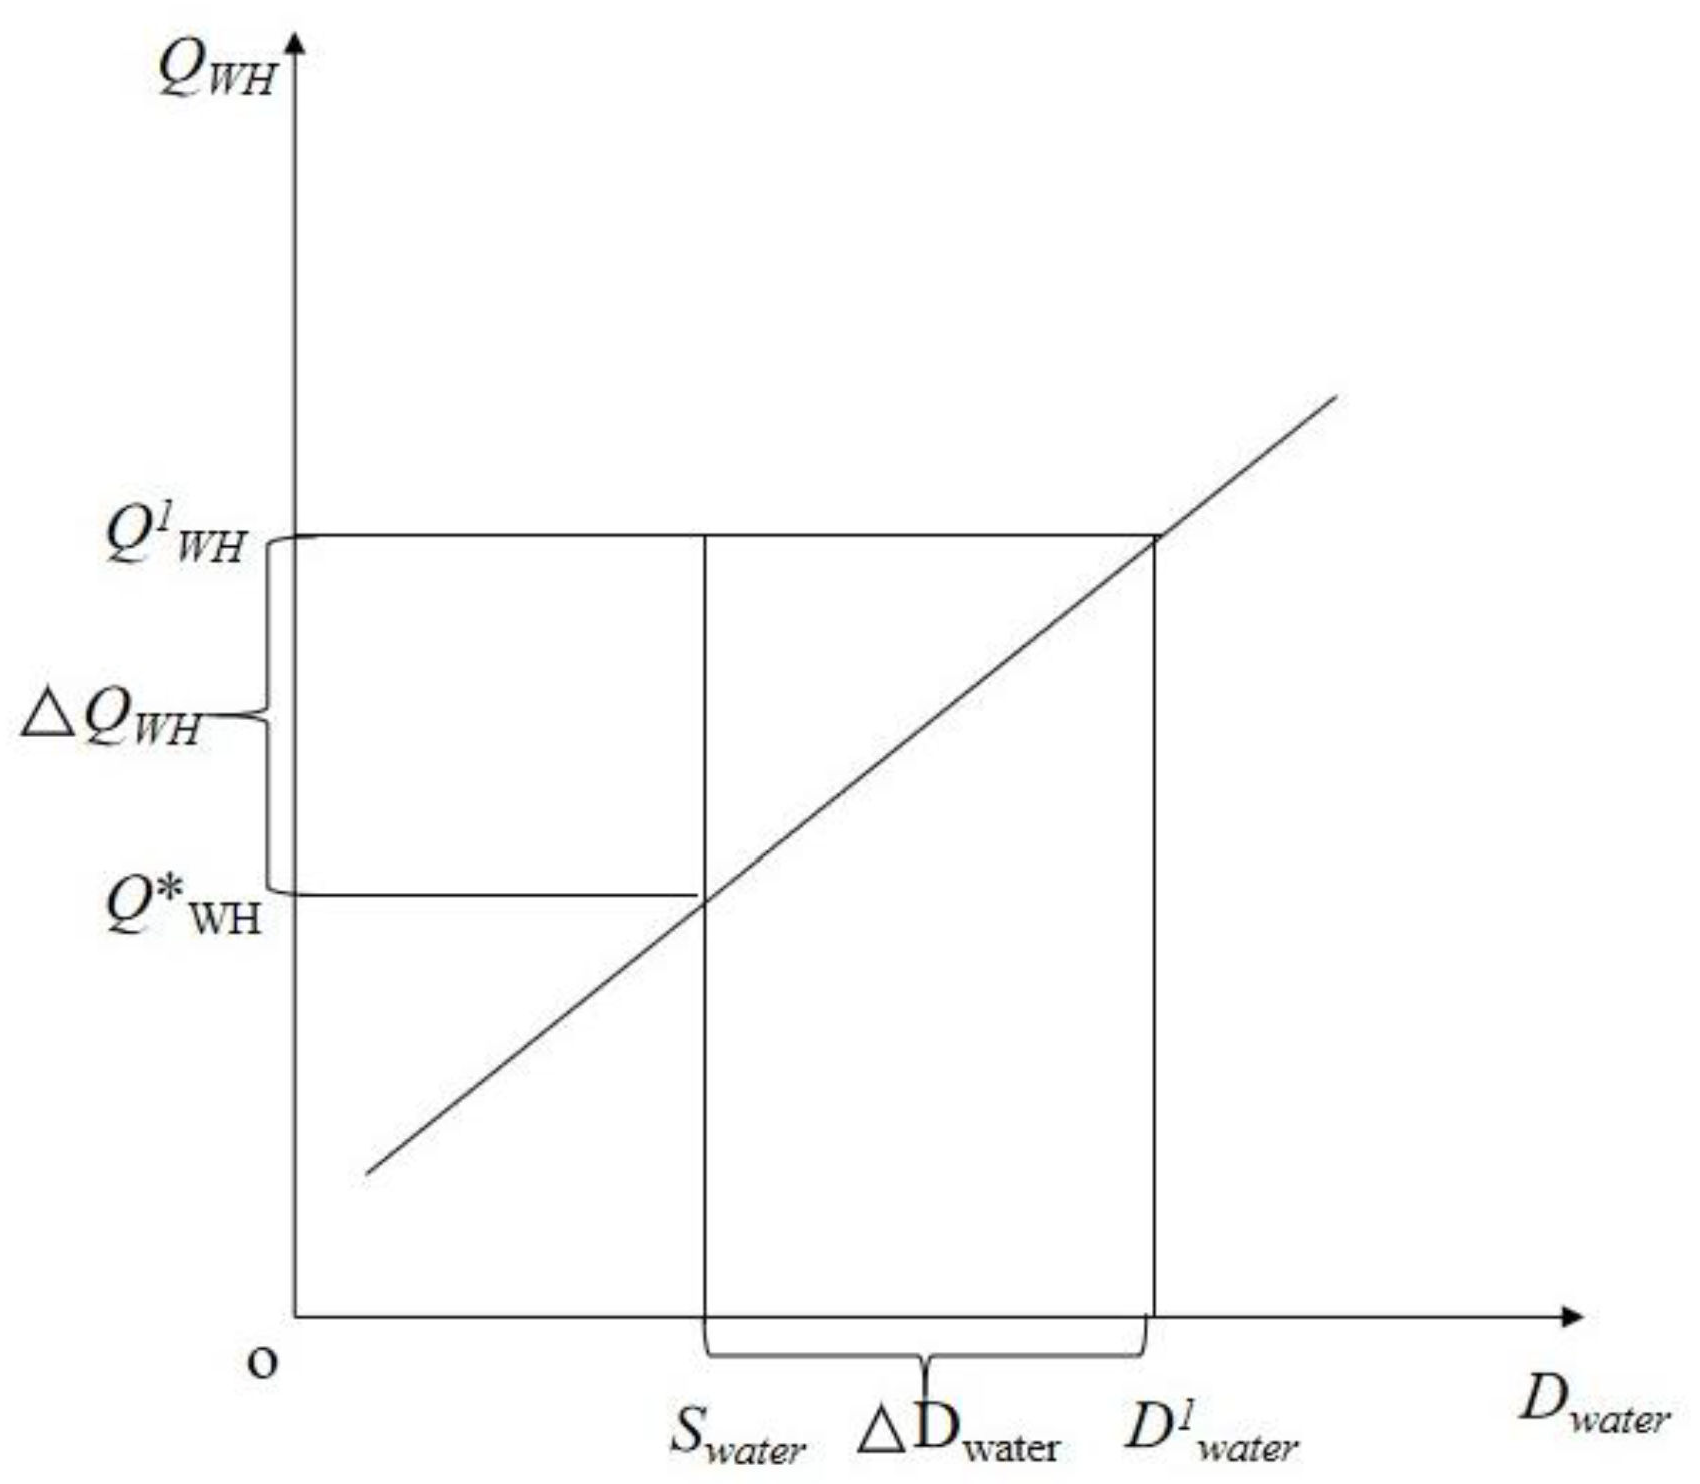
2.1.1. Theoretical Model

The human value of ecosystem goods and services is generated from natural capital (N) through ecological processes and functions according to the eco-economic transformation function:
E = r ( N )
where E represents ecosystem goods and services, N represents natural capital (ecosystem structure), which refers to the biological and abiotic components of ecosystem and environment, including living organisms, plants, air, water, minerals and physical space, etc. and r ( ) represents the eco-economic transfer function.
Having learned more about ecosystem goods and services and drawn on the typical standard production functions of traditional neoclassical economic theory, the neoclassical/ecosystem production function can be described as follows:
Q = Q ( E , K , L )
where Q represents the output of goods or services, K and L represent capital input and labor input, respectively, and others are the same as above.
Water is an important part of natural capital and ecological environment and it is also an indispensable natural resource for the development of the national economy [33]. Therefore, we regarded water as an important factor of production input and embedded it into the economic production function. Moreover, we expanded the basic economic production function in the following form:
Q = Q ( D w a t e r ,   K ,   L )
where D w a t e r represents the water demand in river basin and others are the same as above.
When other conditions remain unchanged, the substitution relationship between the output of goods or services and the input of water in the basin is as follows:
d Q d D w a t e r = Q D w a t e r
Ecosystem services are defined as the contribution of ecosystems to human wellbeing [1]. Among them, the supply of ecosystem services refers to the products and services provided by the ecosystem for human production. The demand of ecosystem services refers to the quantity consumed or expected by human beings [34]. Therefore, it is important to identify and balance the supply and demand of ecosystem services to maintain the sustainable development of the socio-economy and regional ecological security [35]. Therefore, on the premise of achieving balance between supply and demand of water yield service (Figure 1), the output of goods or services increased due to the excessive consumption of water in other regions can be calculated as follows:
Δ Q = Q D w a t e r × ( D w a t e r S w a t e r )

2.1.2. Estimation of Production Elasticity of Water Yield Service

Regional GDP refers to the total output of all resident units in an area of a certain period. The index can overcome the incomparable problem of products in different regions. Therefore, the regional GDP was used to measure the output of goods and services in the Wei River basin. The elements of production in economics indicate that capital and labor input are two important elements in the formation of GDP [36]. According with the research purpose, we chose the regional GDP of watershed as the explained variable and selected the input amount of water as the core explanatory variable and threshold variable. By sorting out relevant research [37,38,39], the general budget expenditure of local finance, the total fixed assets investment and year-end employed labor as control variables were utilized to represent the total expenditure level, total input level and agricultural labor input level, respectively. Based on the above expanded economic production function, this study integrates water elements into the economic production function and constructs model (1). The formula is as follows:
ln G D P i t = c i + β 1 ln D + β 2 ln E i t + β 3 ln K i t + β 4 ln L i t + ε i t
where ln G D P i t represents the regional GDP of county i and period t (logarithm). c i represents a constant, ln D i t represents the water input amount of county i and period t (logarithm), ln E i t represents the general budget expenditure of local finance of county i and period t (logarithm), ln K i t represents the capital input of county i and period t (logarithm), ln L i t represents the labor input of county i and period t (logarithm), ε i t is the random disturbance term and β 1 β 4 are the estimation parameters of the model.
In the short-term production function, the input elements generally follow the law of diminishing marginal return [40]. That is, the benefit of unit input elements on product output is decreasing, so the quadratic term of water elements is further introduced into model (2). The formula is as follows:
ln G D P i t = c i + β 1 ln D + α ln D 2 + β 2 ln E i t + β 3 ln K i t + β 4 ln L i t + ε i t
where α and β 1 β 4 are parameters to be estimated. Others are the same as above.
However, this nonlinear relationship may also appear in the form of threshold effect. Compared with the traditional linear model, the panel threshold model does not need to specify the nonlinear expression of the formula and the threshold value and its number are all determined by the sample endogeneity [30,41]. Therefore, we refer to the research of Hansen et al. [42] and establish a panel threshold regression model to estimate the production elasticity (model (3)) on the basis of the above extended economic production function. The formula is as follows:
ln G D P i t = c i + λ 1 ln D i t I ln D i t < γ + λ 2 ln D i t I ln D i t γ + β 2 ln E i t + β 3 ln K i t + β 4 ln L i t + ε i t
where I * is an indicator function. If it satisfies the conditions in parentheses, the function value is 1, or 0. γ is the threshold value, which is to be estimated. λ 1 λ 2 and β 2 β 4 are the estimation parameters of the model. Others are the same as above.

2.1.3. Pricing of Water Yield Service and Calculation of Compensation Amounts
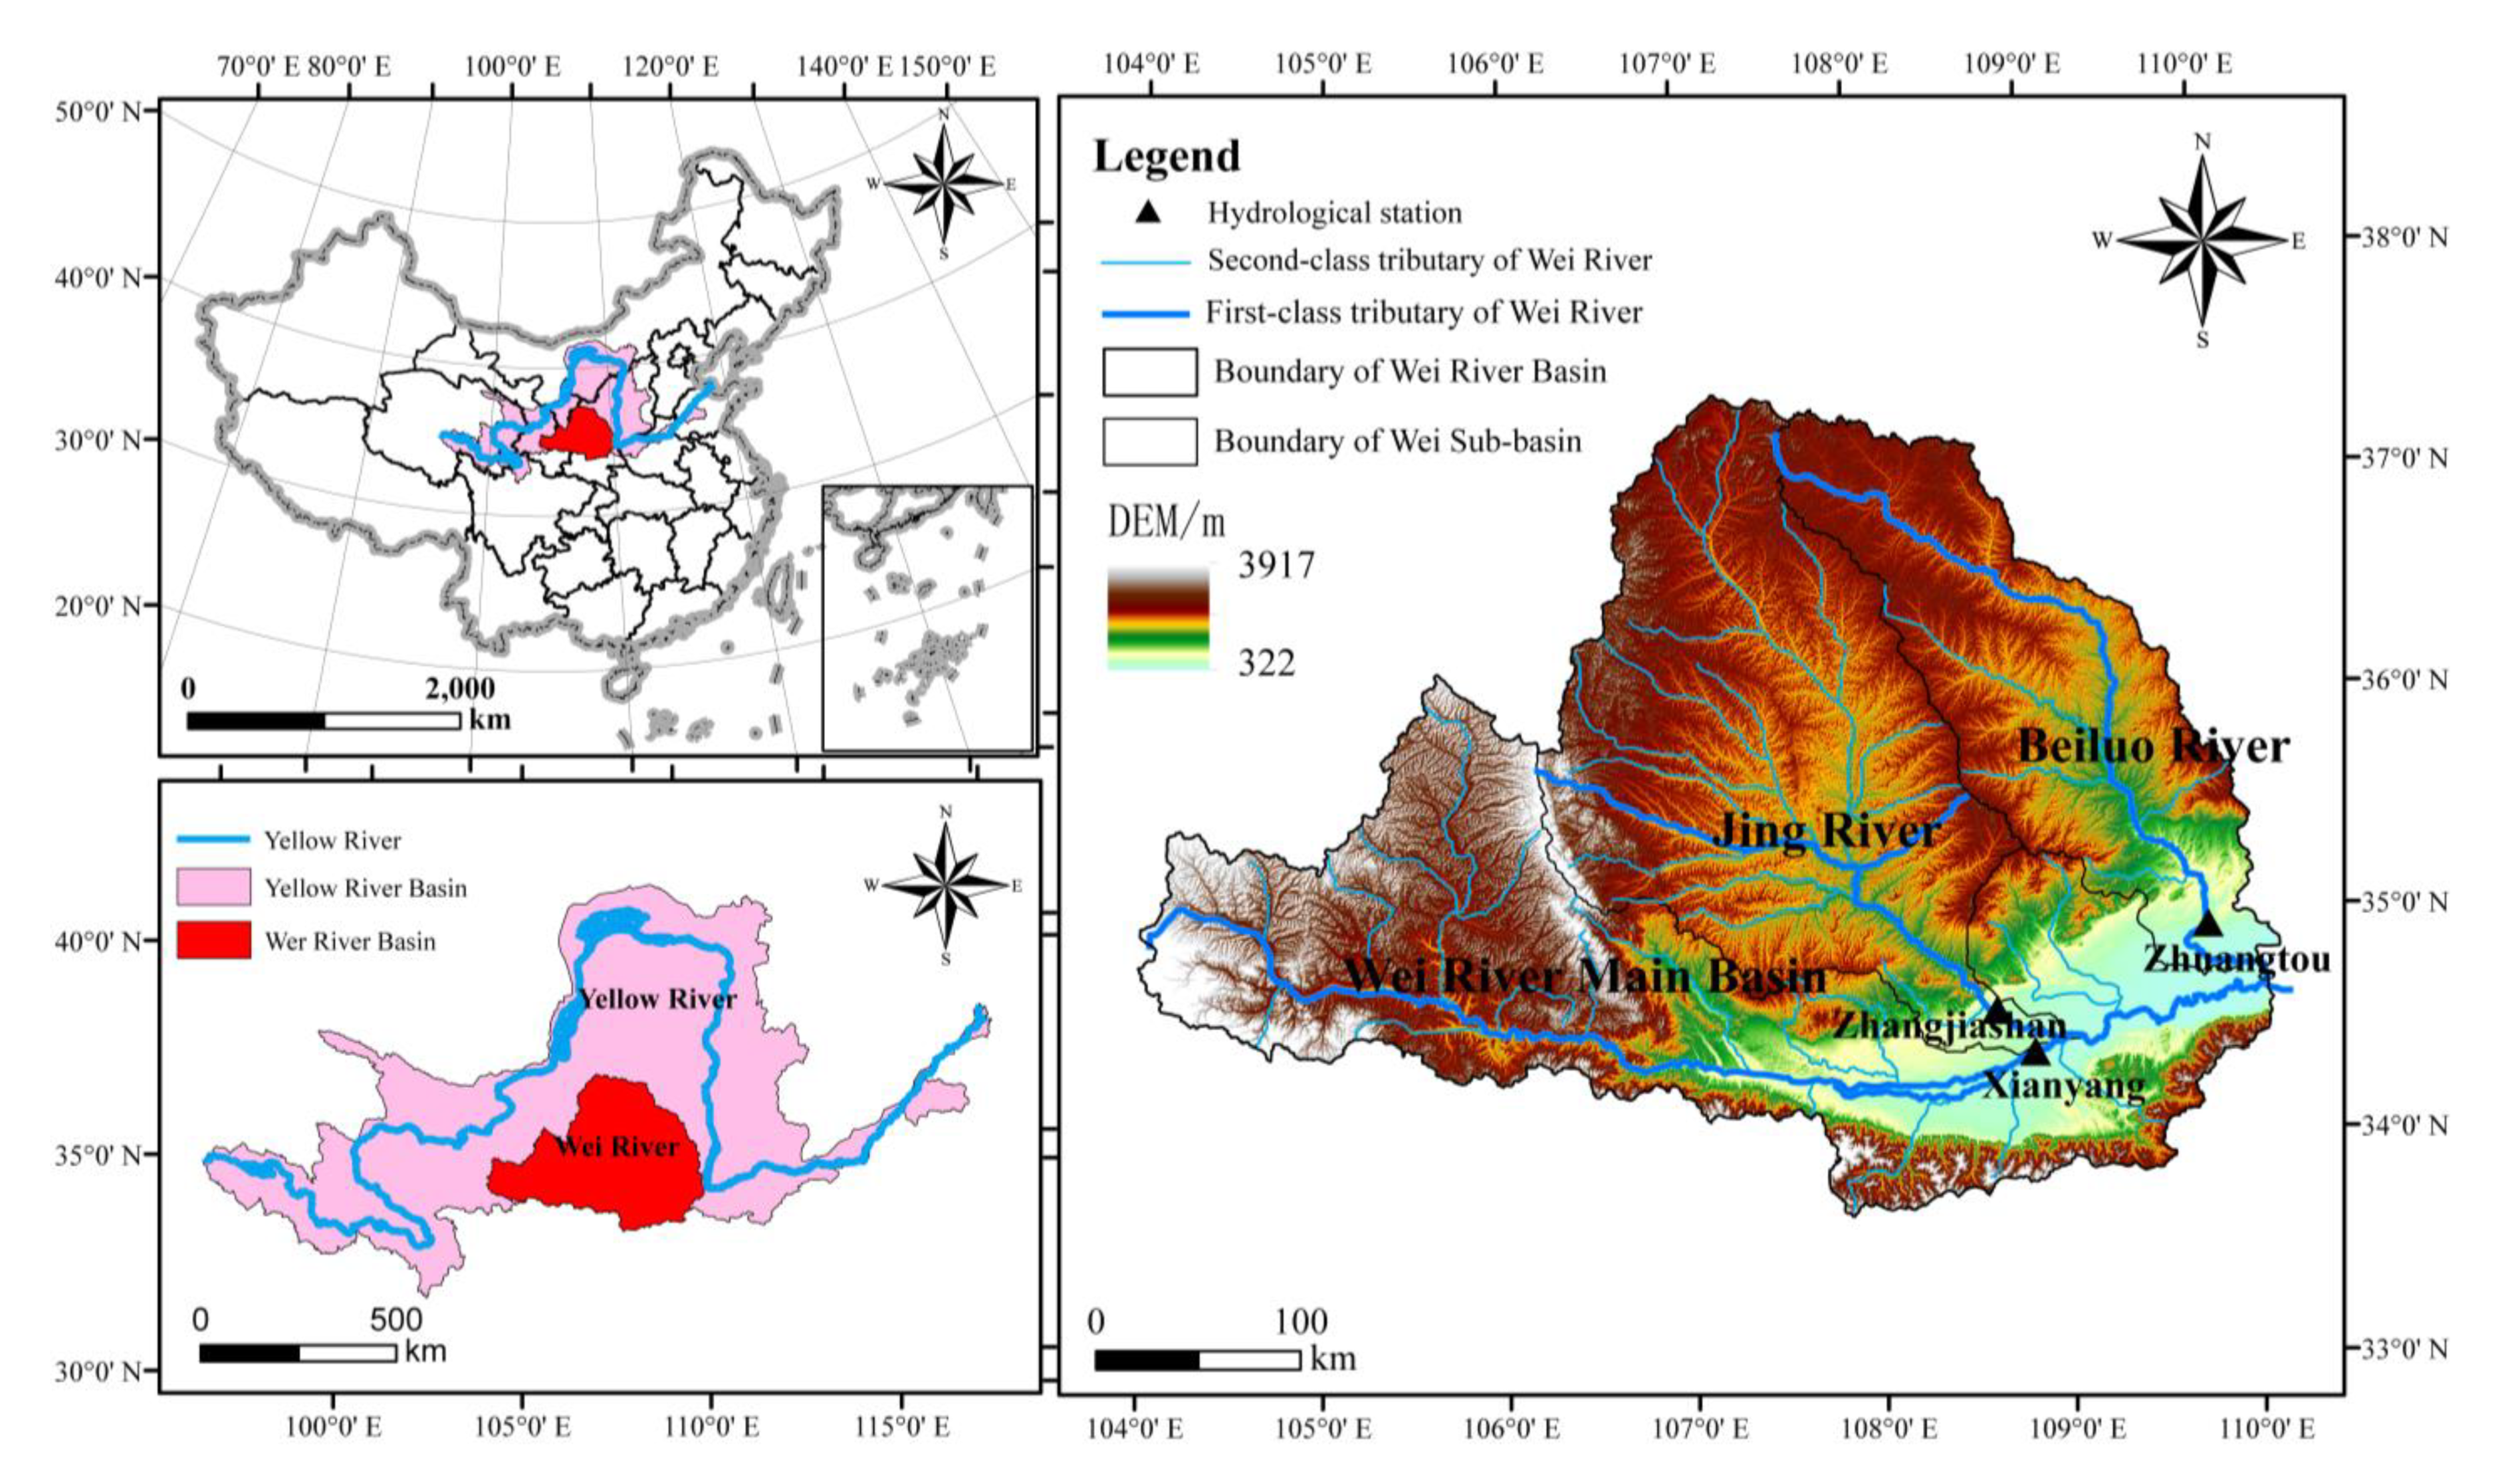
Price is the external embodiment of the intrinsic value of goods [43]. Therefore, the price of water yield service can be defined as the proportion of the change of unit regional GDP in the input of unit water elements. Then, we can estimate the water contribution to regional GDP through Formula (8). Formula (9) calculates the price of water yield service, as follows:
p i t = d G D P i t d D i t = λ × G D P i t D i t
where p i t represents the price of water yield service of county i and period t , λ represents the production elasticity of water yield service and others are as above.
To realize the balance between supply and demand of water yield service and the effective allocation of water, the compensation amounts should be calculated as the product of current price and regional deficit (surplus) of water yield service. The specific formula is as follows:
p a y m e n t i t = p i t × ( D i t S i t )
where p a y m e n t i t represents the compensation amounts of the county i and period t and S i t represents the amount of water supply of the county i and period t . Others are the same as above.

2.2. Study Area

The Wei River originates from the Niushu Mountain in Dingxi City, Gansu, China. It is the largest tributary of the Yellow River, with a geographical location between 34°~38° N and 104°~110° E (Figure 2). The river basin is high in the west and low in the east, and flows through arid and semi-arid areas. It spans the eastern part of Gansu, the south-central part of Ningxia and the central part of Shaanxi, with a total length of 211 km and an area of 132,600 km2. The tributaries of the Wei River basin mainly include the Jing River and the Beiluo River. The Wei River provides the basic water for the development of “Guanzhong–Tianshui Economic Zone” and it is also an important channel connecting the northwest and middle east of China [44]. In addition, it provides a guarantee for sustainable development along the river. Most areas of the region belong to the semi-arid and semi-humid climate in the warm temperate zone. The annual average precipitation accounts for 600 mm with a great inter-annual variation [45]. The annual average evaporation is 700–1200 mm, which is dramatically affected by climatic conditions [46]. The weather is hot and rainy in summer and cold and dry in winter, with an average temperature of 8~14 °C. The runoff is small and remains nearly unchanged under the influence of geographical and topographic elements, resulting in water shortages in the river basin. At present, the basin has not yet formed a unified and coordinated water resources management system. All regions and departments compete for water, resulting in serious disorderly diversions of water [47]. In addition, the water price in the Wei River basin is divided into three classes according to the demand of water consumption by residents, with prices ranging from CNY 3.80/m3 to CNY 7.18/m3. The current water price system cannot effectively play the role of economic leverage for regulation, due to its low price [48].

2.3. Data Source

The data mainly involved the following three types. (1) Simulated data of water supply. This study calculated the supply of water yield service by using the “water yield” sub-module of InVEST and the results were verified. The specific model principle and required data referred to the research of Li, Y., et al. [32]. (2) Simulated data of water demand. This study selected water as an important input variable of production elements to construct the econometric model. Ecological water was not included in calculation of GDP since it refers to the water needed to maintain the normal development and relative stability of ecosystems within a specific space and time range. Therefore, the demand for water yield service (i.e., the input of water resources elements) only took the water of industry, agriculture and daily life into account. These data were from the Water Bulletin of Shaanxi, Gansu and Ningxia, respectively. (3) Socio-economic data. We mainly selected the data of population, regional GDP, general budget expenditure of local finance, the total fixed assets investment and the number in the labor force. To make the price in different years comparable, we converted various index data of 2005, 2010 and 2015 to the price level of 2000 based on the consumer price indexes of Shaanxi, Gansu and Ningxia, respectively. All indicators were sourced from the Chinese County Statistical Yearbook. The data of household consumption index came from the National Bureau of Statistics. Although 2015 is a long way off, as the background notes, “China suffers from severe water shortages. The optimal allocation of water resources will be beneficial to the sustainable economic and ecological development of the basin”. Therefore, this study is not about short-term timeliness. We use the appropriate data to provide an important reference for the optimal allocation of regional water resources. The variable design and its descriptive statistics of this study are shown in Table 1.

3. Results

3.1. The Production Elasticity of Water Yield Service

At the core of determining the compensation amounts of water yield service is the estimated water price, which depends on the calculation of production elasticity (Table 2). First, we estimated the average value of production elasticity of water by using the ordinary fixed effect panel model (Model (1)). Second, considering that the influence of water on regional GDP in the Wei River basin had the law of diminishing marginal return, we introduced the quadratic term of water into the model (Model (2)). However, the quadratic model cannot solve the differential pricing problem of water yield service. As the law of diminishing marginal return may also appear in the form of the threshold effect, we introduced the panel threshold model (Model (3)).
In model (1), the F value was 449.67 (p = 0.00) and R2 was 89.4%. This indicated that, on the whole, the model fitted well. Water had a positive impact on regional GDP, but it was not statistically significant. Compared with model (1), the goodness-of-fit coefficient R2 of model (2) was improved after introducing the square term. The coefficient of the first and second term of water (logarithm) were 4.968 and −0.259, respectively. Both of them had passed the significance level test of 1%, which indicated that the influence of water on regional GDP presented an obvious inverted “U” shaped relationship. The input amounts (logarithm) of water corresponding to the inflection point at the highest point of the curve, which was 9.591. When it was lower than 9.591, the increase in water would contribute to the promotion of regional GDP. When it was higher than 9.591, its marginal benefit would gradually weaken with the increase in water, which accorded with the law of diminishing marginal return to scale [49,50]. However, the quadratic term cannot solve the problem of differential pricing of water yield service. Thus, we introduced the panel threshold model (model (3)).
It is necessary to test the threshold regression before using the panel threshold model. The inspection process included two steps. The first step was to test whether the threshold effect existed. If it did, the threshold value should be further estimated. The second step was to test the significance level of the threshold effect. We tested the water threshold effect by referring to existing studies [42,50]. The result showed that F value of the single threshold model rejected the original hypothesis at the level of 1% and passed the significance level test. Additionally, the water (logarithm) threshold value was 9.449, which was within the confidence interval of 95% significance level. This indicated that water had a nonlinear impact on regional GDP and that the threshold model was superior to the linear model. The result of Model (3) showed that the water (logarithm) estimation coefficient passed the significance level test of 1%. When the water (logarithm) was lower than 9.449, the estimated coefficient was 0.493. In this stage, the increase in water would promote the development of the regional economy. When the water (logarithm) was higher than 9.449, the estimated coefficient was 0.454. In this stage, the increase in water would continue to promote the development of the regional economy, but the rate would weaken to some extent. To sum up, the impact of water input on regional GDP was a nonlinear change law.
Afterwards, we examined the effect of control variables on regional GDP. The general budget expenditure of local finance had a significant positive impact on regional GDP. The coefficient was 0.534, passing the significance level test of 1%. Namely, every 1% increase in the general budget expenditure of local finance would lead to an average increase of 0.534% on regional GDP under other conditions remaining unchanged. Furthermore, the total fixed asset investment also had a positive impact on regional GDP. Every 1% increase in the total fixed asset investment would lead to an average 0.1% increase on regional GDP under other conditions remaining unchanged. Although the labor force had a positive effect on regional GDP, it was not statistically significant. This may be related to the low dependence of current socio-economic development on labor force. On the one hand, the socio-economic development increasingly depended on the improvement of innovation ability of science and technology and foreign trade transactions. On the other hand, workers’ qualities and skills were more significant when it came to their selection. [51,52].

3.2. Temporal and Spatial Distribution Characteristics of Price of Water Yield Service

After using the panel threshold model to estimate the production elasticity of water yield service, we used Formula (9) to calculate the price of water yield service of each county in the region. Then, median clustering method was utilized to conduct a cluster analysis. Finally, we used ArcGIS for spatial analysis, as shown in Figure 3.
From the perspective of time, the water price showed a rising trend. In 2015, the price was CNY 47.27/m3, which increased by CNY 39.03/m3 compared with 2000 (CNY 8.24/m3), with an annual average growth rate of 13.28%. For the provinces in the region (Shaanxi, Gansu and Ningxia), their water price also showed an upward trend. Among them, Shaanxi had the highest price, which was CNY 10.82/m3 in 2000, CNY 7.45/m3 and CNY 9.65/m3 more than Gansu and Ningxia in the same period, respectively. By 2015, it had increased to CNY 60.38/m3, with an annual average growth rate of 13.07%. Gansu came to the second, with the price of CNY 3.37/m3 in 2000 and CNY 28.25/m3 in 2015. The water price in Ningxia was the lowest, which was only CNY 1.17/m3 in 2000 and then increased to 9.37 CNY/m3 in 2015.
From the perspective of space, the water price in the region generally presented a distribution pattern that was higher in the southeast and lower in the northwest. This study divided the region into five categories as following by clustering: low value region (CNY 0.249–6.675/m3), lower value region (CNY 6.675–16.768/m3), middle value region (CNY 16.768–33.981/m3), higher value region (CNY 33.981–77.476/m3) and high value region (CNY 77.476–186.006/m3). Among them, the low value was mainly concentrated in the central and western areas of the region and, with the advance of time, the number of low-value counties in the period generally showed a decreasing trend. Specifically, the counties with low price accounted for 80% in 2000, but only four counties (Xiji, etc.) with low price accounted for less than 5% in 2015. This indicated that the economy of each county had been significantly improved with the rapid development of urbanization. The high-value areas were mainly distributed in northern Shaanxi and the main urban area of Xi’an in Guanzhong of Shaanxi. The spatial evolution law showed a distribution from point-like to block-like. Among them, the water price of northern Shaanxi (Jingbian, Wuqi, etc.) began to significantly increase after 2005, which may be caused by the rapid economic growth of the region. According to the statistics, the annual average growth rate of GDP in these regions was above 35% from 2000 to 2005, among which Jingbian county was as high as 60.09%. However, the mean value of Shaanxi increased from CNY 1.97 billion in 2000 to CNY 4.036 billion in 2005, with an annual average growth rate of only 15.43%. Additionally, Xi’an had the highest price because it had dense population, a complex industrial structure and, relatively, the highest economic development [53]. The region did not involve high-value areas in 2000. By 2015, the number of high-value counties accounted for about one-fifth of the total and the highest average price in counties reached CNY 186.006/m3.

3.3. Temporal and Spatial Distribution Characteristics of Compensation Amounts of Water Yield Service

After obtaining the water price, we calculated the compensation amounts of each county in the region according to Formula (10). Then, we also did a cluster analysis by taking the balance between supply and demand as the standard of dividing payment areas (supply is less than demand) and acceptance areas (supply is greater than demand). Finally, we used ArcGIS to obtain the clustering feature distribution of local spatial autocorrelation (LISA) of compensation amounts in the region. We carried out spatial classification display through the visualization function of ArcGIS, as shown in Figure 4.
From the perspective of time, the county number of acceptance and payment in the region did not change significantly. From 2000 to 2015, the number of acceptance counties were 25, 24, 21 and 21, respectively, while the number of payment county was basically stable at about 70. In contrast, the water compensation amounts had changed significantly. The payment increased from CNY 33,195.5 billion in 2000 to CNY 227,130.2 billion in 2015, with an annual average growth rate of 14.72%. The acceptance was relatively low, increasing from CNY 2922.2 billion in 2000 to CNY 16,398.6 billion in 2015, with an increase of CNY 13,476.4 billion.
From the perspective of space, counties located in the payment areas with the largest proportion (CNY 0~31.9805 billion) accounted for two-thirds of the whole region. Specifically, the low-value areas of payment (CNY 0~1.2715 billion) were mainly concentrated in the northwest of the region and a few were scattered in the Guanzhong of Shaanxi. The median areas of payment (CNY 1.2715~5.8086 billion) were mainly distributed in the southeast of the region and increased with fluctuation during the period. In 2000, the number of payment county in median areas accounted for 7.246%, but accounted for 54.17% in 2015. The high-value areas of payment (CNY 58.086~31.9815 billion) accounted for the smallest proportion. In 2000 and 2005, the high-value areas were not involved. In 2010 and 2015, the high-value areas were mainly concentrated in the main urban area of Xi’an. This indicated that Xi’an had a relatively high economic development, large population density and rapid development of enterprises and its water demand was far higher than its supply. The acceptance areas (CNY −41.448~0 billion) were relatively small, accounting for one-third of the region, and mainly distributed in the southwest and northeast of the region. The economy in these areas was relatively undeveloped and the water demand was small. Specifically, the low-value areas (CNY −219.7~0 million) showed a decreasing trend during the study period, declining from 19 counties in 2000 to 5 counties in 2015. The median value areas (CNY −5.308~−219.7 million) were mainly scattered and the county number increased first and then decreased, showing an inverted U-shaped trend. The high-value areas (CNY −41.448~−530.8 million) mainly appeared in 2005, 2010 and 2015, and accounted for 47.62% in 2015. Further, according to the LISA cluster diagram, we divided the compensation amounts of water into five categories in the Wei River basin: high-high, high-low, low-high, low-low agglomeration and insignificant. Except for the insignificant counties, the spatial agglomeration characteristics were basically stable. The high-high agglomeration was mainly concentrated in developed areas (Xi ‘an, Shaanxi). The low-low agglomeration was mainly distributed in Ganquan, etc. The spatial agglomeration effects of high-low and low-high types were not obvious and only changed significantly in local areas.

4. Discussion

This study explained how to realize water optimal allocation in river basins and provided a scientific basis to establish a reasonable compensation standard. Unlike previous studies, this study included the following two aspects: (1) We selected water as an important production input element to construct an economic production function by expanding the eco-economic transfer function. Then, we calculated the price of water yield service based on the production elasticity of water. (2) We constructed a theoretical model of compensation standard of water yield service to achieve the balance between supply and demand. To sum up, the pricing method that we constructed can guide the future research of related ecosystem services. This can also enrich the theory of compensation standards for ecosystem services in river basins. Furthermore, the results of this study offer references for future research.
We conducted the research of pricing and compensation amounts of water yield service from three perspectives. The first is the economic production function. We found that the marginal benefit showed an increased trend first and then decreased with the increase in water, which was in line with the law of diminishing marginal return in economics [49,50]. The second is the price of water yield service. The current water price in China is relatively low and not enough attention has been paid to the importance and scarcity of the water in river basins. Therefore, phenomena such as excessive utilization, waste of water, etc., had emerged gradually [11,12]. These behaviors further lead to a series of environmental problems such as water shortage, unreasonable allocation of water and serious pollution in water environment. To assist the Chinese government in alleviating these problems and achieving the balance between supply and demand of water yield service, we selected water as one of the important input elements in the economic production function and then stripped its marginal contribution based on the contribution degree of water to the economy. We then calculated the water price of the region. The results showed that water price was relatively higher than the current price, which would raise individual awareness of the significance of water and slow down the waste of water. More importantly, the water price in Jingbian and Wuqi districts in northern Shaanxi had increased significantly since 2005 (Figure 3). The reason was that, as statistics showed, the annual growth rate of GDP reached over 35% in these regions from 2000 to 2005. Thus, the results were more consistent with the actual situation in China. The third perspective is from the balance between supply and demand. The results indicated that the payment areas were mainly concentrated in developed areas of the southeastern river basin and the acceptance areas were mainly distributed in undeveloped areas of the southwestern and northeastern river basin (Figure 4). The conclusion is the same as the study of Wang, Y. et al. [54]. Moreover, as the capital city of Shaanxi, Xi‘an has a large population density, intensive industry and the highest level of economic development. so, Xi’an became the main area with high value of payment as water demand largely exceeds supply. The fourth perspective is from the output method. Compared with existing research on methods of pricing compensation amounts in river basins, we used production function to calculate the water price and, in addition, determining the compensation standard of the watershed according to the balance between supply and demand. Furthermore, we used ArcGIS to analyze regional heterogeneity and efficiency equity comprehensively, which would be beneficial to the incentive effect and the sustainability of compensation in river basins.
This study still has some limitations. Data of the first-level types of land use utilized in InVEST model may lead to information loss. For example, we did not consider differences between new forest and old-growth forest and the species of the different forests. In addition, this study only considered the water stock state in the counties without considering the influence of its flow and regional water regulation projects, which may affect the accuracy of the results. Moreover, the government should establish an ecological compensation mechanism for water yield service in the river basin. This mechanism should take the horizontal as the main vertical and the water quality as the supplement. Furthermore, it is worth developing a coordination mechanism for water yield service in river basins in consideration of water rights, pollution emission rights and other trading systems.

5. Conclusions

This study established a theoretical model to determine a pricing mechanism and compensation amounts to achieve the balance between the supply and demand of water yield service. Then, we estimated the price and compensation amounts of water yield service of the Wei River basin in China. The main conclusions were as follows:
(1)
The water had a positive impact on regional GDP in the Wei River basin and followed the law of diminishing marginal return with the form of the threshold effect. When the water (logarithm) was lower than 9.449, the production elasticity was 0.493. However, when the water (logarithm) was higher than 9.449, the production elasticity was 0.454.
(2)
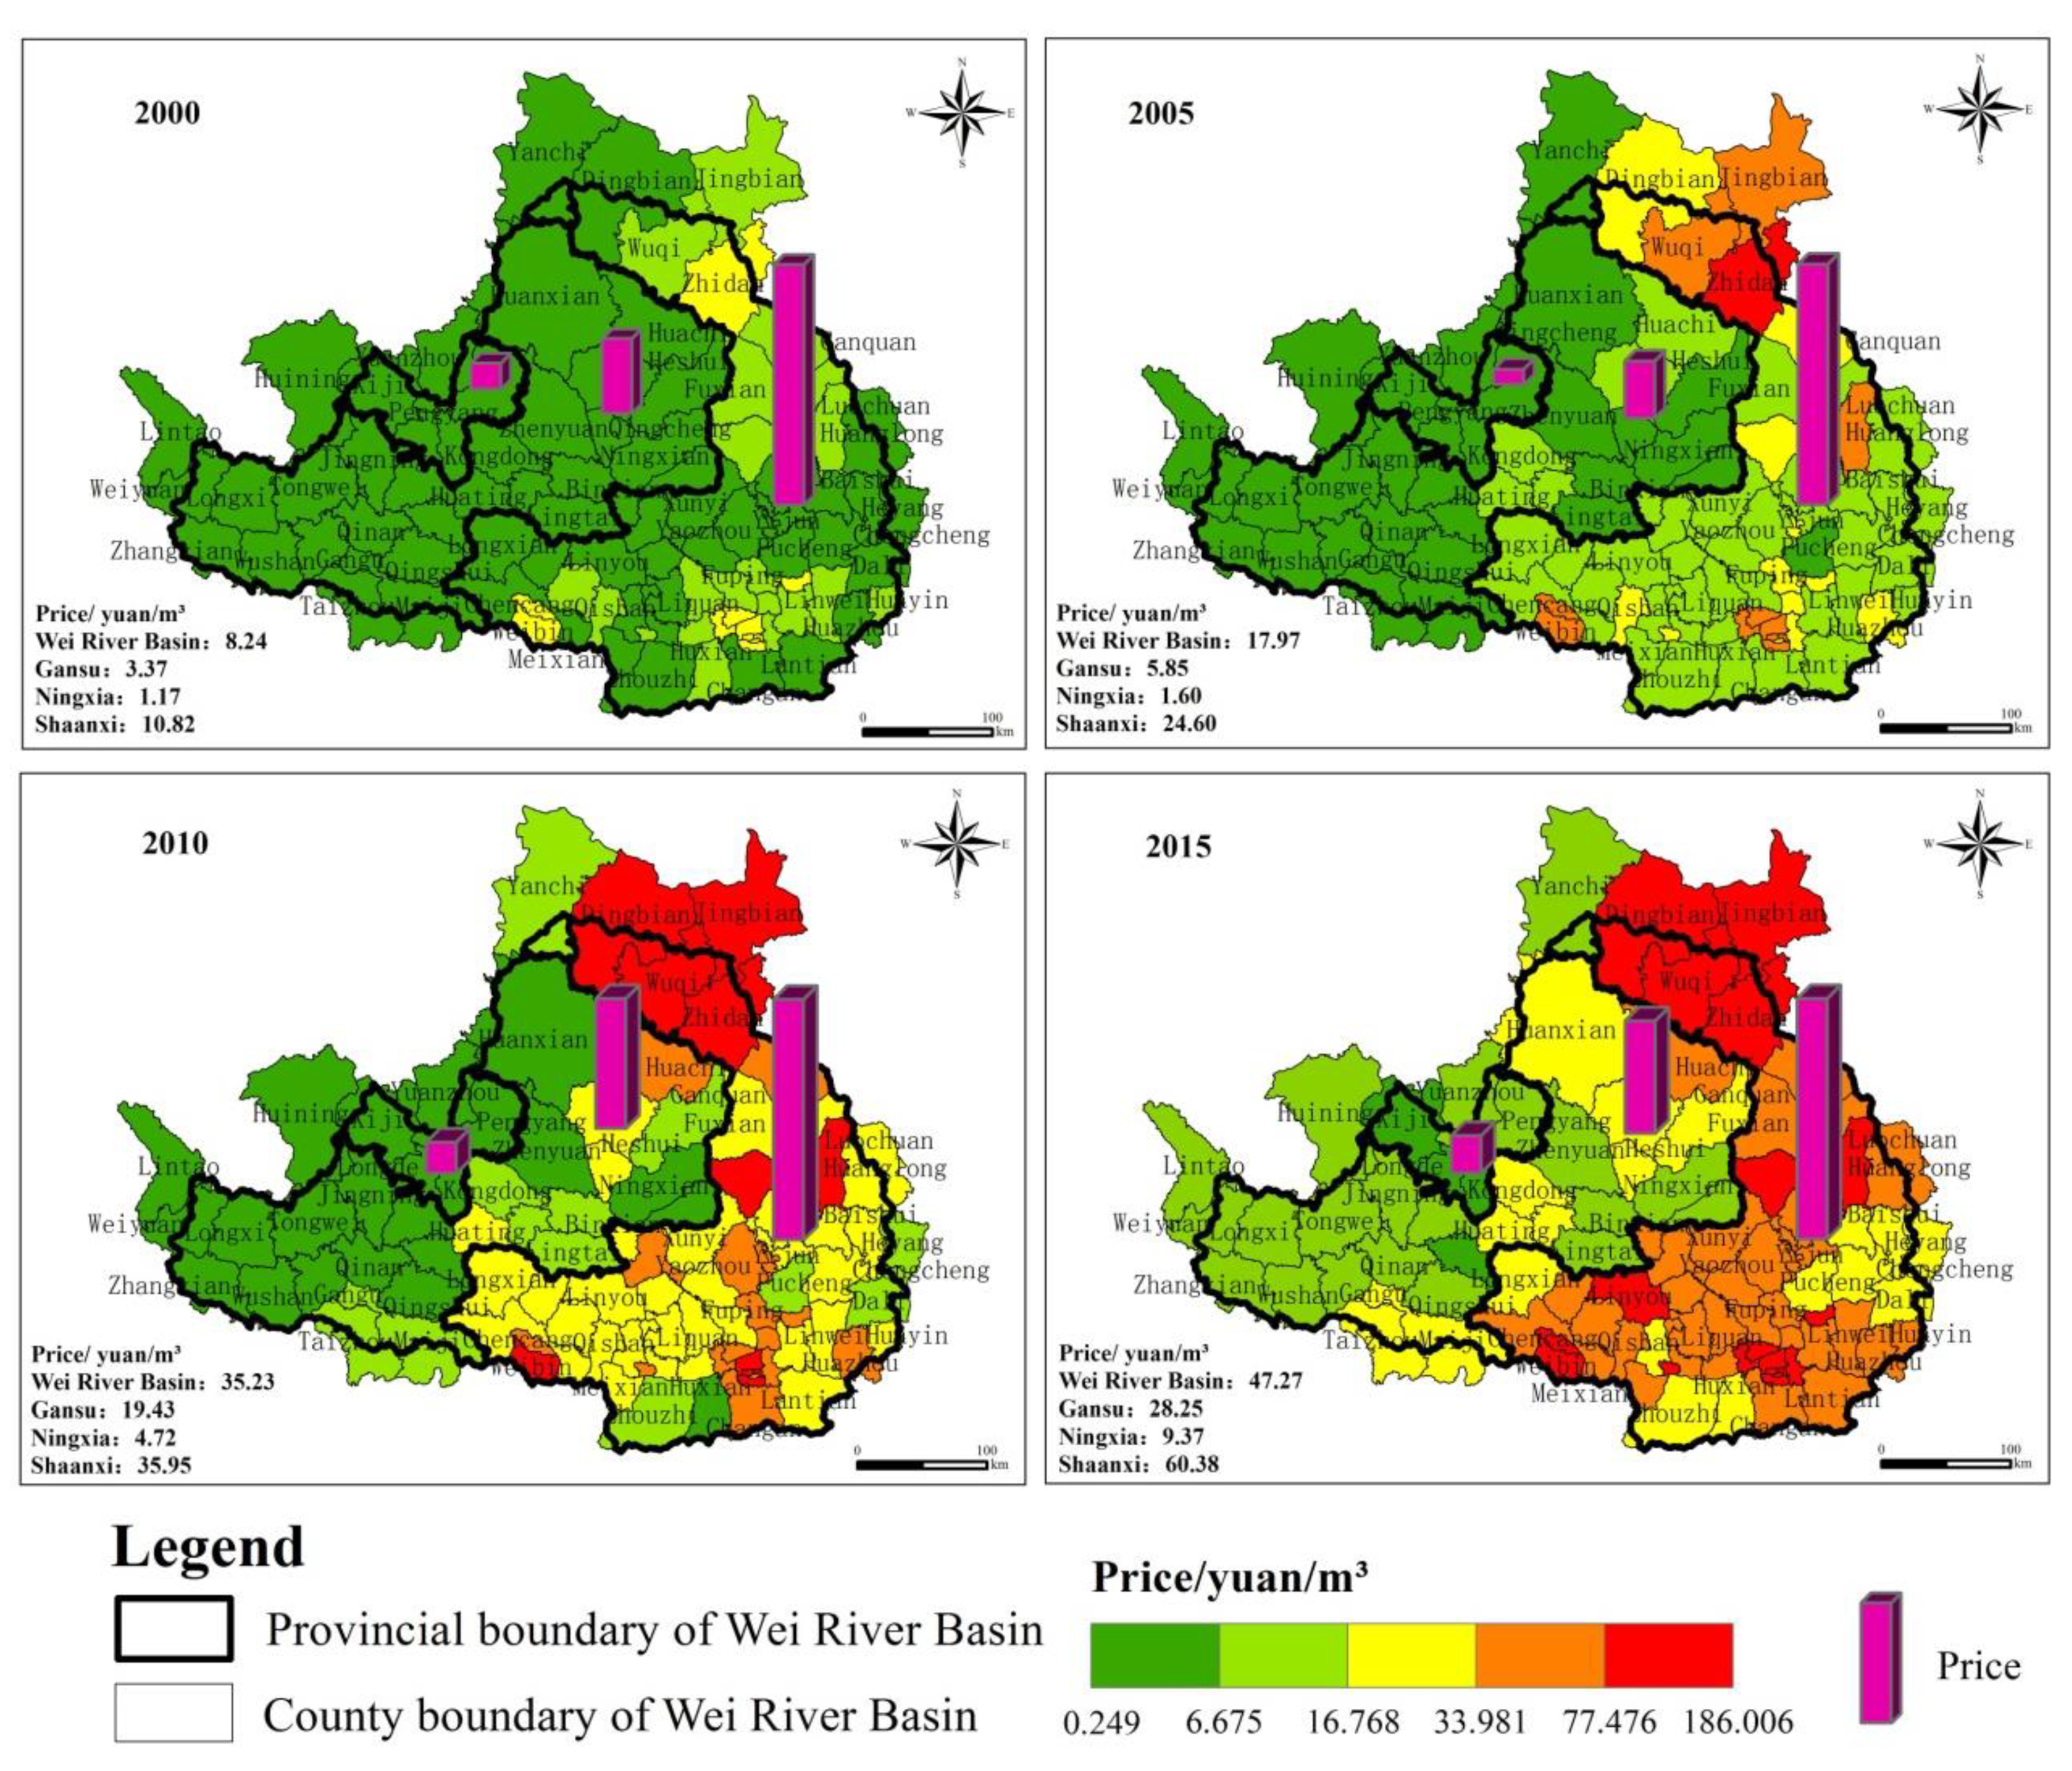
The price of water yield service in the Wei River basin showed an upward trend with a spatial distribution pattern that was high in the southeast and low in the northwest. The annual price in 2015 was CNY 47.27/m3, 472.937% higher than that of 2000 (CNY 8.24/m3). The high-value areas were mainly situated at the vicinity of Xi’an, while the low-value areas were mainly distributed in the western undeveloped region.
(3)
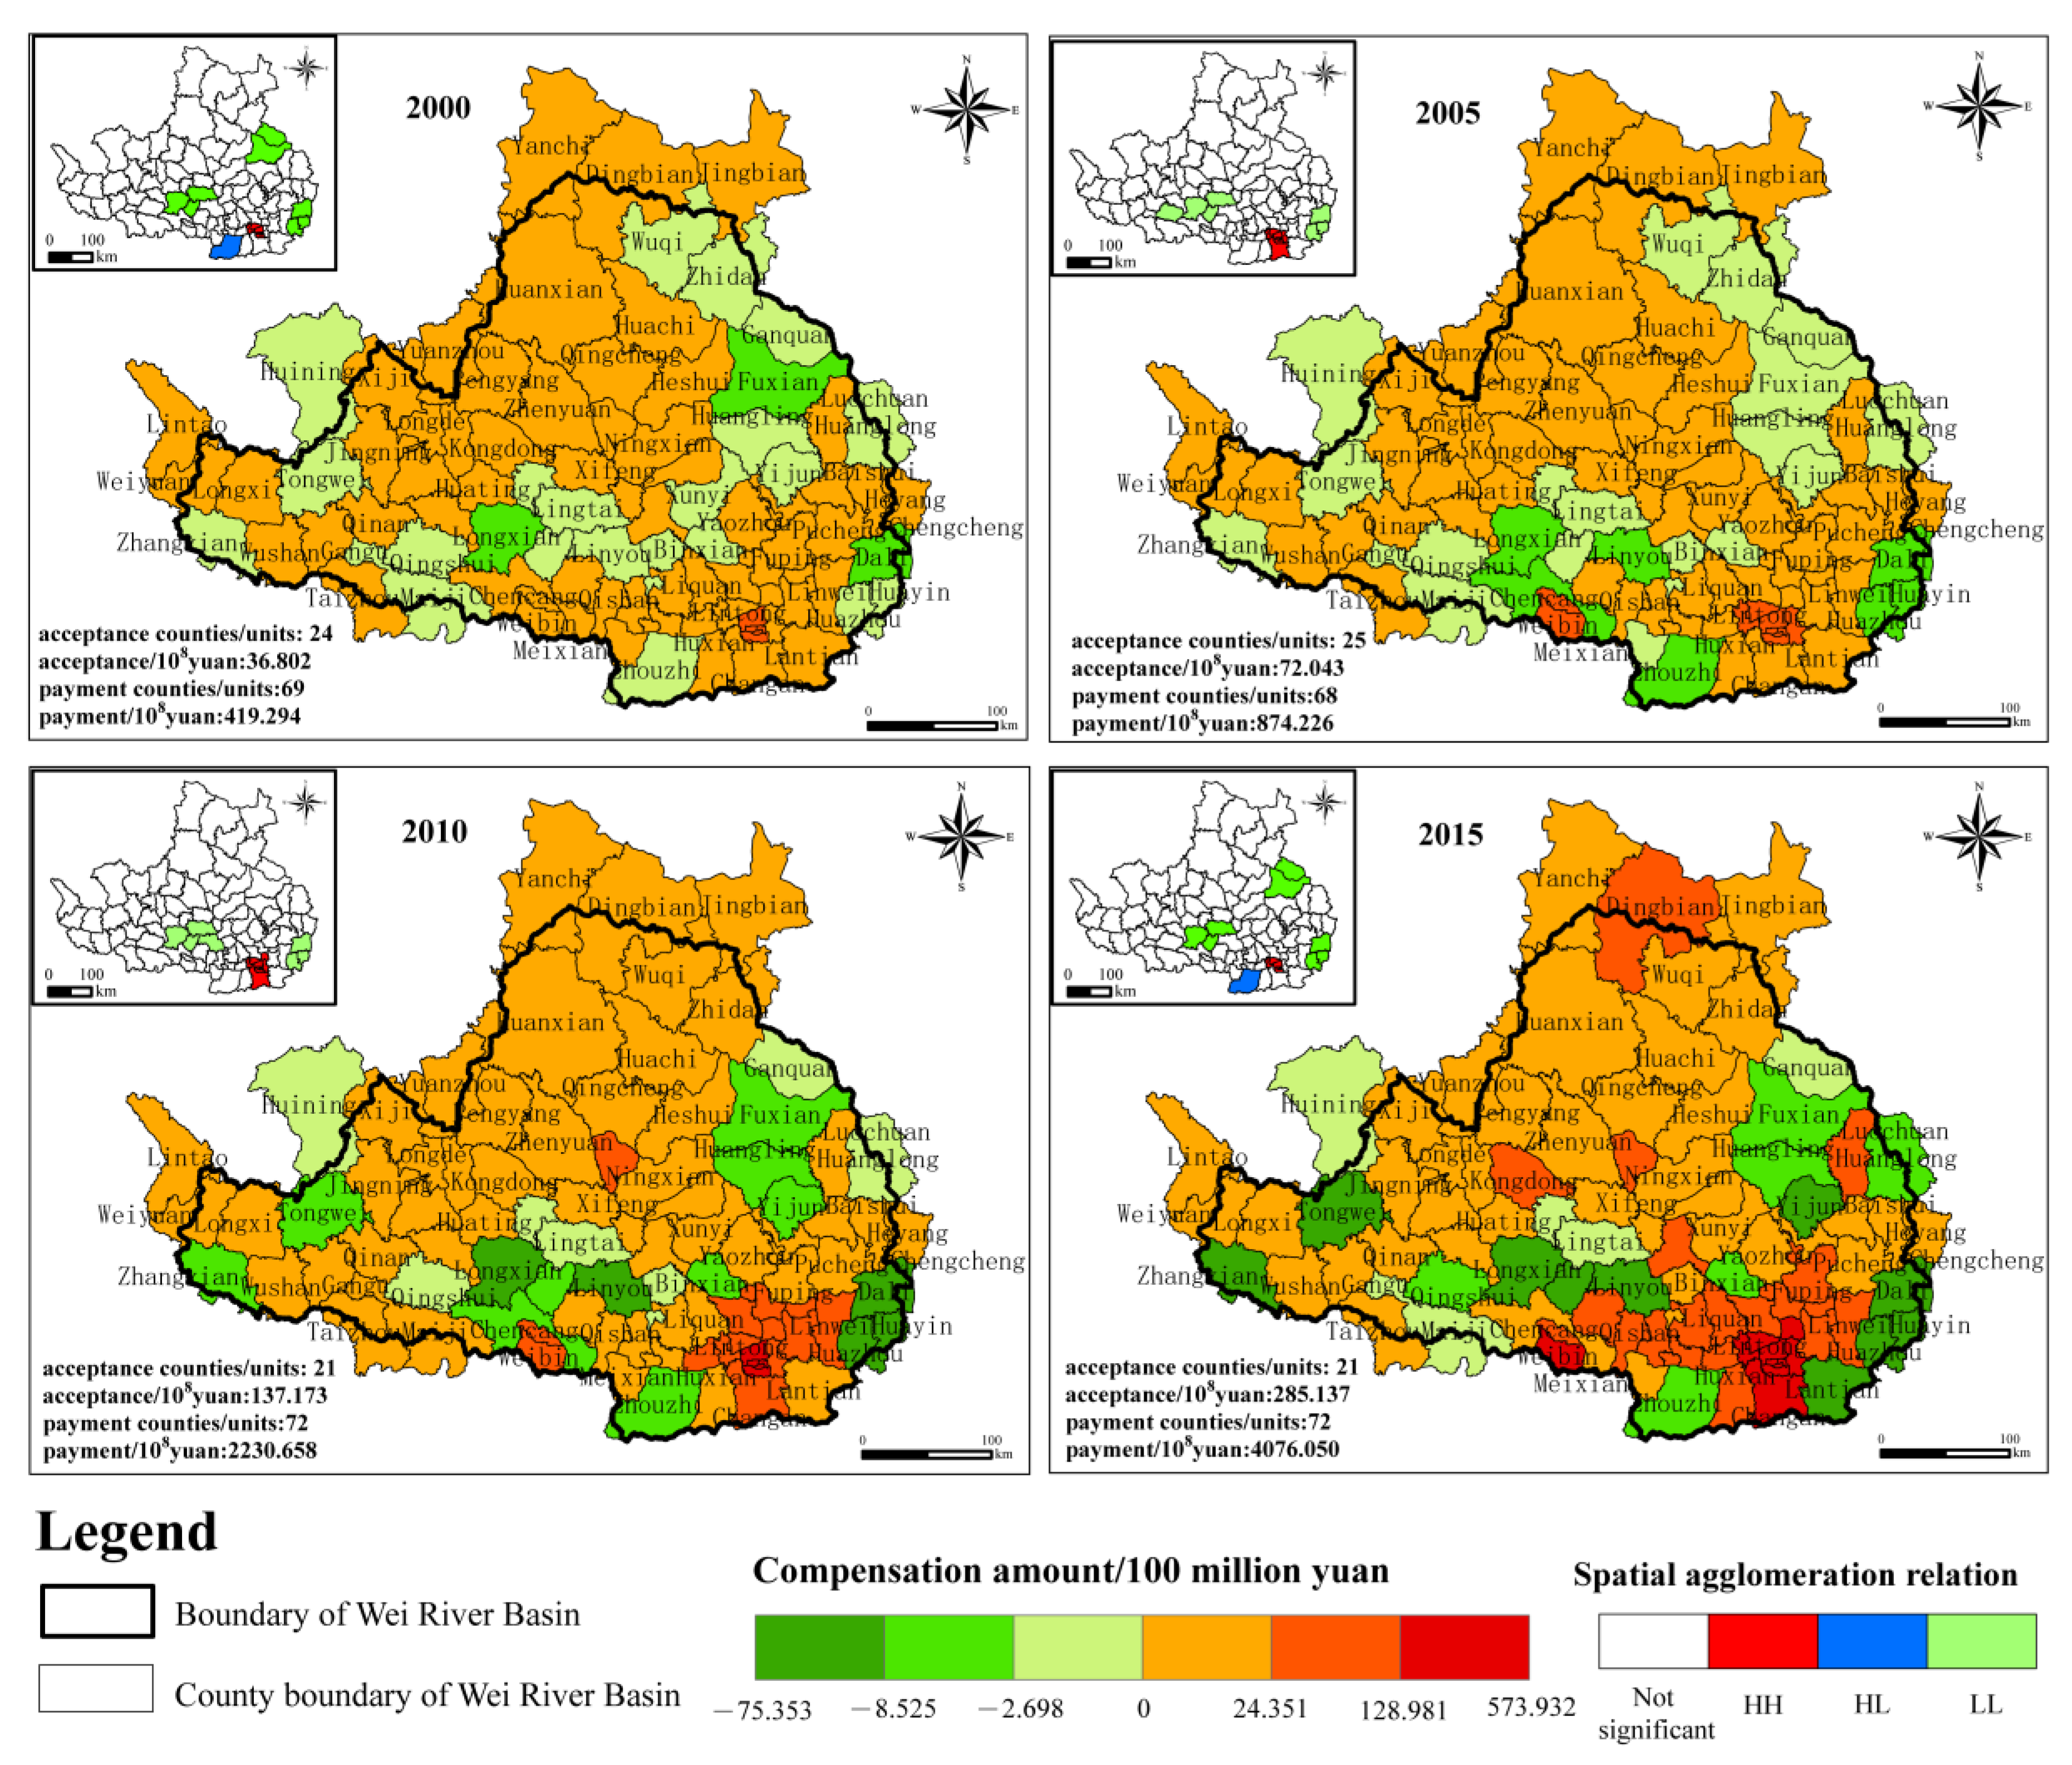
The Wei River basin was divided into payment areas and acceptant areas through taking the balance between supply and demand as the critical point. We found the total compensation amounts showed an increasing trend during the study period. Among them, the total payment increased from CNY 33,195.5 billion in 2000 to CNY 227,130.2 billion in 2015, with an annual average growth rate of 14.72%. The total acceptance increased from CNY 2922.2 billion in 2000 to CNY 16,398.7 billion in 2015, with a cumulative increase of CNY 13,476.5 billion. For spatial distribution, the payment areas were mainly distributed in developed regions and the acceptant areas were mainly distributed in undeveloped regions. This was consistent with the spatial distribution pattern of the water yield service price.

Author Contributions

Conceptualization, Y.L.; methodology, Z.D.; software, Y.L. and Z.D.; Data collection, L.J. and C.C.; resources, Y.D.; writing–original draft preparation, Y.L.; writing–review and editing, Z.D., S.Y. and C.X.; language, X.Z.; funding acquisition, C.X. All authors have read and agreed to the published version of the manuscript.

Funding

This study was funded by the National Natural Science Foundation of China “Research on the mechanism and policy optimization of the impact of environmental awareness and skills on Farmers’ Pro environmental behavior: Taking the production of non wood forest products in Qinba mountain area as an example” (No. 71873102).

Institutional Review Board Statement

Not applicable.

Informed Consent Statement

Not applicable.

Data Availability Statement

The data sets provided in the study are included in the article materials. For further enquiries, please contact the corresponding author.

Acknowledgments

This study would like to thank Zhenmin Ding, Shunbo Yao, Caixia Xue, Yuanjie Deng, Lei Jia, Chaoqing Chai and Xiao Zhang for giving a lot of advice and ideas.

Conflicts of Interest

The authors declare no conflict of interest.

References

  1. Costanza, R.; D’arge, R.; De Groot, R.; Farber, S.; Grasso, M.; Hannon, B.; Limburg, K.; Naeem, S.; O’neill, R.V.; Paruelo, J. The value of the world’s ecosystem services and natural capital. Nature 1997, 387, 253–260. [Google Scholar] [CrossRef]
  2. Chien, H. Evaluating impacts of researchers to enable sustainability transition: Using urban ecosystem service literature as an exemplary field. Environ. Dev. Sustain. 2022, 24, 2345–2361. [Google Scholar] [CrossRef]
  3. Cheng, Q.; Zhou, L.; Wang, T. Assessment of ecosystem services value in Linghekou wetland based on landscape change. Environ. Sustain. Indic. 2022, 15, 100195. [Google Scholar] [CrossRef]
  4. Jaung, W.; Carrasco, L.R.; Richards, D.R.; Shaikh, S.F.E.A.; Tan, P.Y. The role of urban nature experiences in sustainable consumption: A transboundary urban ecosystem service. Environ. Dev. Sustain. 2022, 1–21. [Google Scholar] [CrossRef]
  5. Dai, E.; Wang, Y. Spatial heterogeneity and driving mechanisms of water yield service in the Hengduan Mountain region. Acta Geogr. Sin. 2020, 75, 607–619. [Google Scholar]
  6. He, W.; Song, G. Evaluation of urban water resources utilization efficiency and water demand estimation in Hebei Province. Acta Sci. Circum. 2018, 38, 2909–2918. [Google Scholar]
  7. Martin, J.F. Emergy valuation of diversions of river water to marshes in the Mississippi River Delta. Ecol. Eng. 2002, 18, 265–286. [Google Scholar] [CrossRef]
  8. Zhen, J.; Lim, T.C.; Lu, G. Determination of system vibratory response characteristics applying a spectral-based inverse sub-structuring approach. Part I: Analytical formulation. Int. J. Veh. Noise Vib. 2004, 1, 1–30. [Google Scholar] [CrossRef]
  9. Pattanayak, S.K. Valuing watershed services: Concepts and empirics from southeast Asia. Agric. Ecosyst. Environ. 2004, 104, 171–184. [Google Scholar] [CrossRef]
  10. Wang, X.; Wang, Z.; Yang, W.; Xi, X.; Shi, L.; Dong, W.; Zhang, Q.; Zhou, Y. Present situation of China’s water resources and its future development direction. Environ. Eng. 2014, 32, 1–5. [Google Scholar]
  11. Huang, Q.; Liu, J. Internal Mechanism and Allocation Efficiency of Water Price of China. Macroeconomy 2014, 241, 16–22. [Google Scholar]
  12. Gan, H.; Qin, C.; Wang, L.; Zhang, X. Study on water pricing method and practice I. Discussion on the connotation of water resources value. J. Hydraul. Eng. 2012, 43, 289–296. [Google Scholar]
  13. Xu, X.; Yang, L.; Wang, H.; Gao, Y. Problems and Suggestions on Improvement of Water Resources Allocation in River Basins in China. Resour. Sci. 2011, 33, 392–398. [Google Scholar]
  14. Qiu, Y.; Chen, Y.; Rao, Q.; Lin, X.; Chen, W. Research on Transboundary Ecological Compensation in Minjiang River Basin Based on Pollution Permission. Resour. Environ. Yangtze Basin 2018, 27, 2839–2847. [Google Scholar]
  15. Shen, J.; Gao, X.; He, W.; Sun, F.; Zhang, Z.; Kong, Y.; Wan, Z.; Zhang, X.; Li, Z.; Wang, J.; et al. Prospect theory in an evolutionary game: Construction of watershed ecological compensation system in Tai Lake Basin. J. Clean. Prod. 2021, 291, 125929. [Google Scholar] [CrossRef]
  16. Qiu, Y.; Liu, Y.; Liu, Y.; Chen, Y.; Li, Y. An interval two-stage stochastic programming model for flood resources allocation under ecological benefits as a constraint combined with ecological compensation concept. Int. J. Environ. Res. Public Health 2019, 16, 1033. [Google Scholar] [CrossRef] [Green Version]
  17. Jala, N.L. Evaluation of Economic Value of Pilikula Lake Using Travel Cost and Contingent Valuation Methods. Aquat. Procedia 2015, 4, 1315–1321. [Google Scholar] [CrossRef]
  18. Vasquez, W.F.; De Rezende, C.E. Willingness to pay for the restoration of the Paraíba do Sul River: A contingent valuation study from Brazil. Ecohydrol. Hydrobiol. 2019, 4, 610–619. [Google Scholar] [CrossRef]
  19. Orgill-Meyer, J.; Jeuland, M.; Albert, J.; Cutler, N. Comparing contingent valuation and averting expenditure estimates of the costs of irregular water supply. Ecol. Econ. 2018, 146, 250–264. [Google Scholar] [CrossRef]
  20. Yang, Z.; Liu, H.; Xu, X.; Wang, H.; Liu, H. Design of financial transfer payment system for water ecology compensation. J. Beijing Norm. Univ. (Nat. Sci. Ed.) 2013, 49, 326–332. [Google Scholar]
  21. Liu, C.; Zhang, N. Economic effects of horizontal ecological compensation in the Xin’an River Basin. China Environ. Sci. 2021, 41, 1940–1948. [Google Scholar]
  22. Wang, Y.; Li, G.; Yan, B. Study on horizontal compensation apportionment of ecological service value in watersheds. Resour. Sci. 2019, 41, 1013–1023. [Google Scholar]
  23. Nie, Q.; Kuang, X. Policy Thinking on Perfecting Ecological Compensation Model of River Basin in China. Price Theory Pract. 2014, 364, 51–53. [Google Scholar]
  24. Mohamed, N.; Shamsudin, M.N.; Ghani, A.N.A.; Radam, A.; Kaffashi, S.; Rahim, N.N.R.N.A.; Bin Hassin, N.H. Willingness to pay for watershed conservation at Hulu Langat, Selangor. J. Appl. Sci. 2012, 12, 1859–1864. [Google Scholar] [CrossRef] [Green Version]
  25. Zhao, Y.; Zhang, Y.; Xiong, G.; Yan, W. Willingness-to-pay for ecosystem services of Ganjiang River and its value assessment: A regional heterogeneity perspective. Acta Ecol. Sin. 2018, 38, 1698–1710. [Google Scholar]
  26. Tian, Y.; Bai, X.; Huang, Y.; Zhang, Q.; Tao, J.; Zhang, Y. Ecological Compensation Standard Accounting of Chishui River Basin Based on Ecosystem Service Value. Nongye Jixie Xuebao/Trans. Chin. Soc. Agric. Mach. 2019, 50, 312–322. [Google Scholar]
  27. Zhang, L.; Rong, H. Application of Contingent Vale Method and Opportunity-cost Method to Determining Ecological Compensation Standards—A Case Study of Qiupuhe River. Bull. Soil Water Conserv. 2012, 32, 158–163. [Google Scholar]
  28. Zhang, W.; Ming, Q.; Niu, J.; Shi, Z.; Lei, G. Calculation and mechanisms for ecological compensation credits in the drinking water source region of plateau cities: A case study from the Songhuaba Reservoir region of Kunming. Geogr. Res. 2017, 36, 373–382. [Google Scholar]
  29. Li, X.G.; Miao, H.; Zheng, H.; Ouyang, Z.Y. Main methods for setting ecological compensation standard and their application. Acta Ecol. Sin. 2009, 29, 4431–4440. [Google Scholar]
  30. Ding, Z.; Yao, S. Effects of cultivated land transition on ecosystem service value in Shaanxi Province of China. Resour. Sci. 2019, 41, 1070–1081. [Google Scholar]
  31. Yuan, W.; Zhou, X. Review of Research Progress Abroad in Payments for Ecosystem Services. China Popul. Environ. 2014, 24, 76–82. [Google Scholar]
  32. Li, Y.; Yao, S.; Deng, Y.; Jia, L.; Hou, M.; Gong, Z. Spatio-temporal study on supply and demand matching of ecosystem water yield service—A case study of Wei river basin. Pol. J. Environ. Stud. 2021, 30, 1677–1693. [Google Scholar] [CrossRef]
  33. Chen, W.; Xu, X.; Wang, H.; Wang, W. The Evaluation of Water Resources Sustainable Utilization in Beijing Based on Improved Rank Correlation Analysis. J. Nat. Resour. 2015, 30, 164–176. [Google Scholar]
  34. Liu, D.; Hu, Z.T.; Jin, L.S. Review on analytical framework of eco-compensation. Acta Ecol. Sin. 2018, 38, 380–392. [Google Scholar]
  35. Liu, C.; Wang, W.; Liu, L.; Li, P. Supply-demand matching of county ecosystem services in Northwest China: A case study of Gulang county. J. Nat. Resour. 2020, 35, 2177–2190. [Google Scholar] [CrossRef]
  36. Du, J. A new approach to GDP regression forecasting. Stat. Decis. 2013, 9, 9–14. [Google Scholar]
  37. Tong, Y.; Wang, J. Impact of Labor Supply on Economic Growth in China D A Factor Decomposition Analysis. Popul. Res. 2017, 41, 15–25. [Google Scholar]
  38. Chen, G.; Wang, C. Research on the Relationship between Local Fiscal Expenditure and Economic Growth in China—Based on the Linear Mixed Model Analysis of Provincial Data from 1990 to 2012. Financ. Res. 2014, 8, 42–45. [Google Scholar]
  39. Song, L.; Zhang, W. Research on Spatial Spillover Effect of Fiscal Expenditure on Economic Growth. Financ. Res. 2018, 31, 31–41. [Google Scholar]
  40. Gan, C.; Chen, Y.; Xu, X. Short-term production function model based on the law of diminishing marginal returns. Theor. Innov. 2016, 449, 17–22. [Google Scholar]
  41. Li, Z. Threshold effects of foreign direct investment on China’s carbon emissions. Resour. Sci. 2015, 37, 163–174. [Google Scholar]
  42. Hansen, B.E. Sample splitting and threshold estimation. Econometrica 2000, 68, 575–603. [Google Scholar] [CrossRef] [Green Version]
  43. Marx, K. Capital; World Book Publishing Company: Cleveland, NY, USA, 2013. [Google Scholar]
  44. Wang, Y.; Li, G. A study on compensation of ecosystem spillover value based on emergy expansion in the upper reaches of the Wei River Basin. China Popul. Environ. 2016, 26, 69–75. [Google Scholar]
  45. Zhang, C.; Li, J.; Zhou, Z. Water Resources Security Pattern of the Wei River Basin Based on Spatial Flow Model of Water Supply Service Zhang. Sci. Geogr. Sin. 2021, 41, 350–359. [Google Scholar] [CrossRef]
  46. Wang, F.; Gao, J.; Shao, H.; Zhang, T.; Zhang, Y.; Xu, X.; Zhao, C.; Wang, H. Response of ecosystem service values to land use change based on GIS and ecological compensation in Loess Plateau. Sci. Soil Water Conserv. 2013, 11, 25–31. [Google Scholar]
  47. Zhang, Y. Analysis and countermeasures of the current situation of water resources management in the Wei River basin. Shaanxi Water Resour. 2013, 6, 175–176. [Google Scholar]
  48. Du, M.; Chen, J.; Ma, Z. Water price and the impact of water pollution on farmers in the Wei River basin. Environ. Prot. 2005, 10, 39–43. [Google Scholar]
  49. Hou, M.; Yao, S. Spatial spillover effects and threshold characteristics of rural labor transfer on agricultural eco-efficiency in China. Resour. Sci. 2018, 40, 2475–2486. [Google Scholar]
  50. Krugman, P.; Wells, R. Microeconomics, 2nd ed.; Worth Publishers: New York, NY, USA, 2015. [Google Scholar]
  51. Zhao, L.; Alatenegule. A quantitative study on influence path of Inner Mongolia science and technology innovation ability on high—quality economic development. Sci. Manag. Res. 2019, 37, 103–107. [Google Scholar]
  52. Jie, H.; Wang, C. Education Investment, Labor Quality and Economic Growth Based on STR Model. J. Cent. China Norm. Univ. (Humanit. Soc. Sci.) 2019, 58, 50–56. [Google Scholar]
  53. Gao, X.; Wu, S. Study on Public Cognition and Acceptance Willingness of Reclaimed Water in Xi’an. J. Arid Land Resour. Environ. 2019, 33, 63–69. [Google Scholar]
  54. Wang, Y.; Li, G. Ecological Compensation Standard of Watershed Based on Water Footprint—A Case of Wei River Watershed. Res. Econ. Manag. 2016, 37, 82–89. [Google Scholar]
Figure 1. Theoretical framework of the price of water yield service.
Land 11 01118 g001
Figure 2. Study area.
Land 11 01118 g002
Figure 3. Analysis of price trend by province in the Wei River basin.
Land 11 01118 g003
Figure 4. Temporal and spatial distribution of compensation amounts in Wei River basin.
Land 11 01118 g004
Table 1. Variable design and its descriptive statistics.
VariableUnitMeaningVariable DeclarationMeanStd.MinMax
GDPCNY 104Gross domestic productChina county statistical yearbook659,0001,160,0003623.2311,600,000
D104 m3Demand of water Local water resources bulletin11,284.017645.24273.8845,860.23
ECNY 104Local fiscal expenditureChina county statistical yearbook70.9045.482.32824.68
KCNY 104Investment in fixed assets of the whole societyChina county statistical yearbook278,000735,0001007.386560,000
LpersonNumber of employees at the end of the yearChina county statistical yearbook649,0001250,000572.649270,000
Table 2. Elasticity of value production of water resource elements.
lnGDPModel (1)Model (2)Model (3)
Coef.Std. Err.Coef.Std. Err.Coef.Std. Err.
lnD0.1940.1674.968 ***1.679
0 (lnD < 9.4487); 0.493 ***0.174
1 (lnD ≥ 9.4487) 0.454 ***0.169
lnD2 −0.259 ***0.087
lnE0.533 ***0.0620.497 ***0.0620.534 ***0.042
lnK0.100 **0.0420.116 ***0.0420.100 ***0.029
lnL0.0460.0380.0420.0370.0490.038
_cons3.3261.534−18.2427.8510.6941.622
R20.8940.89710.8998
F449.67415.9492.04
(Prob > F)000
Notes: ***, ** and * represent the significance level of 1%, 5% and 10%, respectively. R2 represents goodness-of-fit coefficient.
Publisher’s Note: MDPI stays neutral with regard to jurisdictional claims in published maps and institutional affiliations.

