Article

Evolution Characteristics and Driving Mechanism of the Territorial Space Pattern in the Yangtze River Economic Belt, China

1
School of Geography and Environmental Science, Guizhou Normal University, Guiyang 550025, China
2
The State Key Laboratory Incubation Base for Karst Mountain Ecology Environment of Guizhou Province, Guiyang 550001, China
*
Author to whom correspondence should be addressed.
Land 2022, 11(9), 1447; https://doi.org/10.3390/land11091447
Submission received: 28 July 2022 / Revised: 23 August 2022 / Accepted: 26 August 2022 / Published: 1 September 2022

Abstract

:
Scientific understanding of the evolution law of territorial space patterns and the ability to reveal the formation mechanism hold great significance for the sustainable utilization of territorial resources and the high-quality green development of the Yangtze River Economic Belt (YREB). In this study, we used the spatial chord diagram, landscape pattern index, and geographical probe to explore the evolution characteristics and formation mechanism of the territorial space pattern of the YREB from 2000 to 2020. The results showed the following: (1) The territorial space showed obvious geographical hierarchical distribution characteristics in the topographic gradient. Production and living space was dominant throughout the low and middle terrain region. Ecological space was dominant throughout the high-terrain regions. With the increase of altitude and slope, production and living space contracted, whereas ecological space areas expanded. (2) Since 2000, the territorial space has changed more dramatically. Over time, living space tended to increase, and production and ecological space tended to decrease, but ecological space was always dominant. In space, the geographical differentiation of territorial space was more obvious, and the pattern was relatively stable, with production space distributed primarily in the middle and lower reaches, living space distributed primarily in the lower reaches, and ecological space distributed primarily in the middle and upper reaches. The inter-transformation between territorial spaces was more frequent, and the transformation trajectory was diversified. (3) The fragmentation, heterogeneity, and dispersion of territorial space landscape patches throughout the whole region increased, and the balance and diversity of territorial space utilization improved. (4) Natural factors have continued to weaken the intensity of their effect on territorial space. Human factors gradually increased the extent of their interference in the territorial space. There are significant differences in the extent of the role of these different factors on the territorial space of the whole region and each basin. Natural and human factors jointly promoted the formation and development of the territorial space pattern.

1. Introduction

Territorial spaces are important places for human survival and development, which provide a fundamental guarantee for economic and social development. Since the entering of the Anthropocene, the global spatial layout has been changing rapidly, bringing economic growth and social well-being [1]. Uncontrolled space expansion and resource depletion, however, have posed significant challenges to the stability and sustainability of the ecosystem [2]. With the deepening of our understanding of the relationship between socio-economics, resources, and environmental well-being, the concepts of the green economy are evolving, and green development is receiving increasing attention. The United Nations Development Programme (UNDP) first proposed the concept of “green development” in the “China Human Development Report 2002: Making Green Development a Choice,” pointing the way for an environmentally friendly green socioeconomic development path [3].
As the world’s largest developing country, China has experienced accelerated industrialization and urbanization since the end of the 20th century, which has dramatically changed the territorial space pattern. The proportion of construction land space rose from about 3.12% in 2000 to about 8.46% in 2019, with a significant expansion of urban, industrial, and mining space, leading to the country’s disparate spatial layout, uneven structural ratios, and ecological damage [4]. To alleviate the contradiction between development and conservation, the 19th National Congress first proposed the new concept of high-quality development. The 14th National Five-Year Plan emphasized that economic and social development should be aimed at promoting high-quality development and promoted speeding up the construction of a new pattern of development and utilization of territorial space with obvious functions, complementary advantages, and high-quality development. This plan indicates that there is an urgent demand to establish an orderly and coordinated territorial spatial order. Therefore, it is necessary to optimize the territorial space pattern and coordinate territorial space development, for which an in-depth analysis of the mechanism of territorial space development is essential.
Extensive research has been conducted on territorial space, which has primarily focused on land use; the evolution of territorial space function; and territorial space planning, development, and consolidation. According to the above three perspectives, to explore land use changes, the territorial space can be divided into cultivated land, forestland, grassland, water area, construction land, and unused land [5]. However, to examine the three zones and three lines, the territorial space can be divided into urban, agricultural, and ecological space [6]. The “three zones” refer to three types of territorial space: urban space, agricultural space, and ecological space, and the “three lines” are the three control lines corresponding to the urban development boundary, permanent basic agricultural land, and ecological protection red line, respectively. Since the 18th National Congress of the Communist Party of China proposed to accelerate the construction of “intensive and efficient production space, livable and moderate living space, and beautiful ecological space,” the coordination of production, living, and ecological space has needed to adapt to the management and research of territorial space. Thus, the research based on the perspective of “production–living–ecological” space has become the focus of government and academia. Although there are significant differences in the recognition of “production–living–ecological” space in academia [7], the connotation of production, living, and ecological spaces currently has formed a relatively unified framework [8]. The classification and identification of “production–living–ecological” space provide the basis for further research on territorial space. Among this research, classification based on land use [9], ecosystems [10], or landscape values [11] has divided the territorial space function, whereas identification has used mostly quantitative measurements and inclusive classification to identify single function spaces or dominant function spaces.
Existing research on “production–living–ecological” spaces has focused mainly on evolution, driving force, effect, and optimization. Research on evolution has revealed the changing characteristics of the “production–living–ecological” space function [12] and the law of coupling and coordination [13] and has examined the connection between the topographic gradient and the “production–living–ecological” space [14]. Research on driving forces has identified human factors, such as migration and farmer behavior [15]; natural factors, such as the climate; and human-natural interactions that all have significant effects on the “production–living–ecological” space [16]. Research on these effects has demonstrated that changes in the “production–living–ecological” space will cause climate changes [17], hydrology [18], and ecological quality, which will have an impact on the environment [19] and sustainability. Research on optimization and management has been based mainly on the analysis of human–natural system coupling [20], territorial space planning [21], and double evaluation [22] perspectives, which involve national [23], interregional [24], provincial [25], urban [26], county [27], and township [28] areas to propose optimal management countermeasures according to local conditions.
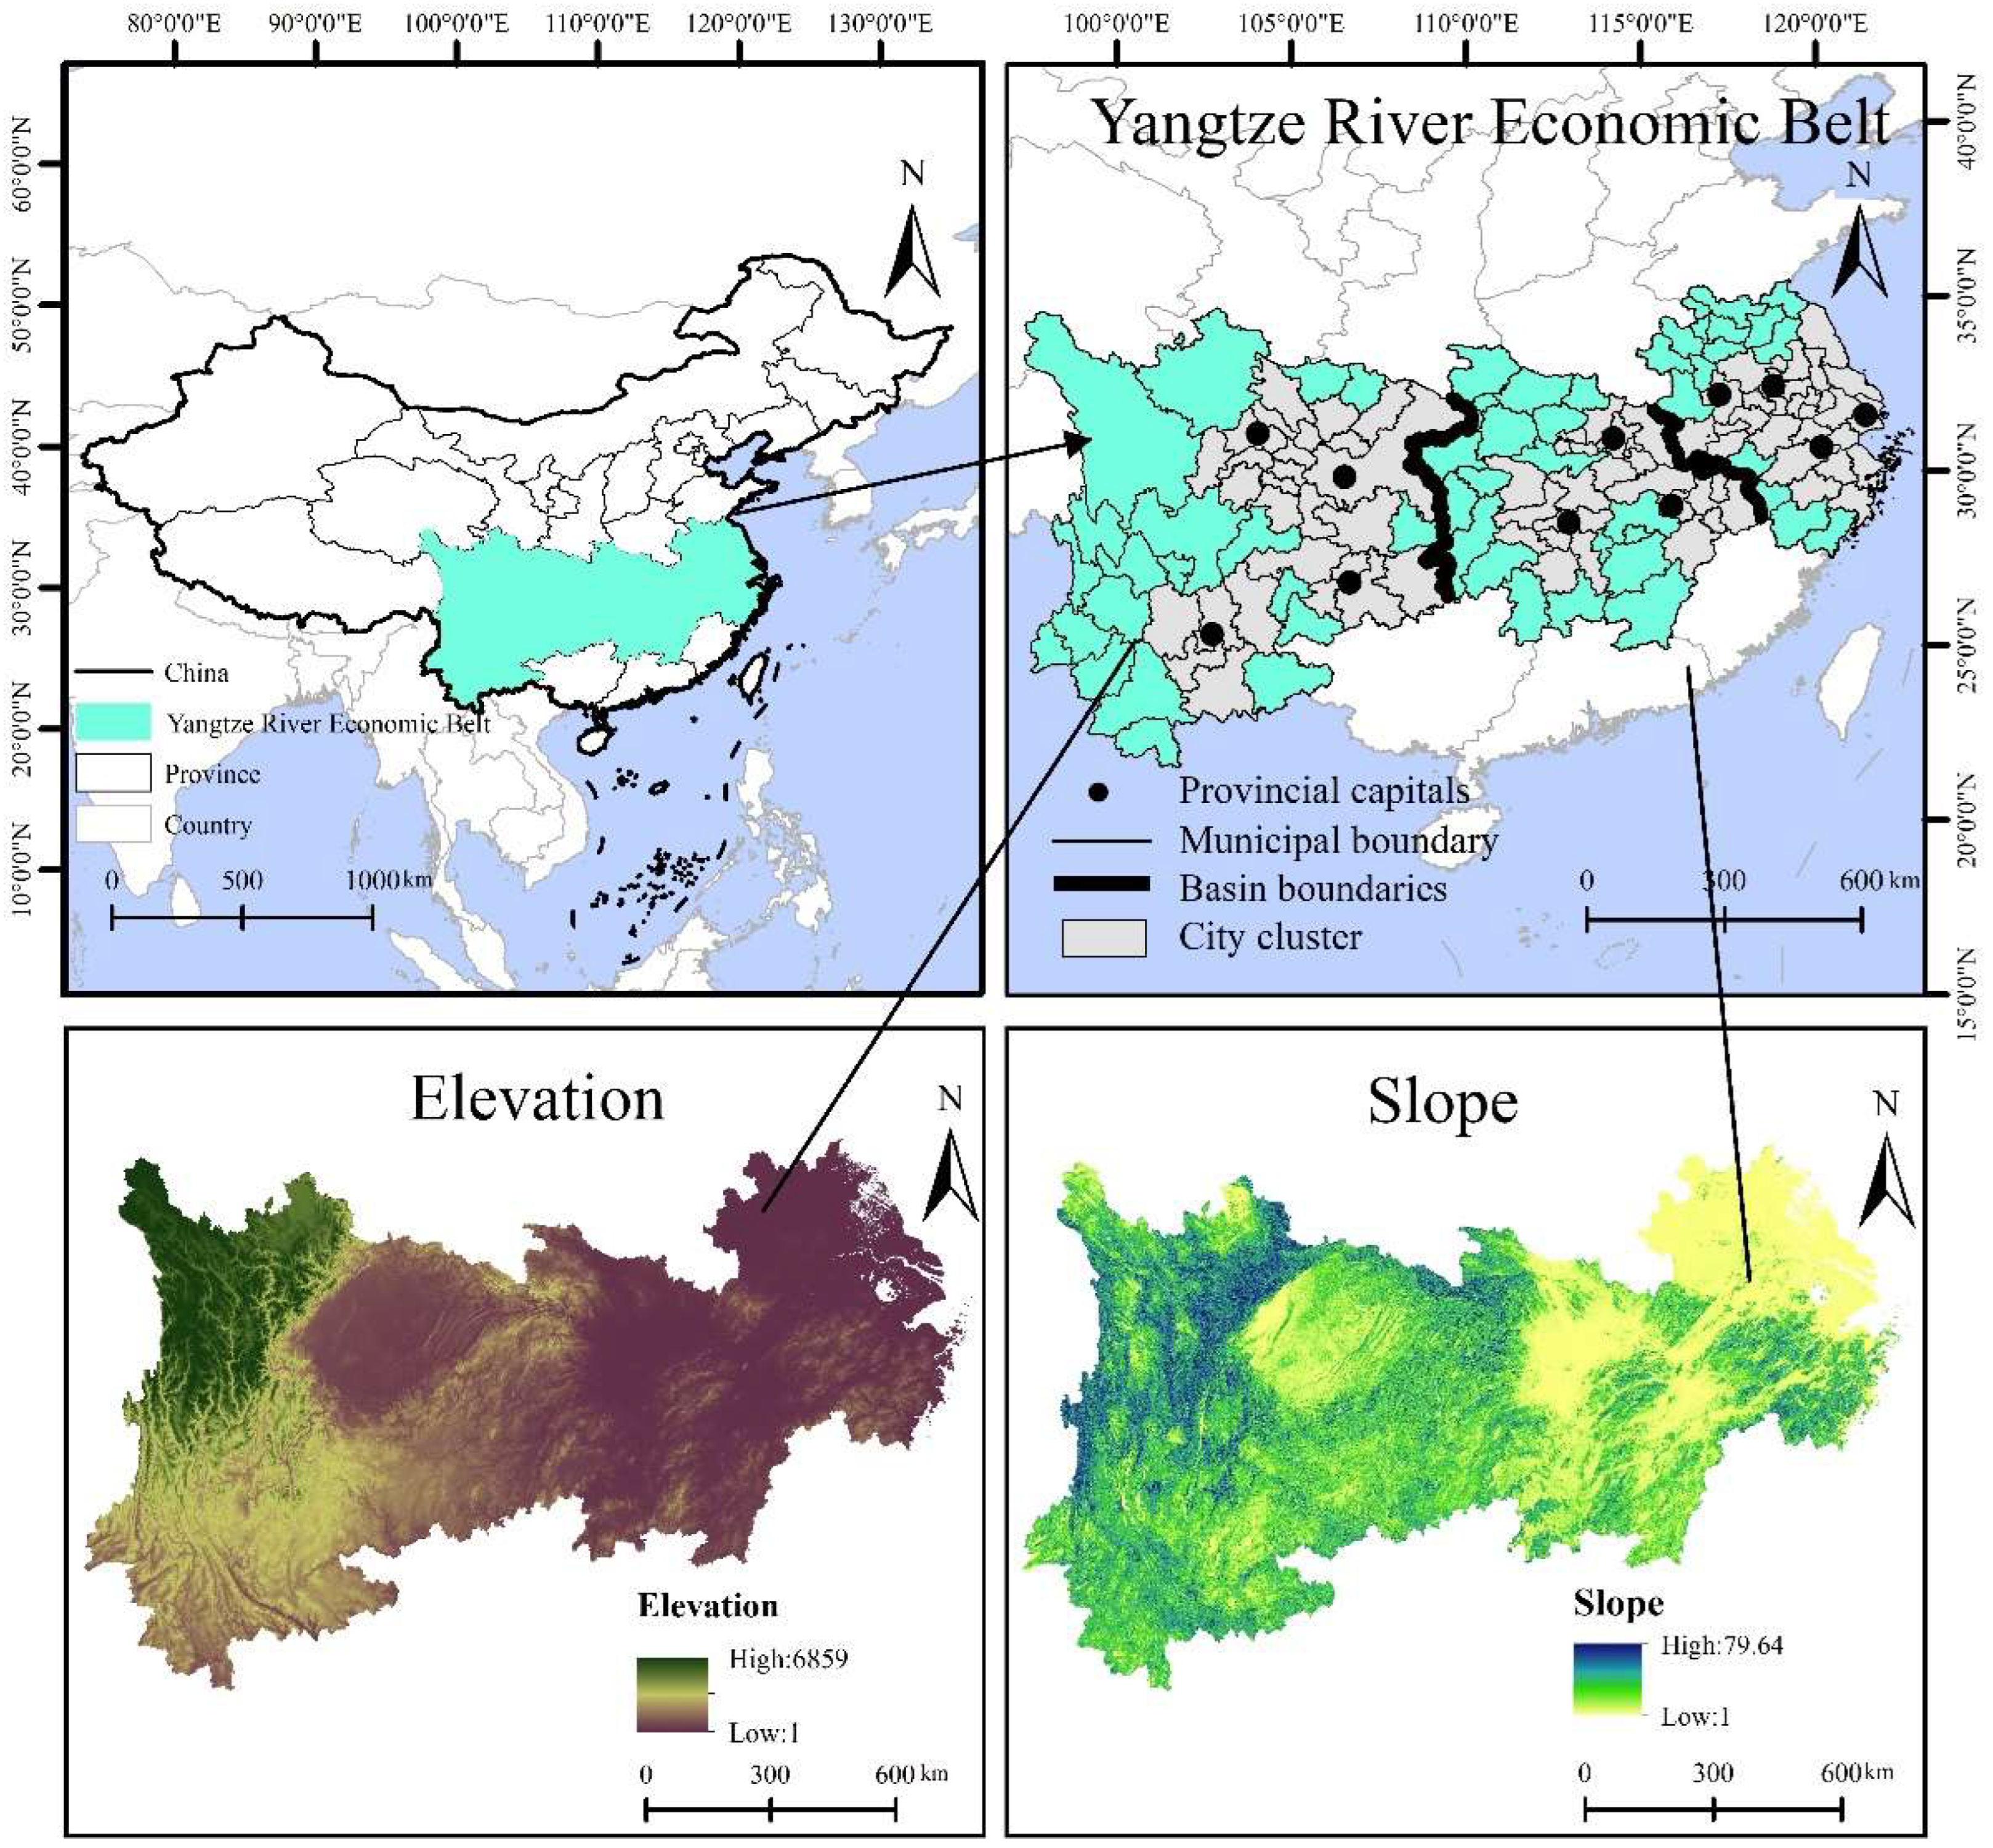
The Yangtze River Economic Belt (YREB) is one of the most active regions in China for the development and utilization of territorial space and also is the most important east west–axis of territorial space development, accounting for 21% of the national area, 40% of the national population, and more than 40% of the total economic output. Since 2000, driven by national policies, the YREB has developed rapidly. In 2020, the region achieved a total gross domestic product (GDP) of CNY 471,580 billion, accounting for 46.6% of the country. At the same time, however, the YREB is also responsible for serious ecological problems [
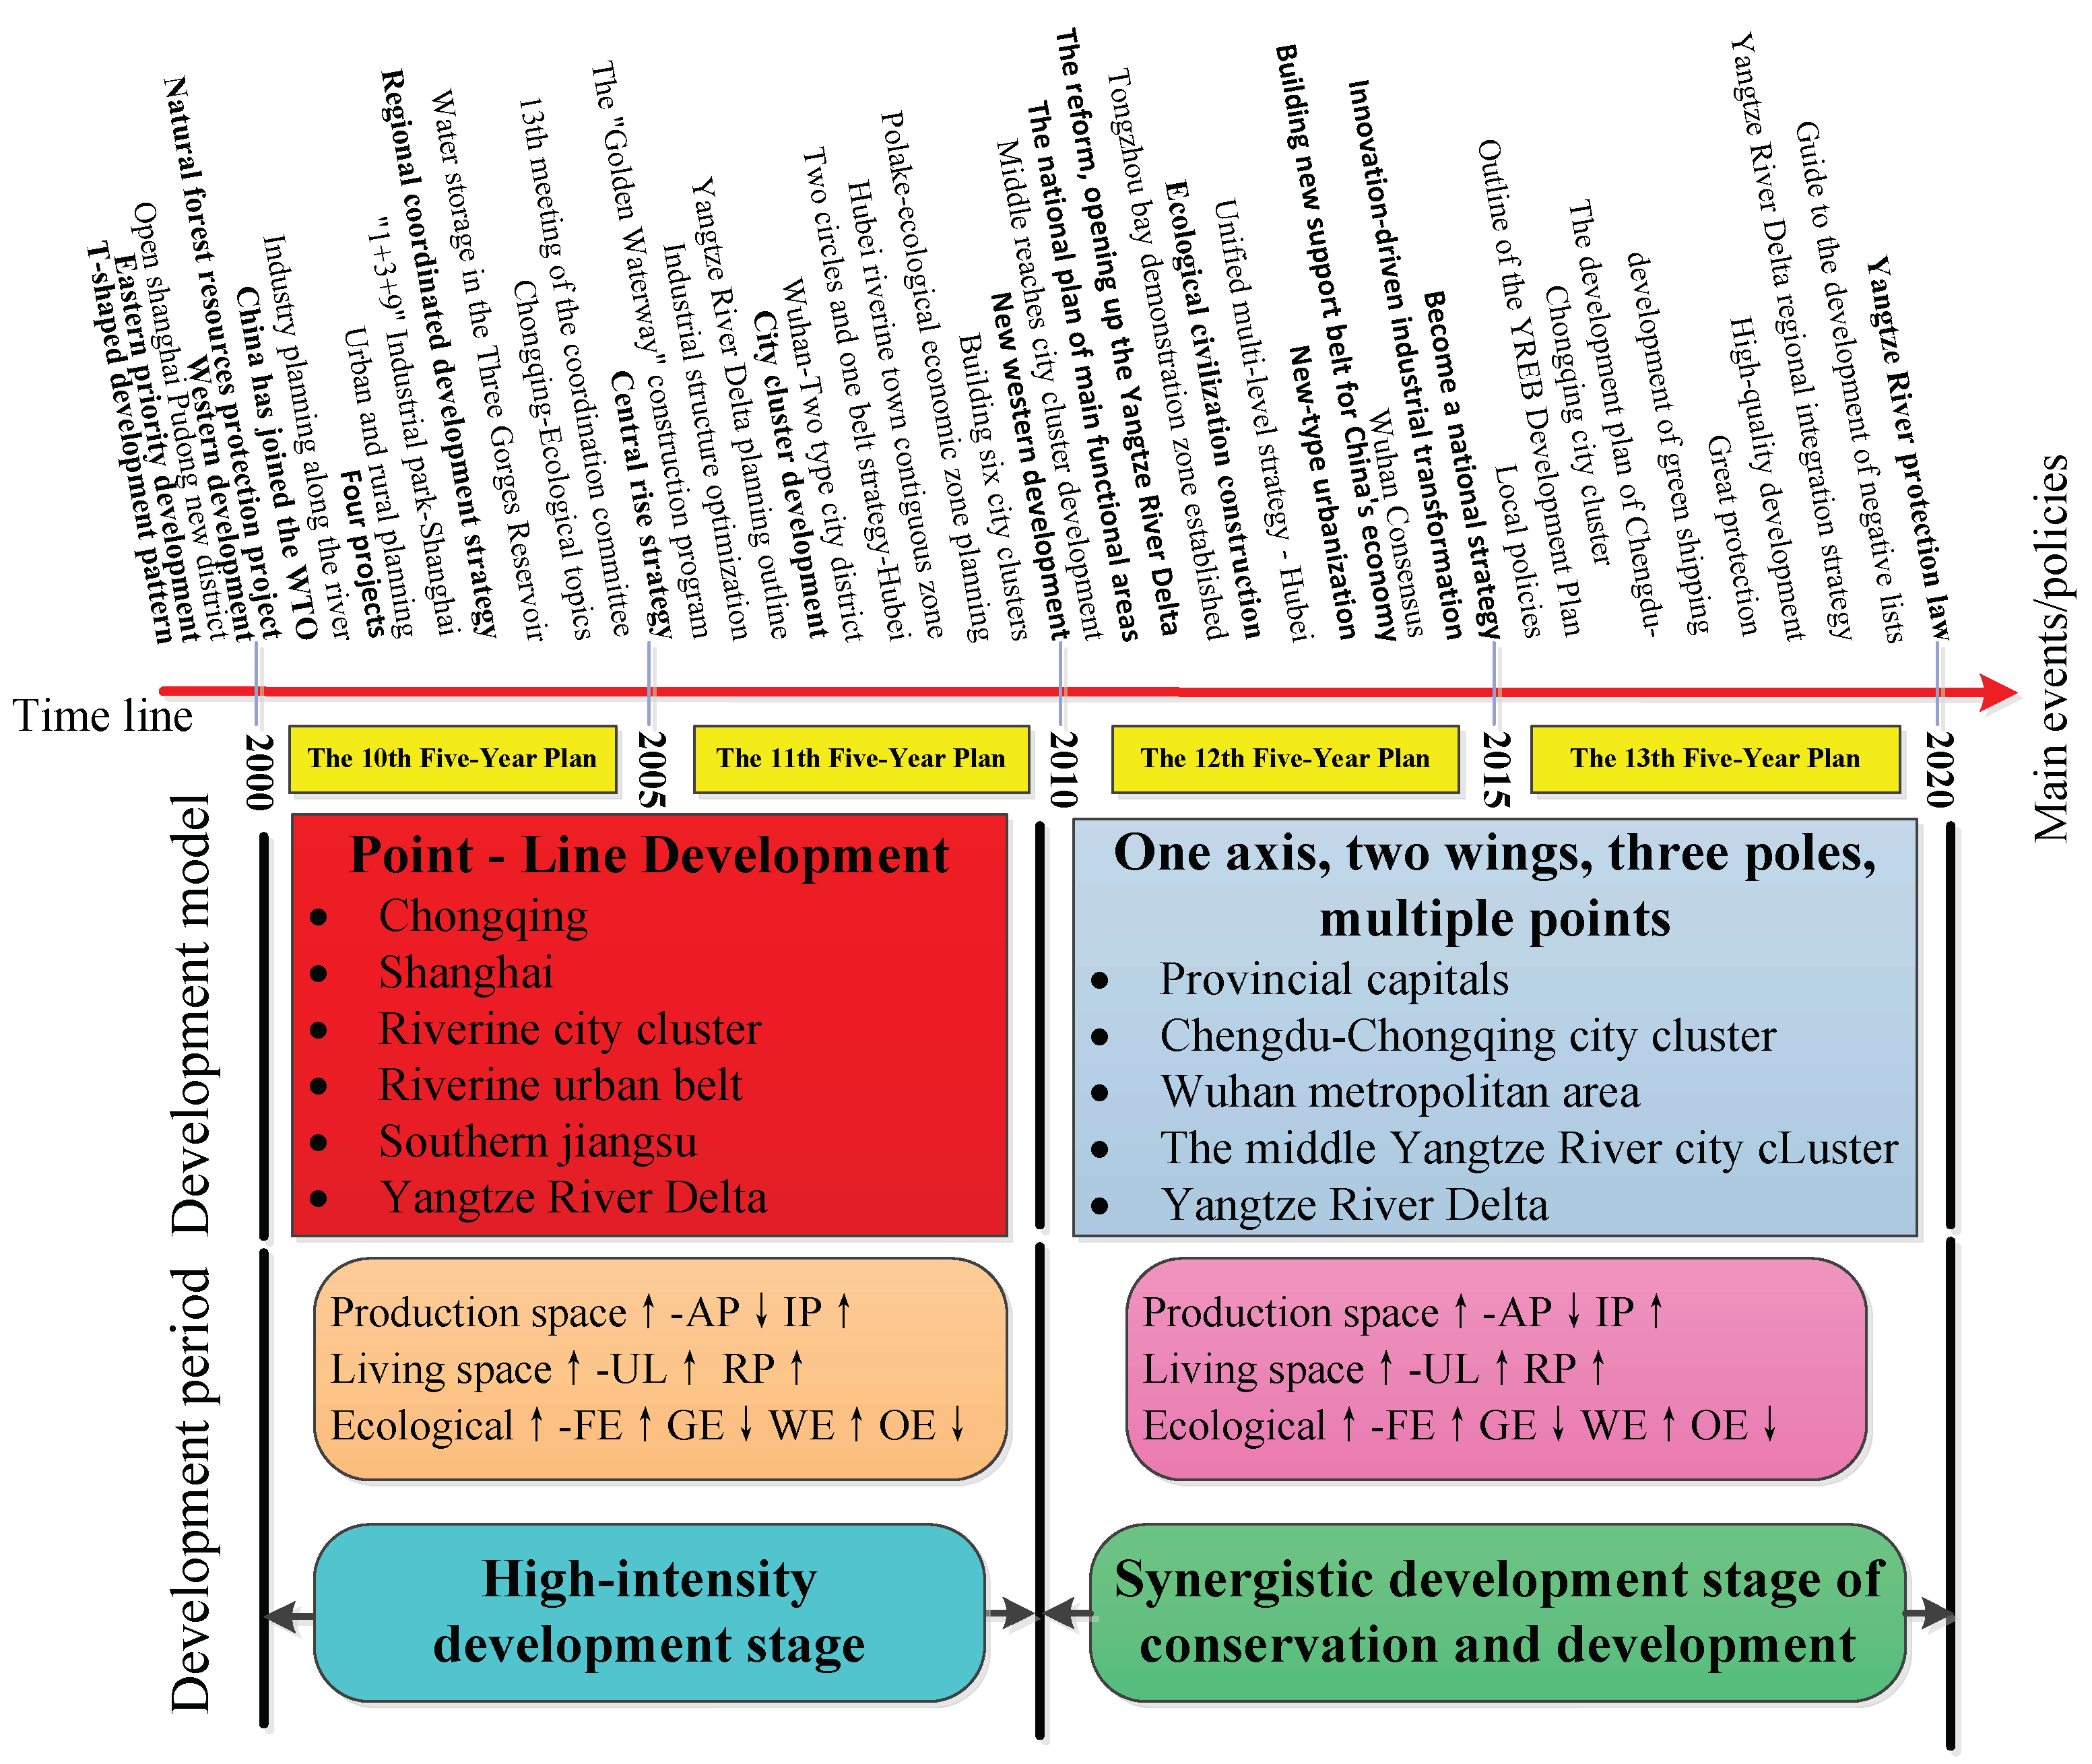
29], and the uncoordinated territorial space development has seriously restricted the high-quality development of the region. Establishing the YREB as a model economic zone of high-quality development is an inevitable requirement against the backdrop of national development in the new era. In 2018, the YREB began “promoting well-coordinated environmental conservation and avoiding excessive development”; high-quality development officially became a national strategy; efficient and reasonable development and utilization of territorial space were established as the foundation of the Yangtze River’s ecological protection. In 2022, scientific planning of territorial space development and protection pattern, establishment and improvement of territorial space management and control mechanism, and speeding up the formulation of a territorial space plan were established as the essential requirements necessary to promote high-quality regional development of the YREB. This series of measures represents the transition of the development of the YREB from a high–speed development stage focusing on territorial space development since 2000 to a high-quality development stage with equal emphasis on development and protection today. Optimizing the territorial spatial pattern and achieving equal emphasis on development and protection is the key to achieving high-quality development of the Yangtze River Economic Belt.
Against the above backdrop, exploring the characteristics and driving mechanisms of territorial space development in the YREB can provide a scientific reference and theoretical support for the rational optimization of the territorial space pattern. Currently, the research on the territorial space of the YREB has featured the following three characteristics: First, in terms of research perspective, it has focused on the analysis of the single space of production, life, or ecology or the connections between two spaces. Research on the mutual influence of these three living spaces, however, has been lacking. Second, in terms of research content, it has focused mostly on the analysis of the evolution and optimization of territorial space, but less on the analysis of the driving mechanism. Third, in terms of research scale, most of the research has focused on the development of territorial space in each river basin, and few studies have examined the whole area on a large scale. Therefore, in general, the research on the process of changing territorial space patterns and the mechanism of regional differentiation in the YREB remains weak.
This study examined the evolutionary characteristics of the territorial space pattern of the YREB since 2000 and revealed the formation mechanism according to the territorial space research model, landscape pattern analysis, and geodetector. A scientific understanding of the evolution pattern and driving factors of the territorial space pattern of the YREB has promoted the formulation and implementation of territorial space planning, optimized the territorial space pattern, implemented the strategy of high-quality development of the YREB, and further promoted high-quality development in China.

2. Materials and Methods

2.1. Study Area

The Yangtze River Economic Belt (YREB) refers to the adjacent economic circle along the Yangtze River connecting the south west border to the eastern seacoast in China, consisting of two provincial level municipalities (i.e., Shanghai, Chongqing) and nine provinces (i.e., Sichuan, Yunnan, Guizhou, Hubei, Hunan, Jiangxi, Zhejiang, Anhui, and Jiangsu). This region covers an area of about 2.0523 million square kilometers, accounting for 21.40% of China’s total land area. The permanent population is about 602 million, and the average urbanization rate was 61.7%, which is higher than the national average. In 2020, the per capita GDP of the YREB was CNY 80,400, compared with China’s average of CNY 72,400. The YREB has strong comprehensive strength and huge development potential and is a major national strategic development area in China.
The YREB spans 21°08′ N to 35°20′ N, 97°21′ E to 122°25′ E. The region runs through the southeastern margin of the Qinghai-Tibet Plateau, the Yunnan-Guizhou Plateau, and the hills south of the Yangtze River from west to east, as well as the Sichuan Basin, the Lianghu Plain, the Poyang Lake Plain, and the middle and lower reaches of the Yangtze River. The terrain is high in the west and low in the east (Figure 1). It encompasses a vast territory, is rich in natural resources, and features complex terrain. In terms of elevation, the YREB decreases gradually from the upper reaches to the lower reaches, with the highest point in the upper reaches at 6511 m above sea level. The topography of the upper reaches mainly features highland and high mountains, with some basins and hilly areas at lower elevations. From the upper reaches, the elevation decreases along the east direction to the middle reaches, where mountains and hills dominate, with the highest elevation being about 3002 m. The lower reaches are generally flat, with plain terrain dominating, and the elevation is mostly below 50 m. In terms of slope, the whole area shows the spatial characteristics of a gradually decreasing overall slope from the upper reaches to the lower reaches, with areas of higher slope density being contiguous in the western part of the upper reaches and areas of the lower slope being distributed throughout most of the middle and lower reaches and near the Sichuan Basin of the upper reaches. According to the characteristics of the natural geographic environment in the study area, we used ArcGIS 10.2 (It is a new generation GIS software developed by ERSI (Environmental Systems Research Institute.) software to extract topographic factors, such as elevation and slope for topographic gradient analysis and combined this data with related studies [30]. With reference to the relevant criteria [31], we divided elevation and slope (Table 1).

2.2. Data Collection and Processing

2.2.1. Data Sources

In this study, we used land use and meteorological data obtained from the Resource and Environmental Sciences Data Center of the Chinese Academy of Sciences (http://www.resdc.cn/, accessed on 3 January 2022). The temporal coverage of selected data covered the years 2000, 2010, and 2020, with a spatial resolution of 1 km. We derived Digital Elevation Model (DEM) data from the Geospatial Data Cloud (https://www.gscloud.cn/, accessed on 10 January 2022) with a spatial resolution of 90 m. The administrative boundaries of the YREB are from the National Basic Geographic Information Center (http://ngcc.sbsm.gov.cn/, accessed on 10 January 2022). The socioeconomic data in this study were obtained from the 2000, 2010, and 2020 China Statistical Yearbook, China Urban Statistical Yearbook, China Urban Construction Statistical Yearbook, and China Regional Economic Statistical Yearbook and from the statistical yearbooks and bulletins of 130 cities in corresponding years. The policy aspect mainly considered the implementation time and coverage area of ecological protection policies to determine the index value. Based on multifunctional discernment of territorial space and referring to the existing research results [32], we established a linkage table of territorial space structure and land use type (Table 2).

2.2.2. Selection of Indicators

We selected 14 aspects of independent variables based on the relevant literature [33] and according to the study area’s natural geographical basis and socioeconomic factors, namely, the ecological function protected areas (X1), average elevation (X2), average precipitation (X3), average slope (X4), average fluctuation degree (X5), the average temperature (X6), GDP (X7), the population of permanent residents (X8), population density (X9), the urbanization rate (X10), urban per capita disposable income (X11), total fixed asset investment (X12), local general public budget revenue (X13), and total social sales (X14). These indicators fall into two categories. One reflects the state of the natural environment, involving topography, temperature, and precipitation. The other type reflects human factors, summarizing population, urbanization, policy, consumption level, and economic development. They are closely related to territorial space development and profoundly influence the distribution and evolution of space (Figure 2).

2.3. Methods

2.3.1. Terrain Distribution Index

A terrain distribution index is a composite index used to analyze the elevation and slope attribute information of any point in space [34]. This index can be used to comprehensively reflect the spatial differentiation of topographical conditions. The calculation formula is as follows
P = ( S ie S i ) × ( S S e )
where P is the terrain distribution index; S ie represents the area of the territorial space of class i on the e topographic interval; S i represents the total area of territorial class i; S indicates the total area of the region; and S e represents the total area of the e topographic interval. If P > 1, the distribution of territorial class i on terrain interval e is dominant; otherwise, it is inferior. The larger P is, the higher the dominance degree is. If P = 1, the proportion of territorial class i on terrain interval e is equal to the proportion of that class in the study area.

2.3.2. Landscape Pattern Indexes of Territorial Space

The landscape pattern indexes are simple quantitative indicators that can highly condense landscape pattern information and reflect certain aspects of its structural composition and spatial configuration [35]. They can be used to analyze the essential characteristics of the spatial pattern of the country, such as size, distribution, shape, and structure. Combining the basic characteristics of the research object and the actual needs of the research content and comprehensively considering the representation meaning of each landscape pattern index, we used the following 10 indicators to quantitatively describe the territorial space pattern by Fragstats 4.2: Number of Patches (NP), Patch Density (PD), Area Integral Dimension (AFRAC), Mean Patch Area (Area_Mn), Landscape Percentage (PLAND), Sprawl (CONTAG), Aggregation Index (AI), Shannon’s Diversity Index (SHDI), Shannon’s Evenness Index (SHEI), and Landscape Shape Index (LSI). The definitions of these indicators are shown in Table 3.

2.3.3. Territorial Space Transition Analysis

The structure transformation of territorial space is achieved through the use of the Sankey diagram, chord diagram [36], and territorial space transfer matrix model [37].
Chord diagrams can express the association between multiple objects. A line segment connecting any two points on a circle is called a chord, and a chord represents the interrelationship between them. The wider the chord is, the higher the number of conversions between different territorial spaces will be. This study used a circle package in R language to compile, obtain, and construct the territorial space change, trajectory model.
Sankey diagrams are charts that describe the flow from one set of values to another. Inside the Sankey diagram, different lines represent different flow diversions, and the width of the line represents the size of the data represented by this branch. In this study, the software Origin 2021 was used to obtain Sankey diagrams.
Chord diagrams and Sankey diagrams can reflect and visualize the relationship between the number and flow of transitions between different territorial spaces.
The transfer matrix refers to the arrangement of the transfer area of territorial space changes in a matrix, which not only demonstrates the specific quantitative change of territorial space use, but also presents the territorial space transfer direction. The mathematical formula is as follows:
S i j = { S 11 S 12   S 1 n S 21 S 22   S 2 n S n 1 S n 2         S n n }
where S represents the area, i and j represent the territorial space use types at the early and late stages of the study, and n represents the number of territorial space types.

2.3.4. Geographical Probe

In this study, we used Geodetector to identify and analyze the driving factors and their interactions with the territorial space changes in the YERB from 2000 to 2020.
Geodetector’s factor detector can detect associations between dependent geographic elements and their influencing factors and find dominant factors to quantify the interaction between two variables [38]. The following equation represents the q statistic:
q =   1 1 N σ 2 h = 1 L N h σ h 2
where q is the index of the degree of explanation of changes in the territorial space pattern, and the value interval of q is [0, 1], where the closer the q-mean value is to 1, the stronger the explanatory power of impact factors is on territorial space evolution; h represents the classes of variables; Nh and N represent the number of grid cells within the entire region and subregion h, respectively; and σ h 2 , σ 2 represent the variances of the entire region and subregion h, respectively.
Geodetector’s interaction detector can detect and calculate the interaction between two factors. In addition, q(XiXj) is the decisive force to exchange the two factors, which can reveal whether, together, the two factors Xi and Xj enhance or weaken the explanation of Y relative to their independent effects. The interaction types are shown in Table 4.

3. Results

3.1. Characteristics of the Distribution of Territorial Space

3.1.1. Spatial Distribution Characteristics of Territorial Space Based on Altitude Gradient

The total area of the territorial space in the seven elevation zones varied greatly. The first level elevation belt was the largest, and the sixth to seventh elevation belts were the smallest. With the increase in elevation, the territorial space showed a more obvious distribution hierarchy (Figure 3).
The dominant distribution region of production space was located in levels 1–5 of the elevation gradients, most notably in the level 6 and 7 elevation gradients, where the distribution index of production space approached 0 (Figure 4). Among these gradients, the dominant distribution region of agriculture space occurred at the level 1 and 2 elevation belts, and the dominant distribution region of industry and mining space occurred at the level 1–4 elevation belts, both of which were influenced by the elevation change and followed a more obvious trend of shrinking with an increase in elevation. Living space was distributed at the low and middle altitude region, especially at the level 1 elevation belt, with a distribution index greater than two, which was the dominant territorial space use manner in this region. Furthermore, the distribution index of urban and rural space followed a wave-like decreasing trend with an increase in altitude. This trend was mainly because the geographical environment and soil and water resource conditions at lower altitudes were more favorable for human survival and living as well as for various production activities. The elevation restriction of ecological space was weak, and its dominant distribution region tended to shift toward the high altitude region. The level 7 elevation zone was the most dominant distribution region of ecological space, among which the distribution index of forestland increased first and then decreased with an increase in altitude. The level 2–6 elevation belts were the dominant distribution region. The distribution index of grassland increased with increasing elevation, and the difference in the dominance of the elevation gradient decreased significantly. The distribution index of grassland in the highest elevation zone of level 7 was the largest, approaching four. We determined that the higher the altitude, the less human activities, and the lower the possibility of damage to the natural environment. Moreover, because of the influence of ecological projects, such as natural forest protection and returning farmland to forestland (grassland), the land that was not suitable for cultivation in high altitude areas was transformed into forestland and grassland. Therefore, forestland and grassland occupied a large proportion of land in the high altitude region. The distribution of other space was more concentrated, and with an increase in altitude, there was a significant three level gradient differentiation. This differentiation manifested mainly as the distribution index: the level 1–5 elevation belt was close to 0, the distribution index of the level 6 elevation belt was close to 2.5, and the distribution index of the level 7 elevation belt was close to 10. Thus, it has become the dominant territorial space used in this region. This is the main reason that the natural conditions of this area are better, and the territorial space use is relatively simple. The dominant distribution region of the water area was located in the low and middle altitude belts, and the dominant distribution was significant at the level 1 elevation belt.

3.1.2. Spatial Distribution Characteristics of Territorial Space Based on Slope Gradient

The territorial space area showed obvious gradient differences with an increase in the five slope, and the territorial space use was concentrated mainly in the level 1 slope region (Figure 5).
The dominant distribution region of production and living space was the level 1 slope belt. When the slope increased, the distribution index of production and living space tended to decrease, and the shrinking of living space was obviously larger than that of production space, which indicated that living space was more restricted by the slope (Figure 6). Specifically, the areas of agricultural, industrial and mining, and urban and rural spaces were all distributed primarily in the level 1 slope belt, in particular, urban and rural living spaces were the dominant way space was used in the region, and their distribution index decreased and approached 0 as the slope increased. This was mainly because human activities were relatively concentrated in flat regions, and the region with a lower slope was a more advantageous location for production and life. As the slope increased, it became more difficult for people to engage in agriculture and other production and construction activities. The ecological space was weakly restricted by the slope, except that the distribution index was less than one on the level 1 slope belt. The distribution index in other slope zones was greater than one and showed a positive correlation with the slope change, and the selectivity to the slope was not significant. The dominant distribution region of forestland, grassland, and other space were all located in the level 5 slope zone, and their areas tended to grow gradually with an increase in slope. The increment of forestland and grassland areas, however, decreased after the level 3 slope gradient, whereas the other space increased. The water was distributed primarily in the level 1 slope belt, and the distribution indices of other slope belts were similar and less than one because the distribution of water area was affected by the characteristics of the water body, which was distributed mostly on the flat ground.

3.2. Characteristics of the Distribution of Territorial Space

3.2.1. Temporal Characteristics

During the period from 2000 to 2020, the dynamic degree of territorial space use in the YREB was 1.99%. From 2000–2010 and 2010–2020, the dynamic degrees of territorial space were 1.90% and 2.00% respectively (Table 5). This result showed that human activities increasingly influenced the territorial space structure during the study period, and the territorial space area has changed more drastically. In general, the production and ecological space in the YREB followed a decreasing trend, whereas the living space followed an increasing trend. Specifically, except for agricultural space, grassland, and other space, the other five types of space expanded, among which the industrial and mining space was the most obvious. The remaining spaces were urban space, rural space, water area, and forestland, which expanded in turn.
From 2000 to 2010, was a period of high intensity development and utilization of land space (Figure 7), with economic construction at the core. In this period, urbanization and industrialization accelerated, and industrial and mining space expanded more drastically, with a dynamic degree of 10.27 (Figure 8). Meanwhile, against the backdrop of rapid socioeconomic development, a large influx of population into cities and towns led to an increase in demand for urban land, and urban space expanded significantly, with a dynamic degree of 4.62. Notably, rural space also was expanding, probably because the national control on rural construction was not strict enough during this time, and the phenomenon of “building new but not tearing down old” in rural housing was a serious problem, which led to the expansion of rural settlements. The degree of change was weak, however, with a dynamic degree of only 0.75, probably because of the serious phenomenon of rural population flowing to urban areas. This probably was because the rural population was moving to the cities and the demand for rural living space was decreasing. The expansion of industrial, mining, and living space, to some extent, has encroached on some of the cultivated and ecological spaces. Therefore, agricultural space, grassland, and other space shrinkage had the most obvious reductions in agricultural space, with a dynamic degree of 0.18. To alleviate the impact damage to the ecological environment caused by the rapid economic development in that period, the national ecological protection projects, such as the protection of natural forest resources and the return of farmland to forests, were introduced in succession, and corresponding measures were taken throughout the region. Such measures included the ecology theme plan set in Chongqing’s 10th Five-Year Plan, Jiangxi’s Poyang Lake Ecological Economic Zone Plan, and the building of a strong green economy province in Yunnan. Overall, the production space decreased from 2000 to 2010 with a dynamic degree of 0.14, and the living and ecological space increased with a dynamic degree of 1.69 and 0.01, respectively.
From 2010 to 2020, is the stage of synergistic and high-quality development of territorial space development and protection, with a focus on green economy construction. Production and ecological space tended to decrease and living space tended to increase during this period. Among these spaces, the agricultural space decreased with a dynamic degree of 0.29, whereas the industrial and mining, urban, and rural spaces all had different degrees of growth, and the most drastic growth was in the industrial and mining space, with a dynamic degree of 21.4. With the YREB rising as a national strategy, the question of development and protection gained increasing attention. Following the guidance of policies such as ecological civilization construction and high-quality development, the YREB forestland and water area continued to follow the trend of expansion and the other space decreased, indicating that human beings increased the development of other space, which had a positive promotion effect on ecological protection. In general, in light of the development of significant damage to the environment, the YREB ecological space contraction trend became more obvious, but the number of ecological spaces under the constraints of national and regional ecological protection policy was controlled to a certain extent, which guided socioeconomic development in the direction of green and high quality.

3.2.2. Spatial Distribution Pattern and Evolution Characteristics

The overall pattern of territorial space in the YREB is solid, featuring obvious characteristics of geographical differentiation. Production space is dominated by agricultural space, with the most widely distributed agricultural space in the middle reaches, especially along the Jianghan Plain and the river plain in the east of Hubei, including the municipal areas of Jingmen, Jingzhou, and Wuhan. These areas are the main grain producing areas in China, forming a high concentration of agricultural space (Figure 9). In addition, the upper reaches near the Sichuan Basin and hills, including the municipal areas of Chongqing and Dazhou, and the lower reaches with Yancheng, Changzhou, and Liuan as the main areas in southern Jiangsu and the central and northern Anhui, form a medium level of agricultural space clustering (Figure 10). The agricultural space in these regions have followed a more obvious expansion trend, compared with the other regions, which basically followed a contraction trend. The municipal areas account for 89.36% of this contraction, with the most obvious contraction occurring in the upper reaches. We identified several reasons for this trend. As ecological protection has increased, arable land and construction land have been converted into ecological space, and this change has been most significant in the upper reaches where the ecological environment is fragile. The industrial and mining space is distributed primarily in the lower reaches, concentrating in the Yangtze River Delta and other areas with a high level of development, such as Lianyungang, Yangzhou, and Huzhou. The expansion of industrial and mining space has been remarkable, and basically all cities have followed the trend of industrial and mining space expansion of different magnitudes, among which Chongqing and Chengdu have experienced the most obvious expansion.
The distribution and evolution of living space are positively correlated with production space. The urban space is distributed in the Yangtze River Delta, the urban agglomeration is concentrated in the middle reaches, and the capital cities are located in the upper reaches, all of which are areas with a high level of urbanization. The rural space is distributed in the areas with more agricultural space, primarily because these areas are suitable for agricultural production and have a better natural environment, flatter terrain, and more concentrated population, which has formed the agglomeration area of these rural settlements. The regional differences in living space changes have been small, and most of the regions are predominantly expansionary. In particular, the urban space has shown a generally dense expansion throughout the whole region, which may be driven by a new type of urbanization policy and may be related to the expansion of industrial and mining space, where industries tend to be distributed around the cities, and the development of these industries drives the construction of towns to a certain extent. Rural spaces often are built along mountains and rivers, and this type of expansion has been relatively obvious in the middle and lower reaches, where the terrain is relatively flat and the lakes and river networks are dense.
The ecological space is dominated by forestland, which is relatively concentrated in the western mountains of the middle reaches and the Qinghai-Tibet mountains of the upper reaches, including Yongzhou, Ganzhou, Shiyan, and other cities in western Hunan and northwestern Hubei, and in Puer, Xishuangbanna, Liangshan, and other places in western Sichuan and western Yunnan. These regions are basically mountainous areas that are less developed and have stronger geographical constraints. Grassland and other space are concentrated in plateau mountainous areas, such as western Yunnan and western Sichuan, where the higher the terrain, the weaker the degree of human activity. This land type is relatively simple, which is conducive to vegetation conservation. The water area is small and subject to topographic and climatic differences, mainly in the relatively low terrain areas in the middle and lower reaches and the higher terrain headwaters area in the west. The ecological space changes dramatically, with a decreasing trend in the middle and upper reaches and an expanding trend in the lower reaches. Among these regions, the expansion of forestland and water area has been similar to the contraction of agricultural space, which has revealed a strong expansion behavior in the upper reaches, while the spatial evolution of grassland has contracted. The other space basically has remained stable, and only a few frontier cities at the junction of Sichuan and Yunnan and the junction of the middle and lower reaches are in a state of contraction. Overall, although the ecological space has been declining, it still accounts for the largest area of territorial space, is the most widely distributed, and always dominates the space.

3.2.3. Transformation of Territorial Space Type

From 2000 to 2020, the mutual transformation behavior between the territorial spaces has been frequent, and the transformation trajectories have been diversified (Figure 11). Production space was converted to ecological space, and living and ecological space were converted to production space, subdivided in sections as shown in Figure 10b. Specifically, the outflow of agricultural space and grassland was frequent, the inflow of industrial and mining space, urban, and rural space occurred frequently, and the inflow and outflow of forest and other space were roughly balanced, subdivided in sections as shown in Figure 10a.
From 2000 to 2010, production space was dominated by outflow behavior, and the transition from agricultural space to other types of space was the most obvious. Agricultural space mainly flowed to the forestland, with an outflow area of 105,034.45 km², which was followed by grassland, water, and rural space, and these outflow areas decreased in turn. Industrial and mining space was dominated by the inflow of other types of space, which mainly originated from the forestland, water area, and urban space. The inflow area was relatively small (only 5412.63 km²), however, with no obvious changes. Living and ecological spaces mainly received an inflow of other types of spaces, among which urban and rural living spaces mainly received an inflow of agricultural spaces, with an inflow of 5803.03 km² and 9550.80 km², respectively, while forestland spaces received an inflow of agricultural and rural spaces, with an inflow of 101,893.67 km² and 6926.52 km², respectively. From the trajectory line of the transformation of land space use types, the transformation behavior was more active in this period, and the types of transformation were diversified. From 2010 to 2020, the production space was dominated by outflow behavior under the influence of the continuous strengthening of the outflow behavior of agricultural space. The degree of outflow has weakened, however, mainly because of the strengthening of the inflow behavior of industrial and mining space, which has manifested in the inflow of forestland, grassland, and water area. Living space received the inflow of other types of space, mainly because urban and rural spaces demonstrated strong inflow behavior, and agricultural space was the main inflow type. The ecological space remained stable, and its dynamic changes were reflected in the interconversion with the production space. The behavior of ecological space flowing to the production space was stronger and greater in area, reaching 196,121 km². The evolution of territorial space in this stage was similar to the previous stage, but the trajectory lines were denser, which suggested that the types of territorial use change were more diverse and the behavior of territorial use change was more active.

3.3. Dynamic Evolution of Territorial Landscape Structure

3.3.1. Evolution of Territorial Landscape Structure at the Class Level

Under the influence of increased human disturbance, the level of fragmentation of the production space landscape pattern, the degree of regularity of shape, and the dispersion of patch distribution all increased. Among them, Area_Mn, PLAND, and AFRAC indicators of agricultural space decreased from 1341, 31.2484, and 1.6601 to 1241, 29.7424, and 1.6589, respectively, and NP and PD increased from 47,561 and 0.0233 to 48,951 and 0.0240, respectively. These changes indicated that the fragmentation degree of cultivated land increased and the shape tended to be simpler, reflecting the increased difficulty of converting agricultural land for large-scale use. The Area-Mn index of industrial and mining space decreased from 254 to 214, but all other landscape pattern indices followed an increasing trend. This change reflected that the industrial and mining space became more fine-grained in the process of expansion, the overall layout tended to be dispersed, and the shape of patches was more complex (Figure 12).
The pattern of living space became increasingly less disturbed by human activities, the spatial layout became concentrated, the patch shapes became irregular, and the degree of fine fragmentation became weaker. The PLAND, NP, PD, and Area-MN indexes of urban and rural space followed a stable increasing trend. Note that the AFRAC index of urban space tended to increase from 2000 to 2010, from 1.4345 to 1.4591, but then it decreased to 1.4366 in 2020, which indicated that the construction of urban space was more disorderly and chaotic in the early development process. With the acceleration of new urbanization construction, however, urban space developed toward order and regularity. The AFRAC indicator of rural living space decreased from 1.6796 to 1.6537, following a continuous decreasing trend, which indicated that the new rural construction was effective, and the rural settlements were becoming more common.
With the rapid development of industrialization and urbanization, the demand for land has been increasing, the ecological landscape area has become smaller, the shape of patches has become complex, the level of landscape fragmentation has become more prominent, and the spatial distribution has become more dispersed. Among these changes, NP and PD indices of forestland and grassland followed an increasing trend, and the Area_Mn index followed a decreasing trend, which reflected the increased fine-grained degree of both. PLAND and AFRAC indicators of forestland increased, from 45.87, 1.6206 to 46, 1.6252, respectively, among which PLAND increased significantly, indicating the forestland expanded and the shape became more complex. Grasslands experienced exactly the opposite change. However, the encroachment and fragmentation of both forestland and grassland increased. Indicators of PLAND, PD, and NP of water and other space followed an increasing trend, and indicators of the Area-Mn index followed a decreasing trend, from 428 to 411, which indicated that the water and other space became more fragmented because of the enhanced impact of human activities. In addition, the AFRAC indicator of water increased from 1.5722 to 1.5725, which could be attributed to the complex shape of the patches of water under the disturbance of human activities. The AFRAC index of other space tended to decrease, from 1.6017 to 1.5914, mainly because of socioeconomic development, which transformed other space into regular and simple shapes to facilitate human activities. Therefore, the fractal dimension tended to decrease.

3.3.2. Evolution of Territorial Landscape Structure at the Landscape Level

From 2000 to 2020, the indicator LSI increased from 256.0091 to 264.8952, reflecting the increasing degree of fragmentation and discretization of landscape patches during the study period (Figure 13). AI and CONTAG indices decreased from 64.6003 and 46.1252 to 63.3742 and 43.2947, respectively. These changes indicated that the degree of landscape agglomeration tended to weaken; the fragmentation level gradually increased; the connectivity of dominant patches, such as agricultural space and forest in the landscape decreased; and the landscape presented a dense pattern of various elements. This showed against the backdrop of rapid regional development, the influence of other types of space on the disturbance of agricultural space and forestland increased. The SHDI and SHEI indices both increased, and SHDI increased more obviously from 1.2733 to 1.3397. This change indicated that the degree of heterogeneity of the territorial space landscape types has increased, the balance and diversity of utilization have improved, and the pattern tended to be diversified. This change indicated that under the influence of other types of landscapes, the control effect of the dominant patches on the overall landscape was constantly being weakened.

3.4. Quantitative Attribution of the Evolution of Territorial Space

During the period from 2000 to 2020, the q-means of natural factors of production, living, and ecological space changed from 0.49, 0.55, and 0.58 to 0.40, 0.34, and 0.44, respectively, which followed a downward trend. The q-means of human factors changed from 0.16, 0.17, and 0.14 to 0.19, 0.16, and 0.26. This change showed that the impact of natural factors on the spatial pattern of the YREB was decreasing, whereas the impact of human factors was increasing (Figure 14).
From 2000 to 2010, natural factors dominated the development of territorial space(Table 6). The major limitation is the terrain conditions. Topographic relief and slope facilitate or hinder human activities and influence the territorial spatial layout. However, with the advancement of technical conditions, its restrictions were constantly weakening. The role of population in human factors continued to become apparent. It may be that since the reform and opening up, labor flowed freely and was cheap. It formed a labor-intensive industrial structure and relied on high labor participation rates to promote economic development. Population mobility or settlement had a great impact on the national land space. In addition, the effect of policy on production space was also larger (X1 = 0.20). Economic development had a greater impact on living space, X12 = 0.21, X13 = 0.22. The level of living consumption had a greater impact on the ecological space, X14 = 0.21. From 2010 to 2020, the influence of elevation and slope remained high. However, the influence of human factors maintained the increasing trend and exceeded the limits of most natural factors. The influence of population remained the most pronounced. In addition, the production space was significantly affected by the level of consumption (X14 = 0.24). As people’s requirements for consumption quality were rising higher and higher, the development of emerging industries met people’s needs for a better life. Promoting regional economic growth. It also manifested in the coordinated development of production and living spaces. Living space is affected by policy (X1 = 0.20) and consumption level (X14 = 0.19). This is closely related to implementing policies such as new urbanization construction and urban–rural integrated development. Ecological space is influenced by economic development (X12 = 0.34, X7 = 0.29). Noteworthy is the balance between conservation and development.

3.4.1. Exploration of Natural Factors

As the natural background of territorial space, natural factors create the basic conditions for the evolution of territorial space patterns. Production space was most affected by topographic relief, elevation and slope, with q-means of 0.61, 0.68 and 0.54 in 2000, 2010 and 2020, respectively. Among these changes, altitude was the dominant factor in the change of the production space in the upper reaches, and the q-mean value reached 0.72. Because the upper reaches terrain is rugged and complex, the elevation difference is large, and human activities are strongly restricted by altitude, which is not convenient for large-scale agricultural farming. In addition, transportation is inconvenient and the population is sparse, which is not conducive to the development of industrial activities. Thus, the production space in the upper reaches decreased significantly when altitude increased. Topographic relief had an obvious influence on the production space in the middle and lower reaches, with q-mean values of 0.65 and 0.70, respectively. As low hills and plains alternate in the middle and lower reaches, the terrain fluctuates greatly, which is not conducive to large-scale agricultural mechanization. In addition, the development of industrial construction activities is restricted. Living and ecological spaces have been significantly influenced by temperature, slope, and altitude, with q-means of 0.21, 0.68, and 0.15 for the three periods, respectively, among which altitude and slope are directly related to the distribution and evolution of living and ecological space in the middle and upper reaches. Because of the complex topography in the middle and upper reaches, the altitude and slope are undulating, and the layout and construction of urban and rural residential buildings are scattered only in those areas that have excellent geographical conditions and in which the altitude is lower and the slope is less undulating. This has created a unique living space pattern of small-scale agglomeration and large-scale dispersion in mountainous areas. Meanwhile, as the lower elevation and slope region in the upper reaches are occupied primarily by production and living space, the ecological space has been distributed primarily throughout the higher elevation region. This region has been less disturbed by human beings and is coupled with complex and diverse mountainous hilly terrain, which has provided rich water and heat conditions and types, further providing a diverse living environment for vegetation growth. The temperature has had a large impact on the living and ecological space in the lower reaches, with q -means of 0.58 and 0.59, respectively. For living space, the lower reaches are located in a subtropical high pressure belt, which has extremely high temperatures and has become the main climate characteristic in summer. The lower reaches have featured a high level of urbanization, the expansion of building land, the enhancement of nighttime lighting, and excessive emissions of automobile exhaust caused by temperature increases. The urban heat island effect has been generated by high temperature and has had a significant impact on the layout of urban and rural residential and infrastructure construction. The temperature rise has exacerbated the frequency of natural disasters, such as floods and storm surges, causing greater duress on the residents in the lower reaches’ coastal areas, further affecting the layout and construction of urban residential areas along the coast. For ecological space, thermal and moisture condition have been important factors affecting the spatial distribution pattern of vegetation. The vegetation coverage in the lower reaches generally has been high in the south and low in the north, which has been consistent with the pattern of thermal and moisture conditions. Thus, it can be seen that temperature has influenced the layout and evolution of ecological space.
Most notably, natural elements have played different degrees of facilitating or inhibiting roles in the evolution and development of the territorial spatial pattern.

3.4.2. Exploration of Human Factors

Human dimensions are the dominant drivers of the evolution of territorial space patterns. Population density, fixed asset investment, local general public budget, total retail sales of consumer goods, and urbanization rate have had prominent degrees of influence. Population density has been the dominant factor in the spatial evolution of the middle and upper reaches of the country, among which the q-means of production, living, and ecological space were 0.34, 0.28, and 0.33 in the upper reaches and 0.22, 0.41, and 0.25 in the middle reaches, respectively. As the development level of the middle and upper reaches gradually improved, the outflow of the population decreased, and the inflow of population increased, which has led to the continuous growth of the regional population. To accommodate the expanding population, urban and rural residential space has increased rapidly, thus expanding the living space. With this increase in the labor force, agriculture, industry, and mining space have followed an expanding trend, and the phenomena of encroaching on ecological land and destroying the natural environment have become increasingly prominent, thus greatly affecting the ecological space. In addition, the ecological space in the middle reaches has been significantly influenced by policy, with a q-mean of 0.31. Under the influence of macropolicies, such as “Ecological civilization construction” and “Conservation of the Yangtze River”, ecological issues have become increasingly important. All provinces in the middle reaches have formulated relevant ecological protection policies and jointly issued the “Tongpingxiu” green development pioneer area construction agreement, which strives to build an ecological green heart in the middle reaches of the Yangtze River. Meanwhile, the policy “Development Plan of Urban Agglomeration in the Middle Reaches of the Yangtze River” clearly identified the need for urban agglomeration to establish an interregional linkage mechanism of ecological construction and environmental protection and to build an ecological urban agglomeration that can be influential. Policy factors have had a notable effect on the development of ecological space in the middle reaches. The q-means of fixed asset investment, local general public budget, total retail sales of consumer goods, and urbanization rate in the lower reaches were greater than 0.80, indicating their significant impact on production, living, and ecological space. Since 2000, these indicators have shown high levels in the lower reaches, especially in southern Jiangsu, northern Zhejiang, and southern Anhui, as well as throughout the entire Yangtze River Delta, where these indicators are driving the economic strength of these regions, improving the quality of rural development, improving the function of urban carriers, making public facilities more adequate, and improving the quality of life of residents. These changes have profoundly affected the evolution and distribution of production and living space in the lower reaches, and subsequently have influenced the development of ecological space in the lower reaches.
Above all, human dimensions have intensified the disturbance to the development of territorial spatial patterns and have played a strong driving role in the evolution and development of the territorial spatial pattern.

3.4.3. Coupled Human–Nature Interaction

We did not identify any factors that played an independent role in the territorial spatial changes of the YREB from 2000 to 2020, but we did find synergistic enhancement effects, which included mutual and nonlinear enhancement (Figure 15).
These results indicated that the development of the territorial space pattern was the result of the synthesis of natural, demographic, economic, policy, and other factors. Natural and human elements work together to promote the formation and development of the territorial space pattern of the YREB. During the study period, the interaction strength of slope, altitude, and population factors generally was stronger than the interaction between other factors. The YREB is a vast area with complex topographic conditions and a large population. Thus, it is inevitable that the interaction between slope, elevation, and population would be stronger and more complex, subdivided in sections as shown in Figure 15A. The development and utilization of territorial space in the different regions followed distinct patterns, subdivided in sections as shown in Figure 15B. Specifically, the upper reaches have a special ecological environment, but GDP and the local general public budget have enhanced the influence of natural elements on the territorial space pattern. The role of policy and natural elements in the middle reaches was more obvious, indicating that the macroregulation of policy has had an obvious driving effect on the development of territorial space in the middle reaches. The lower reaches have experienced active socioeconomic development and natural elements, most notably climate and topographic relief, which have interacted with various human elements to promote the development of territorial space.

4. Discussion

4.1. Analysis of the Spatial Dynamics Evolution of the Territorial Space

Since 2000, the YREB has experienced rapid development through the eastern coast’s priority development strategy, central China’s rise, and western China’s development [39]. Based on land use and socioeconomic data, this study systematically analyzes the dynamic change characteristics of territorial spatial utilization in the YREB from 2000 to 2020 by applying the theory and method of the evolution of territorial spatial patterns.
Under the background of urbanization and industrialization, the territorial space pattern of the YREB has undergone significant changes. Since 2000, industrial, mining, urban and rural spaces have been expanding significantly. The demand for production and living space keeps increasing, the area of ecological landscape decreases, the patch shape becomes complex, and the level of landscape fragmentation becomes larger. It indicates that the phenomenon of encroachment and segmentation of ecological space is increasingly severe, and ecological problems are prominent, which is the same as the previous research results [40,41,42]. With time, the development of China’s territorial space will shift from intensive development and utilization in 2000 to high-quality development and utilization of equal importance to development and protection in 2020. Under the influence of the policies of returning farmland to forest (grass), natural forest resources protection, and ecological civilization construction, ecological issues have been emphasized. The transformation of production space to ecological space is obvious, especially the inflow of agricultural space to woodland and grassland is especially significant [43]. It shows that the YREB pays more attention to the ecological environment while ensuring the stable expansion of production and living space. The coordinated development of production, living, and ecological space is improving, consistent with previous studies [44,45]. However, in general, the problem between development and conservation will not be solved overnight. The YREB is a vast area with a long development history, and despite many control measures, there is no guarantee of immediate results [46]. The research shows that the development of ecological space is slightly different from the expectation, with the same result as related research. However, under the constraints of national and regional ecological protection policies, the reduction of ecological space quantity will be effectively controlled, which will undoubtedly lead the social economy to develop in the direction of green and high quality in the future. In the future, the YREB should strengthen spatial management, prevent ecological space from being excessive, and expand ecological space to provide an ecological protection barrier for regional development under the effective control of production and living space.
The territorial space of the YREB shows prominent characteristics of geographical differentiation. Production and living space are mainly located in and expand significantly around areas with relatively flat topography and more developed economies, concentrated mainly in the middle and lower reaches. Ecological space such as forestland and grassland are mainly located in less developed mountainous areas with relatively rugged terrain [47], mainly in the upper reaches. However, its expansion area is mainly located in the lower plain with low topography. Since the lower reaches have reached a relatively high level of social and economic development, in order to implement the national environmental protection strategy, the main task is to guide the coordinated development of production, living, and ecological space. In general, the significant regional differences in the territorial space of the YREB hinder its coordinated and sustainable development. It should focus on shrinking regional development differences and promoting coordinated development of the YREB.
It is worth noting that the YREB is an important agricultural production base in China. Under the background of rapid development, cultivated land resources carry a large load, and non-agricultural construction and ecological farmland conversion occupy a large number of cultivated land resources, leading to the contraction and fragmentation of agricultural production space [48]. To ensure food security, we should emphasize optimizing and adjusting the structure of cultivated land and promoting agricultural science and innovation to promote the intensive use of cultivated land.

4.2. The Driving Force of Territorial Space Evolution

Related studies show that 60% of land use/cover change can be attributed to human economic and social development activities, and 40% of land use/cover change is related to climate change and other factors [49]. The YREB is one of the most densely populated regions. The population is the dominant human-driven mechanism in the evolution of the territorial space pattern of the YREB. On the one hand, it promotes regional development; on the other hand, it leads to continuous urban and rural expansion, the construction of industrial and mining enterprises, and the opening of transportation routes. It causes the occupation of cultivated land and ecological space, which eventually endangers food security and destroys ecological balance. In order to play a positive role, reduce the negative role. In the future, the provinces should reasonably assess the population carrying capacity and potential, break through the bottleneck of the population carrying capacity, improve the population carrying capacity, scientifically optimize the spatial distribution of population, formulate relevant policies to regulate population growth and migration, guide the population to grow moderately, and avoid adverse effects of population issues. In addition, measures should be taken accordingly to the economy, consumption, and urbanization to promote the development and utilization of territorial space in a positive direction.
Natural factors profoundly influence territorial spatial changes, but the degree of explanation gradually decreases. Changes in topography affect the type of territorial space use and distribution throughout the basin. The YREB is a vast zone with complex topographic and climatic conditions, showing a micro topographic pattern that was high in the west and low in the east. Regional differences in natural endowments also have created regional differences in the development of territorial space to a certain extent. Even though the influence of the natural environment has continued to weaken and the restrictions of human activities by nature gradually have decreased, the role of the natural geographical base in supporting and constraining the development of the territorial space pattern should not be ignored [49]. The study’s results on driving forces are consistent with previous research results [50,51].

4.3. Innovative Points and Deficiencies in Research

The innovation of this study lies mainly in the scale of the study area and its dynamic character of territorial spatial development as a major national development strategy. Exploring the territorial space development of the YREB from a comprehensive perspective is of practical significance in promoting regional development. Study on the territorial space of the YREB. From the perspective of the research scale, more local attention is paid to the territorial space development of each river basin or urban agglomeration. There are fewer studies on the YREB on such a large scale and full scale. This study takes the YREB of China as the research area, which to some extent, can make up for the shortcomings of the current research on the whole large-scale area of the YREB. From the perspective of content, the earlier studies mainly focused on analyzing the spatial evolution and optimization of the territorial space and were less concerned with analyzing the driving mechanisms. Based on the production, living, and ecological space system, this study analyzed the characteristics and driving mechanism of territorial space evolution in the YREB. It will help to reveal the problems that hinder the process of regional development and to take development measures according to the driving mechanism in a localized manner. As a model area for ecological protection and high-quality development in China, the study can promote the high-quality development of the YREB. However, the shortcoming is that the accuracy of the land use data in this paper is not high enough. Although it can reflect the territorial spatial development trend at a large scale, the higher the accuracy of the data, the better the effect of the research results will be. At the same time, the humanistic indicators selected in this study are not rich enough when assessing the driving mechanism. The reason for this is that this study involves 130 prefecture-level cities with a large amount of data, and statistical indicators for some border cities and minority autonomous regions are difficult to find. Therefore, the lack of transportation and science and technology indicators makes it impossible to unify the indicators. Thus it failed to make the indicator system more comprehensive and rich. To sum up, the study has some shortcomings, but they do not affect the performance of the core ideas of this paper, which can still reflect the actual development of the territorial spatial pattern.

5. Conclusions

Based on land use and socioeconomic data, in this study, we systematically analyzed the dynamic change characteristics of the YREB territorial space by applying the theory and method of territorial space pattern evolution. Additionally, we explored the factors affecting the territorial space through geographic detectors. The main conclusions of this study are as follows:
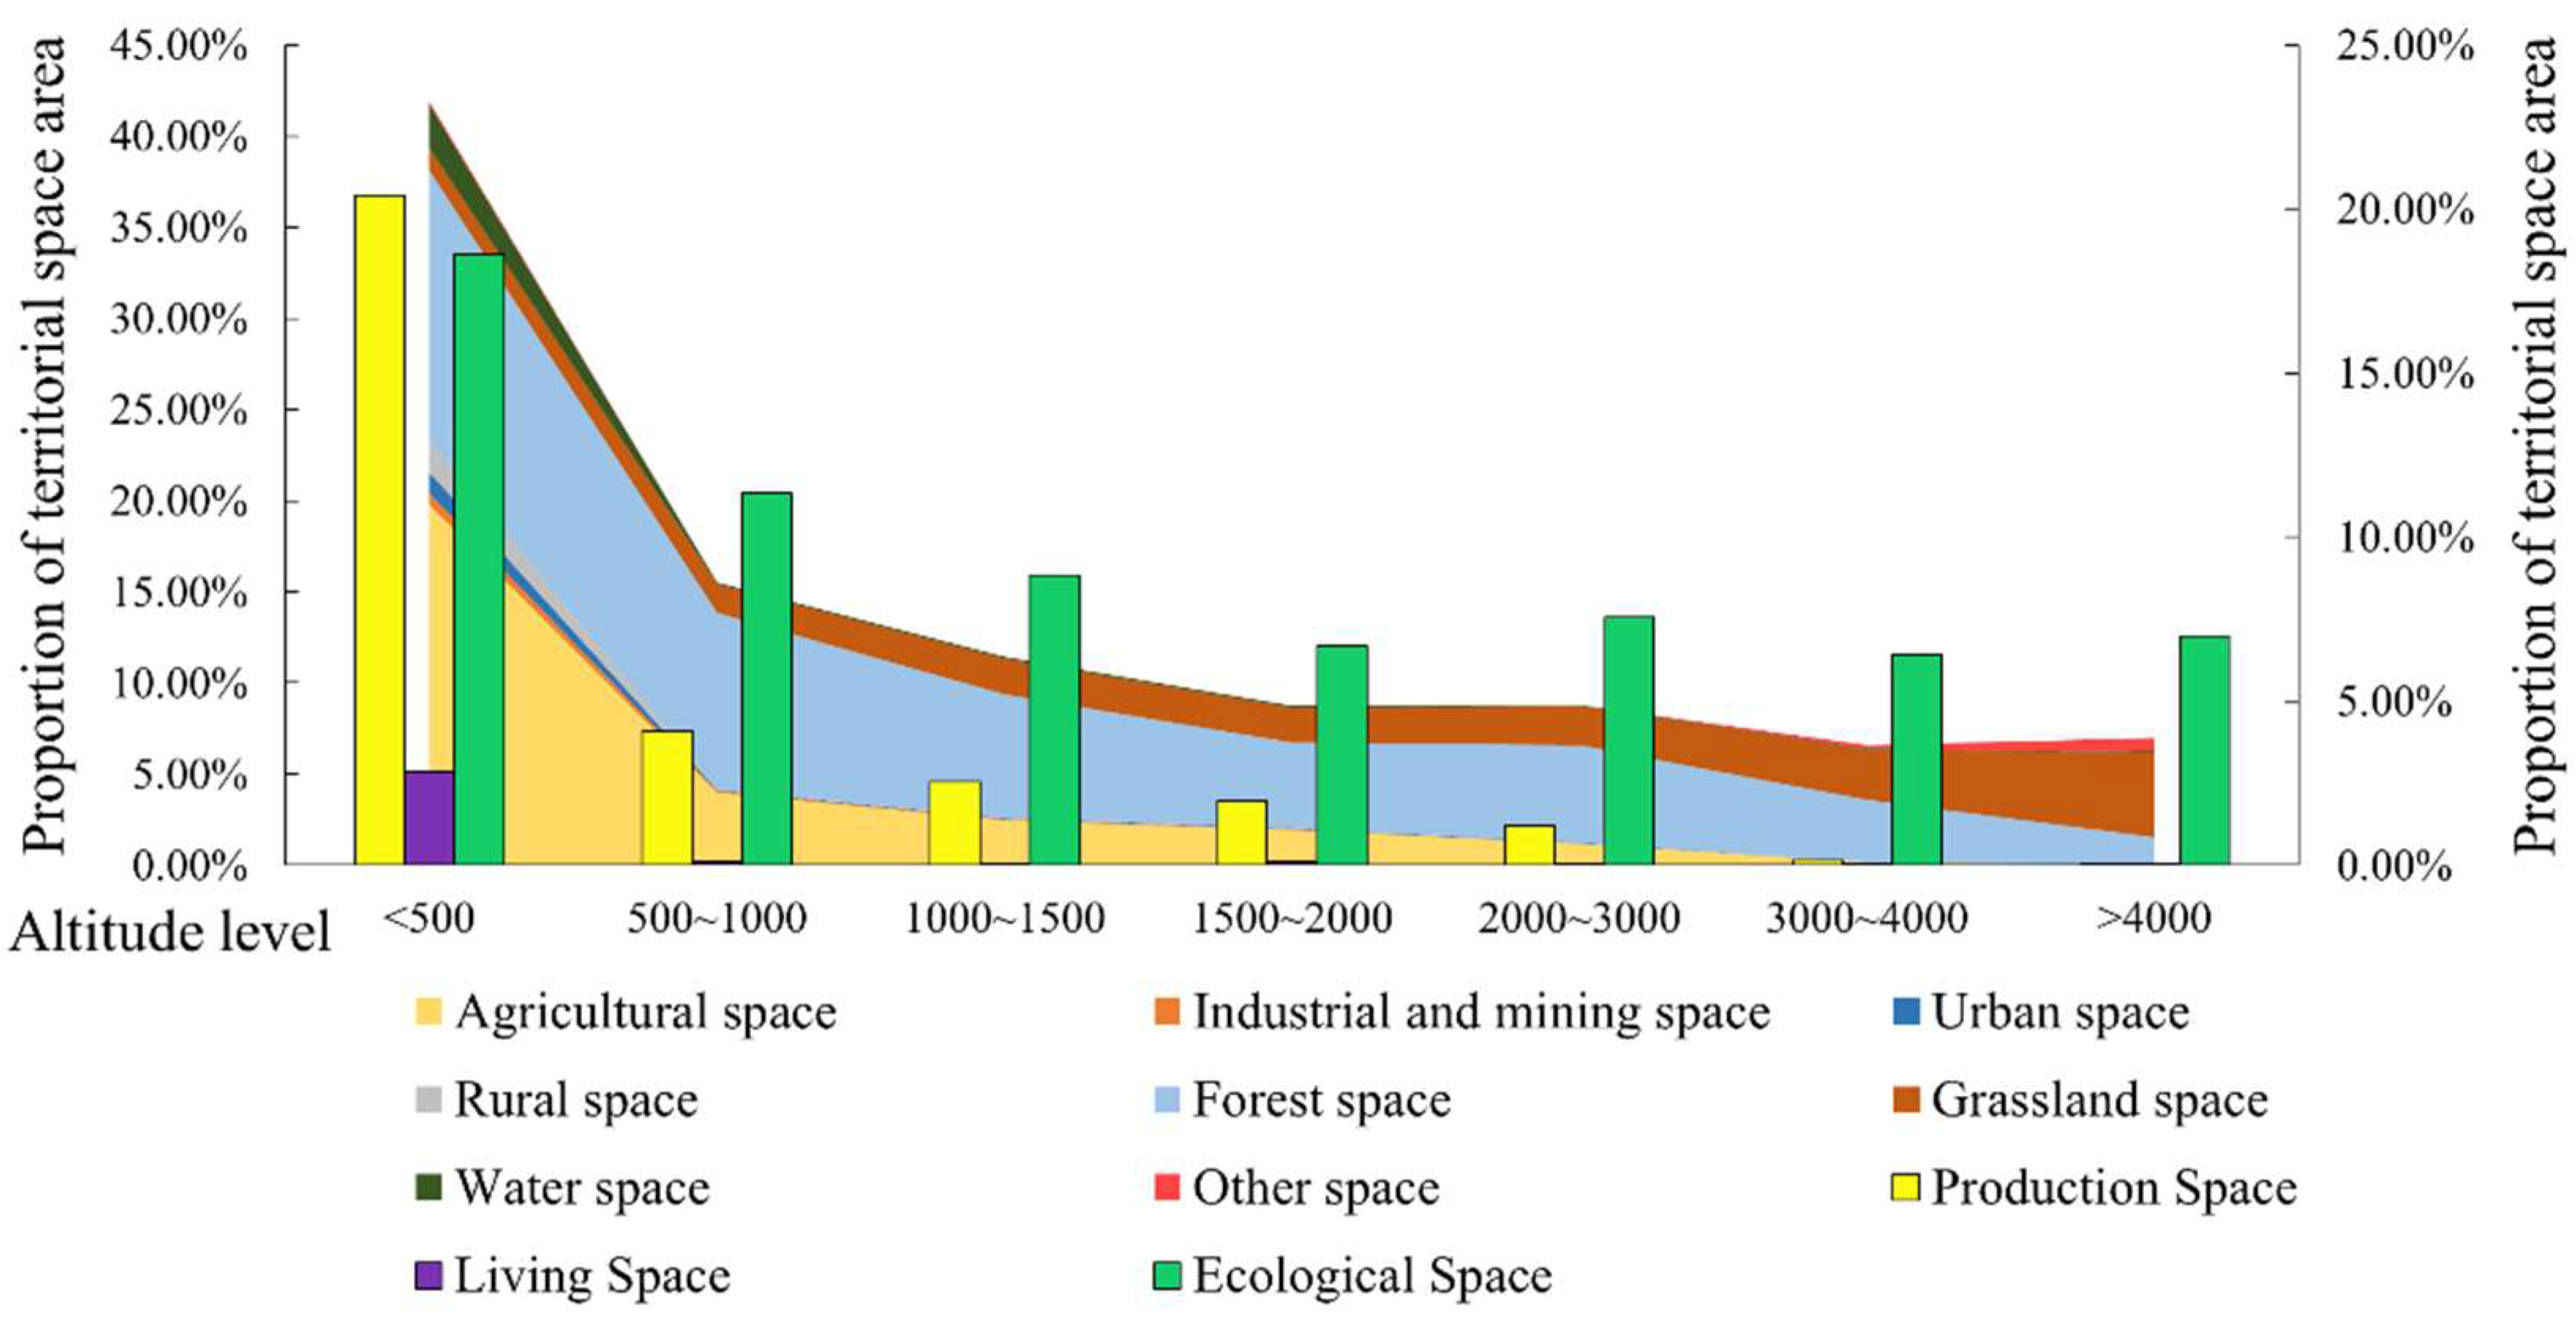
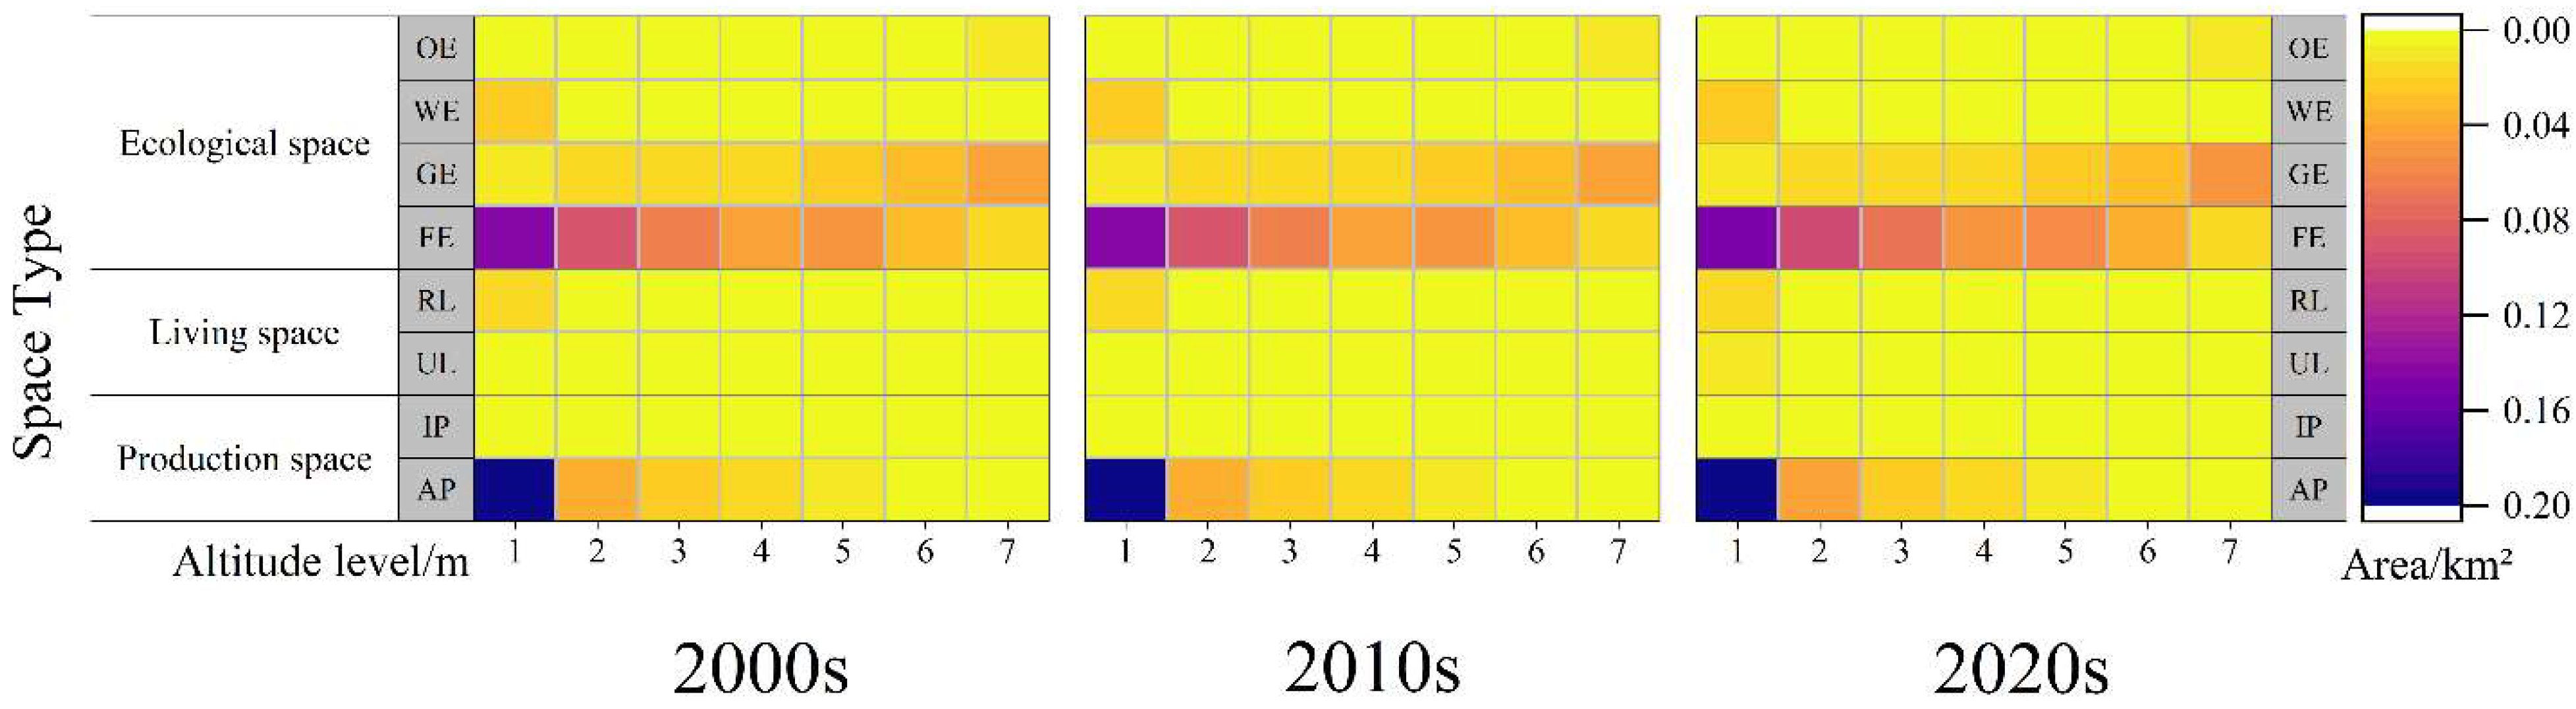
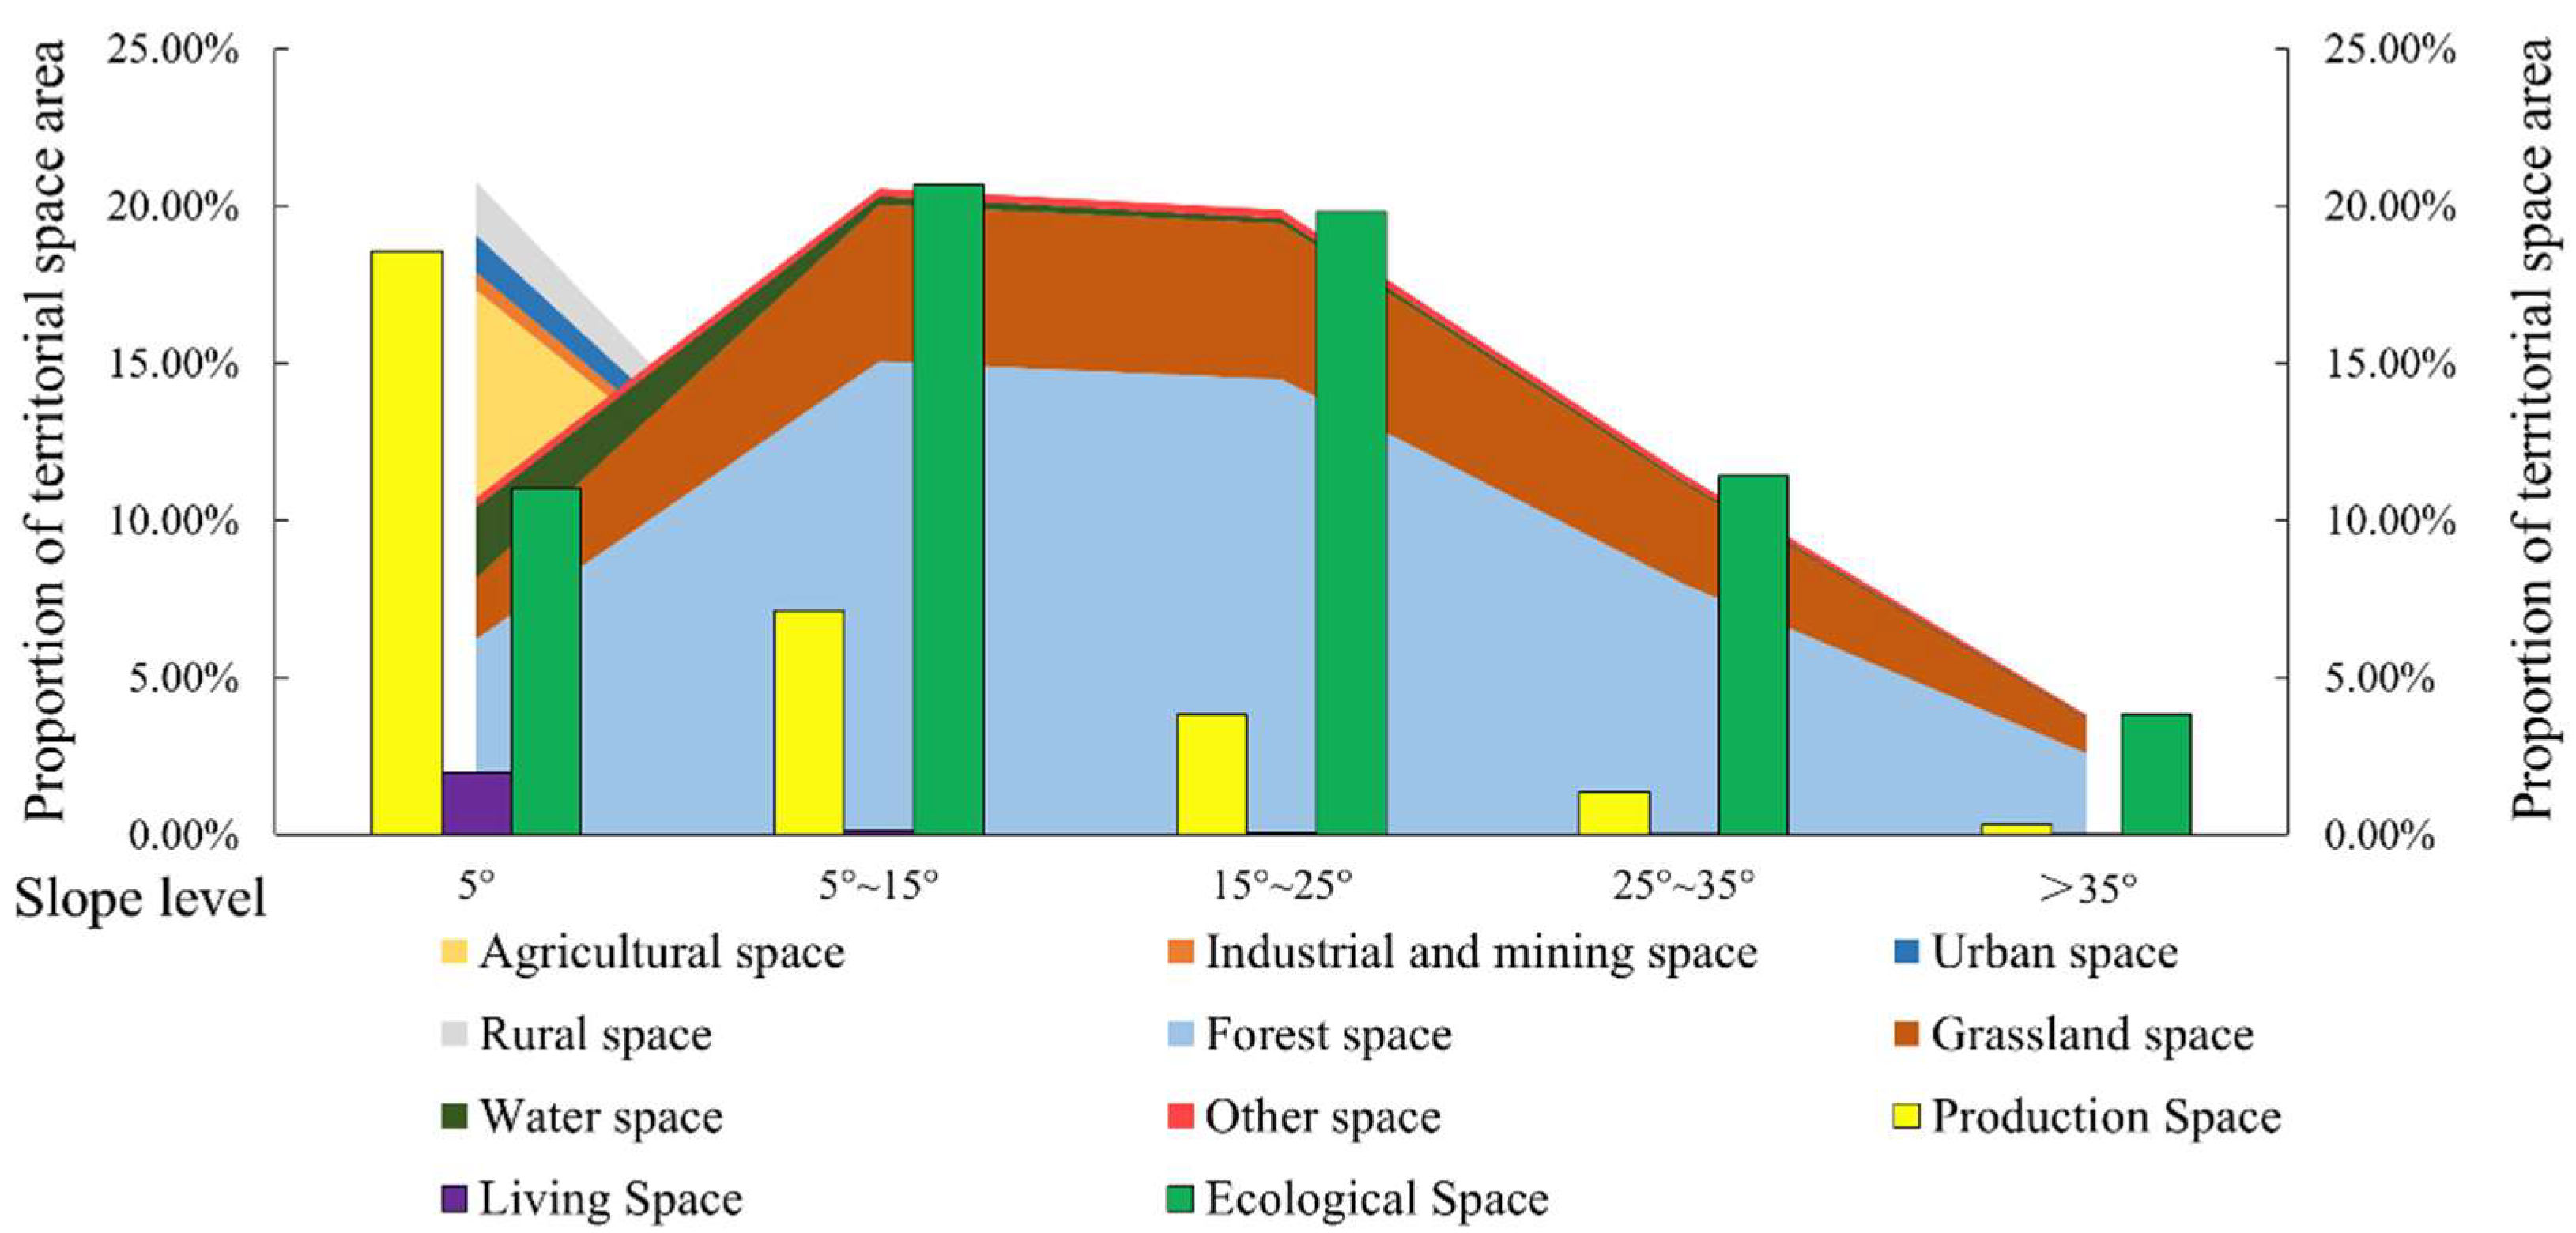
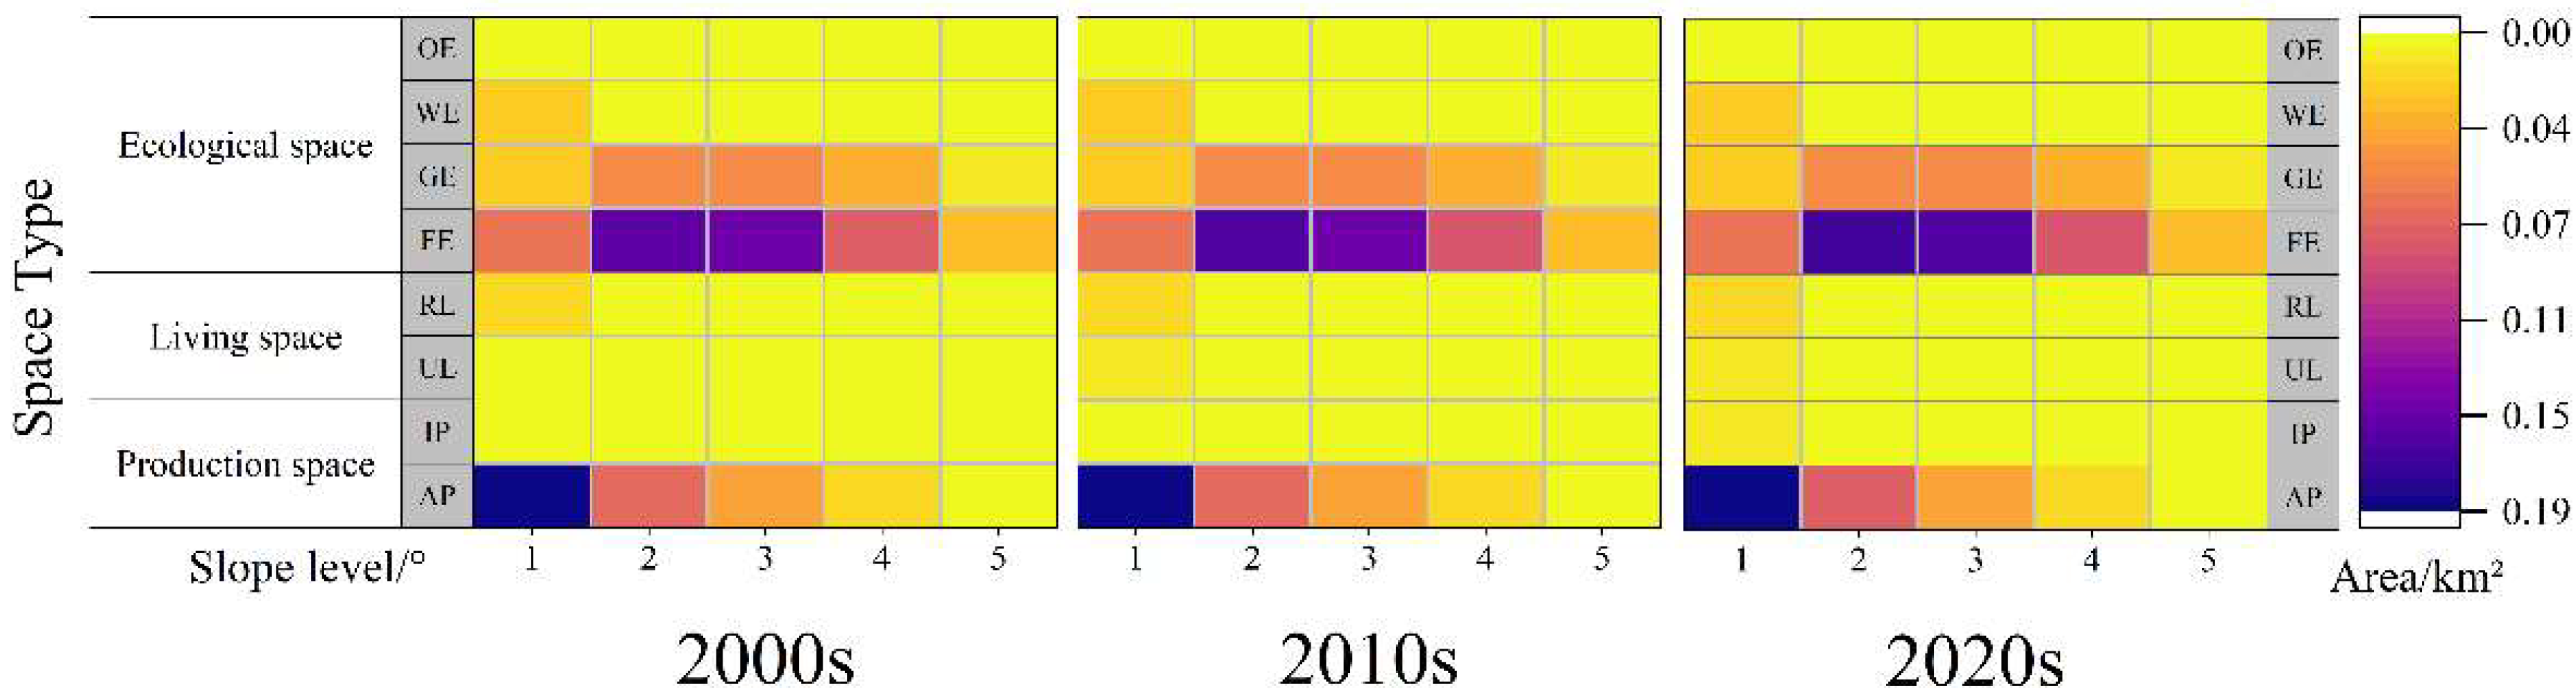
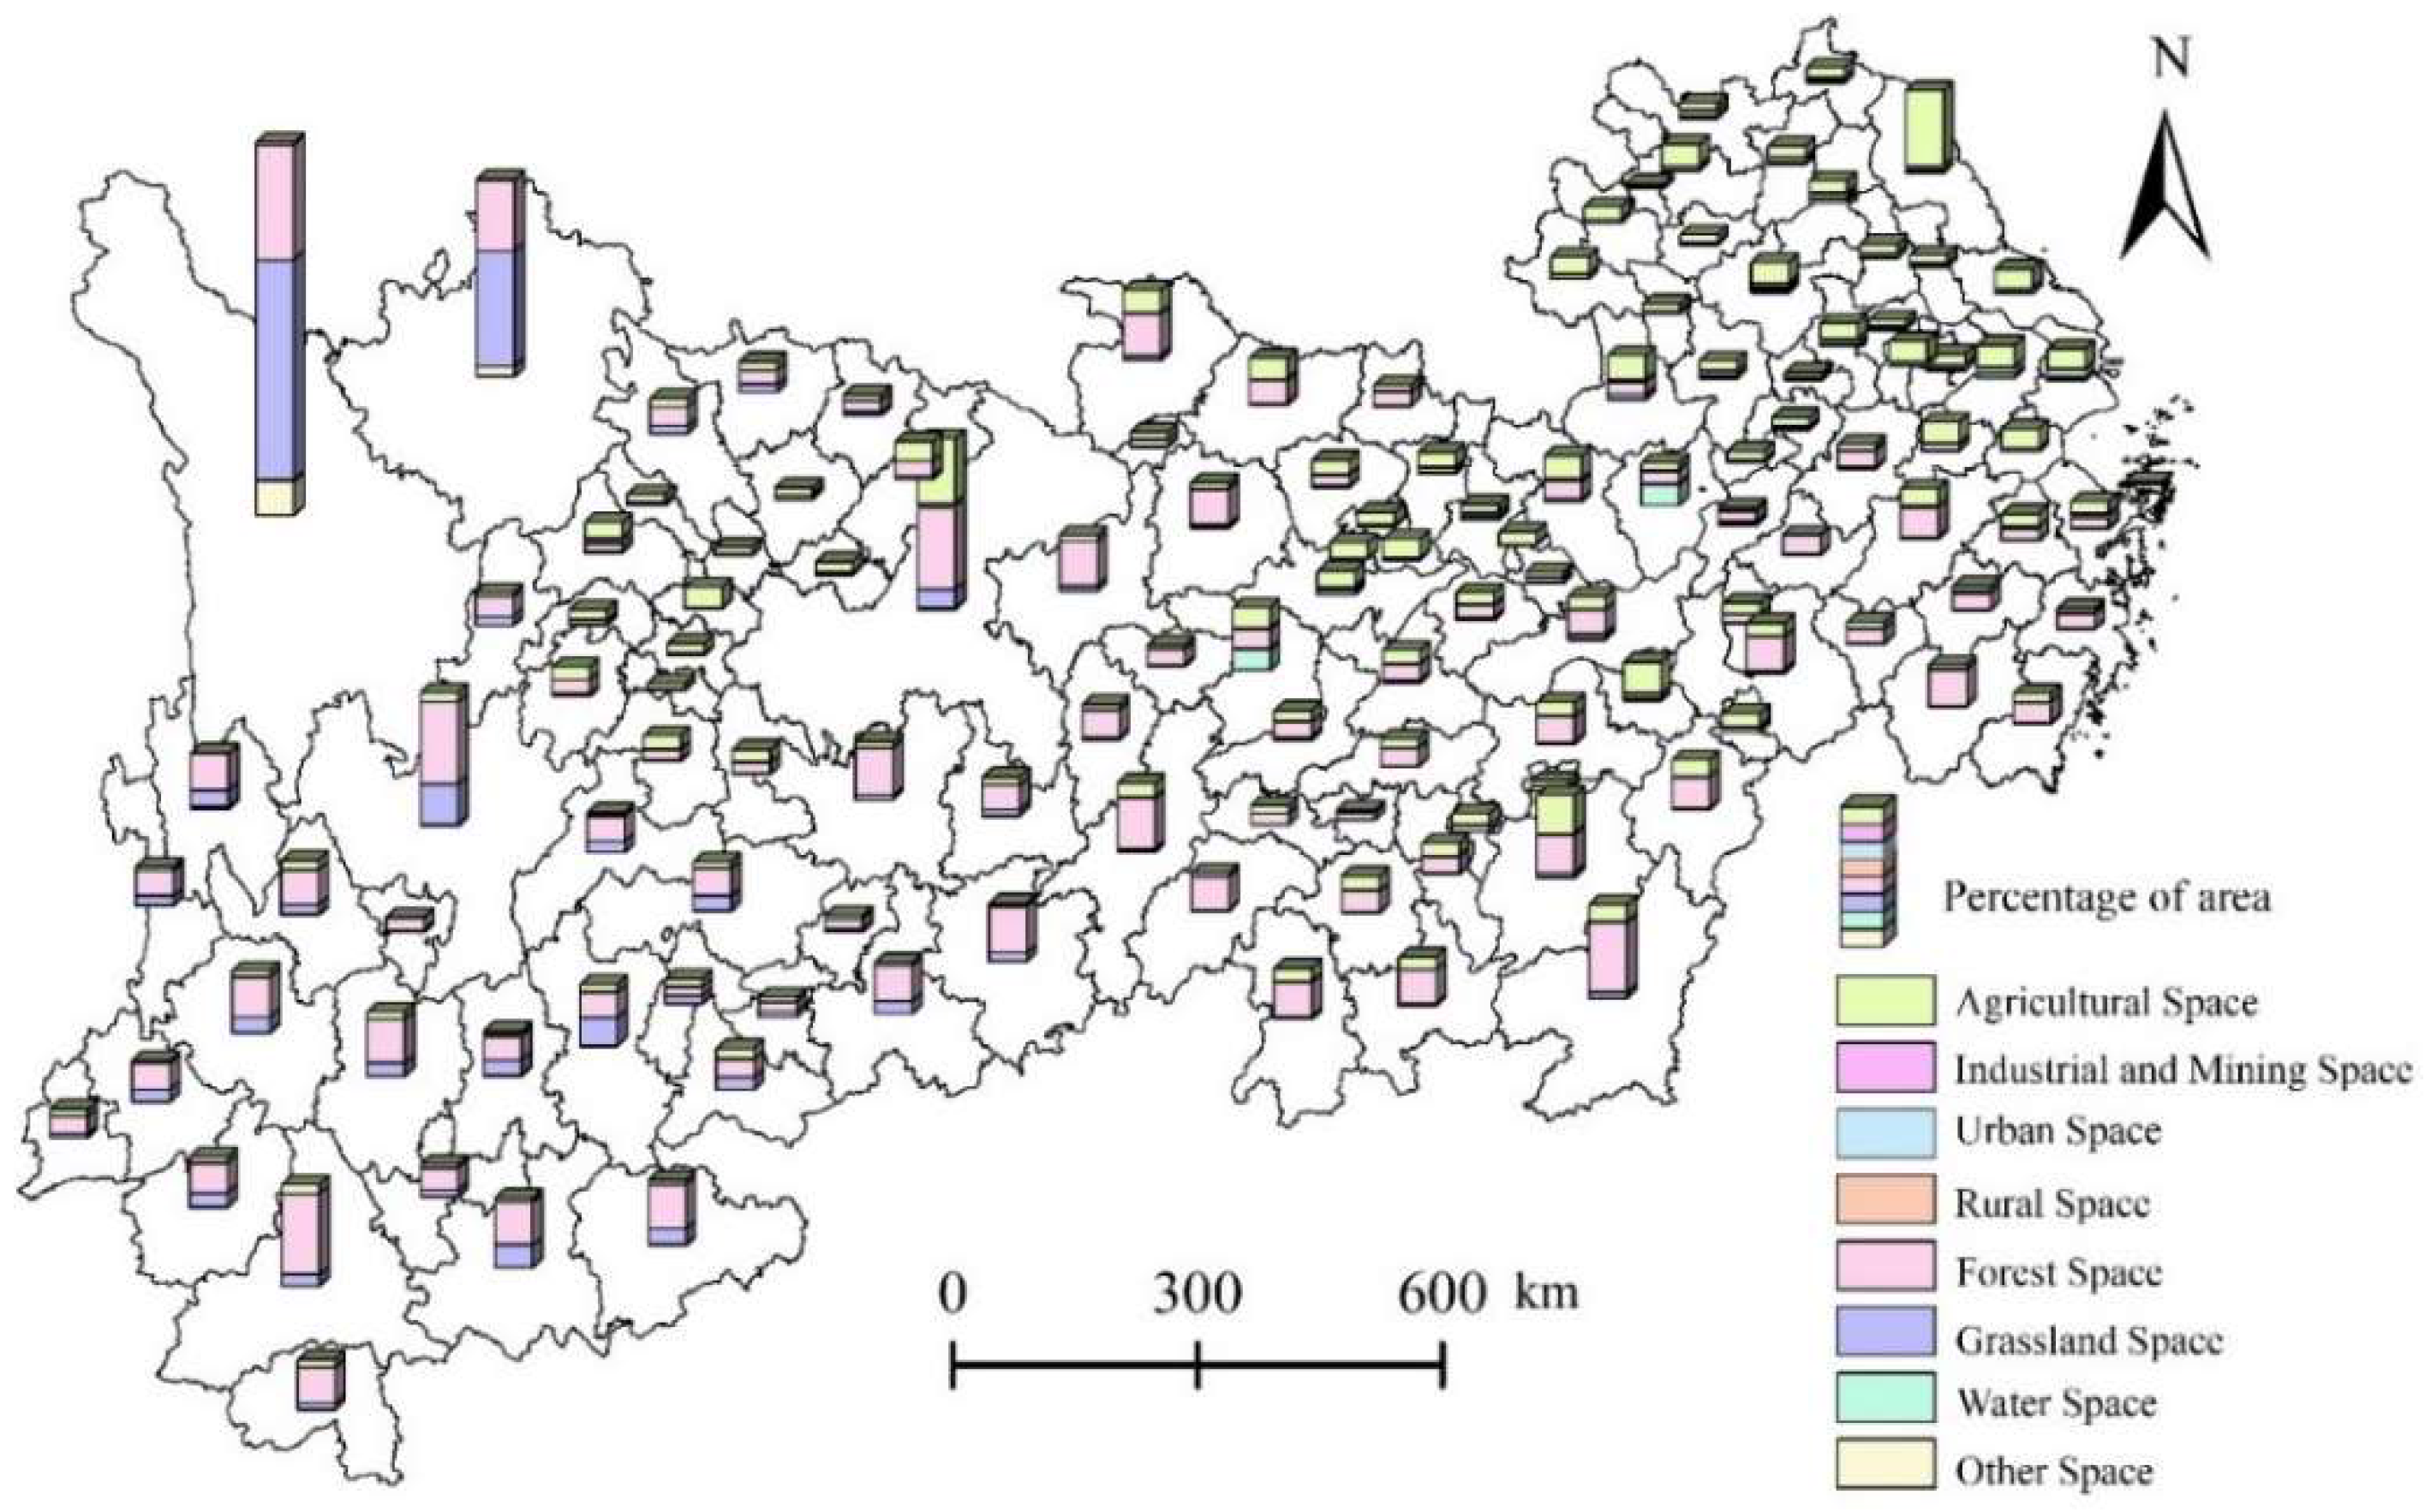
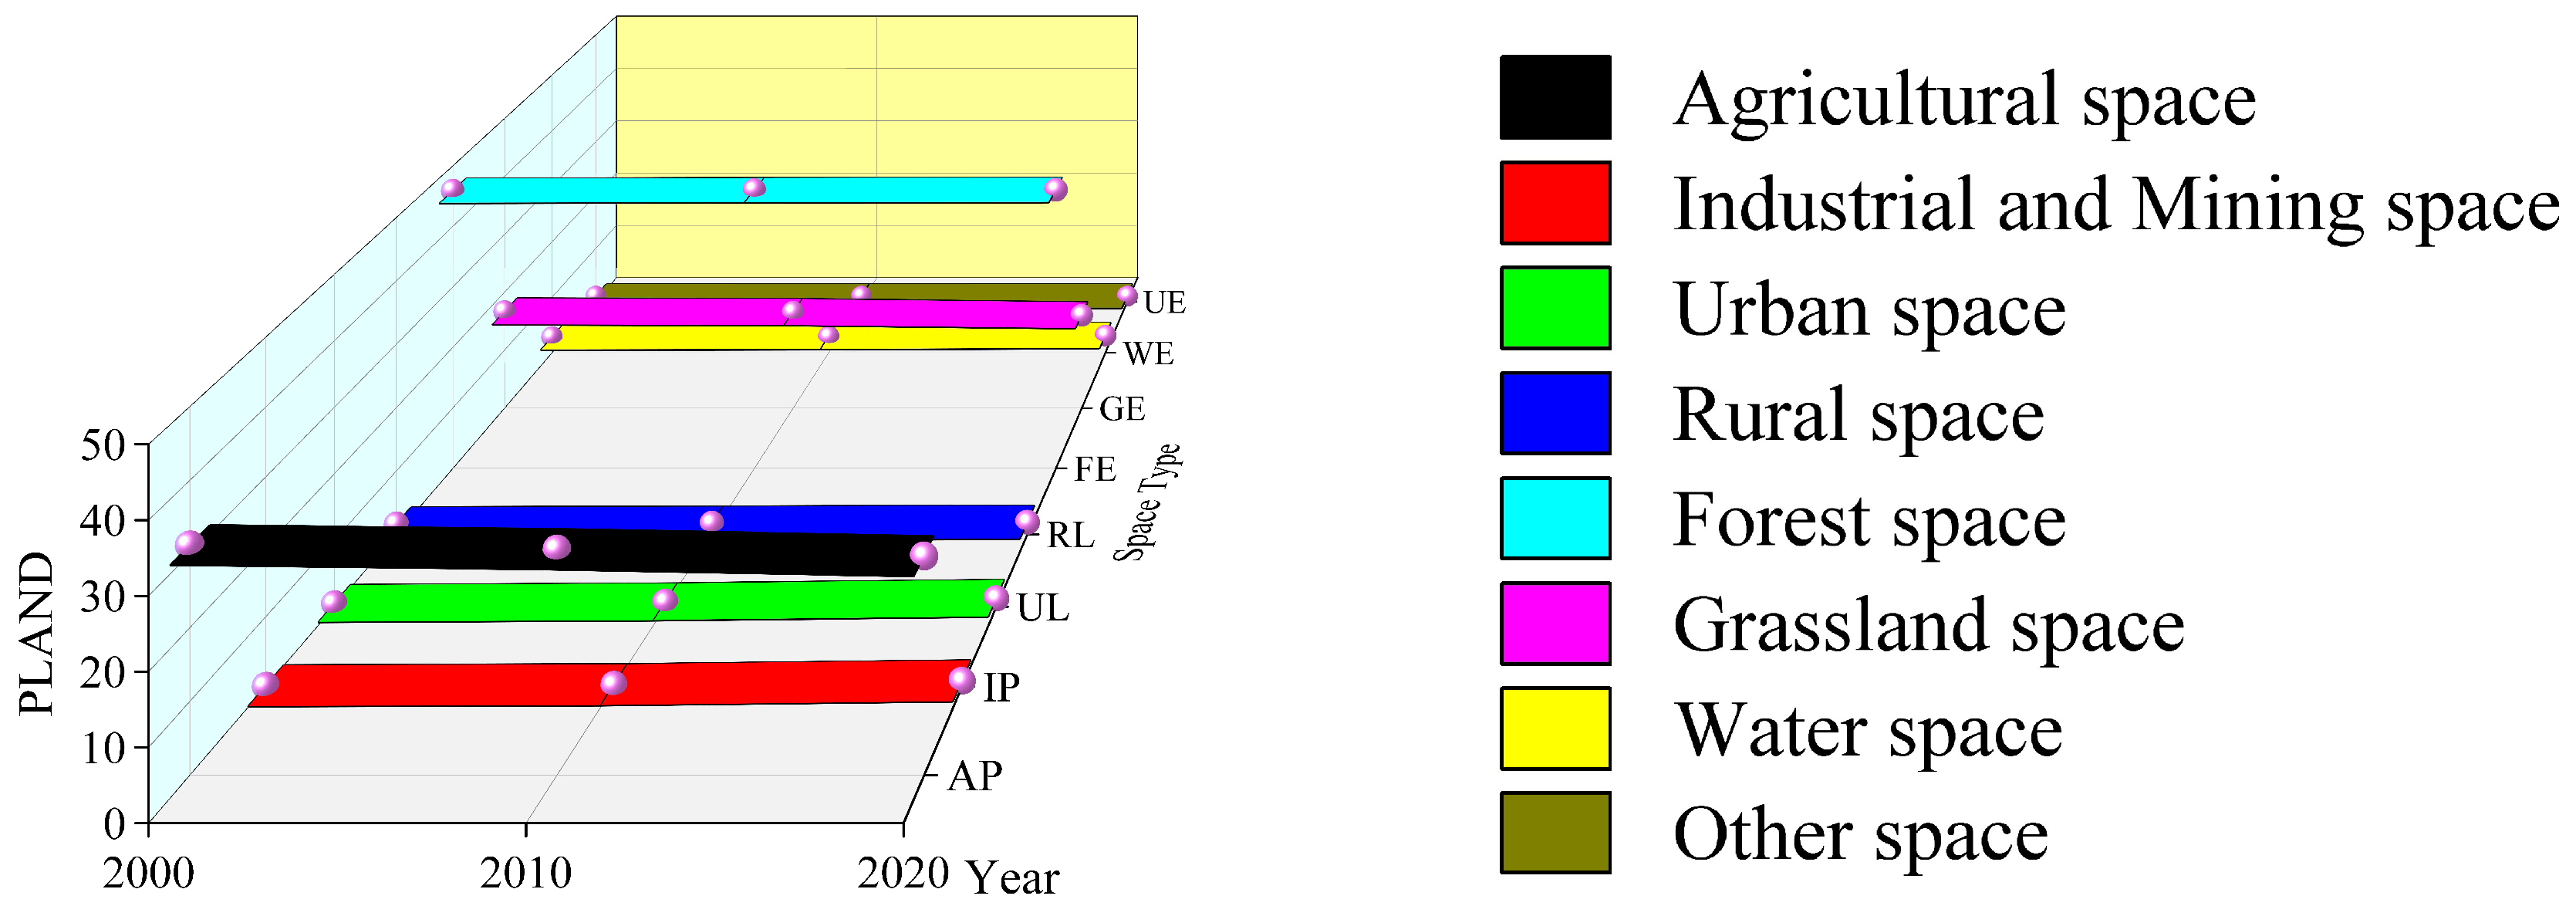
First, the territorial space in the YREB is characterized by a rather obvious geographical hierarchical distribution in terrain gradient. The dominant types of territorial space in the low and middle terrain areas included agriculture, industrial and mining, urban and rural space, and water areas, which were the dominant distribution areas of production and living space. The high terrain areas featured forestland, grassland, and other space, which were the dominant distribution areas of ecological space. With the increase of altitude and slope, production and living space contracted, and ecological space expanded.
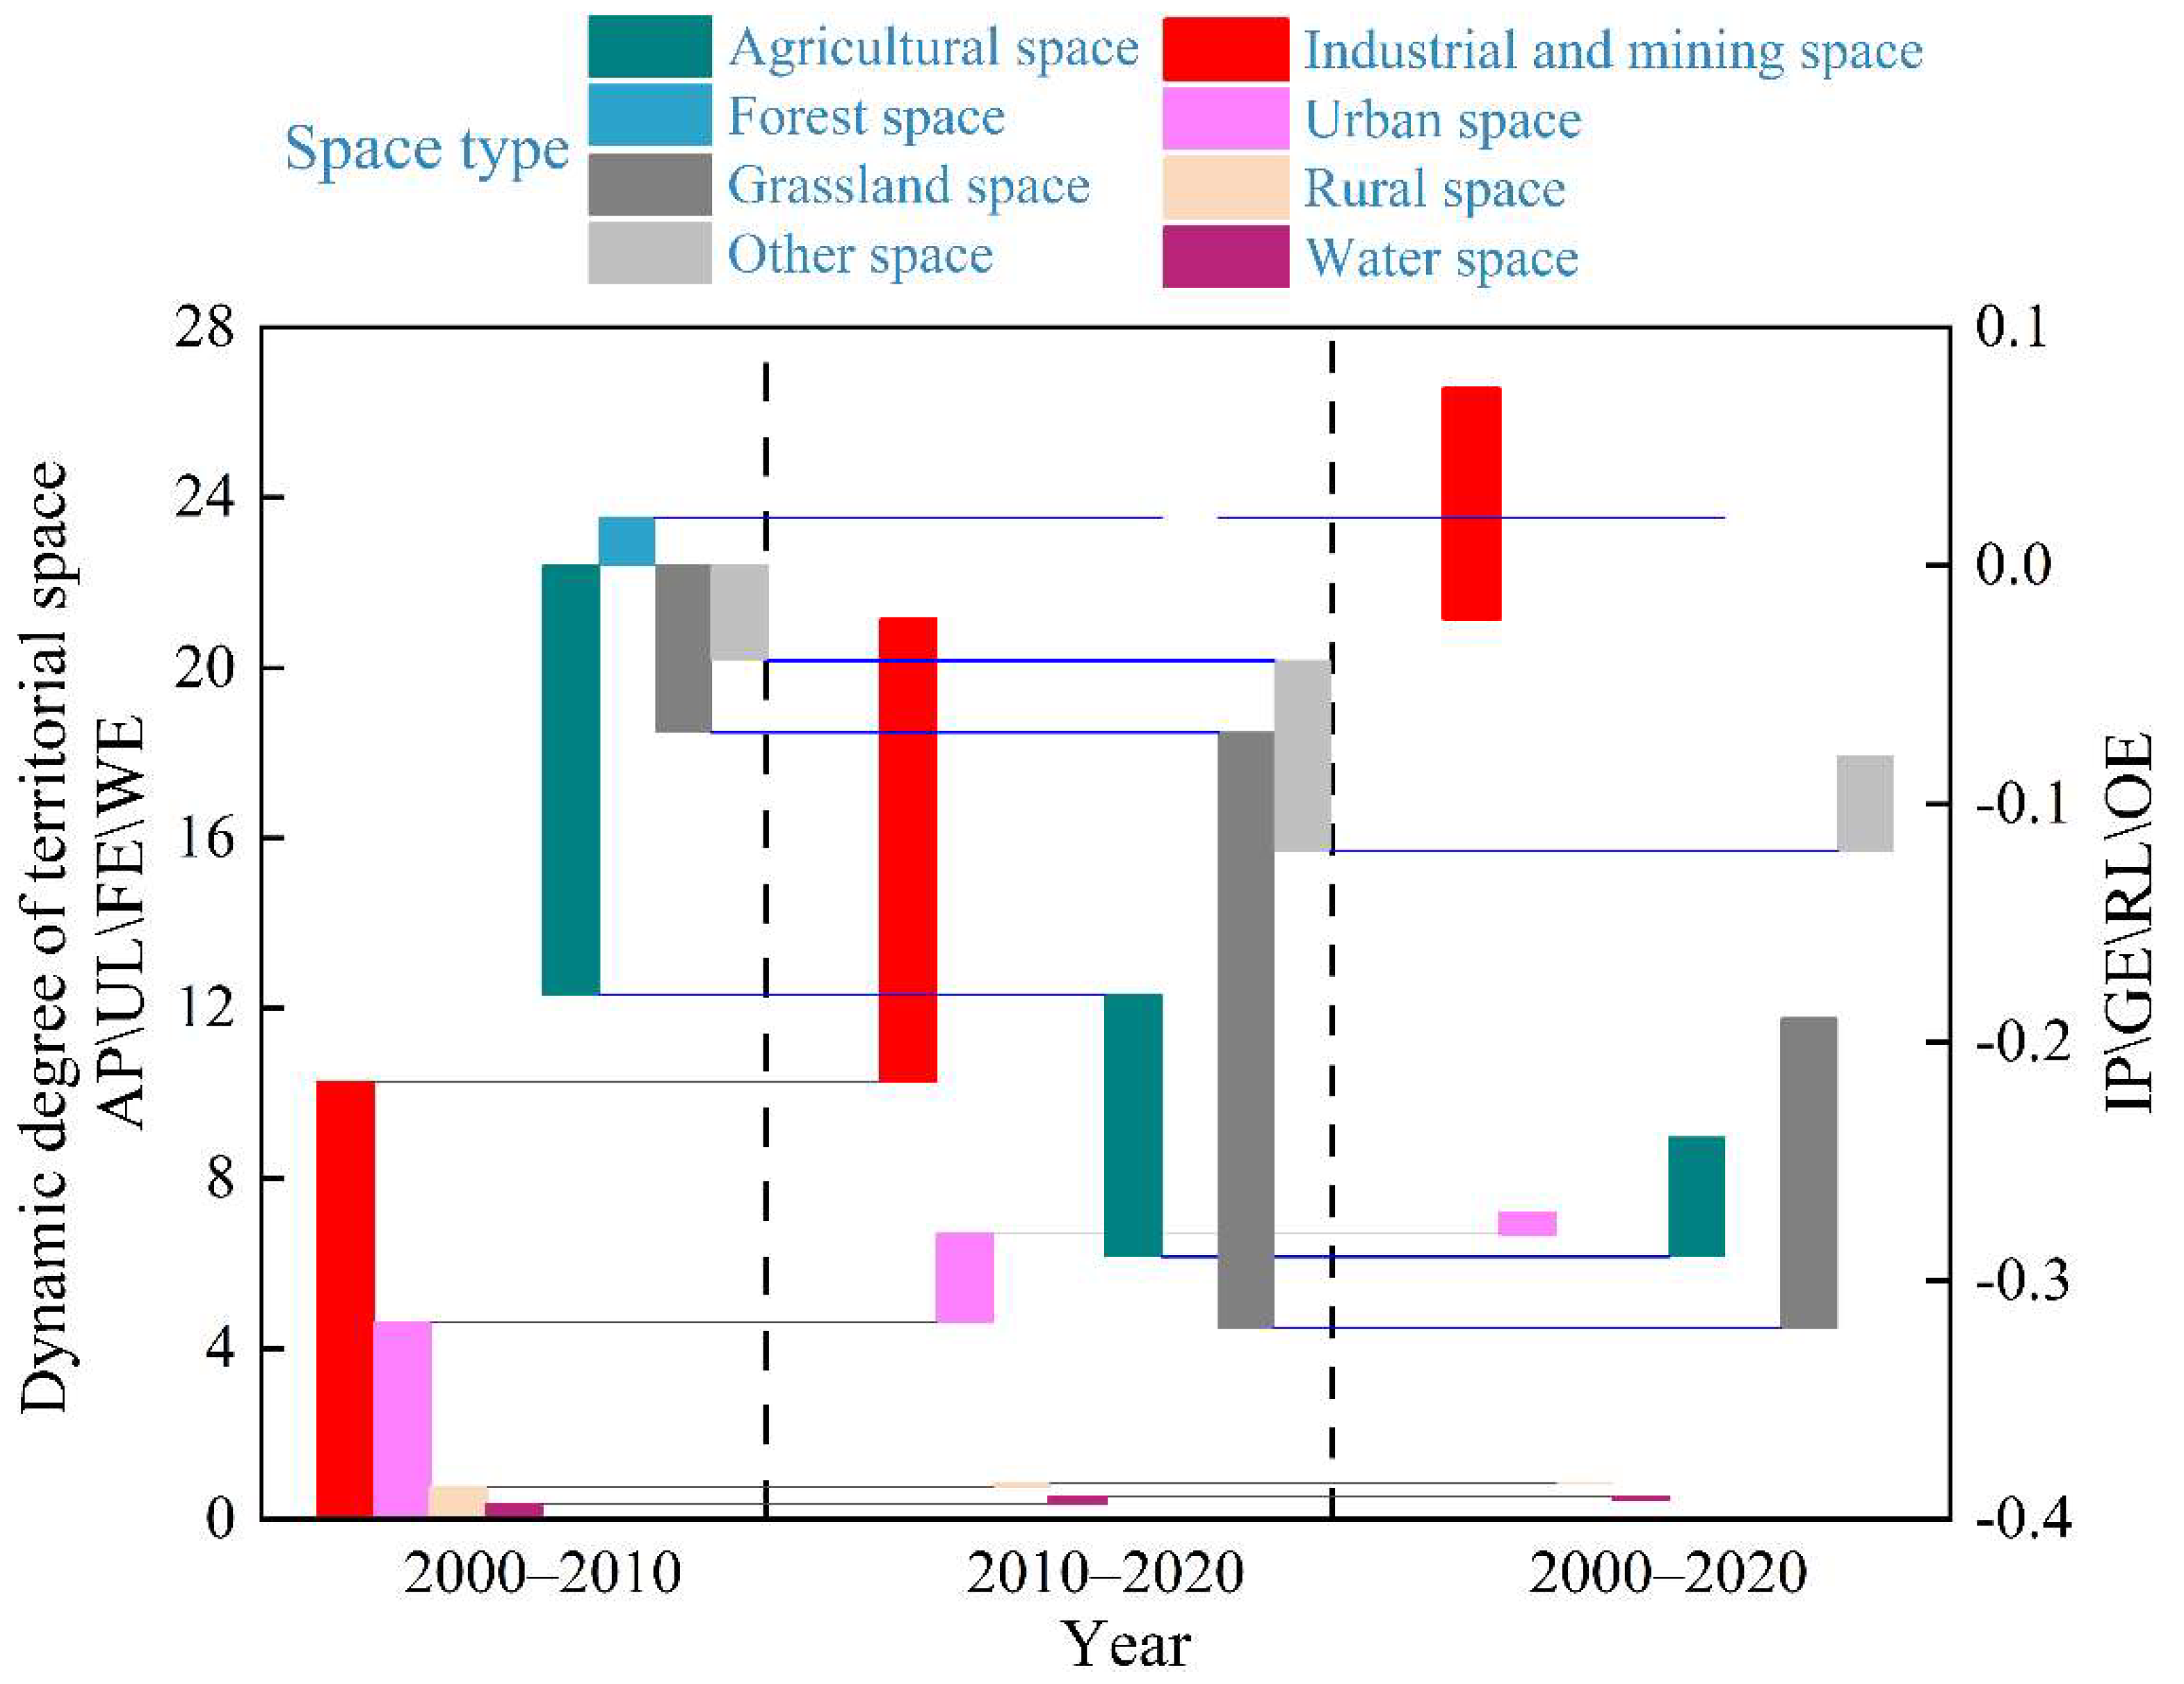
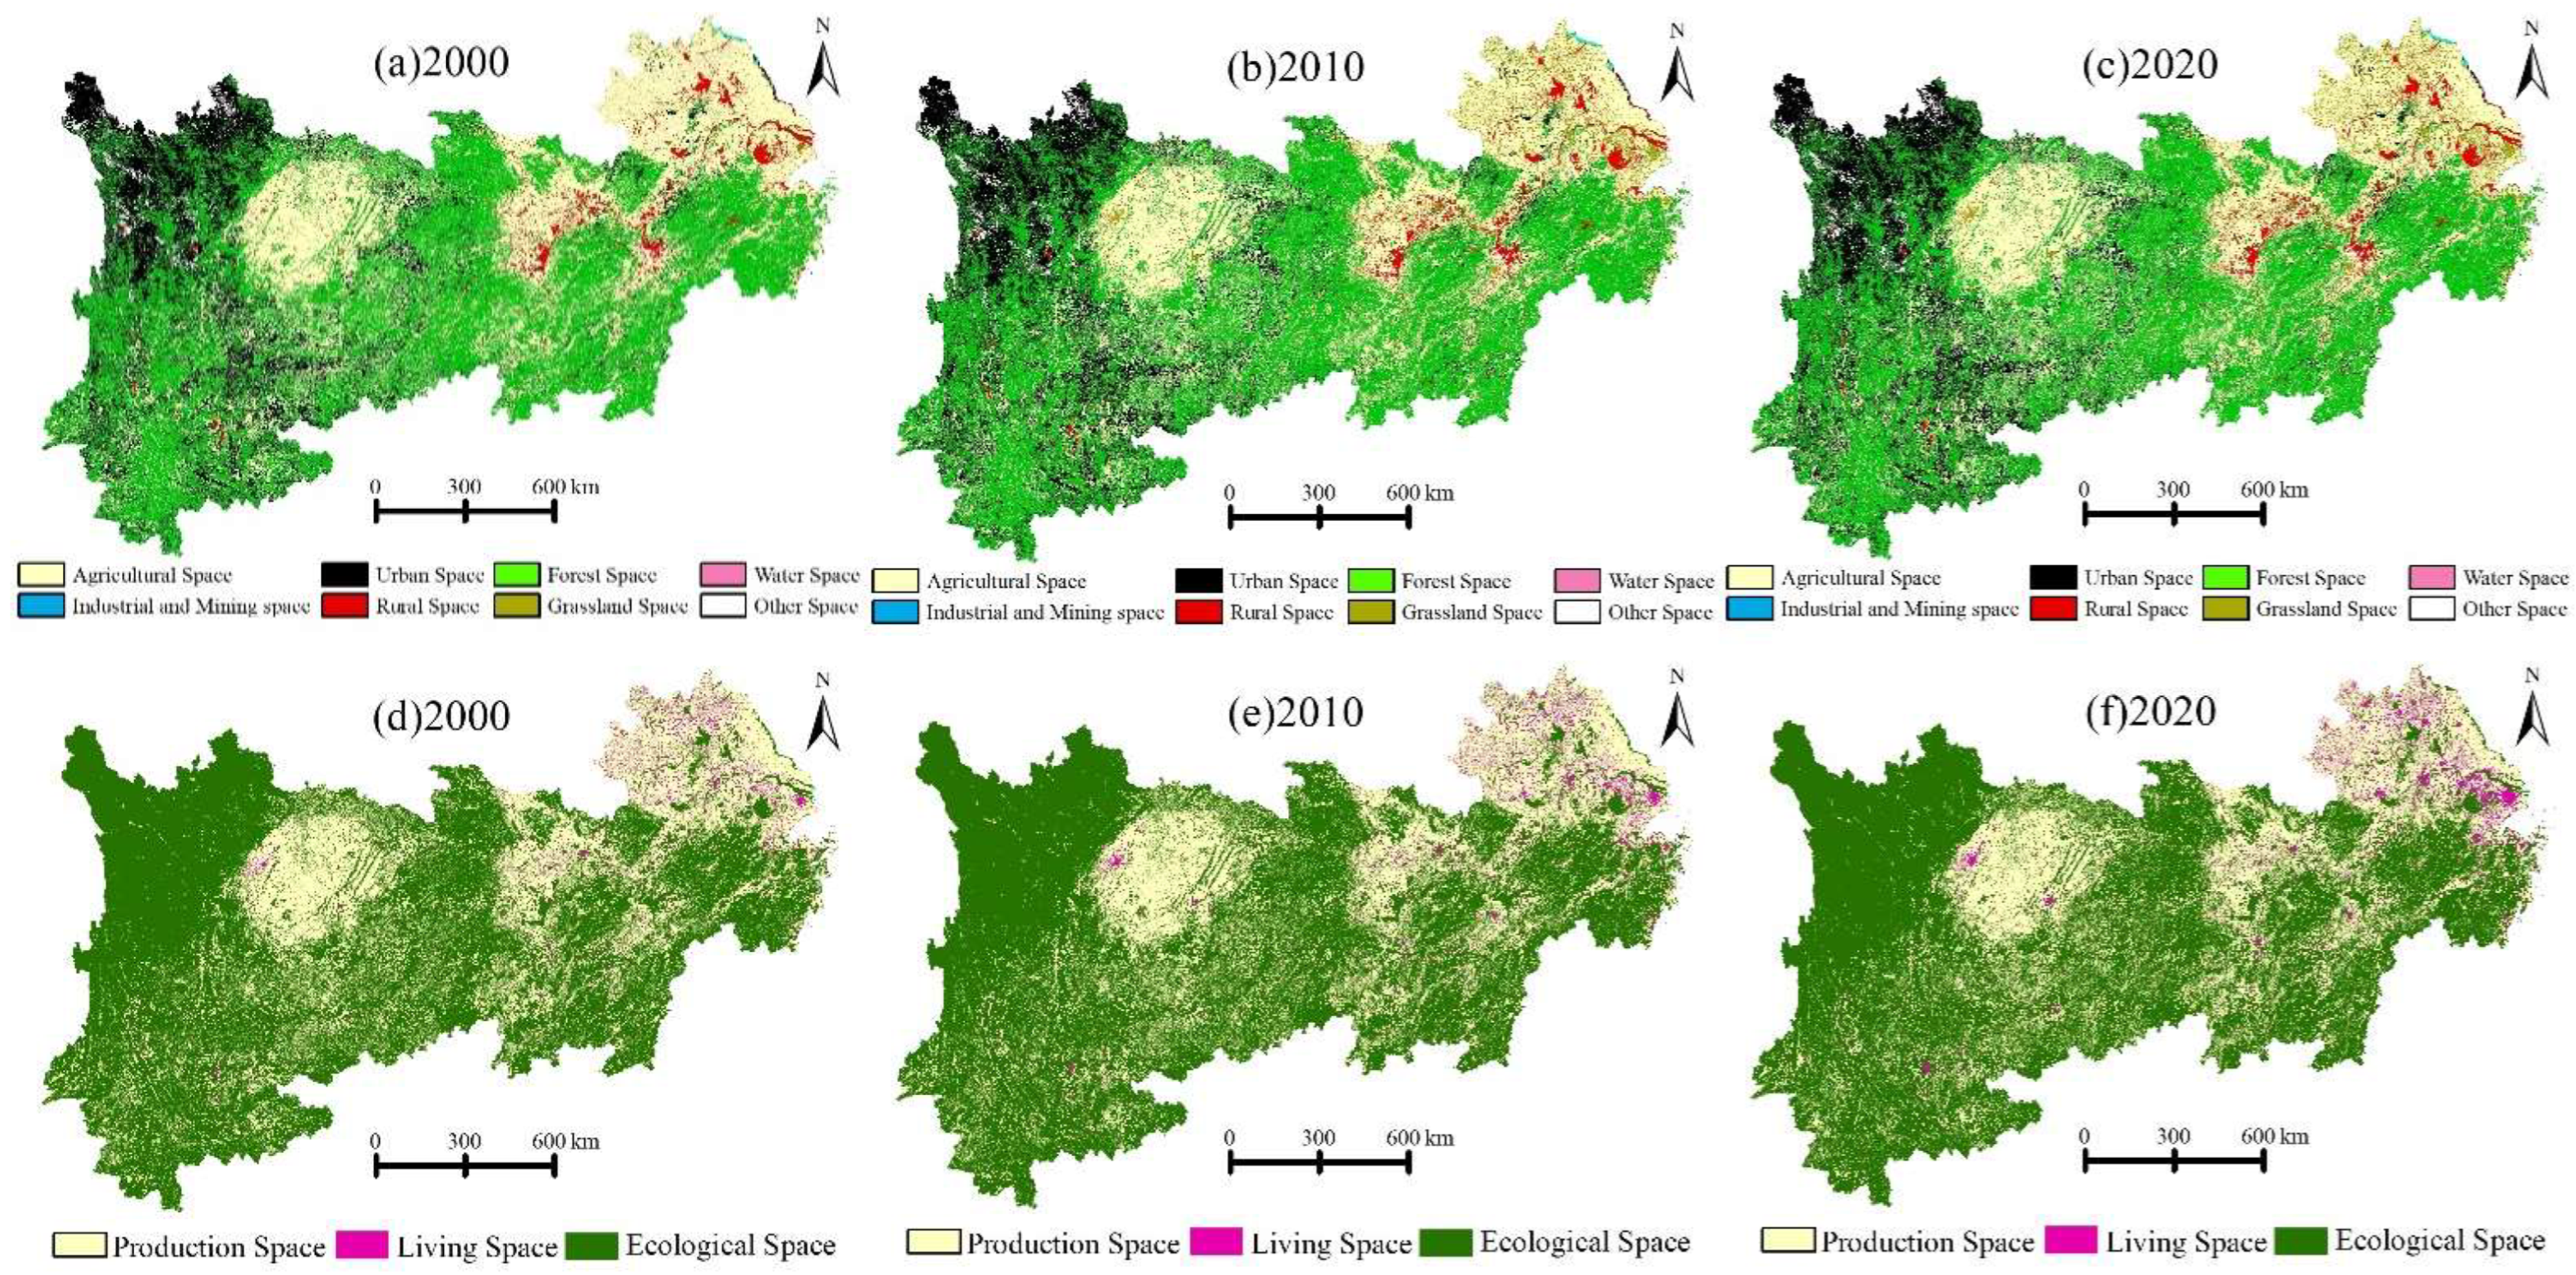
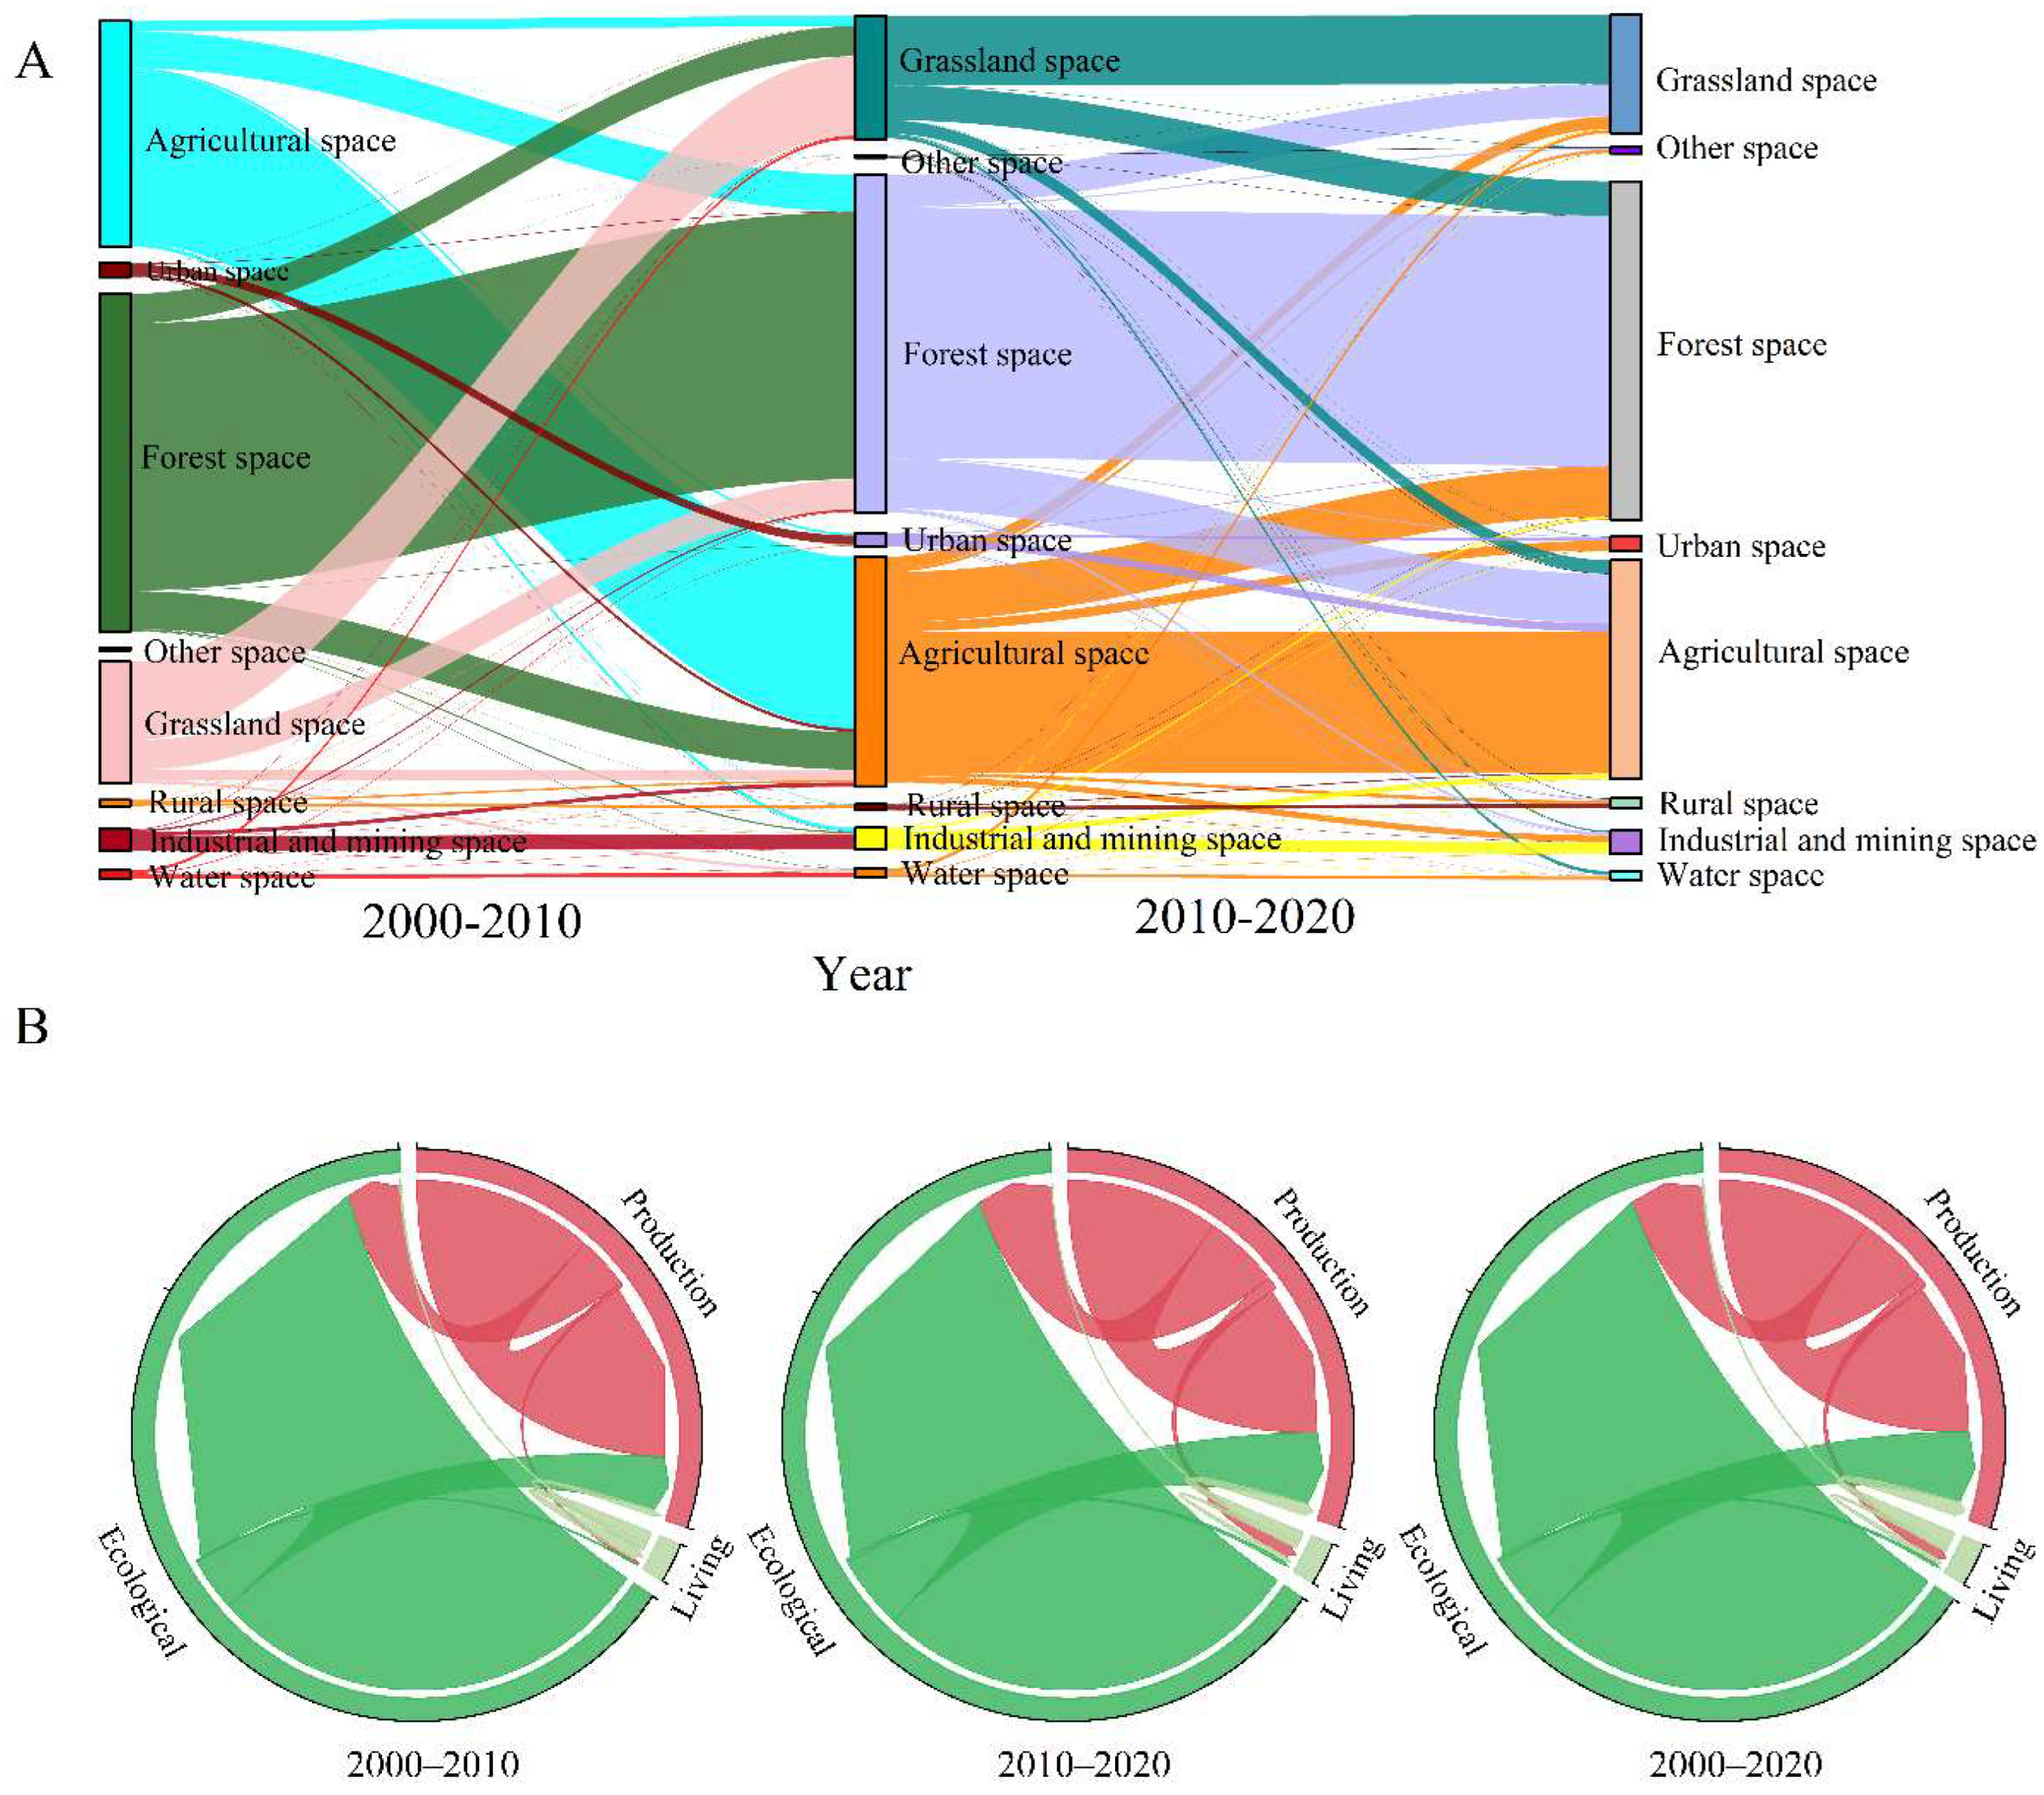
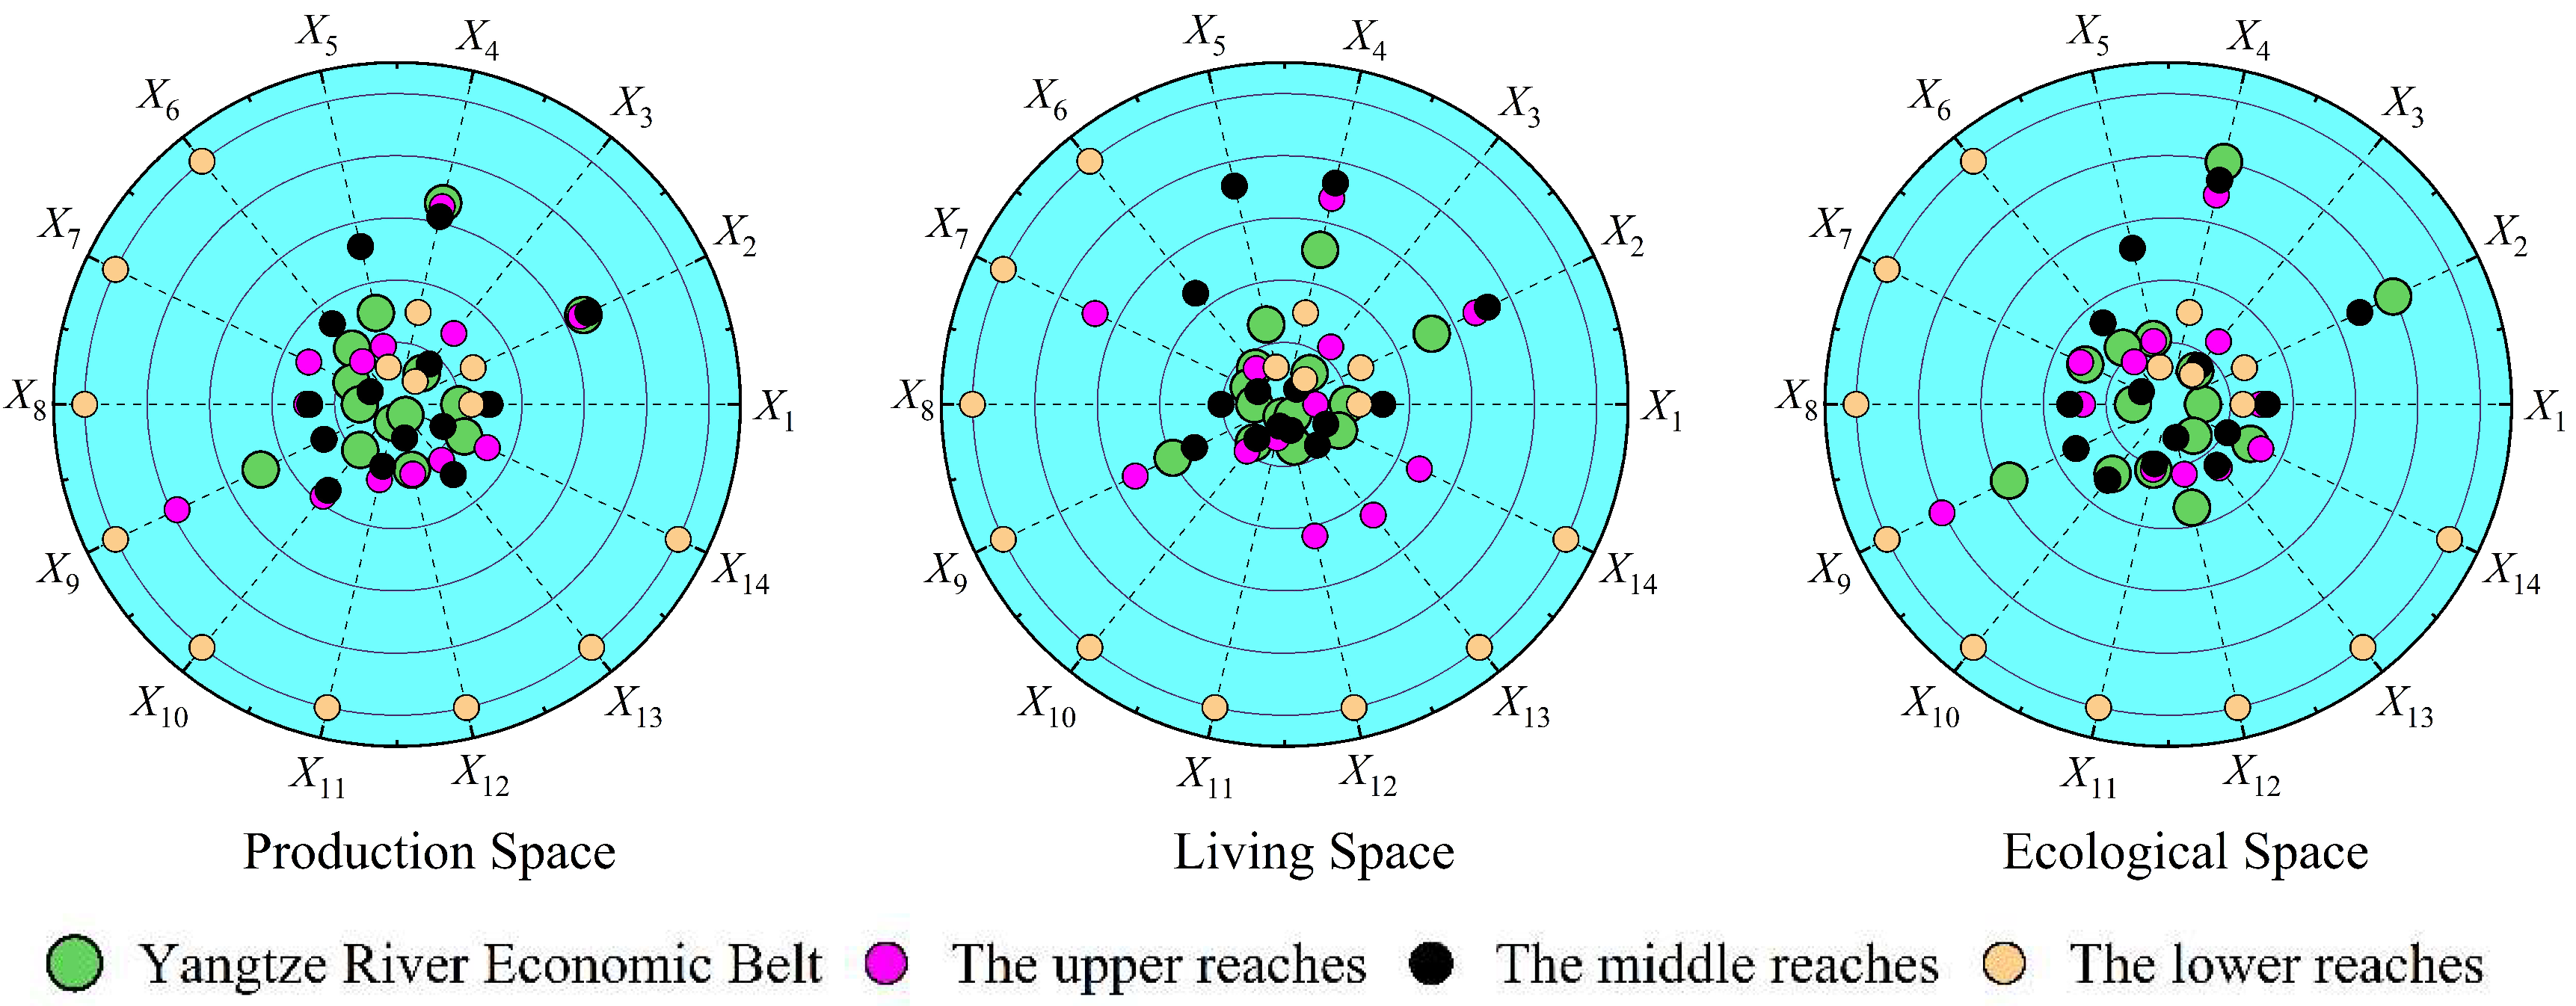
Second, since 2000, the territorial space of the YREB has changed dramatically. From the perspective of time sequence, living space has tended to increase, while production and ecological space have tended to decrease, but ecological space has always been dominant. From the perspective of space, production space was distributed primarily in the middle and lower reaches, living space was distributed primarily in the lower reaches, and ecological space was distributed primarily in the middle and upper reaches. The inter-transformation behavior between territorial spaces has been frequent, and the transformation trajectory showed diversification, with production space transforming mainly to ecological space and living and ecological space transforming primarily to production space.
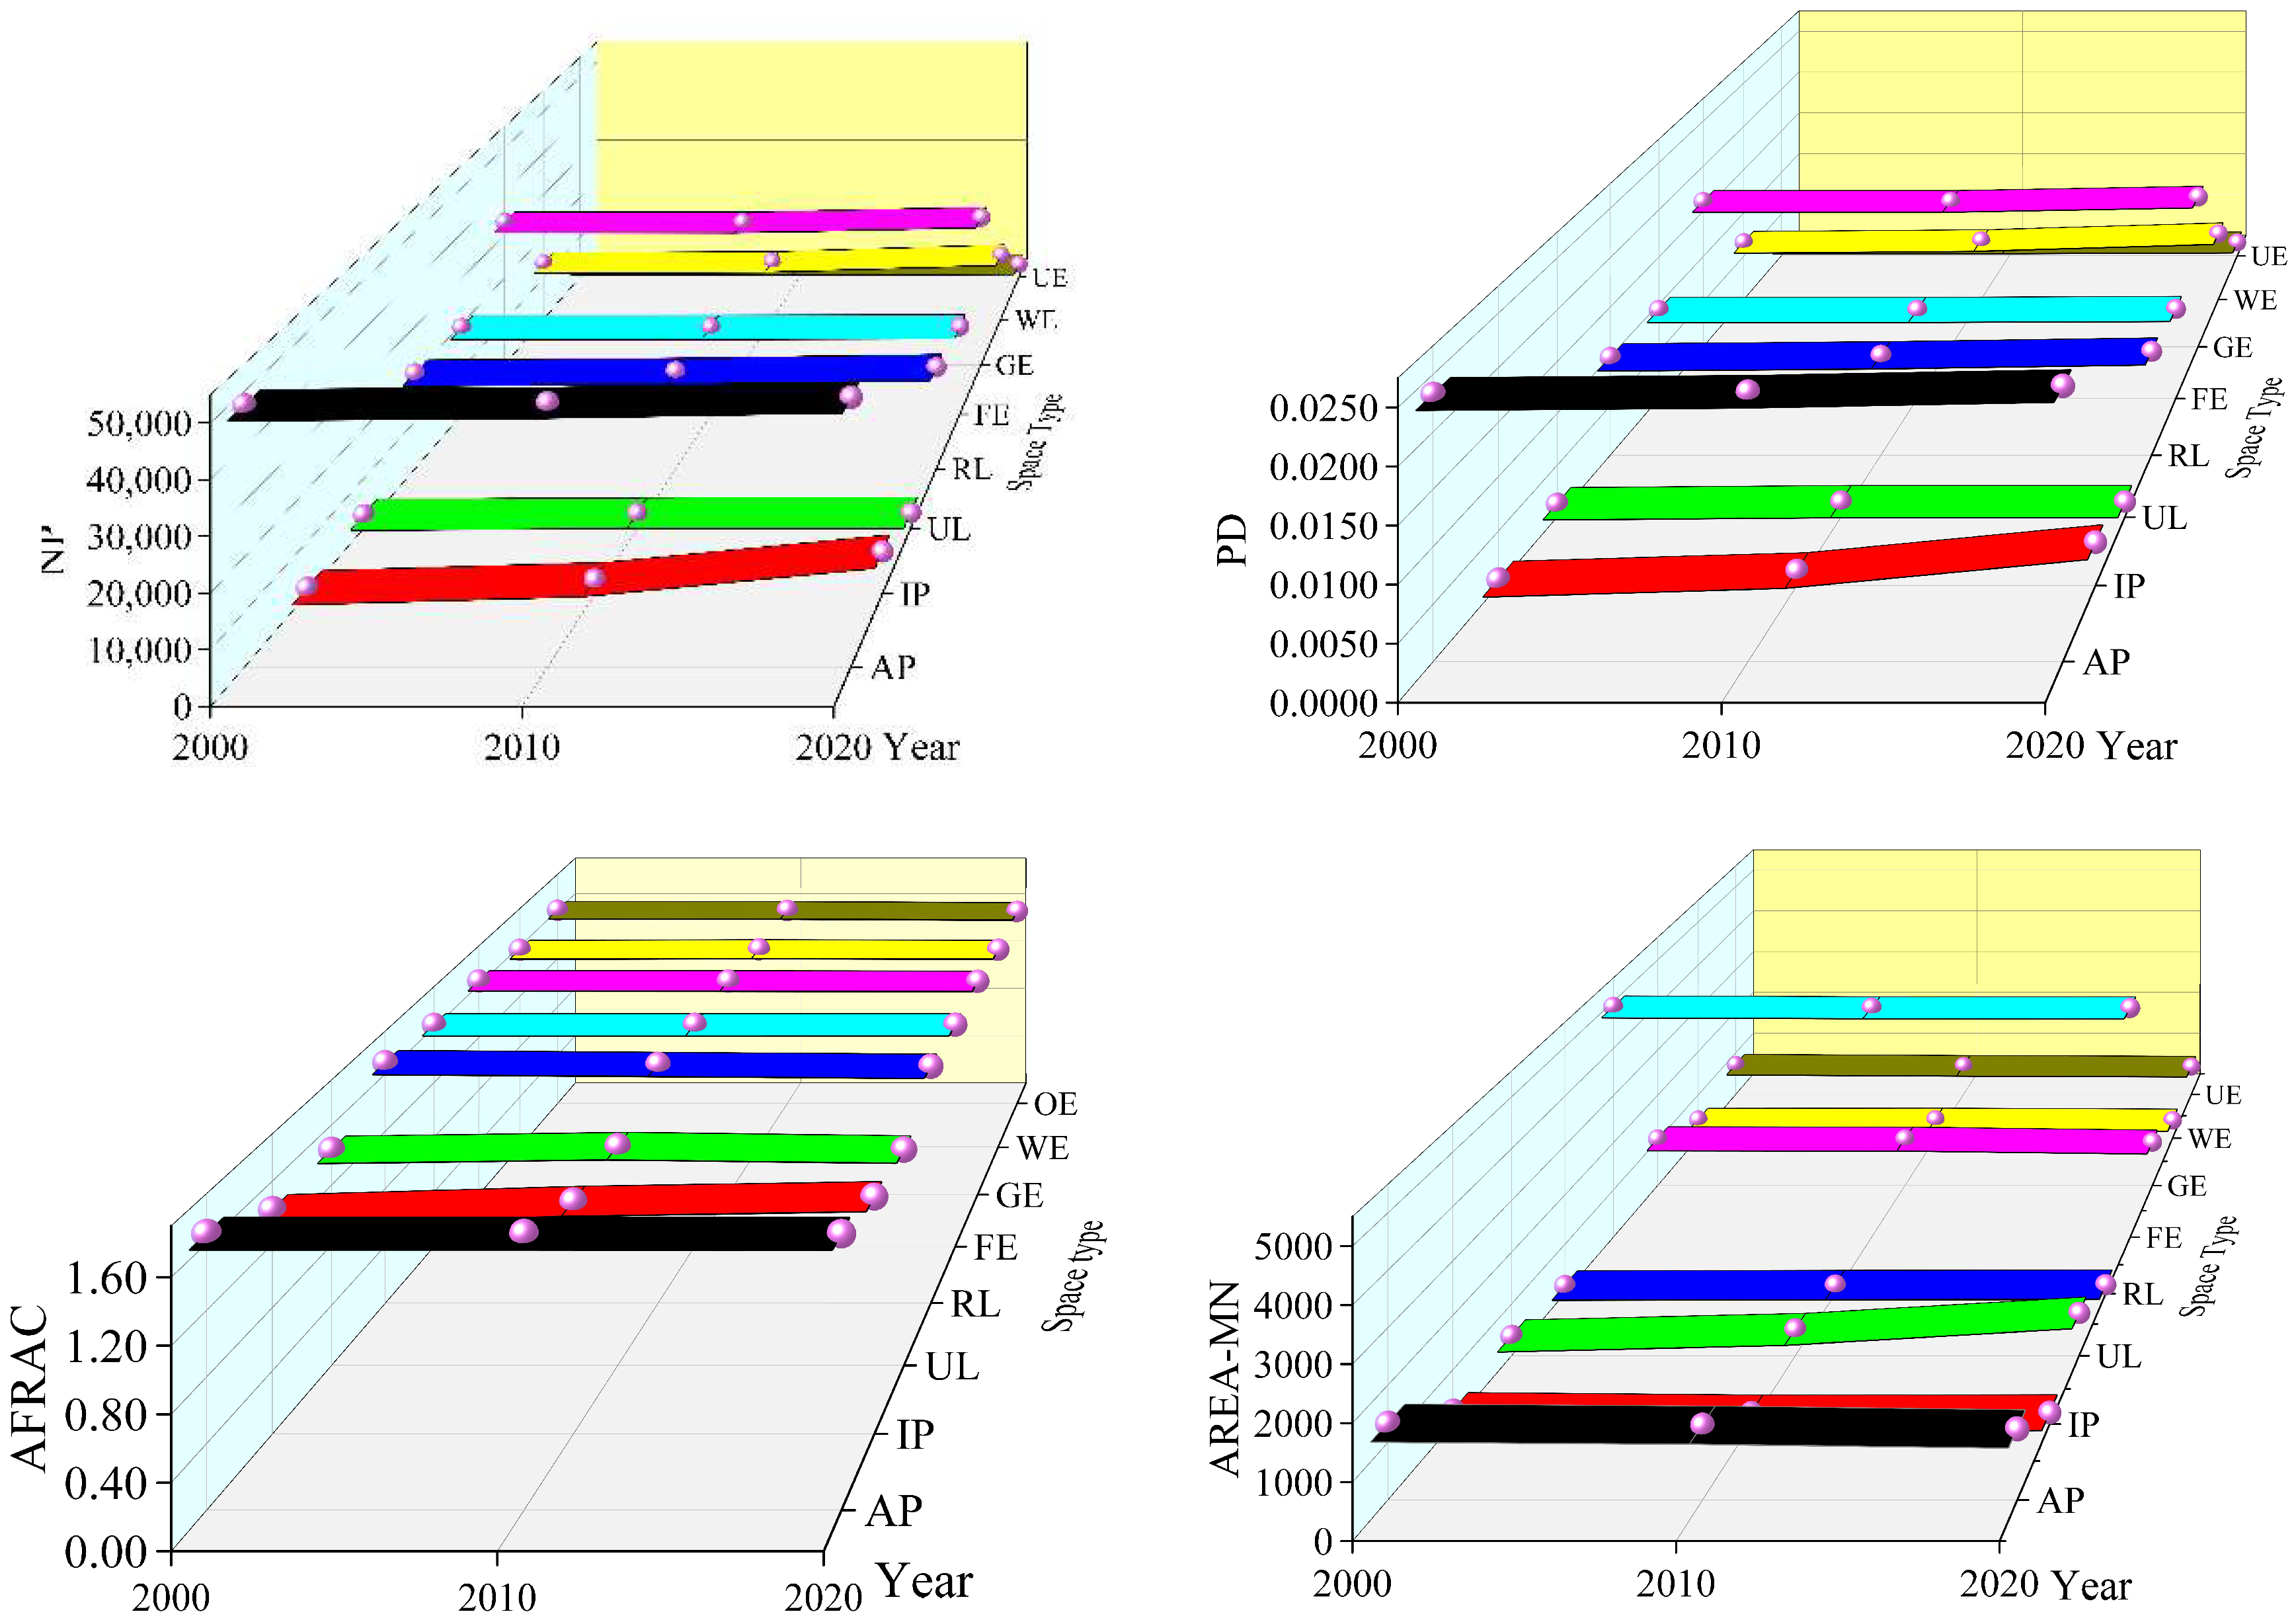
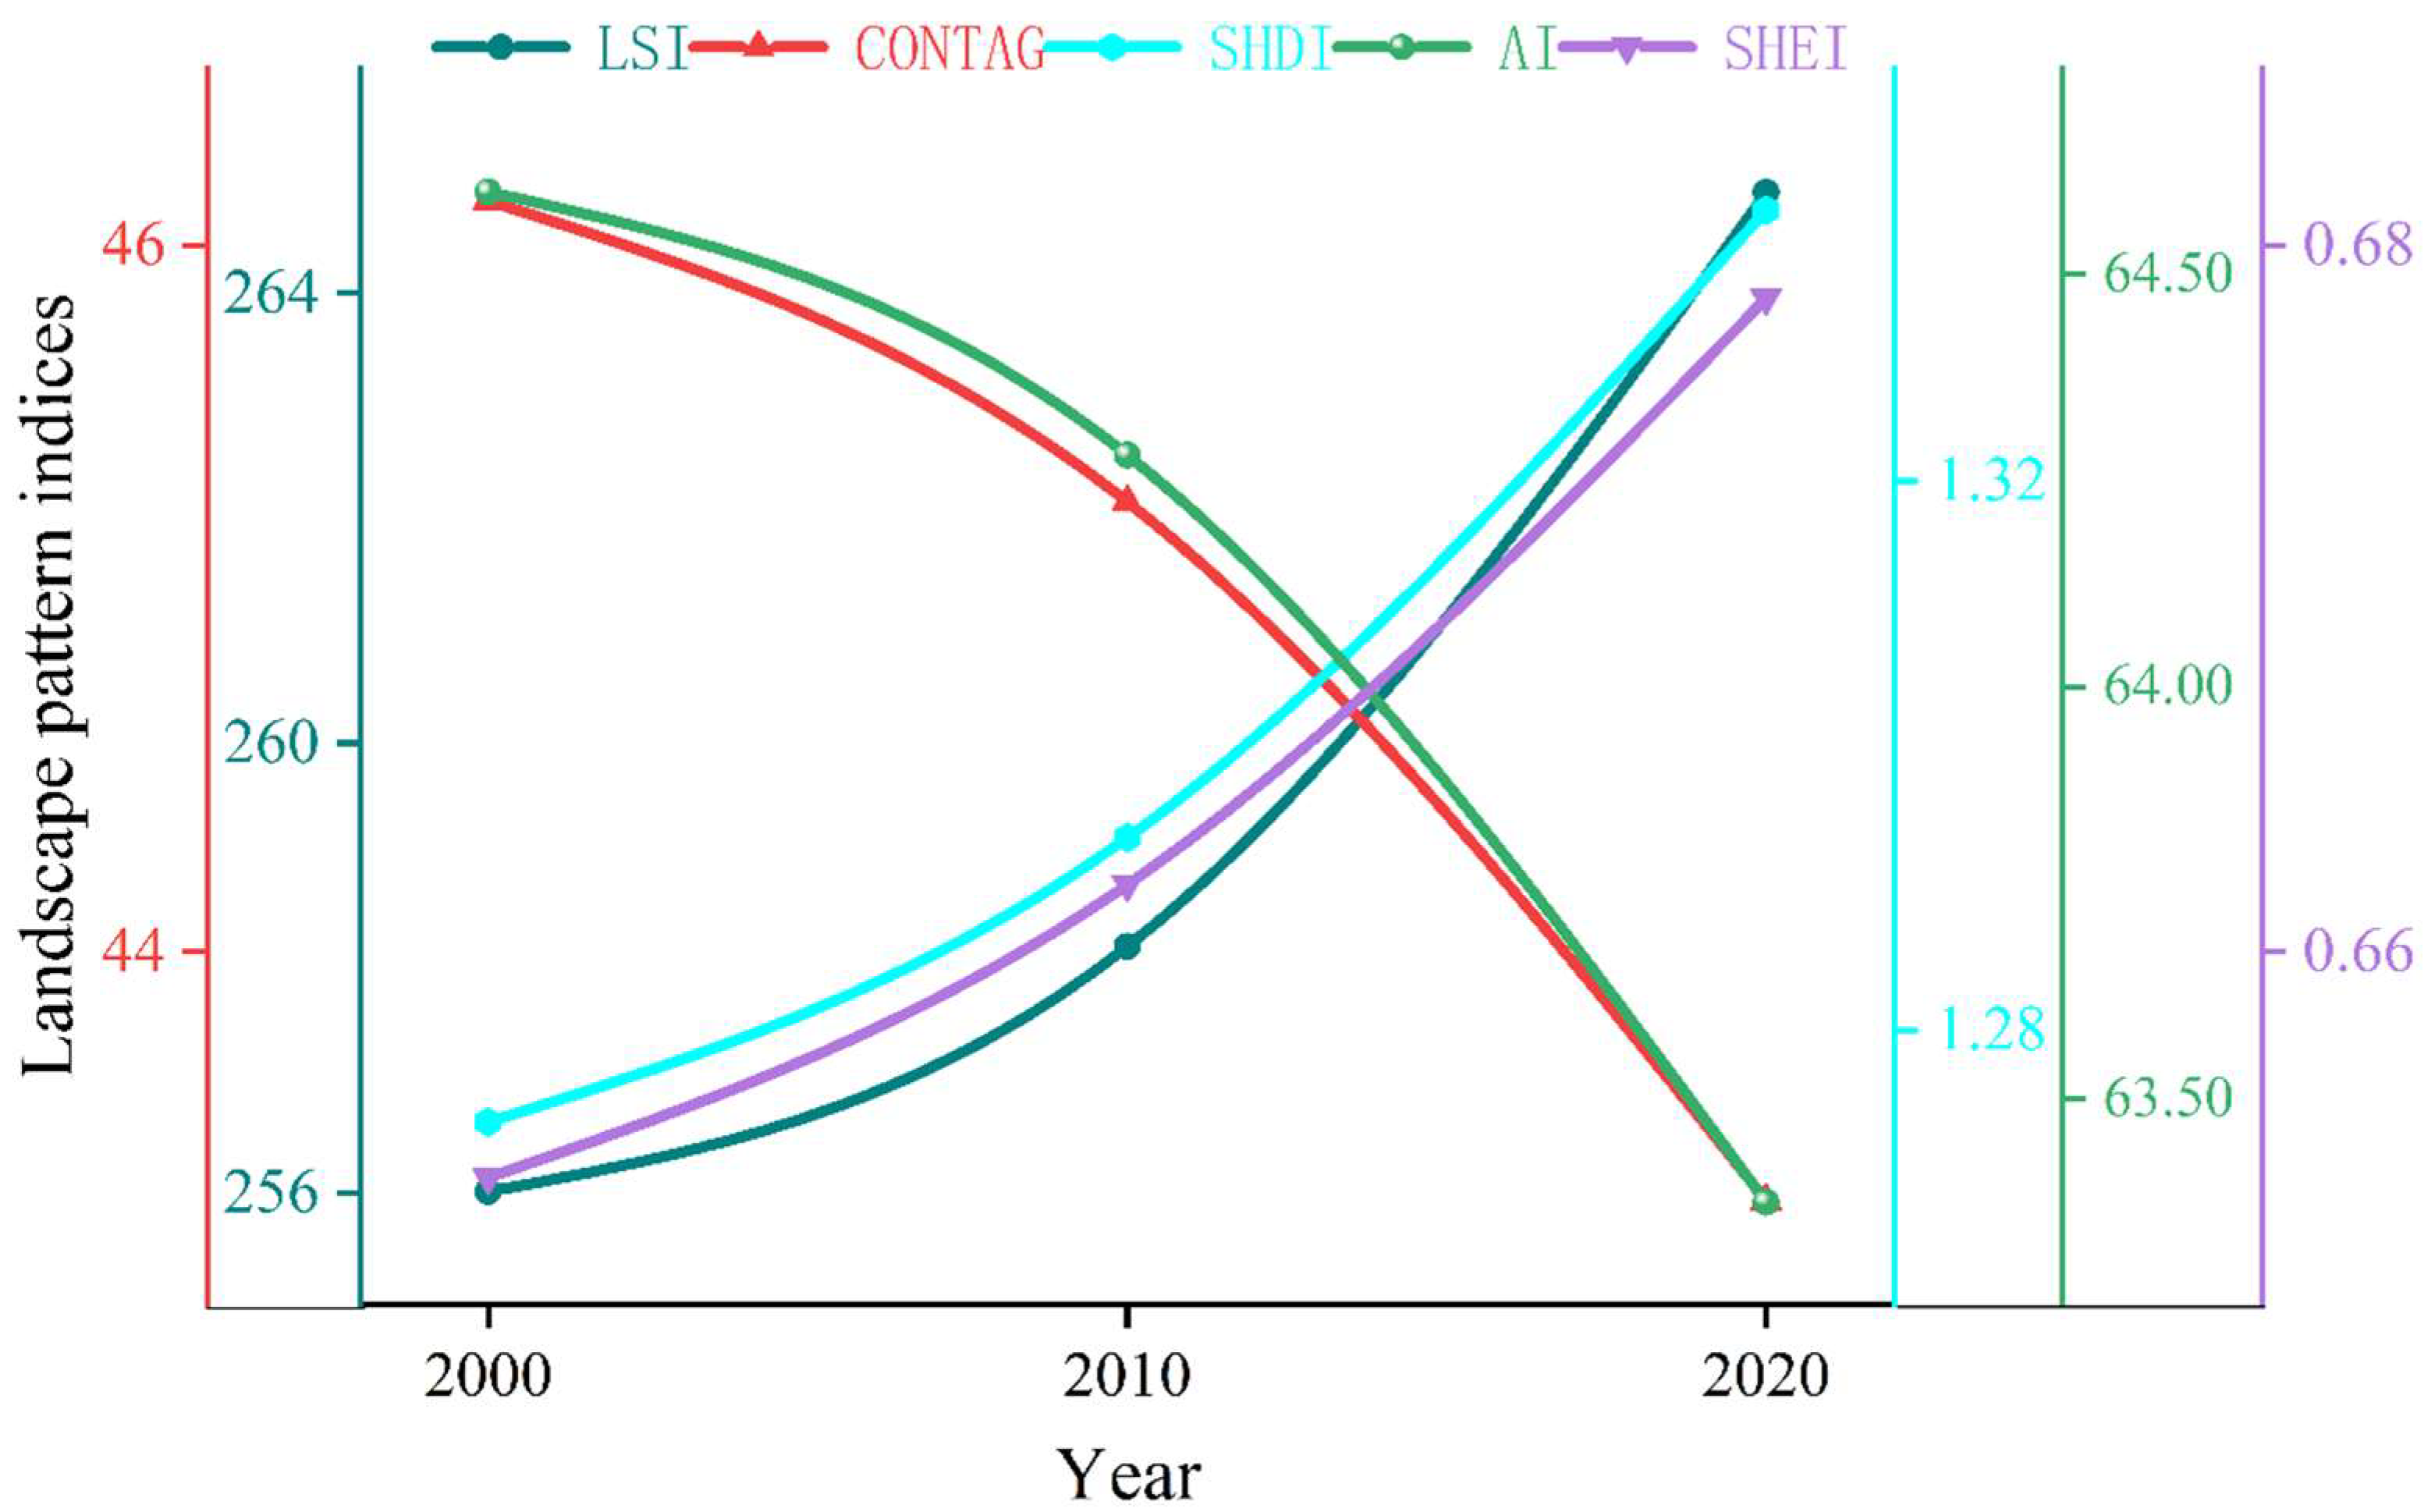
Third, in the past 20 years, the pattern of territorial spatial in the YREB has changed significantly. Among these changes, the level of fragmentation, the degree of regularity of shape, and the spatial dispersion of patches in the production space landscape have increased. The irregularity of the shape of living space patches has decreased and the degree of fragmentation has become weaker and has tended to be spatially concentrated. The shape of ecological space patches has become complex, the spatial pattern has become dispersed, and the level of landscape fragmentation has increased. On the whole, the fragmentation, heterogeneity, and dispersion of landscape patches have increased, and the balance and diversity of space utilization have increased.
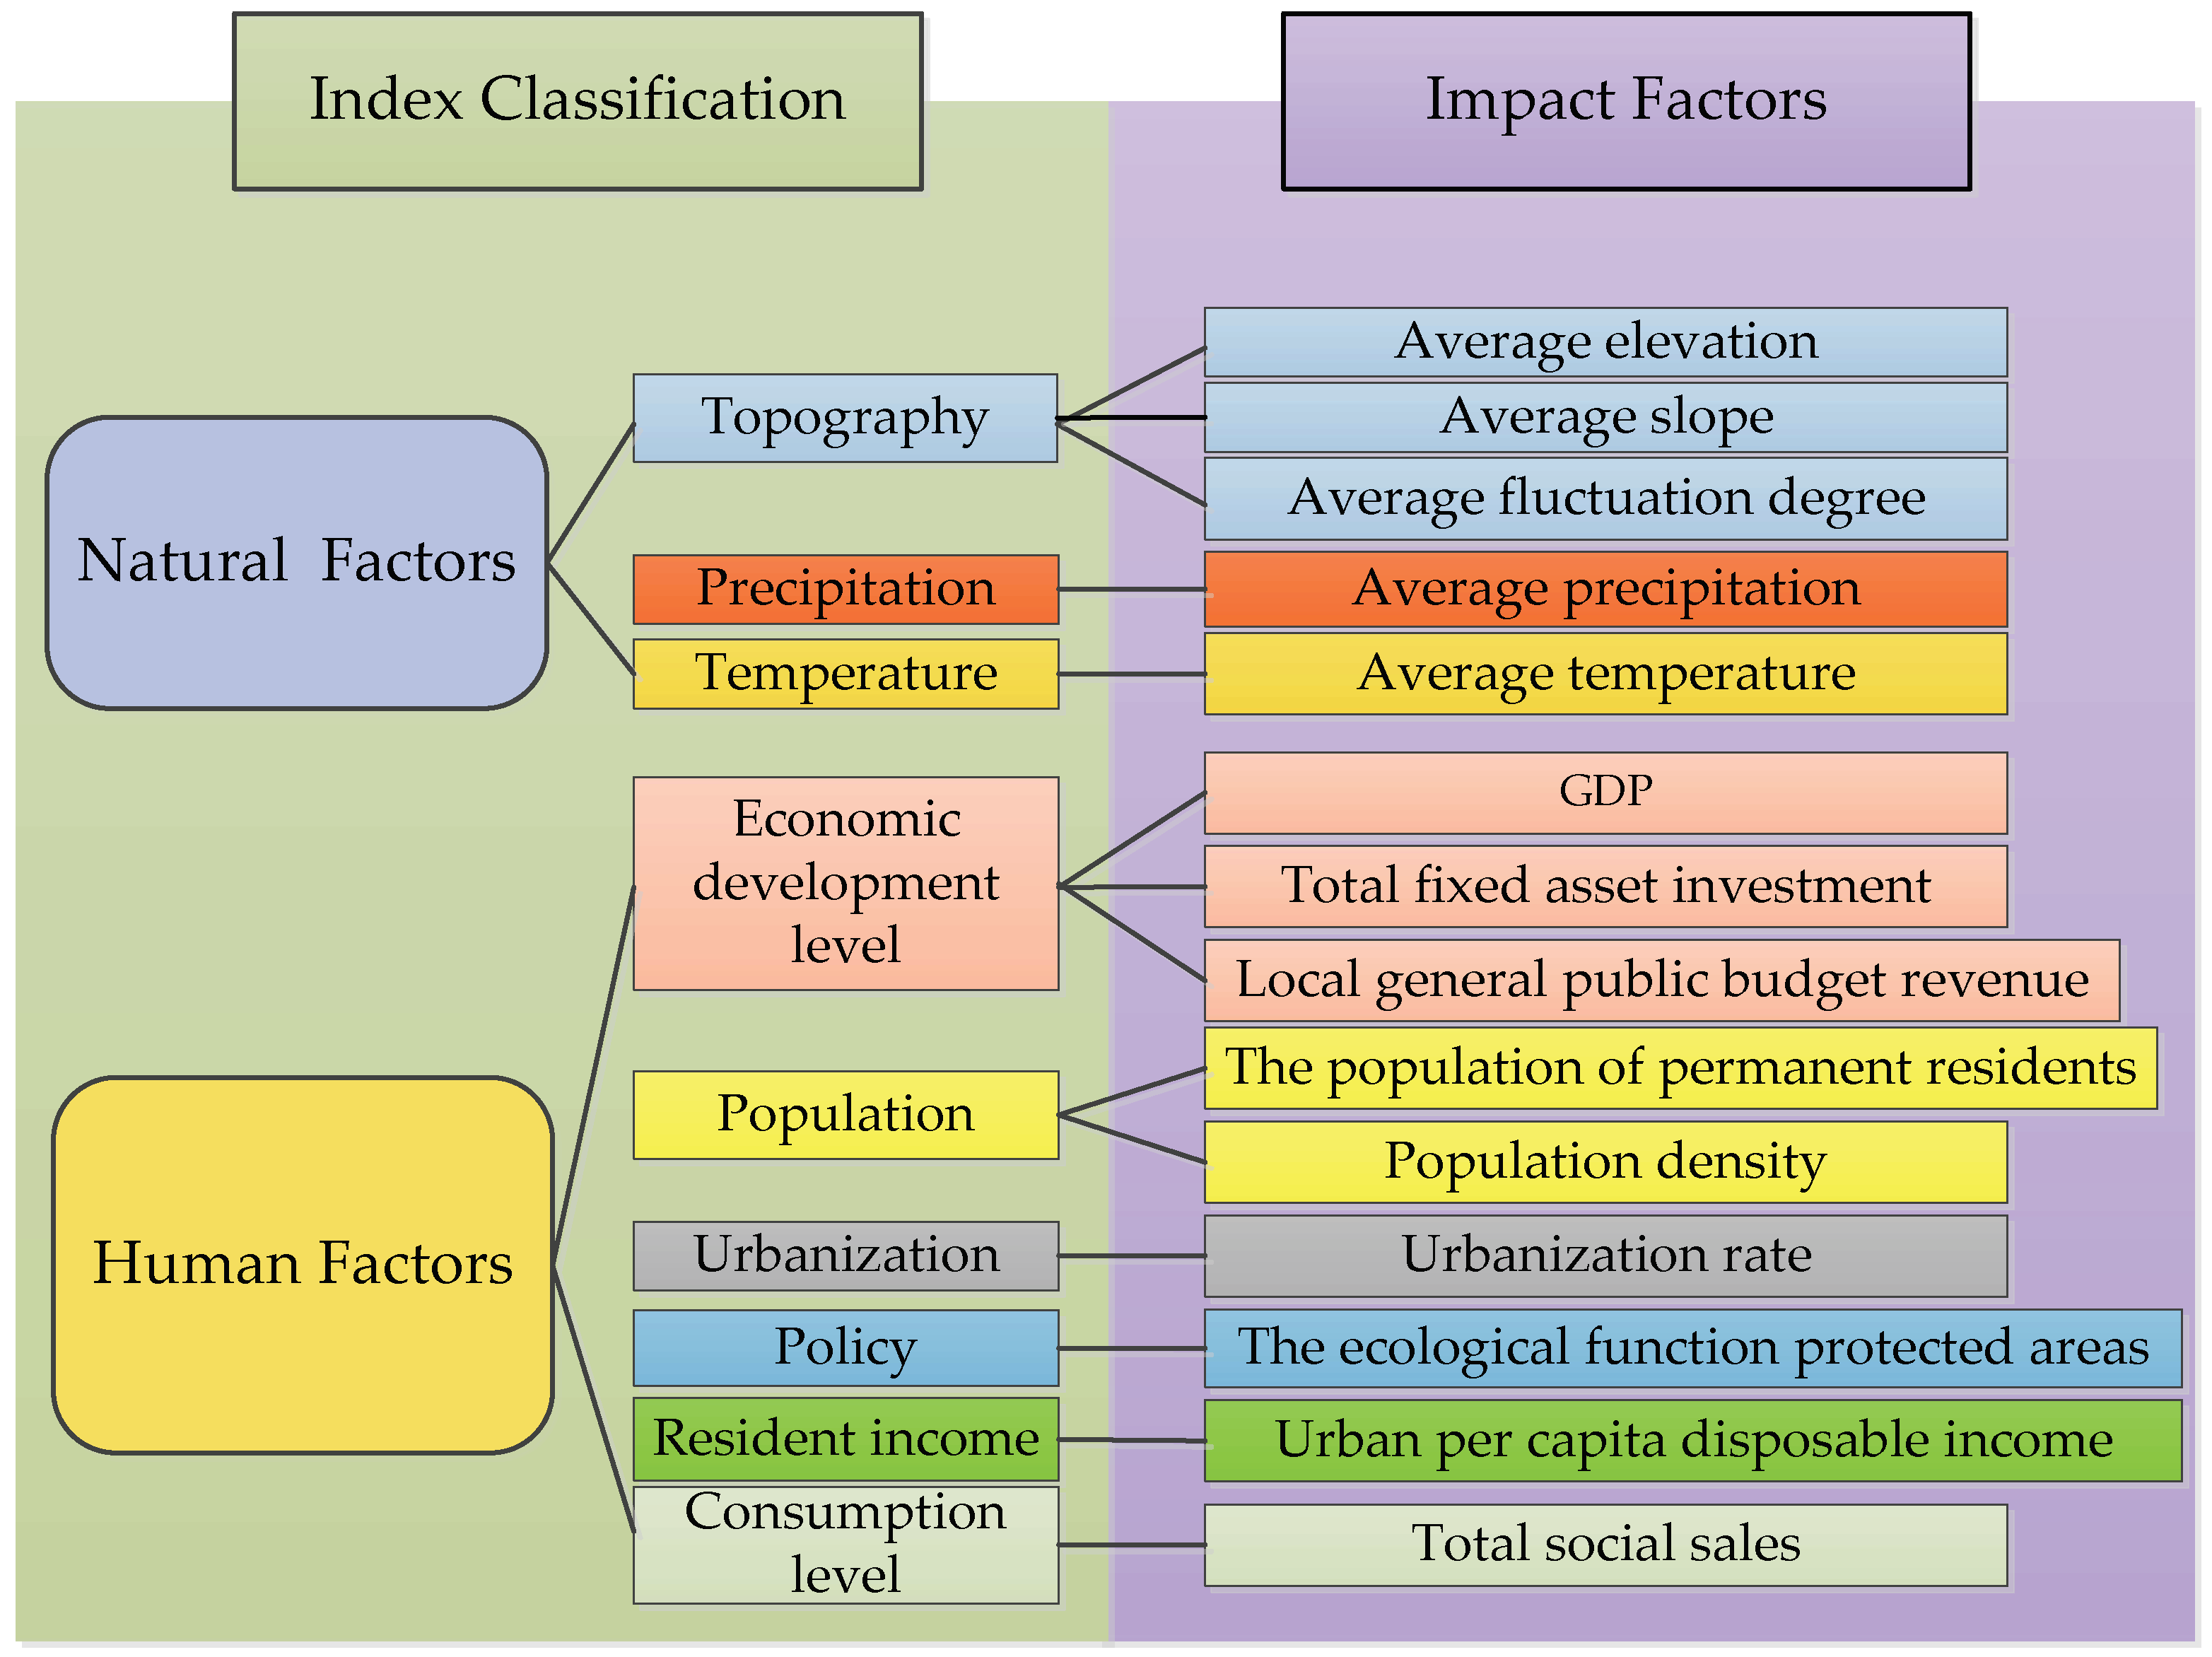
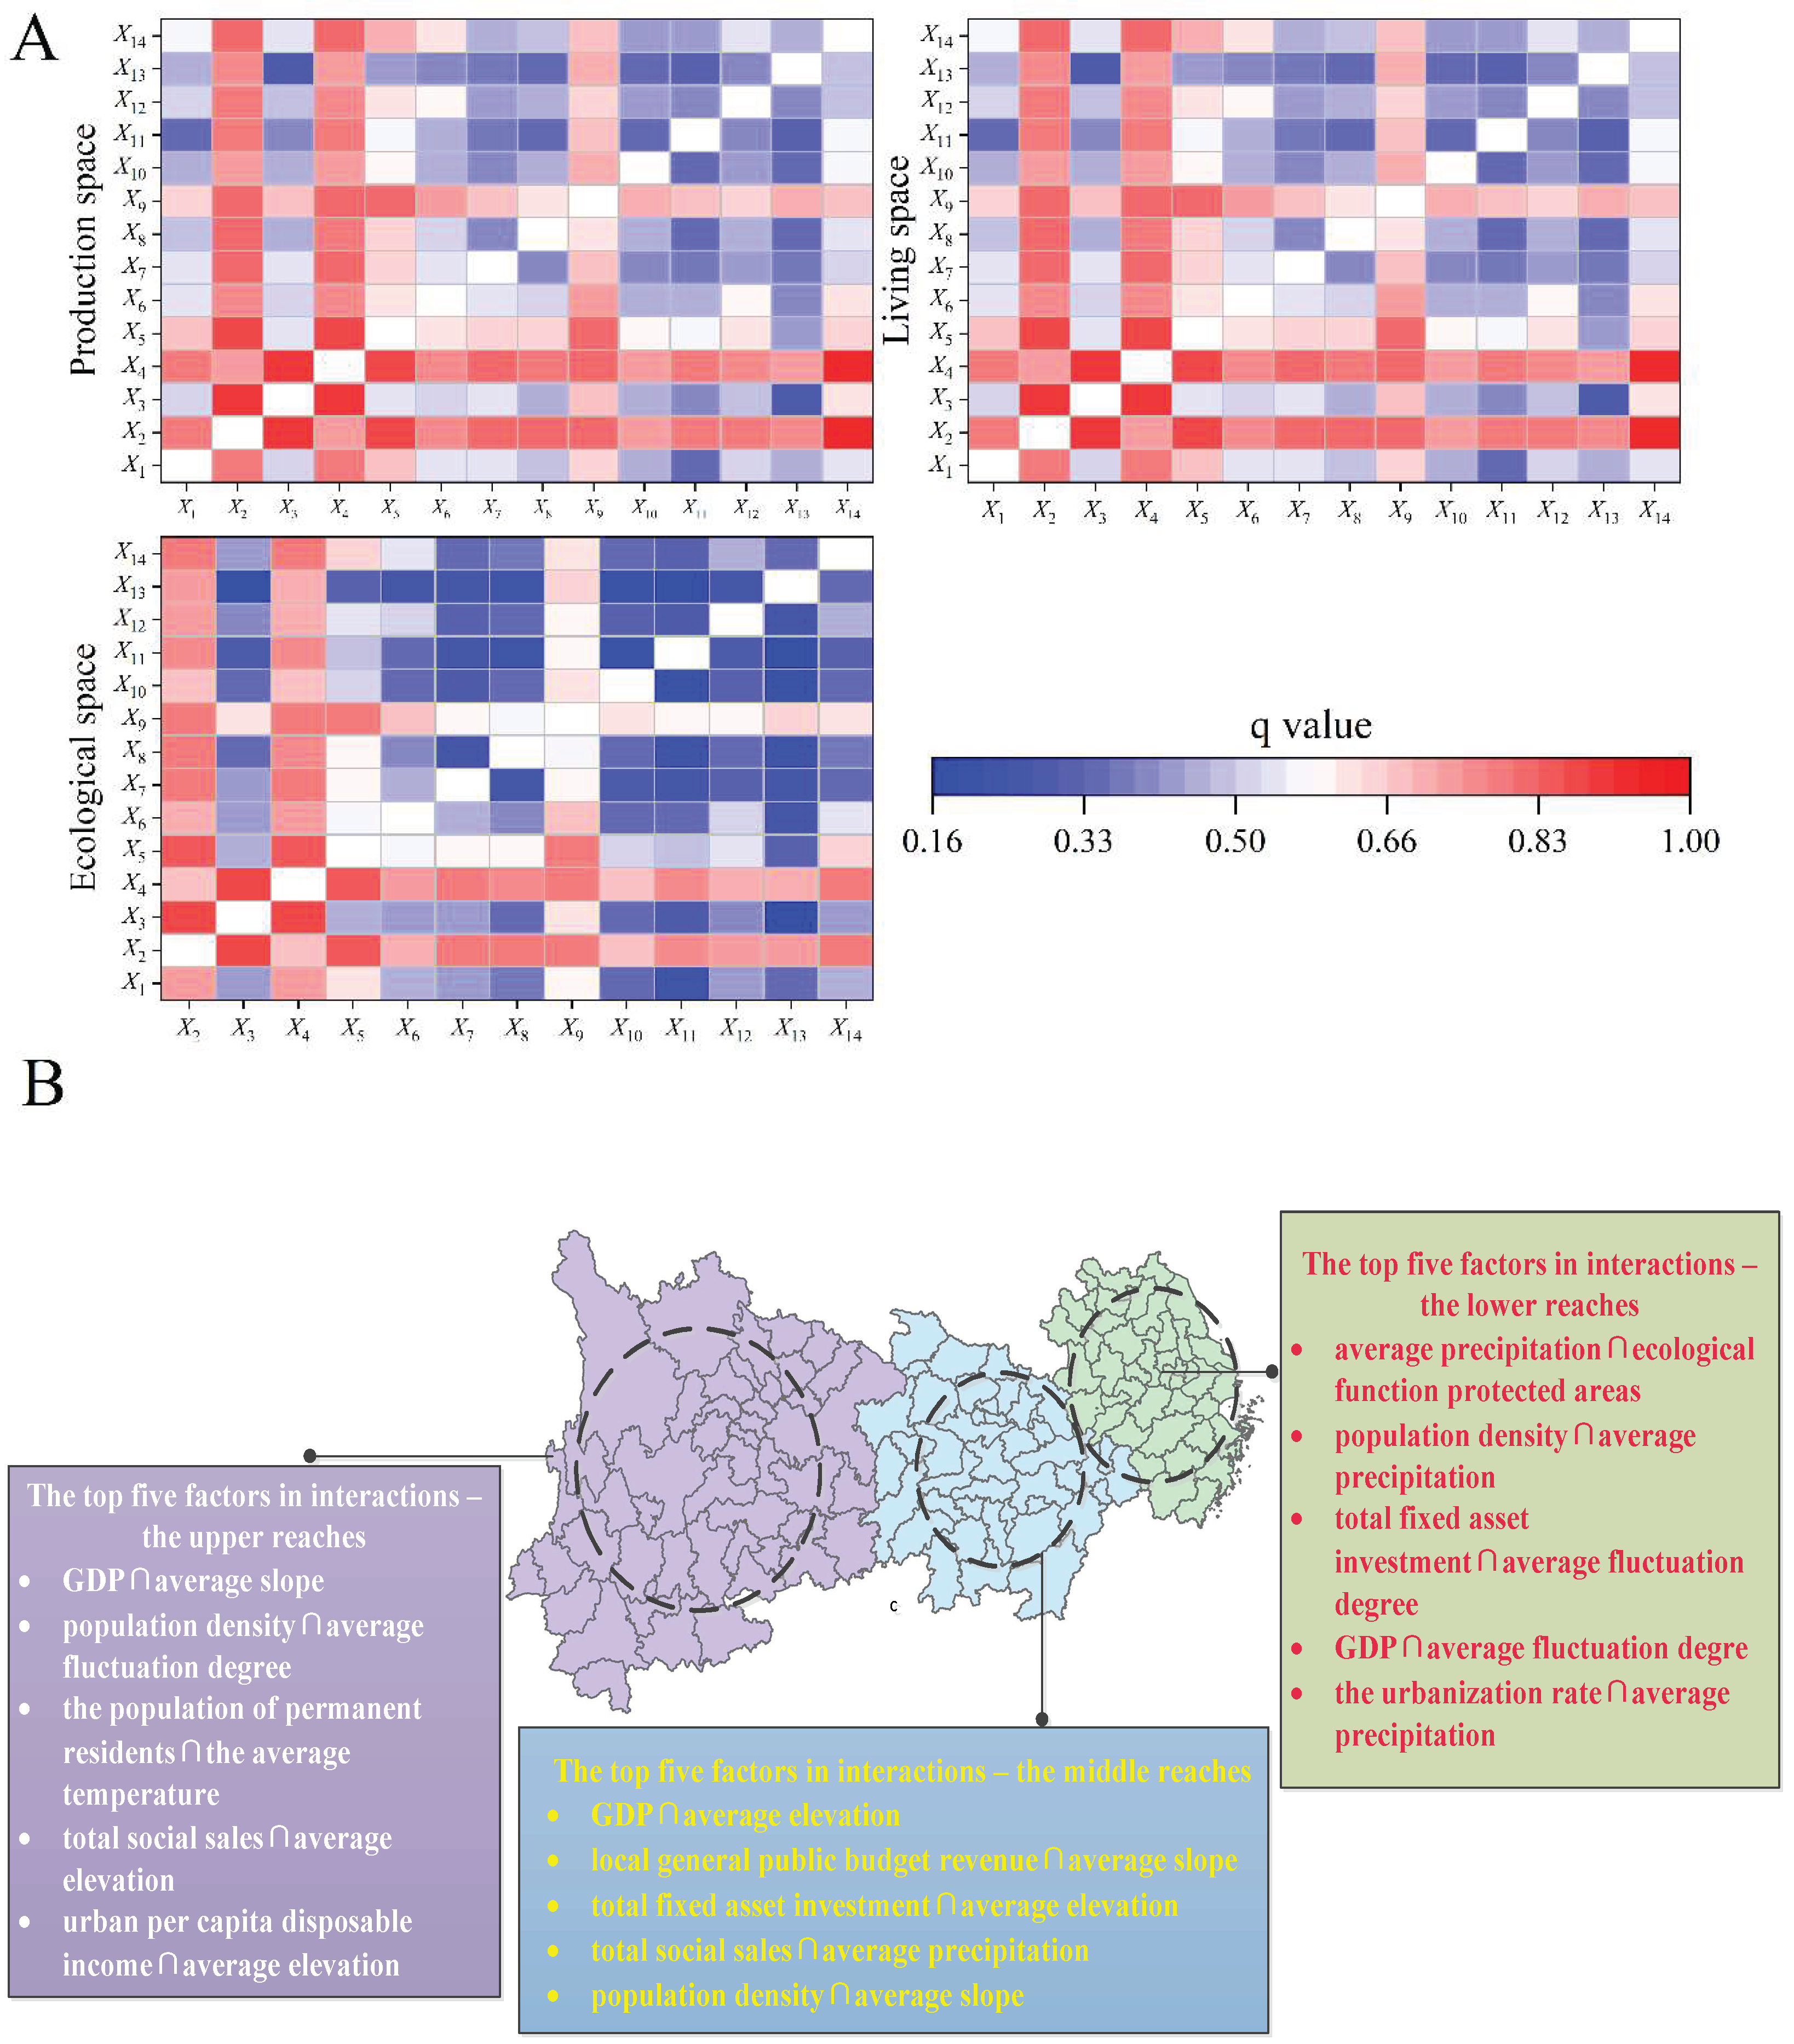
Finally, natural factors promote or inhibit the effects of change on territorial space to different degrees, but the degree of these effects has tended to diminish over time. Human factors have played a strong driving role, and the degree of interference gradually increased. From 2000 to 2010, the dominance of natural factors was stronger, especially the influence of topographical conditions was the most significant, and the effect of human factors was the strongest. From 2010 to 2020, the dominance of human factors increased. Population, economic development, and consumption levels work together to drive territorial space development. There are significant differences in the extent of the role of these different factors on the territorial space of the whole region and each basin, and the role of the same factor on the territorial space of different regions also was different. ln general, natural and human factors jointly promoted the formation and development of the territorial space pattern.
The study of the evolution characteristics and formation mechanism of the territorial space pattern of the YREB provide a reference basis for sustainable territorial space development. The key to the high-quality development of the YREB, however, lies in the optimization of territorial space patterns. Seeking spatial optimization ideas, clarifying spatial optimization goals, formulating differentiated spatial control policies, promoting the coordination of territorial space utilization, and actively promoting the efficient development of territorial space is essential to achieve high-quality development. Therefore, in the future, it is necessary to quantitatively evaluate the degree of coordination among territorial spaces, scientifically evaluate the level of territorial space utilization, identify the positioning of the main functions of territorial space, and build a scientific and reasonable territorial space layout system. This specific process then will be studied in depth to provide a theoretical basis for achieving the high-quality development of the YREB.

Author Contributions

Conceptualization, methodology, J.Z.; software, J.Z.; validation, J.Z. and X.Y.; formal analysis, J.Z.; investigation, J.Z.; resources, J.Z. and Y.Z.; data curation, J.Z.; writing—original draft preparation, J.Z.; writing—review and editing, Y.Z.; visualization, J.Z. and X.Y.; supervision, J.Z. and Y.Z.; project administration, Y.Z.; funding acquisition, Y.Z. All authors have read and agreed to the published version of the manuscript.

Funding

This research was funded by the National Basic Research Program of China (Grant No. 2015CB452706), National Natural Science Foundation of China (Grant No. 41771115) and Major Research Issues on Comprehensively Deepening Reform in Guizhou Province (Grant No. GZGGKT [2022]).

Institutional Review Board Statement

Not applicable.

Informed Consent Statement

Not applicable.

Data Availability Statement

The data presented in this study are available on request from the author.

Acknowledgments

We sincerely gratitude the editors and reviewers who commented on this paper and gave their time and effort. We thank LetPub (www.letpub.com, accessed on 22 July 2022) for its linguistic assistance during the preparation of this manuscript.

Conflicts of Interest

The authors declare no conflict of interest.

References

  1. Zaldo-Aubanell, Q.; Serra, I.; Sardanyés, J.; Alsedà, L.; Maneja, R. Reviewing the Reliability of Land Use and Land Cover Data in Studies Relating Human Health to the Environment. Environ. Res. 2021, 194, 110578. [Google Scholar] [CrossRef] [PubMed]
  2. Lafortezza, R.; Chen, J. The Provision of Ecosystem Services in Response to Global Change: Evidences and Applications. Environ. Res. 2016, 147, 576–579. [Google Scholar] [CrossRef] [PubMed]
  3. Fran, M. China Human Development Report 2002: Making Green Development a Choice. Produced by Stockholm Environment Institute in collaboration with UNDP. China Q. 2003, 174, 539–541. [Google Scholar]
  4. Long, H.; Qu, Y.; Tu, S.; Zhang, Y.; Jiang, Y. Development of Land Use Transitions Research in China. J. Geogr. Sci. 2020, 30, 1195–1214. [Google Scholar] [CrossRef]
  5. Kertész, Á.; Nagy, L.A.; Balázs, B. Effect of Land Use Change on Ecosystem Services in Lake Balaton Catchment. Land Use Policy 2019, 80, 430–438. [Google Scholar] [CrossRef]
  6. Lian, X. Review on Advanced Practice of Provincial Spatial Planning: Case of a Western, Less Developed Province. Int. Rev. Spat. Plan. Sustain. Dev. 2018, 6, 185–202. [Google Scholar] [CrossRef]
  7. Cui, J.X.; Gu, J.; Sun, J.W.; Luo, J. The spatial pattern and evolution characteristics of the production, living and ecological space in Hubei provence. China Land Sci. 2018, 8, 67–73. [Google Scholar]
  8. Fukuchi, T.; Yamaguchi, M.; Kabayama, S. Macroscopic analysis of demography and land-use in central area of metropolitan region. Stus. Reg. Sci. 2008, 14, 59–77. [Google Scholar]
  9. Geng, S.; Zhu, W.; Shi, P. A Functional Land Use Classification for Ecological, Production and Living Spaces in the Taihang Mountains. J. Resour. Ecol. 2019, 10, 246–255. [Google Scholar]
  10. Xie, G.; Zhen, L.; Zhang, C.; Deng, X.; Koenig, H.J.; Tscherning, K.; Helming, K. Assessing the Multifunctionalities of Land Use in China. J. Resour. Ecol. 2010, 1, 311–318. [Google Scholar]
  11. Lovell, S.T.; DeSantis, S.; Nathan, C.A.; Olson, M.B.; Ernesto Méndez, V.; Kominami, H.C.; Erickson, D.L.; Morris, K.S.; Morris, W.B. Integrating Agroecology and Landscape Multifunctionality in Vermont: An Evolving Framework to Evaluate the Design of Agroecosystems. Agric. Syst. 2010, 103, 327–341. [Google Scholar] [CrossRef]
  12. Wang, Y.; Zhao, X.; Zuo, L.; Zhang, Z.; Wang, X.; Yi, L.; Liu, F.; Xu, J. Spatial Differentiation of Land Use and Landscape Pattern Changes in the Beijing-Tianjin-Hebei Area. Sustainability 2020, 12, 3040. [Google Scholar]
  13. Nelson, E.; Mendoza, G.; Regetz, J.; Polasky, S.; Tallis, H.; Cameron, D.R.; Chan, K.M.A.; Daily, G.C.; Goldstein, J.; Kareiva, P.M.; et al. Modeling Multiple Ecosystem Services, Biodiversity Conservation, Commodity Production, and Tradeoffs at Landscape Scales. Front. Ecol. Environ. 2009, 7, 4–11. [Google Scholar]
  14. Song, Y.; Xue, D.; Dai, L.; Wang, P.; Huang, X.; Xia, S. Land Cover Change and Eco-Environmental Quality Response of Different Geomorphic Units on the Chinese Loess Plateau. J. Arid Land 2020, 12, 29–43. [Google Scholar]
  15. Duan, Y.; Wang, H.; Huang, A.; Xu, Y.; Lu, L.; Ji, Z. Identification and Spatial-Temporal Evolution of Rural “Production-Living-Ecological” Space from the Perspective of Villagers’ Behavior—A Case Study of Ertai Town, Zhangjiakou City. Land Use Policy 2021, 106, 105457. [Google Scholar] [CrossRef]
  16. Deng, Y.; Yang, R. Influence Mechanism of Production-Living-Ecological Space Changes in the Urbanization Process of Guangdong Province, China. Land 2021, 10, 1357. [Google Scholar] [CrossRef]
  17. Wende, W.; Huelsmann, W.; Marty, M.; Penn-Bressel, G.; Bobylev, N. Climate Protection and Compact Urban Structures in Spatial Planning and Local Construction Plans in Germany. Land Use Policy 2010, 27, 864–868. [Google Scholar]
  18. Liu, Y.; Long, H.; Li, T.; Tu, S. Land Use Transitions and Their Effects on Water Environment in Huang-Huai-Hai Plain, China. Land Use Policy 2015, 47, 293–301. [Google Scholar]
  19. Hersperger, A.M.; Langhamer, D.; Dalang, T. Inventorying Human-Made Objects: A Step towards Better Understanding Land Use for Multifunctional Planning in a Periurban Swiss Landscape. Landsc. Urban Plan. 2012, 105, 307–314. [Google Scholar] [CrossRef]
  20. Miljanovic, D. A Review of the Complexity Approach to the Study Human (Society)-Nature Interactions. Glas. Srp. Geogr. Drus. 2010, 90, 109–137. [Google Scholar] [CrossRef]
  21. Ma, R.; Chen, J.; Pan, Q.; Cheng, Y.; Wang, W.; Zhu, B.; Ma, J.; Li, J. How Should the Effectiveness of Marine Functional Zoning in China Be Evaluated? Taking Wenzhou Marine Functional Zoning as an Example. Land 2022, 11, 267. [Google Scholar] [CrossRef]
  22. Xiang, Y.; Gao, H.; Xia, T.; Wang, L.; Li, Z.; Wang, J.; Liao, J.; Luo, J. “Double Evaluation”—The prerequisite and foundation of the municipal-level land and space master plan. E3S Web Conf. 2021, 233, 3021. [Google Scholar]
  23. Manderscheid, K.; Richardson, T. Planning Inequality: Social and Economic Spaces in National Spatial Planning. Eur. Plan. Stud. 2011, 19, 1797–1815. [Google Scholar] [CrossRef]
  24. Ouyang, X.; Xu, J.; Li, J.; Wei, X.; Li, Y. Land Space Optimization of Urban-Agriculture-Ecological Functions in the Changsha-Zhuzhou-Xiangtan Urban Agglomeration, China. Land Use Policy 2022, 117, 106112. [Google Scholar] [CrossRef]
  25. Xie, B.; Wang, Q.; Huang, B.; Chen, Y.; Yang, J.; Qi, P. Coordinated State Analysis and Differential Regulation of Territorial Spatial Functions in Underdeveloped Regions: A Case Study of Gansu Province, China. Sustainability 2022, 14, 950. [Google Scholar] [CrossRef]
  26. Tao, Y.; Wang, Q. Quantitative Recognition and Characteristic Analysis of Production-Living-Ecological Space Evolution for Five Resource-Based Cities: Zululand, Xuzhou, Lota, Surf Coast and Ruhr. Remote Sens. 2021, 13, 1563. [Google Scholar] [CrossRef]
  27. Wang, M.; Wang, Y.; Wu, Y.; Yue, X.; Wang, M.; Hu, P. Identifying the Spatial Heterogeneity in the Effects of the Construction Land Scale on Carbon Emissions: Case Study of the Yangtze River Economic Belt, China. Environ. Res. 2022, 212, 113397. [Google Scholar] [CrossRef]
  28. Dayyani, L.; Pourtaheri, M.; Eftekhari, A.R.; Ahmadi, H. The Identification and Zoning of Areas Having Rural Deteriorated Textures in the Tehran Province by Using KDE and GIS. Hum. Ecol. Risk Assess. 2019, 25, 475–504. [Google Scholar] [CrossRef]
  29. Liu, Y.; Liu, W.; Yan, Y.; Liu, C. A perspective of ecological civilization: Research on the spatial coupling and coordination of the energy-economy-environment system in the Yangtze River Economic Belt. Environ. Monit. Assess. 2022, 194, 403. [Google Scholar] [CrossRef]
  30. Fan, J.; Xu, Y.; Ge, H.; Yang, W. Vegetation growth variation in relation to topography in Horqin Sandy Land. Ecol. Indic. 2020, 113, 106215. [Google Scholar] [CrossRef]
  31. Solomon, N.; Hishe, H.; Annang, T.; Pabi, O.; Asante, I.K.; Birhane, E. Forest Cover Change, Key Drivers and Community Perception in Wujig Mahgo Waren Forest of Northern Ethiopia. Land 2018, 7, 32. [Google Scholar] [CrossRef] [Green Version]
  32. Zhang, H.; Yang, Q.; Zhang, H.; Zhou, L.; Chen, H. Optimization of Land Use Based on the Source and Sink Landscape of Ecosystem Services: A Case Study of Fengdu County in the Three Gorges Reservoir Area, China. Land 2021, 10, 1242. [Google Scholar] [CrossRef]
  33. Wang, Z.; Liang, L.; Sun, Z.; Wang, X. Spatiotemporal Differentiation and the Factors Influencing Urbanization and Ecological Environment Synergistic Effects within the Beijing-Tianjin-Hebei Urban Agglomeration. J. Environ. Manag. 2019, 243, 227–239. [Google Scholar] [CrossRef]
  34. Xue, L.; Zhu, B.; Wu, Y.; Wei, G.; Liao, S.; Yang, C.; Wang, J.; Zhang, H.; Ren, L.; Han, Q. Dynamic Projection of Ecological Risk in the Manas River Basin Based on Terrain Gradients. Sci. Total Environ. 2019, 653, 283–293. [Google Scholar] [CrossRef]
  35. Tang, Y. Effect Analysis of Land-Use Pattern with Landscape Metrics on an Urban Heat Island. J. Appl. Remote Sens. 2018, 12, 026004. [Google Scholar] [CrossRef]
  36. Xiao, D.; Niu, H.; Yan, H.; Fan, L.; Zhao, S. Spatiotemperal evolution of land use pattern in the Yellow River Basin (Henan section) from 1990 to 2018. Trans. Chin. Soc. Agric. Eng. 2020, 36, 271–281. [Google Scholar]
  37. Pang, R.; Hu, N.; Zhou, J.; Sun, D.; Ye, H. Study on Eco-Environmental Effects of Land-Use Transitions and Their Influencing Factors in the Central and Southern Liaoning Urban Agglomeration: A Production–Living–Ecological Perspective. Land 2022, 11, 937. [Google Scholar] [CrossRef]
  38. Krüger, L.; Paiva, V.H.; Petry, M.V.; Ramos, J.A. Strange Lights in the Night: Using Abnormal Peaks of Light in Geolocator Data to Infer Interaction of Seabirds with Nocturnal Fishing Vessels. Polar Biol. 2017, 40, 221–226. [Google Scholar] [CrossRef]
  39. Wang, Q.; Wang, H. Dynamic simulation and conflict identification analysis of production–living–ecological space in Wuhan, Central China. Integr. Environ. Assess. Manag. 2022. [Google Scholar] [CrossRef]
  40. Li, X.; Wang, Y.; Song, Y. Unraveling Land System Vulnerability to Rapid Urbanization: An Indicator-Based Vulnerability Assessment for Wuhan, China. Environ. Res. 2022, 211, 112981. [Google Scholar] [CrossRef]
  41. Cai, W.J.; Tu, F. Spatiotemporal Characteristics and Driving Forces of Construction Land Expansion in Yangtze River Economic Belt, China. PLoS ONE 2020, 15, e0227299. [Google Scholar] [CrossRef] [PubMed]
  42. Chen, B.; Wu, C.; Huang, X.; Yang, X. Examining the Relationship between Urban Land Expansion and Economic Linkage Using Coupling Analysis: A Case Study of the Yangtze River Economic Belt, China. Sustainability 2020, 12, 1227. [Google Scholar] [CrossRef] [Green Version]
  43. Chen, W.; Zhao, H.; Li, J.; Zhu, L.; Wang, Z.; Zeng, J. Land Use Transitions and the Associated Impacts on Ecosystem Services in the Middle Reaches of the Yangtze River Economic Belt in China Based on the Geo-Informatic Tupu Method. Sci. Total Environ. 2020, 701, 134690. [Google Scholar] [CrossRef] [PubMed]
  44. Zhang, D.; Zhang, Y.; Zang, Z.; Sun, C. The Driving Forces and Synergistic Effect Between Regional Economic Growth, Resources and the Environment in the Yangtze River Economic Zone. J. Resour. Ecol. 2014, 5, 203–210. [Google Scholar]
  45. Lin, Y.; Peng, C.; Chen, P.; Zhang, M. Conflict or Synergy? Analysis of Economic-Social- Infrastructure-Ecological Resilience and Their Coupling Coordination in the Yangtze River Economic. Ecol. Indic. 2022, 142, 109194. [Google Scholar] [CrossRef]
  46. Yang, Y.; Wang, H.; Wang, C.; Yang, B. Model-Based Temporal Evolution and Spatial Equilibrium Analysis of Green Development in China’s Yangtze River Economic Belt from 2009 to 2018. Ecol. Indic. 2022, 141, 109071. [Google Scholar] [CrossRef]
  47. Chen, W.; Zeng, J.; Zhong, M.; Pan, S. Coupling Analysis of Ecosystem Services Value and Economic Development in the Yangtze River Economic Belt: A Case Study in Hunan Province, China. Remote Sens. 2021, 13, 1552. [Google Scholar] [CrossRef]
  48. Faivre, N.; Fritz, M.; Freitas, T.; de Boissezon, B.; Vandewoestijne, S. Nature-Based Solutions in the EU: Innovating with Nature to Address Social, Economic and Environmental Challenges. Environ. Res. 2017, 159, 509–518. [Google Scholar] [CrossRef]
  49. Hou, X.; Liu, J.; Zhang, D.; Zhao, M.; Xia, C. Impact of Urbanization on the Eco-Efficiency of Cultivated Land Utilization: A Case Study on the Yangtze River Economic Belt, China. J. Clean. Prod. 2019, 238, 117916. [Google Scholar] [CrossRef]
  50. Song, X.; Hansen, M.; Stehman, S.V.; Potapov, P.V.; Tyukavina, A.; Vermote, E.F.; Townshend, J.R. Global land change from 1982 to 2016. Nature 2018, 560, 639–643. [Google Scholar] [CrossRef]
  51. Jiang, H.Y.; Simonovic, S.P.; Yu, Z. ANEMI_Yangtze v1.0: A Coupled Human–Natural Systems Model for the Yangtze Economic Belt—Model Description. Geosci. Model Dev. 2022, 15, 4503–4528. [Google Scholar] [CrossRef]
Figure 1. Altitude and slope map of the Yangtze River Economic Belt.
Land 11 01447 g001
Figure 2. Influencing factors of territorial space evolution in the Yangtze River Economic Belt.
Land 11 01447 g002
Figure 3. Proportion of territorial space area on the elevation gradient of the Yangtze River Economic Belt from 2000 to 2020.
Land 11 01447 g003
Figure 4. Elevation terrain distribution index of the territorial space of the Yangtze River Economic Belt from 2000 to 2020.
Land 11 01447 g004
Figure 5. Proportion of territorial space area on the slope gradient of the Yangtze River Economic Belt from 2000 to 2020.
Land 11 01447 g005
Figure 6. Slope terrain distribution index of the territorial space of the Yangtze River Economic Belt from 2000 to 2020.
Land 11 01447 g006
Figure 7. Important events and policy evolution of Yangtze River Economic Belt development from 2000 to 2020.
Land 11 01447 g007
Figure 8. Evolution of the dynamic degree of territorial space in the Yangtze River Economic Belt from 2005 to 2015.
Land 11 01447 g008
Figure 9. Distribution of territorial space in the Yangtze River Economic Belt.
Land 11 01447 g009
Figure 10. Evolution of the territorial space pattern of the Yangtze River Economic Belt from 2000 to 2020. (ac) are the spatial distribution of agricultural production space, industrial and mining production space, urban living space, rural living space, forestland ecological space, grassland ecological space, water ecological and other ecological spaces in the Yangtze River Economic Belt in the years 2000, 2010 and 2020, respectively. (df) are the distribution of production, living and ecological space in the Yangtze River Economic Zone in 2000, 2010 and 2020, respectively.
Land 11 01447 g010
Figure 11. Territorial space type transformation trajectory of the Yangtze River Economic Belt from 2000 to 2020. In the figure, (A) is the Sankey diagrams, a visualization of the mutual transfer of territorial space types in the Yangtze River Economic Belt from 2000 to 2020. (B) is the chord diagrams, a visualization of the mutual transfer of production, living and ecological space in the Yangtze River Economic Belt from 2000 to 2020. In Figure B, the mutual transfer of production, living and ecological space for 2000–2010, 2010–2020 and 2000–2020 are shown respectively.
Land 11 01447 g011
Figure 12. Changes in landscape pattern indices at the class level in the Yangtze River Economic Belt from 2000 to 2020.
Land 11 01447 g012aLand 11 01447 g012b
Figure 13. Changes in landscape pattern indices at the landscape level in the Yangtze River Economic Belt from 2000 to 2020.
Land 11 01447 g013
Figure 14. The q-mean value of the driving factors of spatial change in the Yangtze River Economic Belt from 2000 to 2020.
Land 11 01447 g014
Figure 15. Interaction detection results of drivers of territorial spatial evolution in the Yangtze River Economic Belt from 2000 to 2020. In the figure, (A) shows the interaction detection results of the drivers of the territorial space evolution of the Yangtze River Economic Belt in 2020, and (B) shows the top five interaction factors in terms of interaction values among the factors affecting the territorial space change in the upper, middle and lower reaches from 2000 to 2020.
Land 11 01447 g015
Table 1. Classification of altitude and slope of the Yangtze River Economic Belt.
AltitudeSlope
Altitude Limits/mLevelPercentage of Total Area/%Slope Limits/°LevelPercentage of Total Area/%
<500141.865131.50
500–1000215.545–15227.93
1000–1500311.4315–25323.66
1500–200048.7725–35412.78
2000–300058.79>3554.13
3000–400066.59
>400077.02
Table 2. Connection between classification of territorial space and classification of land use in the Yangtze River Economic Belt.
Territorial Space ClassificationLand-Use Classification System of the Chinese Academy of Sciences
Primary Space TypeCodeSecondary Space TypePrimary Land TypeSecondary Land Type
Production spaceAPAgricultural spaceCultivated landPaddy field, dry farmland
IPIndustrial and mining spaceUrban and rural industrial and mining residential landOther construction land
Living spaceULUrban space Urban land
RLrural space Rural residential land
Ecological spaceFEForestland spaceForestlandforestland, shrub forestland, sparse forestland, and other forestland
GEGrassland spaceGrasslandHigh coverage grassland, medium coverage grassland, low coverage grassland
WEWater spaceWater areaRivers, canals, lakes, reservoirs, ponds, tidal flats, and shoals
OEOther spaceUnused landSandy land, gobi, saline–alkali land, swampland, bare land, and bare rocky land, other
Table 3. Landscape pattern index table.
LevelLandscape Pattern IndexesCalculation FunctionParameter Introduction
Class levelNumber of Patches (NP) NP = 1 n n i It represents the quantitative characteristics of landscape patches.
Patch Density (PD) P D = N P / A It represents the level of landscape type fragmentation.
Area Integral Dimension (AFRAC) A F R A C = 2 { [ j = 1 n ( ln P i j · ln a i j ) ] [ ( j = 1 n ln P i j ) ( j = 1 n ln a i j ) ] } ( N j = 1 n ln P i j 2 ) ( j = 1 n ln P i j ) 2 It represents the complexity of patch type shape.
Mean Patch Area (Area_Mn) A r e a _ M n = A / N P It represents the level of separation of landscape types.
Landscape Percentage (PLAND) P L A N D = ( j n a i j / A ) × 100 It represents the dominance of a specific type of landscape.
Landscape levelSprawl (CONTAG) C O N T A G = { 1 + i = 1 m k = 1 m [ P i ( g j k k = 1 m g i k ) ] * [ ln P i ( g j k k = 1 m g i k ) ] 2 ln m } × 100 It reflects the clustering degree or spreading trend of landscape patches, the adjacent relationship between different types of landscape and the degree of fragmentation.
Aggregation Index (AI) A I = [ ( i = 1 m g i j m a x g i j ) × P i ] × 100 It reflects the compactness of landscape types.
Shannon’s Diversity Index (SHDI) S H D I = i = 1 m P i ln P i It reflects the state of the overall equilibrium distribution of the landscape.
Shannon’s Evenness Index (SHEI) S H E I = i = 1 m P i ln P i ln m It represents the homogenization level of landscape space.
Landscape Shape Index (LSI) L S I = 0.25 E / A It represents the complexity of the overall landscape.
A is the total area of the region; N is the total number of patches; ni is the ith area of a specific type of landscape; aij is the area of the j patch of the i-type landscape; Pij is the perimeter of each patch of each landscape; m is the number of landscape types in the region; eij is the total edge perimeter between patch i and patch k; E is the perimeter of the entire regional landscape type; Pi is the proportion of the i-type of spatial landscape in the region; gi is the number of adjacent landscape patches of a certain type; max is the maximum number of patches adjacent to a certain landscape type.
Table 4. Definition of the interaction types in the Geodetector model.
Interaction RelationshipInteraction Types
q(XiXj) < Min(q(Xi),q(Xj))Nonlinear weaken
Min(q(Xi),q(Xj)) < q(XiXj) < Min(q(Xi),q(Xj))Univariable weaken
q(XiXj) = q(Xi) + q(Xj)Independent
Max(q(Xi),q(Xj)) < q(XiXj) < q(Xi) + q(Xj)Bivariable enhanced
q(XiXj) > q(Xi) + q(Xj)Nonlinear enhanced
Table 5. The dynamic degree of territorial space in the Yangtze River Economic Belt from 2005 to 2015.
Type of Territorial Space2000–20102010–20202000–2020
Production space−0.14−0.11−0.12
Living space1.692.622.37
Ecological space0.01−0.05−0.02
Dynamic degree1.902.001.99
Table 6. Driving factors of territorial spatial evolution in the Yangtze River Economic Belt, 2000–2020 (Top 6).
200020102020
Production spaceX40.70 X40.68 X40.66
X50.68 X50.66 X20.66
X20.60 X20.58 X90.48
X90.40 X90.37 X50.30
X30.29 X10.20 X140.24
X10.21 X60.20 X60.23
Living spaceX40.77 X20.81 X20.52
X50.75 X50.77 X40.51
X20.67 X40.76 X90.40
X90.48 X90.30 X50.26
X30.31 X130.22 X10.20
X10.20 X120.21 X140.19
Ecological spaceX20.85 X40.77 X20.80
X50.82 X50.75 X40.80
X40.81 X20.68 X90.57
X90.38 X90.39 X120.34
X30.27 X140.21 X70.29
X100.19 X60.20 X140.29
Publisher’s Note: MDPI stays neutral with regard to jurisdictional claims in published maps and institutional affiliations.

