
Industrial Park Role as a Catalyst for Regional Development: Zooming on Middle East Countries


Abstract
:1. Introduction
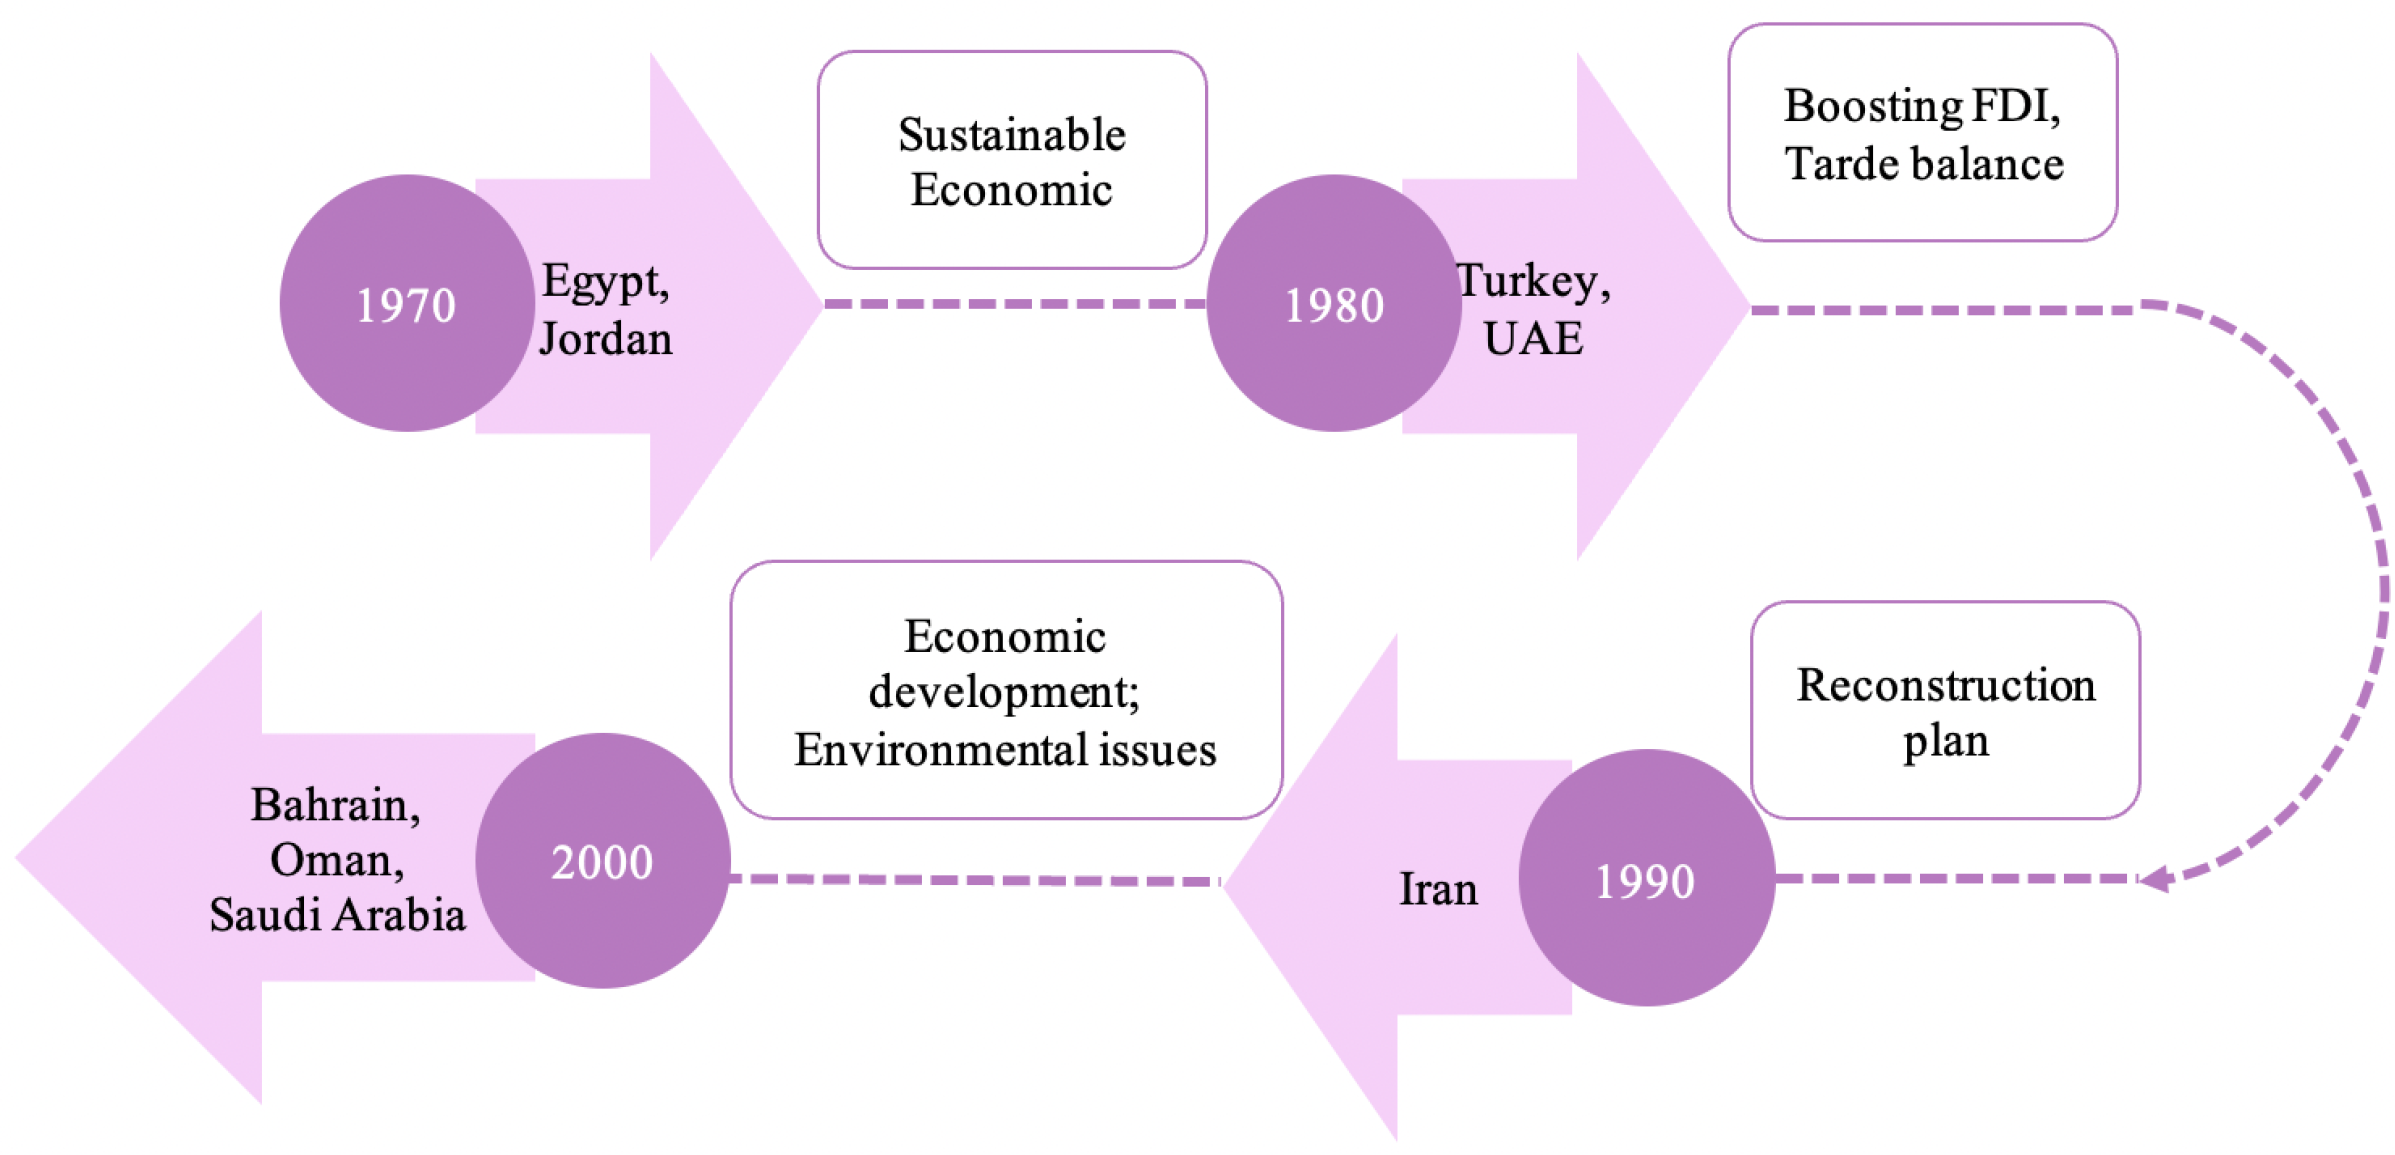
1.1. Research Background
1.2. Aims and Questions
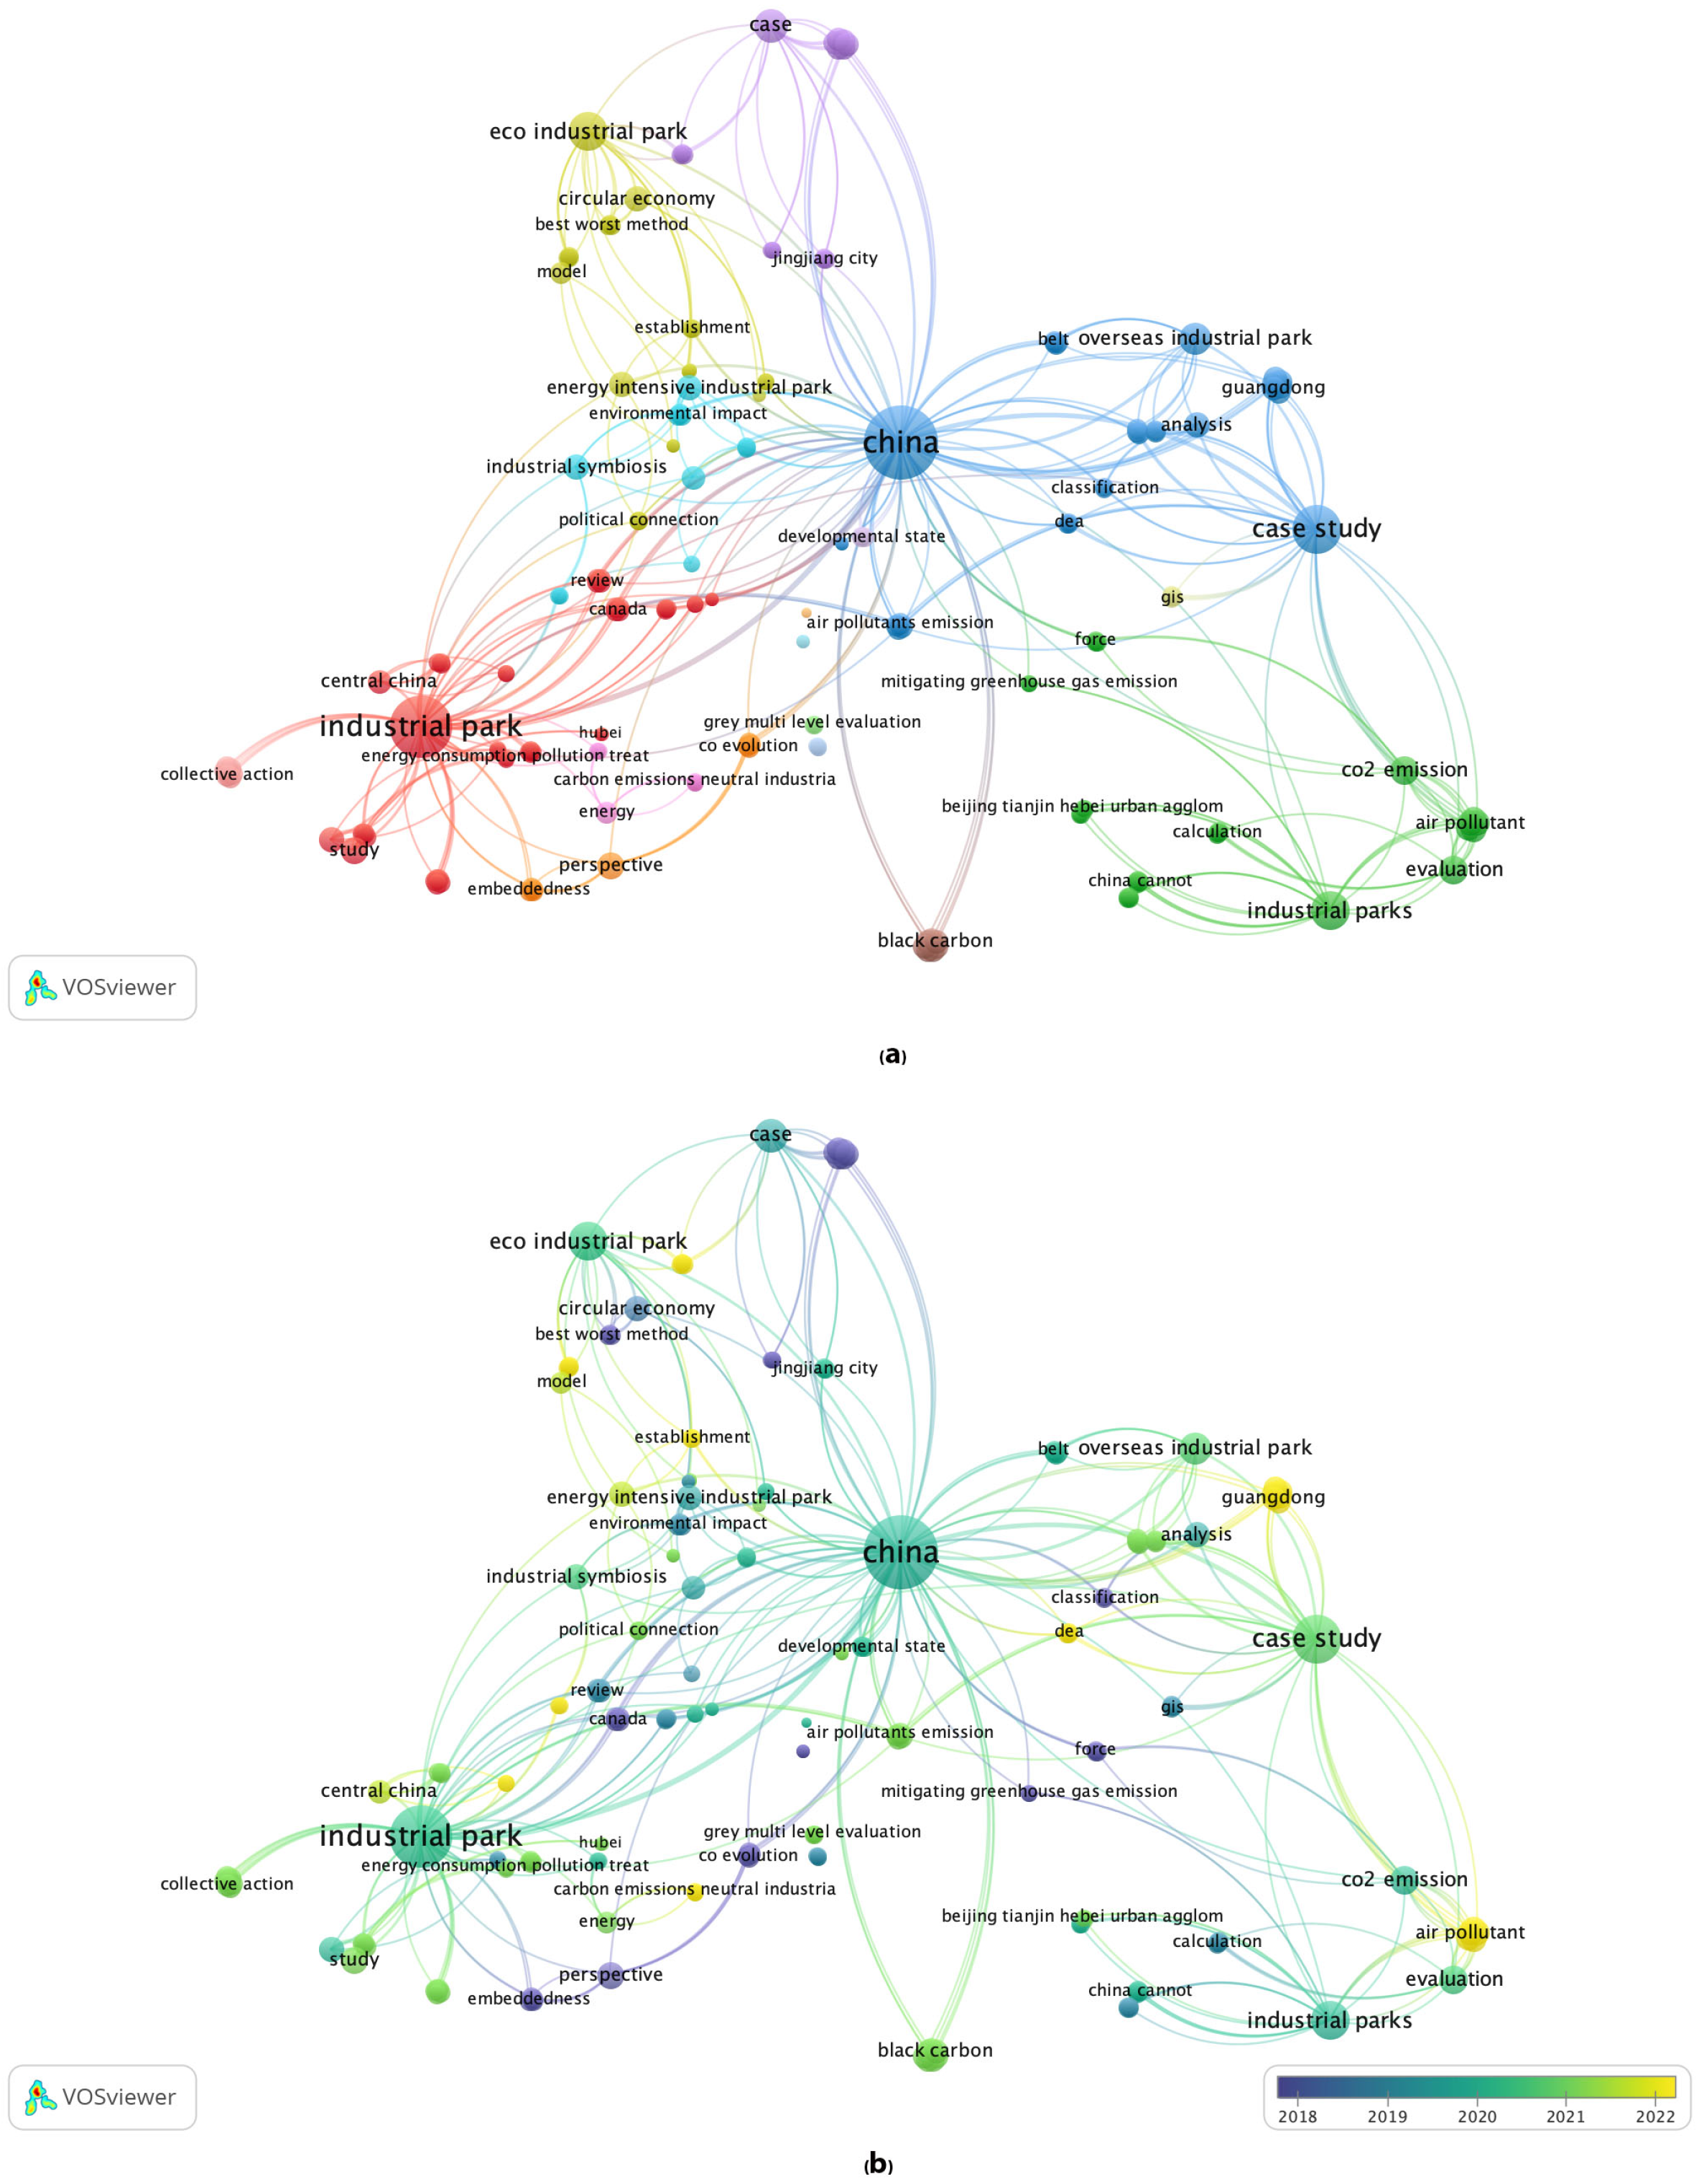
2. Relevant Literature
3. Materials and Methods
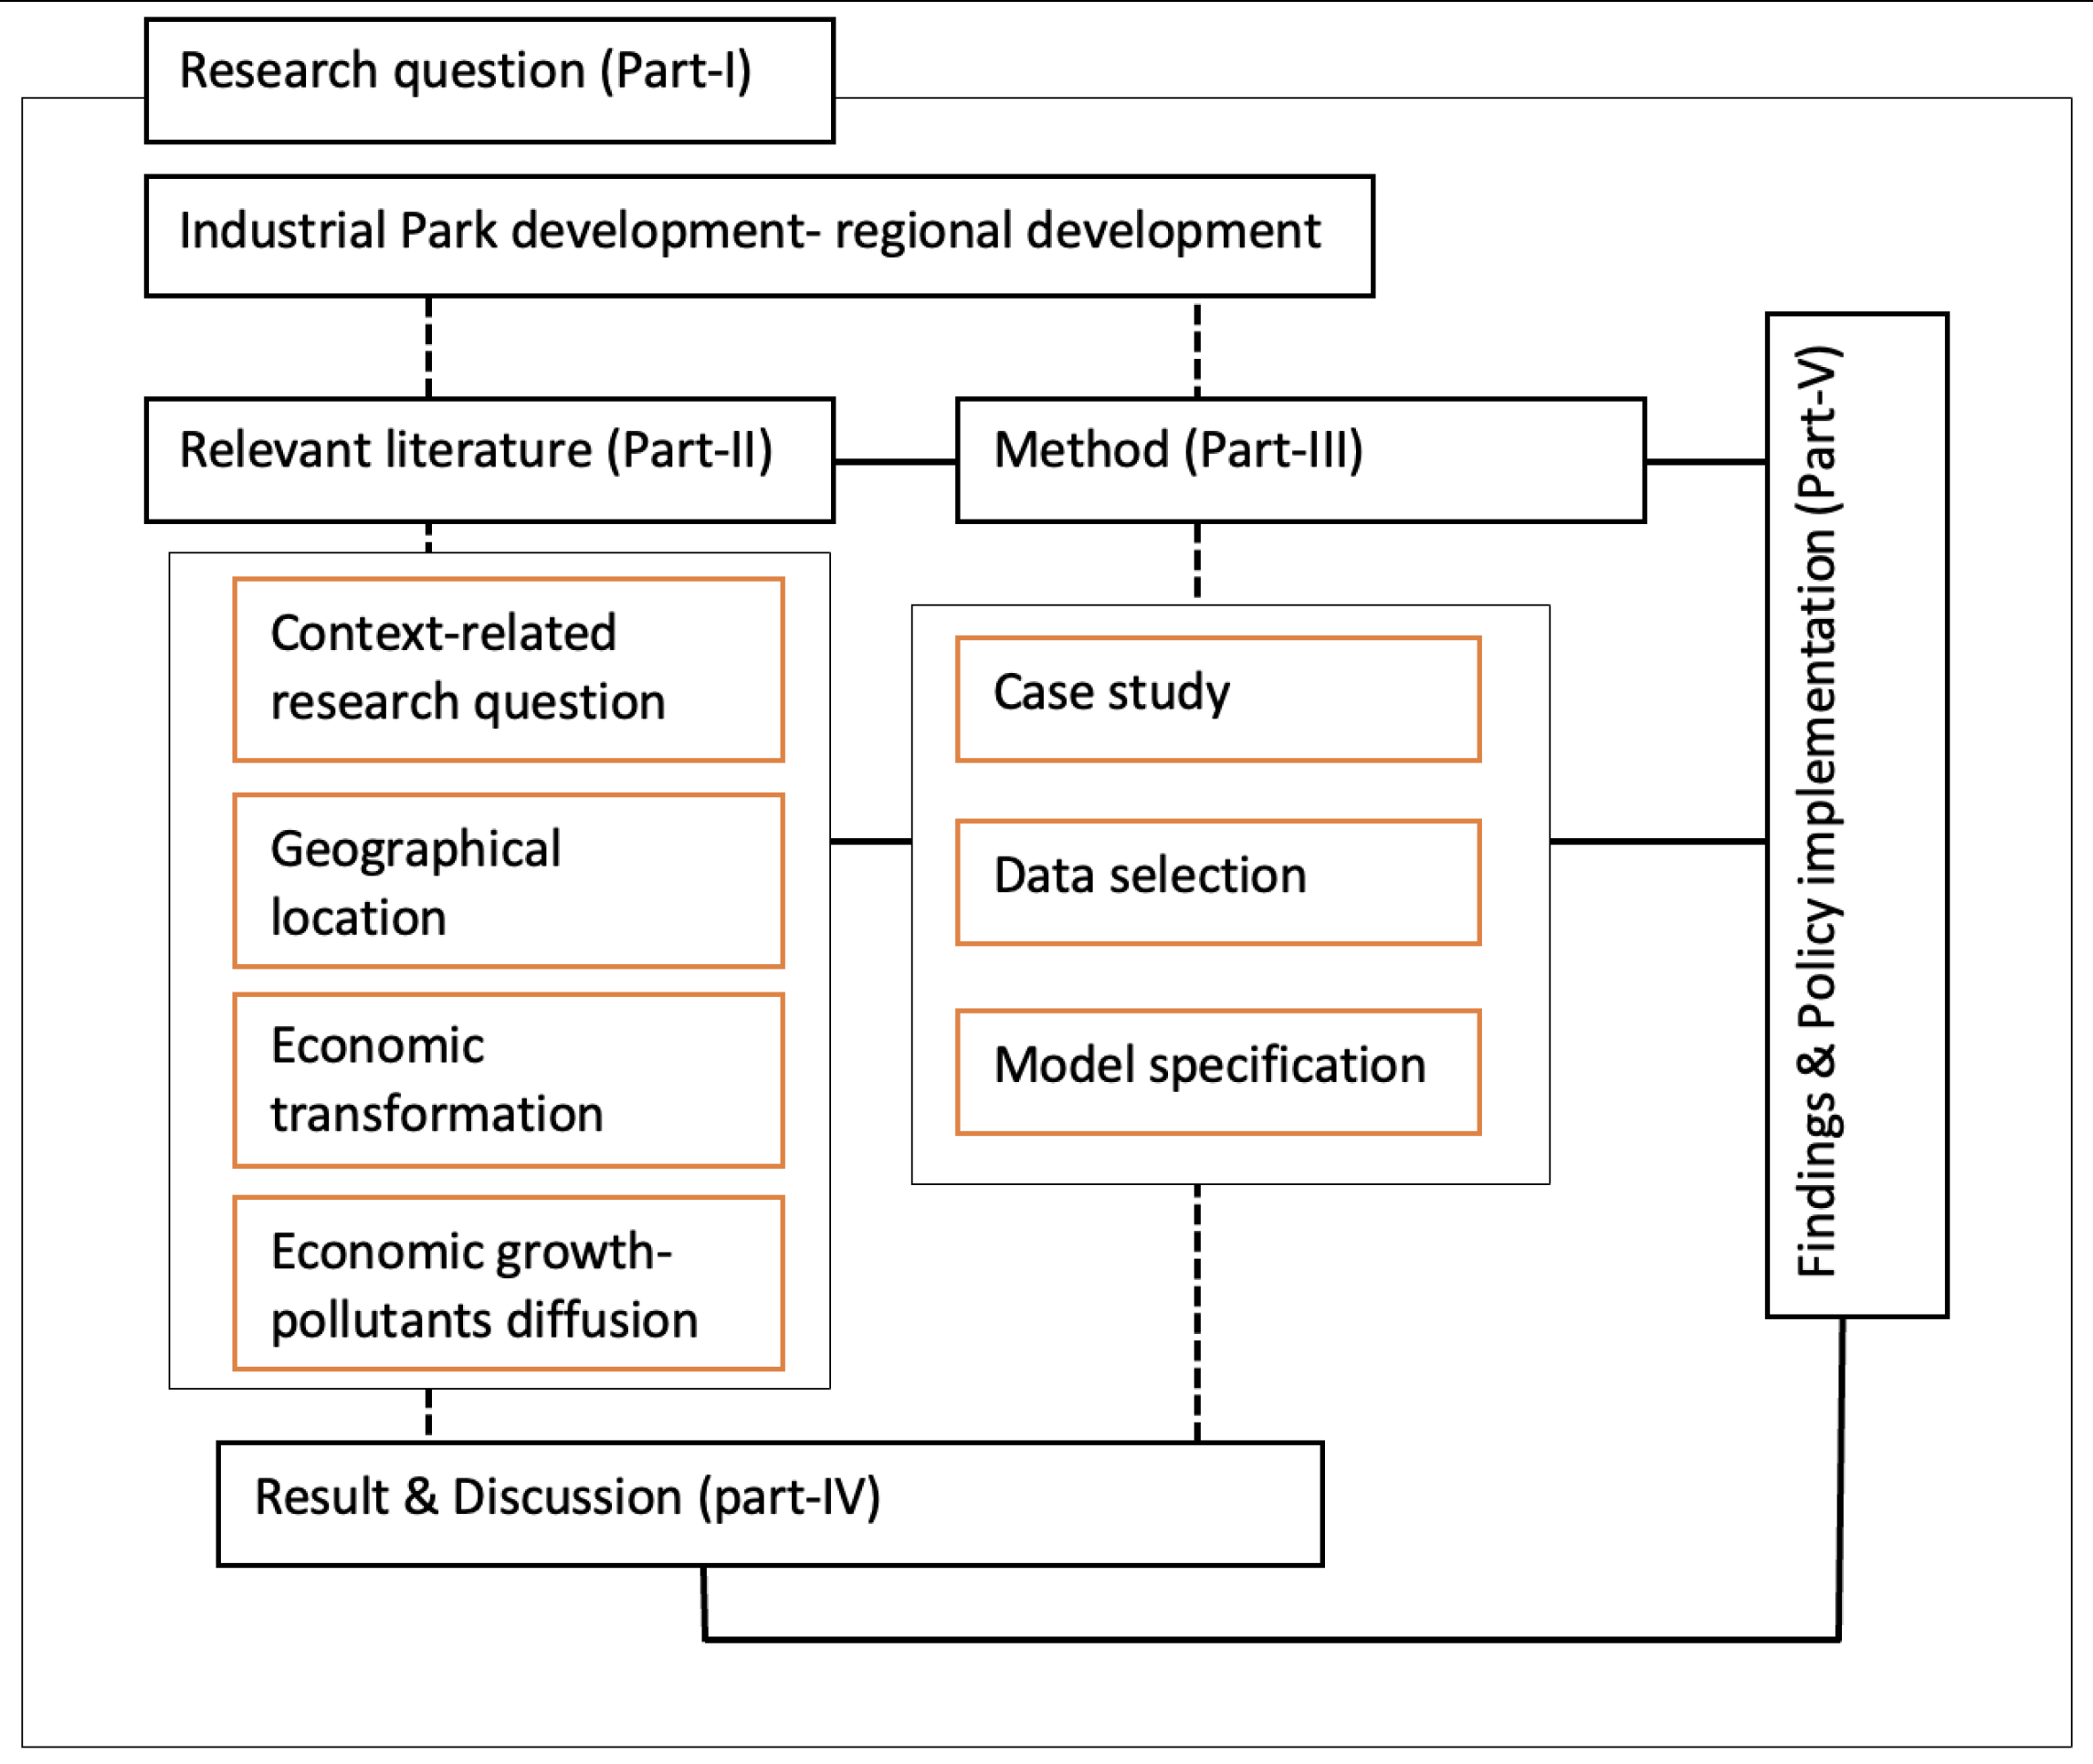
3.1. Research Steps
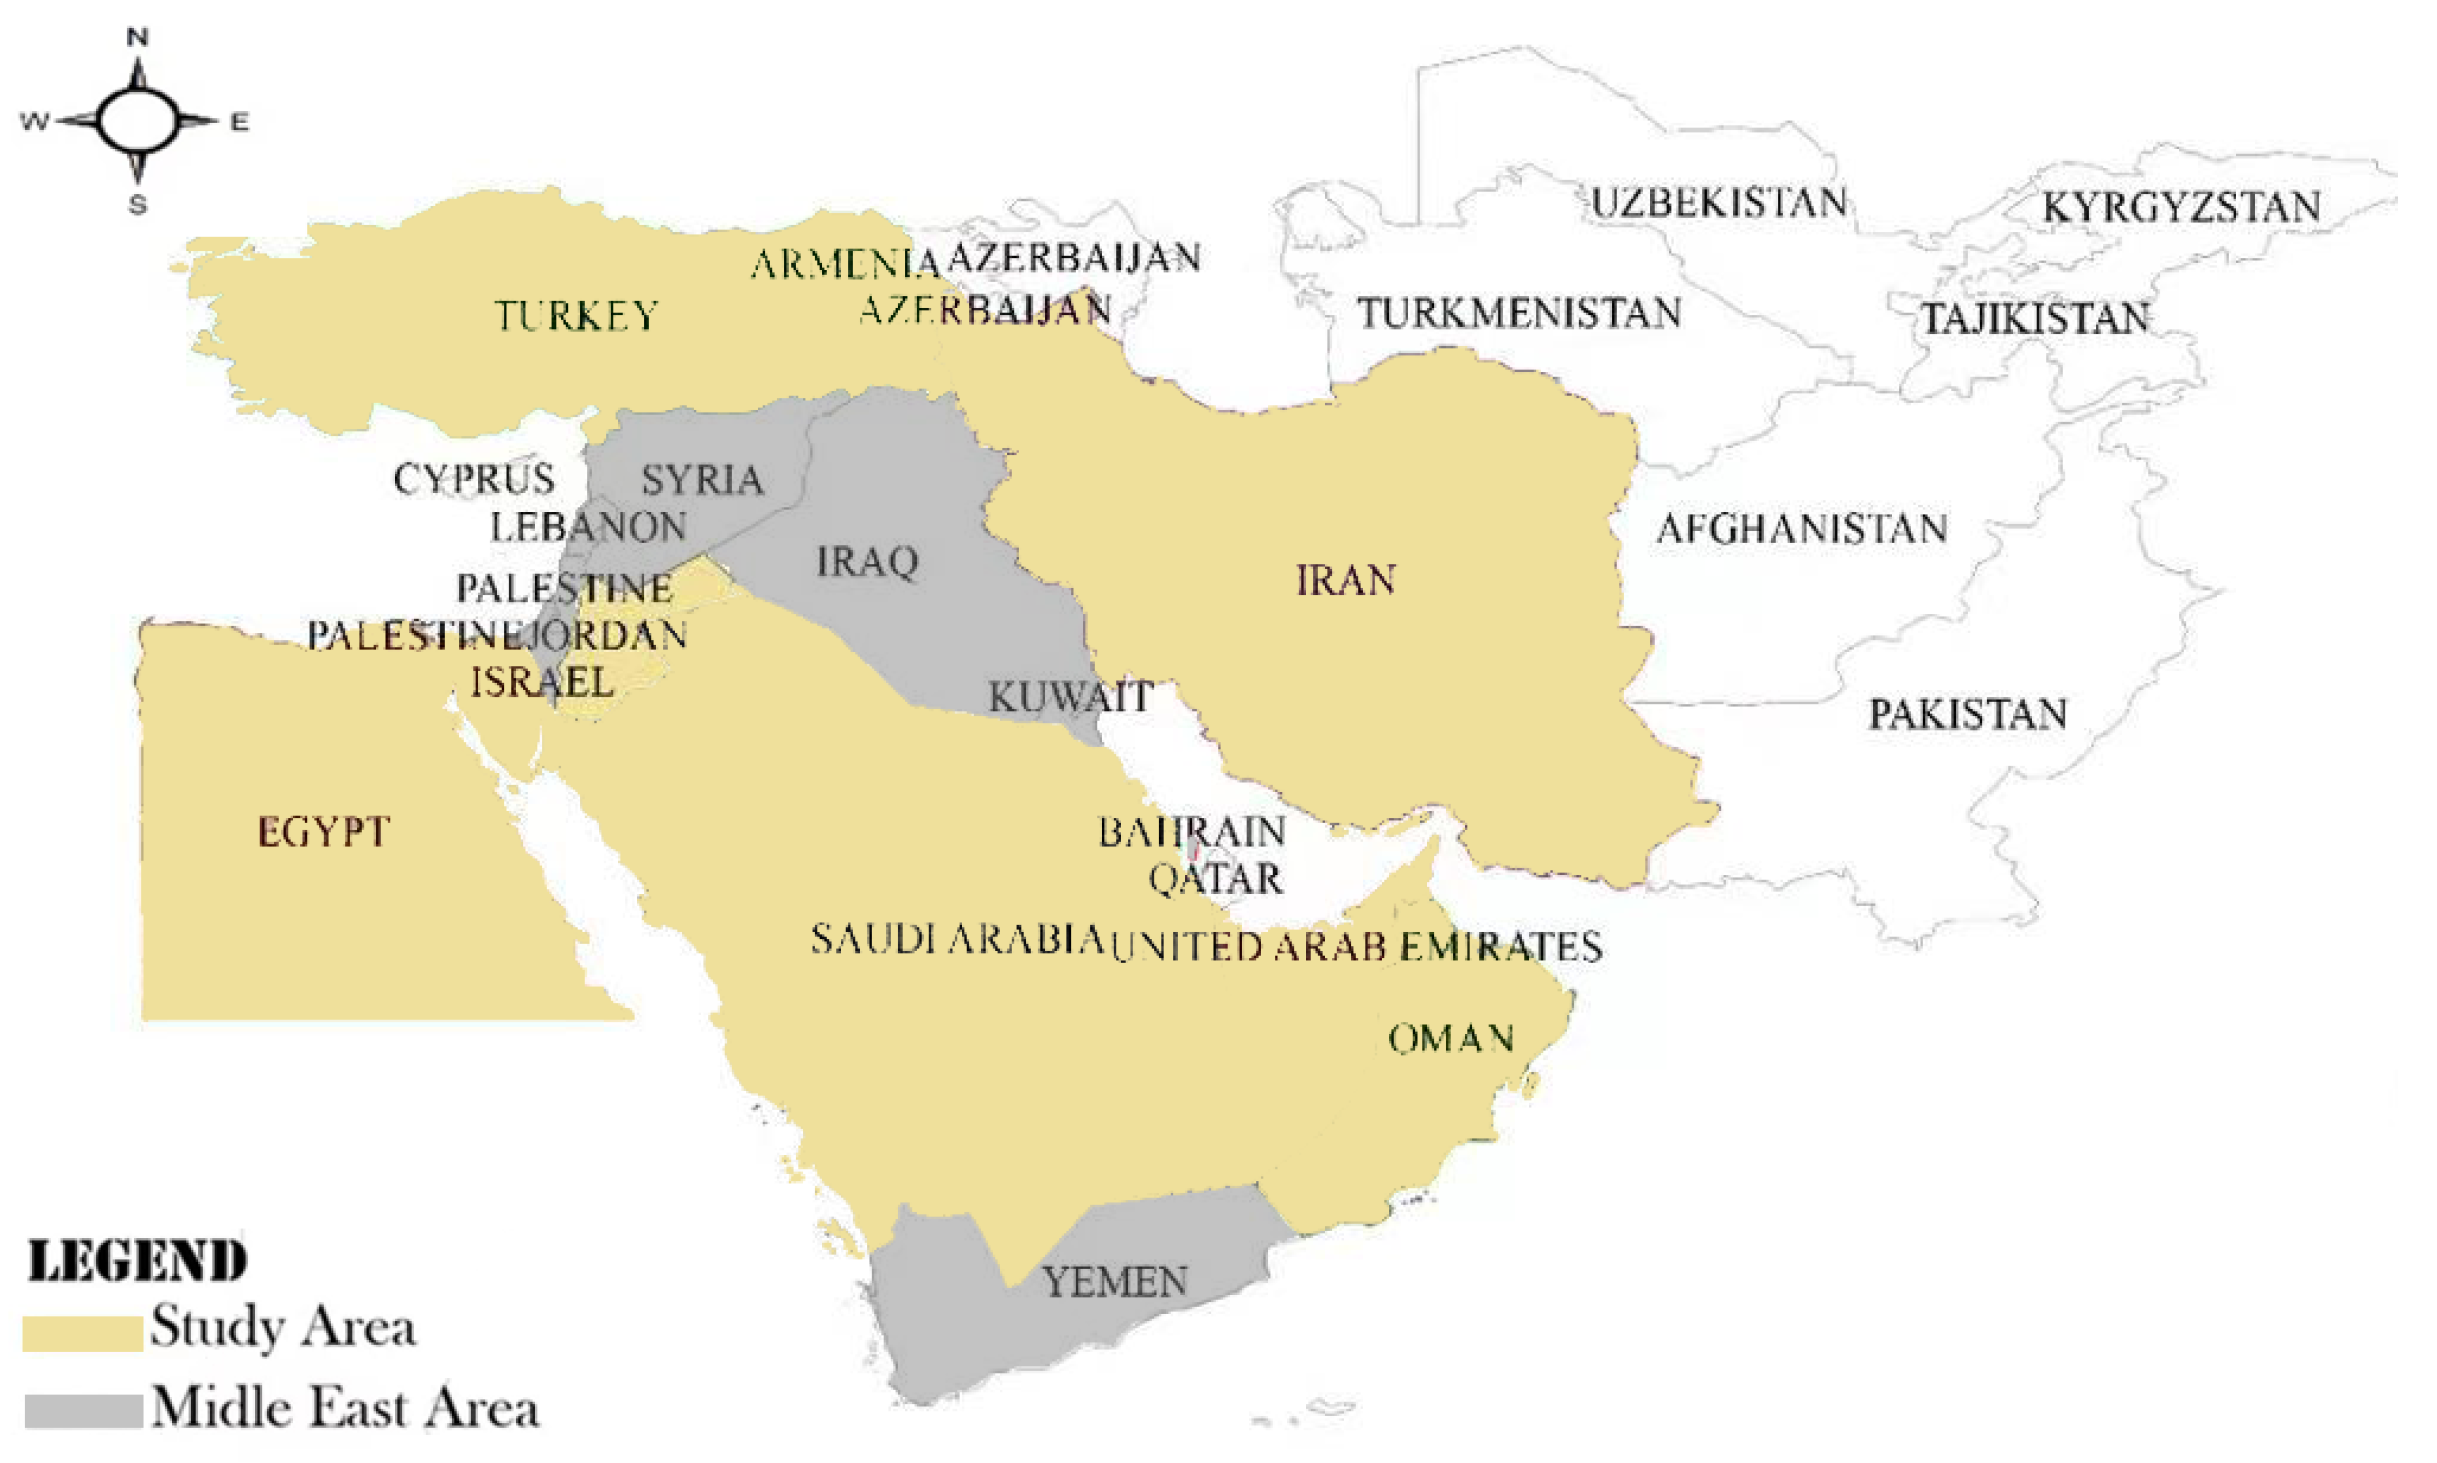
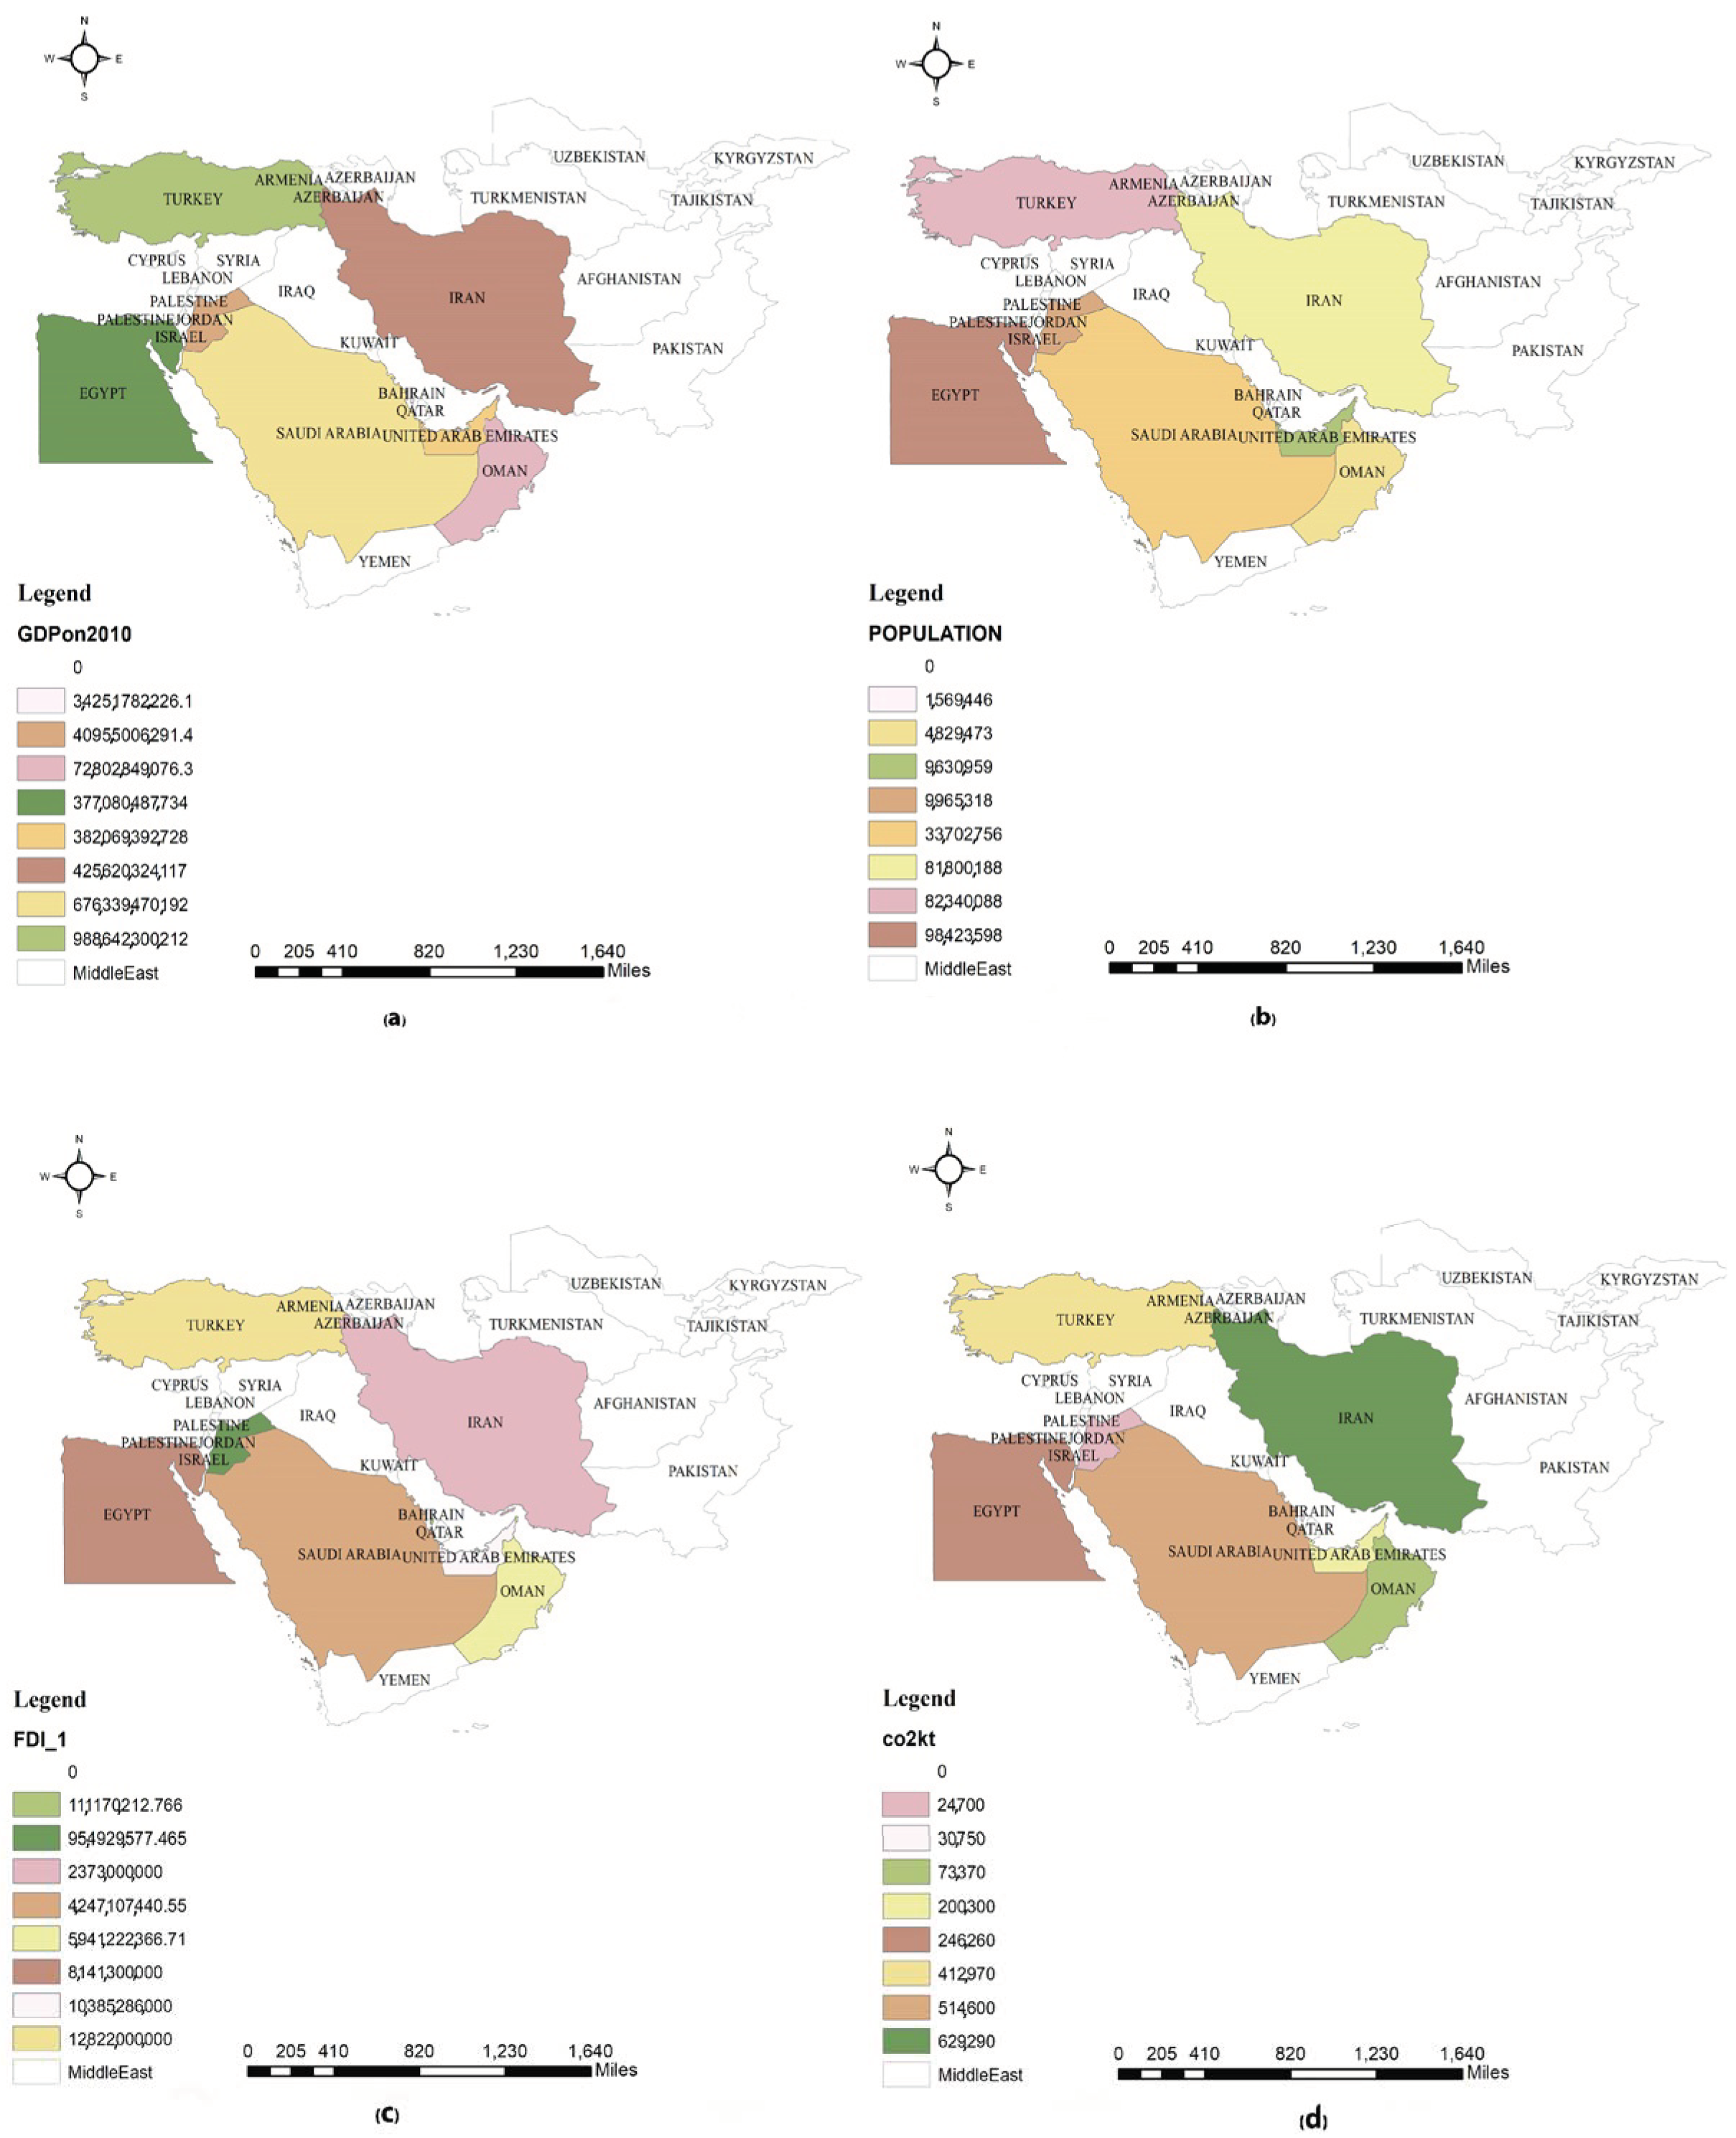
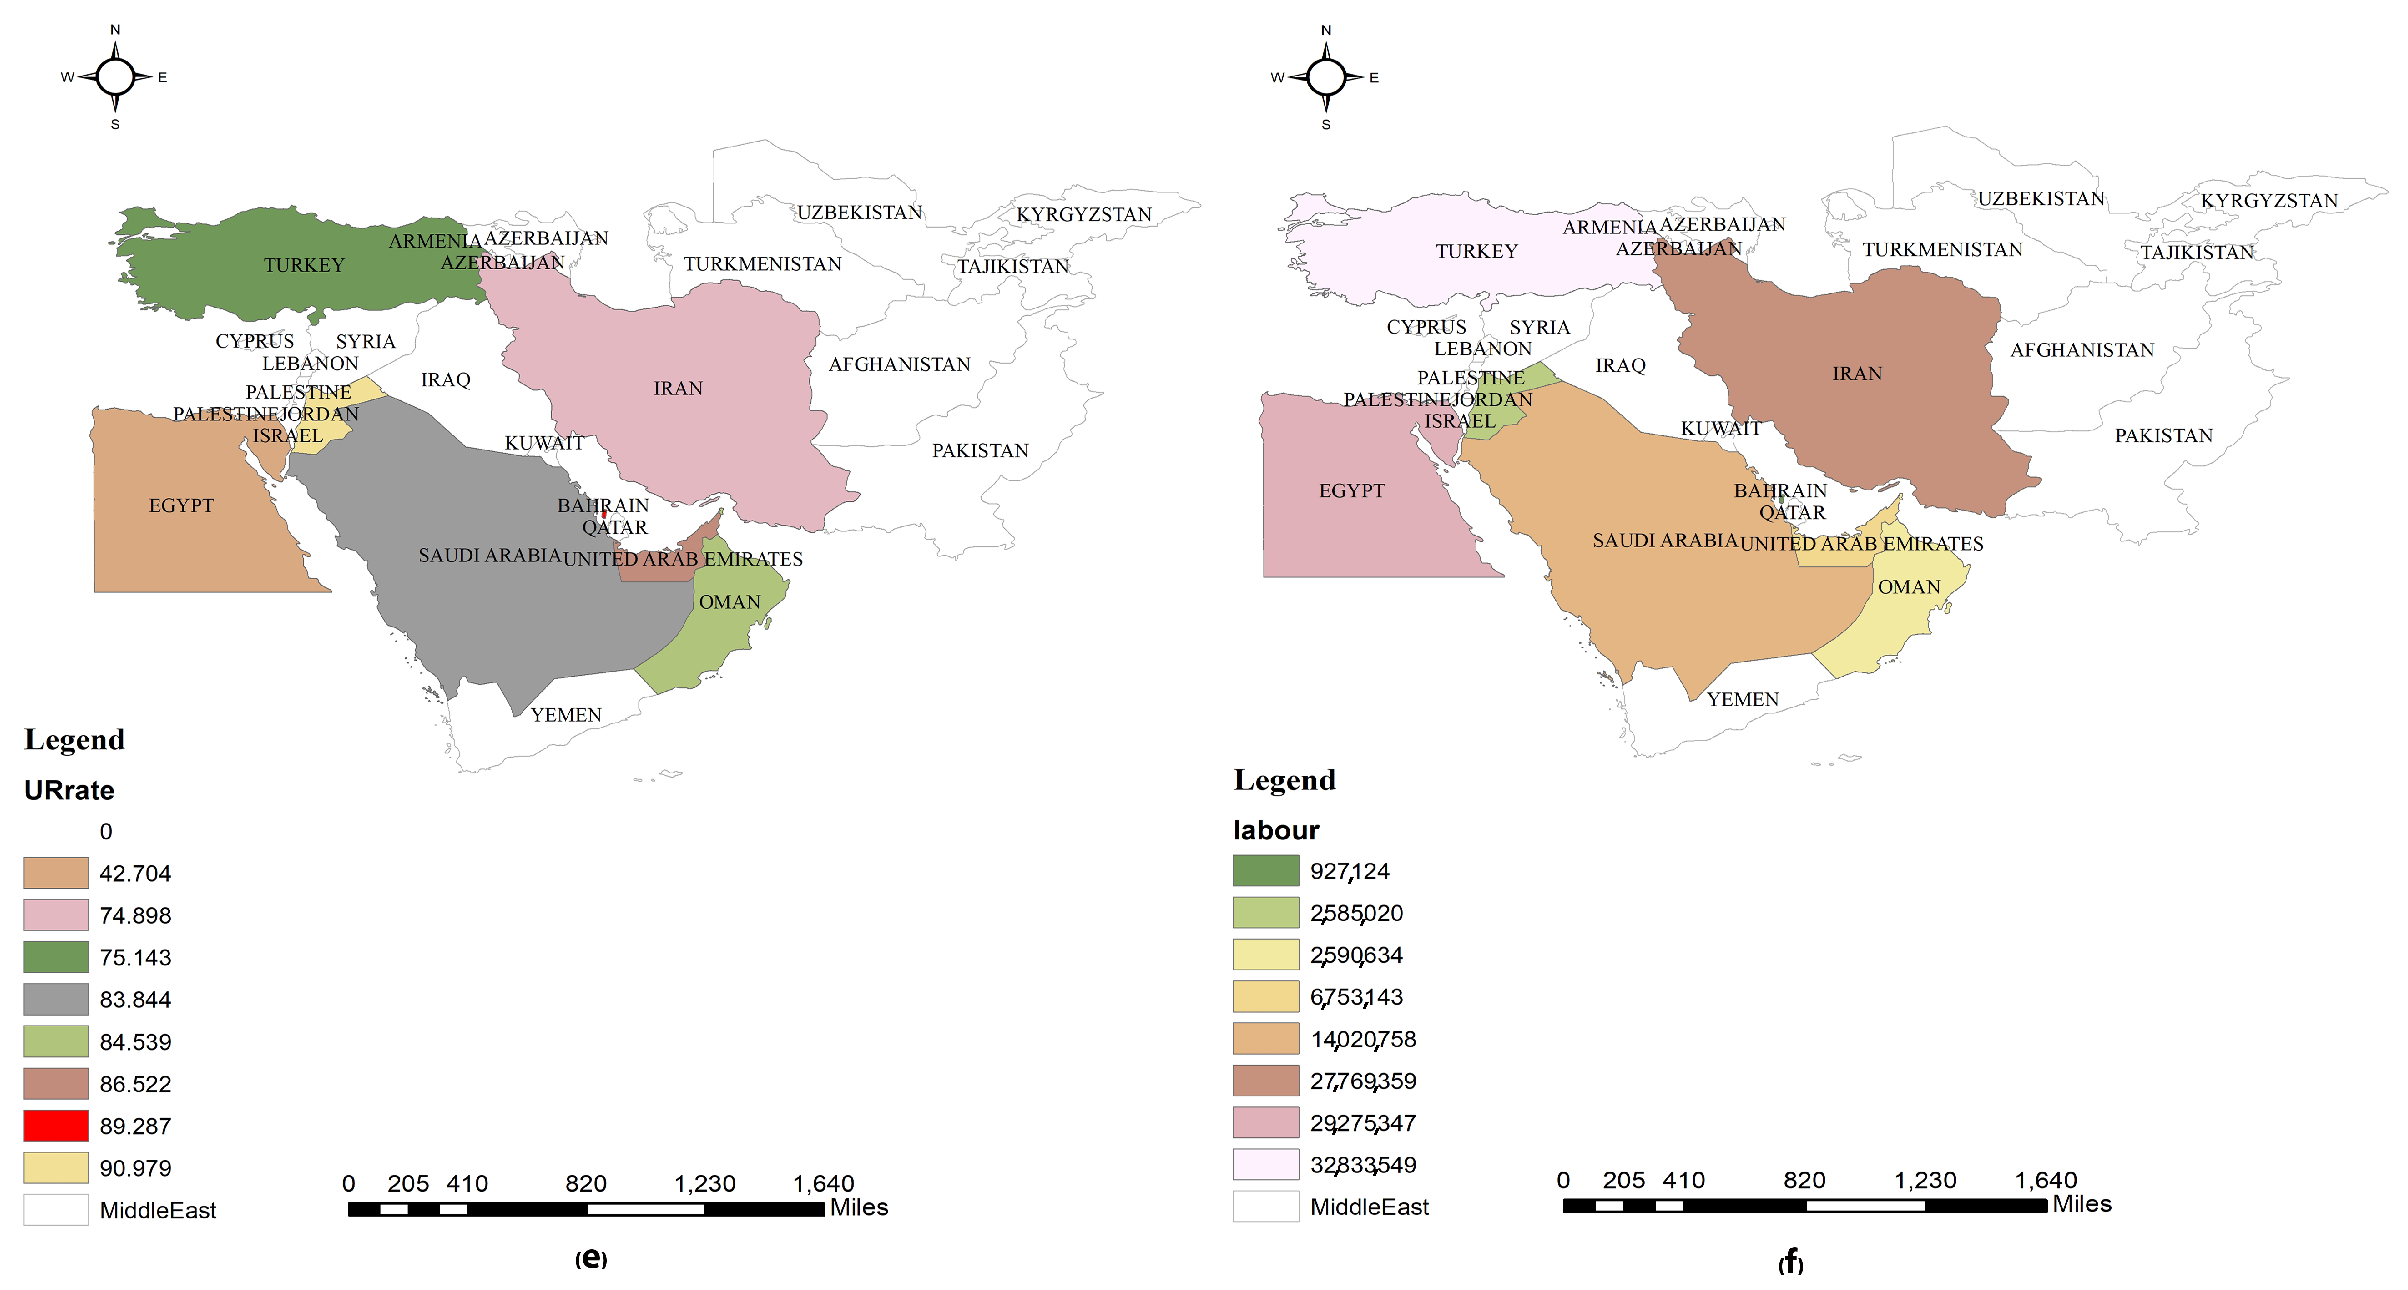
3.2. Study Area
3.3. Data Source
3.4. Model Specification
- Random effects model:
4. Results
- Estimation of the model with fixed effects:
5. Discussion
6. Conclusions
Author Contributions
Funding
Data Availability Statement
Conflicts of Interest
References
- Wang, X.; Feng, Y. The effects of National High-tech Industrial Development Zones on economic development and environmental pollution in China during 2003–2018. Environ. Sci. Pollut. Res. 2021, 28, 1097–1107. [Google Scholar] [CrossRef] [PubMed]
- Zhang, Y.; Lu, X.; Liu, B.; Wu, D.; Fu, G.; Zhao, Y.; Sun, P. Spatial relationships between ecosystem services and socioecological drivers across a large-scale region: A case study in the Yellow River Basin. Sci. Total Environ. 2021, 766, 142480. [Google Scholar] [CrossRef] [PubMed]
- Zhihao, Y.; Li, T. From Informal Renewal to Formal Renewal: Governance of Collectively Owned Industrial Land Renewal Based on a Case Study of Guangzhou. China City Plan. Rev. 2020, 29, 56–64. [Google Scholar]
- Moberg, L. The political economy of special economic zones. J. Inst. Econ. 2015, 11, 167–190. [Google Scholar] [CrossRef]
- Zeng, D.Z. The past, present, and future of special economic zones and their impact. J. Int. Econ. Law 2021, 24, 259–275. [Google Scholar] [CrossRef]
- Zheng, G.; Barbieri, E.; Di Tommaso, M.R.; Zhang, L. Development zones and local economic growth: Zooming in on the Chinese case. China Econ. Rev. 2016, 38, 238–249. [Google Scholar] [CrossRef]
- Leong, C.K. Special economic zones and growth in China and India: An empirical investigation. Int. Econ. Econ. Policy 2013, 10, 549–567. [Google Scholar] [CrossRef]
- Giannecchini, P.; Taylor, I. The eastern industrial zone in Ethiopia: Catalyst for development? Geoforum 2018, 88, 28–35. [Google Scholar] [CrossRef]
- Tam, B.T.M. SEZ Development in Cambodia, Thailand and Vietnam and the regional value chains. EEC Dev. Transp. Facil. Meas. Thailand Dev. Strateg. Neighboring Ctries. BRC Res. Rep. 2019, 24, 87. [Google Scholar]
- Xu, J.; Carey, R. Exploring China’s Impacts on Development Thinking and Policies. IDS Bull. 2021, 52, 53–68. [Google Scholar] [CrossRef]
- Lin, G.C. Chinese urbanism in question: State, society, and the reproduction of urban spaces. Urban Geogr. 2007, 28, 7–29. [Google Scholar] [CrossRef]
- Bost, F. Special economic zones: Methodological issues and definition. Transnatl. Corp. J. 2019, 26, 141–153. [Google Scholar] [CrossRef]
- Yang, Z.; Chen, X.; Pan, R.; Yuan, Q. Exploring location factors of logistics facilities from a spatiotemporal perspective: A case study from Shanghai. J. Transp. Geogr. 2022, 100, 103318. [Google Scholar] [CrossRef]
- Pakdeenurit, P. Special Economic Zone: Facts, roles, and opportunities of investment. In Proceedings of the International MultiConference of Engineers and Computer Scientists 2014, Hong Kong, China, 12–14 March 2014. [Google Scholar]
- Dirksmeier, P. Extensive legal exceptionalism, an administrative export-processing zone and urbanization in Mauritius. Area Dev. Policy 2018, 3, 203–222. [Google Scholar] [CrossRef]
- Blanke, G. Free zone arbitration in the United Arab Emirates: DIFC v. ADGM:(Part I). J. Int. Arbitr. 2018, 35, 541–573. [Google Scholar] [CrossRef]
- Biryukov, E. About the Futuristic City of Neom in Saudi Arabia. 2017, pp. 39–43. Available online: https://vestnik.guu.ru/jour/article/view/878 (accessed on 16 June 2022).
- Dursun, M.; Goker, N.; Tulek, B.D. Efficiency analysis of organized industrial zones in Eastern Black Sea Region of Turkey. Socio-Econ. Plan. Sci. 2019, 68, 100659. [Google Scholar] [CrossRef]
- Held, C.C.; Cummings, J.T.; Cotter, J.V. Middle East Patterns: Places, Peoples, and Politics; Routledge: London, UK, 2018. [Google Scholar]
- Dong, F.; Wang, Y.; Su, B.; Hua, Y.; Zhang, Y. The process of peak CO2 emissions in developed economies: A perspective of industrialization and urbanization. Resour. Conserv. Recycl. 2019, 141, 61–75. [Google Scholar] [CrossRef]
- Zhao, S.; Wang, X.; Qu, P.; Rahmoun, T. Research on the Planning and Development of Industrial Cities in the Middle East Arab Countries Under the Belt and Road Initiative. China City Plan. Rev. 2020, 29, 50–60. [Google Scholar]
- Zhang, Y.; Tong, D.; Liang, X. New perspective on regional inequality: Theory and evidence from Guangdong, China. J. Urban Plan. Dev. 2018, 144, 04018002. [Google Scholar] [CrossRef]
- Dai, Q.; Ye, X.; Wei, Y.D.; Ning, Y.; Dai, S. Geography, ethnicity and regional inequality in Guangxi Zhuang autonomous region, China. Appl. Spat. Anal. Policy 2018, 11, 557–580. [Google Scholar] [CrossRef]
- Luo, M.; Zhao, T.; Zhao, L.; Wang, J. Understanding regional inequality in per capita CO2 emissions in China during 1997–2016: Sources and driving factors. Environ. Sci. Pollut. Res. 2020, 27, 32100–32115. [Google Scholar] [CrossRef]
- Ye, C.; Li, S.; Zhuang, L.; Zhu, X. A comparison and case analysis between domestic and overseas industrial parks of China since the Belt and Road Initiative. J. Geogr. Sci. 2020, 30, 1266–1282. [Google Scholar] [CrossRef]
- Wang, S.; Meng, G.; Zhou, J.; Xiong, L.; Yan, Y.; Yu, N. Analysis on geo-effects of China’s overseas industrial parks: A case study of Cambodia Sihanoukville Special Economic Zone. J. Geogr. Sci. 2021, 31, 712–732. [Google Scholar] [CrossRef]
- Liang, Y.; Zeng, J.; Kuik, C.C.; Zhou, Z.; Zhou, K. Policy transfer and scale reconstruction of China’s overseas industrial parks: A case study of the Malaysia-China Kuantan Industrial Park. J. Geogr. Sci. 2021, 31, 733–746. [Google Scholar] [CrossRef]
- Kang, L.; Ma, L. Expansion of industrial parks in the Beijing–Tianjin–Hebei urban agglomeration: A spatial analysis. Land 2021, 10, 1118. [Google Scholar] [CrossRef]
- Shang, H.; Li, J. Eco-efficiency assessment for the eco-industrial park based on the emergy analysis. In Modeling Risk Management in Sustainable Construction; Springer: Berlin/Heidelberg, Germany, 2011; pp. 229–235. [Google Scholar]
- Liu, L.; Lei, H. Cluster Analysis for Study Ecological Landscape Sustainability: An Empirical Study in Xi’an of China. In LTLGB 2012; Springer: Berlin/Heidelberg, Germany, 2013; pp. 1041–1047. [Google Scholar]
- Fan, Y.; Qiao, Q.; Fang, L. Network analysis of industrial metabolism in industrial park–A case study of Huai’an economic and technological development area. J. Clean. Prod. 2017, 142, 1552–1561. [Google Scholar] [CrossRef]
- Zhao, Y. China in transition towards a circular economy: From policy to practice. J. Prop. Plan. Environ. Law 2020, 12, 187–202. [Google Scholar] [CrossRef]
- He, Y.; Zhu, Z.; Xie, H.; Zhang, X.; Sheng, M. A case study in China of the influence mechanism of industrial park efficiency using DEA. Environ. Dev. Sustain. 2022, 1–20. [Google Scholar] [CrossRef]
- Wu, Y.; Gao, X. Can the establishment of eco-industrial parks promote urban green innovation? Evidence from China. J. Clean. Prod. 2022, 341, 130855. [Google Scholar] [CrossRef]
- Yang, Z.; Hao, G.; Cheng, Z. Investigating operations of industrial parks in Beijing: Efficiency at different stages. Econ. Res.-Ekon. Istraživanja 2018, 31, 755–777. [Google Scholar] [CrossRef]
- Lin, S.H.; Wang, D.; Huang, X.; Zhao, X.; Hsieh, J.C.; Tzeng, G.H.; Li, J.H.; Chen, J.T. A multi-attribute decision-making model for improving inefficient industrial parks. Environ. Dev. Sustain. 2021, 23, 887–921. [Google Scholar] [CrossRef]
- Guo, Y.; Tian, J.; Zang, N.; Gao, Y.; Chen, L. The role of industrial parks in mitigating greenhouse gas emissions from China. Environ. Sci. Technol. 2018, 52, 7754–7762. [Google Scholar] [CrossRef] [PubMed]
- Zhang, M.; Wang, C.; Wang, S.; Wang, K.; Zhang, R. Assessment of greenhouse gas emissions reduction potential in an industrial park in China. Clean Technol. Environ. Policy 2020, 22, 1435–1448. [Google Scholar] [CrossRef]
- Gao, G.; Wang, S.; Xue, R.; Liu, D.; Ren, H.; Zhang, R. Uncovering the characteristics of air pollutants emission in industrial parks and analyzing emission reduction potential: Case studies in Henan, China. Sci. Rep. 2021, 11, 23709. [Google Scholar] [CrossRef]
- Wang, J.; Wang, S.; Li, S.; Cai, Q.; Gao, S. Evaluating the energy-environment efficiency and its determinants in Guangdong using a slack-based measure with environmental undesirable outputs and panel data model. Sci. Total Environ. 2019, 663, 878–888. [Google Scholar] [CrossRef]
- Yu, X.; Chen, H.; Wang, B.; Wang, R.; Shan, Y. Driving forces of CO2 emissions and mitigation strategies of China’s National low carbon pilot industrial parks. Appl. Energy 2018, 212, 1553–1562. [Google Scholar] [CrossRef]
- Thorarinsson, L. A Review of the Evolution of the Japanese Oil Industry, Oil Policy and Its Relationship with the Middle East; The Oxford Institute for Energy Studies: Oxford, UK, 2018. [Google Scholar]
- Ross, M.L. The oil curse. In The Oil Curse; Princeton University Press: Princeton, NJ, USA, 2012. [Google Scholar]
- Issa, N.S.C.; Al Abbar, S.D. Sustainability in the Middle East: Achievements and challenges. Int. J. Sustain. Build. Technol. Urban Dev. 2015, 6, 34–38. [Google Scholar] [CrossRef]
- Tregenna, F. Deindustrialization and premature deindustrialization. In Handbook of Alternative Theories of Economic Development; Edward Elgar Publishing: Cheltenham, UK, 2016. [Google Scholar]
- McNeill, J.R.; Engelke, P. The Great Acceleration: An Environmental History of the Anthropocene Since 1945; Harvard University Press: Cambridge, MA, USA, 2016. [Google Scholar]
- Azmeh, S. Trade regimes and global production networks: The case of the qualifying industrial zones (QIZs) in Egypt and Jordan. Geoforum 2014, 57, 57–66. [Google Scholar] [CrossRef]
- Kamel, M.; Abu El Ella, E.S.M. Integration of Remote Sensing & GIS to Manage the Sustainable Development in the Nile Valley desert fringes of assiut-sohag governorates, upper Egypt. J. Indian Soc. Remote Sens. 2016, 44, 759–774. [Google Scholar]
- Akyelken, N. Mobility-related economic exclusion: Accessibility and commuting patterns in industrial zones in Turkey. Soc. Incl. 2017, 5, 175–182. [Google Scholar] [CrossRef] [Green Version]
- Çal, M.; Kandemir, A.; Saygili, C.; Bayraktar, C. Efficiency Analysis of Free Zones and Strategy Policies. In New Challenges in Leadership and Technology Management; Future Academy: Hong Kong, China, 2019. [Google Scholar]
- Chamorro-Courtland, C. National report for the united arab emirates and its free zones. In Executory Contracts in Insolvency Law; Edward Elgar Publishing: Cheltenham, UK, 2019. [Google Scholar]
- Esposito, P.; Iovino, F. Special Economic Zones: A Brief Comparative Excursus. 2018. [Google Scholar]
- Teichmann, F.M.J.; Wittmann, C. Money laundering in the United Arab Emirates: The risks and the reality. J. Money Laund. Control 2022. [Google Scholar] [CrossRef]
- Al Oraimi, S. Diversity and social cohesion in the United Arab Emirates. Вестник Рoссийскoгo университета дружбы нарoдoв. Серия: Сoциoлoгия. RUDN J. Sociol. 2020, 20, 837–846. [Google Scholar] [CrossRef]
- Russell QC, D. Trusts and foundations move onshore in the Gulf. Trust. Trust. 2021, 27, 311–320. [Google Scholar] [CrossRef]
- Shahnoori, P.; Jenkins, G.P. The value of online banking to small and medium-sized enterprises: Evidence from firms operating in the uae free trade zones. Appl. Econ. 2019, 51, 4046–4055. [Google Scholar] [CrossRef]
- Esposito, P.; Ricci, P.; Iovino, F. The urban free zones (UFZ). between disapproval, misunderstanding and recognition. as a special development tool for local finance. In Proceedings of the 10th Annual Conference of the EuroMed Academy of Business, Rome, Italy, 13–15 September 2017. [Google Scholar]
- Basyoni, M.H.; Aref, M.A. Composition and origin of the sabkha brines, and their environmental impact on infrastructure in Jizan area, Red Sea Coast, Saudi Arabia. Environ. Earth Sci. 2016, 75, 1–17. [Google Scholar] [CrossRef]
- Sharbatoghlie, A. Urbanization and Regional Disparities in Post-Revolutionary Iran; Routledge: London, UK, 2021. [Google Scholar]
- Hakimian, H. Iran’s Free Trade Zones: Back Doors to the International Economy? Iran. Stud. 2011, 44, 851–874. [Google Scholar] [CrossRef]
- Jiang, Q.; He, M.; Ma, M.T.; Wu, H.Z.; Yu, Z.J.; Guan, S.; Jiang, L.Y.; Wang, Y.; Zheng, D.D.; Jin, F.; et al. [Corrigendum] MicroRNA-148a inhibits breast cancer migration and invasion by directly targeting WNT-1. Oncol. Rep. 2022, 47, 1–2. [Google Scholar] [CrossRef] [PubMed]
- Wei, H.; Zhang, Y.; Zhang, T.; Guan, Y.; Xu, K.; Ding, X.; Pang, Y. Review on bioinspired planetary regolith-burrowing robots. Space Sci. Rev. 2021, 217, 1–39. [Google Scholar]
- Baltagi, B.H. Panel Data Econometrics: Theoretical Contributions and Empirical Applications; Emerald Group Publishing: Bingley, UK, 2006. [Google Scholar]
- Latourte, A.; Gottenberg, J.E.; Luxembourger, C.; Pane, I.; Claudepierre, P.; Richette, P.; Lafforgue, P.; Combe, B.; Cantagrel, A.; Sibilia, J.; et al. Safety of surgery in patients with rheumatoid arthritis treated by abatacept: Data from the French Orencia in Rheumatoid Arthritis Registry. Rheumatology 2017, 56, 629–637. [Google Scholar] [CrossRef] [Green Version]
- Song, L.; Zhou, X. Does the green industry policy reduce industrial pollution emissions?—Evidence from China’s national eco-industrial park. Sustainability 2021, 13, 6343. [Google Scholar] [CrossRef]
- Zeng, L. China’s Eco-Efficiency: Regional Differences and Influencing Factors Based on a Spatial Panel Data Approach. Sustainability 2021, 13, 3143. [Google Scholar] [CrossRef]
- Hou, J.; Teo, T.S.; Zhou, F.; Lim, M.K.; Chen, H. Does industrial green transformation successfully facilitate a decrease in carbon intensity in China? An environmental regulation perspective. J. Clean. Prod. 2018, 184, 1060–1071. [Google Scholar] [CrossRef]
- De Simone, E.; D’Uva, M. Social support, industrial parks and FDI location choice across Hungarian counties. Soc. Indic. Res. 2017, 133, 1031–1045. [Google Scholar] [CrossRef]
- Pan, F.; Wang, J. From obligated embeddedness to supplier chain park investment: A new mode of FDI. China Soft Sci 2010, 3, 95–102. [Google Scholar]
- Li, T.; Wang, W. Planning and designing of distributed PV of Suzhou Industrial Park. In Proceedings of the 2015 IEEE 42nd Photovoltaic Specialist Conference (PVSC), New Orleans, LA, USA, 14–19 June 2015; pp. 1–2. [Google Scholar]
- Peng, T.; Wu, W. Green GDP accounting: Further research and discussion in the context of low-carbon development. China Popu. Resour. Environ. 2010, 20, 81–86. [Google Scholar]
- Tian, L.; Ge, B.; Li, Y. Impacts of state-led and bottom-up urbanization on land use change in the peri-urban areas of Shanghai: Planned growth or uncontrolled sprawl? Cities 2017, 60, 476–486. [Google Scholar] [CrossRef]
- Cavallo, A.; Ghezzi, A.; Colombelli, A.; Casali, G.L. Agglomeration dynamics of innovative start-ups in Italy beyond the industrial district era. Int. Entrep. Manag. J. 2020, 16, 239–262. [Google Scholar] [CrossRef]
- Davis, K.; Golden, H.H. Urbanization and the development of pre-industrial areas. In Kingsley Davis; Routledge: London, UK, 2017; pp. 295–317. [Google Scholar]


| Source | Research Fields | Dimensions | Methods |
|---|---|---|---|
| Ye et al., 2021 [25] | Belt and Road Initiative (BRI), China (Thai-Chinese Rayong Industrial Zone and Tianjin Economic-Technological Development Area) | economic development mode | spatiotemporal evolution |
| Wang et al., 2021 [26] | Cambodia Sihanoukville Special Economic Zone (BRI) | Geo political, economic social and cultural | interviews and a case study |
| Liang et al., 2021 [27] | Malaysia-China Kuantan Industrial Park | policy transfer theory | Interview as data collection |
| Kang, 2021 [28] | Beijing–Tianjin–Hebei | urban agglomeration and supplements | Critical analysis |
| Shang and Li, 2021 [29] | an industrial Park | economic performance and the environmental performance | Eco- efficiency |
| Liu and Lei, 2013 [30] | An Empirical Study in Xi’an of China industrial parks (environment, economic criteria) | the concept of ecological landscape | DEARA (Data Envelopment-Regression Analysis) model, |
| Fan et al., 2017 [31] | Huai’an economic and technological development area | Economic agglomerations | ecological network analysis |
| Zhao et al., 2020 [32] | Suzhou New District and Shanghai city in the building CE-oriented industrial park and CE city, | circular economy | a top-down approach |
| He et al., 2020 [33] | 36 industrial parks Jiangxi Province of china | economic efficiency | DEA |
| Wu and Gao, 2022 [34] | 264 prefecture-level cities in China | achieving green and sustainable development | difference-in-difference (DID) model and panel data |
| Yang et al., 2018 [35] | Beijing China | Economic returns | multi-stage operational process |
| Lin et al., 2019 [36] | China’s case study | Policy and economic inefficacy of industrial parks | multi-attribute decision- making model interview |
| Guo et al., 2018 [37] | greenhouse gas (GHG) emissions of 213 Chinese national-level industrial parks | Low carbon industrial park development | investigation and questionnaires;analysis by ArcGIS software |
| Zhang et al., 2020 [38] | Yongcheng Economic Technological Development Zone | Boosting economic and reducing carbon emissions | scenario, Math analysis, IPCC guidelines as the main method |
| Gao et al., 2021 [39] | 11 industrial parks located in Henan Province | CO, PM10, PM2.5, VOCs and NH3emissions from (which industry, and what kind of energy use) and economic ouput | bottom-up emission factor method and material balance method |
| Wang et al., 2019 [40] | Summary on China’s industrial park project | green growth and sustainable development | Review theory |
| Yu et al., 2017 [41] | 20 pilot industrial parks adopted by National Low Carbon Industrial Parks Pilot Programme (LCIPPP) | CO emissions | STIRPAT (Stochastic Impacts by Regression on Population, Affluence and Technology) model |
| Variables | Unit | Min | Max | Mean | SD |
|---|---|---|---|---|---|
| No. Industrial parks | - | 0 | 4 | 0.447 | 0.796 |
| labor force | person | 305,457 | 32,833,549 | 11,738,565 | 10,968,542 |
| Urbanization rate | percent | 42.704 | 90.979 | 74.701 | 13.960 |
| CO | kt | 15,880 | 629,290 | 204993.289 | 183430.365 |
| GDP | US | 15,447,922,938 | 988,642,300,212 | 272,997,718,273 | 232,898,089,116 |
| FDI | US | 2,172,431,730 | 39,455,863,929 | 5,301,513,483 | 6,816,401,775 |
| Population | NO | 664,611 | 98,423,598 | 34,122,892 | 33,672,860 |
| Variables | T-Statistic | Prob | Degree |
|---|---|---|---|
| No. Industrial parks | −5.40679 | 0.0000 | I(0) |
| labor force | −7.11154 | 0.0000 | I(0) |
| Urbanization rate | −1.82847 | 0.0337 | I(0) |
| CO emission | −2.46149 | 0.0069 | |
| FDI | −2.39850 | 0.0082 | I(0) |
| Population | −1.99382 | 0.0231 | I(0) |
| GDP | −0.98403 | 0.1626 | I(1) |
| Equation: EQ01 | |||
| Test cross-section fixed effects | |||
| Effects Test | Statistic | d.f. | Prob |
| Cross-section F | 362.673267 | (7.130) | 0.0000 |
| Variables | Coefficient | Std.Error | t-Statistic | Prob |
|---|---|---|---|---|
| C | − 9.14 | 6.14 | −14.89862 | 0.0000 |
| Co2Kt | 434439.9 | 33209.84 | 13.08166 | 0.0000 |
| FDI | 0.753961 | 0.153564 | 4.909754 | 0.0000 |
| URrate | 3.79 | 1.85 | 2.051503 | 0.0422 |
| Labor | 28072.47 | 1468.923 | 19.11091 | 0.0000 |
| Population | −2892.254 | 680.5519 | −4.249866 | 0.0000 |
| Industrial park | 2.27 | 8.07 | 2.809662 | 0.0057 |
| Weighted Statistics | |||
| R-squared | 0.997091 | Mean dependent var | 11.27881 |
| Adjusted R-squared | 0.996800 | S.D. dependent var | 23.58215 |
| R-squared | 0.997091 | Mean dependent var | 11.27881 |
| S.E. of regression | 0.890959 | Sum squared resid | 0.999807 |
| F-statistic | 3427.734 | Durbin-Watson stat | 103.1950 |
| Prob(F-statistic) | 0.000000 | ||
| Unweighted Statistics | |||
| R-squared | 0.983306 | Mean dependent var | 2.67 |
| Sum squared resid | 1.22 | Durbin-Watson stat | 0.313567 |
| Equation: EQ01 | |||
| Test cross-section random effects | |||
| Test Summary | Chi-Sq Statistic | Chi-Sq.d.f. | Prob |
| Cross-section random | 313.897100 | 6 | 0.0000 |
| Ranks | Countries | Average Value of GDP at Constant Price (Intercept) |
|---|---|---|
| 1 | Saudi Arabia | 172,000,000,000 |
| 2 | UAE | 146,000,000,000 |
| 3 | Oman | 59,700,000,000 |
| 4 | Bahrain | 55,500,000,000 |
| 5 | Jordan | 47,300,000,000 |
| 6 | Turkey | 42,500,000,000 |
| 7 | Egypt | − 245,000,000,000 |
| 8 | Iran | −277,000,000,000 |
Publisher’s Note: MDPI stays neutral with regard to jurisdictional claims in published maps and institutional affiliations. |
© 2022 by the authors. Licensee MDPI, Basel, Switzerland. This article is an open access article distributed under the terms and conditions of the Creative Commons Attribution (CC BY) license (https://creativecommons.org/licenses/by/4.0/).
Share and Cite
Falahatdoost, S.; Wang, X. Industrial Park Role as a Catalyst for Regional Development: Zooming on Middle East Countries. Land 2022, 11, 1357. https://doi.org/10.3390/land11081357
Falahatdoost S, Wang X. Industrial Park Role as a Catalyst for Regional Development: Zooming on Middle East Countries. Land. 2022; 11(8):1357. https://doi.org/10.3390/land11081357
Chicago/Turabian StyleFalahatdoost, Soniya, and Xingping Wang. 2022. "Industrial Park Role as a Catalyst for Regional Development: Zooming on Middle East Countries" Land 11, no. 8: 1357. https://doi.org/10.3390/land11081357