Article

Research on the Equity of Urban Green Park Space Layout Based on Ga2SFCA Optimization Method—Taking the Core Area of Beijing as an Example

1
The Bartlett School of Architecture, University College London, London WC1H 0QB, UK
2
Department of Architecture, Hubei University of Arts And Science, Xiangyang 441053, China
3
College of Horticulture, Nanjing Agricultural University, Nanjing 210095, China
*
Author to whom correspondence should be addressed.
Land 2022, 11(8), 1323; https://doi.org/10.3390/land11081323
Submission received: 28 July 2022 / Revised: 14 August 2022 / Accepted: 15 August 2022 / Published: 16 August 2022
(This article belongs to the Special Issue Big Data Analytics, Spatial Optimization for Land Use Planning)

Abstract

:
(1) Background: The issue of equity in the layout of urban green park spaces is an essential dimension of urban public resource allocation. (2) Objective: To analyze the equity of the distribution of parkland in the core area of Beijing from a quantitative and spatial perspective. By measuring both vehicular and pedestrian transport modes, the study identifies areas with low levels of green space provision and provides strategies for optimization. It is hoped that this study can provide a basis for future green space construction in the core area of Beijing. (3) Methods: In this paper, the Gauss Two-step Floating Catchment Area Method (Ga2SFCA) is used to study the green park space layout in the core area of Beijing. The two modes of 30min-walk and 10min-car-journey were used to measure the fair values of the residential unit scale, the street district scale, and the overall scale, respectively. (4) Results: The study results show that the fair values based on the 30-min walk and the 10-min car journey differ significantly. For the 30-min walk-based travel mode, the proportion of fair (Class IV) and fairer (Class V) areas is approximately 20%, while for the 10 min car-based travel mode, the corresponding class is over 90%. (5) Conclusions: The overall equity of urban parkland in Beijing core area is better for car-based travel modes, while for walking modes, the supply is still insufficient, and the distribution of parkland is polarized.

1. Introduction

1.1. Research Background

In the 19th National Congress Report, the principal contradiction of China is defined as the contradiction between the people’s growing need for a better life and unbalanced and insufficient development [1]. The “unbalanced” development is a symptom of the problem of equity [2]. Taking urban parks as an example, along with the urbanization process in China, there is an increasing demand for urban parks and green spaces. In order to enjoy the beauty of nature in the parks efficiently and quickly, people hope to reach them efficiently and quickly. As essential public resources, urban parks and green spaces serve ecological and social functions.
The traditional method of evaluating urban parks in China in terms of greening rate and parkland area per capita only considers the quantitative dimension, ignoring the actual spatial distance and time costs [3,4,5]. The time it takes for residents to reach the same park can vary considerably from area to area. Underlying this discrepancy is a mismatch between the supply and demand for parkland [6]. In some areas, there may be an oversupply of parkland. Conversely, there may be cases where the supply exceeds the demand [7].
In the face of limited green space resources, rational allocation and equitable layout should focus on current planning and assessment [8]. In cities, it is essential to allocate public resources in a fair manner when it comes to urban parks and green spaces.

1.2. Research Progress on the Equity of Urban Green Space

At present, the equity of the layout of urban parkland relies mostly on accessibility calculations [9,10,11]. The basic concept of accessibility was first introduced by Walter Hansen in 1959 and was defined as “the chance of interaction between nodes in a single system network” [12]. Since then, accessibility has been widely used in studying the layout of various urban public facilities [13]. The focus of scholars has also slowly shifted from parity in the quantitative dimension to a balanced distribution in the spatial dimension [14]. In China, the concept related to the accessibility of parkland was introduced in 1999 by Kongjian Yu [15]. This was expanded and supplemented by Yujun Yang [16] and Zhengna Song [17]. The definition of accessibility commonly adopted refers to “the ease of reaching any point in space from a place overcoming costs (including time, distance, cost)” [18].
In contrast to accessibility, spatial equity is not clearly defined, but its main emphasis is on different regions and social groups’ ability to have equal access to public service facilities [19]. In other words, equity is a supply-side and demand-side perspective that emphasizes the differences in access to public service facilities for different social groups or regions [20,21] and can be seen as a deepening of the concept of accessibility [22].
Research on the equity of green space layout can be broadly divided into green space-based research and user-based research [23]. Green space-based studies focus on analyzing the supply capacity or service capacity of different types of green space, such as urban park space [24]. On the other hand, user-based studies focus on the equity of different groups of people in terms of their ability to access green spaces [25]. This paper focuses on urban green park space as the main subject of the study, which belongs to the former category.
Research on green space equity varies between developed and developing countries at the national level. In developed countries, the understanding of green space equity is no longer limited to one-dimensional data analysis. A study by Henry, Dennis, and Jens identified environmental inequalities in urban green space provision at the household and individual level in major German cities [26]. Using multiple dimensions of social equity, Anthony compared the social attributes of the green space types [27]. Ann and Torsten proposed that the availability of accessible and attractive green spaces is an important component of urban quality of life measures and suggested the feasibility of measuring this using the 2SFCA approach [28]. As presented in Alexis, Chris, and Edmund’s study [29], access for different religious and ethnic groups is compared to some of the criteria set forth in the UK Green Space Guidelines. In conclusion, in developed countries, research related to green space equity has moved beyond quantitative and spatial equity and into the social equity dimension [26,27,28,29].
Compared to developed countries, research on green space equity has been relatively slow in developing countries. In recent years, however, many experts and scholars have begun to pay attention to the inequitable distribution of green space in urban development in developing countries and have learned from advanced evaluation models used in developed countries [30,31,32]. Based on a travel behavior model, Carolina et al. examined accessibility differences in urban green spaces by location, age, gender, and income in two medium-sized cities in Chile [30]. Macedo and Haddad combined census data with park provision studies to evaluate the distribution of urban parks in Brazil [31]. Heather et al. conducted interviews to examine the preferences, perceptions, and barriers to access to urban green spaces among different income groups [32].

1.3. Urban Green Space Layout Research Method

Both qualitative and quantitative studies are included in the evaluation method of equity of urban green space. Qualitative research mainly consists of description and field research [33], which described the values of different populations for green space accessibility by means of a list so as to judge the differences [34]. According to Barrera, research subjects were categorized into three classes and, based on this classification, three representative areas were selected for a descriptive analysis of their accessibility [35]. After describing different green spaces, Rosa and Daniele argued that green spaces that serve a greater number of people are more equitable [36]. These qualitative description-based approaches have enriched the content of green space equity studies. Due to their subjective nature and the fact that most of them do not yield quantitative indicators, they are currently used more as supplements and supporting evidence for quantitative studies [37,38,39].
Quantitative research methods mainly include Buffer Zone Analysis, Minimum Proximity Method, Gravitational Model Method, Network Analysis Method, and Two-step Floating Catchment Area Method (2SFCA) [40]. Scholars such as Xiaodan Ge, Haiwei Yin, and Zhe Sun have provided a detailed overview of the advantages and disadvantages of these methods [41,42]. The Buffer Zone Analysis is simple to calculate but ignores the suppression of the spatial road network [43]. The Minimum Proximity Method uses Euclidean straight-line distance as a measure, ignoring the real travel intentions of users [44]. The Gravitational Model Method provides a comprehensive means for modeling and calculating parkland area, service quality, and distance [45], but the indicators chosen are not uniform, making cross-sectional comparisons difficult [46]. The Network Analysis Method can produce accurate results, but it highly relies on a data-complete transportation system network and is complex to calculate in practice [47]. There is a wide use of the Two-Step Floating Catchment Area Method and its optimization approach today [48,49,50,51]. Originally proposed by Radke [51], it has been refined by Luo and other scholars into a more mature model of equity measurement [52].
Overall, each of the current research methods has its own applicable research conditions. There may be differences in the models chosen by different scholars as well as in the computational methods they employ. The majority of them, however, rely on GIS for the calculation of the accessibility of green park spaces [53,54,55]. Using the results obtained, social attributes such as population and income are then overlaid to obtain the spatial layout equity evaluation results [56]. Among them, the Two-step Floating Catchment Area Method (2SFCA) and its optimization method are widely used in the field of equity evaluation due to their wide applicability and high accuracy [55,57,58]. In addition to incorporating social attributes into accessibility studies, it considers the interaction between users and green spaces [57,58]. Thus, the results of the study are optimized by introducing a function that simulates the actual distance. As a result, the method is of relatively high value in evaluating the spatial accessibility of public service facilities [59].

1.4. Article Innovations

In the core area of Beijing, the Gauss Two-step Floating Catchment Area Method (Ga2SFCA) was used to measure the equity of urban green park space layout. Ga2SFCA has also been optimized in terms of the minimum study unit, statistical methods, and measurement indicators. In addition to the spatial distance and time costs, the supply-demand relationship was analyzed in order to determine the degree of matching between park green spaces and urban residents. As a result, it is able to compensate for the shortcomings of existing studies, which are primarily qualitative rather than quantitative in nature.

2. Materials and Methods
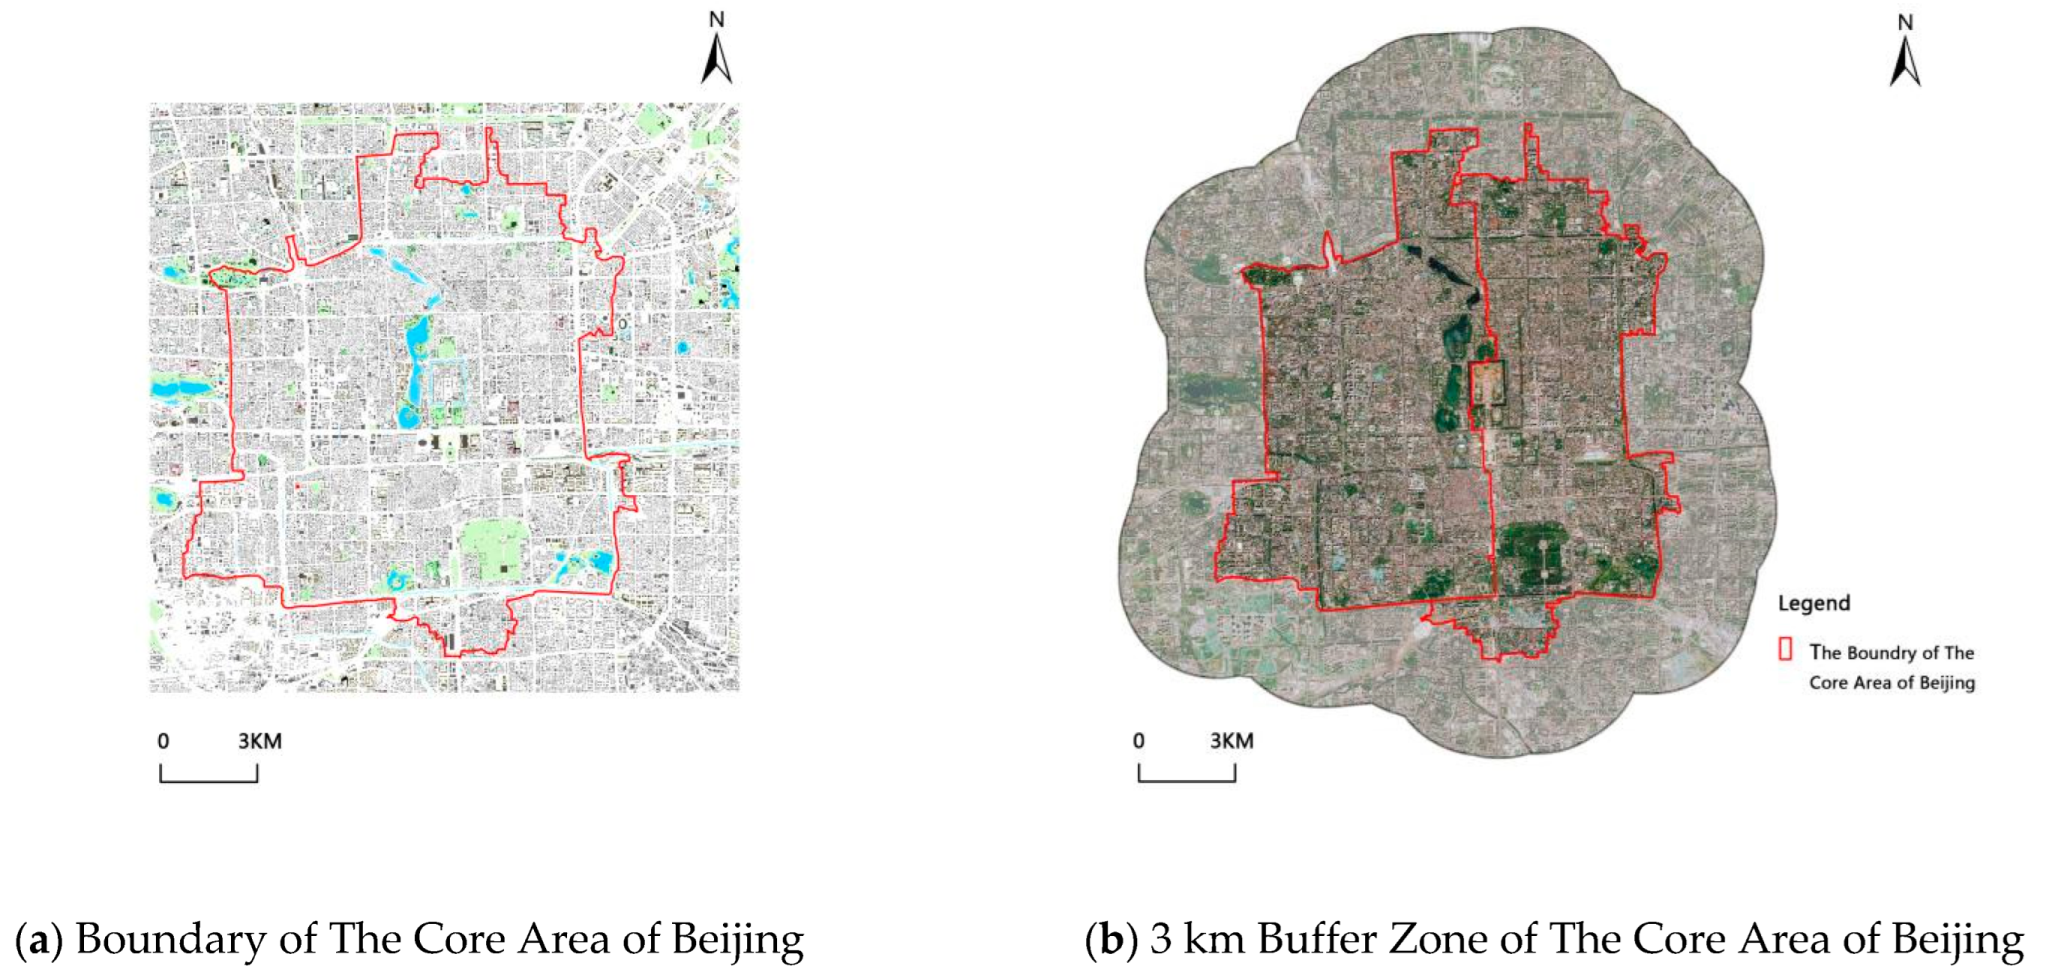
2.1. Research Area

The core area of Beijing, including the two administrative districts, the East District and the West District, has a total area of 92.5 km2 [60]. In September 2017, the Beijing Urban Master Plan (2016–2035) proposed to build an urban spatial structure of “one core, one main and one vice, two axes, multiple points and one district”, in which the “one core” refers to the core area of Beijing [61].
Based on preliminary calculations, the total amount of green park space in the core area of Beijing is 1138.1 hectares [62]. In addition, the public green space area per capita in the core area of Beijing is 6.37 m2; the service radius coverage of green park space is 86.6%, and the greening coverage rate is 31.95% [63,64]. The Figure 1 illustrates the boundaries of the Core Area of Beijing.

2.2. Data Processing

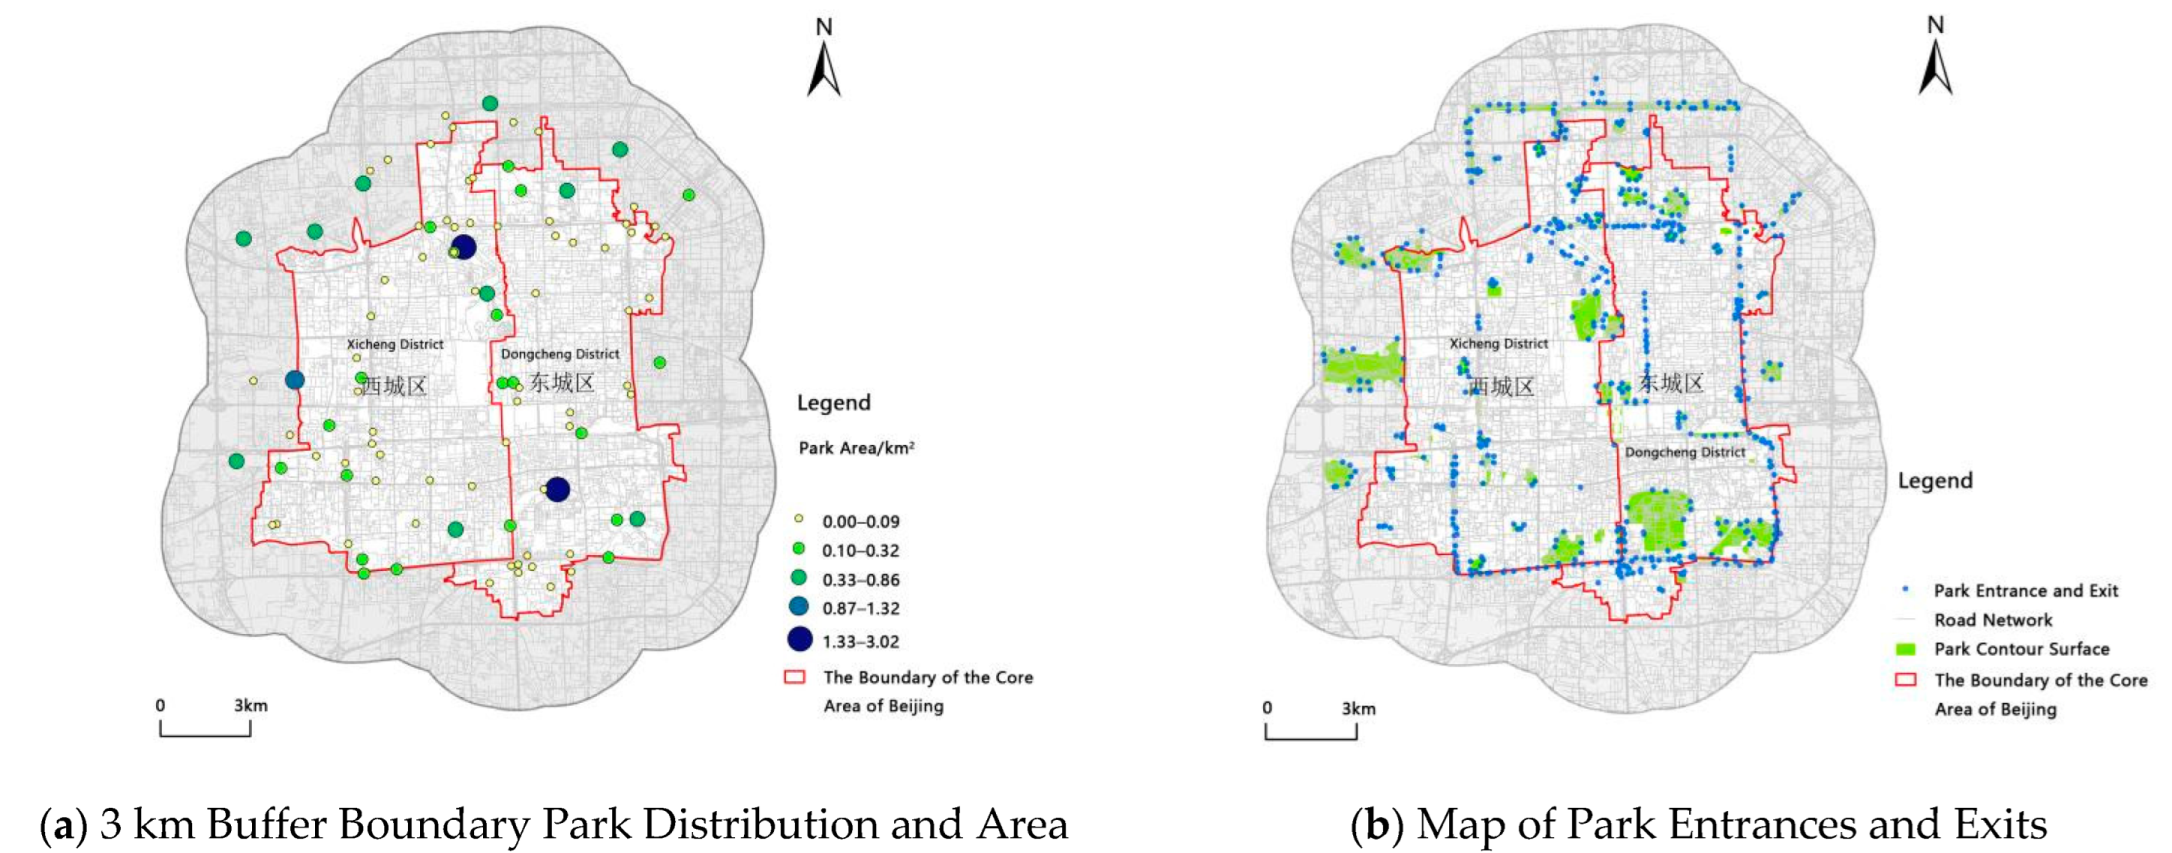
2.2.1. Green Park Space

Referring to the classification standards for green park space in GBT 51346-2019 Urban Green Space Planning Standards, the green park space in the core area of Beijing is divided into two major categories: Category I, which includes comprehensive parks (area of 10 hm2 or more) and community parks (area of 1–10 hm2) and Category II, which includes street gardens (area of 0.2–1 hm2) and micro public green areas (0.04–0.2 hm2) [65,66].
According to the data of Beijing Landscape Bureau in 2021, there are 79 registered parks and green areas in the Core Area of Beijing [67]. Among them, 51 are Category I and 28 are Category II, as Shown in Table 1. Considering the special nature of Category II itself, there is a larger number of green spaces that have not yet been registered due to their small size. Based on this, Baidu Map remote sensing images were used. In order to calibrate the Category II green park areas and their vector boundaries, GIS image correction, manual visual translation, and image definition functions were combined.
On this basis, the scope of the statistical study considered only objective administrative divisions but did not take into account edge effects. Residents who are at the administrative boundary are free to choose to visit the parks near the boundary [68]. Therefore, a buffer zone was established with a radius of 3 km [69] and the parks covered were counted and increased.
The reason for selecting a search radius of 3 km is that 3 km can cover the majority of parks within the boundaries [70]. Furthermore, the distance of 3 km is suitable for both pedestrian and vehicular traffic [71]. By choosing a radius that is too large, the calculation will be skewed by covering too many parks in other areas. In contrast, choosing too small a radius will not cover parks located near the boundary range [72].
The resulting green space boundaries and green space names were compared and calibrated with the existing park green spaces in the Detailed Control Plan for the Core Area of Beijing (District Level) (2018–2035) [62], resulting in the final green park space boundaries and extent in the research area.
Rather than using real park entrances and exits, many studies have adopted the geometric center of the park for selecting park entrances and exits [73]. The distance from the center of mass of the park to the real entrance/exit of the park boundary will influence the accessibility calculation [74]. Therefore, the real entrances and exits of Category I parklands are used in this study. The coordinates of the entrances and exits were picked up by the Baidu Coordinate Picker, and the results were checked using Street Maps. For Category II parkland, due to its smaller area and better accessibility, the entrance/exit is replaced by the center of mass. The face to point command in GIS was used, and the park was linked to the entrances and exits. Figure 2 shows the distribution of the park and its entrances and exits.

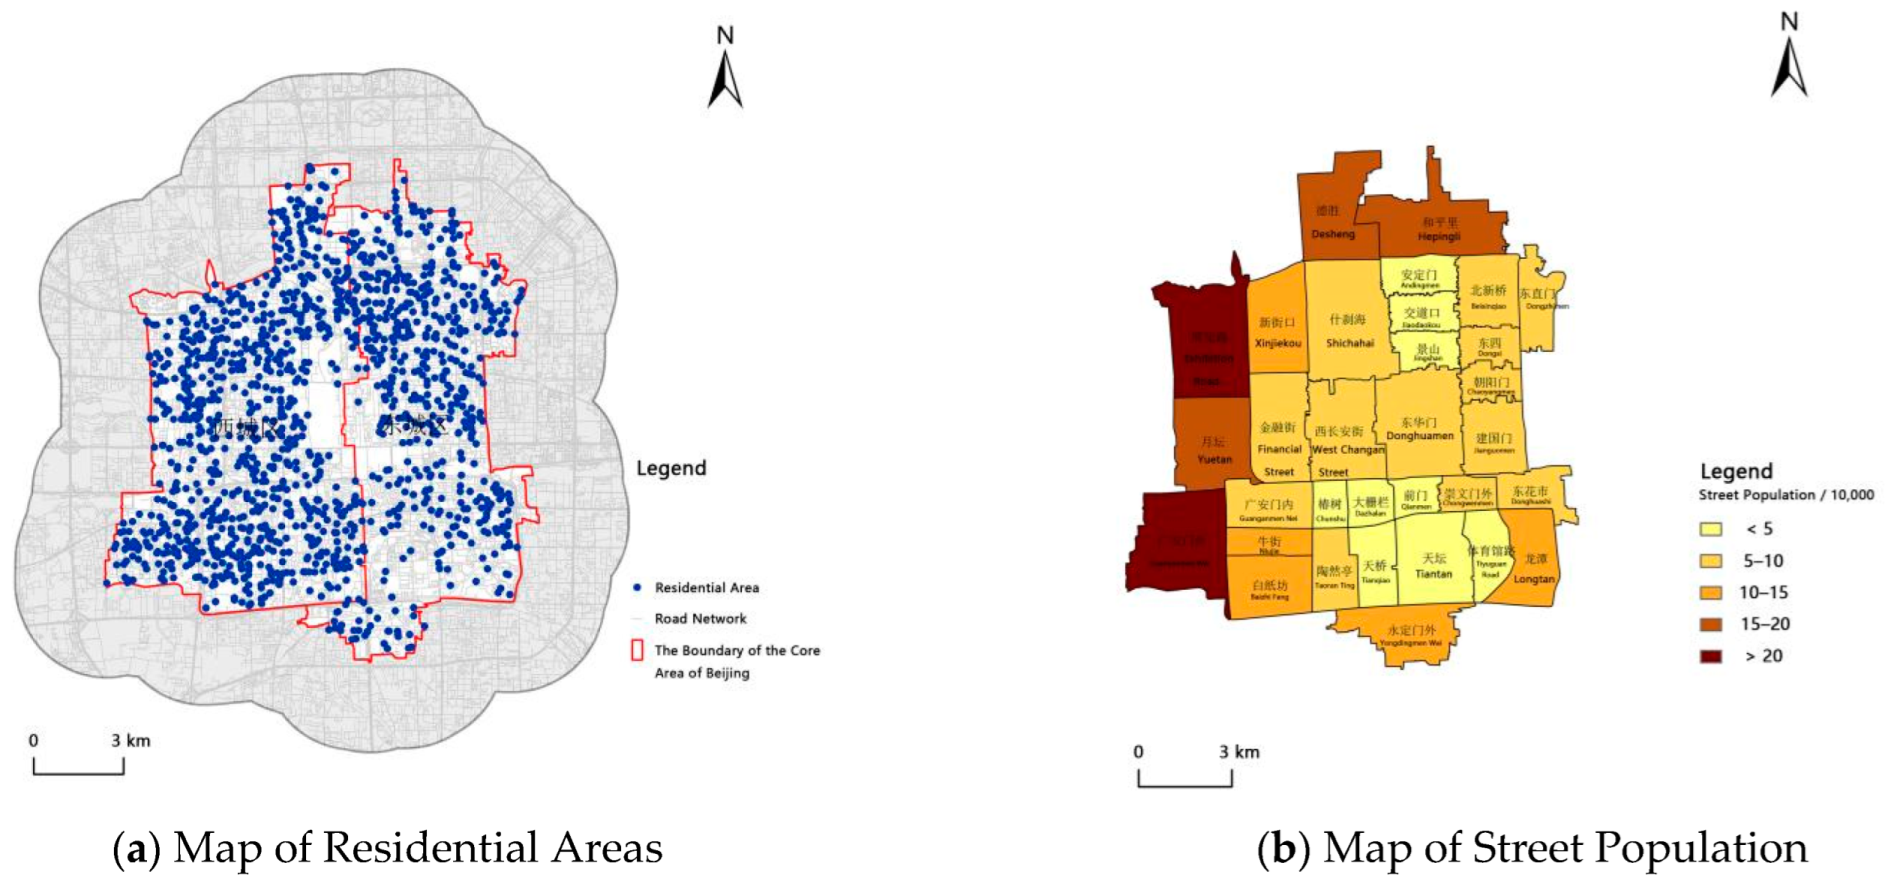
2.2.2. Population Data and Settlement Data

Population data statistics are directly related to the granularity of the study and have a greater impact on the evaluation results. This study takes residential units as the research object and uses Python to crawl the point information of the districts located in the core area of Beijing in Housing World and Anjuke. Data fields such as cell name, price, address, latitude and longitude, floor area, and the number of households and buildings were also obtained. As of April 2022, a total of 1577 residential district point data were obtained after screening.
In most existing studies, population data were calculated using GIS raster data or using the residential area data [76,77]. The two research methods, which both calculate population numbers using a faceted distribution, assume a uniform distribution of the population within a faceted area, disregarding the objective existence of variability. As a result of this, the study proposes optimization measures based on the matching of residential area point information with population data.
According to the seventh census data in China, the average number of persons per household in Beijing is 2.31 [78]. The crawled residential area household information field is multiplied by 2.31 and rounded to obtain the residential area population count information, which is linked to the residential area latitude and longitude of the residential area. Consequently, the resulting statistics produce data about the population that are more accurate and have a smaller granularity. Figure 3 illustrates the distribution of residential units and the size of the population.

2.2.3. Road Network Data

As the bearer of people’s trips, the accuracy of road traffic network data can have a significant impact on the results of evaluations. Different levels of roads and different modes of transportation will influence commute times in real life.
The road traffic network data in the study area were obtained through OSM Maps and the Baidu Maps API Port. The roads were also divided into five categories: highways, urban trunk roads, urban secondary roads, urban feeder roads, and other roads [79]. Passing speeds were assigned according to different travel modes [80].The speeds for each type of road are shown in Table 2. GIS tools were also used to simulate the resistance for areas such as road corners and intersections. Ultimately, a judgement matrix was created with the aid of the OD costing tool in GIS, and a complementary topological analysis was carried out. In this way, the travel time of users based on different modes of transportation could be determined.

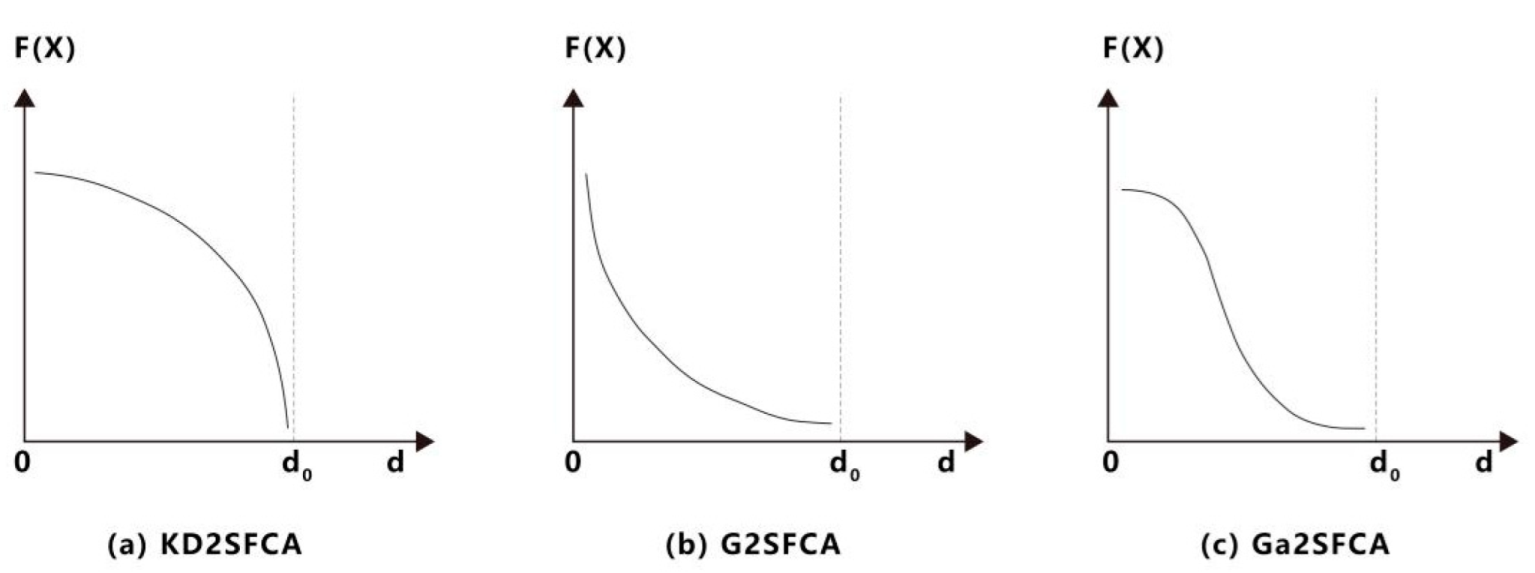
2.3. Gauss Two-Step Floating Catchment Area Method (Ga2SFCA)

The Gauss Two-step Floating Catchment Area Method (Ga2SFCA) is an optimization method for the Two-step Floating Catchment Area Method (2SFCA) and was proposed by Dai D. and Wang F. in 2010 [82], since the traditional Two-step Floating Catchment Area Method does not take into account the fact that accessibility tends to decay with the cost of travel [56]. Based on this, the researchers introduced different decay functions to simulate the tendency of green spaces to become less attractive to users as spatial distance increases [39,51]. As a result of a comparative analysis of the attenuation curves of different functions, the Gauss Two-step Floating Catchment Area Method was selected for its relative slow attenuation curve as it approaches the search domain, which is more representative of the actual travel conditions of residents [83]. Consequently, the Gauss Two-Step Floating Catchment Area Method is used in this study as an evaluation method. Besides, The Ga2SFCA has a relatively smooth curve, as shown in Figure 4.

2.4. Calculation Process

In the first step, the ratio of supply to demand for urban parkland in the study area is calculated. This step takes the urban green park space as the starting point to search for the distribution of residential areas at different radius distances. A Gaussian function is introduced, and weights are assigned to simulate the change in distance decay. Finally, a summation is made, and the ratio of supply to demand for parkland is calculated.
R j = S j i { d i j d 0 } k D i × G ( d i j )
Rj is the ratio of supply to demand of green park space; j represents the supply point, i.e., urban green park space; i represents the demand point, i.e., residential district. k denotes the number of residential districts (pcs) within the search radius. Sj denotes the supply capacity of green park space, i.e., the area of urban green park space (m2). Di is the size of the residential area, expressed in terms of the number of residential areas (pcs). dij denotes the distance between supply point j and demand point i. The distance is represented by the commuting time (min) of different modes of transport. d0 denotes the search radius. In the formula, G(dij) represents the Gaussian function, which is calculated as
G ( d i j , d 0 ) = { e ( 1 2 ) × ( d i j d 0 ) 2 e ( 1 2 ) 1 e ( 1 2 ) , d i j d 0 0 , d i j > d 0
From Equations (1) and (2), the ratio of supply to demand for parkland Rj (m2/person) can be derived.
In the second step, the accessibility values for residential areas are calculated. This calculation then takes the residential area as the starting point and searches for the distribution of parks at different radius distances, and superimposes a Gaussian function.
A i = i { d i j d 0 } m R j × G ( d i j , d 0 )
In the formula, m denotes the number of parks searched; Rj denotes the ratio of parkland supply to demand obtained in the first step (m2/person); Ai denotes the accessibility value for each residential area (m2/person).
The third step is to calculate the equity value enjoyed by the residential area.
E i = max ( R j ) max ( A i ) × A i
Ei is the equity value of each residential plot. Ei > 1 means that supply is greater than demand; Ei ≤ 1 means that supply and demand are in relative balance or supply is less than demand [85].
As a measure of equitability, previous studies have used the values of walking and driving as the two modes of transportation. The walking time is set at 30 min, and the car travel time is set at 10 min [86,87,88]. According to the calculated Ei value, supply level was classified into six levels from I–VI, namely: Class I No Supply Service, Class II Lack of Supply, Class III Insufficient Supply, Class IV Balanced Supply, Class V Sufficient Supply, and Class VI Saturated Supply.
The proportion of the four equity levels of Seriously Inequitable (Class II and Class VI), Relatively Inequitable (Class III), Relatively Equitable (Class V), and Equitable (Class IV) in different study units are also counted. The specific classification criteria are shown in Table 3.

3. Results

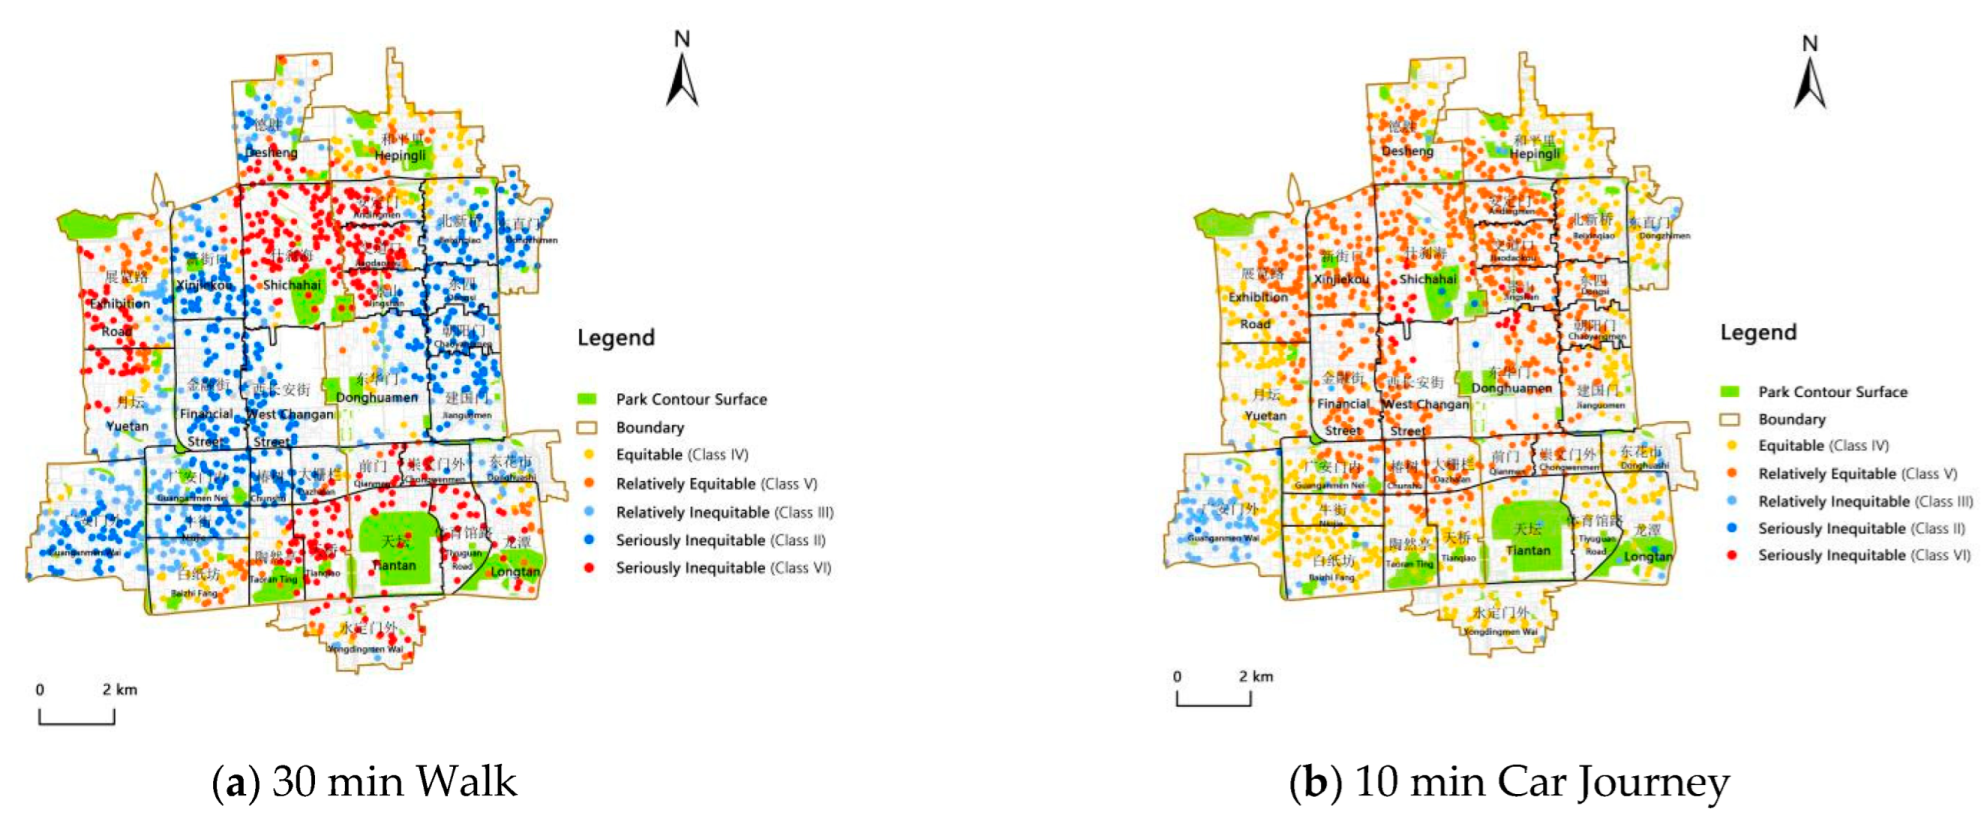
3.1. Results of the Equity of the Residential Unit Scale

Following the above calculation method, the Ei value can be calculated for both the 30 min walking and the 10 min car journey modes of travel. Different classes of supply will be assigned based on the Ei value. The equity level will be determined based on the different levels of supply.
As shown in Figure 5, as well as in Table 4 and Table 5, the equity of urban parkland based on walking and driving varies considerably for the residential units studied. However, the percentage of residential units No Supply Service (Class I) tends to be 0.0% for either mode of transport. This indicates that urban parks in the core area of Beijing have basically achieved full coverage for the residential unit level.
When using a 30-min walk as a calculation indicator, there are 334 Equitable (Class IV) and Relative Equitable (Class V) residential units, accounting for 21.17%, Relative Inequitable (Class III) residential units account for 20.04%, and Seriously Inequitable (Class II and Class VI) account for 58.40%.
The results using a 10-min car journey radius of d0 show that there are 1434 Equitable (Class IV) and Relative Equitable (Class V) residential units, accounting for 90.93%, 6.59% are Relative Inequitable (Class III), and 2.47% are Seriously Inequitable (Class II and Class VI).

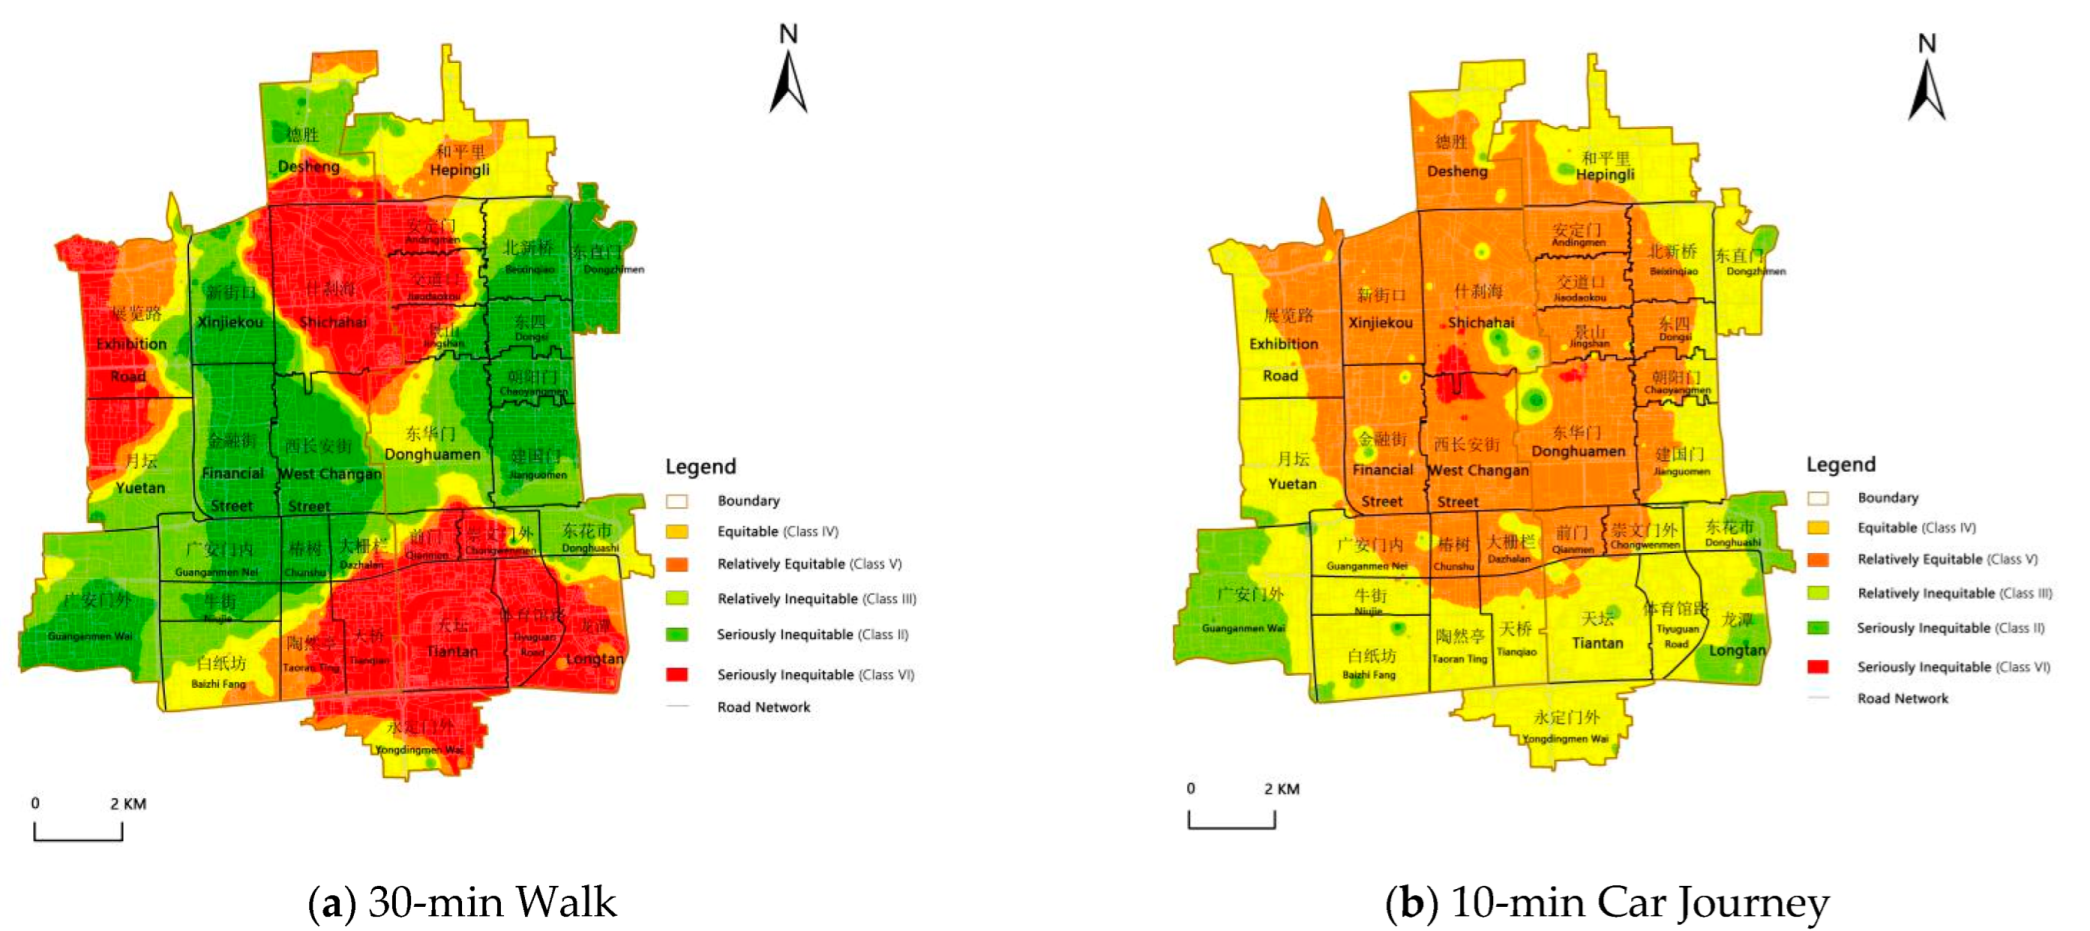
3.2. Results of the Overall Equity Calculation

Based on the core area of Beijing as a whole, the equity of the urban green park space layout is calculated, as shown in Figure 6. In Table 6, the number of particles and the proportion of Class I in the core area of Beijing are both 0, which indicates that no urban parks serve the area. The results are consistent with the calculation of the scale of residential units.
As shown in Table 7, based on the travel mode of walking for 30 min, the percentage of Equitable (Class IV) and Relatively Equitable (Class V) area is 22.34%, the percentage of Relatively Inequitable (Class III) areas is 20.81%, and the percentage of Seriously Inequitable (Class II and Class VI) is 56.85%, while the calculation result of the 10-min car journey, the percentage of Equitable (Class IV) and Relatively Equitable (Class V) area is 91.26%, the percentage of Relatively Inequitable (Class III) area is 7.85%, and the percentage of Seriously Inequitable (Class II and Class VI) is 0.89%.

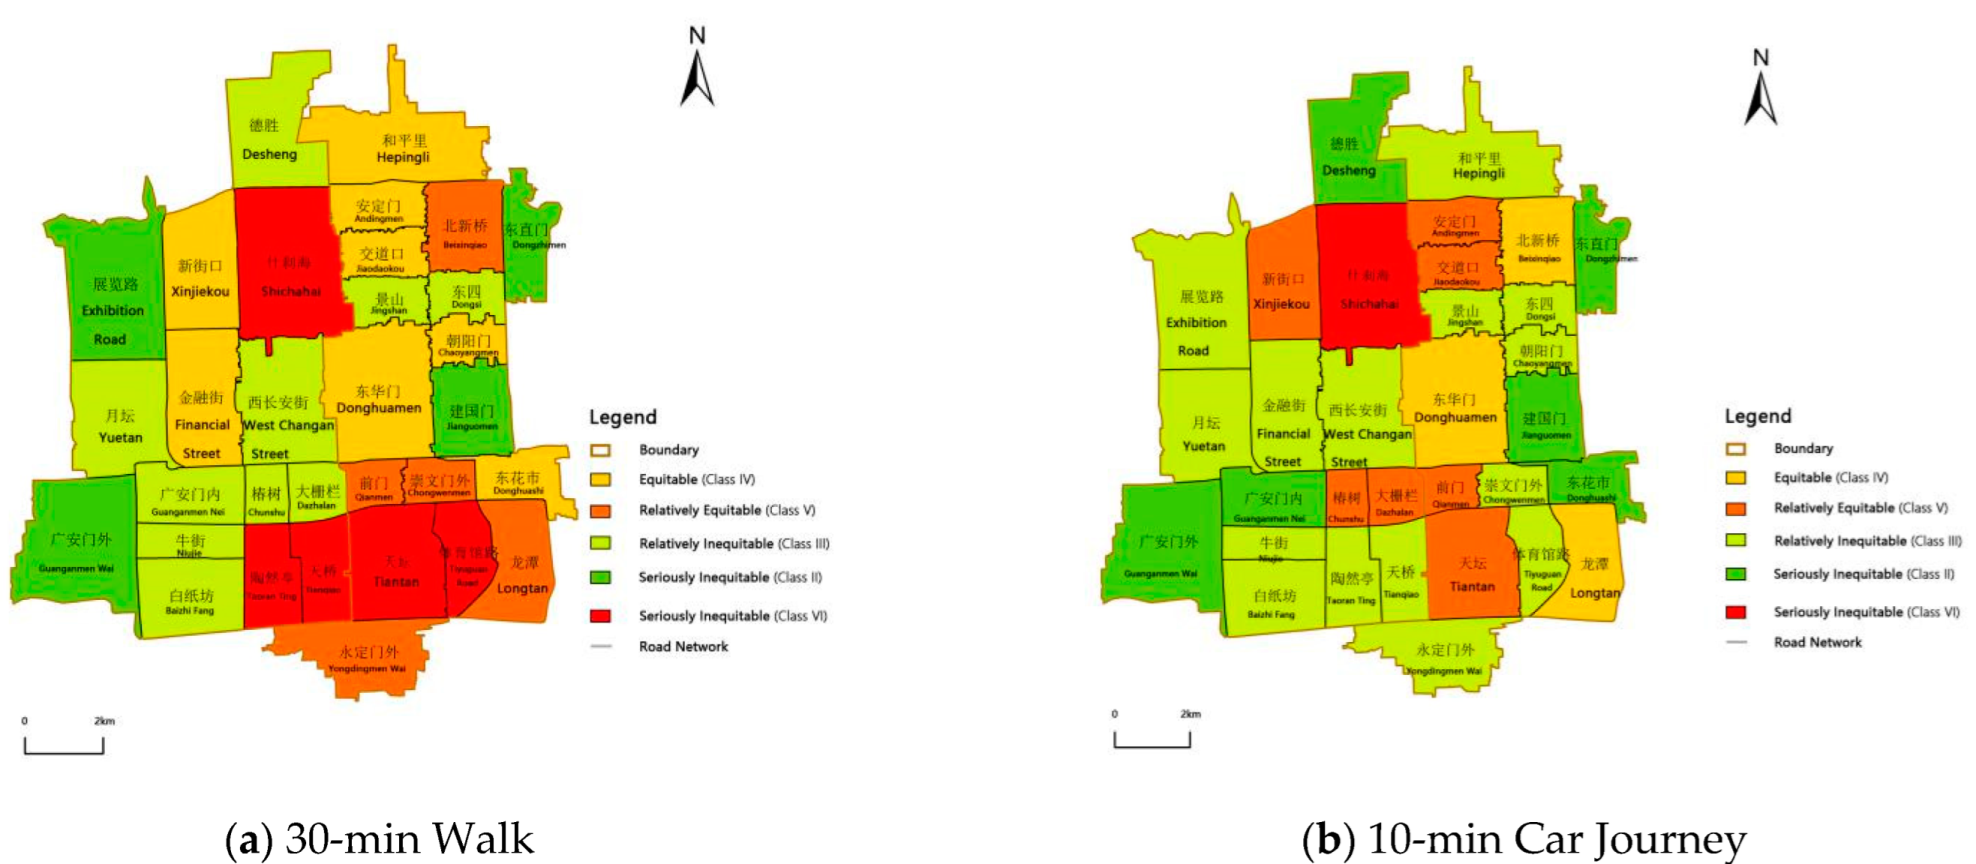
3.3. Overall Evaluation of the Equity of Urban Parkland

According to the 10-min car journey travel mode, the proportion of areas with Equitable (Class IV) and Relatively Equitable (Class V) area in the core area of Beijing is over 90%, indicating that the vast majority of areas have a good capacity for the use of urban green park space.
As shown in Figure 5b and Figure 6b, the urban green park space supply in the Shichahai District, the Xichangan District, the Dongzhimen District, and their nearby districts fall into Class V, i.e., adequate supply.
Within the Guanganmen Wai District, the Longtan District, the Donghuashi District, and the Dongzhimen District, there are relatively large areas of Class II, i.e., a certain amount of additional parkland is needed. However, on the whole, a 10-min car journey covers the entire core area of Beijing, i.e., the proportion of Class I areas is 0.
On the other hand, the calculation result of walking 30 min has obvious aggregation. As shown in Figure 5a and Figure 6a, there is a larger area near the Shichahai District, the Tiantan District, and the Exhibition Road District that falls into Class VI. Furthermore, there are a great deal of Class II and Class III areas in Guanganmen Wai District, Guanganmen Nei District, Niujie District, Chunshu District, Financial Street District, Xinjiekou District, West Changan Street District, Donghuamen District, Donghuashi District, Jianguomen District, Chaoyangmen District, Dongsi District, Beixinqiao District and Dongzhimen District, which shows that there is an insufficient supply of urban green park space resources. Additional parkland in these areas needs to be prioritized.
In general, the layout of urban green park space in the core area of Beijing is more conducive to car travel than walking. The results are much higher than those calculated by experts in related fields for the equity of urban parkland in other cities, such as Shanghai [89] and Wuhan [90]. In contrast, for the walking mode, the overall supply of urban parkland remains insufficient, and the parkland distribution is polarized.

4. Discussion

4.1. Analysis of Calculation Results

The fair value of a property determined by a 30-min walk in the core area of Beijing differs significantly from that calculated by a 10-min car trip. This result can be attributed to a number of factors.
First, in the early planning of urban parks in the core area of Beijing, the layout of urban parks was based mainly on the accessibility of the road network for motorized traffic. As a result, the accessibility of urban parks was relative higher in the results based on vehicular traffic than walking [91]. For accessibility, as an essential indicator of equity measurement, higher calculation results in higher equity values.
Second, the car travel rate is much greater than walking, and the car travel method covers a larger area. When using the Gauss Two-step Floating Catchment Area Method (Ga2SFCA) for calculations, this means that the search domain and search radius are larger. As a result, there is a greater number of parks that can be reached by a residential area, and the fair value of the calculation is higher.
Third, due to the special nature of the core area of Beijing, some parks are concentrated in the area, such as Beihai Park, Tiantan Park, etc. There is an overflow of urban park resources in some areas due to the large number of historical sites and the concentrated distribution of parks [92]. Due to its faster rate, the car-based travel mode has a weakening effect on agglomeration. Consequently, the calculated overall degree of polarization is lower than the results obtained from walking mode, and the park will be relatively more equitable.

4.2. Optimization Strategies

In the core area of Beijing, the layout of urban parks is measured and analyzed to reveal three main shapes: face-shaped, belt-shaped, and patch-shaped [93]. Table 8 shows the information for these 3 kinds of parks.
Face-shaped parks mainly include municipal parks such as Tiantan Park, Taoranting Park, and Beihai Park, as well as large historical and cultural parks. Since these parks cover a large area and have a large coverage, they have a significant impact on the equity of the surrounding districts and residential units, resulting in a saturation of green space supply in some areas. The majority of these parks have a relatively long history, having been built during the early stages of the planning and construction of the core area of Beijing.
Belt parks mainly include the Second Ring Urban Greenway, the North Second Ring Urban Park, and the Lotus River Urban Recreation Park. The majority of these parks were constructed within the past 20 years along the banks of rivers or along the sides of roads [94]. Upon superimposing the contours of the parks and the equity distribution of residential units, it can be noted that the width of these parks is not large. For example, the Second Ring Urban Greenway has an average width of 40 m. However, they have a significant impact on the equity value of residential properties in the vicinity of their distribution centers. These parks have narrower boundaries and more entrances and exits than face-shaped parks, and they are better suited to serve residents in the surrounding area.
The patch-shaped parks are mainly composed of Class II parks, including district parks, community parks, and pocket parks, which mostly have a history of 5 to 10 years [95]. In general, patch-shaped parks have a lower impact on equity in the core area of Beijing than parks with facades or belts. It does, however, contribute to the promotion of equity of provision at the level of residential areas and districts.
As a result of the above findings, many districts lack adequate parkland provision. To improve parkland services, it is difficult to construct additional large parks or face-shaped parks on top of existing ones. It is therefore most effective to prioritize the provision of parkland in districts where there is a shortage or undersupply of parkland. There is great potential for patch-shaped parks in the future.
At a local level, the patch-shaped parks will provide parkland resources for residential units. They can be linked by green corridors and green belts to form belt parks, thereby improving the equity of the district and promoting the equity of the core area of Beijing as a whole.
In addition, the number of faceted park entrances and exits should be increased. In the course of the study, it was found that some large parks have a limited number of entrances and exits. This results in excessive distances between them, which are not conducive to public access. Consequently, if park boundaries can be efficiently optimized by adding additional entrances, large parks will become more accessible. In addition, the distribution of park resources will be more equitable.
To some extent, the establishment of green walkways and urban slow-walking systems will also contribute to the improvement of the equity of urban parks and green spaces. The core area of Beijing has a high density of primary and secondary roads. There are, however, a limited number of pedestrian walkways in some areas, which makes it difficult for residents to reach the parks on foot. The establishment of an urban slow-walking system can improve the accessibility of parkland and make it easier for residents to reach the parks. Moreover, it can enhance the integrity and coherence of urban parks.

5. Conclusions

5.1. District Level Equity Differences

As a result of the equity calculations for parkland in the core area of Beijing, district-level equity degree can be obtained.
As shown in Figure 7, most of the districts have similar fairness results based on both the 30-min walk and the 10-min car journey modes of travel. There are, however, some districts where the results differ significantly between the two modes of transportation, including Chongwenmen District, Yongdingmen Wai District, Donghuashi District, Tianqiao District, Taoran Ting District, Tiyuguan Road District, Hepingli District, and Financial Street District.
According to Table 9, further comparisons reveal that neighborhoods with significant differences are clustered around two blocks. The six districts of Chongwenmen District, Yongdingmen Wai District, Donghuashi District, Tianqiao District, Taoran Ting District, and Tiyuguan Road District are mainly concentrated near the Tiantan District. The two districts of Hepingli District and Financial Street District are mainly concentrated around the Shichahai District.
In these districts, comparing the Ei values shows that the results of the 30-min walk-based calculation are generally greater than those of the 10-min car journey calculation. The results of the 30-min walk for the Taoran Ting District, Tianqiao District, and Tiyuguan Road District, for example, show that these three districts are Seriously Inequitable (Class VI), with a saturated supply of parkland. The results of the 10-min car journey, however, indicate that these three districts are Relatively Inequitable (Class III), with insufficient supplies.
This difference can be attributed to the polarization of the parkland and to the characteristics of the two modes of transportation. Comparing the results of the 30-min walk based on residential units in Figure 5 and Figure 6, it can be seen that there are a large number of residential units in the vicinity of Tiantan Park and Shichahai Park, all of which are Seriously Inequitable (Class VI). As a result of an excess of green space supply, the Seriously Inequitable is not caused by a lack of green space supply, but by an excess of green space supply. Because of the concentrated distribution of these large parks, such as Tiantan Park and Shichahai Park, the local supply level of parkland exceeds the original demand of the residents. This is why the calculation results based on the 30-min walk tend to be Seriously Inequitable.
The polarization of some areas is weakened by the fact that the car journey is faster and the accessibility is higher for walking. Thus, for Chongwenmen District, Yongdingmen Wai District, Donghuashi District, Tianqiao District, Taoran Ting District, Tiyuguan Road District, Hepingli District and Financial Street District, these areas are more informative based on the 10-min car journey than the 30-min walk calculation. For these eight districts, the 10-min car journey results show that they are all in the Relatively Inequitable (Class III) category. In the walk-based calculations, the polarization of the faceted parks and the radiating effect mask the fact that these neighborhoods are still lacking in green space provision.
A further comparison of the park profiles and entrances in Figure 2 reveals that there are very few face-shaped and patch-shaped parks in these eight districts, and that the Second Ring Urban Greenway traverses most of these neighborhoods. This illustrates the importance of belt-shaped parks in enhancing the equity of district-scale parks, as well as the need to increase parkland in these areas. According to the development plan for the core area of Beijing, there is limited land available for construction in these eight districts in the short term. It is therefore most effective to add patch-shaped parks within these areas and to link them into belt-shaped parks in the future.

5.2. Future Park Additions

Combining the results of the 30-min walk and the 10-min car journey, the result of the car journey calculation was used to identify areas that were not served and the result of the walk calculation was used to identify areas with low green space provision. In the core area of Beijing, the areas to be added at the district level were graded in accordance with the polarization of green spaces and the advantages and disadvantages of both walking and driving modes of transportation. Furthermore, suggestions for additions were made based on the level of green space deficiency, as shown in Table 10.

6. Research Outlook

According to the results of the study, the equity level resulting from a 30-min walk and a 10-min car trip differs significantly. Overall, the equity of urban parkland in the core area of Beijing is better for car-based travel modes, but for walking modes, the supply remains insufficient and the distribution of parkland is polarized.
Figure A1 illustrates the framework of this study. The purpose of this study is to provide a quantitative analysis of the equity of the layout of urban parks in the core area of Beijing. Based on previous studies, the data collection and calculation methods were optimized to a certain extent, resulting in more accurate calculations, but also with some limitations. For example, in the statistics of parkland data, some new but unregistered street parks and pocket parks do not have defined boundaries, so they are not included in the statistics. In the way the model is constructed, different functions can also be introduced to compare the results of different measurements. The results obtained from the calculations also only reflect the urban parkland and are not representative of all green spaces.
To calculate accessibility and equity, two typical approaches were chosen, vehicular and pedestrian. In future studies, metro access may also be considered as a basis. Due to the many factors that influence the calculation of the vehicular mode, settings such as stop stations and turning radii can have an impact on the calculation results. In this study, the author made reference to the previous research methods to carry out the normalization process. Afterwards, if the data permit, more detailed research can be conducted on these topics.
Future studies should consider the impact of certain parkland on a local scale, as well as the impact of different park forms and layouts on improving regional equity. The extent to which parkland meets the needs of different age groups (elderly, children, etc.) could also be explored, thereby expanding the depth and breadth of parkland equity research.

Author Contributions

Conceptualization, Y.C. and Y.G.; methodology, Y.C.; software, Y.C.; validation, Y.C. and Y.G.; formal analysis, Y.C.; investigation, Y.G.; resources, M.Z.; data curation, Y.C. and Y.G.; writing—original draft preparation, Y.C., Y.G. and M.Z.; writing—review and editing, Y.C.; visualization, Y.C. and Y.G.; supervision, M.Z.; project administration, M.Z.; funding acquisition, M.Z. All authors have read and agreed to the published version of the manuscript.

Funding

This research was funded by Research on Urban Autochthonous Plants and Potential For Garden Applications, grant number 31870705.

Informed Consent Statement

Informed consent was obtained from all subjects involved in the study.

Data Availability Statement

Registered park information available at https://www.bjxch.gov.cn/xcsj.html (accessed on 15 March 2021); population data information available at http://tjj.beijing.gov.cn/tjsj_31433/pcsj_31452/rkpc/ (accessed on 24 March 2021); residential area information available at https://newhouse.fang.com (accessed on 15 April 2021).

Acknowledgments

Thanks to Zhe Sun for his suggestions on the theoretical aspects of this article. Thanks to Chuan Gong for guidance on the technical aspects of GIS in this article.

Conflicts of Interest

The authors declare no conflict of interest.

Appendix A

Figure A1. Technical framework for the research.
Land 11 01323 g0a1

References

  1. Ji, M. Changes in The Main Contradictions of Chinese Society. Stat. Consult. 2017, 6, 40–42. [Google Scholar] [CrossRef]
  2. Ge, X.; Li, Y. A Review of Urban Green Space Equity Evaluation Studies. Constr. Ind. Press 2018, 8, 258–266. [Google Scholar]
  3. Abel, T.D. Skewed riskscapes and environmental injustice: A case study of metropolitan St. Louis. Environ. Manag. 2008, 42, 232–248. [Google Scholar] [CrossRef] [PubMed]
  4. Christopher, G.; Boone Geoffrey, L.; Buckley, J.; Grove, M.; Sister, C. Parks and people: An environmental justice inquiry in Baltimore, Maryland. Ann. Assoc. Am. Geogr. 2009, 99, 767–787. [Google Scholar]
  5. Ernstson, H. The social production of ecosystem services: A framework for studying environmental justice and ecological complexity in urbanized landscapes. Landsc. Urban Plan. 2013, 109, 7–17. [Google Scholar] [CrossRef]
  6. Ren, J.; Wang, Y. Spatial Accessibility Analysis of Green Park Spaces in Huangpu District, Shanghai Based on An Improved Two-Step Moving search method. Adv. Geosci. 2021, 40, 774–783. [Google Scholar]
  7. Heynen, N.; Perkins, H.A.; Roy, P. The political ecology of uneven urban green space: The impact of political economy on race and ethnicity in producing environmental inequality in Milwaukee. Urban Aff. Rev. 2006, 42, 3–25. [Google Scholar] [CrossRef]
  8. Floyd, M.F.; Johnson, C.Y. Coming to terms with environmental justice in outdoor recreation: A conceptual discussion with research implications. Leis. Sci. 2002, 24, 59–77. [Google Scholar] [CrossRef]
  9. Lakes, T.; Brückner, M.; Krämer, A. Development of an environmental justice index to determine socio-economic disparities of noise pollution and green space in residential areas in Berlin. J. Environ. Plan. Manag. 2014, 57, 538–556. [Google Scholar] [CrossRef]
  10. Landry, S.M.; Chakraborty, J. Street trees and equity: Evaluating the spatial distribution of an urban amenity. Environ. Plan. 2009, 41, 2651–2670. [Google Scholar] [CrossRef]
  11. Mertes, J.D.; Hall, J.R. Park. Recreation, Open Space and Greenway Guidelines; Urban Land Institute: Washington, DC, USA, 1996; Volume 10, pp. 93–131. [Google Scholar]
  12. Hansen, W.G. How accessibility shapes land use. J. Am. Inst. Plan. 1959, 25, 73–76. [Google Scholar] [CrossRef]
  13. Li, P.; Lu, Y. A Review And Outlook of Accessibility Studies. Adv. Geosci. 2005, 3. [Google Scholar]
  14. Talen, E. The social equity of urban service distribution: An exploration of park access in Pueblo, Colorado, and Macon, Georgia. Urban Geogr. 1997, 18, 521–541. [Google Scholar] [CrossRef]
  15. Yu, K.; Duan, T. Evaluation Methods and Examples of Landscape Accessibility as A Functional Indicator of Urban Green Space Systems. Urban Plan. 1999, 8, 7–10. [Google Scholar]
  16. Yang, Y.; Song, X. Comparison of GIS-based Accessibility Evaluation Methods. J. Build. Sci. Eng. 2004, 4, 27–32. [Google Scholar]
  17. Song, Z.; Chen, W. Spatial Accessibility of Public Services And its Metrics. Adv. Geosci. 2010, 10, 1217–1224. [Google Scholar]
  18. Lawrence, S.; Giles, C.L. Accessibility of information on the web. Intelligence 2000, 11, 32–39. [Google Scholar] [CrossRef]
  19. Yu, S.; Zhu, X.; He, Q. An assessment of urban park access using house-level data in urban China: Through the lens of social equity. Int. J. Environ. Res. Public Health 2020, 17, 2349. [Google Scholar] [CrossRef]
  20. Cai, Y.; Ya, W. Analysis of The Spatial Pattern And Accessibility of Parkland in Central Guangzhou. J. Ecol. Environ. 2011, 11, 1647–1652. [Google Scholar] [CrossRef]
  21. Xu, J.; Fang, S. Spatial Equity Analysis of Green Park Spaces in The Central City of Wuhan Based on G2SFCA. Resour. Sci. 2017, 39, 430–440. [Google Scholar]
  22. Wu, J.; Lin, S. Spatial Equity Analysis of Urban Park Green Space from the Perspective of Supply and Demand Balance—A Case Study of Futian District, Shenzhen. J. Appl. Ecol. 2016, 9, 2831–2838. [Google Scholar] [CrossRef]
  23. Tan, P.Y.; Samsudin, R. Effects of spatial scale on assessment of spatial equity of urban park provision. Landsc. Urban Plan. 2017, 158, 139–154. [Google Scholar] [CrossRef]
  24. Huang, Y.; Li, Y. A Review of Domestic And International Literature on Green Space Equity. Constr. Ind. Press 2019, 8, 394–404. [Google Scholar]
  25. Nicholls, S.; Shafer, C.S. Measuring Accessibility and Equity in a Local Park System: The Utility of Geospatial Technologies to Park and Recreation Professionals. J. Park Recreat. Adm. 2001, 19, 102–124. [Google Scholar]
  26. Wüstemann, H.; Kalisch, D.; Kolbe, J. Access to urban green space and environmental inequalities in Germany. Landsc. Urban Plan. 2017, 164, 124–131. [Google Scholar] [CrossRef]
  27. Kimpton; Anthony. A spatial analytic approach for classifying greenspace and comparing greenspace social equity. Appl. Geogr. 2017, 82, 129–142. [Google Scholar] [CrossRef]
  28. Van Herzele, A.; Wiedemann, T. A monitoring tool for the provision of accessible and attractive urban green spaces. Landsc. Urban Plan. 2003, 63, 109–126. [Google Scholar] [CrossRef]
  29. Comber, A.; Brunsdon, C.; Green, E. Using a GIS-based network analysis to determine urban greenspace accessibility for different ethnic and religious groups. Landsc. Urban Plan. 2008, 86, 103–114. [Google Scholar] [CrossRef]
  30. Rojas, C.; Páez, A.; Barbosa, O.; Carrasco, J. Accessibility to urban green spaces in Chilean cities using adaptive thresholds. J. Transp. Geogr. 2016, 57, 227–240. [Google Scholar] [CrossRef]
  31. Macedo, J.; Haddad, M.A. Equitable distribution of open space: Using spatial analysis to evaluate urban parks in Curitiba, Brazil. Environ. Plan. B Plan. Des. 2016, 43, 1096–1117. [Google Scholar] [CrossRef]
  32. Wendel HE, W.; Zarger, R.K.; Mihelcic, J.R. Accessibility and usability: Green space preferences, perceptions, and barriers in a rapidly urbanizing city in Latin America. Landsc. Urban Plan. 2012, 107, 272–282. [Google Scholar] [CrossRef]
  33. Ibes, D.C. A multi-dimensional classification and equity analysis of an urban park system: A novel methodology and case study application. Landsc. Urban Plan. 2015, 137, 122–137. [Google Scholar] [CrossRef]
  34. Jennifer, W.; Wilson, J.P. Parks and Park Funding in Los Angles: An Equity-Mapping Analysis. Geography 2005, 26, 4–35. [Google Scholar]
  35. la Barrera, D.; Francisc. Indicators for Green Spaces in Contrasting Urban Settings. Ecol. Indic. 2016, 62, 212–219. [Google Scholar] [CrossRef]
  36. La Rosa, D.; Takatori, C.; Shimizu, H.; Privitera, R. A Planning Framework to Evaluate Demands and Preferences by Different Social Groups for Accessibility to Urban Greenspaces. Sustain. Cities Soc. 2018, 36, 346–362. [Google Scholar] [CrossRef]
  37. Rigolon, A. A complex landscape of inequity in access to urban parks: A literature review. Landsc. Urban Plan. 2016, 153, 160–169. [Google Scholar] [CrossRef]
  38. Nicholls, S. Measuring the accessibility and equity of public parks: A case study using GIS. Manag. Leis. 2001, 6, 201–219. [Google Scholar] [CrossRef]
  39. Lindsey, G.; Maraj, M.; Kuan, S.C. Access, equity, and urban greenways: An exploratory investigation. Prof. Geogr. 2001, 53, 332–346. [Google Scholar] [CrossRef]
  40. Talen, E. Visualizing fairness: Equity maps for planners. J. Am. Plan. Assoc. 1998, 64, 22–38. [Google Scholar] [CrossRef]
  41. Yi, H.; Kong, F. Evaluation of Urban Green Space Accessibility And Equity. J. Ecol. 2008, 7, 3375–3383. [Google Scholar]
  42. Sun, Z.; Zhang, X. A Quantitative Assessment of The Equity of The Spatial Layout of Urban Parks And Green Spaces—An Example of Parks within The Sixth Ring Road in Beijing. West. J. Habitat 2020, 5, 83–90. [Google Scholar] [CrossRef]
  43. Peng, H.; Xu, L. Buffer Zone Analysis And Ecological Impact Assessment. J. Tianjin Norm. Univ. 2004, 2, 34–37. [Google Scholar]
  44. Mu, H.; Yuga. Research on The Evaluation of Service Level And Fairness of Urban Green Park Space from the Perspective of Supply And Demand Balance—An Empirical Analysis Based on Big Data. Urban Dev. Res. 2019, 11, 10–15. [Google Scholar]
  45. Liu, C.; Li, X. Urban Park Accessibility Study—Methodology and Key Issues. J. Ecol. 2010, 30, 5381–5390. [Google Scholar]
  46. Guan, X.; Liu, L. Spatial Linkage Analysis of The Beijing-Tianjin-Hebei Urban Agglomeration Based on A Modified Gravity Model. Urban Issues 2014, 11, 21–26. [Google Scholar] [CrossRef]
  47. Hao, X.; Xu, P. Comparison of City Networks Based on Baidu Index and Gravity Model—An Example of Beijing-Tianjin-Hebei City Cluster. J. Beijing Norm. Univ. 2017, 53, 479–485. [Google Scholar] [CrossRef]
  48. Wang, F. Inverted two-step floating catchment area method for measuring facility crowdedness. Prof. Geogr. 2018, 70, 251–260. [Google Scholar] [CrossRef]
  49. Wang, F. From 2SFCA to i2SFCA: Integration, derivation and validation. Int. J. Geogr. Inf. Sci. 2021, 35, 628–638. [Google Scholar] [CrossRef]
  50. McGrail, M.R.; Humphreys, J.S. Measuring spatial accessibility to primary care in rural areas: Improving the effectiveness of the two-step floating catchment area method. Appl. Geogr. 2009, 29, 533–541. [Google Scholar] [CrossRef]
  51. Radke, J.; Mu, L. Spatial decompositions, modeling and mapping service regions to predict access to social programs. Geographic Inf. Sci. 2000, 6, 105–112. [Google Scholar] [CrossRef]
  52. Ma, X.; Zhen, S. Study on The Service Area And Accessibility of Green Park Spaces. Urban Rural. Dev. 2018, 20, 49–51. [Google Scholar]
  53. Wang, H. 2SFCA And Model Builder Based Accessibility Modelling Analysis of Urban Food Service. Mapp. Spat. Geogr. Inf. 2015, 38, 126–128. [Google Scholar]
  54. Stoia, N.L.; Niţă, M.R.; Popa, A.M.; Iojă, I.C. The green walk—An analysis for evaluating the accessibility of urban green spaces. Urban For. Urban Green. 2022, 75, 127685. [Google Scholar] [CrossRef]
  55. Kabisch, N.; Haase, D. Green justice or just green? Provision of urban green spaces in Berlin, Germany. Landsc. Urban Plan. 2014, 122, 129–139. [Google Scholar] [CrossRef]
  56. Yang, D.H.; Goerge, R.; Mullner, R. Comparing GIS-based methods of measuring spatial accessibility to health services. J. Med. Syst. 2006, 30, 23–32. [Google Scholar] [CrossRef]
  57. Zhong, S.; Yang, X.; Chen, R. The accessibility measurement of hierarchy public service facilities based on multi-mode network dataset and the two-step 2SFCA: A case study of Beijing’s medical facilities. Geogr. Res. 2016, 35, 731–744. [Google Scholar]
  58. Cheng, Y.; Liu, M.; Li, M. Spatial accessibility analysis of green space in suburb parks based on 2SFCA. Cent. South For. Inventory Plan. 2011, 30, 31–35. [Google Scholar]
  59. Lin, Y.; Sheets, S.; Gong, X.; Davies, A. A multi-modal relative spatial access assessment approach to measure spatial accessibility to primary care providers. Int. J. Health Geogr. 2018, 17, 1–22. [Google Scholar] [CrossRef] [PubMed]
  60. Gao, Y. The Core Area of Beijing Marks A Historic New Beginning. China Dev. Monit. 2020, 17, 48–49. [Google Scholar]
  61. Wang, S. Beijing Urban Master Plan (2016–2035). Urban Plan. 2019, 8, 69–75. [Google Scholar]
  62. The Central Committee of the Communist Party of China The State Council on the Approval of the Detailed Control Plan (District Level) for the Core Area of the Capital Function (2018–2035). State Counc. Gaz. People’s Repub. China 2020, 25, 16–18.
  63. Yang, M. Strategic Thinking on The Spatial Layout of The New Phase of Beijing’s City. Urban Plan. 2017, 41, 23–32. [Google Scholar]
  64. Xu, H.; Zhao, G. Assessing the Value of Urban Green Infrastructure Ecosystem Services for High-Density Urban Management and Development: Case from the Capital Core Area of Beijing, China. Sustainability 2021, 13, 12115. [Google Scholar] [CrossRef]
  65. Meerow, S.; Newell, J.P.; Stults, M. Defining urban resilience: A review. Landsc. Urban Plan. 2016, 147, 38–49. [Google Scholar] [CrossRef]
  66. Yunlu, Z.; Jia, M.; Xiong, L. Exploring the planning and control paths of urban and rural green space systems for the new era of territorial spatial planning. Landsc. Archit. 2020, 27, 25–29. [Google Scholar] [CrossRef]
  67. Data Collected from Bjxch.gov.cn. 2022. Available online: https://www.bjxch.gov.cn/xcsj.html (accessed on 15 March 2021).
  68. Dong, P.; Yang, C.; Rui, X.; Zhang, L.; Cheng, Q. An effective buffer generation method in GIS. Int. Geosci. Remote Sens. Symp. 2003, 6, 3706–3708. [Google Scholar]
  69. Yang, W. Multi-scale Green Space Accessibility And Equity in Guangzhou Based on a Two-Step Movement Search Method with Multiple Travel Modes. J. Ecol. 2021, 41, 6064–6074. [Google Scholar]
  70. Feng, S.; Chen, L.; Sun, R.; Feng, Z.; Li, J.; Khan, M.S.; Jing, Y. The distribution and accessibility of urban parks in Beijing, China: Implications of social equity. Int. J. Environ. Res. Public Health 2019, 16, 4894. [Google Scholar] [CrossRef]
  71. Guo, M.; Liu, B.; Tian, Y.; Xu, D. Equity to urban parks for elderly residents: Perspectives of balance between supply and demand. Int. J. Environ. Res. Public Health 2020, 17, 8506. [Google Scholar] [CrossRef]
  72. Zhang, Y.; Wu, Q.; Wu, L.; Li, Y. Measuring Community Green Inequity: A Fine-Scale Assessment of Beijing Urban Area. Land 2021, 10, 1197. [Google Scholar] [CrossRef]
  73. Xu, M.; Xin, J.; Su, S.; Weng, M.; Cai, Z. Social inequalities of park accessibility in Shenzhen, China: The role of park quality, transport modes, and hierarchical socioeconomic characteristics. J. Transp. Geogr. 2017, 62, 38–50. [Google Scholar] [CrossRef]
  74. Zhang, X.; Lu, H.; Holt, J.B. Modeling spatial accessibility to parks: A national study. Int. J. Health Geogr. 2011, 10, 1–14. [Google Scholar] [CrossRef] [PubMed]
  75. Beijing Registered Green Space. Available online: https://www.bjxch.gov.cn/xcsj/sj/xxxq/pnidpv12.html (accessed on 15 March 2021).
  76. Guo, M.; Han, C.; Guan, Q.; Huang, Y.; Xie, Z. A universal parallel scheduling approach to polyline and polygon vector data buffer analysis on conventional GIS platforms. Trans. GIS 2020, 24, 1630–1654. [Google Scholar] [CrossRef]
  77. Zhou, X.; Zhang, X. Behavioural Scale-oriented Evaluation of the Fairness of Urban Green Space Pattern and its Optimization Strategy: The Case of Shenzhen City. Beijing Univ. J. 2013, 5, 892–898. [Google Scholar] [CrossRef]
  78. Stats.gov.cn. Seventh National Census. 2022. Available online: http://www.stats.gov.cn/ztjc/zdtjgz/zgrkpc/dqcrkpc/ggl/ (accessed on 24 March 2021).
  79. Chang, Z.; Chen, J.; Li, W.; Li, X. Public transportation and the spatial inequality of urban park accessibility: New evidence from Hong Kong. Transp. Res. Part D Transp. Environ. 2019, 76, 111–122. [Google Scholar] [CrossRef]
  80. Cha, X. A Preliminary Study on Constructing a Network of Rail Transit TOD Complex Developments—Taking the Capital Core Area as an Example. Urban Rural. Constr. 2021, 15, 56–59. [Google Scholar]
  81. Geurs, K.T.; Van Wee, B. Accessibility evaluation of land-use and transport strategies: Review and research directions. J. Transp. Geogr. 2004, 12, 127–140. [Google Scholar] [CrossRef]
  82. Dai, D.J.; Wang, F.H. Geographic Disparities in Accessibility to Food Stores in Southwest Mississippi. Environ. Plan. B: Plan. Des. 2011, 38, 659–677. [Google Scholar] [CrossRef]
  83. Chen, X.; Jia, P. A comparative analysis of accessibility measures by the two-step floating catchment area (2SFCA) method. Int. J. Geogr. Inf. Sci. 2019, 33, 1739–1758. [Google Scholar] [CrossRef]
  84. Wang, F. Measurement, optimization, and impact of health care accessibility: A methodological review. Ann. Assoc. Am. Geogr. 2012, 102, 1104–1112. [Google Scholar] [CrossRef]
  85. Zheng Chang, J.C.; Weifeng Li, X.L. Evaluating spatial disparity of access to public parks in gated and open communities with an improved G2SFCA model. Sustainability 2019, 11, 5910. [Google Scholar] [CrossRef]
  86. Tao, Z.; Cheng, Y.; Liu, J. Hierarchical two-step floating catchment area (2SFCA) method: Measuring the spatial accessibility to hierarchical healthcare facilities in Shenzhen, China. Int. J. Equity Health 2020, 19, 1–16. [Google Scholar] [CrossRef] [PubMed]
  87. Kanuganti, S.; Sarkar, A.K.; Singh, A.P. Quantifying accessibility to health care using Two-step Floating Catchment Area Method (2SFCA): A case study in Rajasthan. Transp. Res. Procedia 2016, 17, 391–399. [Google Scholar] [CrossRef]
  88. Chang, H.S.; Liao, C.H. Exploring an integrated method for measuring the relative spatial equity in public facilities in the context of urban parks. Cities 2011, 28, 361–371. [Google Scholar] [CrossRef]
  89. Xiao, Y.; Wang, Z.; Li, Z.; Tang, Z. An assessment of urban park access in Shanghai–Implications for the social equity in urban China. Landsc. Urban Plan. 2017, 157, 383–393. [Google Scholar] [CrossRef]
  90. Tan, C.; Tang, Y.; Wu, X. Evaluation of the equity of urban park green space based on population data spatialization: A case study of a central area of Wuhan, China. Sensors 2019, 19, 2929. [Google Scholar] [CrossRef] [PubMed]
  91. Straatemeier, T. How to plan for regional accessibility? Transp. Policy 2008, 15, 127–137. [Google Scholar] [CrossRef]
  92. Shi, M. From imperial gardens to public parks: The transformation of urban space in early twentieth-century Beijing. Mod. China 1998, 24, 219–254. [Google Scholar] [CrossRef]
  93. Li, W.; Ouyang, Z.; Meng, X.; Wang, X. Plant species composition in relation to green cover configuration and function of urban parks in Beijing, China. Ecol. Res. 2006, 21, 221–237. [Google Scholar] [CrossRef]
  94. Li, X.; Wang, W.; Wang, J.; Cao, X.; Wang, X.; Liu, J.; Liu, X.; Xu, X.; Jiang, X. Contamination of soils with organochlorine pesticides in urban parks in Beijing, China. Chemosphere 2008, 70, 1660–1668. [Google Scholar] [CrossRef]
  95. Guo, S.; Yang, G.; Pei, T.; Ma, T.; Song, C.; Shu, H.; Zhou, C. Analysis of factors affecting urban park service area in Beijing: Perspectives from multi-source geographic data. Landsc. Urban Plan. 2019, 181, 103–117. [Google Scholar] [CrossRef]
Figure 1. The Mapping of the Core Area of Beijing (a) defines the boundary of the core area of Beijing; (b) defines the boundary of the 3 km buffer zone of the core area of Beijing.
Land 11 01323 g001
Figure 2. Park entrances and distribution in the core area of Beijing: (a) Defines the distribution and size of parks in the research area; (b) defines the entrances and exits parks in the research area.
Land 11 01323 g002
Figure 3. Map of residential areas and street population (a) showing the distribution of residential areas in the core area of Beijing; (b) showing the distribution of population in the various districts of the core area of Beijing.
Land 11 01323 g003
Figure 4. 2SFCA model optimization function comparison. Comparing the decay curves of the three functional models, Ga2SFCA has a flatter curve. For this study, Ga2SFCA was selected since it is more in line with the actual situation of distance decay. The Figure was Adapted from Wang’s research [84].
Land 11 01323 g004
Figure 5. Residential district equity values. (a) Equity values for residential districts within a 30 min walk; (b) equity values for residential districts with a 10 min car journey.
Land 11 01323 g005
Figure 6. Overall equity value diagram. (a) Equity values for the whole core area of Beijing within a 30-min walk; (b) equity values for the whole core area of Beijing with a 10-min car journey.
Land 11 01323 g006
Figure 7. Equity value at district level. (a) Equity values at district level for 30-min walk; (b) equity values at district level for 10-min car journey.
Land 11 01323 g007
Table 1. Statistical table of registered parks in the core area of Beijing.
CategoryRangeNameNumber
Category I10,000
–100,000 m2
West Innovation Lane Urban Recreation ParkNew Central Street City Forest ParkSecond Ring Urban GreenwayGuangyang Valley Urban Forest Park51
Ditan ParkDongdan ParkTwenty-four Seasons ParkGuangning Park
Yandun ParkJiaolou Yingxiu ParkTaoyuan ParkFinancial Street Centre Park
West Innovation Lane Urban Recreation ParkNew Central Street City Forest ParkSecond Ring Urban GreenwayGuangyang Valley Urban Forest Park
Tiantan Wai ParkDongdan ParkFestival ParkGuangning Park
Yandun ParkJiaolou Yingxiu ParkTaoyuan ParkFinancial Street Centre Park
Ditan Wai ParkJadefly ParkYongdingmen ParkTanishi Katsukyo Park
Ming City Wall Site ParkLongtan West Lake ParkLongtan Central Lake ParkDesheng Park
Calamus River ParkHuangchenggen Heritage ParkNankan ParkShuangxiu Park
Lake Youth ParkWillow ParkBeijing Working People’s PalaceXibianmen City Wall Site Park
Zhongshan ParkTiantan ParkRose ParkShichahai Park
Changchun Court ParkBeijing Grand GardenJinzhongdu ParkYuetan Park
Rindinghu ParkSouth Leaside ParkShuncheng ParkBaiyun Park
Guangyuan ParkWanshou ParkXuanwu Art GardenTaoranting Park
Longtan ParkNorth Second Ring Road City Park Olympic Community ParkLotus River City Recreation Park
Beihai ParkJingshan ParkBeijing Zoo
Category II400–10,000 m2Tiantan Pocket Park (3 sites in total)Tong Ren Hospital Pocket ParkProsecutor’s Office Pocket ParkXiangheyuan Pocket Park28
Weixiao West Pocket ParkFour Jade Pocket ParkQianmen ParkHua Cheng Park
Moon Bay ParkChangle Fong Forest ParkYiching Garden Forest ParkXinjiekou City Forest Park
Candle GardenTsui Fong YuenSoutheast corner of TiananmenMagnetkou Pocket Park
Guangqumen Pocket ParkStreet South Pocket ParkTiantan East Gate Pocket ParkShichahai Pocket Park
Exhibition Hall Road Pocket ParkCompleted Garden Pocket ParkEast Fosu Lane Pocket ParkSishku Pocket Park
Hundred GardensXinhua Street Road West Pocket Park
Data collated from [75].
Table 2. Road classification and speed assignment table.
CategoryNameSpeed (km/h)
IHighways100
IIUrban Trunk Roads50
IIIUrban Secondary Roads40
IVUrban Feeder Roads30
VOther Roads20
Adapted from the research of Geurs [81].
Table 3. Supply level and equity level classification table.
Supply LevelClassEiEquity Level
No Supply ServiceClass I0.00None
Lack of SupplyClass II0.00–0.25Seriously Inequitable
Insufficient SupplyClass III0.25–0.50Relatively Inequitable
Balanced SupplyClass IV0.50–0.75Equitable
Sufficient SupplyClass V0.75–1.00Relatively Equitable
Saturated SupplyClass VI>1.00Seriously Inequitable
Table 4. Supply classification statistics for residential units with walking 30 min and driving 10 min by car.
ClassWalking 30 min10 min Car Journey
Number of
Residential Units
PercentageNumber of
Residential Units
Percentage
Class I60.3800
Class II51432.5990.57
Class III31620.041046.59
Class IV18611.7962239.44
Class V1489.3881251.49
Class VI40725.81301.90
Table 5. Equity level statistics for residential units with walking 30 min and driving 10 min by car.
Equity LevelPercentage of Walking 30 minPercentage of 10 min Car Journey
Equitable11.7939.44
Relatively Equitable9.3851.49
Relatively Inequitable20.046.59
Seriously Inequitable58.402.47
Table 6. Supply classification for overall area with walking 30 min and driving 10 min by car.
ClassWalking 30 min10 min Car Journey
Number of Particles
in Area
PercentageNumber of Particles in AreaPercentage
Class I0000
Class II1,683,47726.8955420.09
Class III1,303,20420.81491,5337.85
Class IV847,05713.532,770,49944.25
Class V551,6638.812,943,51447.01
Class VI1,876,04029.9650,3530.80
Table 7. Equity level statistics for overall area with walking 30 min and driving 10 min by car.
Equity LevelPercentage of Walking 30 minPercentage of 10 min Car Journey
Equitable13.5344.25
Relative Equitable8.8147.01
Relative Inequitable20.817.85
Seriously Inequitable56.850.89
Table 8. Park shape classification and plan.
ShapeFace-ShapedBelt-ShapedPatch-Shaped
Typical parksTaoranting ParkSecond Ring Urban GreenwayCandle Park
Distribution Land 11 01323 i001 Land 11 01323 i002 Land 11 01323 i003
Plan Land 11 01323 i004 Land 11 01323 i005 Land 11 01323 i006
Table 9. Districts with large differences based on 30-min walk and 10-min car journey.
District NameEquity Level of 30 min WalkEquity Level of 10 min Car Journey
ChongwenmenRelatively Equitable (Class V)Relatively Inequitable (Class III)
Yongdingmen WaiRelatively Equitable (Class V)Relatively Inequitable (Class III)
DonghuashiRelatively Equitable (Class V)Seriously Inequitable (Class II)
TianqiaoSeriously Inequitable (Class VI)Relatively Inequitable (Class III)
Taoran TingSeriously Inequitable (Class VI)Relatively Inequitable (Class III)
Tiyuguan RoadSeriously Inequitable (Class VI)Relatively Inequitable (Class III)
HepingliEquitable (Class IV)Relatively Inequitable (Class III)
Financial StreetEquitable (Class IV)Relatively Inequitable (Class III)
Table 10. Table of proposed additional parkland areas.
LocationParkland DemandSuggestions for Additions
Guanganmen Wai, Jianguomen, DongzhimenClass II Lack of SupplyPriority Additions
Exhibition Road, Guanganmen Nei, DeshengClass II Lack of Supply
Or
Class III Insufficient Supply
Additions Required
Yuetan, Niujie, Baizhi Fang, Dongsi, JingshanClass III Insufficient SupplySuggested Additions
Publisher’s Note: MDPI stays neutral with regard to jurisdictional claims in published maps and institutional affiliations.

