1. Introduction
Since the reform and opening-up, Shenzhen and Hong Kong have carried out mutual learning programs, obtained mutual benefits, experienced coordinated development, and gone through four stages together: “undertaking industrial transfer”, “cooperation within the industry in Shenzhen and Hong Kong”, “cooperation in Shenzhen and Hong Kong”, and “the core engine metropolis of the Guangdong–Hong Kong–Macao Greater Bay Area (GBA)”. The Central Committee of the Communist Party of China and the State Council successively issued The Outline Development Plan for the Guangdong–Hong Kong–Macao Greater Bay Area (February 2019) and The Proposal of the Central Committee of the Communist Party of China and the State Council on Supporting Shenzhen to Build a Pilot Demonstration Zone of Socialism with Chinese Characteristics (August 2019). With the release of these policies, cooperation between Shenzhen and Hong Kong has stepped into a new stage. Some questions that have arisen include: How can individuals clear customs with a lower time cost caused by system differences between Shenzhen and Hong Kong, such as the gap in the tax system, the legal system, and transportation management rules? How can we enhance the mobility of cross-border elements? How can we achieve a dual-core international metropolis with integrated functions? The study addresses these issues and tries to solve the construction dilemma of the GBA.
Whether the customs clearance system is efficient or not has become a significant indicator by which to measure the competitiveness of countries and regions. Commonly, there are four customs clearance patterns in international port stations, including “two inspections at two ports”, “two inspections at one port”, “free customs clearance”, and “within territory but out of customs” [
1]. It is obvious that cross-border traffic accessibility has a direct influence on a port city’s economy [
2]. Consequently, its measurement has become a hot topic in academia. The macro-analysis mainly focuses on the connectivity of railway, highway, or aviation networks and their impact on port cities or harbor hinterlands. Typical studies that can be carried out include: creating a model to measure the accessibility from the hinterland to the port to analyze the spatial differences in port connectivity among various urban agglomerations in China [
3]; building a model to explore diversified strategies for improving the China–Europe freight transport channel capacity [
4]; and establishing a fuzzy comprehensive evaluation model to measure the benefits of a sea–rail intermodal container logistics channel to explore the Yiwu-Ningbo sea–rail intermodal container transport channel in the Yangtze River Delta region [
5]. Most of the relevant studies from the macro-perspective discuss the efficiency of diverse transportation modes and combinations of them under only one country’s tariff system, especially focusing on the impact of the channel and its network on the logistics efficiency and the economic function of the port city. On the other hand, micro-analysis attaches great importance to the efficiency of the customs clearance system between the port and the city (where the port is located), and the indicators usually selected include the coordinated efficiency of the customs clearance system at the port [
6] and the accessibility from the port to different functional areas of the city [
7]. Generally, from the macro- and micro-perspectives, the existing studies on the relationship between ports and cities have failed to integrate the enterprise- and resident-intensive areas in order to examine the connected efficiency of different customs areas. A few studies on the Shenzhen–Hong Kong customs clearance system also primarily discuss the feasibility of 24-h customs clearance [
8], the supervision of passenger inspections [
9], and the construction of a channel network for waterway passenger transport [
10]. However, little research has addressed the customs clearance mode in the commute time within urban functional areas. Therefore, this study, from the viewpoint of customs clearance system facilitation, aimed to optimize the traffic accessibility in a multi-scenario simulation under customs clearance barriers between Shenzhen and Hong Kong. Based on the accessibility discussed above, the study concerns the impact of the time cost on the cooperation between the two cities. Then, more precise optimization strategies are proposed for customs clearance system facilitation.
2. Literature Review
Through a review of the relevant literature on cross-border cooperation, it was found that efficiency has become an important topic in cross-border cooperation research and has received increasing attention with the deepening of cross-border cooperation. The studies can be divided into three types: cooperation fields, cooperation modes, and cooperation barriers. Firstly, cross-border cooperation can be referred to as ‘traffic efficiency’. Cross-customs cooperation plays an important role as a core node in multiple types of deep cross-border cooperation in tourism, health, the environment, and other fields. Secondly, cross-border cooperation can be referred to as ‘system efficiency’. Through the establishment of supranational institutions and the implementation of cross-border policies, the system mechanism and governance of cross-border cooperation have been continuously improved. The cross-customs clearance system has played an important role in improving the efficiency of cross-border cooperation. Thirdly, cross-border cooperation can be referred to as an ‘efficiency barrier’. Borders have a shielding effect on cross-border cooperation. Although cross-border cooperation is in a relatively mature stage of development, it still faces problems, such as cross-border accessibility, and bilateral differences. However, the existing research on cross-border cooperation has not taken the subway network to be an influencing factor.
2.1. Cross-Border Cooperation Fields
Cross-border integration promotes all-around and multi-field cooperation. The existing research mainly focuses on economic cooperation, environmental governance, cross-border tourism, health, and other fields [
11,
12]. Taking the Pakstadlinburg (The Netherlands) and Aachen (Germany) regions as examples, Duindam et al. explored the issue of how we can use transboundary land and development and utilization patterns to promote transboundary economic and spatial development [
13,
14]. Héraud studied policies that promote innovation in the transboundary region of the Upper Rhine Valley and found that the creative potential of multicultural spaces promotes the development of emerging economies [
15]. Decoville et al. [
11] compared three indicators (cross-border commuter flow, per capita GDP difference, and resident identity) in 10 cross-border metropolitan regions in the European Union. It was found that the greater the economic gap between border regions, the higher the interaction level of cross-border commuting, which promotes the integration of cross-border regions. Zhu huibin [
16] summarized typical models of cross-border cooperation and showed that cross-border cooperation needs to adapt to local conditions, comprehensively analyze the relationship between regional input and output, and select an appropriate spatial governance model according to the actual situation. Li Panpo et al. [
17] conducted research on the cross-border development of entrepreneurial agriculture under the guidance of the rural revitalization strategy and constructed a cross-border development model of creative agriculture.
2.2. Cross-Border Cooperation Modes
The existence of boundaries provides opportunities for the exploration of new governance modes [
18]. Cross-border governance covers the construction of decision-making processes and the implementation of cooperative agreements, bringing together multi-scale authorities on both sides of the border [
19,
20]. Ma Xueguang et al. [
21] studied the types of scales and logical interpretation of EU inter-regional cross-border cooperation, explored the relationship between its economic systems and institutions, and gave suggestions on a model of development between China’s “Belt and Road” and urban agglomerations. Perkmann [
22] proposed a logical structure for the construction of a cooperation system in a cross-border region, found that cross-border cooperation involves the construction of new governance scales that cover political mobilization, system construction, and strategic unification, and provided an analysis of system construction research in cross-border areas. Cross-border cooperation will also have an impact on the reterritorialization of the border region and the reconfiguration of territorial space [
23]. Popescu [
24] took EU cross-border cooperation to be a new organizational structure and used the Romania–Ukraine–Moldova border region as an example to show how border cooperation affects the construction and governance of national and local governments’ cross-border systems, thereby affecting changes in European borders and territories.
2.3. Cross-Border Cooperation Barriers
As a territorial dividing line, a border increases the spatial and temporal distance and brings about higher transaction costs [
25]. It will make cross-border cooperation challenging due to physical and geographical barriers as well as differences in linguistic and cultural systems, political systems, management systems, legal frameworks, and technological and environmental standards [
26]. The promotion of cross-border cooperation and the formation of a cross-border region are both complex multi-mechanism processes with complicated influencing factors. The language and cultural differences between bilateral countries, cooperation desires, and cross-cultural prejudice are all barriers to cross-border integration [
27,
28]. Cross-border cooperation involves coordination among systems at different scales, and this high coordination cost further magnifies the negative impact of differentiated systems [
29]. In many studies, cross-border accessibility is seen as a major barrier to cross-border cooperation. Scholars have proposed a cross-border traffic penetration index to calculate the impact of cross-border traffic on the entire EU region. Studies have shown that even in the most mature and socio-economically developed EU border areas, cross-border traffic has not been fully developed due to the complex legal and administrative frameworks on both sides [
30]. In addition, the existence of non-EU Member States and border procedures also increases the time and cost of regional and international land transport [
31].
3. Research Area and Data
3.1. Research Area
There are nine customs clearance ports in Shenzhen and Hong Kong (
Table 1 and
Figure 1). Futian Port connects to the subway and highway; however, cars cannot pass through it. Luohu Port only connects to the subway. Huanggang Port is the only 24-h customs clearance port. It generally uses Futian Port, Luohu Port, Huanggang Port, and Shenzhen Bay Port. In addition, since Futian Port and Luohu Port connect to the MTR, it is more convenient to commute.
As mentioned above, there are four main customs clearance modes at international ports. Shenzhen mostly adopts the “two inspections at two ports” mode, such as at Luohu Port and Futian Port. The “two inspections at one port” mode is only adopted by West Kowloon Railway Station and Shenzhen Bay Port. However, in fact, the latter mode only applies to the transitional period. This policy shortens the spatial distance, and there is no difference between it and the former one.
Furthermore, as China’s degree of global openness increases, so does the flow of people entering and departing ports, as well as the flow of import and export commodities. This accounts for the mismatch between the existing port mode and the worsening of the current situation. However, there are fundamental differences in the spatial design of the control points between the two customs clearance modes, namely “two inspections at two ports” and “two inspections at one port”. So, it is difficult to convert the existing port infrastructure from the spatial layout of the “two inspections at two ports” mode to the structure of the “two inspections at one port” mode. In addition, there is a low probability that the customs clearance time will be reduced in a short period of time. Currently, Futian Port and Luohu Port adopt two customs clearance methods: staff-service and self-service. Self-service customs clearance requires card-swiping and fingerprint collection. When departing a port in Shenzhen via card-swiping and fingerprint collection, it usually takes 15–30 min for a person to clear customs for the first time, but 1 h at rush hour.
3.2. Data Sources
3.2.1. Subway Network Data
Taking Shenzhen and Hong Kong as spatial units, relevant surveys suggest that the subway is the most popular and efficient mode of transportation between the two cities. Therefore, the subway was used as the primary mode of transportation in this study. An accessibility analysis based on time cost was used to simulate and upgrade the connection between Shenzhen and Hong Kong. The subway network data originate from the Shenzhen Metro Line Map (2020) and MTR Line Map (2020). The frequency of the subway was calculated using the time supplied by the metro schedules on the official websites.
3.2.2. Points of Interest in Urban Functional Areas
The POI data for this study were chiefly obtained from the AutoNavi map open platform (
https://lbs.amap.com/) with network data crawling technologies (accessed on 15 January 2021). The study focuses on four functions (business, commercial, residential, and industrial), considering the characteristics of the POI data and the evolution of the functional space in Shenzhen and Hong Kong. A total of 98,406 valid POI data elements were obtained after rectifying, reclassifying, and filtering the original data. The different types of functional elements and their associated POI subclasses are shown in
Table 2.
3.2.3. Customs Clearance Time for Multiple Scenarios
We obtained the customs clearance time for various situations after conducting interviews. The customs clearance time in the various situations varied due to the diversity of individuals. Hence, several time intervals were selected for the statistical analysis. The results are shown in
Table 3.
4. Methodology
4.1. Research Design
Based on a model for accessibility analysis and evaluation, the weighted average travel time, Kriging Spatial Interpolation, and kernel density were used to measure the commute accessibility in order to comprehensively optimize the accessibility of cross-custom cooperation in the four functional zones (
Figure 2). First, according to the results on the customs clearance and inspection method obtained through interviews, the customs clearance time was evaluated. Secondly, based on spatial autocorrelation and using the original data and structural type of the semi-variance function, an interpolation approach was applied for the unbiased evaluation of unknown sample locations of regionalized variables. Third, kernel density analysis was applied to analyze the spatial distribution of geographical elements for the density analysis of elements in the neighborhood. KDE analysis uses the density within the range (window) of each observation to represent the value at the center of the window. Within the window, the KDE weighs nearby objects more heavily than distant objects on the basis of a kernel function [
32]. It has also been used extensively to assess the spatial aggregation degree and distribution pattern of urban POIs. Its basic principle is to assign varying weights to objects within the search region.
4.2. Measurement of Accessibility Based on Time Cost
The formula for the calculation of accessibility [
33] is
. In the equation,
denotes the accessibility value for station
I, namely its weighted average travel time, which expresses the proximity of the connection between station
i and the others. Its unit was set to minutes for precise calculations. The smaller the value, the easier it is to get to the station and the more accessible.
is the smallest time interval between station
i and
j.
n is the number of stations located in the study area.
is the weight of station
j. In this study, the flow of people and the frequency of the subway were regarded as crucial aspects that have an impact on the subway’s accessibility since the mode of transportation is the subway. As a result, subway frequency was used to denote the weight. Due to the One Country–Two Systems policy and the fact that Shenzhen and Hong Kong have two independent customs zones, customs clearance has an institutional cost that is included in the customs clearing time. Accordingly, the customs clearance time was used to quantify the institutional hurdle to customs clearance; in other words, the more time, the higher the institutional barrier.
4.3. Kriging Spatial Interpolation of the Commute Time in Different Functional Areas of Shenzhen and Hong Kong
The calculation formula [
34] is
. In the equation,
x denotes location points at different latitudes and longitudes, and
is the variable value at
x, the sum of deterministic trend value
and spatial autocorrelation random error
. The kriging interpolation method is adopted to identify the high-value areas and low-value areas of accessibility between Shenzhen and Hong Kong.
4.4. Kernel Density Evaluation
Its main idea is to assign varying weights to objects within the search region. The larger the weight, the closer it is to the center of the search region, and the density value of the area can be obtained by adding the weights of each sample point in the search range. The formula for Kriging Spatial Interpolation is
. In the equation,
denotes the kernel density calculation function at spatial position
s, the function
k is a spatial weight function,
h is the distance decay threshold, and
n is the number of points whose distance from position
s is less than or equal to
h [
35]. With ArcGIS, we applied kernel density analysis to assess the spatial aggregation degree and distribution pattern of POIs in urban functional areas. The cell size and search radius were set to their defaults. In other words, the cell size was determined by the environment and the search radius was calculated for the input dataset using the “Silverman rule of thumb” spatial variable, which helps to avoid spatial outliers.
5. Results
In this study, “scenario” refers to a customs clearance circumstance where time is required because of customs barriers in Shenzhen and Hong Kong, while “multi” refers to a variety of scenarios with diverse customs clearance methods, including staff-service, self-service, and customs-barrier-free methods. Self-service customs clearance is mostly accomplished using fingerprint, card, and facial recognition. The scenarios include time nodes of 1 min, 5 min, 15 min, 30 min, and 60 min. After repeated attempts, we chose 60 min, 30 min, and 15 min for the customs clearance simulation and 5 min the for customs clearance optimization analysis and barrier-free optimization analysis.
5.1. Simulation of Shenzhen–Hong Kong Customs Clearance
5.1.1. Customs Clearance in 60 min and 105–120 min to Reach the Core Area of Shenzhen and Hong Kong
When the customs clearance time is one hour, the accessibility of Shenzhen is generally higher than that of Hong Kong. Shenzhen’s entire area lies within 105 min, but Hong Kong’s is more than 105 min. In Shenzhen, the accessibility inside the customs area (Nanshan, Futian, and Luohu) is superior to the accessibility outside the customs area (Bao’an, Guangming, Longhua, Yantian, Pingshan, and Dapeng). Futian District has the most-accessible areas, followed by Nanshan District, Longhua District, and Luohu District. In Hong Kong, the main urban areas (Kowloon City, Sham Shui Po, Wan Chai, and Yau Tsim Mong) are in the 90–120 min range, which is 30 min longer than the main urban areas of Shenzhen (
Figure 3a,
Table 4). The main reason for this is that the control point in Shenzhen and Hong Kong has been restricted, which leads to a longer customs clearance time.
5.1.2. Customs Clearance in 30 min and 75–90 min to Reach the Core Area of Shenzhen and Hong Kong
When the customs clearance time is reduced to half an hour, the accessible area within 90 min expands, and the accessible area outside 90 min shrinks. The accessibility within the Shenzhen customs area increases to within 60 min, the accessibility outside the customs area increases to within 90 min, and the accessibility of the Futian CBD region is within 45 min. The core area of Hong Kong (Kowloon City, Sham Shui Po, and Wan Chai) now reaches within 90 min, and the zones near Shenzhen (North District, Kwun Tong District, and northern Sha Tin District) reach within 75 min (
Figure 3a,
Table 4). The main reasons for this are that the customs clearance time has decreased and the customs clearance speed has increased, which contributes to the expansion in accessibility.
5.1.3. Customs Clearance in 15 min and 60–90 min to Reach the Core Area of Shenzhen and Hong Kong
When the clearance time is reduced to 15 min, the reachable area within 60 min expands. The territory of Shenzhen that can be reached in 45 min also expands, including almost all of the Futian District area. However, there are no substantial modifications in other regions. In Hong Kong, the accessible area within 75 min grows to include Sha Tin District, Wong Tai Sin District, and Sham Shui Po District, while the entire accessible zone of the outlying islands increases to within 90 min (
Figure 3c,
Table 4). Again, the results verify that the customs clearance time has decreased and the connection between Shenzhen and Hong Kong has been promoted.
5.2. Time Cost in Customs Clearance and Optimization of the Accessible Range of Functional Areas in Shenzhen and Hong Kong
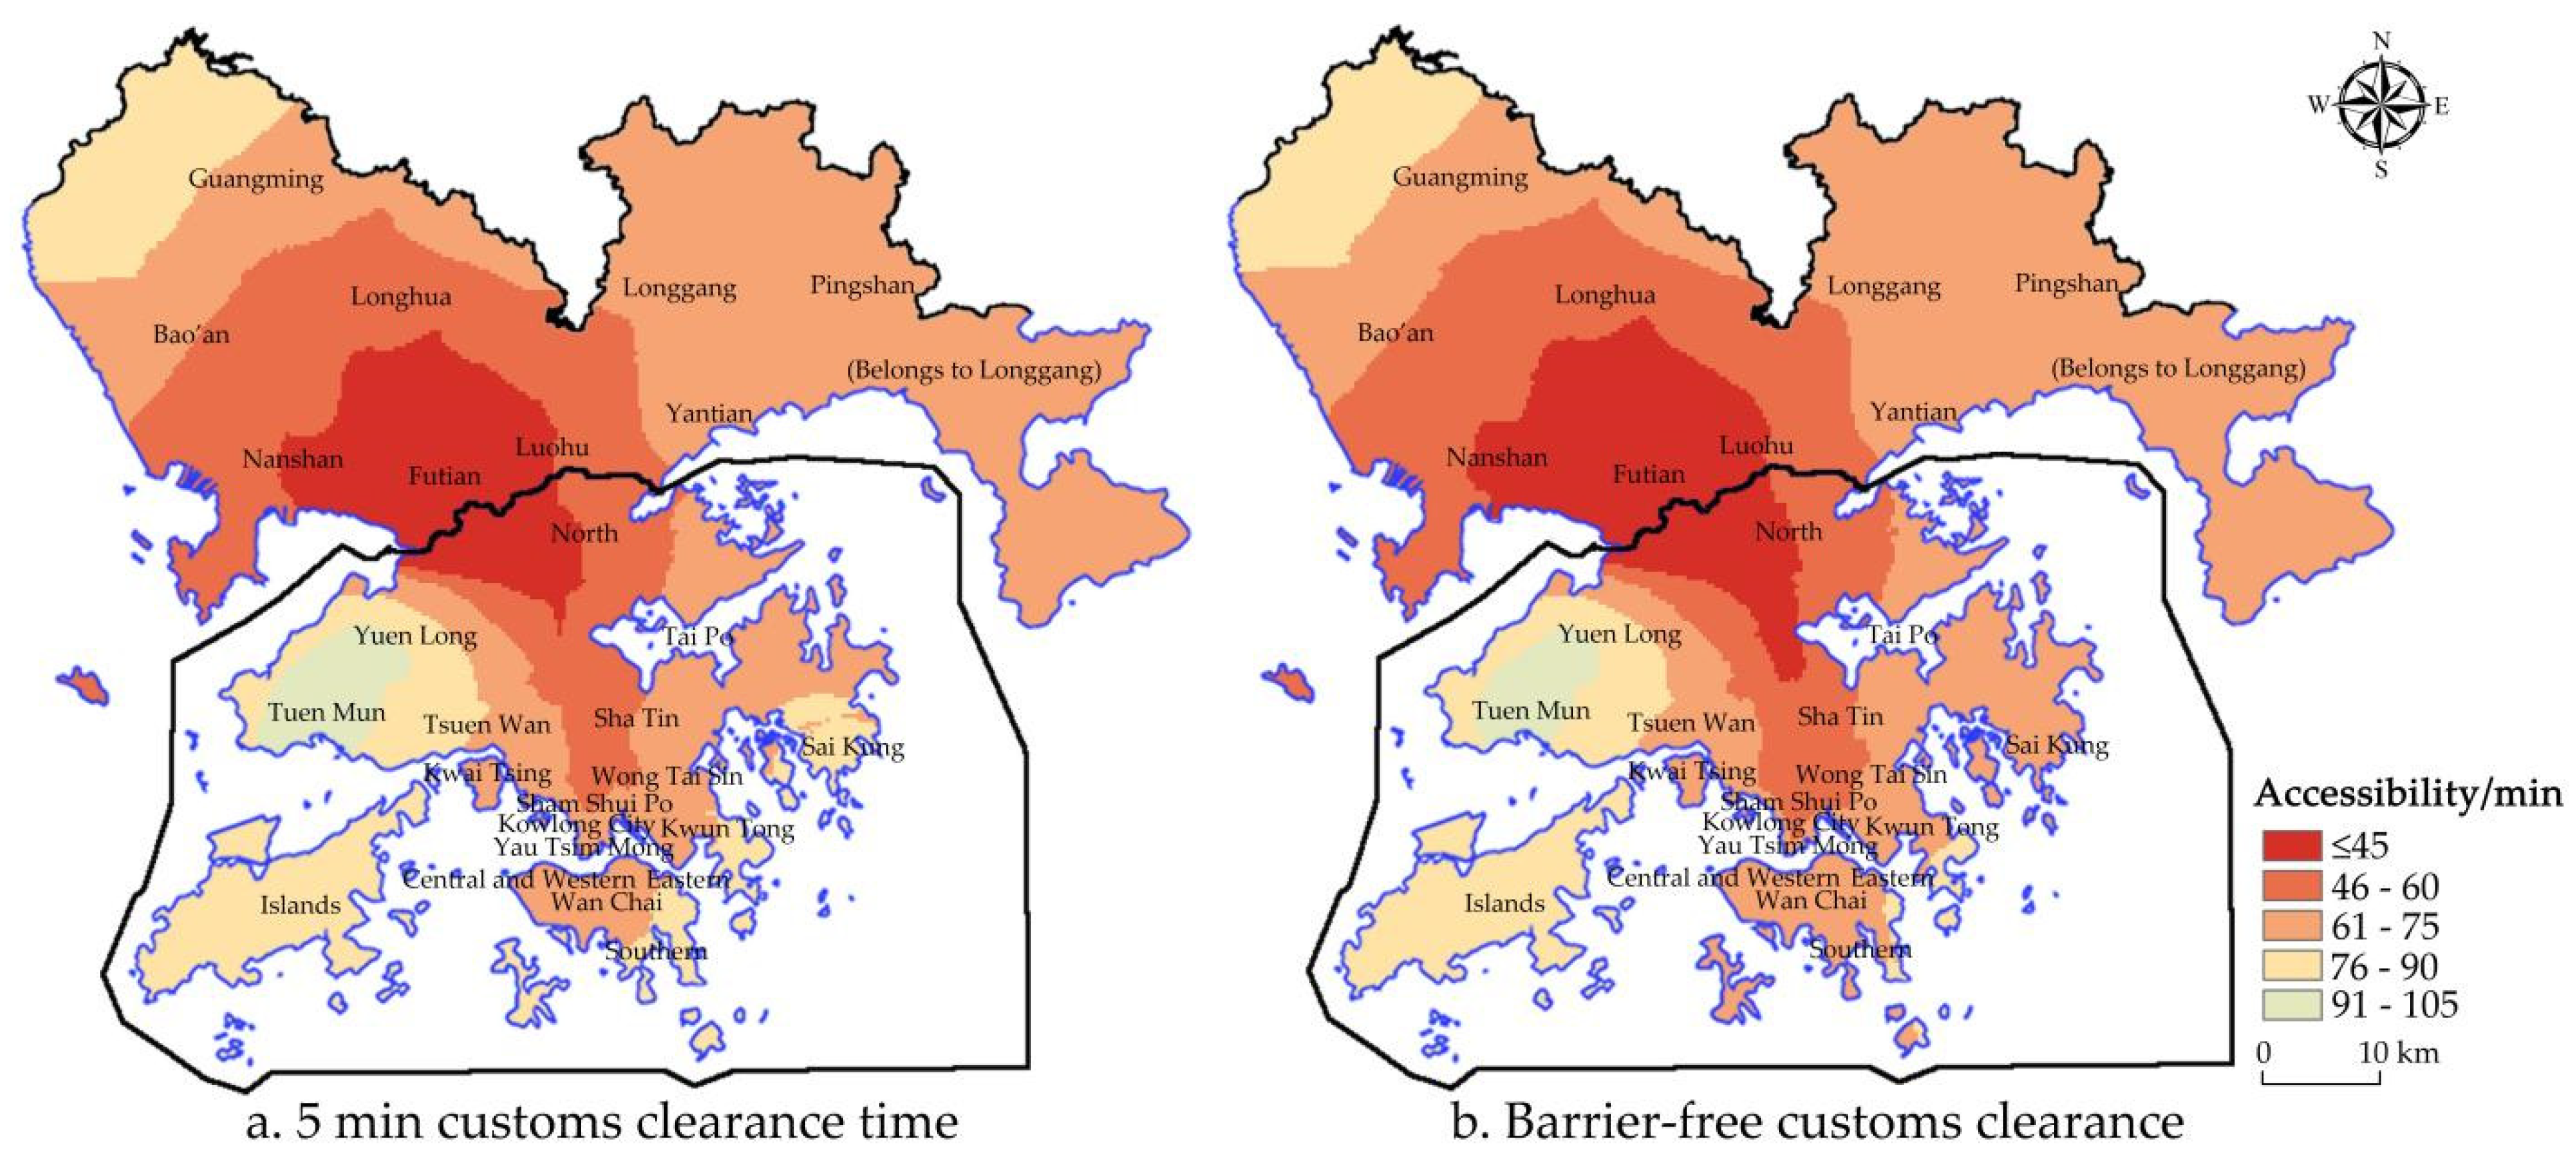
5.2.1. Customs Clearance in 5 min and 60–75 min to Reach the Core Area of Shenzhen and Hong Kong
When reducing the customs clearance time to 5 min, the accessibility of Shenzhen and Hong Kong considerably improves. It takes less than 75 min to travel between these cities’ main urban areas, and less than 90 min to arrive at any location in these areas. The area that can be reached within 45 min significantly expands, most locations within the Shenzhen customs area can be reached within 45 min, and this area expands to Hong Kong’s North District. Simultaneously, the accessible area outside 75 min shrinks, while the accessible area within 75 min correspondingly expands (
Figure 4a,
Table 5).
5.2.2. Barrier-Free Customs Clearance and 60–75 min to Most of the Land Area in Shenzhen and Hong Kong
Shenzhen and Hong Kong have the strongest connectivity under the barrier-free customs clearance system. Most places in Hong Kong can be reached within 75 min, while the area accessible within 60 min only extends to the Kwun Tong District (
Figure 4b,
Table 5).
It is difficult to increase accessibility by reducing the customs clearance time because Hong Kong’s center is in the south and only the East Rail Line connects Hong Kong with Shenzhen. The main reason for the long time it takes to reach Hong Kong’s main urban area is the distance that must be traveled. In the future, it will be necessary to shorten the connection time through the land utilization distribution and rail transit planning.
The simulation results also reveal that Shenzhen is more accessible than Hong Kong, especially in the CBD. This finding is related to the layout of the subway stations to some extent. Subway stations are clustered together in Shenzhen’s CBD, while they are relatively dispersed in Hong Kong. Moreover, Shenzhen also has many transfer stations. Its metro lines form a circular network in which it is easy to transfer stations. However, due to the separation of the West Rail Line and the East Rail Line in Hong Kong during the early years, most subway stations in Hong Kong are connected by a single line (
Figure 1). Because there were two independent subway systems in the past, there were few transfer stations, resulting in limited accessibility now. In the future, we could increase the number of cross-city rail transit connections and the convenience of intra-city rail transit.
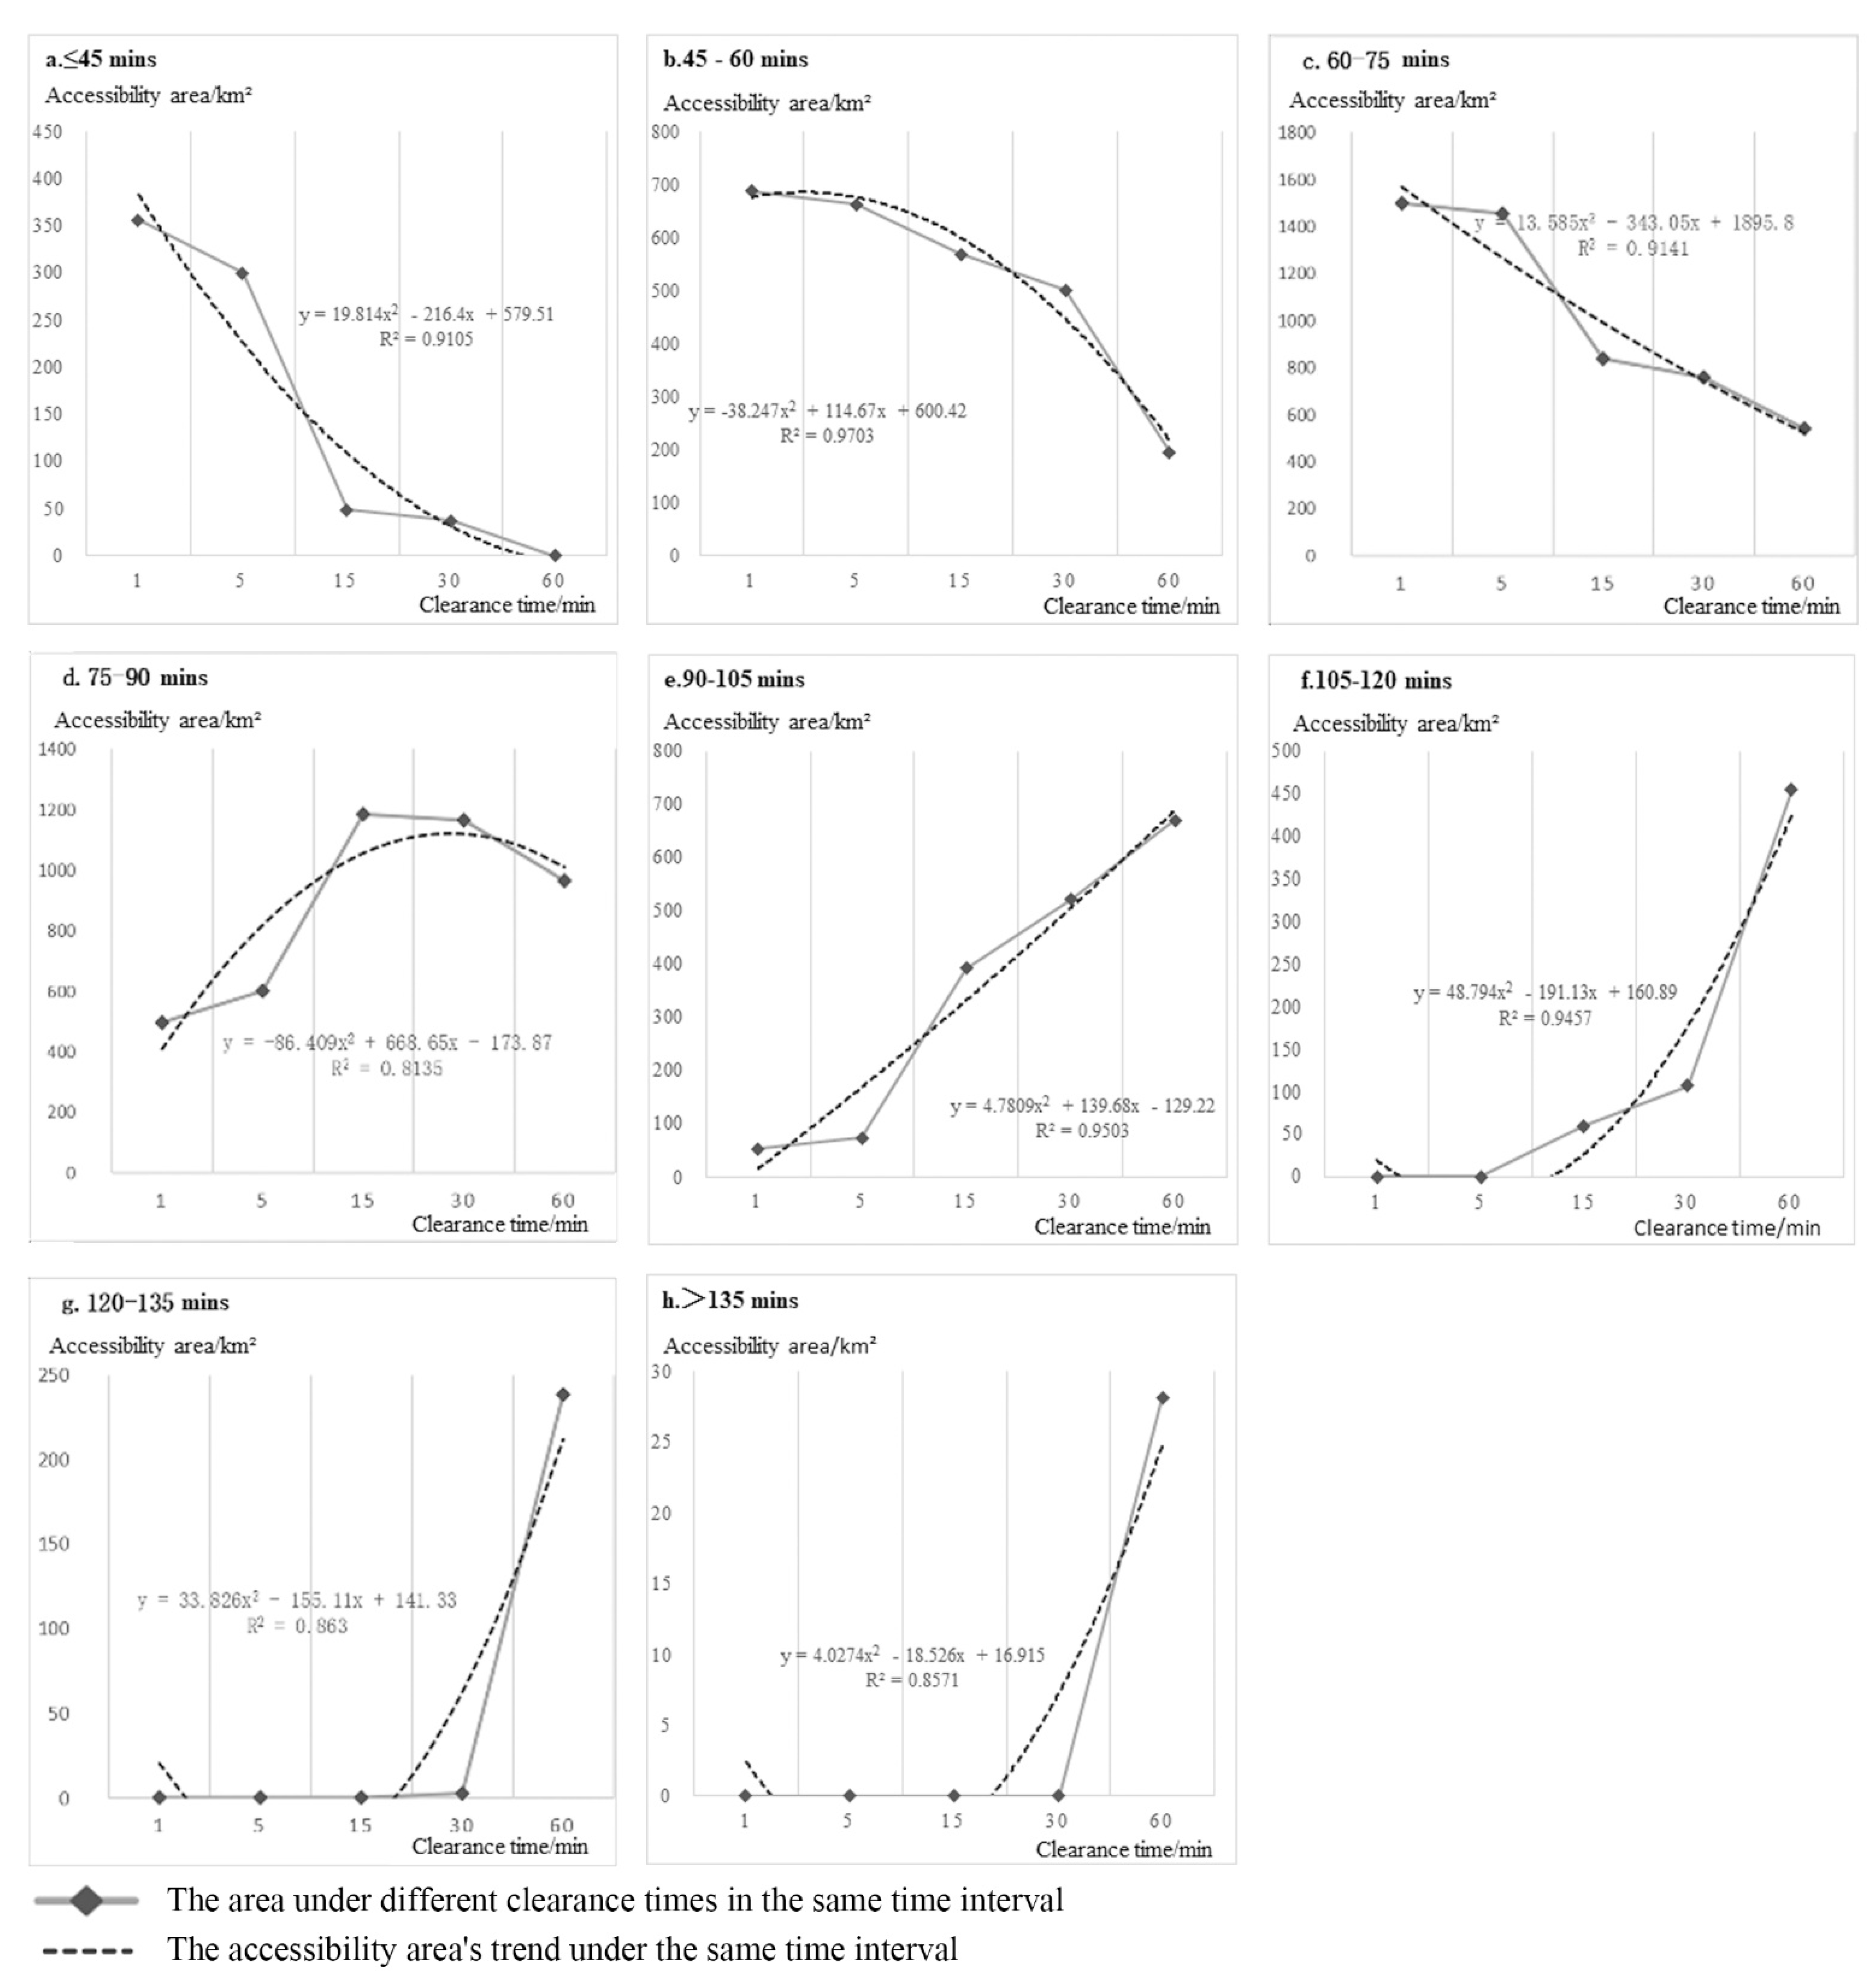
5.3. Comparison of Accessible Areas of the Urban Functional Areas in Shenzhen and Hong Kong under the Multi-Scenario Customs Clearance Simulation
The accessible area was measured in order to explore the rule of accessibility of the Shenzhen–Hong Kong connection in multiple scenarios. It was found that when the customs clearance time decreases, the area within 75 min expands and the area outside 75 min shrinks (
Table 6). Based on the accessible area, regression analysis was used to obtain the fitting function of the clearance time and the accessible area. The results indicate that the polynomial function fits the data rather well. (
Table 7). Accordingly, the clearance time and the accessible area can be represented as a unary quadratic function relationship. As the time increases, the accessible area of less than 75 min shows a downward trend, and the accessible area of greater than 75 min expands (
Figure 5). This result verifies, to some extent, that the customs clearance time has a negative impact on the accessibility of the two cities’ transportation systems and that reducing the institutional cost of customs clearance can accelerate the interactions between the two places. Thus, the 75-min mark was selected as the cut-off point for measuring the quality of accessibility.
In the context of overcoming administrative barriers, the transportation network is the backbone of a city, and the industrial structure is the heart of the city. Accordingly, in order to reduce wasted time, we need to optimize industrial growth and its spatial layout and the construction of transportation facilities. Examples include allocating production factors in the industry, opening up the upstream and downstream industrial chains, expanding and reinforcing advantageous industrial clusters, and creating an industrial ecosystem with no boundaries. In terms of transportation, at a given distance, we should consider boosting the convenience of transportation through intelligence and promoting the construction of a highly efficient, multi-hierarchy integrated system.
6. Discussion
According to the simulation, the accessible area within 75 min of Shenzhen and Hong Kong increases as the customs clearance time decreases, whereas the reachable area outside 75 min increases as the customs clearance time increases. Accordingly, the 75-min mark was used to distinguish between excellent and mediocre accessibility. The commute time contour was divided into three categories (45 min, 60 min, and 75 min). Moreover, we regarded commute time as one of the critical factors that affect commuting comfort. Taking into account the comfortable commute time in Beijing and Shanghai, the relationship between commute time and comfort in the Shenzhen–Hong Kong international dual-core metropolis was divided into four intervals (
Table 8).
As China’s economy enters an innovation-driven stage, innovative collaboration between Shenzhen and Hong Kong will play a leading role in the GBA’s growth. As industrial development is the cornerstone of a city’s prosperity, fine industrial division becomes inevitable. If we wish to reduce the connection time by a larger amount, we should evaluate the industrial distribution and functional structure even after eliminating the barriers to customs clearance at ports. Examples include improving the industrial chain’s modernization, strengthening the industrial cluster, and intensifying industrial cooperation. Consequently, four categories of POI data were established for the kernel density analysis (industrial, business, commercial, and residential). Moreover, commuting accessibility analysis of several functional areas was carried out to investigate commuting comfort with the assumption of no customs clearance barriers.
6.1. The Coverage Region and Type of Accessibility of Commercial Districts in Shenzhen and Hong Kong
Shenzhen’s commercial area is mostly concentrated within Futian District, followed by Luohu District. Hong Kong’s commercial area is concentrated within Yau Tsim Mong District, Kowloon City District, Sham Shui Po District, Kwun Tong District, Wan Chai District, and the Central and Western Districts. The distance between the two cities’ CBDs is between 60 and 75 min, while the commercial districts of Hong Kong’s Tuen Mun District, Yuen Long District, and Shenzhen Guangming District are accessible within greater than 75 min (
Figure 6a). These results indicate that the majority of cross-border commerce workers commute for more than an hour every day, which falls outside the average range of comfortable commute times.
6.2. The Coverage Region and Type of Accessibility of Business Districts in Shenzhen and Hong Kong
The business district of Shenzhen is more dispersed than that of Hong Kong. The comfortable zone (45 min) includes Shenzhen’s Futian District and Luohu District and Hong Kong’s North District and Kwun Tong District. Shenzhen’s Guangming District and Hong Kong’s Yuen Long District and Tuen Mun District all lie in the exhaustion zone (greater than 75 min). The other locations generally lie in the uncomfortable zone (60–75 min) (
Figure 6b). The commuting distance is lengthened due to the poor transit links between Shenzhen and Hong Kong. Therefore, it is vital to include a rapid and convenient mode of transportation between the two cities in the future blueprint.
6.3. The Coverage Region and Type of Accessibility of Residential Districts in Shenzhen and Hong Kong
Shenzhen’s residential area is more scattered, whereas Hong Kong’s is more agglomerated. The residential areas in the two cities are accessible within 60–75 min (
Figure 6c). In Shenzhen, the primary agglomeration areas are Futian District and Longhua District, and the regions beyond the customs area are scattered. However, from the perspective of the overall distribution pattern of commerce, business, and industry, the distribution of residences is rather acceptable, and the commute time will not be excessive. In Hong Kong, most of the functional areas are concentrated within a single location. The primary urban region is where commercial, business, residential, and industrial areas all congregate. The commute time of employees also lies within the moderately comfortable range. The commute time for cross-border employees—who reside in Shenzhen but work in Hong Kong—is more than one hour. Therefore, after transportation optimization, commercial and residential zones should be put into the layout of the residential area near the border and subway stations, high-speed railway stations, and other transportation stations while taking into consideration the demands of cross-border employees.
6.4. The Coverage Region and Type of Accessibility of Industrial Districts in Shenzhen and Hong Kong
Shenzhen’s industrial regions are mainly concentrated within Guangming District and Longhua District, followed by Longgang District and Pingshan District. Hong Kong’s industrial regions are concentrated within Tuen Mun District, Shatin District, Tsuen Wan District, Kwai Tsing District, Wong Tai Sin District, and Kwun Tong District, with a small area in Kowloon City. These industrial zones in the two cities have a traffic time of greater than 75 min, putting them in the exhaustion zone (
Figure 6d). The distance between the two cities’ primary industrial agglomeration areas is so great that it harms production cooperation and agglomeration effects. Most factories in Hong Kong have relocated to the Chinese mainland, but the city still has a small number of garment, toy, and knitting factories. In order to maximize the use of space, most of them are situated in industrial buildings or industrial parks. On the other hand, most of the factories in Shenzhen are located beyond the city’s customs area, and the distribution is rather scattered. In future industrial planning, for cross-border cooperation among industries, a pilot cooperation area in the junction area of the two cities is needed in order to promote interactions between enterprises, promote the linkage of upstream and downstream industries, and build an intimate cooperative relationship. In the layout of the industrial region, it is recommended that the area outside Shenzhen’s customs area integrate scattered industrial areas and encourage industrial transformation and upgrading.
Therefore, when the customs clearance barriers are eliminated, the commuting comfort of the two cities’ functional areas will mostly lie within the average range. Other unreachable places can decrease the commute time between the two cities through industrial cooperation, the land use layout, and transportation connections. It is critical to construct a comfortable (45-min) living circle, focus on building a smart city, develop the region holistically, fully utilize Shenzhen’s primary and secondary industries and Hong Kong’s financial and service industries, and continuously enhance Shenzhen and Hong Kong’s role as a core engine. In addition, it is also important to integrate idle land, increase land-use efficiency, rationally allocate land for various functions, and encourage industry–city–people integration. Then, it will be vital to strengthen and refine urban management, promote the seamless connection of various modes of transportation, and accelerate the interconnection between Shenzhen Connect and Octopus in order to build an efficient and integrated multi-level transportation system.
7. Conclusions
Based on POI and subway data on Shenzhen and Hong Kong, this paper carried out an accessibility and kernel density analysis to simulate the commute comfort and accessibility in a twin-city functional area under various customs clearance scenarios and identify the accessibility patterns and barriers to the facilitation of urban functional areas when clearing customs in an international dual-core metropolis. The results are as follows. First, the 75-min traffic (commuting) time was taken to be the turning point of the efficiency of the Shenzhen–Hong Kong connection, while the customs clearance time and the accessible areas both showed the shape of a parabolic function with an upward opening. Second, through a connectivity comparison, it was discovered that the accessibility of Shenzhen’s main urban area is 15–20 min greater than that of Hong Kong’s main urban area. Third, inhabitants in Shenzhen and Hong Kong spend an average of 60–75 min commuting between business, commercial, residential, and industrial areas, which lies in the uncomfortable range. Accordingly, it is critical to increase the efficiency of the Shenzhen–Hong Kong customs clearance system and reduce customs clearance costs in order to promote the integration of Shenzhen and Hong Kong, implement the national strategy of dual circulation and innovation-driven development, and efficiently drive the coordinated construction of the GBA.
At the macro-level, in terms of top-level design, we should further connect the system and standards in the two cities and also encourage information sharing. An inclusive and precise preference should be given to people commuting between Shenzhen and Hong Kong. Special channels and credit channels should be established for businessmen and scientists. Employees and employers should be treated equally in Guangdong, Hong Kong, and Macao, and the procedures for entrance and exit applications and residence visas should be simplified. The recognition of personnel information between Hong Kong and the Chinese mainland should be sped up, customs clearance procedures should be simplified, and the transit time cost for local citizens should be reduced. Then, the co-construction of transportation systems and infrastructure in Shenzhen and Hong Kong should be steadily encouraged. We should build an integrated Shenzhen–Hong Kong subway network and promote its seamless connection. We should promote the recognition of metro cards and travel codes in the two cities, optimize the language system of the transportation and transfer service systems between the two places, and promote the realization of a 45-min living circle in the core area of Shenzhen and Hong Kong. We should design an innovative development plan for ports in Shenzhen and Hong Kong and develop an advanced layout for urban rail connections between Shenzhen and Hong Kong. Additionally, we should coordinate cross-border regional planning and deepen the two cities’ industrial integration. We should steadily promote Hong Kong and Shenzhen’s collaborative construction of two technological innovation cooperation zones in Qianhai and Hetao, rationally allocate all spatial elements, and build a region-wide industrial chain. We should strengthen the connection between the two cities’ urban planning systems, coordinate production, living, and ecological spatial planning in cross-border regions, and transform the marginal areas into economically developed areas in order to effectively reduce the commute time cost between the two places.
From the micro-operational perspective, we should first further optimize the present customs clearance system in order to improve its robustness. Special customs clearance channels can be set up for products in Shenzhen and Hong Kong’s shopping malls, which can go straight to the customs area. Customs clearance applications can be pre-processed at selected subway stations or offices and the capacity of customs clearance channels can be properly increased during holidays, busy tourist seasons, unusual emergencies, and rush hour. The cross-border information platform and the accuracy of customs clearance technology can be improved. A smart information platform and a cross-border personnel interaction database can be established and improved, and customs clearance procedures can be simplified. The customs clearance process at ports can be optimized, and the Shenzhen–Hong Kong customs clearance model can be transitioned from the “two inspections at two ports” mode to the “two inspections at one port” mode or even the “unilateral inspection and release” mode. The efficiency and accuracy of the inspection of electronic equipment used at customs can be improved, and the mode of inspection can be changed from simultaneous personnel and cargo inspection to automatic detection and interception.
Furthermore, this study has room for potential improvement, and there is an urgent need for further research in this field. Theoretically, we should evaluate the external costs of the current situation, combine more detailed demographical and spatial data, and obtain detailed commuting scenario data in order to identify the impact of accessibility on work and life in more detail. In the future, more questionnaire and social survey studies should be carried out in order to reveal the impact on the accessibility of commutes. Methodologically, previous research was limited by a lack of demographic and social survey data and data on different situations, which could be improved in future research. In particular, the commute time can be influenced by more complicated scenarios. Therefore, our future research will incorporate more data on complicated situations into the model in order to obtain more accurate results.


