
The Impact of Transport Infrastructure on Rural Industrial Integration: Spatial Spillover Effects and Spatio-Temporal Heterogeneity


Abstract
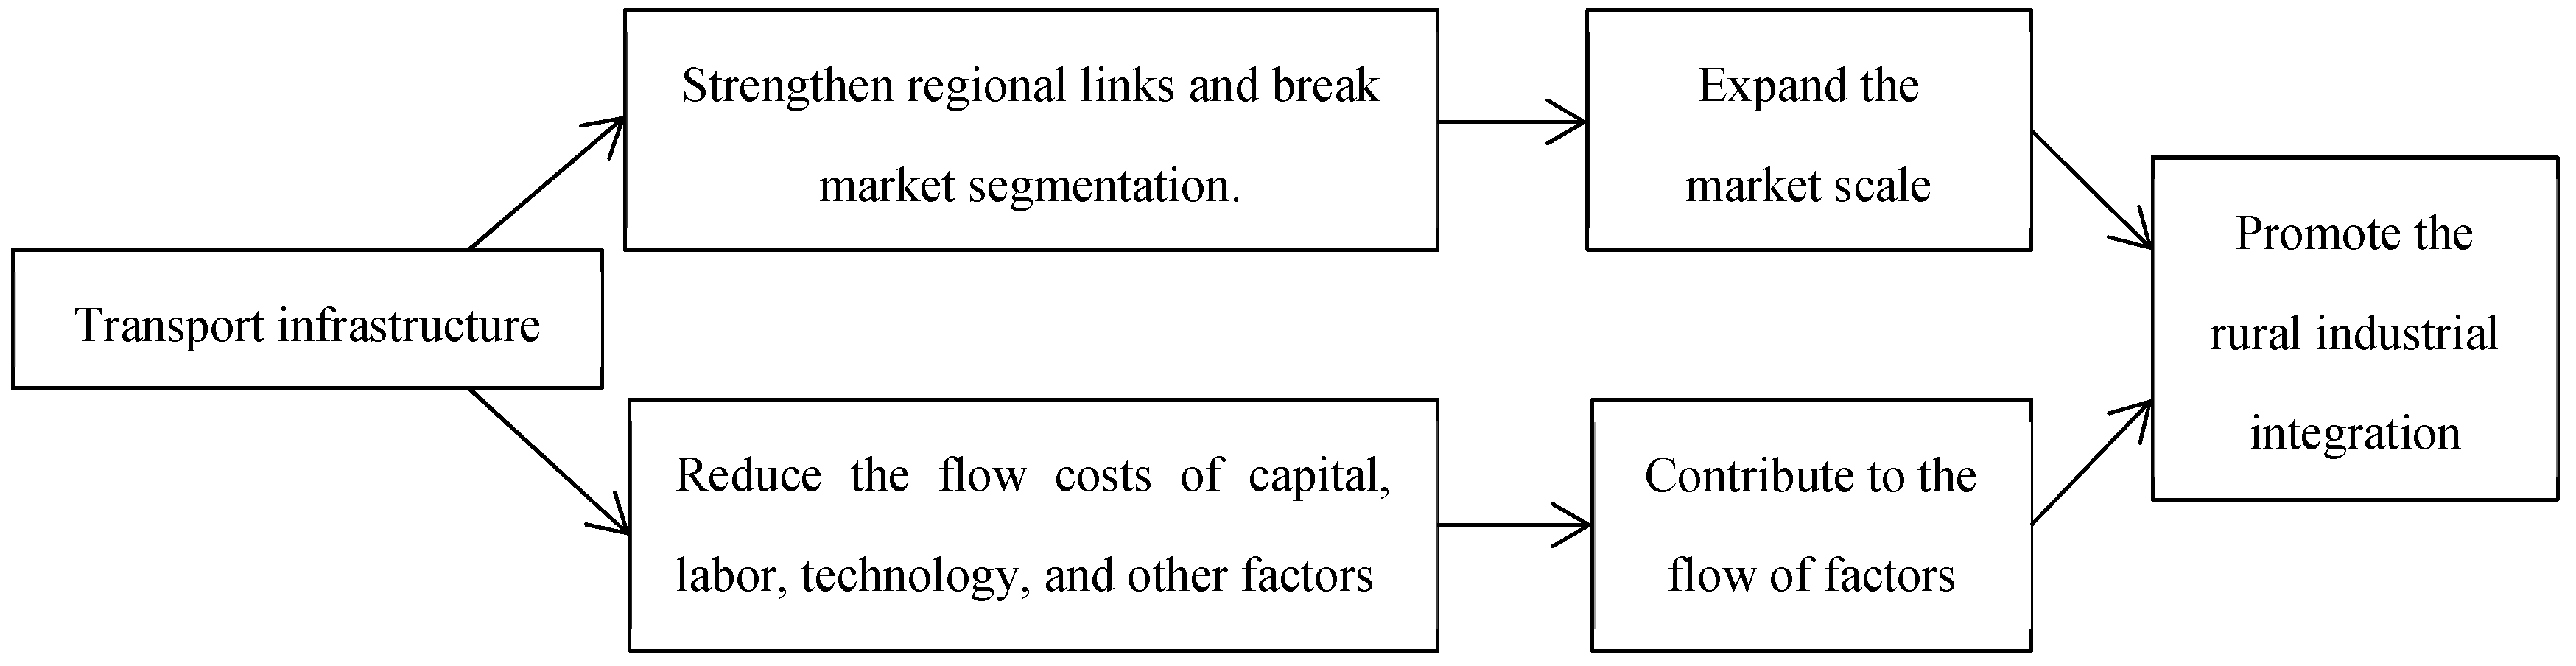
:1. Introduction
2. Research Hypothesis
3. Research Methodology
3.1. Econometric Model
3.2. Measurement Method
3.3. Evaluation Index System for the Development Quality of Rural Industrial Integration
- improvement of the general development level;
- completeness of industrial chains;
- diversity of functions;
- the richness of business modes;
- close linkage of interests; and
- integration of industries and cities.
- intra-agricultural integration;
- extension of the agricultural industry chain;
- expansion of agricultural multifunctionality;
- industrial technology penetration; and
- interest linkage mechanism.
3.4. Data and Sample
4. Results
4.1. Development Quality of China’s Rural Industrial Integration
4.2. The Basic Regression Results
4.2.1. Spatial Autocorrelation Analysis
4.2.2. Benchmark Regression Result
4.3. Heterogeneity Analysis
4.3.1. Analysis of the Heterogeneity of the Time Dimension
4.3.2. Analysis of the Heterogeneity of the Spatial Dimension
5. Discussion
5.1. China’s Rural Industrial Integration Development Pattern
5.2. The Impact of Transport Infrastructure on the Quality of Rural Industrial Integration
6. Conclusions
Author Contributions
Funding
Institutional Review Board Statement
Informed Consent Statement
Data Availability Statement
Conflicts of Interest
References
- Rosenberg, N. Technological change in the machine tool industry, 1840–1910. J. Econ. Hist. 1963, 23, 414–443. Available online: http://www.jstor.com/stable/2116207 (accessed on 5 April 2022). [CrossRef]
- Tian, X.; Wu, M.; Ma, L.; Wang, N. Rural finance, scale management and rural industrial integration. China Agric. Econ Rev. 2020, 12, 349–365. [Google Scholar] [CrossRef]
- Bhattacharjee, P.S.; Saha, D.; Mukherjee, A. An approach for location area planning in a personal communication services network (pcsn). IEEE Trans. Wirel. Commun. 2004, 3, 1176–1187. [Google Scholar] [CrossRef]
- Pg, A.; Vm, B. Technology and international competitiveness: The interdependence between manufacturing and producer services. Struct. Chang. Econ. Dyn. 2005, 16, 489–502. [Google Scholar] [CrossRef]
- Li, L.; Jing, Q. Research on the dynamic mechanism of rural network-based industrial integration—Based on the perspective of urban-rural interaction. Agric. Econ. Issues 2019, 8, 129–138. [Google Scholar] [CrossRef]
- Morosini, P. Industrial Clusters, Knowledge Integration and Performance. World Dev. 2004, 32, 305–326. [Google Scholar] [CrossRef]
- Luo, S.; He, K.; Zhang, J. Can road construction promote agricultural growth?—An analysis based on the perspective of cross-area operation of agricultural machinery. Chin. Rural Econ. 2018, 6, 67–83. Available online: https://kns.cnki.net/kcms/detail/detail.aspx?FileName=ZNJJ201806005&DbName=CJFQ2018 (accessed on 6 August 2021).
- Donaldson, D. Railroads of the Raj: Estimating the Impact of Transportation Infrastructure. Am. Econ. Rev. 2010, 32, 16487. [Google Scholar] [CrossRef] [Green Version]
- Baldwin, R.E.; Martin, P. Agglomeration and regional growth. Handb. Reg. Urban Econ. 2003, 4, 2671–2711. [Google Scholar] [CrossRef]
- Atack, J.; Bateman, F.; Haines, M.; Margo, R.A. Did Railroads Induce or Follow Economic Growth? Soc. Sci. Hist. 2016, 34, 171–197. [Google Scholar] [CrossRef]
- Agrawal, A.; Galasso, A.; Oettl, A. Roads and innovation. Rev. Econ. Stat. 2014, 99, 417–434. [Google Scholar] [CrossRef]
- Tang, D.; Mao, M.; Shi, J.; Hua, W. The Spatio-Temporal Analysis of Urban-Rural Coordinated Development and Its Driving Forces in Yangtze River Delta. Land 2021, 10, 495. [Google Scholar] [CrossRef]
- Fan, X.; Song, D.; Zhao, X. Does infrastructure development break domestic market segmentation? Econ. Res. 2017, 52, 20–34. Available online: https://kns.cnki.net/kcms/detail/detail.aspx?FileName=JJYJ201702003&DbName=CJFQ2017 (accessed on 5 May 2021).
- Qi, G.; Shi, W.; Lin, K.-C.; Yuen, K.F.; Xiao, Y. Spatial spillover effects of logistics infrastructure on regional development: Evidence from China. Transport. Res. Part A Policy Pract. 2020, 135, 96–114. [Google Scholar] [CrossRef]
- Karayalcin, C.; Pintea, M. The role of productivity, transportation costs, and barriers to intersectoral mobility in structural transformation. Econ. Model. 2022, 108, 105759. [Google Scholar] [CrossRef]
- Prus, P.; Sikora, M. The Impact of Transport Infrastructure on the Sustainable Development of the Region—Case Study. Agriculture 2021, 11, 279. [Google Scholar] [CrossRef]
- Song, M.; Wang, S.; Fisher, R. Transportation, iceberg costs and the adjustment of industrial structure in China. Transport. Res. D Transp. Environ. 2014, 32, 278–286. [Google Scholar] [CrossRef]
- Liu, C.; Wu, Q.; Liu, Q. Transportation infrastructure, market accessibility and firm productivity—A competition and resource allocation-based perspective. Econ. Res. 2020, 55, 140–158. Available online: https://d.wanfangdata.com.cn/periodical/jjyj202007010 (accessed on 5 May 2021).
- Cao, Y.; Yang, Y.; Xiang, H. A study on the impact of transportation infrastructure on total factor productivity of service industry—Based on productive capital stock data. Explor. Econ. Issues 2021, 42, 37–50. Available online: https://kns.cnki.net/kcms/detail/detail.aspx?FileName=JJWS202104005&DbName=DKFX2021 (accessed on 5 April 2022).
- Arnold, J.; Bassanini, A.; Scarpetta, S. Solow or lucas? testing speed of convergence on a panel of oecd countries. Res. Econ. 2011, 65, 110–123. [Google Scholar] [CrossRef] [Green Version]
- Fogel, R.W. Railroads and American Economic Growth: Essays in Econometric History. Can. J. Econ. Polit. Sci. 1965, 31, 611–612. [Google Scholar] [CrossRef]
- Faber, B. Trade Integration, Market Size, and Industrialization: Evidence from China’s National Trunk Highway System. Rev. Econ. Stud. 2014, 81, 1046–1070. [Google Scholar] [CrossRef] [Green Version]
- Cechella, C.; Silva, J.R.; Dentinho, T.P. Explaining Trade and FDI Relationships in a Gravitational Model. Stud. Reg. Sci. 2009, 39, 41–52. [Google Scholar] [CrossRef]
- Donaldson, D.; Hornbeck, R. Railroads and American Economic Growth: A “Market Access” Approach. Q. J. Econ. 2016, 131, 799–858. [Google Scholar] [CrossRef] [Green Version]
- Li, J.; Wen, J.; Jiang, B. Spatial Spillover Effects of Transport Infrastructure in Chinese New Silk Road Economic Belt. Int. J. E-Navig. Marit. Econ. 2017, 6, 1–8. [Google Scholar] [CrossRef]
- Ke, S. Determinants of Economic Growth and Spread-backwash Effects in Western and Eastern China. Asian Econ. J. 2010, 24, 179–202. [Google Scholar] [CrossRef]
- Herzog, I. National Transportation Networks, Market Access, and Regional Economic Growth. J. Urban Econ. 2021, 122, 103316. [Google Scholar] [CrossRef]
- Boarnet, M.G. Spillovers and the Locational Effects of Public Infrastructure. J. Reg. Sci. 1998, 38, 381–400. [Google Scholar] [CrossRef]
- Bardaka, E.; Delgado, M.S.; Florax, R. A spatial multiple treatment/multiple outcome difference-in-differences model with an application to urban rail infrastructure and gentrification. Transport. Res. Part A Policy Pract. 2019, 121, 325–345. [Google Scholar] [CrossRef]
- Nathaniel, B.; Skrede, G.K.; Kyle, B. Space Is More than Geography: Using Spatial Econometrics in the Study of Political Economy. Int. Stud. Q. 2006, 50, 27–44. [Google Scholar] [CrossRef]
- Zhang, T.; Li, M.; Xu, Y. The Construction and Empirical Study of Rural Revitalization Evaluation Index System. Manag. World 2018, 34, 99–105. Available online: https://kns.cnki.net/kcms/detail/detail.aspx?FileName=GLSJ201808010&DbName=CJFQ2018 (accessed on 24 April 2021).
- Fu, L.; Li, J. Comprehensive evaluation and research on China’s public culture service system based on AHP method and entropy weight method. J. Chem. Pharm. Res. 2014, 6, 230–238. Available online: http://jocpr.com/articles/comprehensive-evaluation-and-research-on-chinas-public-culture-service-system-based-on-ahp-method-and-entropy-weight-met.pdf (accessed on 24 April 2021).
- Li, J. Weight Determining of Factors Influencing Grain Output Based on Entropy Weight Method. Asian Agric. Res. 2012, 4, 7–9. Available online: http://www.cnki.com.cn/Article/CJFDTotal-AAGR201203004.htm (accessed on 24 April 2021).
- Xiao, J.; Feng, M. Transmutation of rural industrial integration: Interaction and co-evolution of interest linkages and production factors. Financ. Econ. Sci. 2020, 9, 64–78. Available online: https://kns.cnki.net/kcms/detail/detail.aspx?FileName=CJKX202009007&DbName=DKFX2020 (accessed on 24 April 2021).
- Zhang, L.; Luo, X.; Wang, Y. Integrated development of rural industries in counties and farmers’ quality of life-Empirical evidence from 37 districts and counties in Chongqing. J. Macro Qual. Res. 2021, 9, 100–113. Available online: https://kns.cnki.net/kcms/detail/detail.aspx?FileName=HGLY202102009&DbName=CJFQ2021 (accessed on 5 April 2022).
- Sun, X.; Zhang, G. The opening of high-speed rail, environmental pollution and urban economic development. Soft Sci. 2021, 35, 103–108. [Google Scholar] [CrossRef]
- Wu, Z. New requirements and path innovation of human capital development based on rural revitalization. Theory Reform 2018, 6, 44–52. [Google Scholar] [CrossRef]
- Ma, Y.; Wang, W. The “local-neighborhood” effect of environmental decentralization and local government competition on green technology innovation. China Manag. Sci. 2021, 29, 68–80. [Google Scholar] [CrossRef]
- Chen, C.; Li, S.; Tian, Y. Statistical evaluation of rural industrial integration development level. Stat. Decis. 2021, 37, 164–169. Available online: https://kns.cnki.net/kcms/detail/detail.aspx?FileName=TJJC202121035&DbName=DKFX2021 (accessed on 5 April 2022).
- Yu, T. Evaluation and Analysis of the Integration and Development of Rural Primary, Secondary and Tertiary Industries. J. Macro Qual. Res. 2020, 11, 76–85. Available online: https://kns.cnki.net/kcms/detail/detail.aspx?FileName=JJGA202011007&DbName=DKFX2020 (accessed on 5 April 2022).
- César, D.; Hidekazu, I. Regions and material flows: Investigating the regional branching and industry relatedness of port traffic in a global perspective. J. Econ. Geogr. 2016, 16, 805–830. [Google Scholar] [CrossRef] [Green Version]
- Coar, A.K.; Demir, B.; Ghose, D.; Young, N. Road capacity, domestic trade and regional outcomes. J. Econ. Geogr. 2021, lbab045. [Google Scholar] [CrossRef]
- Tunde, A.M.; Adeniyi, E.E. Impact of Road Transport on Agricultural Development: A Nigerian Example. Ethiop. J. Environ. Stud. Manag. 2012, 5, 232–238. [Google Scholar] [CrossRef] [Green Version]
- Damania, R.; Berg, C.; Russ, J.; Barra, A.F.; Nash, J.; Ali, R. Agricultural Technology Choice and Transport. Am. J. Agric. Econ. 2017, 99, 265–284. [Google Scholar] [CrossRef] [Green Version]
- Akangbe, J.A.; Oloruntoba, O.O.; Achem, B.; Komolafe, S. An Appraisal of Transportation Facilities Effects on Agricultural Development in Moro Local Government Area, Kwara State, Nigeria. Ethiop. J. Environ. Stud. Manag. 2013, 6, 191–200. [Google Scholar] [CrossRef] [Green Version]
- Higgins, A.; McFallan, S.; McKeown, A.; Bruce, C.; Chilcott, C. Informing major government programs for rural transport infrastructure in northern Australia. Rangel. J. 2018, 40, 341. [Google Scholar] [CrossRef]
- Tong, T.; Yu, T.; Cho, S.; Jensen, K.; De La Torre Ugarte, D. Evaluating the spatial spillover effects of transportation infrastructure on agricultural output across the United States. J. Transp. Geogr. 2013, 30, 47–55. [Google Scholar] [CrossRef]
- Dong, X.; Zheng, S.; Kahn, M.E. The Role of Transportation Speed in Facilitating High Skilled Teamwork Across Cities. J. Urban Econ. 2019, 115, 103212. [Google Scholar] [CrossRef]
- Hornbeck, R.; Rotemberg, M. Railroads, Reallocation, and the Rise of American Manufacturing. In 2019 Meeting Papers; National Bureau of Economic Research: Cambridge, MA, USA, 2019. [Google Scholar] [CrossRef] [Green Version]
- Song, D.; Yao, C. Do High-Speed Rail Operation and Economic Coordination Committee Break the Market Segmentation in Urban Agglomerations—Evidence from the Yangtze River Delta Urban Agglomeration. Econ. Theory Bus. Manag. 2019, 38, 4. Available online: http://en.cnki.com.cn/Article_en/CJFDTotal-JJLL201902004.htm (accessed on 5 May 2021).
- Han, S.; Han, F.; Zhang, S.; Li, Y.; Zhang, J. Analysis on the Coupling Effect of Xi’an-Yinchuan High Speed Railway and Economy Development in Shanxi-Gansu-Ningxia District Railway and Economy Development in Shanxi-Gansu-Ningxia District. IOP Conf. Ser. Earth Environ. Sci. 2021, 693, 012131. [Google Scholar] [CrossRef]
- Pradhan, R.P.; Bagchi, T.P. Effect of transportation infrastructure on economic growth in India: The VECM approach. Res. Transp. Econ. 2013, 38, 139–148. [Google Scholar] [CrossRef]
- Koster, H.; Tabuchi, T.; Thisse, J.F. To be connected or not to be connected? The role of long-haul economies. J. Econ. Geogr. 2021, 22, 711–753. [Google Scholar] [CrossRef]
- Gao, J.; Jun, B.; Pentland, A.S.; Zhou, T.; Hidalgo, C.A. Spillovers across industries and regions in China’s regional economic diversification. Reg. Stud. 2021, 55, 1311–1326. [Google Scholar] [CrossRef]
- Huang, Y.; Xu, W. Spatial and temporal heterogeneity of the impact of high-speed railway on urban economy: Empirical study of Chinese cities. J. Transp. Geogr. 2021, 91, 102972. [Google Scholar] [CrossRef]
- Banerjee, A.; Duflo, E.; Qian, N. On the Road: Access to Transportation Infrastructure and Economic Growth in China. J. Dev. Econ. 2020, 145, 102442. [Google Scholar] [CrossRef] [Green Version]
- Petersen, E.R.; Taylor, A.J. An investment planning model for a new North-Central railway in Brazil. Transport. Res. Part A Policy Pract. 2001, 35, 847–862. [Google Scholar] [CrossRef]
- Legaspi, J.; Hensher, D.; Wang, B. Estimating the wider economic benefits of transport investments: The case of the Sydney North West Rail Link project. Case Stud. Transp. Policy 2015, 3, 182–195. [Google Scholar] [CrossRef]
- Fremont, A.; Franc, P. Hinterland transportation in Europe: Combined transport versus road transport. J. Transp. Geogr. 2010, 18, 548–556. [Google Scholar] [CrossRef] [Green Version]
- Lu, Y.; Zhao, J. Disentangling Treatment Effect, Spatial Spillover Effect and Quantile Effect: An Empirical Study of Beijing-Shanghai High Speed Rail. World Reg. Stud. 2019, 1, 47–57. Available online: http://en.cnki.com.cn/Article_en/CJFDTotal-SJDJ201901006.htm (accessed on 5 May 2021).


| Tier 1 Indicators | Secondary Indicators | Unit |
|---|---|---|
| Intra-agricultural integration | Machine cultivation area/Total sown area of crops | % |
| Total output value of agriculture, forestry, animal husbandry, and fishery/Number of people employed in agriculture, forestry, animal husbandry, and fishery | billion dollars | |
| Extension of the agricultural industry chain | Total power of agricultural machinery/Total sown area of crops | kw/ha |
| Total output value of agriculture, forestry, and fishery services/Total output value of agriculture, forestry, animal husbandry, and fishery | % | |
| Expansion of agricultural multifunctionality | Agricultural fertilizer application rates/Total sown area of crop | ton/ha |
| Grain sown area/Total sown area of crops | % | |
| Industrial technology penetration | Number of rural broadband connections/Number of people in villages | pcs |
| Mobile-phone penetration rate | pcs | |
| Interest linkage mechanism | Per capita disposable income of farmers | dollars |
| Urbanization rate | % |
| Variables | Observations | Mean | SD |
|---|---|---|---|
| Road density | 341 | 8502.847 | 4903.305 |
| Rail density | 341 | 230.901 | 181.726 |
| Industrial structure | 341 | 0.164 | 0.082 |
| Economic size | 341 | 0.033 | 0.027 |
| Technical support | 341 | 0.032 | 0.023 |
| Human capital levels | 341 | 841.367 | 438.795 |
| Rural production infrastructure | 341 | 0.195 | 0.505 |
| Region | 2009 | 2014 | 2019 | Region | 2009 | 2014 | 2019 |
|---|---|---|---|---|---|---|---|
| Beijing | 0.413 | 0.555 | 0.532 | Hubei | 0.147 | 0.249 | 0.430 |
| Tianjin | 0.252 | 0.324 | 0.468 | Hunan | 0.155 | 0.246 | 0.416 |
| Hebei | 0.159 | 0.260 | 0.395 | Guangdong | 0.238 | 0.353 | 0.480 |
| Shanxi | 0.164 | 0.247 | 0.330 | Guangxi | 0.118 | 0.198 | 0.391 |
| Inner Mongolia | 0.175 | 0.279 | 0.339 | Hainan | 0.155 | 0.272 | 0.449 |
| Liaoning | 0.236 | 0.352 | 0.370 | Chongqing | 0.119 | 0.218 | 0.393 |
| Jilin | 0.182 | 0.264 | 0.295 | Sichuan | 0.099 | 0.205 | 0.387 |
| Heilongjiang | 0.178 | 0.287 | 0.408 | Guizhou | 0.096 | 0.170 | 0.298 |
| Shanghai | 0.296 | 0.356 | 0.492 | Yunnan | 0.096 | 0.167 | 0.288 |
| Jiangsu | 0.253 | 0.427 | 0.737 | Tibet | 0.138 | 0.219 | 0.289 |
| Zhejiang | 0.292 | 0.434 | 0.692 | Shaanxi | 0.152 | 0.244 | 0.380 |
| Anhui | 0.132 | 0.217 | 0.432 | Gansu | 0.194 | 0.252 | 0.372 |
| Fujian | 0.212 | 0.362 | 0.641 | Qinghai | 0.134 | 0.206 | 0.343 |
| Jiangxi | 0.151 | 0.224 | 0.396 | Ningxia | 0.166 | 0.240 | 0.373 |
| Shandong | 0.208 | 0.315 | 0.479 | Xinjiang | 0.152 | 0.259 | 0.423 |
| Henan | 0.137 | 0.230 | 0.371 | — | — | — | — |
| WL | WJ | WL | WJ | ||||||
|---|---|---|---|---|---|---|---|---|---|
| Year | Moran’s | Z-Statistic | Moran’s | Z-Statistic | Year | Moran’s | Z-Statistic | Moran’s | Z-Statistic |
| 2009 | 0.357 *** | 3.887 | 0.268 *** | 3.546 | 2015 | 0.243 *** | 3.718 | 0.167 *** | 3.259 |
| 2010 | 0.379 *** | 4.051 | 0.279 *** | 3.620 | 2016 | 0.239 *** | 3.981 | 0.172 *** | 3.666 |
| 2011 | 0.380 *** | 4.047 | 0.283 *** | 3.651 | 2017 | 0.230 *** | 3.952 | 0.166 *** | 3.666 |
| 2012 | 0.393 *** | 4.099 | 0.286 *** | 3.620 | 2018 | 0.220 *** | 4.024 | 0.163 *** | 3.875 |
| 2013 | 0.251 *** | 3.742 | 0.170 *** | 3.227 | 2019 | 0.217 *** | 4.023 | 0.171 *** | 4.071 |
| 2014 | 0.253 *** | 3.701 | 0.180 *** | 3.327 | — | — | — | — | — |
| Dependent Variable | Development Quality of Rural Industrial Integration | |||
|---|---|---|---|---|
| Model | (1) | (2) | (3) | (4) |
| Road density | 0.002 *** | 0.002 *** | ||
| (0.001) | (0.001) | |||
| Rail density | 0.122 *** | 0.113 *** | ||
| (0.034) | (0.034) | |||
| Industrial structure | 95.811 | 82.982 | 104.765 | 90.554 *** |
| (76.025) | (76.115) | (75.480) | (75.780) | |
| Economic size | 760.686 ** | 641.158 * | 868.599 *** | 739.884 ** |
| (330.345) | (332.125) | (328.876) | (331.561) | |
| Technical support | −387.933 | −250.578 | −566.292 | −403.901 |
| (429.949) | (427.758) | (430.711) | (429.340) | |
| Human capital levels | 0.042 *** | 0.037 *** | 0.047 *** | 0.041 *** |
| (0.012) | (0.012) | (0.012) | (0.012) | |
| Rural production infrastructure | 20.598 *** | 14.234 ** | 22.099 *** | 15.152 ** |
| (7.103) | (6.728) | (7.042) | (6.688) | |
| Regional fixed effects | Yes | Yes | Yes | Yes |
| Year fixed effects | Yes | Yes | Yes | Yes |
| rho | 0.393 *** | 0.450 *** | 0.413 *** | 0.464 *** |
| (0.063) | (0.071) | (0.062) | (0.071) | |
| sigma2_e | 663.127 *** | 665.060 *** | 625.520 *** | 658.203 *** |
| (51.578) | (51.649) | (50.854) | (51.169) | |
| LogL | 757.217 | 757.104 | 759.211 | −353.995 |
| R-squared | 0.552 | 0.610 | 0.651 | 0.687 |
| Dependent Variable | Development Quality of Rural Industrial Integration | |||
|---|---|---|---|---|
| Year | 2009–2013 | 2014–2019 | ||
| Model | (1) | (2) | (3) | (4) |
| Road density | 0.001 * | 0.003 ** | ||
| (0.001) | (0.001) | |||
| Rail density | 0.074 | 0.112 *** | ||
| (0.063) | (0.036) | |||
| Control variables | Yes | Yes | Yes | Yes |
| Regional fixed effects | Yes | Yes | Yes | Yes |
| Year fixed effects | Yes | Yes | Yes | Yes |
| rho | 0.172 | 0.162 | 0.470 *** | 0.493 *** |
| (0.106) | (0.109) | (0.073) | (0.071) | |
| LogL | −630.000 | −631.013 | −785.260 | −782.822 |
| R-squared | 0.003 | 0.022 | 0.432 | 0.544 |
| Dependent Variable | Development Quality of Rural Industrial Integration | |||
|---|---|---|---|---|
| Region | East | Midwest | ||
| Model | (1) | (2) | (3) | (4) |
| Road density | 0.006 *** | 0.002 * | ||
| (0.002) | (0.001) | |||
| Rail density | 0.008 | 0.153 *** | ||
| (0.103) | (0.039) | |||
| Control variables | Yes | Yes | Yes | Yes |
| Regional fixed effects | Yes | Yes | Yes | Yes |
| Year fixed effects | Yes | Yes | Yes | Yes |
| rho | 0.306 *** | 0.316 *** | 0.161 * | 0.225 ** |
| (0.082) | (0.083) | (0.096) | (0.095) | |
| LogL | −697.925 | −701.249 | −914.423 | −908.824 |
| R-squared | 0.064 | 0.061 | 0.712 | 0.730 |
Publisher’s Note: MDPI stays neutral with regard to jurisdictional claims in published maps and institutional affiliations. |
© 2022 by the authors. Licensee MDPI, Basel, Switzerland. This article is an open access article distributed under the terms and conditions of the Creative Commons Attribution (CC BY) license (https://creativecommons.org/licenses/by/4.0/).
Share and Cite
Zhang, H.; Wu, D. The Impact of Transport Infrastructure on Rural Industrial Integration: Spatial Spillover Effects and Spatio-Temporal Heterogeneity. Land 2022, 11, 1116. https://doi.org/10.3390/land11071116
Zhang H, Wu D. The Impact of Transport Infrastructure on Rural Industrial Integration: Spatial Spillover Effects and Spatio-Temporal Heterogeneity. Land. 2022; 11(7):1116. https://doi.org/10.3390/land11071116
Chicago/Turabian StyleZhang, Han, and Dongli Wu. 2022. "The Impact of Transport Infrastructure on Rural Industrial Integration: Spatial Spillover Effects and Spatio-Temporal Heterogeneity" Land 11, no. 7: 1116. https://doi.org/10.3390/land11071116