
Analysis of Land Use Optimization of Metro Station Areas Based on Two-Way Balanced Ridership in Xi’an


Abstract
:1. Introduction
- The expansion of theoretical research. Focusing on the basic theory of inbound and outbound ridership and station area land use, we deeply studied the internal mechanism between ridership and land use and enriched the theoretical system of station area land use optimization research.
- Innovation of technical means. Combined with multi-source data (cell phone signaling, built-up area GIS data) for analysis, a data processing model for analyzing ridership distribution was developed. The model focused more on the distribution characteristics of land-generated inbound ridership and attracted outbound ridership.
- Innovation in research methods. Through the study of relevant literature and data analysis, the influence mechanism and relationship model of inbound and outbound ridership and land use factors were established. On this basis, optimization research was carried out, a land use index optimization system under the guidance of the two-way balance of ridership was established, and specific optimization measures for land use in each station area are proposed.
2. Literature Review
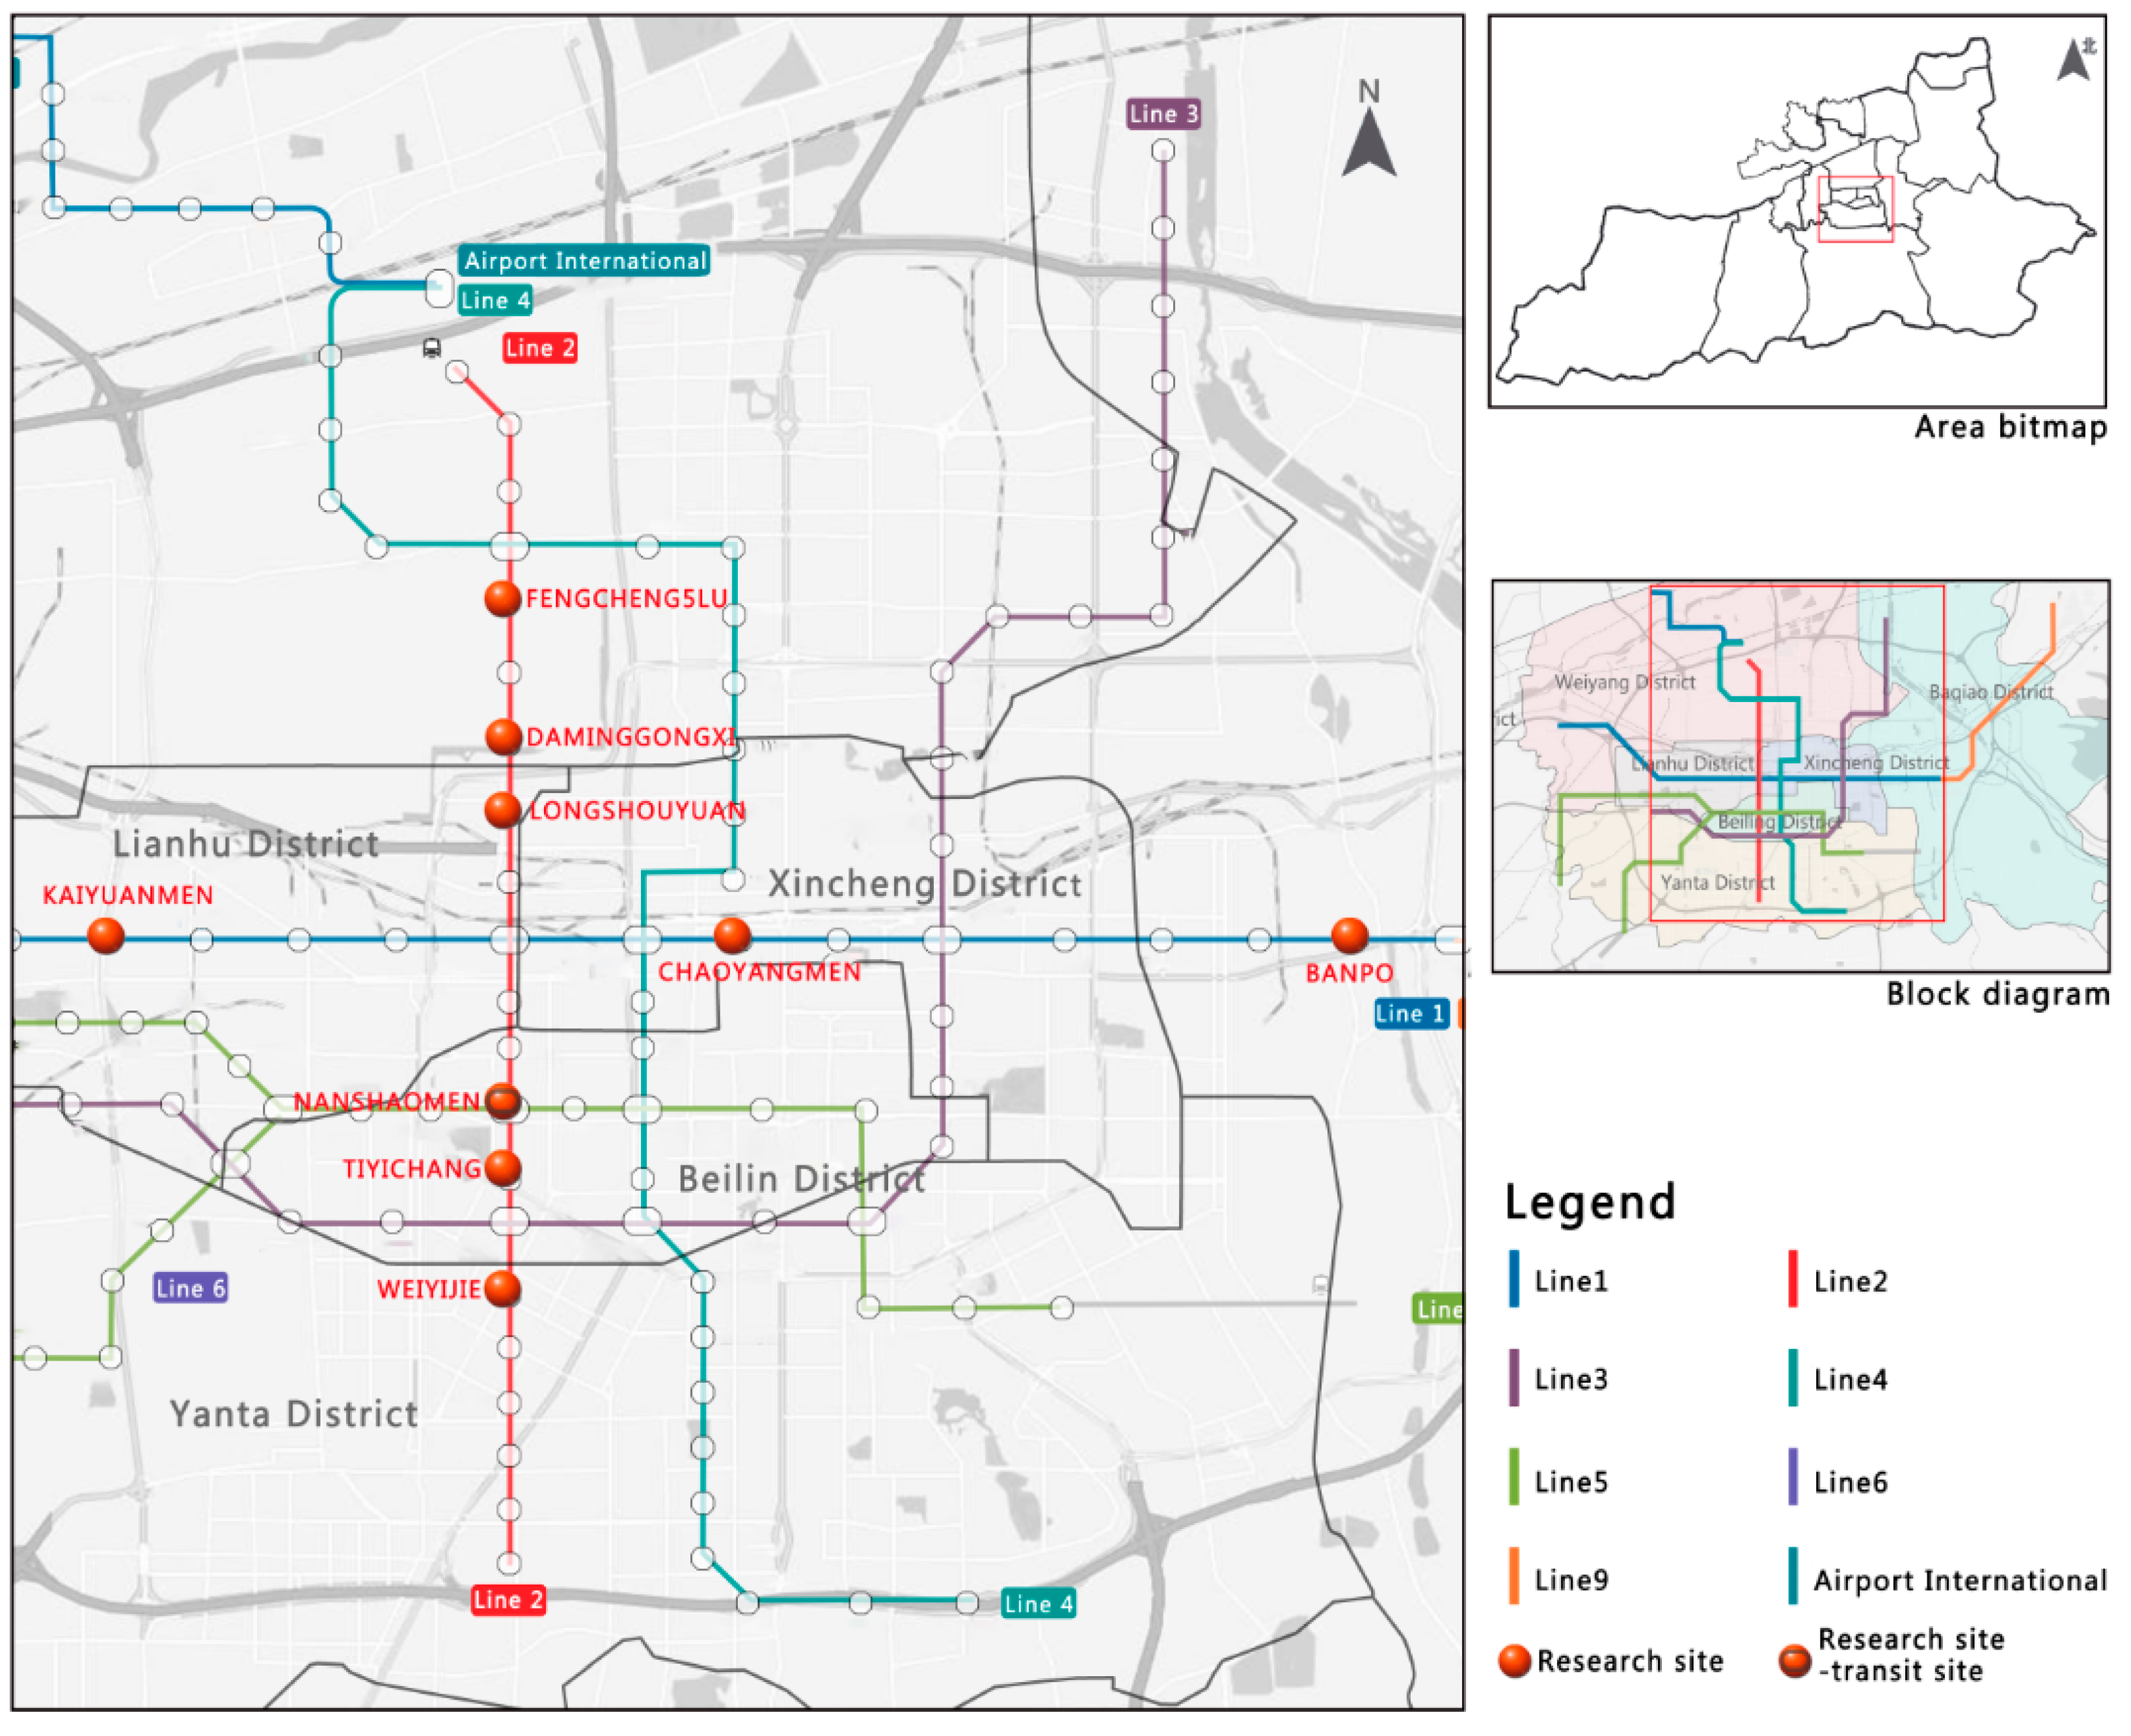
3. Study Area and Data Source
3.1. Study Area
- Stations outside the Third Ring Road in Xi’an. The metro station areas outside the Third Ring Road are still in the development and construction stages.
- Metro transfer stations. Transfer stations are affected by the flow of passengers, the different distribution characteristics of ridership at the station, and the complex characteristics of the ridership; the land use of the metro station area is affected by various factors as well, showing different characteristics.
- Stations with abnormal ridership. Similar to Zhonglou Station, Xiaozhai Station, Yongningmen Station, etc., are affected by holidays or flow restriction control measures.
- The selection was according to the administrative region where the site was located. The stations are distributed in different positions in the east, south, west, north, and center of the built-up urban area.
3.2. Data Source
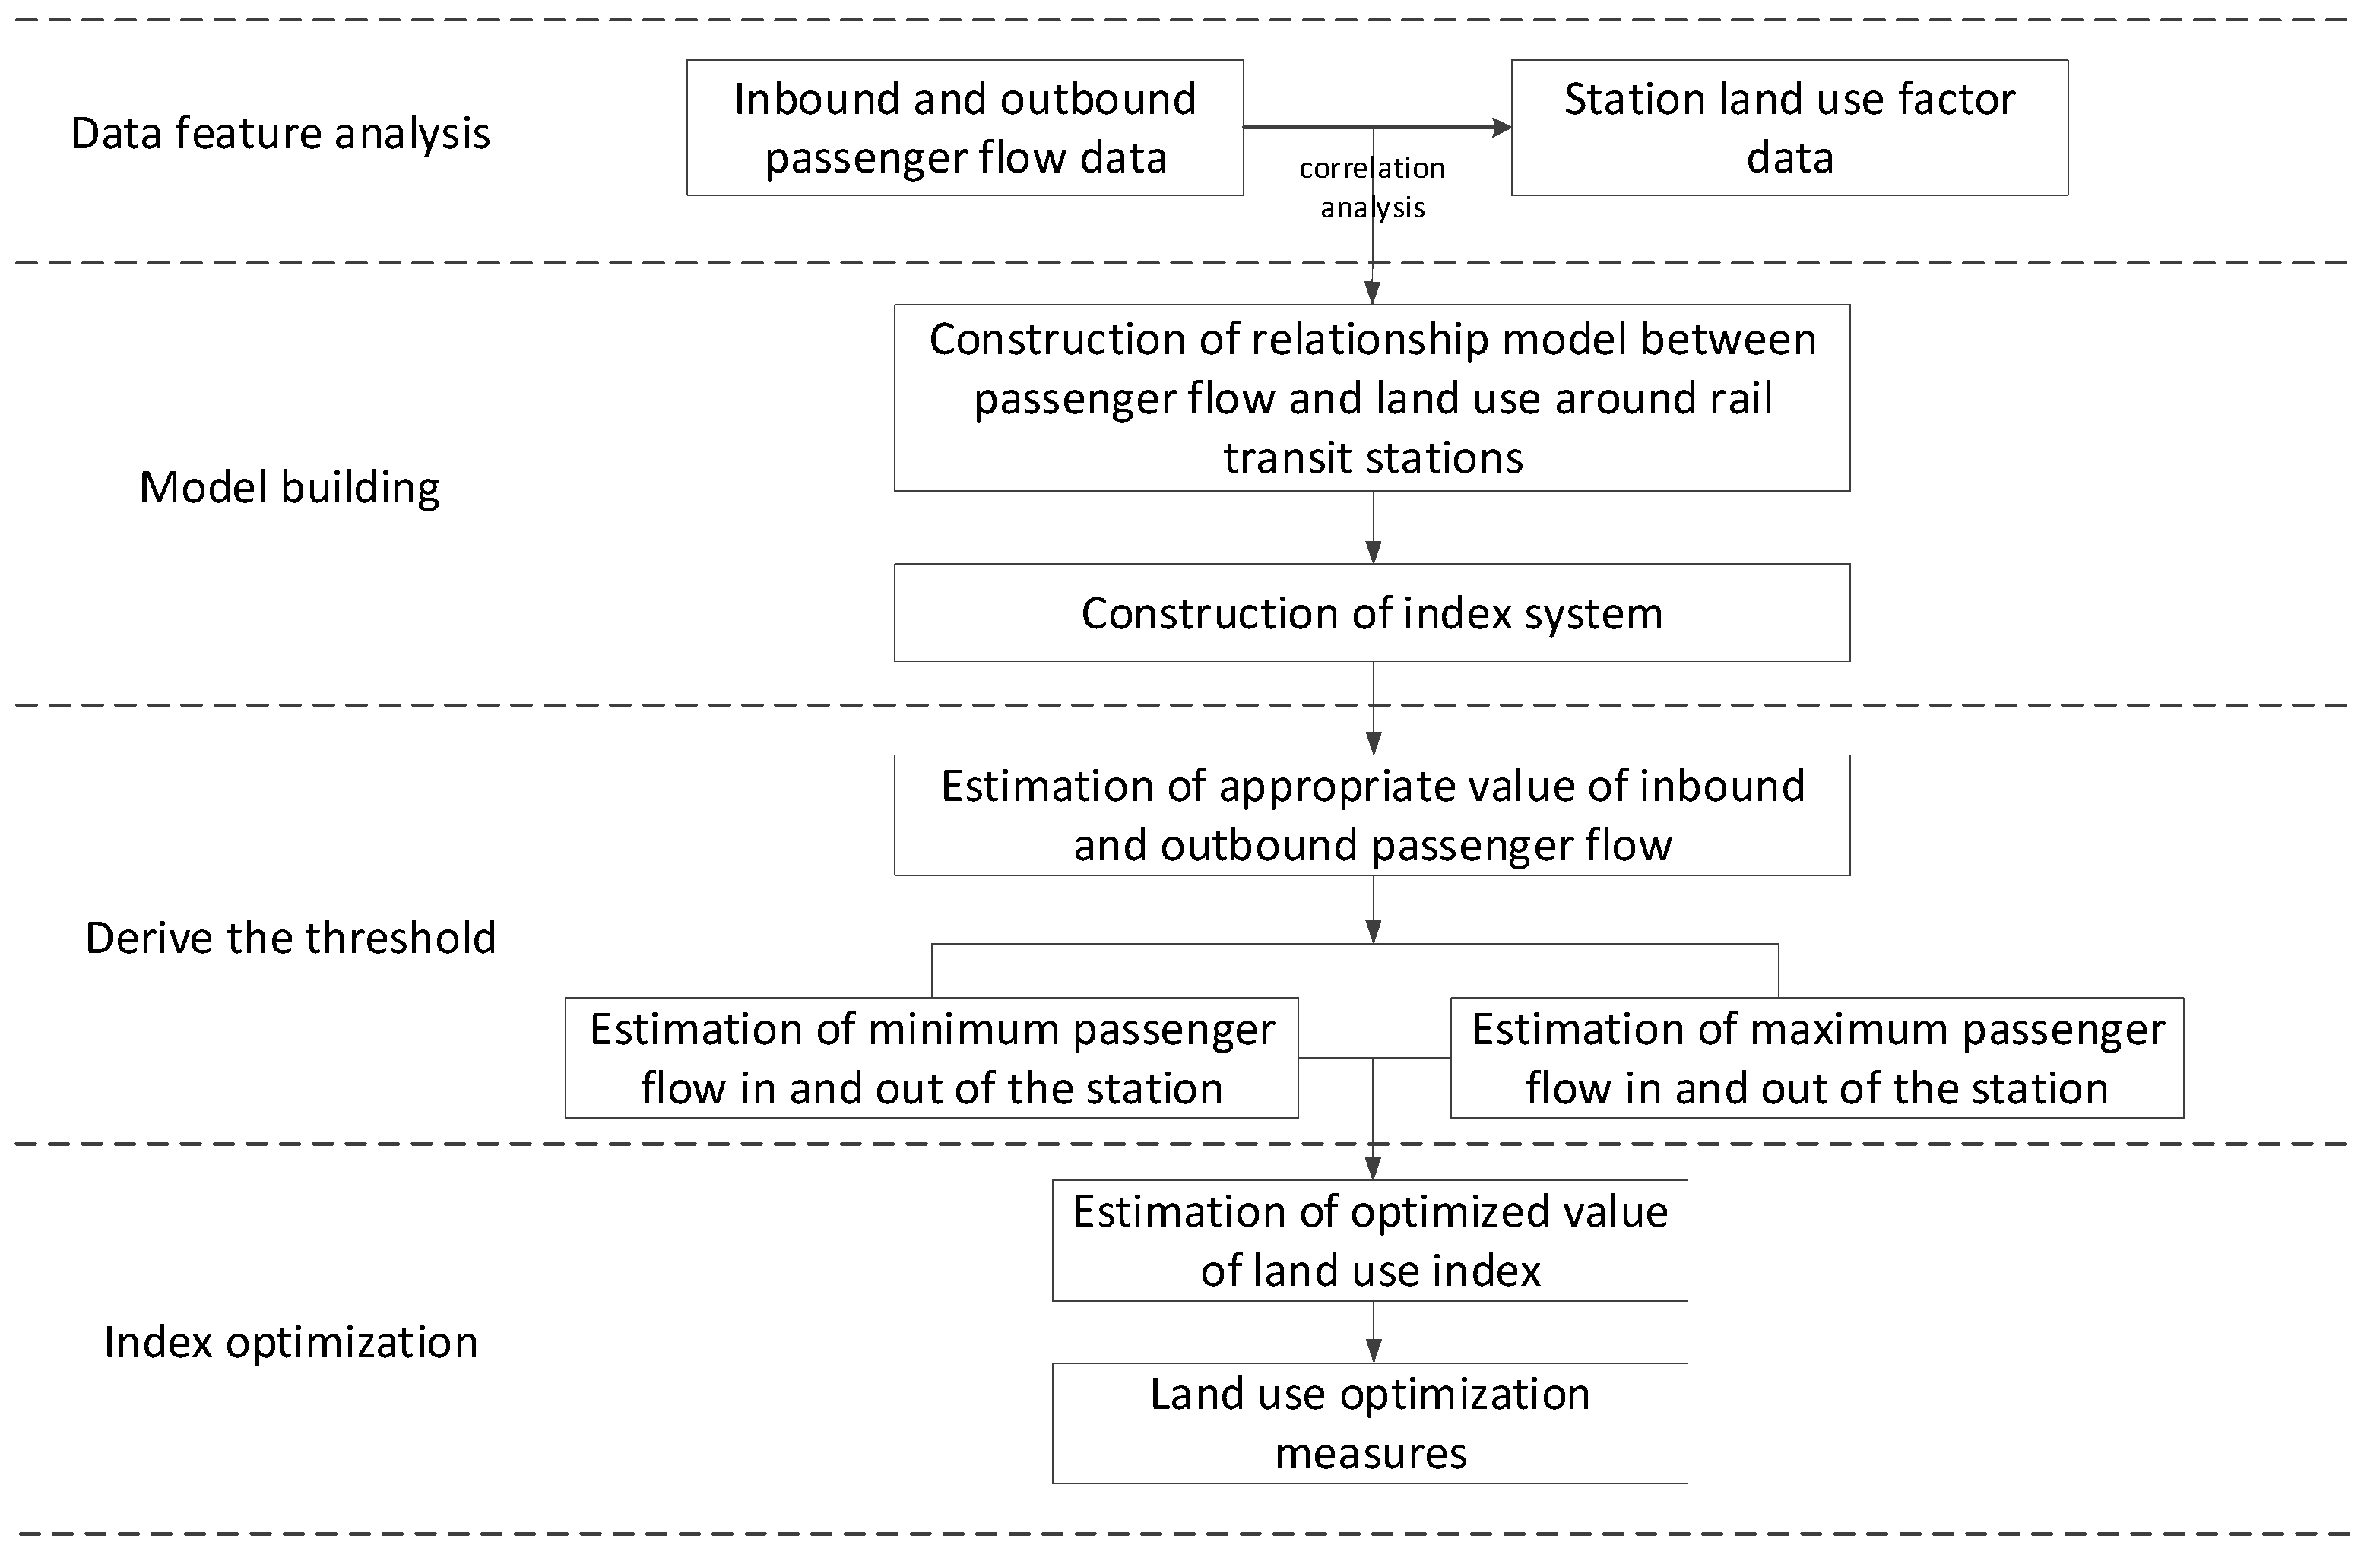
4. Methodology
4.1. Regression Analysis
4.2. Building a Variable Set
4.3. Estimation of a Suitable Value of Metro Ridership
5. Results and Discussion
5.1. Relationship Model between Ridership and Land Use Factors
5.2. Estimation of Optimal Values of Land Use Factors in Station Areas
- (1)
- Average plot ratio
- (2)
- Building mix diversity and land use mix diversity
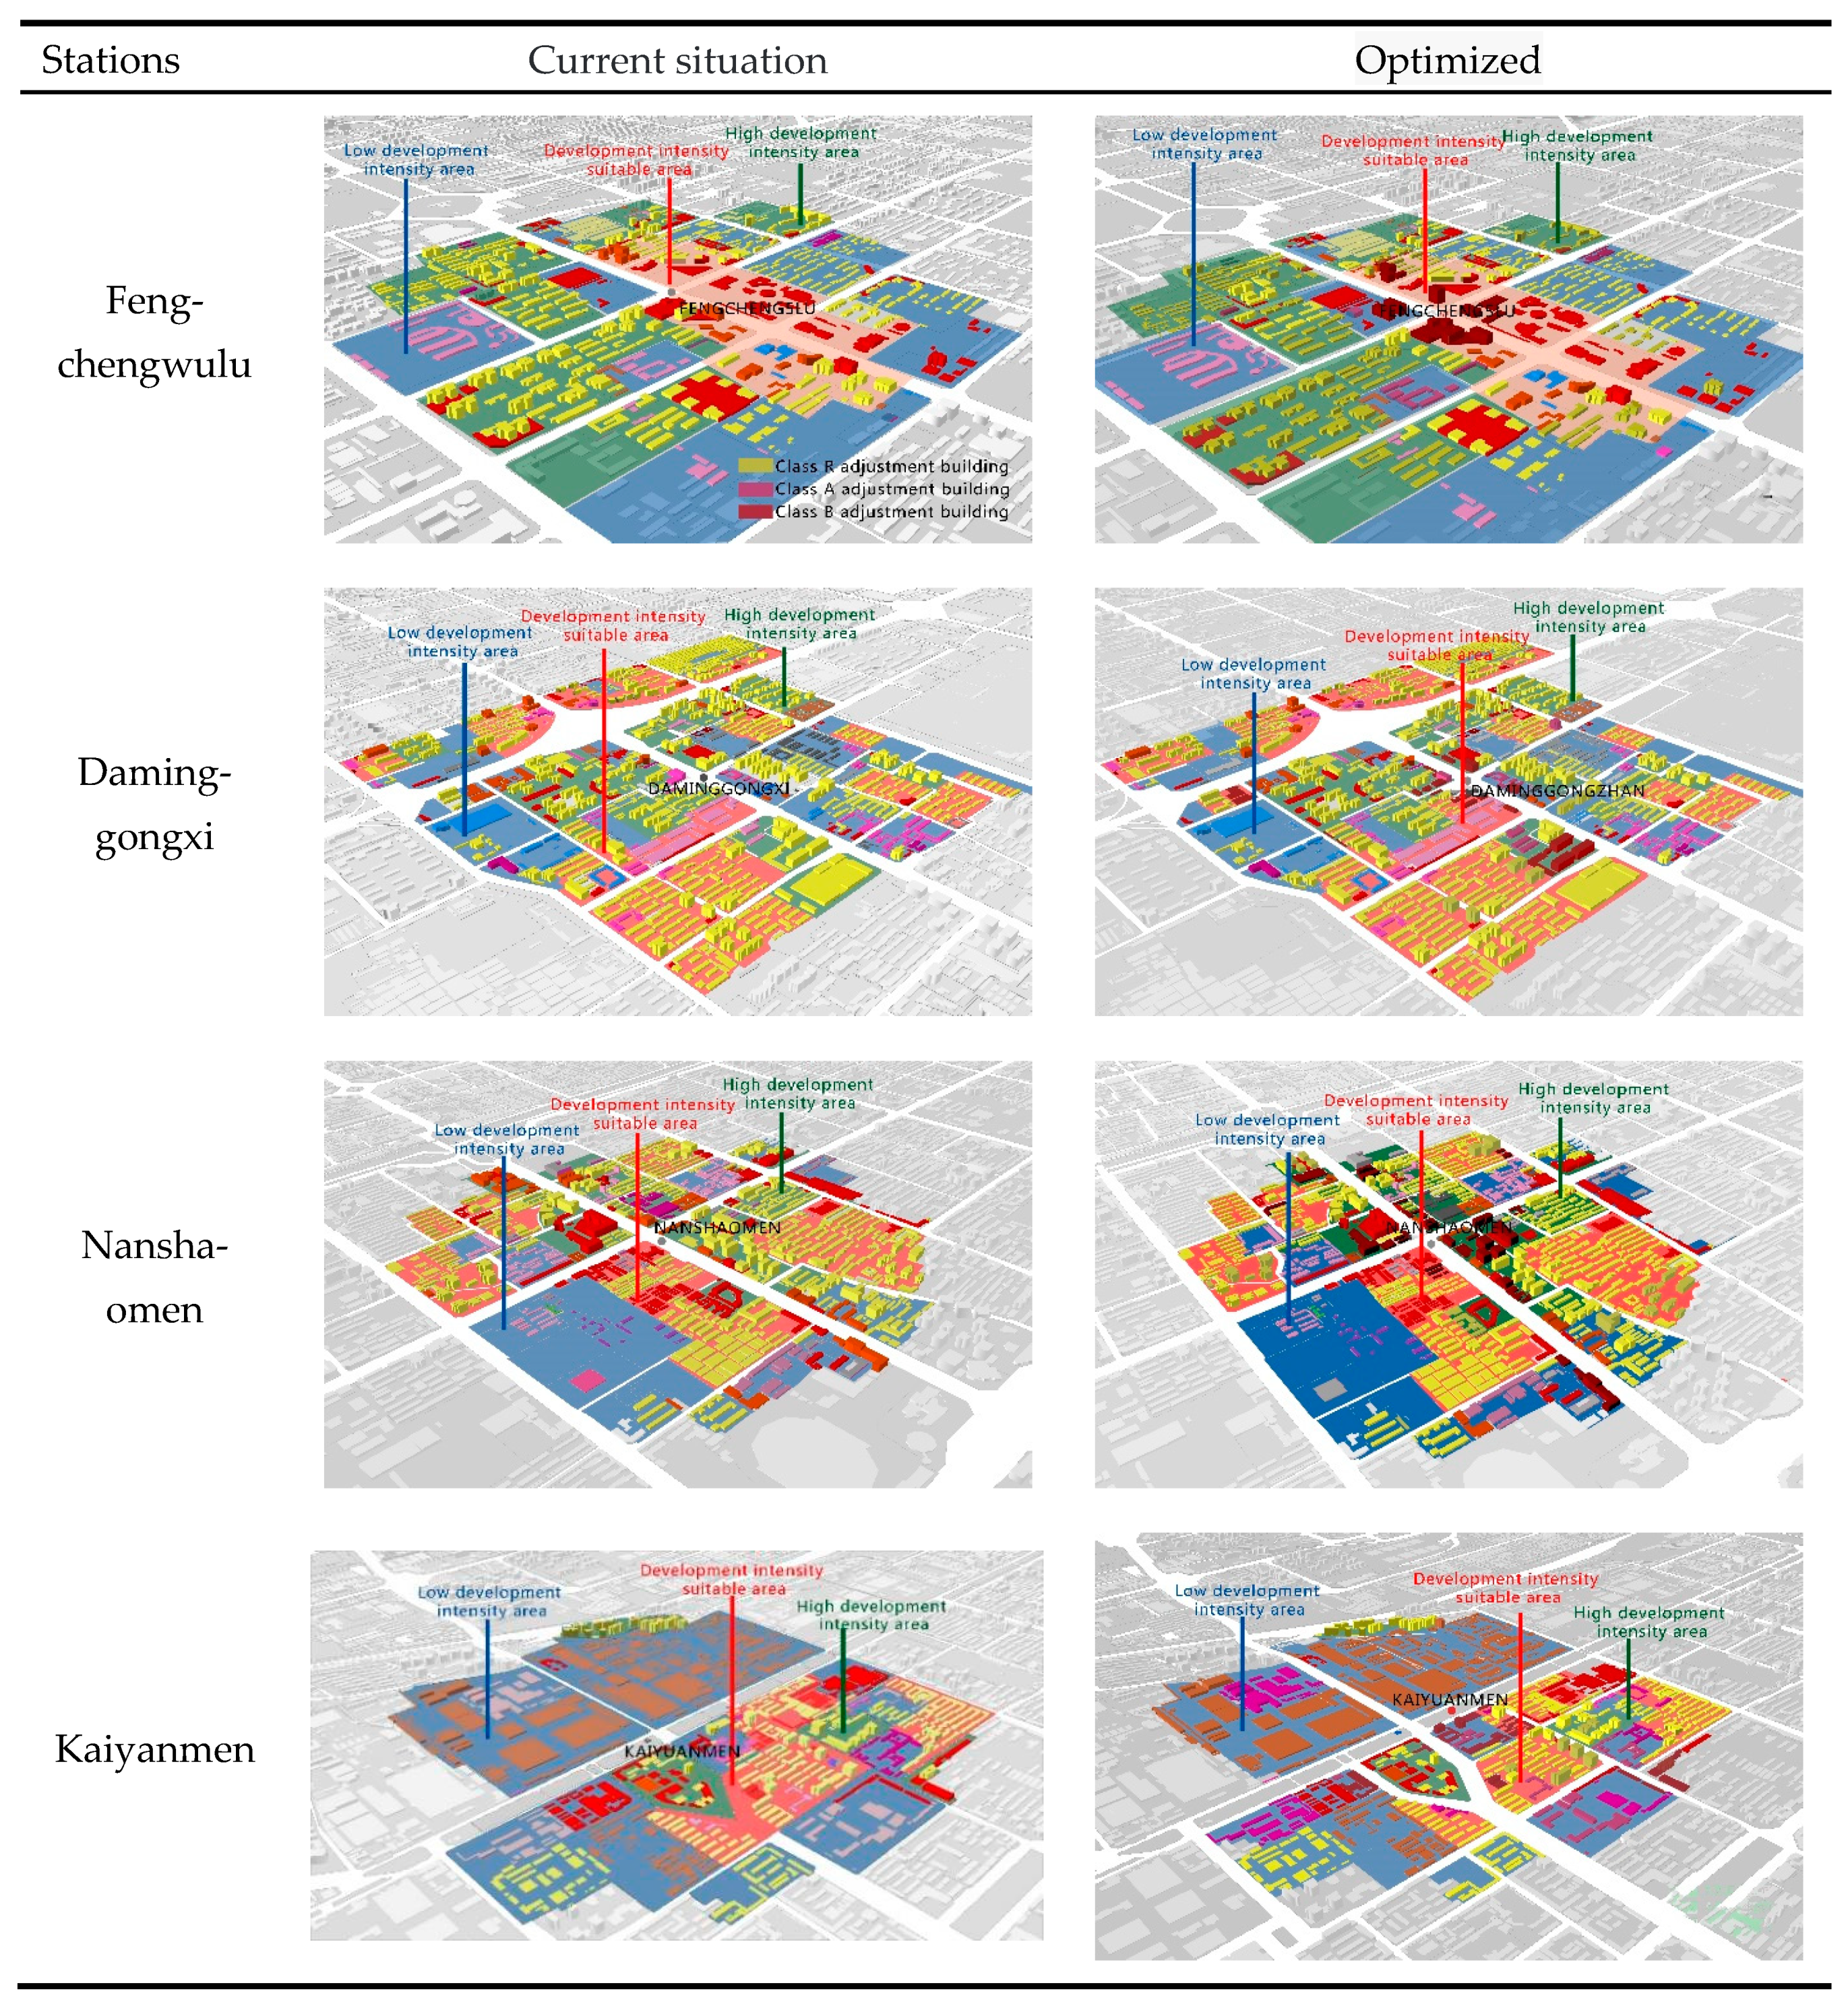
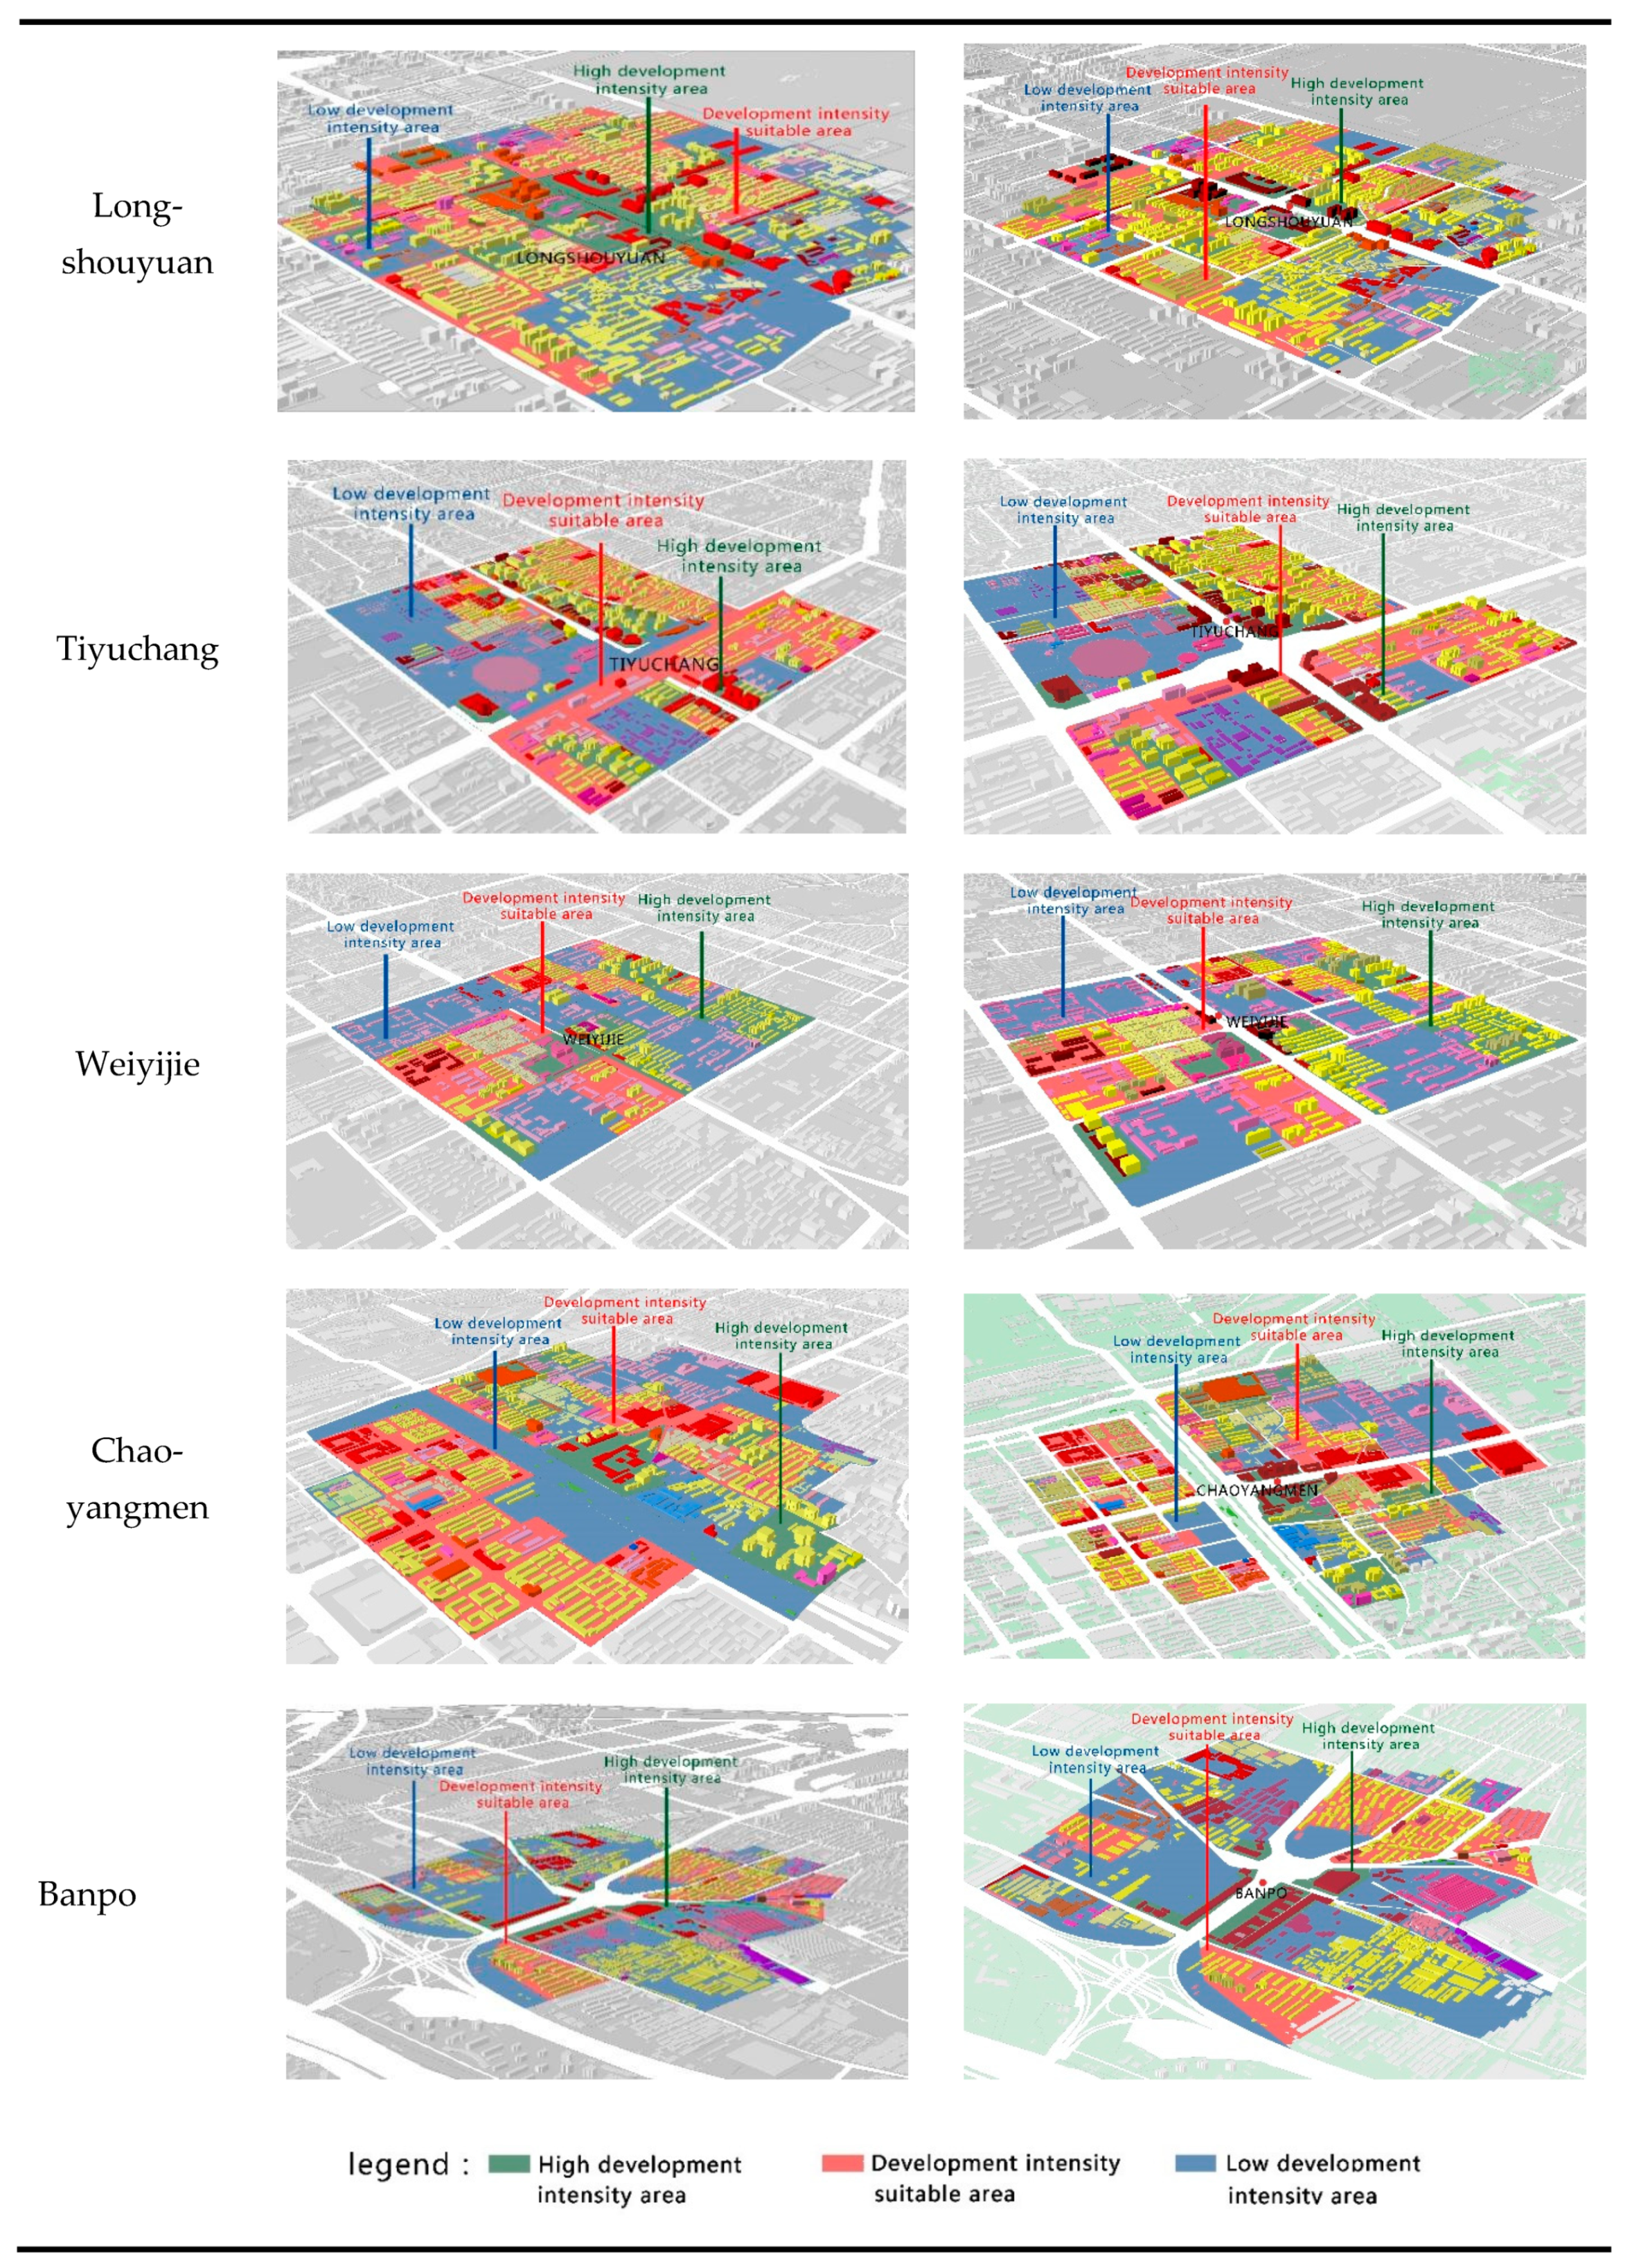
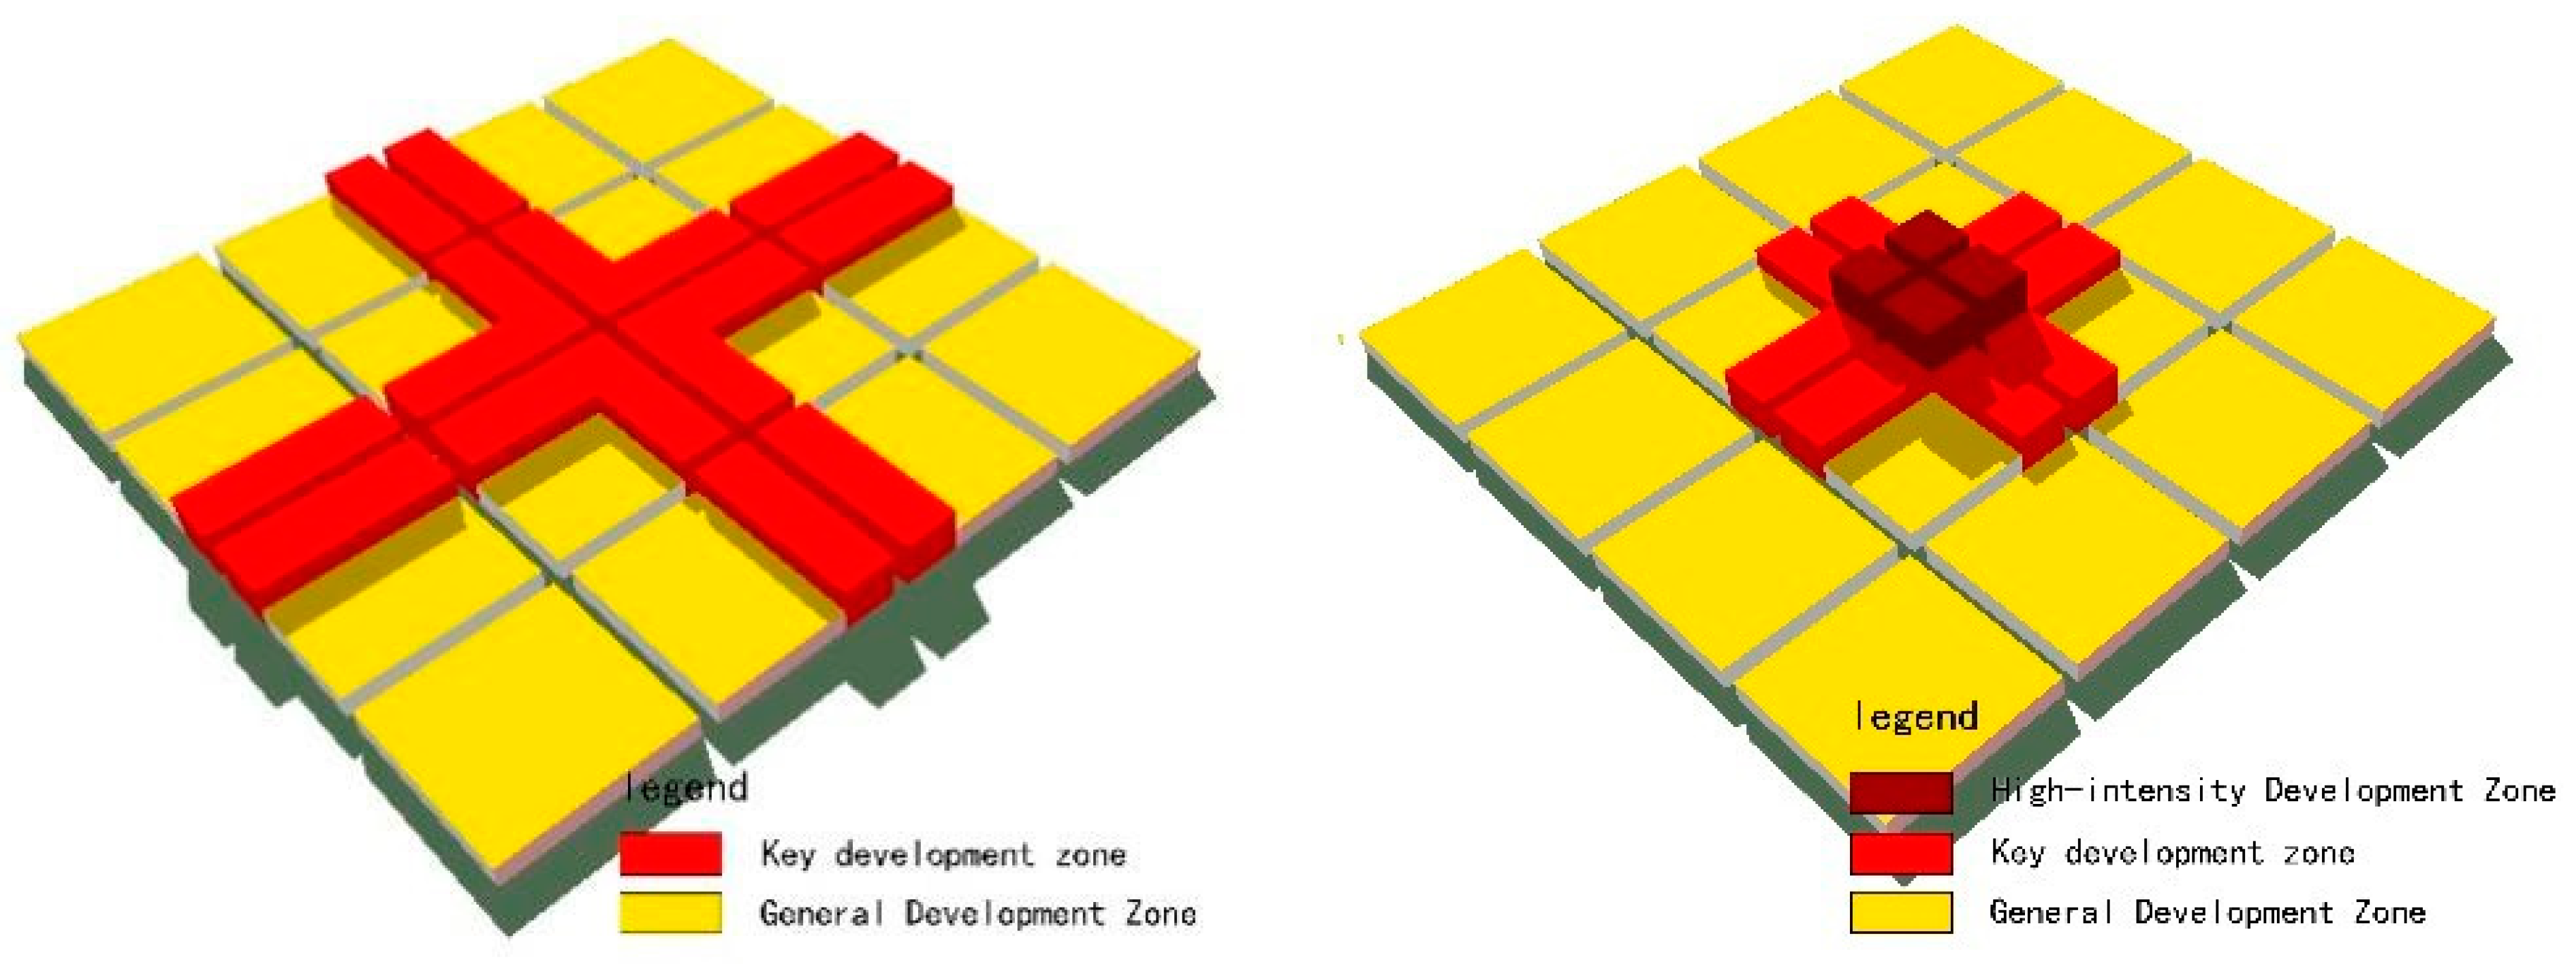
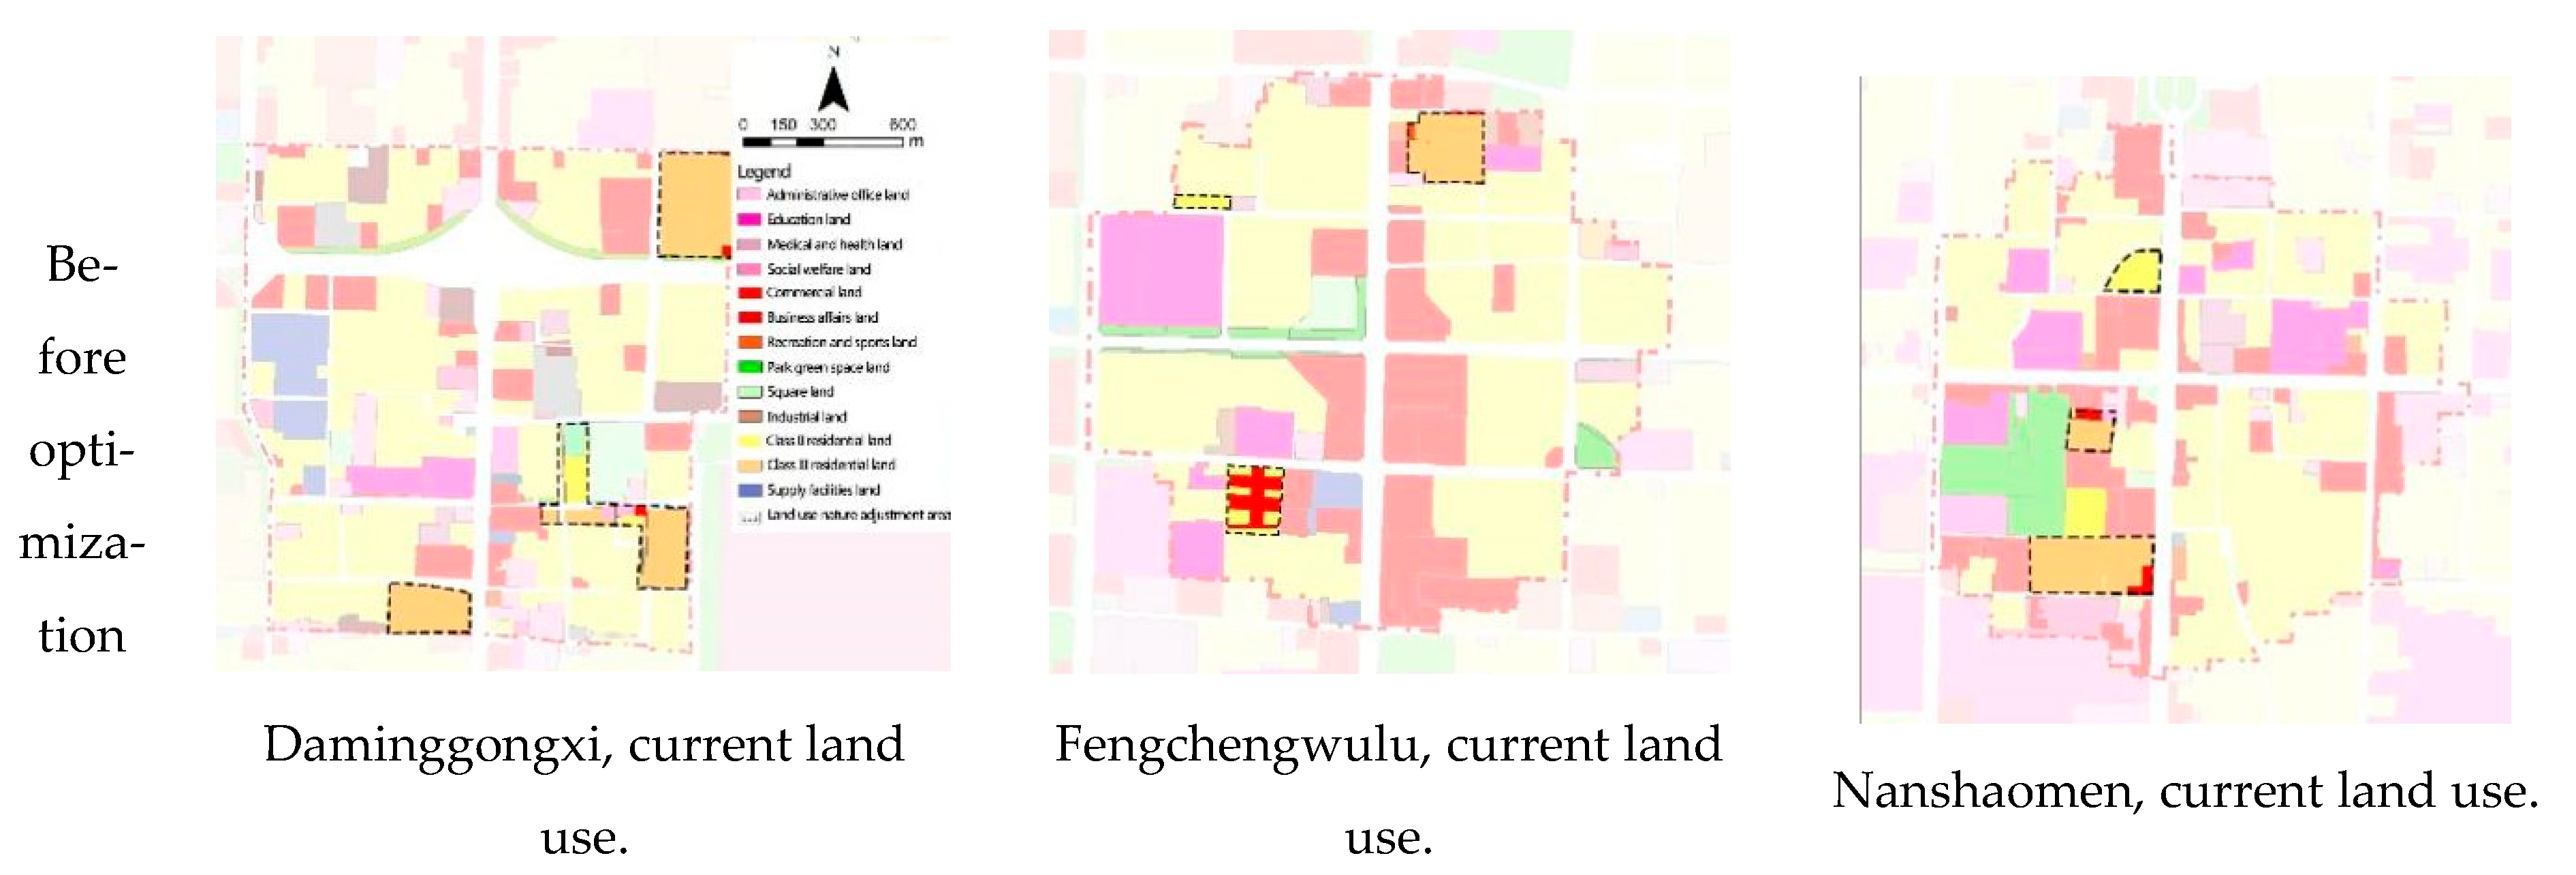
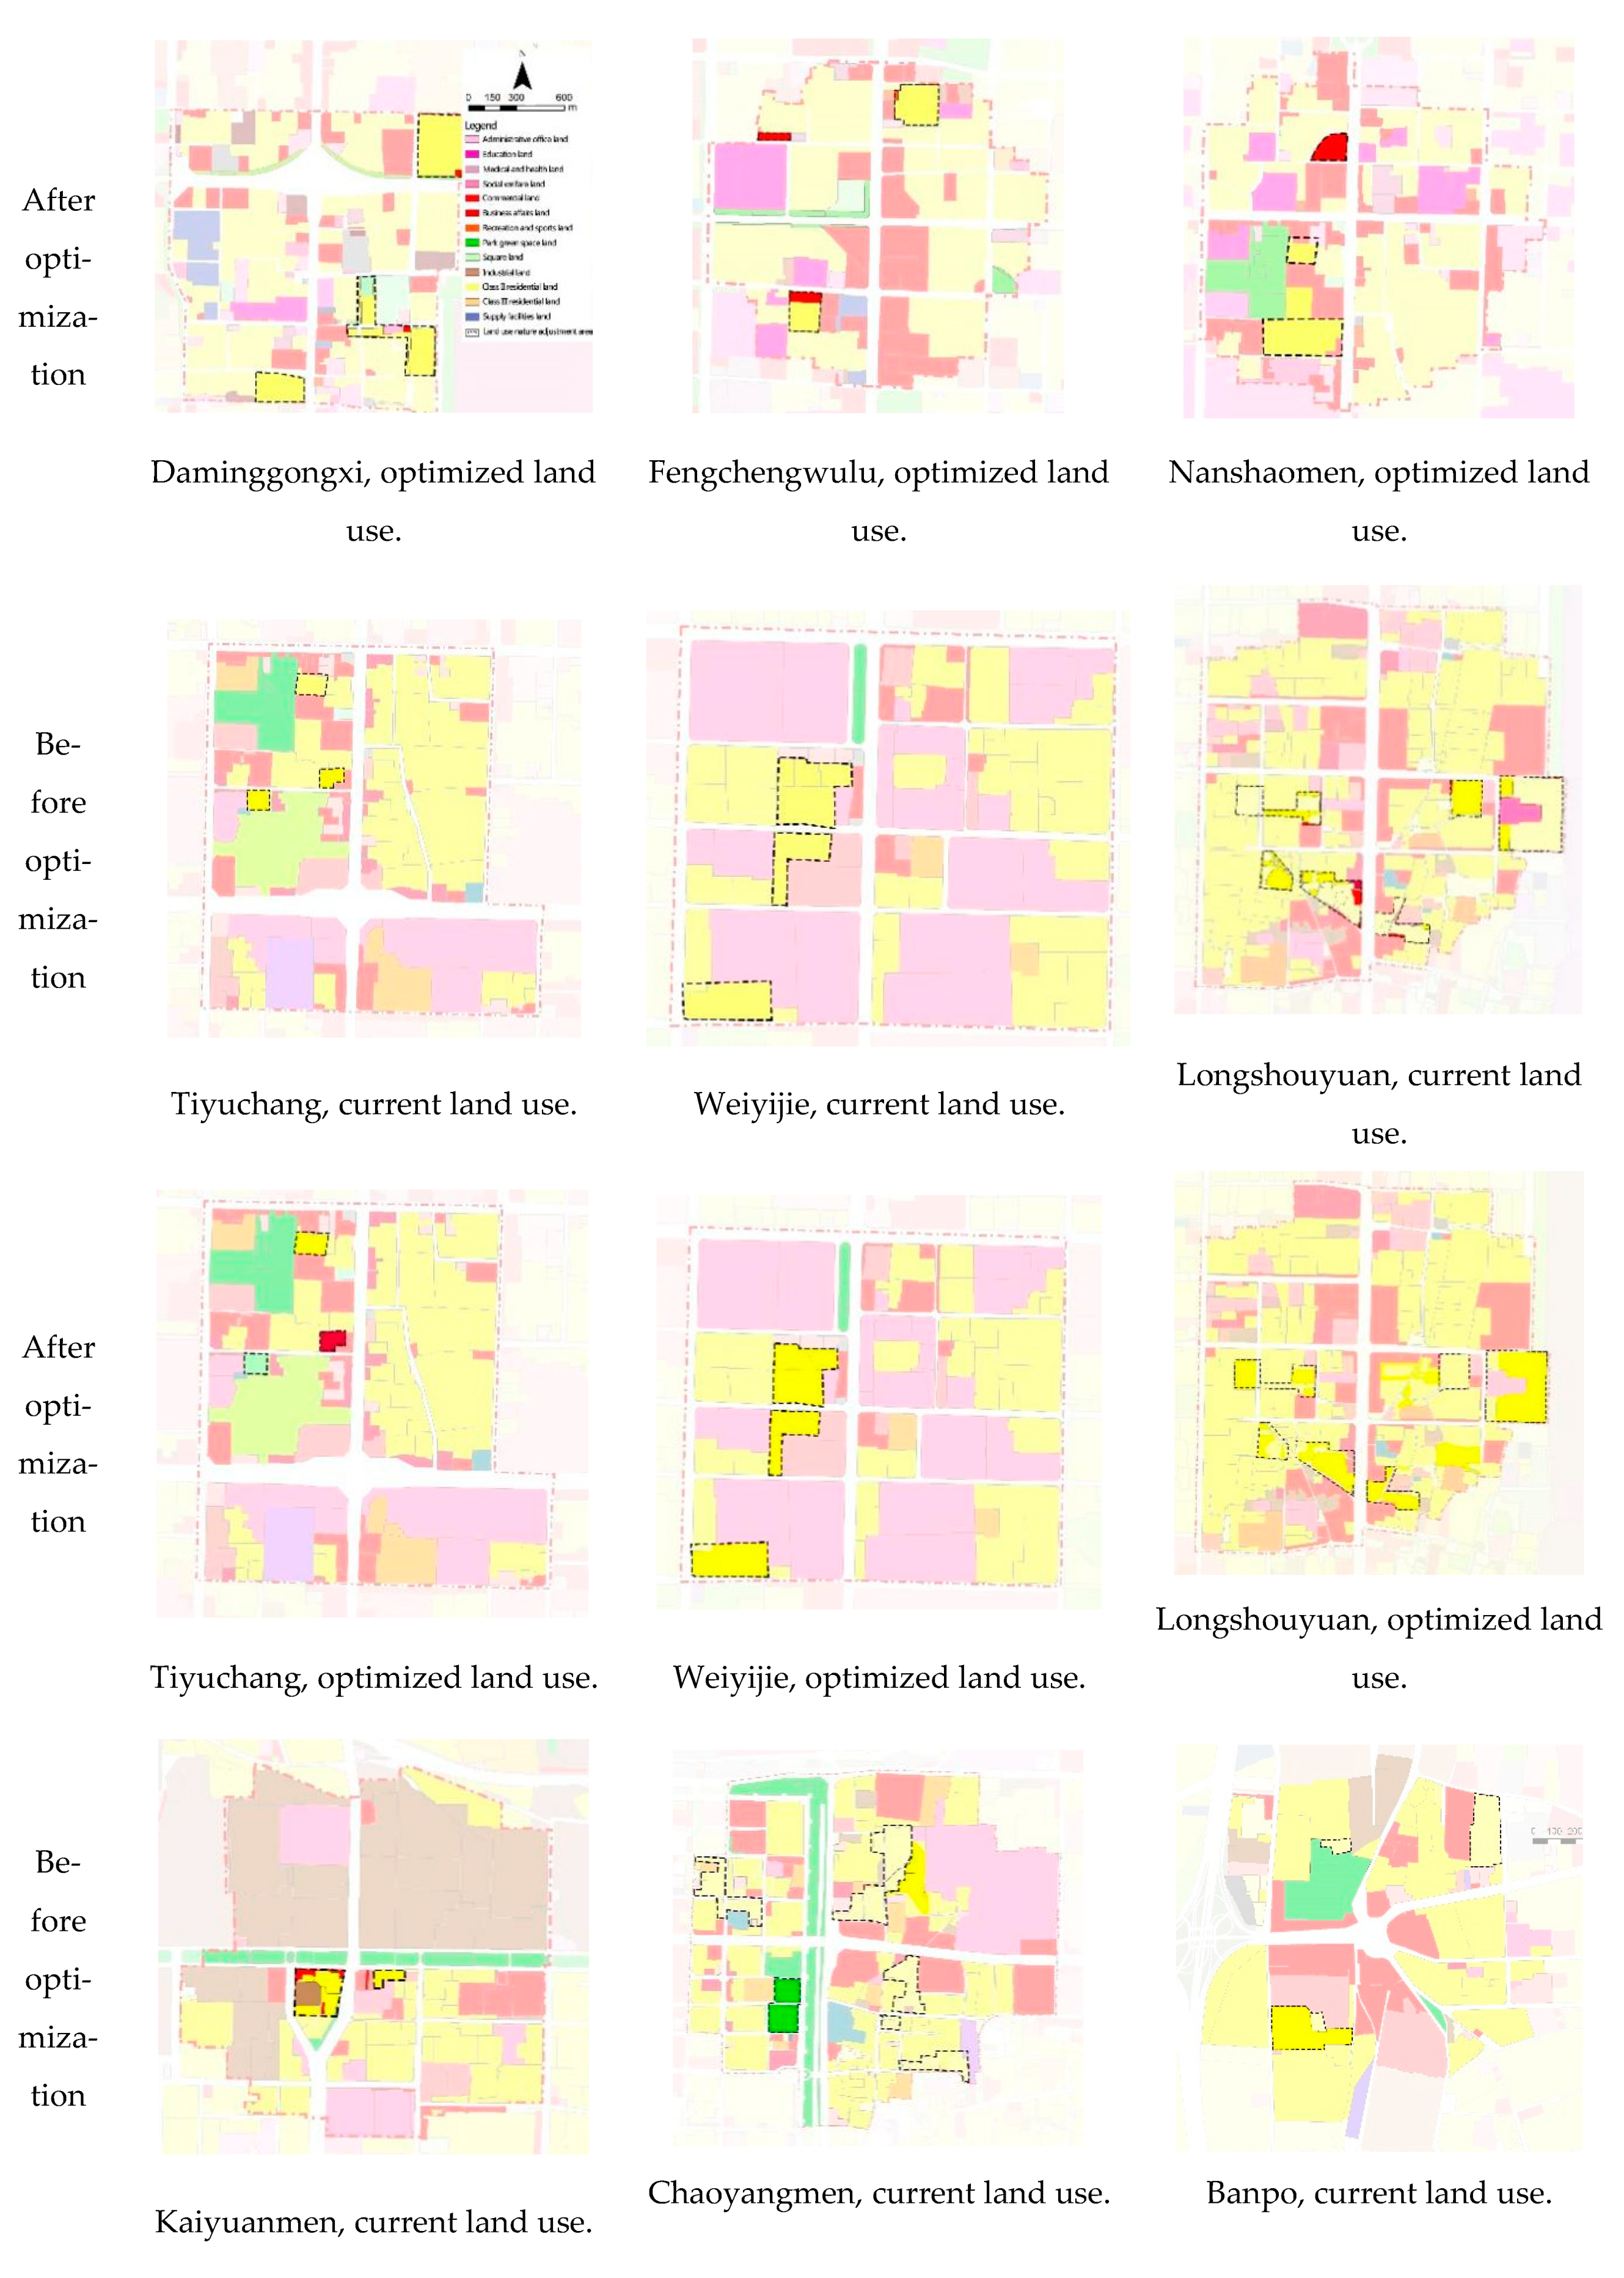
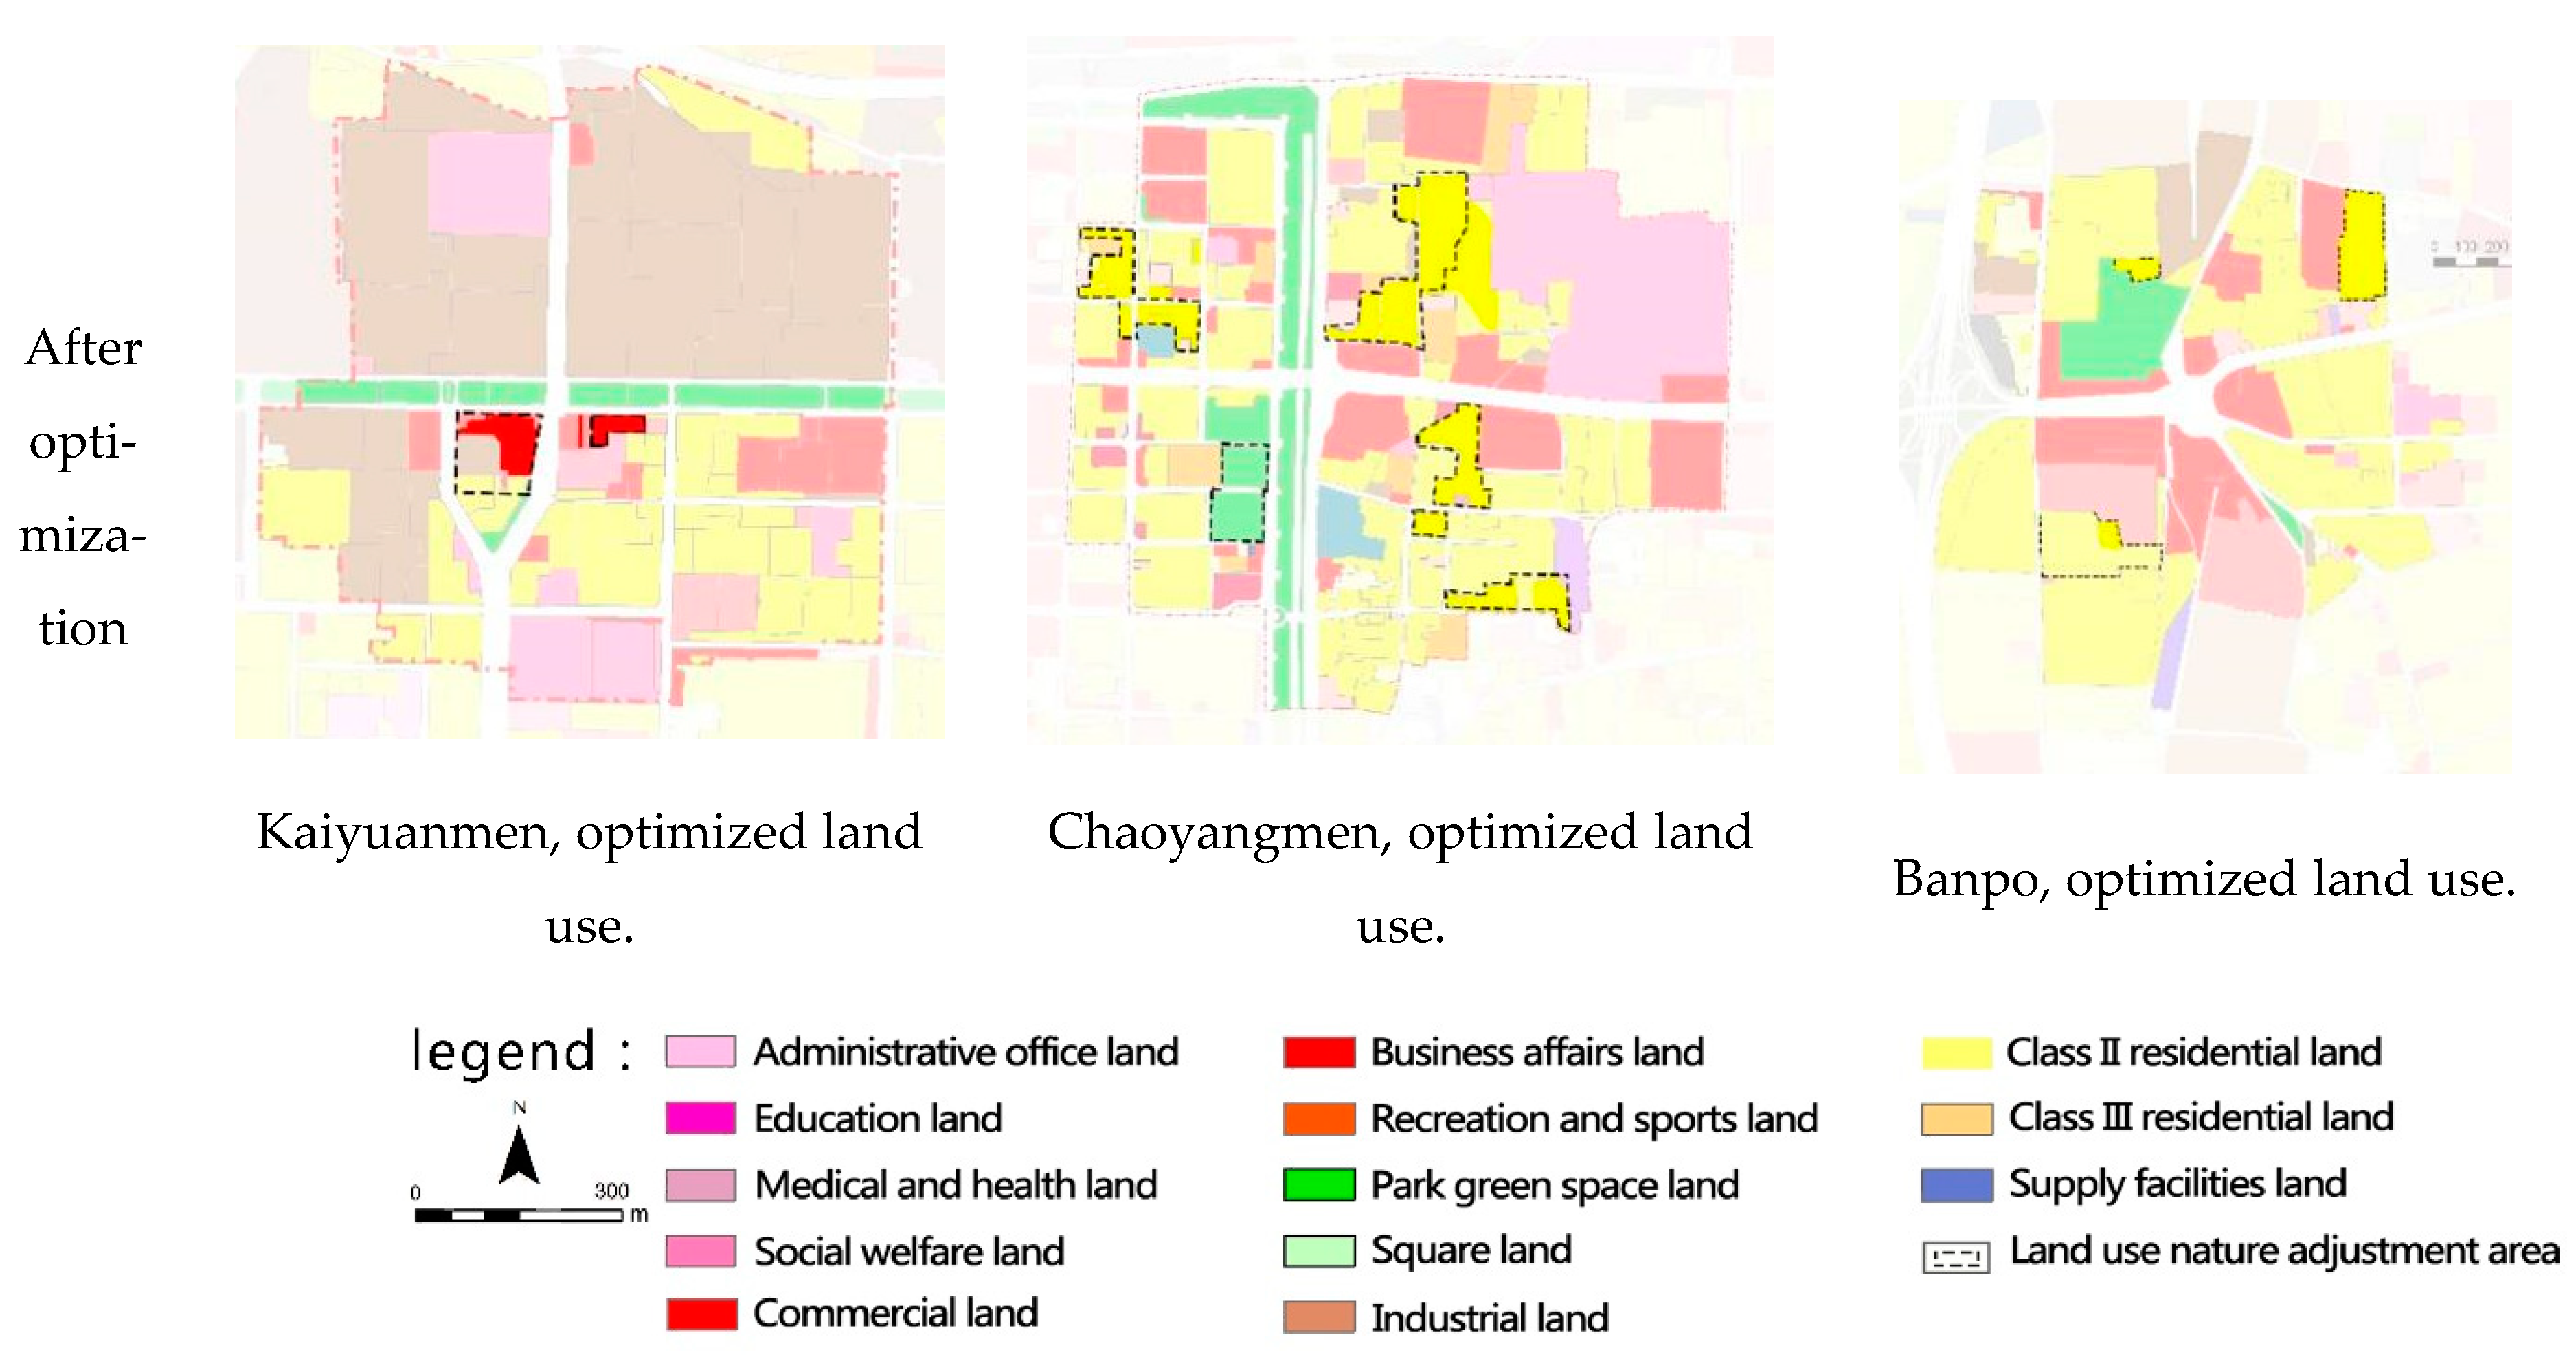
5.3. Optimizing Measures for Land Use in Station Areas
- (1)
- Development intensity optimization
- (2)
- Optimization of land use properties
6. Conclusions
Author Contributions
Funding
Informed Consent Statement
Data Availability Statement
Conflicts of Interest
References
- Jirón, P. Sustainable Urban Mobility in Latin America and the Caribbean; Global Report on Human Settlements: Regional Report for Latin American and the Caribbean; GRHS: Richmond, TX, USA, 2013. [Google Scholar]
- Guo, J.F.; Liu, Y.; Yu, L. Traffic congestion in large metropolitan area in China. Urban Transp. China 2011, 9, 8–14. [Google Scholar]
- Cervero, R. Linking urban transport and land use in developing countries. J. Transp. Land Use 2013, 6, 7–24. [Google Scholar] [CrossRef] [Green Version]
- Hou, Q.; Duan, Y. Collaborative optimization of land use intensity and traffic capacity under hierarchical control rules of regulatory detailed planning. J. Chang. Univ. 2015, 35, 114–121. [Google Scholar]
- Stover, V.; Koepke, F. Transportation and Land Development; Prentice-Hall: Englewood Cliffs, NJ, USA, 1988. [Google Scholar]
- Hu, J.; Zhang, G. Planning for Areas Along Urban Rail Lines: The Case of Fuzhou Metro Line One (North Part). Urban Plan. Forum 2012, 76–84. [Google Scholar]
- Duan, Y.; Hou, Q.; Zhang, S. Review of Intensive Land Use in Built-up Areas Based on Low-carbon Travel. Planners 2019, 35, 5–11. [Google Scholar]
- Duan, D.; Zhang, F. Study on Classification of Urban Rail Transit Stations from the Perspective of Land Use Optimization: A Case Study on Xi’an Subway Line 2. City Plan. Rev. 2013, 37, 39–45. [Google Scholar]
- Pan, H.; Ren, C.; Yang, T. A Study on the Impact on the Land use of Station Areas Brought by Urban Rail Transport in Shanghai. Urban Plan. Forum 2007, 4, 92–97. [Google Scholar]
- Cervero, R.; Kockelman, K. Travel demand and the 3Ds: Density, diversity, and design. Transp. Res. Part D Transp. Environ. 1997, 2, 199–219. [Google Scholar] [CrossRef]
- Kuby, M.; Barranda, A.; Upchurch, C. Factors influencing light-rail station boardings in the United States. Transp. Res. Part A Policy Pract. 2004, 38, 223–247. [Google Scholar] [CrossRef]
- Sohn, K.; Shim, H. Factors generating boardings at metro stations in the Seoul metropolitan area. Cities 2010, 27, 358–368. [Google Scholar] [CrossRef]
- Gutiérrez, J.; Cardozo, O.D.; García-Palomares, J.C. Transit ridership forecasting at station level: An approach based on distance-decay weighted regression. J. Transp. Geogr. 2011, 19, 1081–1092. [Google Scholar] [CrossRef]
- Zhao, M.; Li, L.; Fang, Y.; Zhang, L.; Dong, W.; Li, Z.; Duan, Y. Optimization of intensive land use in blocks of Xi’an from the perspective of bicycle travel. Alex. Eng. J. 2021, 60, 241–249. [Google Scholar] [CrossRef]
- Cervero, R. Induced travel demand: Research design, empirical evidence, and normative policies. J. Plan. Lit. Inc. CPL Bibliogr. 2002, 17, 3–20. [Google Scholar] [CrossRef]
- Lee, C.; Moudon, A.V. Correlates of walking for transportation or recreation purposes. J. Phys. Act. Health 2006, 3 (Suppl. 1), S77–S98. [Google Scholar] [CrossRef]
- Chan, S.; Miranda-Moreno, L. A station-level ridership model for the metro network in Montreal, Quebec. Can. J. Civ. Eng. 2013, 40, 254–262. [Google Scholar] [CrossRef]
- Guang, R. Passenger Flow Prediction for Urban Railway Station’s Entrance and Exit Based on Land-Use and Accessibility. Master’s Thesis, Beijing Jiaotong University, Beijing, China, 2013. [Google Scholar]
- Cai, C.; Yao, E.; Zhang, Y.; Liu, J. Forecasting of Passenger Flow’s Distribution among Urban Rail Transit Stations Based on AFC Data. China Railw. Sci. 2015, 36, 126–132. [Google Scholar]
- Cheng, G.; Zhou, L.; Xu, H. Passenger Flow Forecast Model for Urban Rail Transit Stations based on GWR. J. Wuhan Univ. Technol. 2019, 43, 198–203. [Google Scholar]
- Tan, Z.; Li, S.; Li, X.; Liu, X.; Chen, Y.; Li, W. Spatio-temporal effects of urban rail transit on complex land-use change. Acta Geogr. Sin. 2017, 72, 850–862. [Google Scholar]
- Debrezion, G.; Pels, E.; Rietveld, P. The impact of railway stations on residential and commercial property value: A meta-analysis. J. Real Estate Financ. Econ. 2007, 35, 161–180. [Google Scholar] [CrossRef] [Green Version]
- Pan, Q. The impacts of an urban light rail system on residential property values: A case study of the Houston metro rail transit line. Transp. Plan. Technol. 2012, 36, 145–169. [Google Scholar] [CrossRef]
- Handy, S. Smart growth and the transportation-land use connection: What does the research tell us? Int. Reg. Sci. Rev. 2005, 28, 146–167. [Google Scholar] [CrossRef]
- Liu, W.; Zhao, M. Model and algorithm of Optimizing to Integrated Land-use of railway station areas based on two-way balanced passenger flow. Syst. Eng. 2015, 33, 136–140. [Google Scholar]
- Zhang, Z. Study on Bidirectional Balance of Public Traffic Flow and Land Use Relationship in Public Transportation Corridor. Master’s Thesis, Chang’an University, Xi’an, China, 2017. [Google Scholar]
- Qiao, J.; Sun, L. Lane Formation Rule of bidirectional pedestrians flow in rail transit Corridor. J. Beijing Univ. Technol. 2017, 43, 1916–1921. [Google Scholar]
- Loo, B.P.; Chen, C.; Chan, E.T. Rail-based transit-oriented development: Lessons from New York City and Hong Kong. Landsc. Urban Plan. 2010, 97, 202–212. [Google Scholar] [CrossRef]
- Guo, P. On Characteristics and prediction of urban rail transit passenger flow. Urban Mass Transit 2010, 13, 58–62. [Google Scholar]
- Cui, L. Exploration of Traffic Demand Forecasting Model for Urban Transportation Planning. Sichuan Build. Mater. 2016, 42, 140–141+144. [Google Scholar]
- Zhang, Y.; Cao, K.; He, Y.; Zhou, W. Discussion on spatial match between land use and rail transit: A case study of Shenzhen subway Line 2. City Plan. Rev. 2017, 41, 107–115. [Google Scholar]
- Sung, H.; Choi, K.; Lee, S.; Cheon, S. Exploring the impacts of land use by service coverage and station-level accessibility on rail transit ridership. J. Transp. Geogr. 2014, 36, 134–140. [Google Scholar] [CrossRef]
- Wang, J.; Zhang, N.; Peng, H.; Huang, Y.; Zhang, Y. Spatiotemporal Heterogeneity Analysis of Influence Factor on Urban Rail Transit Station Ridership. J. Transp. Eng. Part A Syst. 2022, 148, 04021115. [Google Scholar] [CrossRef]
- Zhao, J. Study of the Basic Theory Application of Catchment Area of Urban Rail Transit Stations. Ph.D. Thesis, Southeast University, Nanjing, China, 2017. [Google Scholar]


| Variables | Min | Max | Mean | SD | |
|---|---|---|---|---|---|
| Land characteristics | Total land area (X1) (ten thousand m2) | 170.01 | 247.89 | 216.76 | 25.88 |
| Total building area (X2) (ten thousand m2) | 215.61 | 618.16 | 429.85 | 126.22 | |
| Average building density (X3) | 0.26 | 0.42 | 0.32 | 0.565 | |
| Average plot ratio (X4) | 1.05 | 2.95 | 1.99 | 0.563 | |
| Building mix diversity (X5) | 1.12 | 1.52 | 1.28 | 0.133 | |
| Land use mix diversity (X6) | 1.46 | 1.95 | 1.71 | 0.165 | |
| Traffic characteristics | Outbound ridership (y1) | 475 | 2900 | 1822 | 1143.8 |
| Inbound ridership (y2) | 482 | 4164 | 1622 | 779.1 | |
| Metro sharing rate (X7) | 20.61% | 24.57% | 22.16% | 1.31% | |
| Land Use Factors | Estimated Coefficient | Standard Error | Standardized Coefficient | T-Value | p-Values |
|---|---|---|---|---|---|
| Intercept | −37.38 (−31.51) | 0.50 (0.30) | −74.10 (−106.22) | 0.009 (0.006) | |
| Total land area (lnx1) | 1.57 (1.51) | 0.12 (0.07) | 0.20 (0.20) | 12.88 (21.00) | 0.049 (0.030) |
| Total building area (lnx2) | 1.40 (1.03) | 0.11 (0.06) | 0.46 (0.35) | 13.15 (16.27) | 0.048 (0.039) |
| Average plot ratio (x4) | 0.81 (0.95) | 0.06 (0.04) | 0.47 (0.57) | 12.88 (25.84) | 0.049 (0.025) |
| Building mix diversity (x5) | 0.76 (0.83) | 0.06 (0.03) | 0.11 (0.12) | 13.55 (25.04) | 0.047 (0.025) |
| Land use mix diversity (x6) | 0.57 (0.84) | 0.04 (0.02) | 0.10 (0.15) | 15.38 (38.34) | 0.041 (0.017) |
| R2 | 0.988 (0.979) | ||||
| Adjusted R2 | 0.994 (0.979) | ||||
| Sum of Squares | 7.582 (7.027) | ||||
| df | 7 (7) | ||||
| Mean Square | 1.090 (1.015) | ||||
| F | 19,095.882 (51,432.081) | ||||
| P | 0.006 (0.003) | ||||
| Stations | Fengchengwulu | Daminggongxi | Longshouyuan | Nanshaomen | Tiyuchang | Weiyijie | Kaiyuanmen | Chaoyangmen | Banpo | |
|---|---|---|---|---|---|---|---|---|---|---|
| Current value | X4 | 1.79 | 2.59 | 2.06 | 2.95 | 2.31 | 1.69 | 1.7 | 1.75 | 1.05 |
| X2 | 339.91 | 618.15 | 481.53 | 501.71 | 573.61 | 392.65 | 344.43 | 401.04 | 215.61 | |
| X5 | 1.14 | 1.13 | 1.23 | 1.28 | 1.45 | 1.32 | 1.3 | 1.52 | 1.18 | |
| X6 | 1.5 | 1.75 | 1.74 | 1.77 | 1.82 | 1.57 | 1.46 | 1.95 | 1.84 | |
| Y1 Outbound ridership optimization value range | X4 | 2.19–3.48 | 0.98–2.27 | 1.19–2.48 | 1.58–2.87 | 0.66–1.95 | 1.5–2.79 | 1.97–3.26 | 0.99–2.28 | 2.22–3.51 |
| X2 | 493.65–1642.03 | 138.24–459.83 | 215.38–716.42 | 139.96–465.55 | 122.37–407.06 | 328.62–1093.07 | 442.05–1470.38 | 197.58–657.21 | 644.38–2143.37 | |
| X5 | 1.6–3.08 | 0.71–0.77 | 0.24–1.72 | 0.29–1.19 | 0.45–1.03 | 1.11–2.58 | 1.61–3.09 | 0.65–2.13 | 2.53–4.01 | |
| X6 | 1.96–3.41 | 0.07–1.39 | 0.77–2.22 | 0.22–1.68 | 0.06–1.4 | 1.35–2.81 | 1.76–3.22 | 1.09–2.55 | 3.17–4.62 | |
| Y2 Inbound ridership optimization value range | X4 | 2.11–3.63 | 0.46–1.99 | 0.83–2.36 | 1.31–2.83 | 0.15–1.67 | 1.24–2.77 | 1.84–3.36 | 0.77–2.29 | 2.47–3.99 |
| X2 | 407.94–978.14 | 182.20–436.88 | 238.60–5721.17 | 194.96–467.46 | 165.49–396.79 | 303.06–726.68 | 372.46–893.06 | 229.16–549.47 | 488.34–1170.92 | |
| X5 | 1.48–3.08 | 0.12–0.49 | 0.06–1.55 | 0.45–1.15 | 0.35–0.77 | 0.85–2.46 | 1.45–3.05 | 0.49–2.1 | 2.68–4.29 | |
| X6 | 1.95–4.09 | 0.24–0.9 | 0.03–2.16 | 0.54–1.6 | 0.22–0.92 | 0.93–3.07 | 1.65–3.79 | 0.58–2.72 | 3.84–5.97 | |
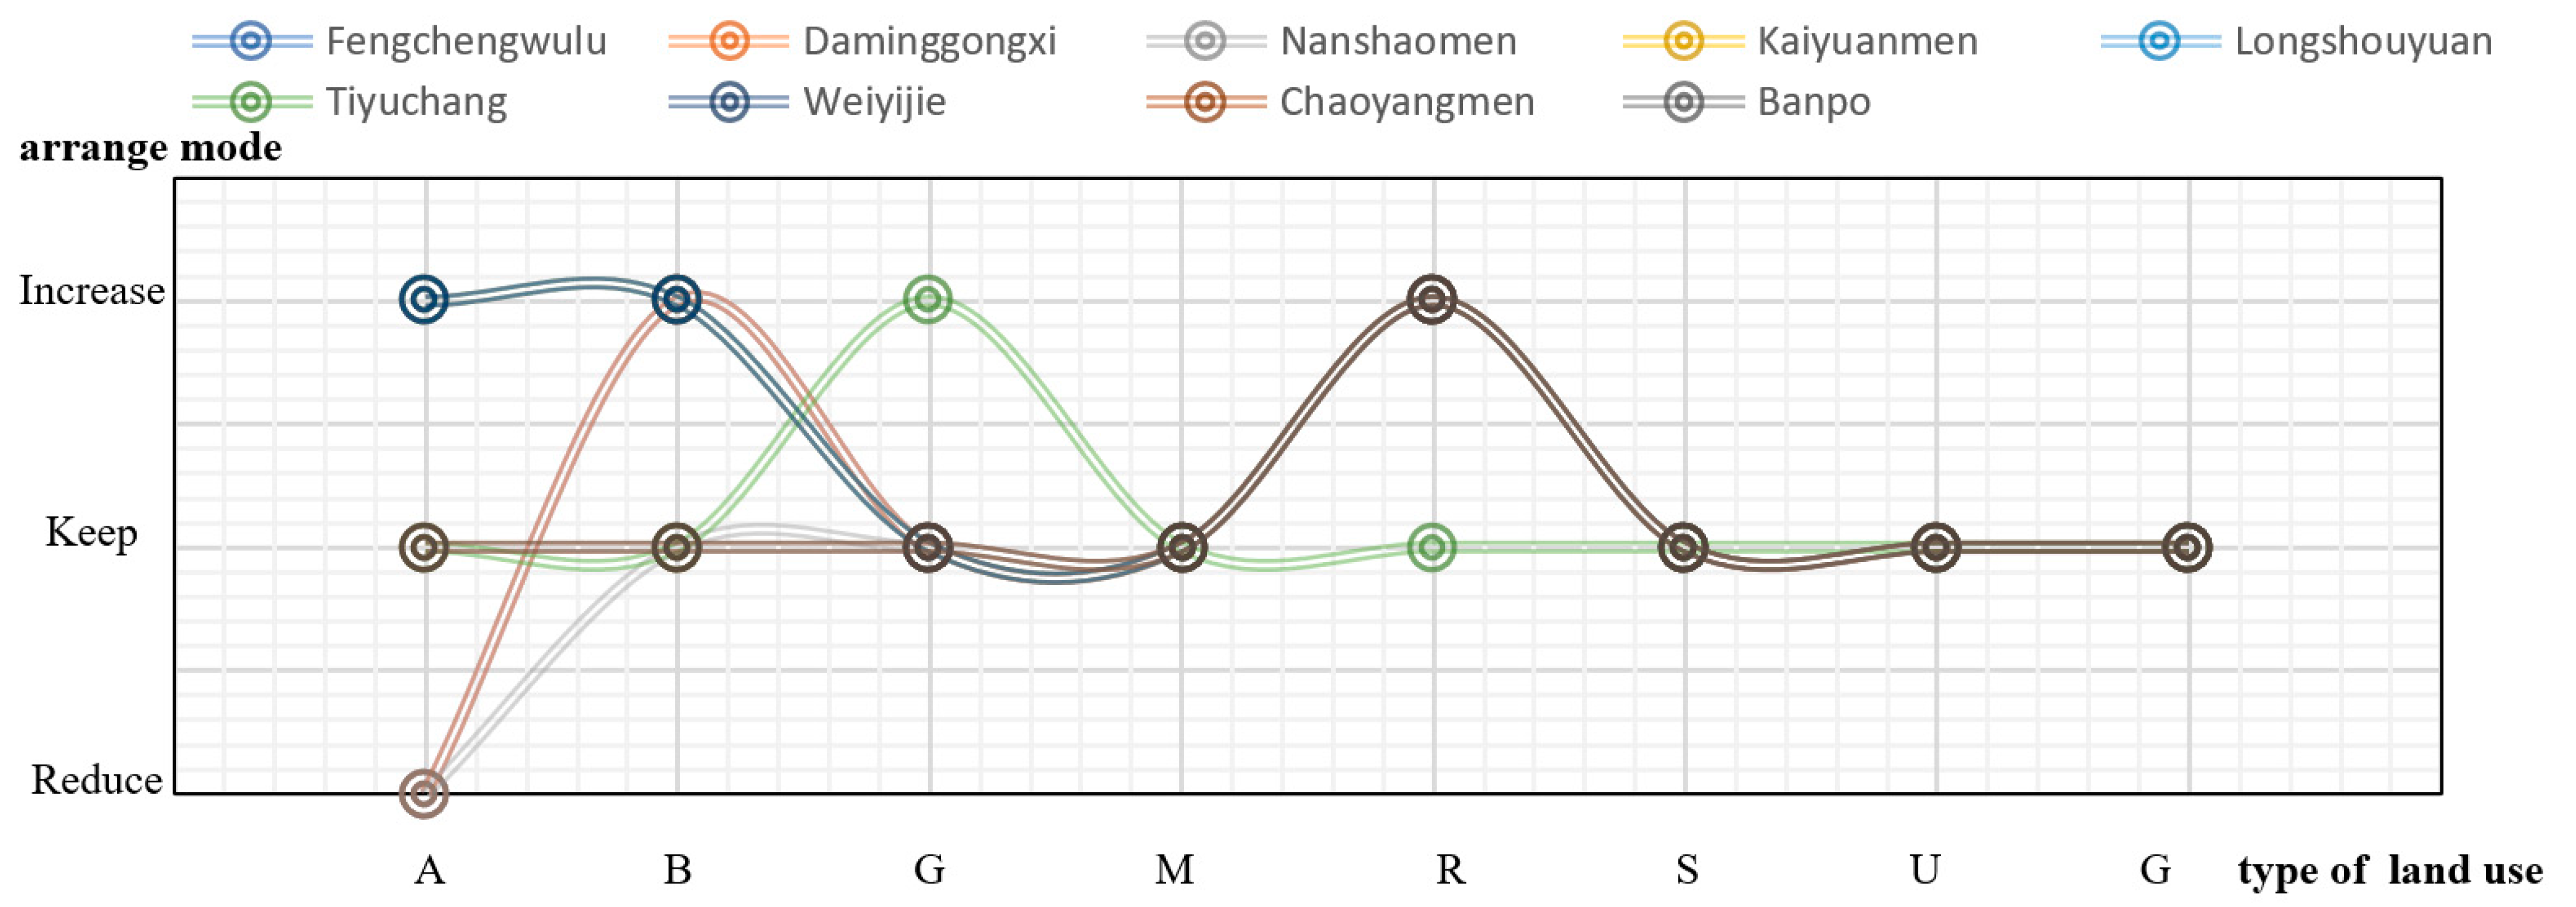
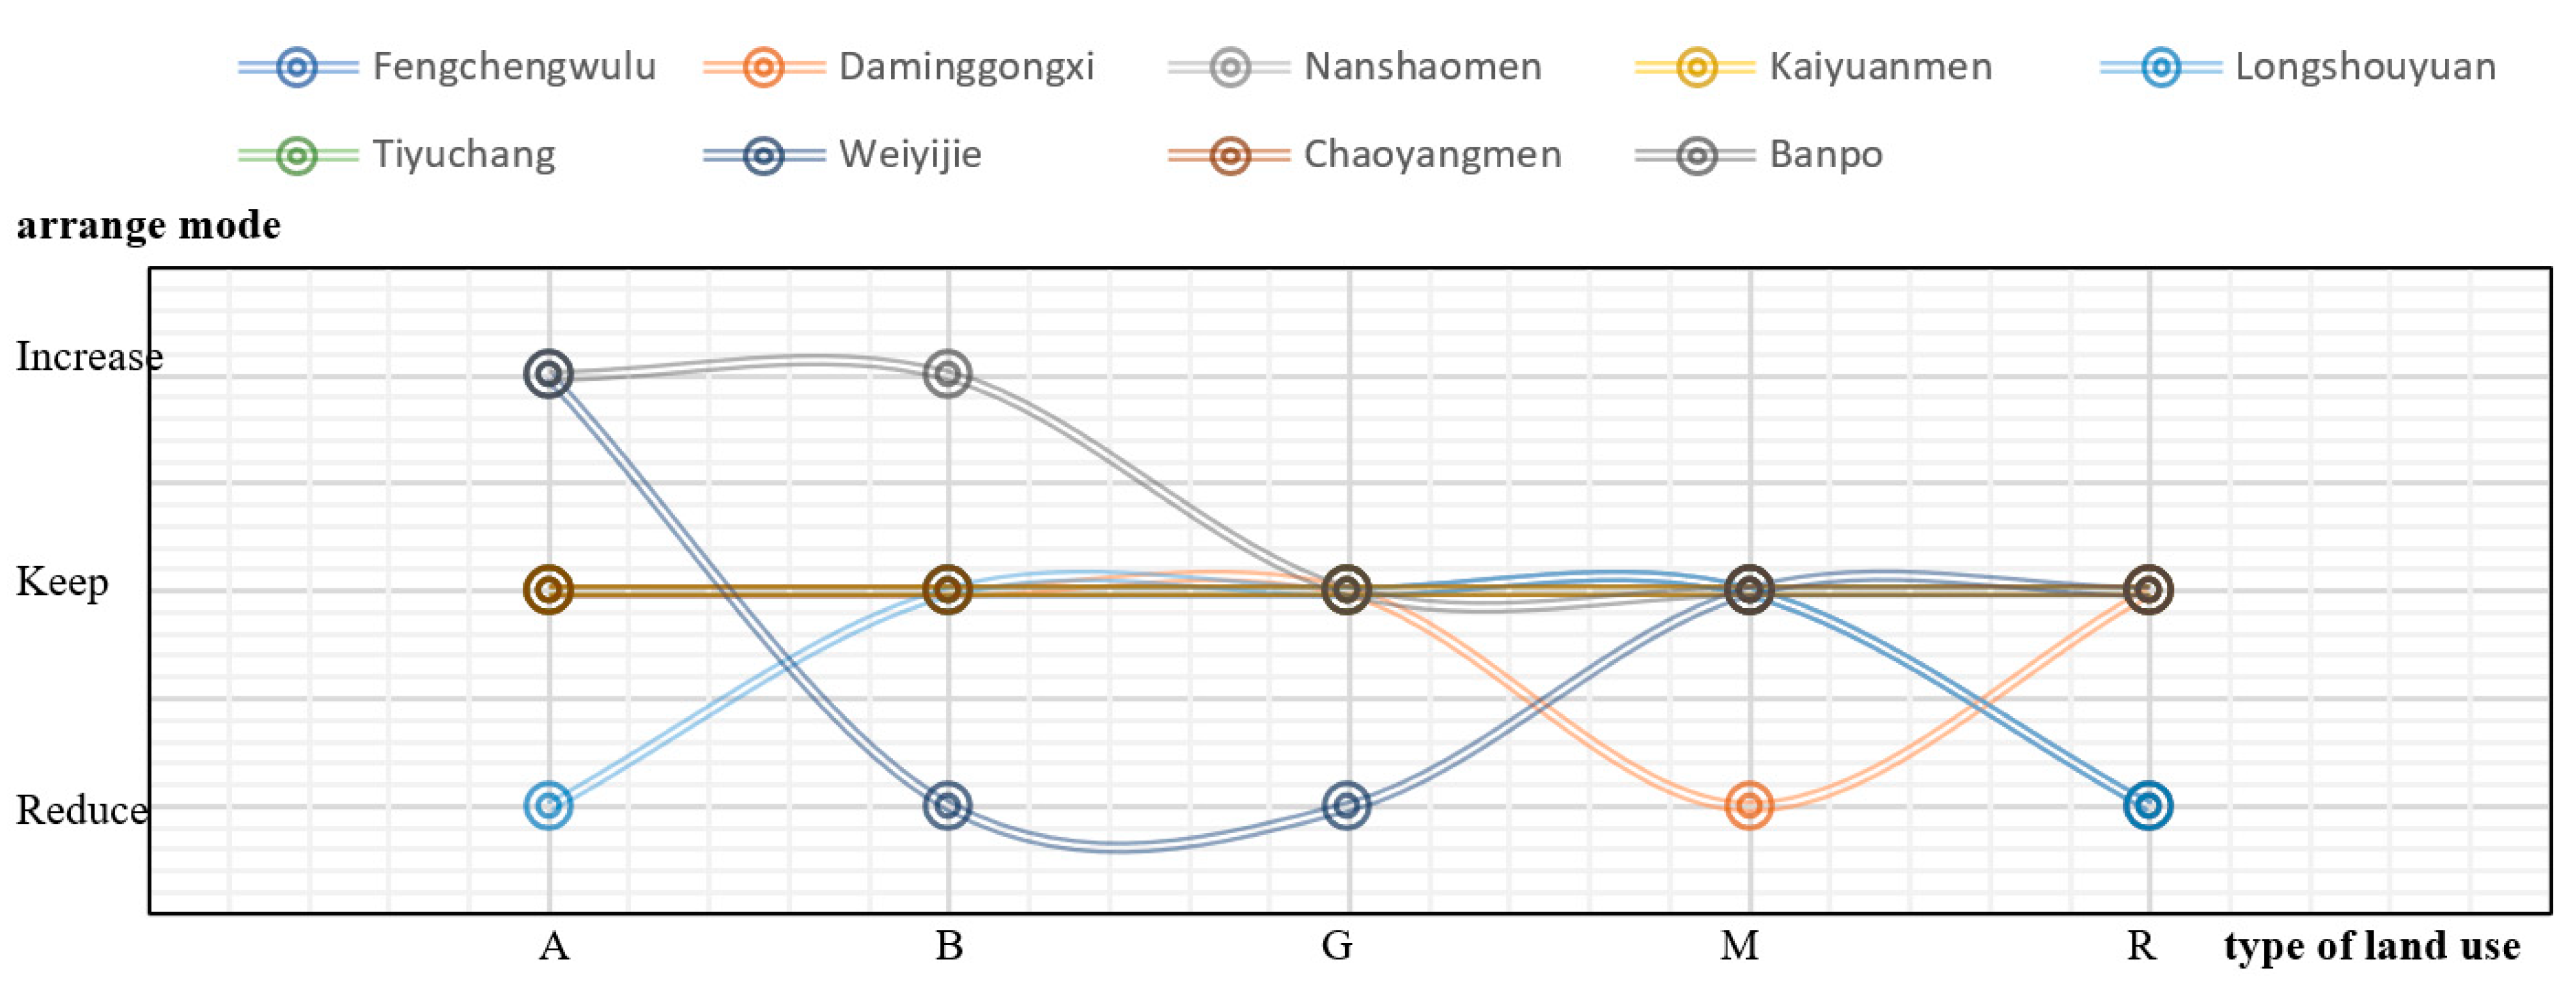
| Land classification | Fengchengwulu | Daminggongxi | Nanshaomen | Kaiyuanmen | Longshouyuan | Tiyuchang | Weiyijie | Chaoyangmen | Banpo |
|---|---|---|---|---|---|---|---|---|---|
| A | Remain | Remain | Remain | Increase | Increase | Remain | Increase | Remain | Remain |
| B | Increase | Increase | Remain | Increase | Increase | Increase | Increase | Increase | Increase |
| G | Remain | Remain | Increase | Remain | |||||
| M | Remain | Remain | Remain | Remain | |||||
| R | Increase | Increase | Increase | Increase | Increase | Increase | Increase | Increase | |
| S | Remain | Remain | |||||||
| U | Remain | Remain | Remain | Remain | |||||
| A, land for public administration and public service facilities; B, land for commercial service facilities; G, land for green space and squares; M, industrial land; R, residential land; S, land for roads and transportation facilities; U, land for utilities. | |||||||||
Publisher’s Note: MDPI stays neutral with regard to jurisdictional claims in published maps and institutional affiliations. |
© 2022 by the authors. Licensee MDPI, Basel, Switzerland. This article is an open access article distributed under the terms and conditions of the Creative Commons Attribution (CC BY) license (https://creativecommons.org/licenses/by/4.0/).
Share and Cite
Zhao, M.; Tong, H.; Li, B.; Duan, Y.; Li, Y.; Wang, J.; Lei, K. Analysis of Land Use Optimization of Metro Station Areas Based on Two-Way Balanced Ridership in Xi’an. Land 2022, 11, 1124. https://doi.org/10.3390/land11081124
Zhao M, Tong H, Li B, Duan Y, Li Y, Wang J, Lei K. Analysis of Land Use Optimization of Metro Station Areas Based on Two-Way Balanced Ridership in Xi’an. Land. 2022; 11(8):1124. https://doi.org/10.3390/land11081124
Chicago/Turabian StyleZhao, Meng, Haiyan Tong, Bo Li, Yaqiong Duan, Yubai Li, Jianpo Wang, and Kexin Lei. 2022. "Analysis of Land Use Optimization of Metro Station Areas Based on Two-Way Balanced Ridership in Xi’an" Land 11, no. 8: 1124. https://doi.org/10.3390/land11081124