
Integrating ANNs and Cellular Automata–Markov Chain to Simulate Urban Expansion with Annual Land Use Data

Abstract
:1. Introduction
2. Data and Methods
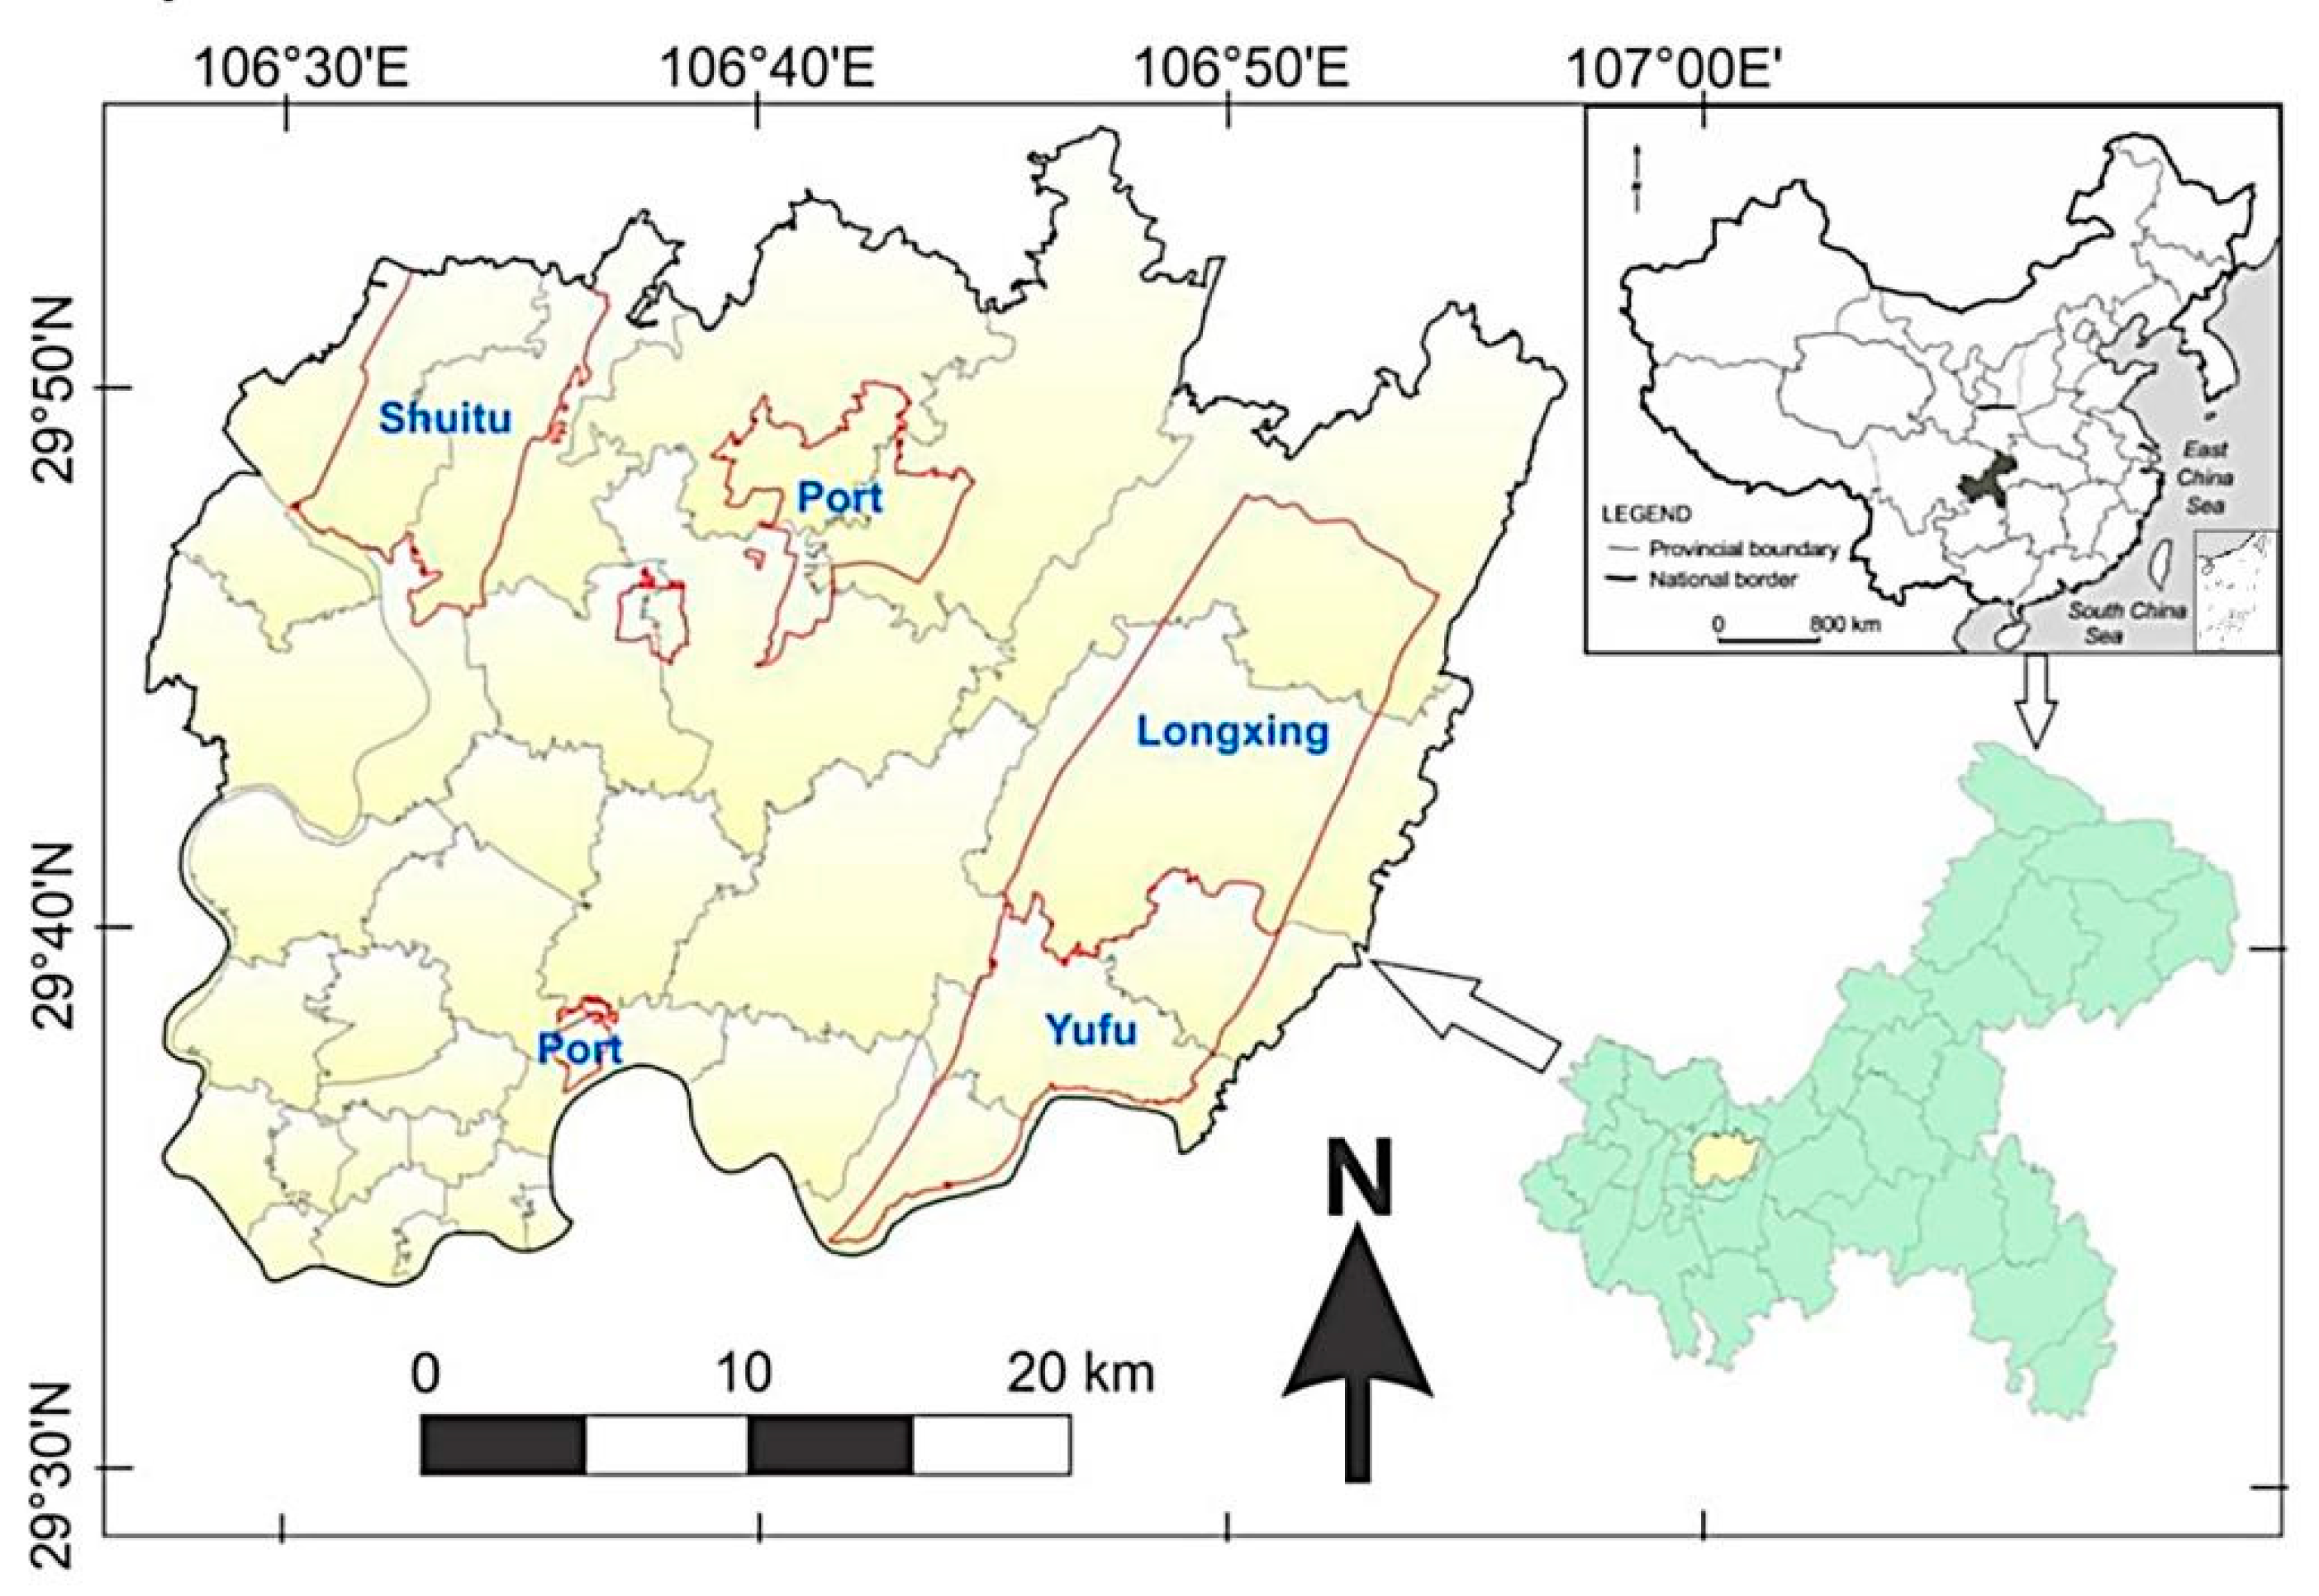
2.1. Study Area
2.2. Data
2.3. Methods
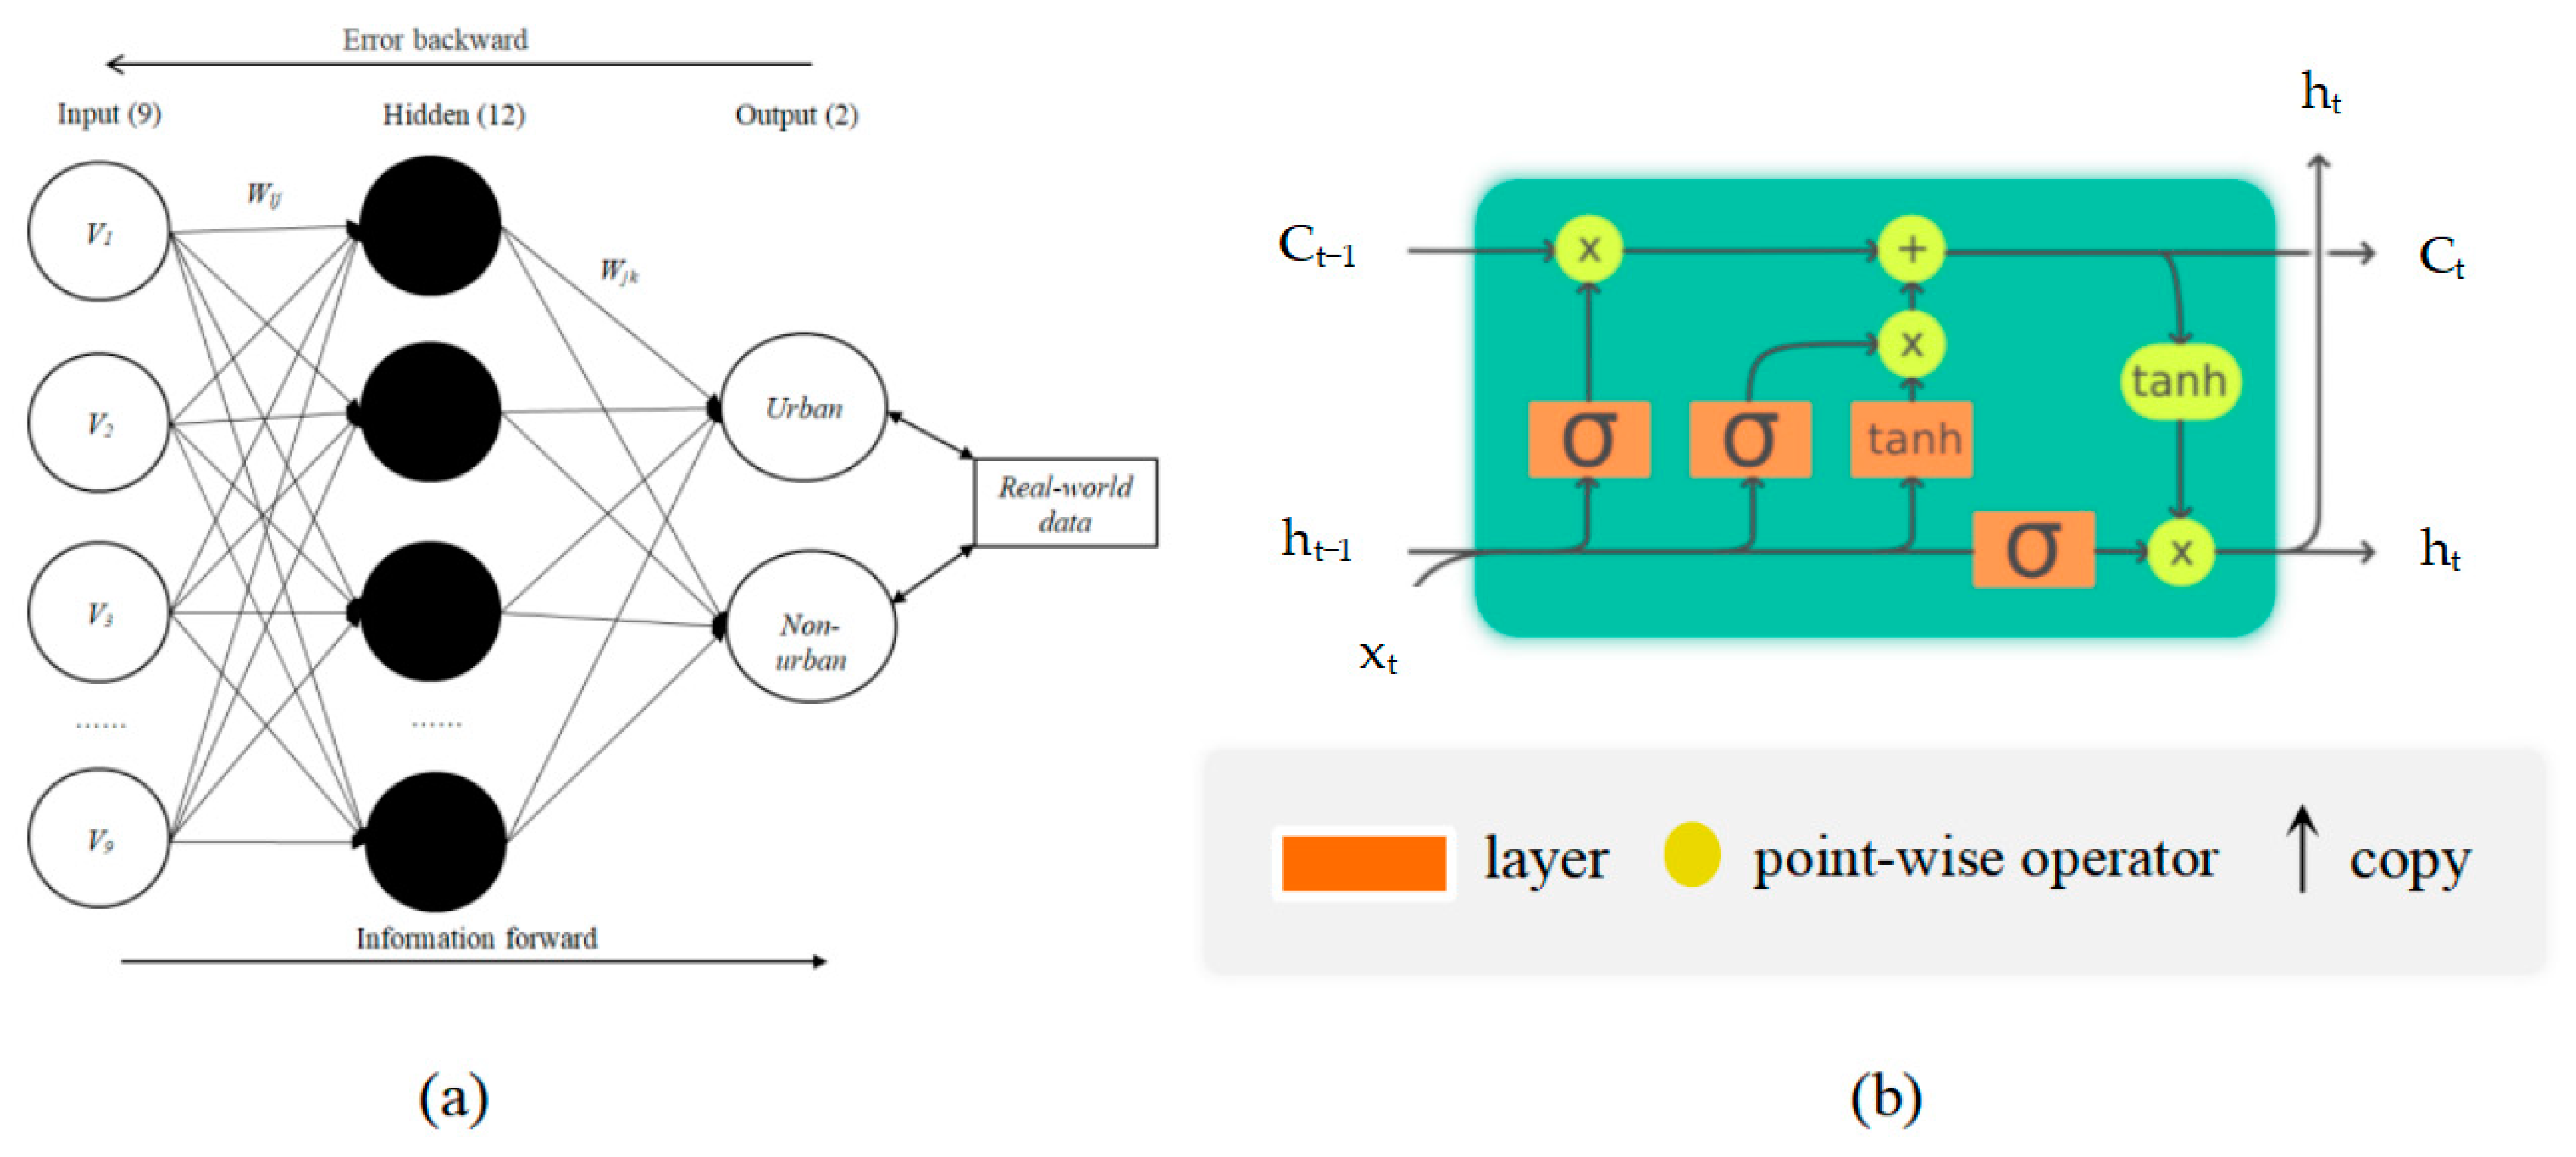
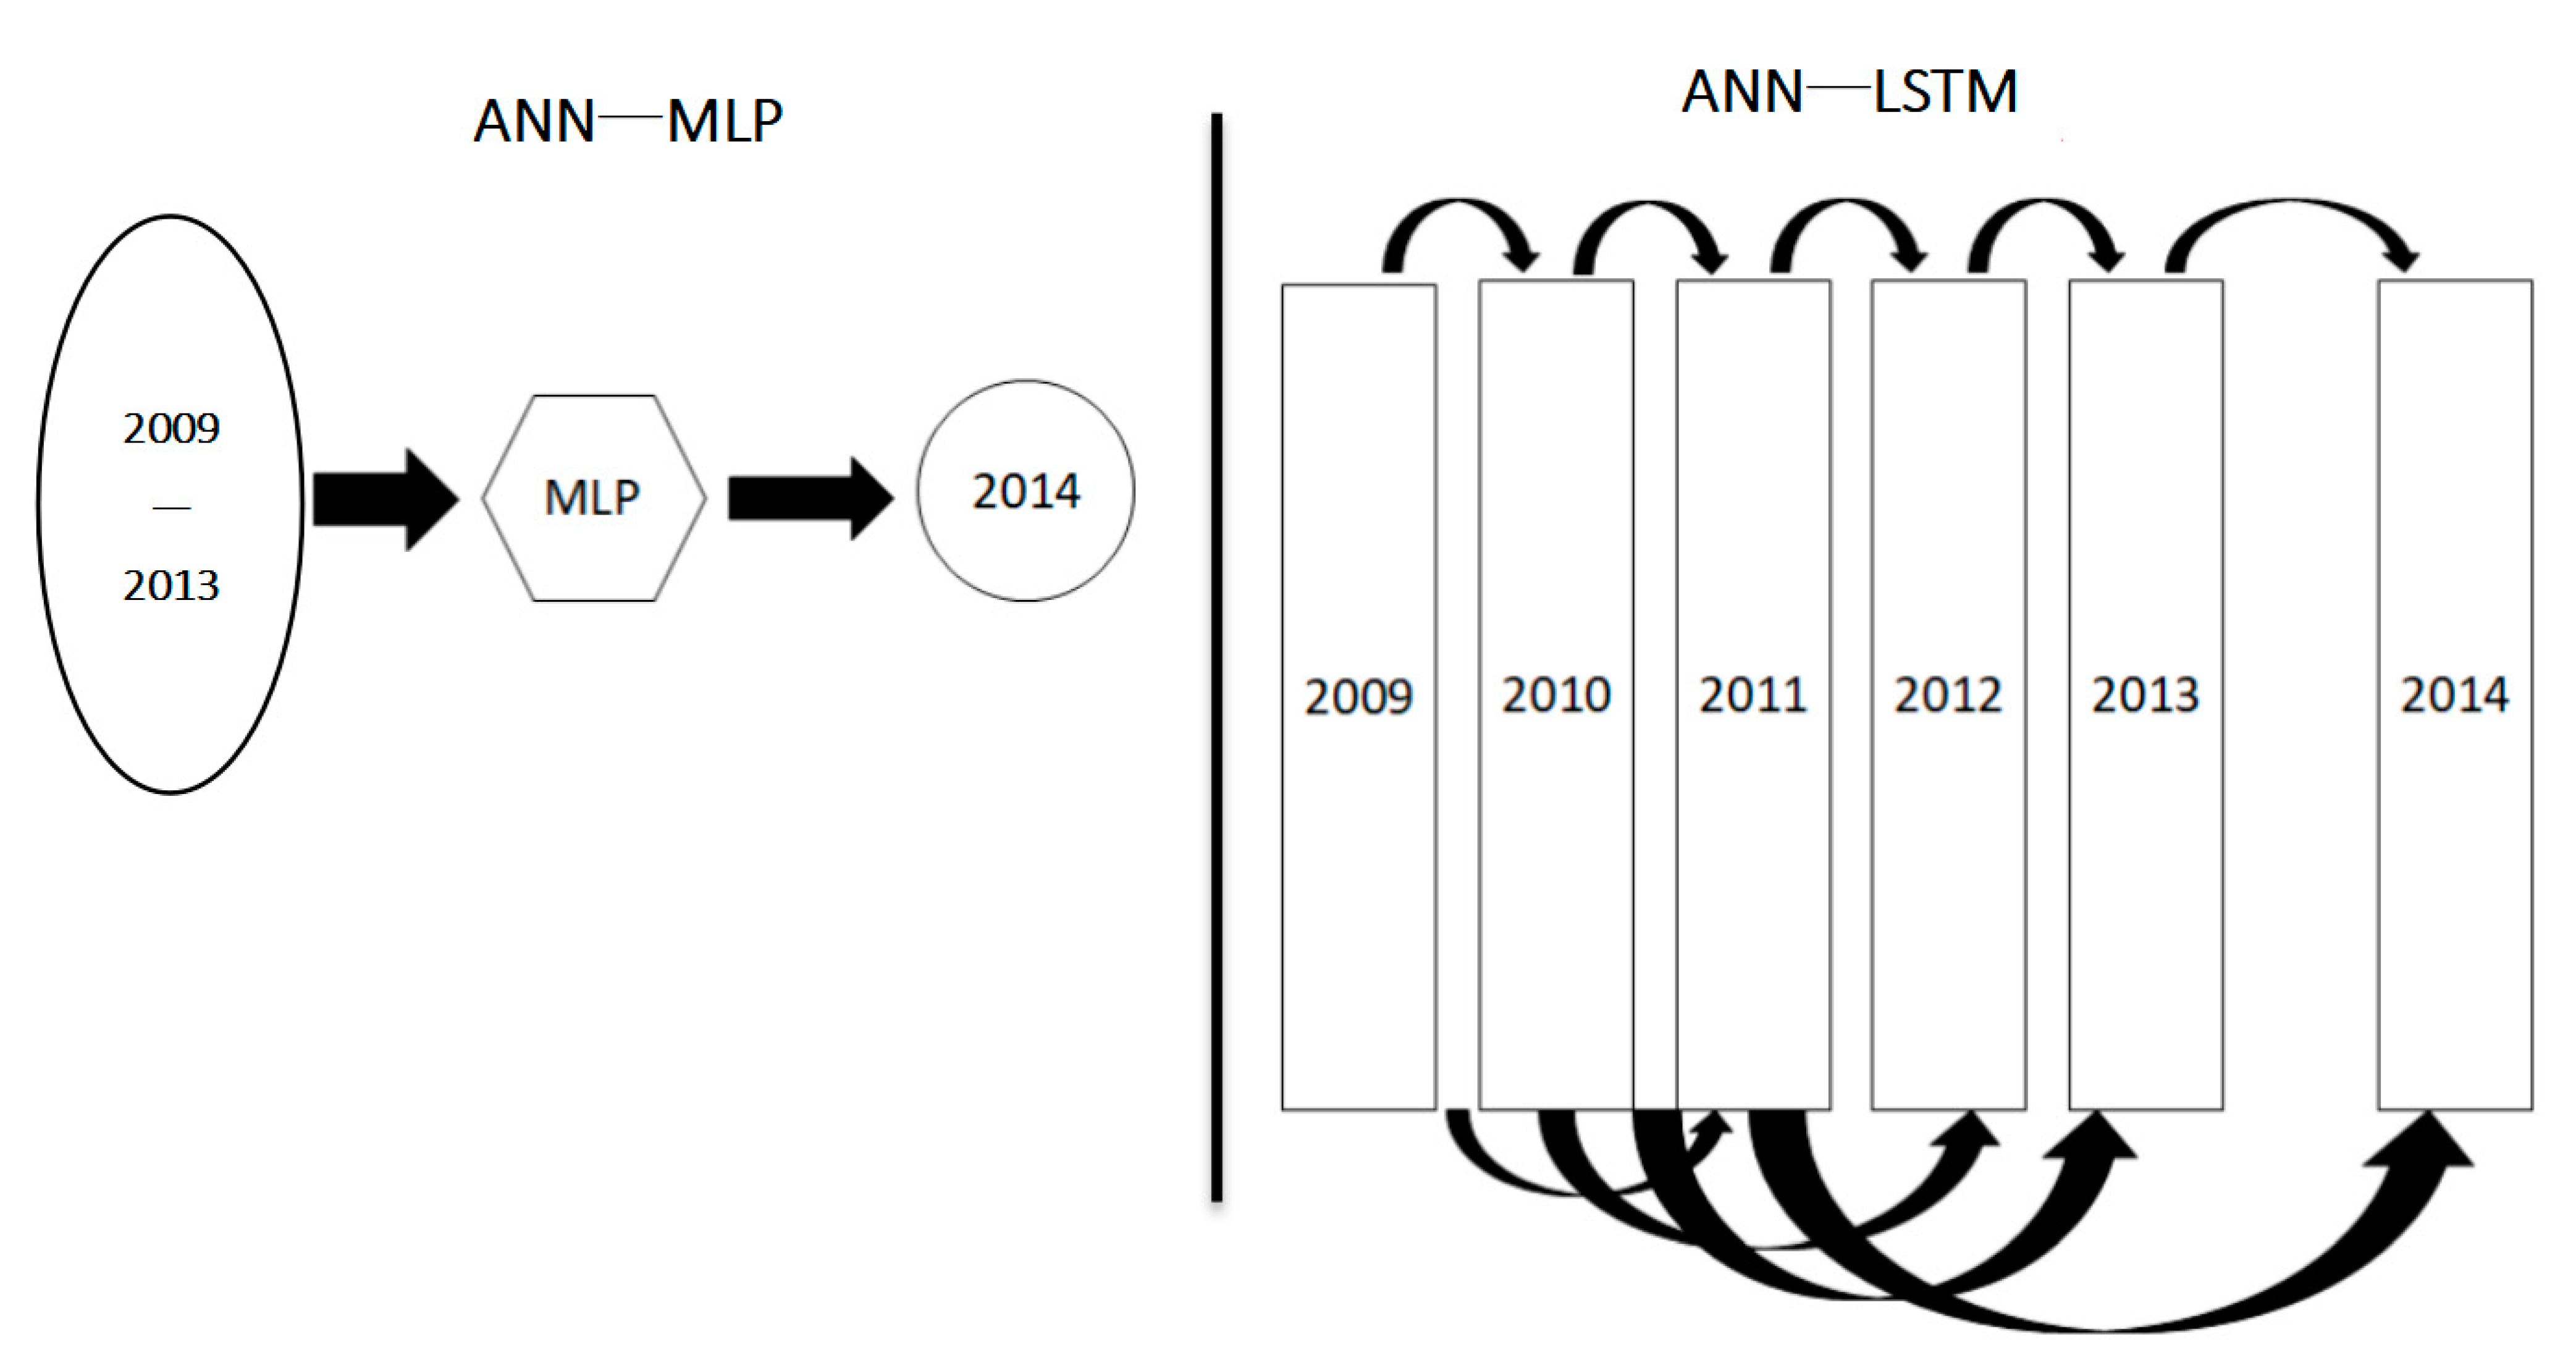
2.3.1. Artificial Neural Networks
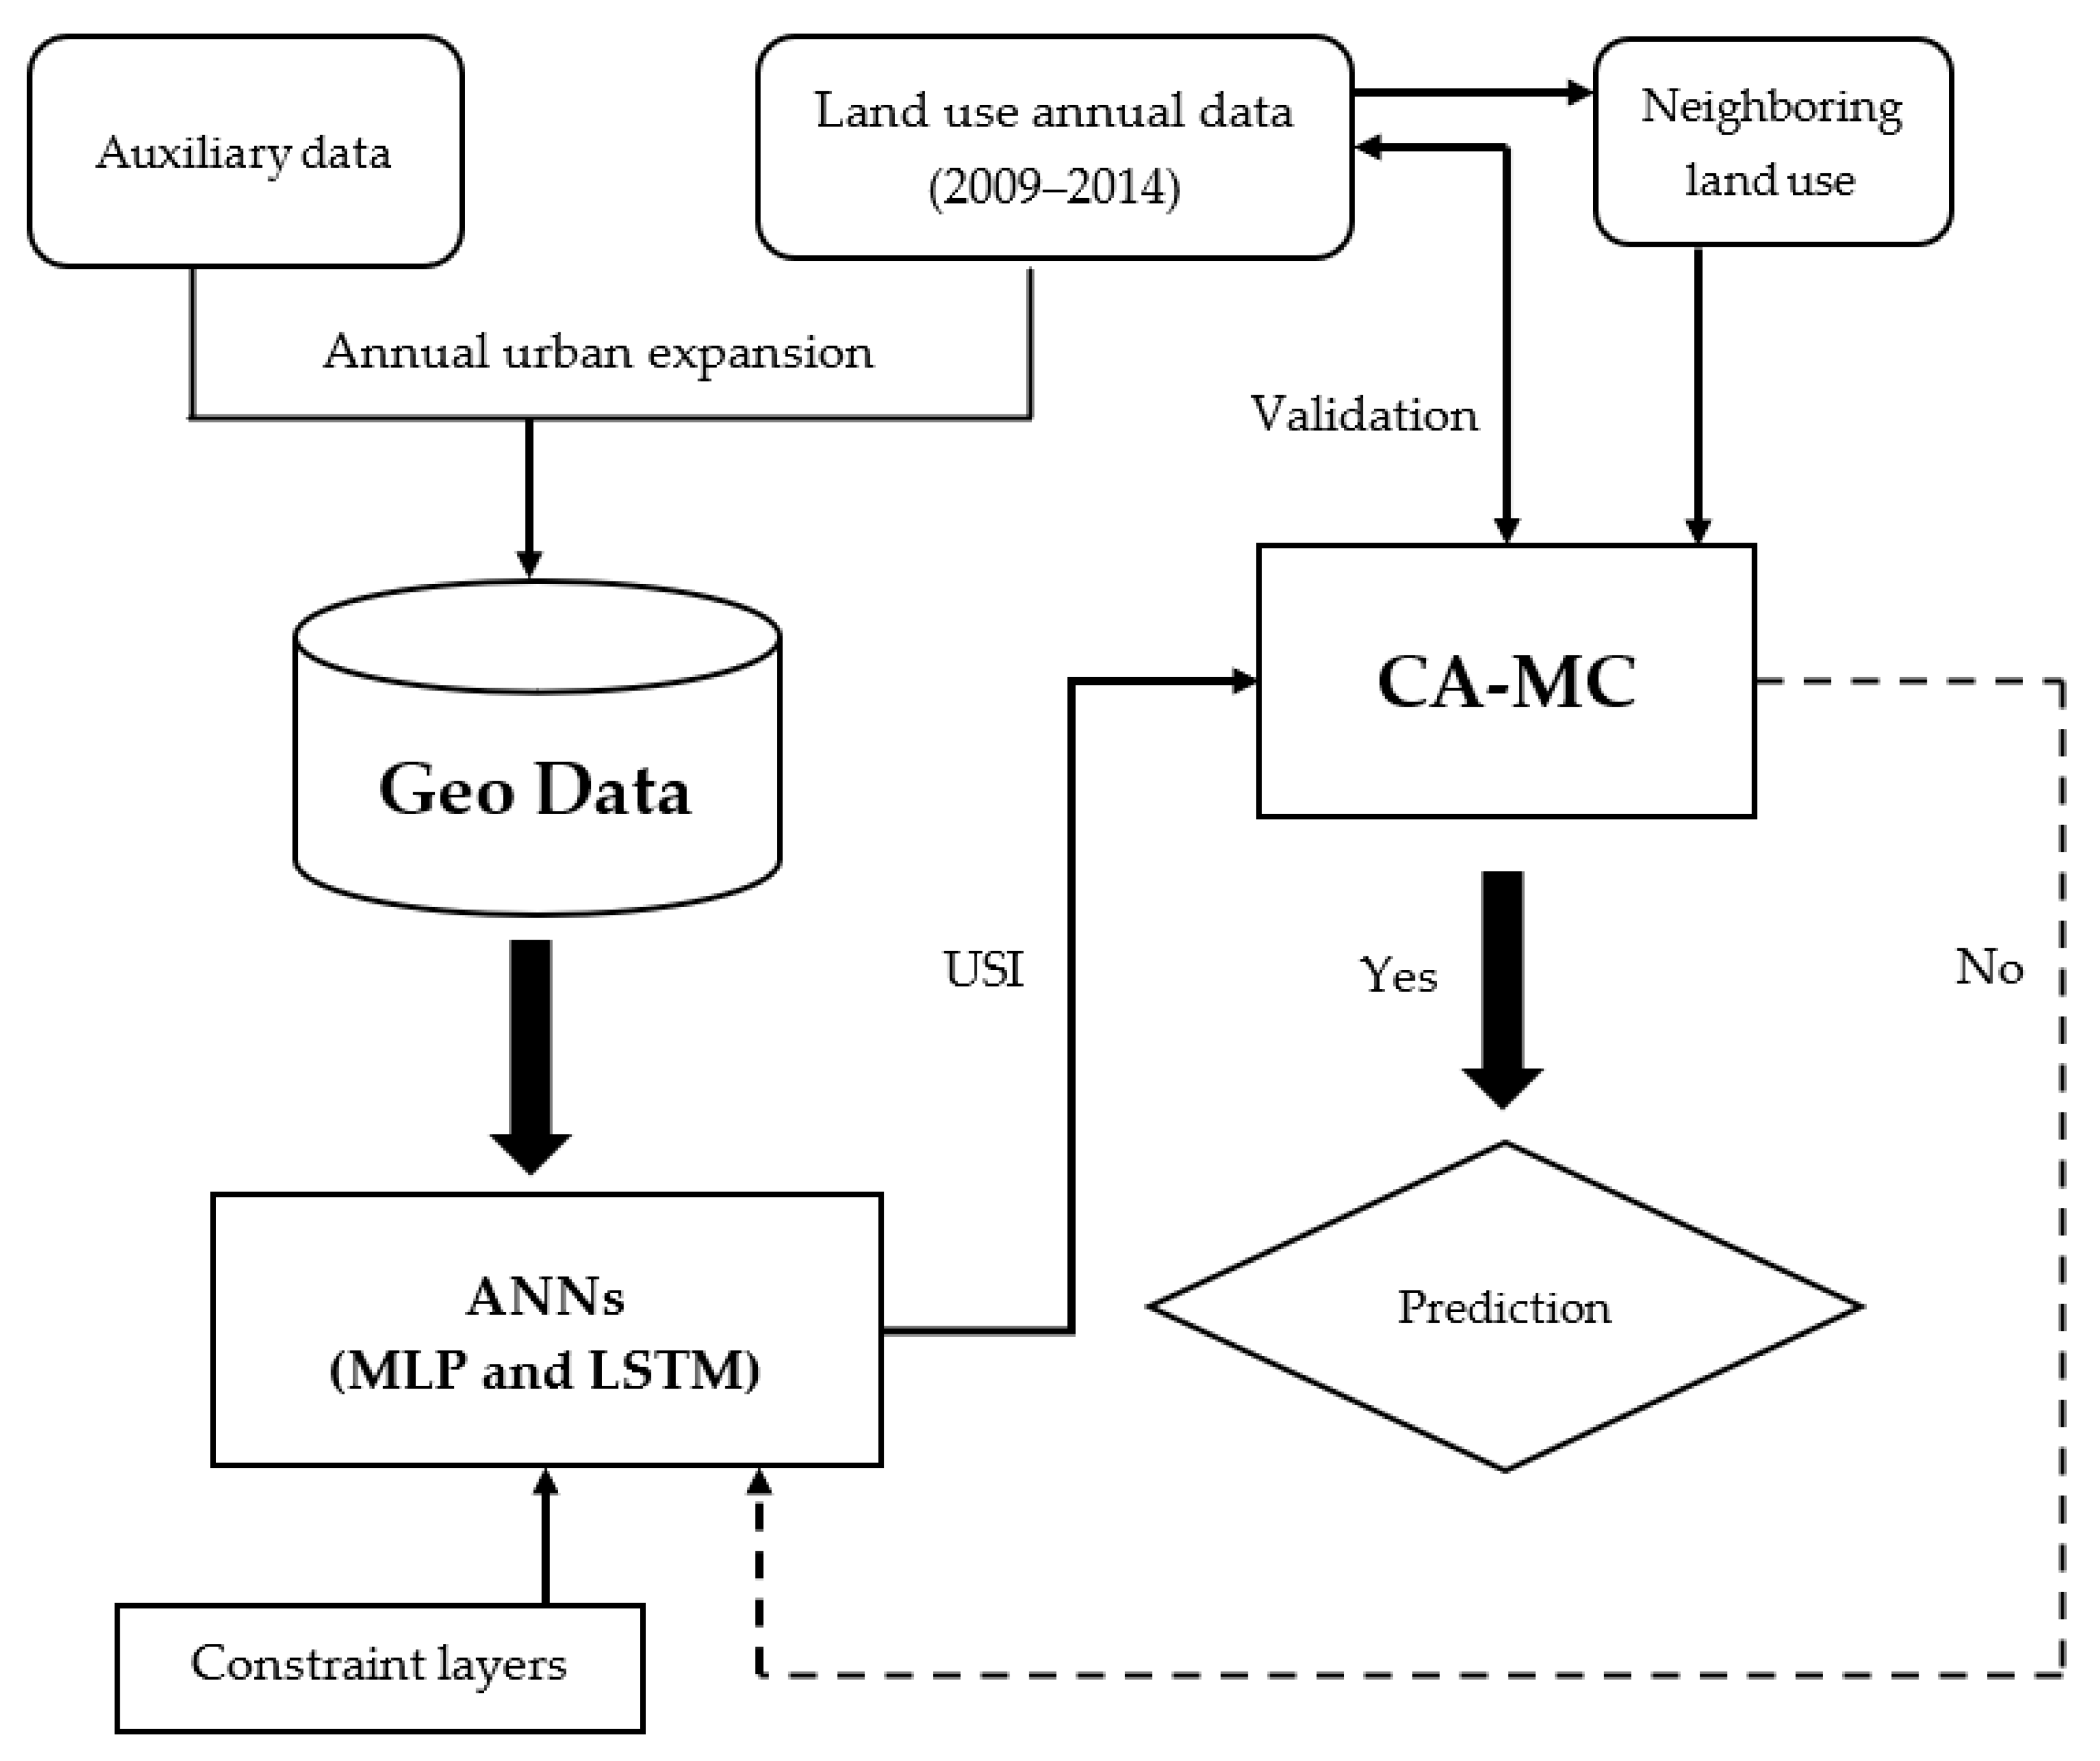
2.3.2. ANNs’ Integration with Markov Chain—Cellular Automata
2.4. Model Implementation
3. Results and Discussion
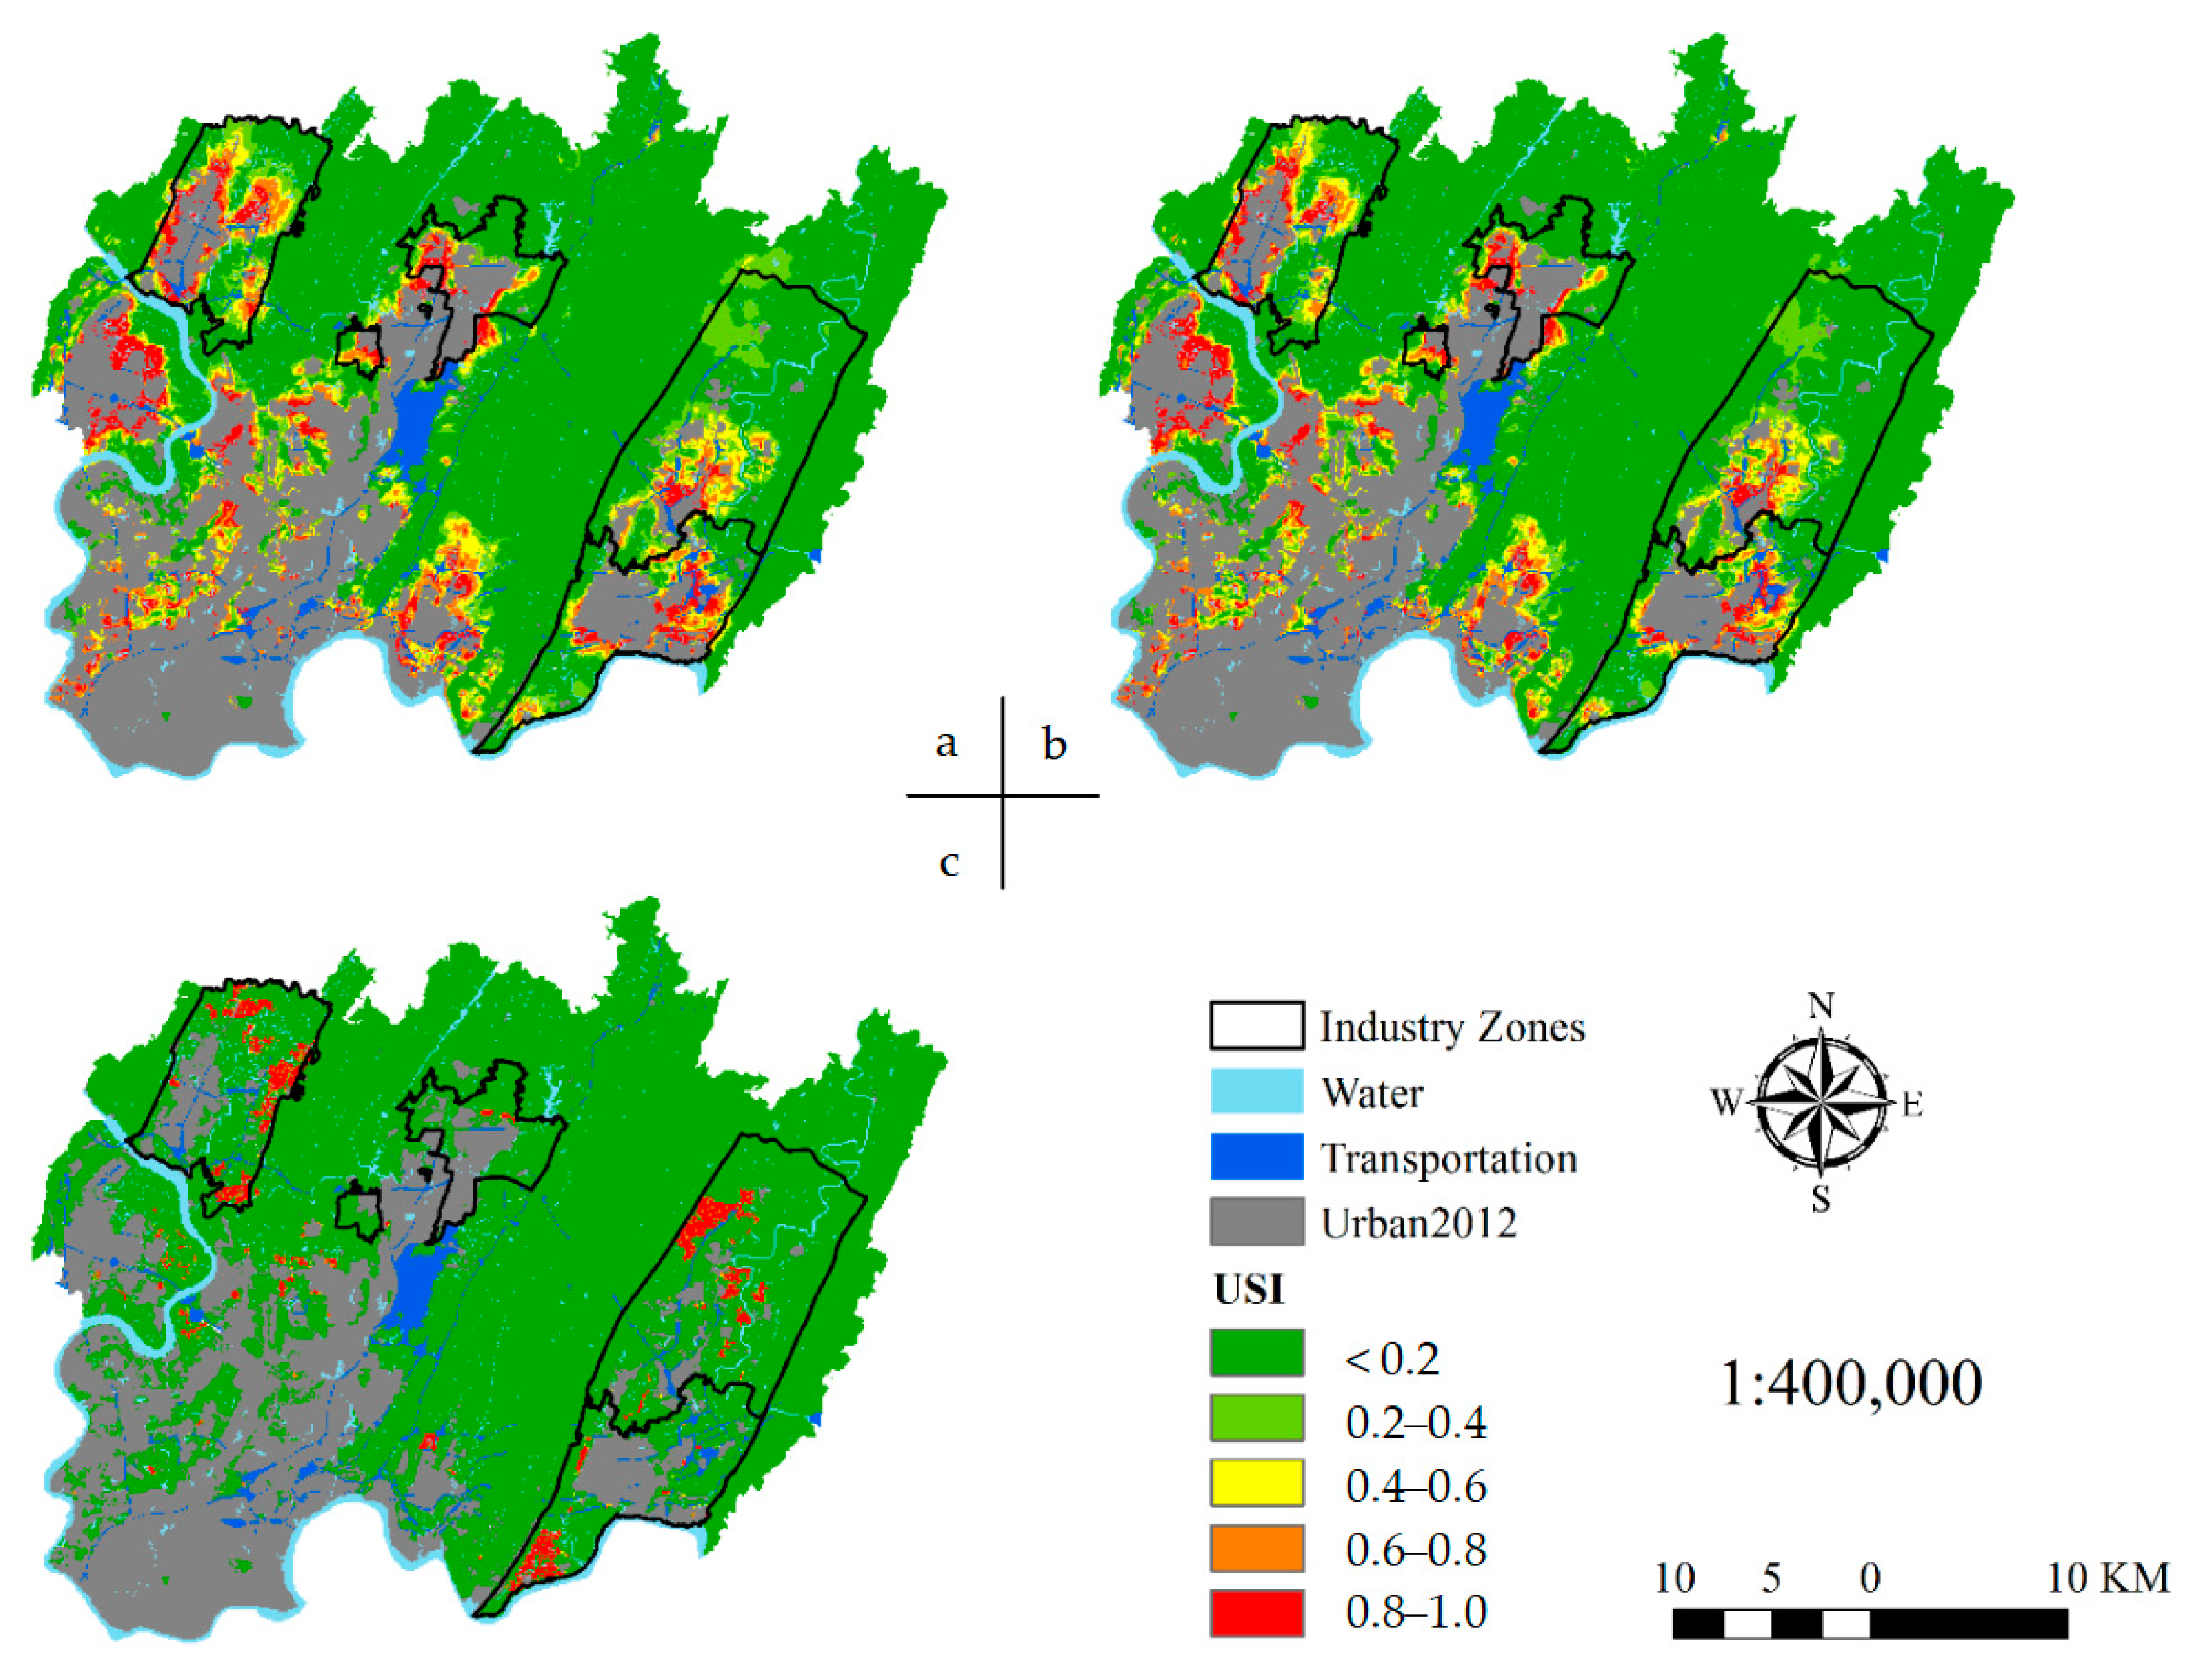
3.1. Urban Suitability Index Map
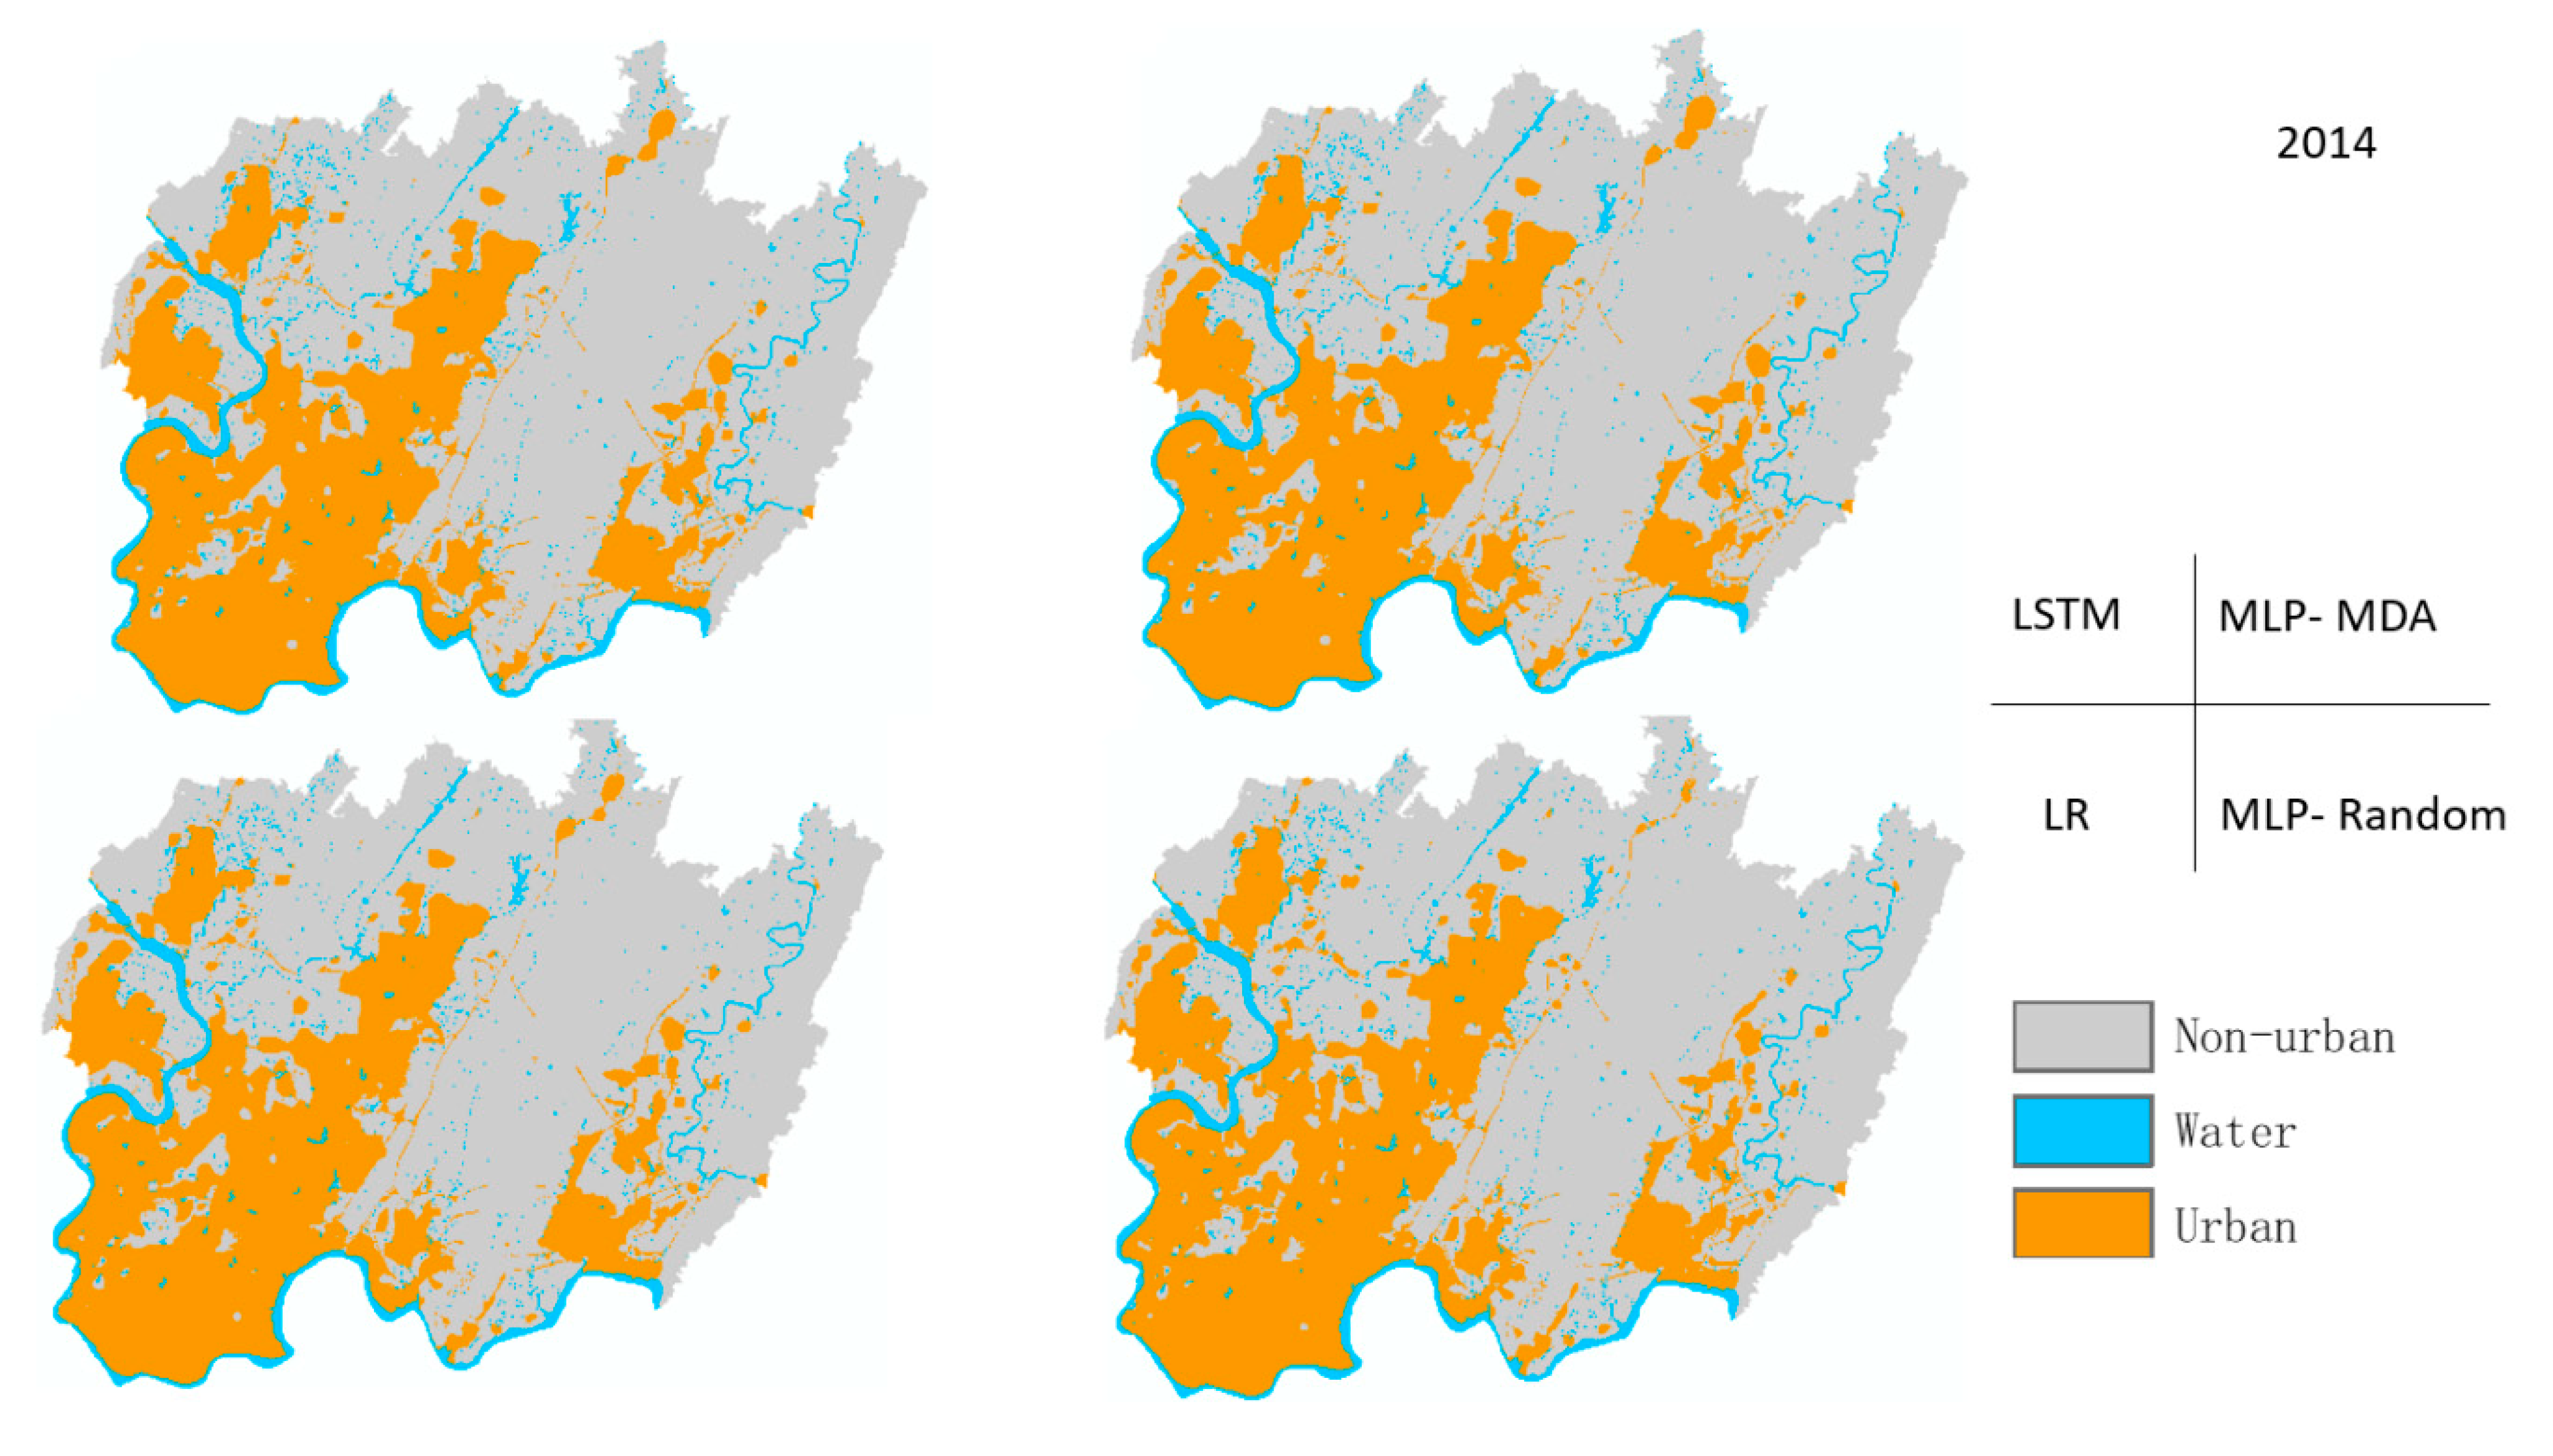
3.2. Model Validation
3.3. Model Result Comparison between the Liangjiang New Distract and Southern Auckland
4. Conclusions
Author Contributions
Funding
Institutional Review Board Statement
Informed Consent Statement
Data Availability Statement
Acknowledgments
Conflicts of Interest
References
- Demurger, S.; Sachs, J.D.; Woo, W.T.; Shuming, B.A.O.; Chang, G. The relative contributions of location and preferential policies in China’s regional development: Being in the right place and having the right incentives. China Econ. Rev. 2002, 13, 444–465. [Google Scholar] [CrossRef]
- Deng, X.Z.; Huang, J.K.; Rozelle, S.; Uchida, E. Growth, population and industrialization, and urban land expansion of China. J. Urban Econ. 2008, 63, 96–115. [Google Scholar] [CrossRef]
- Zhang, Q.; Wallace, J.; Dong, X.Z.; Seto, K.C. Central versus local states: Which matters more in affecting China’s urban growth? Land Use Policy 2014, 38, 487–496. [Google Scholar] [CrossRef]
- Engelfriet, L.; Koomen, E. The impact of urban form on commuting in large Chinese cities. Transportation 2018, 45, 1269–1295. [Google Scholar] [CrossRef] [Green Version]
- He, J.Q.; Wang, S.J.; Liu, Y.; Ma, H.T.; Liu, Q. Examining the relationship between urbanization and the eco-environment using a coupling analysis: Case study of Shanghai, China. Ecol. Indic. 2017, 77, 185–193. [Google Scholar] [CrossRef]
- Jat, M.K.; Garg, P.K.; Khare, D. Modelling of urban growth using spatial analysis techniques: A case study of Ajmer city (India). Int. J. Remote Sens. 2008, 29, 543–567. [Google Scholar] [CrossRef]
- Huang, B.; Zhang, L.; Wu, B. Spatiotemporal analysis of rural–urban land conversion. Int. J. Geogr. Inf. Sci. 2009, 23, 379–398. [Google Scholar] [CrossRef]
- Shafizadeh Moghadam, H.; Helbich, H. Spatiotemporal urbanization processes in the megacity of Mumbai, India: A Markov chains-cellular automata urban growth model. Appl. Geogr. 2013, 40, 140–149. [Google Scholar] [CrossRef]
- Shafizadeh-Moghadam, H.; Helbich, H. Spatiotemporal variability of urban growth factors: A global and local perspective on the megacity of Mumbai. Int. J. Appl. Earth Obs. Geoinf. 2015, 35 Pt B, 187–198. [Google Scholar] [CrossRef]
- Sudhira, H.S.; Ramachadra, T.V.; Jagadish, K.S. Urban sprawl: Metrics, dynamics and modelling using GIS. Int. J. Appl. Earth Obs. Geoinf. 2004, 5, 29–39. [Google Scholar] [CrossRef]
- Liu, J.; Liu, M.; Tian, H.; Zhuang, D.; Zhang, Z.; Zhang, W.; Deng, X. Spatial and temporal patterns of China’s cropland during 1990–2000: An analysis based on Landsat TM data. Remote Sens. Environ. 2005, 98, 442–456. [Google Scholar] [CrossRef]
- Deng, J.S.; Wang, K.; Hong, Y.; Qi, J.G. Spatio-temporal dynamics and evolution of land use change and landscape pattern in response to rapid urbanization. Landsc. Urban Plan. 2009, 92, 187–198. [Google Scholar] [CrossRef]
- Seto, K.C. Exploring the dynamics of migration to mega-delta cities in Asia and Africa: Contemporary drivers and future scenarios. Glob. Environ. Chang. 2011, 21 (Suppl. S1), S94–S107. [Google Scholar] [CrossRef]
- Jiang, L.; Deng, X.Z.; Seto, K.C. Multi-level modeling of urban expansion and cultivated land conversion for urban hotspot counties in China. Landsc. Urban Plan. 2012, 108, 131–139. [Google Scholar] [CrossRef]
- Ma, Y.; Xu, R. Remote sensing monitoring and driving force analysis of urban expansion in Guangzhou City, China. Habitat Int. 2010, 34, 228–235. [Google Scholar] [CrossRef]
- Arsanjani, J.; Helbich, M.; Kainz, W.; Boloorani, A.D. Integration of logistic regression, Markov chain and cellular automata models to simulate urban expansion. Int. J. Appl. Earth Obs. Geoinf. 2013, 21, 265–275. [Google Scholar] [CrossRef]
- Xu, C.; Liu, M.; Hong, C.; Chi, T.; An, S.; Yang, X. Temporal variation of characteristic scales in urban landscapes: An insight into the evolving internal structures of China’s two largest cities. Landsc. Ecol. 2012, 27, 1063–1074. [Google Scholar] [CrossRef]
- Liu, Y.; He, Q.; Tan, R.; Zhou, K.; Liu, G.; Tang, S. Urban growth modeling based on a game between farmers and governments: Case study of urban fringe in Wuhan, Hubei Province in China. J. Urban Plan. Dev. 2015, 142, 04015018. [Google Scholar] [CrossRef]
- Zhan, S.H. Hukou Reform and Land Politics in China: Rise of a Tripartite Alliance. China J. 2017, 78, 25–49. [Google Scholar] [CrossRef]
- Yue, W.Z.; Wang, R.L.; Fan, B.L. Spatial patterns analysis of urban expansion in Hangzhou city. J. ZheJiang Univ. (Sci. Ed.) 2013, 40, 596–605. [Google Scholar]
- Michael, W.; Franz, F. Land-Use Transport Interaction: State of the Art. Available online: https://ssrn.com/abstract=1434678 (accessed on 1 January 2004).
- Wegener, M. Land-Use Transport Interaction Models. In Handbook of Regional Science; Fischer, M., Nijkamp, P., Eds.; Springer: Berlin/Heidelberg, Germany, 2014. [Google Scholar]
- Dingil, A.E.; Rupi, F.; Esztergár-Kiss, D. An Integrative Review of Socio-Technical Factors Influencing Travel Decision-Making and Urban Transport Performance. Sustainability 2021, 13, 10158. [Google Scholar] [CrossRef]
- Batty, M.; Xie, Y.; Sun, Z. Modeling urban dynamics through GIS-based cellular automata. Comput. Environ. Urban Syst. 1999, 23, 205–233. [Google Scholar] [CrossRef] [Green Version]
- Li, X.; Yeh, A.G.O. Modelling sustainable urban development by the integration of constrained cellular automata and GIS. Int. J. Geogr. Inf. Sci. 2000, 14, 131–152. [Google Scholar] [CrossRef]
- Aburas, M.M.; Ho, Y.M.; Ramli, M.F.; Ash’aari, Z.H. The simulation and prediction of spatio-temporal urban growth trends using cellular automata models: A review. Int. J. Appl. Earth Obs. Geoinf. 2016, 52, 380–389. [Google Scholar] [CrossRef]
- Arsanjani, J.J.; Helbich, M.; de Noronha Vaz, E. Spatiotemporal simulation of urban growth patterns using agent-based modeling: Case Tehran. Cities 2013, 32, 33–42. [Google Scholar] [CrossRef]
- Zhang, H.; Jin, X.; Wang, L.; Zhou, Y.; Shu, B. Multi-agent based modeling of spatiotemporal dynamical urban growth in developing countries: Simulating future scenarios of Lianyungang city, China. Stoch. Environ. Res. Risk Assess. 2015, 29, 63–78. [Google Scholar] [CrossRef]
- Pijanowski, B.C.; Brown, D.G.; Shellito, B.A.; Manik, G.A. Using neural networks and GIS to forecast land use changes: A land transformation model. Comput. Environ. Urban Syst. 2002, 26, 553–575. [Google Scholar] [CrossRef]
- Jat, M.K.; Choudhary, M.; Saxena, A. Urban growth assessment and prediction using RS, GIS and SLEUTH model for a heterogeneous urban fringe. Egypt. J. Remote Sens. Space Sci. 2017, 10, 1–19. [Google Scholar]
- White, R.; Engelen, G.; Uljee, I. Modeling Cities and Regions as Complex Systems; MIT Press: Cambridge, MA, USA, 2015. [Google Scholar]
- White, R. Cities and cellular automata. Discret. Dyn. Nat. Soc. 1998, 2, 111–125. [Google Scholar] [CrossRef]
- Kim, Y.; Safikhani, A.; Tepe, E. Machine learning application to spatio-temporal modeling of urban growth. Comput. Environ. Urban Syst. 2022, 94, 101801. [Google Scholar] [CrossRef]
- Yi, S.; Zhou, Y.; Li, Q. A New Perspective for Urban Development Boundary Delineation Based on the MCR Model and CA-Markov Model. Land 2022, 11, 401. [Google Scholar] [CrossRef]
- Ghosh, P.; Mukhopadhyay, A.; Chanda, A.; Mondal, P.; Akhand, A.; Mukherjee, S.; Hazra, S. Application of Cellular automata and Markov-chain model in geospatial environmental modeling—A review. Remote Sens. Appl. Soc. Environ. 2017, 5, 64–77. [Google Scholar] [CrossRef]
- Islam, K.; Rahman, M.F.; Jashimuddin, M. Modeling land use change using Cellular Automata and Artificial Neural Network: The case of Chunati Wildlife Sanctuary, Bangladesh. Ecol. Indic. 2018, 88, 439–453. [Google Scholar] [CrossRef]
- Hagenauer, J.; Helbich, M. Mining urban land-use patterns from volunteered geographic information by means of genetic algorithms and artificial neural networks. Int. J. Geogr. Inf. Sci. 2012, 26, 963–982. [Google Scholar] [CrossRef]
- Pijanowski, B.C.; Tayyebi, A.; Doucette, J.; Pekin, B.K.; Braun, D.; Plourde, J. A big data urban growth simulation at a national scale: Configuring the GIS and neural network based land transformation model to run in a high performance computing (HPC) environment. Environ. Model. Softw. 2014, 51, 250–268. [Google Scholar] [CrossRef]
- Paliwal, M.; Kumar, U.A. Neural Networks and Statistical Techniques: A Review of Applications. Expert Syst. Appl. 2009, 36, 2–17. [Google Scholar] [CrossRef]
- Berberoğlu, S.; Akın, A.; Clarke, K.C. Cellular automata modeling approaches to forecast urban growth for Adana, Turkey: A comparative approach. Landsc. Urban Plan. 2016, 153, 11–27. [Google Scholar] [CrossRef]
- Li, X.; Yeh, A.G.O. Neural-network-based cellular automata for simulating multiple land use changes using GIS. Int. J. Geogr. Inf. Sci. 2002, 16, 323–343. [Google Scholar] [CrossRef]
- Xu, T.; Gao, J.; Coco, G. Simulation of urban expansion via integrating artificial neural network with Markov chain–cellular automata. Int. J. Geogr. Inf. Sci. 2019, 33, 1960–1983. [Google Scholar] [CrossRef]
- Xu, T.; Gao, J.; Coco, G. Extraction of urban built-up areas from nighttime lights using artificial neural network. Geocarto Int. 2020, 35, 1049–1066. [Google Scholar] [CrossRef]
- Xu, T.; Gao, J.; Li, Y. Machine learning-assisted evaluation of land use policies and plans in a rapidly urbanizing district in Chongqing, China. Land Use Policy 2019, 87, 30–40. [Google Scholar] [CrossRef]
- Park, S.; Jeon, S.; Kim, S.; Choi, C. Prediction and comparison of urban growth by land suitability index mapping using GIS and RS in South Korea. Landsc. Urban Plan. 2011, 99, 104–114. [Google Scholar] [CrossRef]
- Rumelhart, D.; Hinton, G.; Williams, R. Learning internal representations by error propagation. In Parallel Distributed Processing: Explorations in the Microstructures of Cognition; Rumelhart, D.E., McClelland, J.L., Eds.; MIT Press: Cambridge, UK, 1986; Volume 1, pp. 318–362. [Google Scholar]
- Lipton, Z.C.; Berkowitz, J.; Elkan, C. A critical review of recurrent neural networks for sequence learning. arXiv 2015, arXiv:1506.00019. [Google Scholar]
- Hagan, M.T.; Demuth, H.B.; Beale, M.H. Neural Network Design; PWS Publishing: Boston, MA, USA, 1996. [Google Scholar]
- van Vliet, J.; Bregt, A.K.; Hagen-Zanker, A. Revisiting Kappa to account for change in the accuracy assessment of land-use change models. Ecol. Model. 2011, 222, 1367–1375. [Google Scholar] [CrossRef]
- Deng, Y. The Strategy Research for the Character of LiangJiang New District during the “Openning West”; Xian Technology University: Xi’an, China, 2011. [Google Scholar]
- Fu, F.C.; Zhou, B.T.; Liang, K.X. Research of the Ecosystem Services Value (ESV) of Land Use in Liangjiang New Area of Chongqing. J. Southwest China Norm. Univ. (Nat. Sci. Ed.) 2012, 37, 67–73. [Google Scholar]
- Fu, J.P. Study on Land Use Change of Liangjiang New Area in Chongqing. J. Green Sci. Technol. 2017, 2017, 180–182. [Google Scholar]
- Wang, J.; Chen, Y.Q.; Shao, X.M.; Zhang, Y.Y.; Cao, Y.G. Land-use changes and policy dimension driving forces in China: Present, trend and future. Land Use Policy 2012, 29, 737–749. [Google Scholar] [CrossRef]
- Li, L. State rescaling and national new area development in China: The case of Chongqing Liangjiang. Habitat Int. 2015, 50, 80–89. [Google Scholar] [CrossRef]
- Auckland City Council. The Auckland Plan. Available online: https://www.aucklandcouncil.govt.nz/plansprojects-policies-reports-bylaws/our-plans-strategies/Documents/auckland-plan-2012-fulldocument.pdf (accessed on 15 January 2012).
- Auckland Regional Council. A Brief History of Auckland’s Urban Form. Auckland Council: Scientific Report. 2010. Available online: http://knowledgeauckland.org.nz/assets/publications/Brief_history_of_Auckland_s_urban_form.pdf (accessed on 30 November 2010).
- Chen, T.; Chiu, H.; Lin, Y. How do East and Southeast Asian Cities Differ from Western Cities? A Systematic Review of the Urban Form Characteristics. Sustainability 2020, 12, 2423. [Google Scholar] [CrossRef] [Green Version]
- Cegielska, K.; Noszczyk, T.; Kukulska, A.; Szylar, M.; Hernik, J.; Dixon-Gough, R.; Jombach, S.; Valánszki, I.; Kovács, K.F. Land use and land cover changes in post-socialist countries: Some observations from Hungary and Poland. Land Use Policy 2018, 78, 1–18. [Google Scholar] [CrossRef]
- Liu, Y.; Li, J.; Yang, Y. Strategic adjustment of land use policy under the economic transformation. Land Use Policy 2018, 74, 5–14. [Google Scholar] [CrossRef]
- Zhu, J.; Simarmata, H.A. Formal land rights versus informal land rights: Governance for sustainable urbanization in the Jakarta metropolitan region, Indonesia. Land Use Policy 2015, 43, 63–73. [Google Scholar] [CrossRef]
- Mustafa, A.; Cools, M.; Saadi, I.; Teller, J. Coupling agent-based, cellular automata and logistic regression into a hybrid urban expansion model (HUEM). Land Use Policy 2017, 69, 529–540. [Google Scholar] [CrossRef] [Green Version]


| Variable | Description |
|---|---|
| Dynamic variables | |
| Proxy: existing urban | Euclidean distance between existing urban cell and the target cell |
| Proxy: new road | Euclidean distance between the newly built roads (one year in advance) and the target cell |
| Land use | The proportion of all land use types within a Moore neighborhood (3 × 3 cells) |
| Still variables | |
| Digital Elevation Model (DEM) | Terrain factor, elevation value (height: meters) |
| Slope | Terrain factor, slope (in degrees) |
| Proxy: Motorway | Euclidean distance between the entrances or exits of motorway and the target cell |
| Proxy: Arterial Road | Euclidean distance between arterial roads and the target cell |
| Proxy: City major road | Euclidean distance between urban major roads and the target cell |
| Proxy: City medium road | Euclidean distance between urban medium roads and the target cell |
| Proxy: City minor road | Euclidean distance between urban minor roads and the target cell |
| Proxy: School | Euclidean distance between kindergarten, primary schools, and middle schools and the target cell |
| Proxy: Transports | Euclidean distance between bus stops, train stations, and ferry ports and the target cell |
| Proxy: Hospital | Euclidean distance between hospitals and the target cell |
| Proxy: Market | Euclidean distance between supermarkets and convenience stores and the target cell |
| Range | <0.2 | 0.2–0.4 | 0.4–0.6 | 0.6–0.8 | ≥0.8 |
|---|---|---|---|---|---|
| MLP–Random | 596.38/75.3% | 79.38/10% | 47.94/6.0% | 38.11/4.8% | 31.27/3.9% |
| MLP–MDA | 612.23/77.2% | 73.30/9.2% | 44.98/5.7% | 33.92/4.3% | 28.65/3.6% |
| LSTM | 769.00/96.9% | 2.43/0.3% | 0.87/0.1% | 1.54/0.2% | 19.27/2.4% |
| Method | Kappa | Kappa Simulation | Fuzzy Kappa Simulation |
|---|---|---|---|
| LR | 0.818 | 0.27 | 0.51 |
| MLP–Random | 0.829 | 0.36 | 0.64 |
| MLP–MDA | 0.827 | 0.32 | 0.53 |
| LSTM | 0.857 | 0.48 | 0.70 |
| Area | Model with Best Performance | Kappa | Kappa Simulation |
|---|---|---|---|
| Southern Auckland | ANN | 0.941 | 0.547 |
| Liangjiang New District | LSTM | 0.857 | 0.48 |
Publisher’s Note: MDPI stays neutral with regard to jurisdictional claims in published maps and institutional affiliations. |
© 2022 by the authors. Licensee MDPI, Basel, Switzerland. This article is an open access article distributed under the terms and conditions of the Creative Commons Attribution (CC BY) license (https://creativecommons.org/licenses/by/4.0/).
Share and Cite
Xu, T.; Zhou, D.; Li, Y. Integrating ANNs and Cellular Automata–Markov Chain to Simulate Urban Expansion with Annual Land Use Data. Land 2022, 11, 1074. https://doi.org/10.3390/land11071074
Xu T, Zhou D, Li Y. Integrating ANNs and Cellular Automata–Markov Chain to Simulate Urban Expansion with Annual Land Use Data. Land. 2022; 11(7):1074. https://doi.org/10.3390/land11071074
Chicago/Turabian StyleXu, Tingting, Dingjie Zhou, and Yuhua Li. 2022. "Integrating ANNs and Cellular Automata–Markov Chain to Simulate Urban Expansion with Annual Land Use Data" Land 11, no. 7: 1074. https://doi.org/10.3390/land11071074