Article

Functional Tradeoffs and Feature Recognition of Rural Production–Living–Ecological Spaces

School of Architecture, Southeast University, Nanjing 210096, China
*
Author to whom correspondence should be addressed.
Land 2022, 11(7), 1103; https://doi.org/10.3390/land11071103
Submission received: 22 June 2022 / Revised: 13 July 2022 / Accepted: 15 July 2022 / Published: 19 July 2022
(This article belongs to the Special Issue Feature Papers for Land, Biodiversity, and Human Wellbeing Section)

Abstract

:
Recently, the spatial contradiction in rural construction has intensified. Production–living–ecological (PLE) spaces, as important load-bearing spatial patterns of rural revitalization, have become a research focus of territorial space planning. Because of the lack of studies on the scale and accuracy at the township level in rural PLE spaces, the objective of this study is to quantify the subfunctional and functional areas of PLE spaces, weigh the relationship between PLE functions, and conduct feature identification and strategy formulation of the PLE synergistic functional areas. Combined with multitype measurement methods, the study constructed a township-level PLE space evaluation system composed of 12 subfunctional indicators. Taking Guli Street in Nanjing city as an example, Spearman correlation analysis, spatial local autocorrelation analysis, and cold/hot spot identification were used to analyze the synergies and tradeoffs between PLE functions. On this basis, the evaluation model of the PLE synergies area was constructed. The results showed that the production function showed a fragmented distribution pattern. The proportion of high-intensity living function areas was very small. The ecological function area had good patch integrity. In the PLE functions, obvious synergies exist between any two functions, and the tradeoff between the third one and any of the two functions. The seven types of PLE synergistic potential areas were dominated by the dual-function high synergistic zone (DF-H-Z). The zoning scheme and governance strategy proposed in this paper have important practical value for solving the contradiction of sustainable and coordinated development of township-scale spatial resources.

1. Introduction

By the end of 2021, the urbanization rate of China’s permanent population was 64.72%, 0.83 percentage points higher than that at the end of 2020. The expansion of urban areas and the inflow of rural populations into cities affected the urbanization rate by 0.36 and 0.35 percentage points, respectively (National Bureau of Statistics, 2022). The prominent problems of rural over-construction and rural population loss aggravate the contradiction of rural space, causing serious impacts on the local human settlement environment [1,2,3], natural ecology [4], regional characteristics, and landscape [5], such as farmland invasion [6], loss of biodiversity [3], landscape fragmentation [7], and other problems that frequently occur. The sustainable development of rural areas has been neglected [8]. As a developing country, China’s rural unbalanced development has become an important issue affecting the process of urbanization, the national economy, and people’s livelihood. In response, the Chinese government has put forward a rural revitalization strategy. Rural revitalization is a process of comprehensive revitalization of the rural population, economy, society, culture, and ecology by means of economic, political, cultural, and engineering measures to cope with the loss of factors and functional decline within the rural regional system [9].
Based on the regional system of the man–land relationship, the rural regional system often contains three basic functions, namely, production function, living function, and ecological function [6,10]. Ecological spaces refer to the areas with important ecological functions and ecological products and services as the main function. Production spaces are areas with the main function of providing industrial products, agricultural products, and service products. Living spaces are the areas that provide the main functions of human living and public activities [11]. Since the food, energy, and resources of rural life are from agricultural production and the ecological environment, the sustainable development of rural areas is considered the comprehensive development of PLE [12,13]. The report to the 18th National Congress of the Communist Party of China in November 2012 clearly stated the development goals of “promoting intensive and efficient production space, livable and appropriate living space, and beautiful ecological space [14]”. In recent years, both territorial space planning and village planning have proposed the scientific layout of rural PLE spaces [15]. The research on PLE spaces is conducive to improving the relevant theories, methods, and technical systems of territorial space planning. In practice, it is conducive to long-term planning and scientific overall planning of rural spatial resources and layout to achieve effective control and scientific governance of territorial space.
The idea of PLE spaces first sprouted in the agricultural operation mode of PLE mode in Taiwan in the early 1980s [16]. Since then, the idea of PLE has been widely used in the basic framework of sustainable development goals in rural areas. Foreign agricultural ecologists also put forward similar ideas based on the theory of sustainable agriculture and agroecology. Australian scholar Bill Mollison put forward the idea of sustainable agriculture in 1978, trying to build a permanent human civilization through the integration of production, life, and ecology [17]. The Czech ecologists Bořivoj š arapatka et al. (1998) suggested that when agroecology was solving the problem of sustainable agricultural development, it should be integrated with the rural human settlement environment [18]. Robert Gilman (1991) [19] and Kates (2001) [20] pointed out that ecological spaces are the basis of production spaces and living spaces, and the key to coordinating man–land relationships and realizing regional sustainable development. Plieninger (2007) divided the rural regional functions of Germany into five functions, including the agricultural production function and the living space function [21]. Willemen et al. (2010) believed that the Dutch countryside has seven major functions, including residence, transportation and cultural heritage, and studied the mechanism of action among each function on this basis [22]. Long Hualou (2014) believed that land consolidation should be used to promote the reconstruction of rural PLE spaces in China [23].
Rural PLE spaces are important load-bearing spatial patterns of rural revitalization. In recent years, studies on PLE spaces include connotation and formation of the mechanism of PLE spaces [2], measurement and recognition of PLE spaces [24,25,26,27], conflict and synergies of PLE spaces [28,29], evolution and simulation of PLE spaces [12,30,31], reconstruction and optimization of PLE spaces [11,23,32], etc. The identification of PLE spaces, as a research basis, is the spatial positioning and division of the quantity and quality of the current production, living, and ecological spaces. The identification methods have scale differences. According to the scale differences of evaluation units, the spatial identification scales of PLE can be roughly divided into the medium and macroscales with administrative regions (i.e., national, urban agglomeration, province, city, county, and village [10,24,27,30,33,34,35,36]) as evaluation units and the microscales with polygons and grid pixels [15] as evaluation units [37]. The research methods are divided into the land-use type merging method and the index system calculation method. Based on the main function of land-use types, the land-use type merging method directly merges land-use types into different spatial types [24,29,38]. The index system calculation method is based on social, economic, natural, and other factors that affect PLE spaces, and it adopts the comprehensive evaluation method to construct the index system to identify PLE spaces [28,36,39]. Index system classification is mainly based on land-use multifunction [40,41], ecosystem service [42], landscape function [43], and other theories to carry out PLE function classification. Index measurement methods include direct measurements of biophysical processes, the value-equivalent method, and the model method [44].
Existing research on rural PLE spaces are mainly analyzed from macro perspectives, such as at the county level and province level, but there is a lack of research on rural PLE spaces from the perspective of village-level administrative regions at the township level. In terms of evaluation units, the village area needs to obtain high-precision land use information through high-resolution remote sensing images, which also increases the difficulty of accurate research on PLE spaces at this scale. Therefore, most studies on rural areas take administrative areas or grids as evaluation units, and there is a lack of studies on land patches as evaluation units. In terms of the construction of measurement indicators, the measurement of PLE space function indicators in rural areas is often highly confused, with indicators targeted at urban areas. For example, nonagricultural production indicators in rural areas are not the main development direction of rural areas. Due to the lack of a statistical yearbook, basic data, and other support in rural areas, as well as the fact that the accuracy of natural and geographical data is difficult to guarantee, scientific research needs to be improved.
To sum up, this paper fully considered the particularity of natural conditions and social development in rural areas and proposed an evaluation system for PLE space functions based on a township scale to quantify and visualize the distribution characteristics of different spatial function patterns. In addition, the land-use classification results were derived from the object-oriented recognition method using high-resolution remote sensing images, and accurate land-use patch morphological units were obtained, which makes up for the shortcomings of previous studies. This study selected a typical rural area of an important central city with priority for development located in the plain of the middle and lower reaches of the Yangtze River in eastern China [45,46]. The synergies and tradeoffs analysis of rural PLE functions, as well as the identification results of regional characteristics, guide the zoning and spatial planning of land-use functions in rural areas to solve the multi-conflict characteristics of rural development and pave the way for sustainable development. The specific objectives of this study included (1) high-precision identification and quantification of subfunctional and functional areas of PLE spaces; (2) synergies and tradeoffs between subfunctions and functions of PLE spaces; and (3) the use of feature identification of PLE synergistic functional areas, land use planning, and spatial control strategies.

2. Materials and Methods
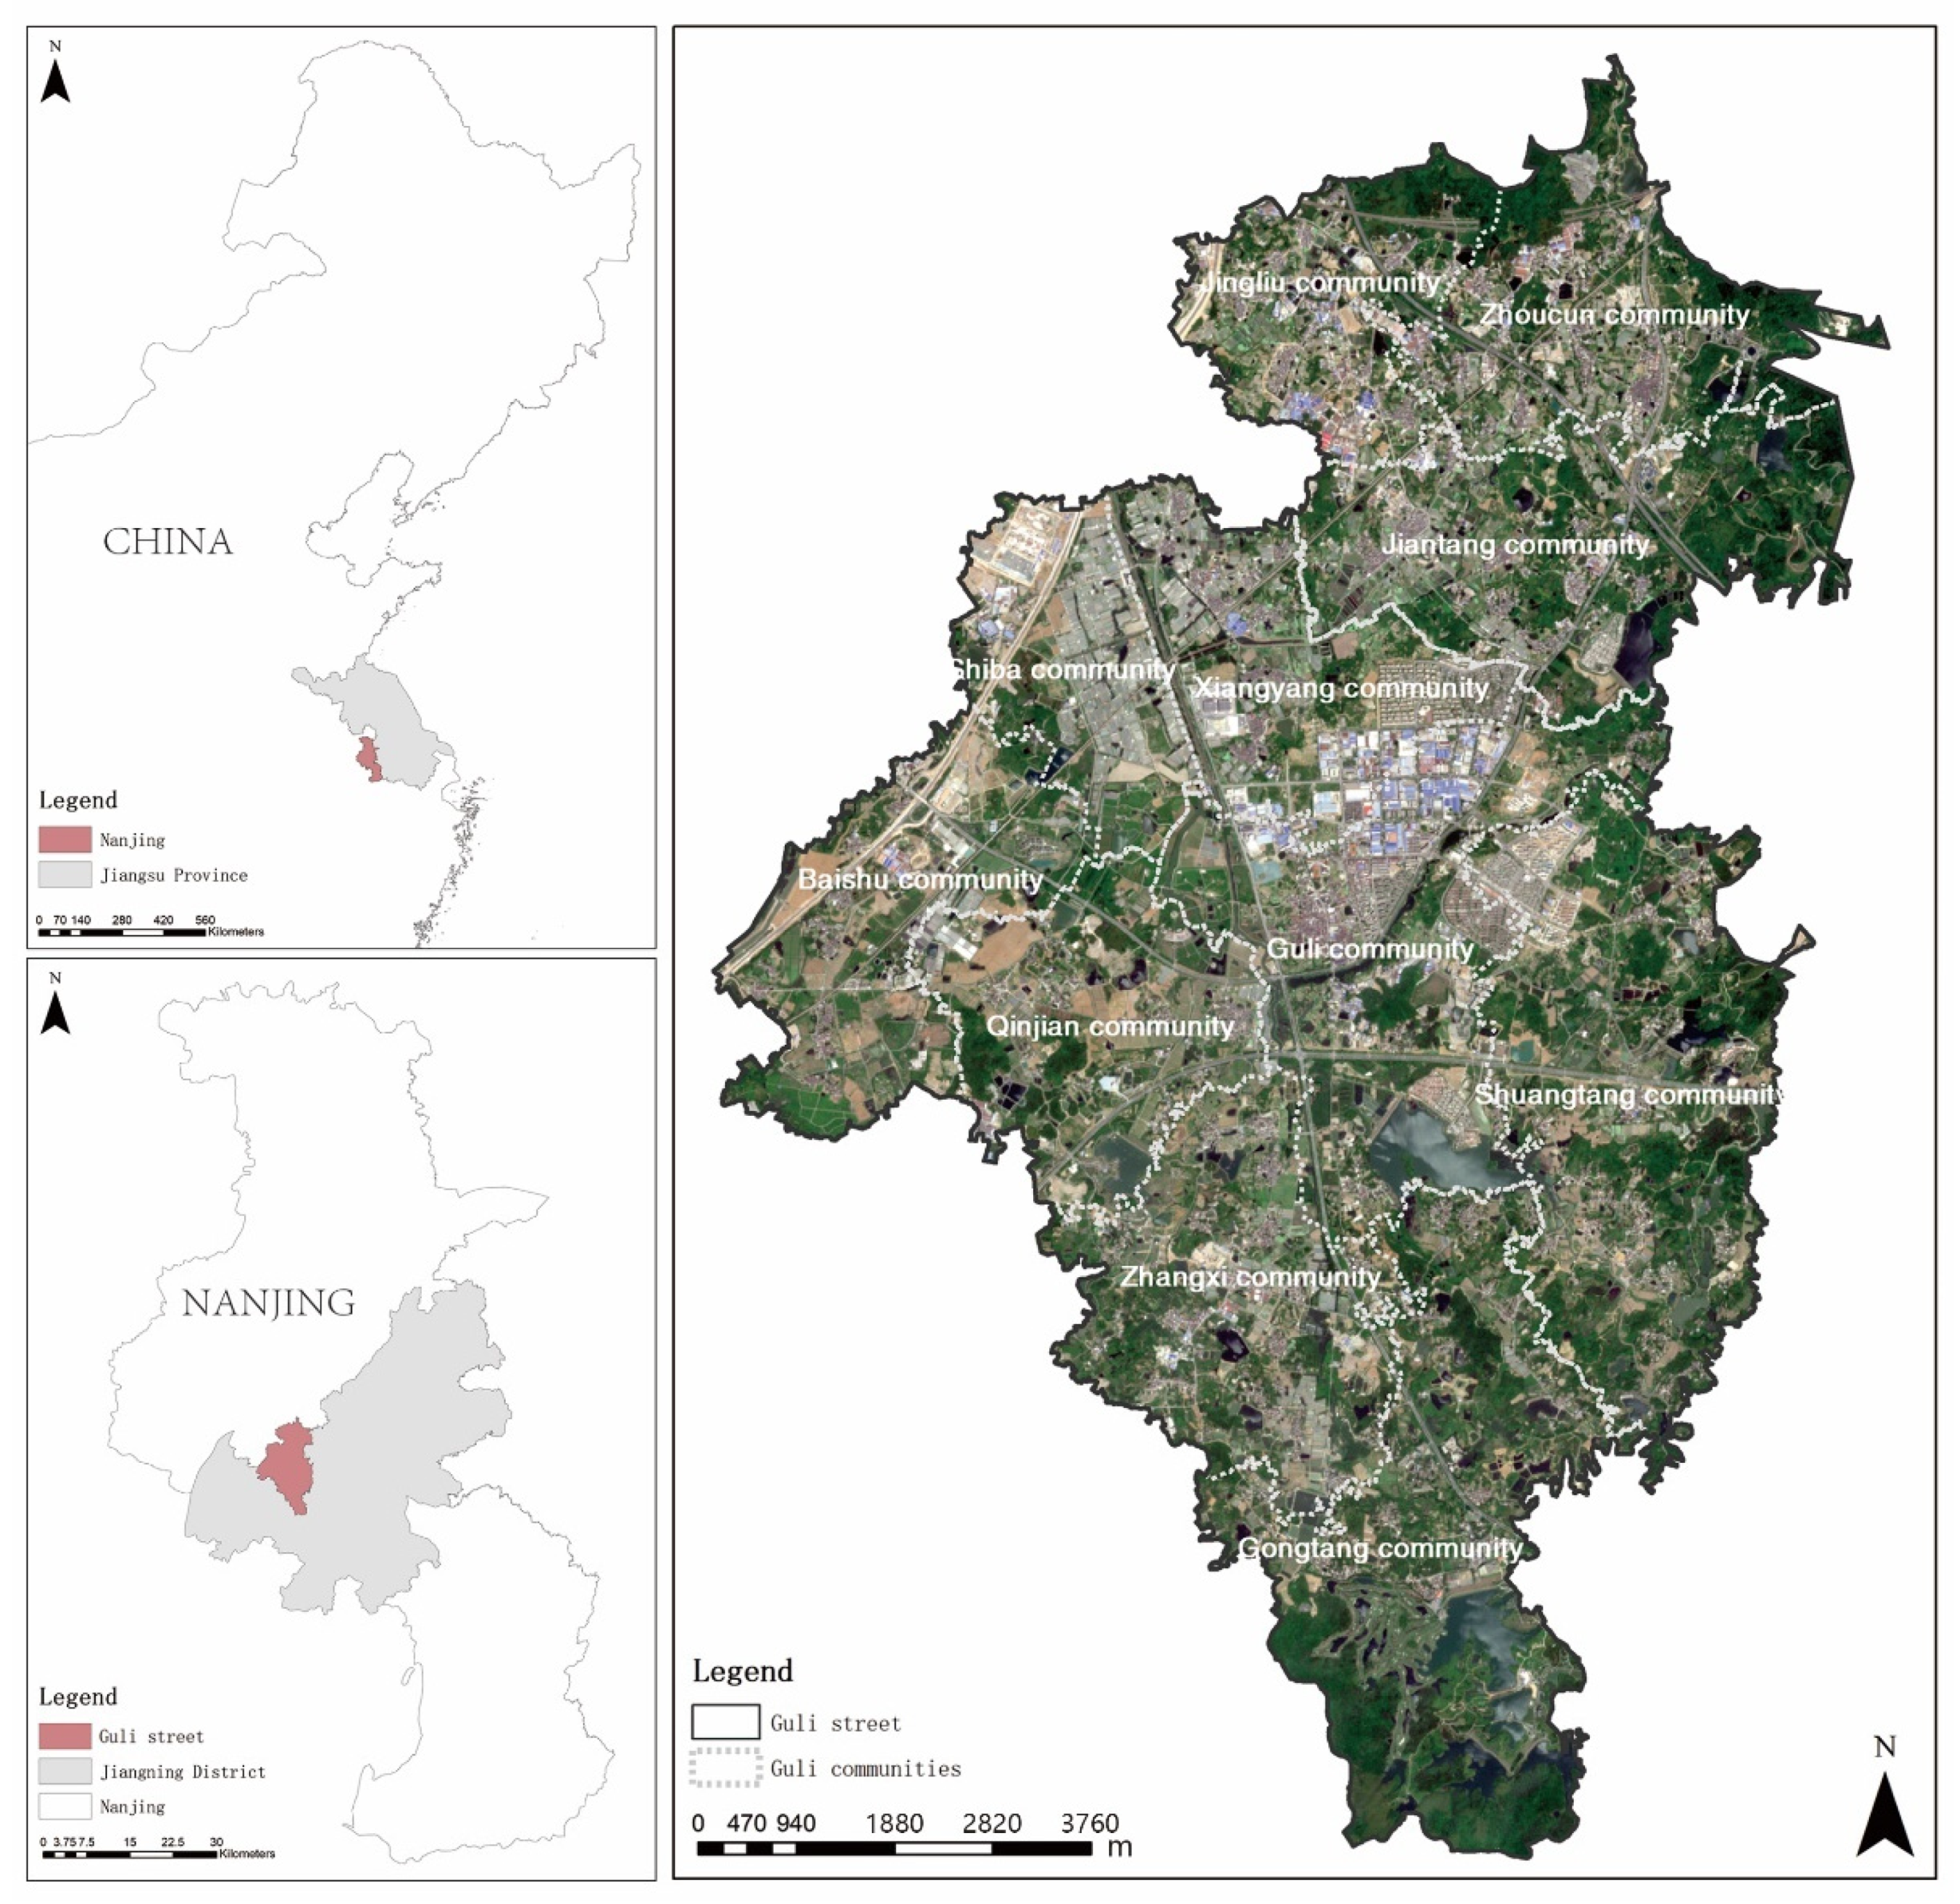
2.1. Research Area

Guli Street is located in the west of Jiangning District, Nanjing, south bank of the lower reaches of the Yangtze River, between latitude 31°37′–32°07′ North and longitude 118°28′–119°06′ East. Guli Street is located in the Ningzhen mountain range, the terrain is high in the north and low in the south. The terrain is divided into hills, mountains, and fields. It has a subtropical monsoon climate with four distinct seasons, with an average temperature of 15.7 °C and an average annual rainfall of 1079.8 mm. It is located within the Yangtze River, Qinhuai River basin, and there are 21 major rivers such as the Shiba River. The river network density is 1.6 km/square km, and the total runoff is 1.44 billion cubic meters. Grain crops are mainly rice and wheat (Figure 1).
The reasons for selecting this site as the research area are as follows: (1) Guli Street has diverse landscape functions, rich natural geographical conditions, and dense river networks. Construction land accounts for 18.2%, agricultural land (cultivated land, orchard, woodland, and other agricultural lands) accounts for 42.21%, and land use and cover are diverse. (2) In 2019, the local GDP (Gross Domestic Product) was CNY (Chinese Yuan) 4.056 billion, and the general public budget revenue was CNY 401 million [47]. The total industrial output value above the designated size was CNY 2.672 billion. In terms of economic size, rural areas can represent a large number of second-tier cities in China. (3) The region covers a total area of 91 square kilometers, with 11 villages (communities) under its jurisdiction and a registered population of 41,600. The area is vast and sparsely populated, which conforms to the typical characteristics of rural areas. (4) Zhangxi community, Xujiayuan village, Datang Jin village, etc., as characteristic rural villages in Jiangsu Province, have won the titles of “Beautiful Water Village of Jiangsu” and “Beautiful Leisure Village of China” and have been selected as typical cases of Jiangsu Rural revitalization strategic planning implementation, which are of typical significance for rural development planning research. (5) Relying on the national key R&D project plan, it has a good research foundation and platform and convenient data acquisition.

2.2. Research Data

2.2.1. Basic Statistics of Guli Street

(1) Statistical datasets: The population of Guli Street, the total number of households at the end of the year, the area of cultivated land, the number of primary and secondary schools, and the area of public cultural and sports facilities were obtained from the Jiangning Yearbook (2020), and some missing data were replaced by the mean values of village-level administrative regions.
(2) Agricultural production datasets: farmland production potential data were based on China’s arable land distribution, soil, and elevation data in 2010, using the Global Agro-Ecological Zones (GAEZs) model, comprehensively considering light, temperature, water, CO2 concentration, pests and diseases, agricultural climate constraints, soil, terrain, and other factors. The main considerations were five crops: wheat, corn, rice, soybean, and sweet potato.
(3) Satellite data: 12.5 m digital elevation model (DEM) data from an ALOS PALSAR sensor(Japan Aerospace Exploration Agency (JAXA)), collected in the high-resolution mode, were used as a baseline to produce terrain and slope data.
(4) Boundary datasets: the dataset included village-level, town-level, county-level, district-level, city-level, province-level, and national-level boundary vector data (Table 1).

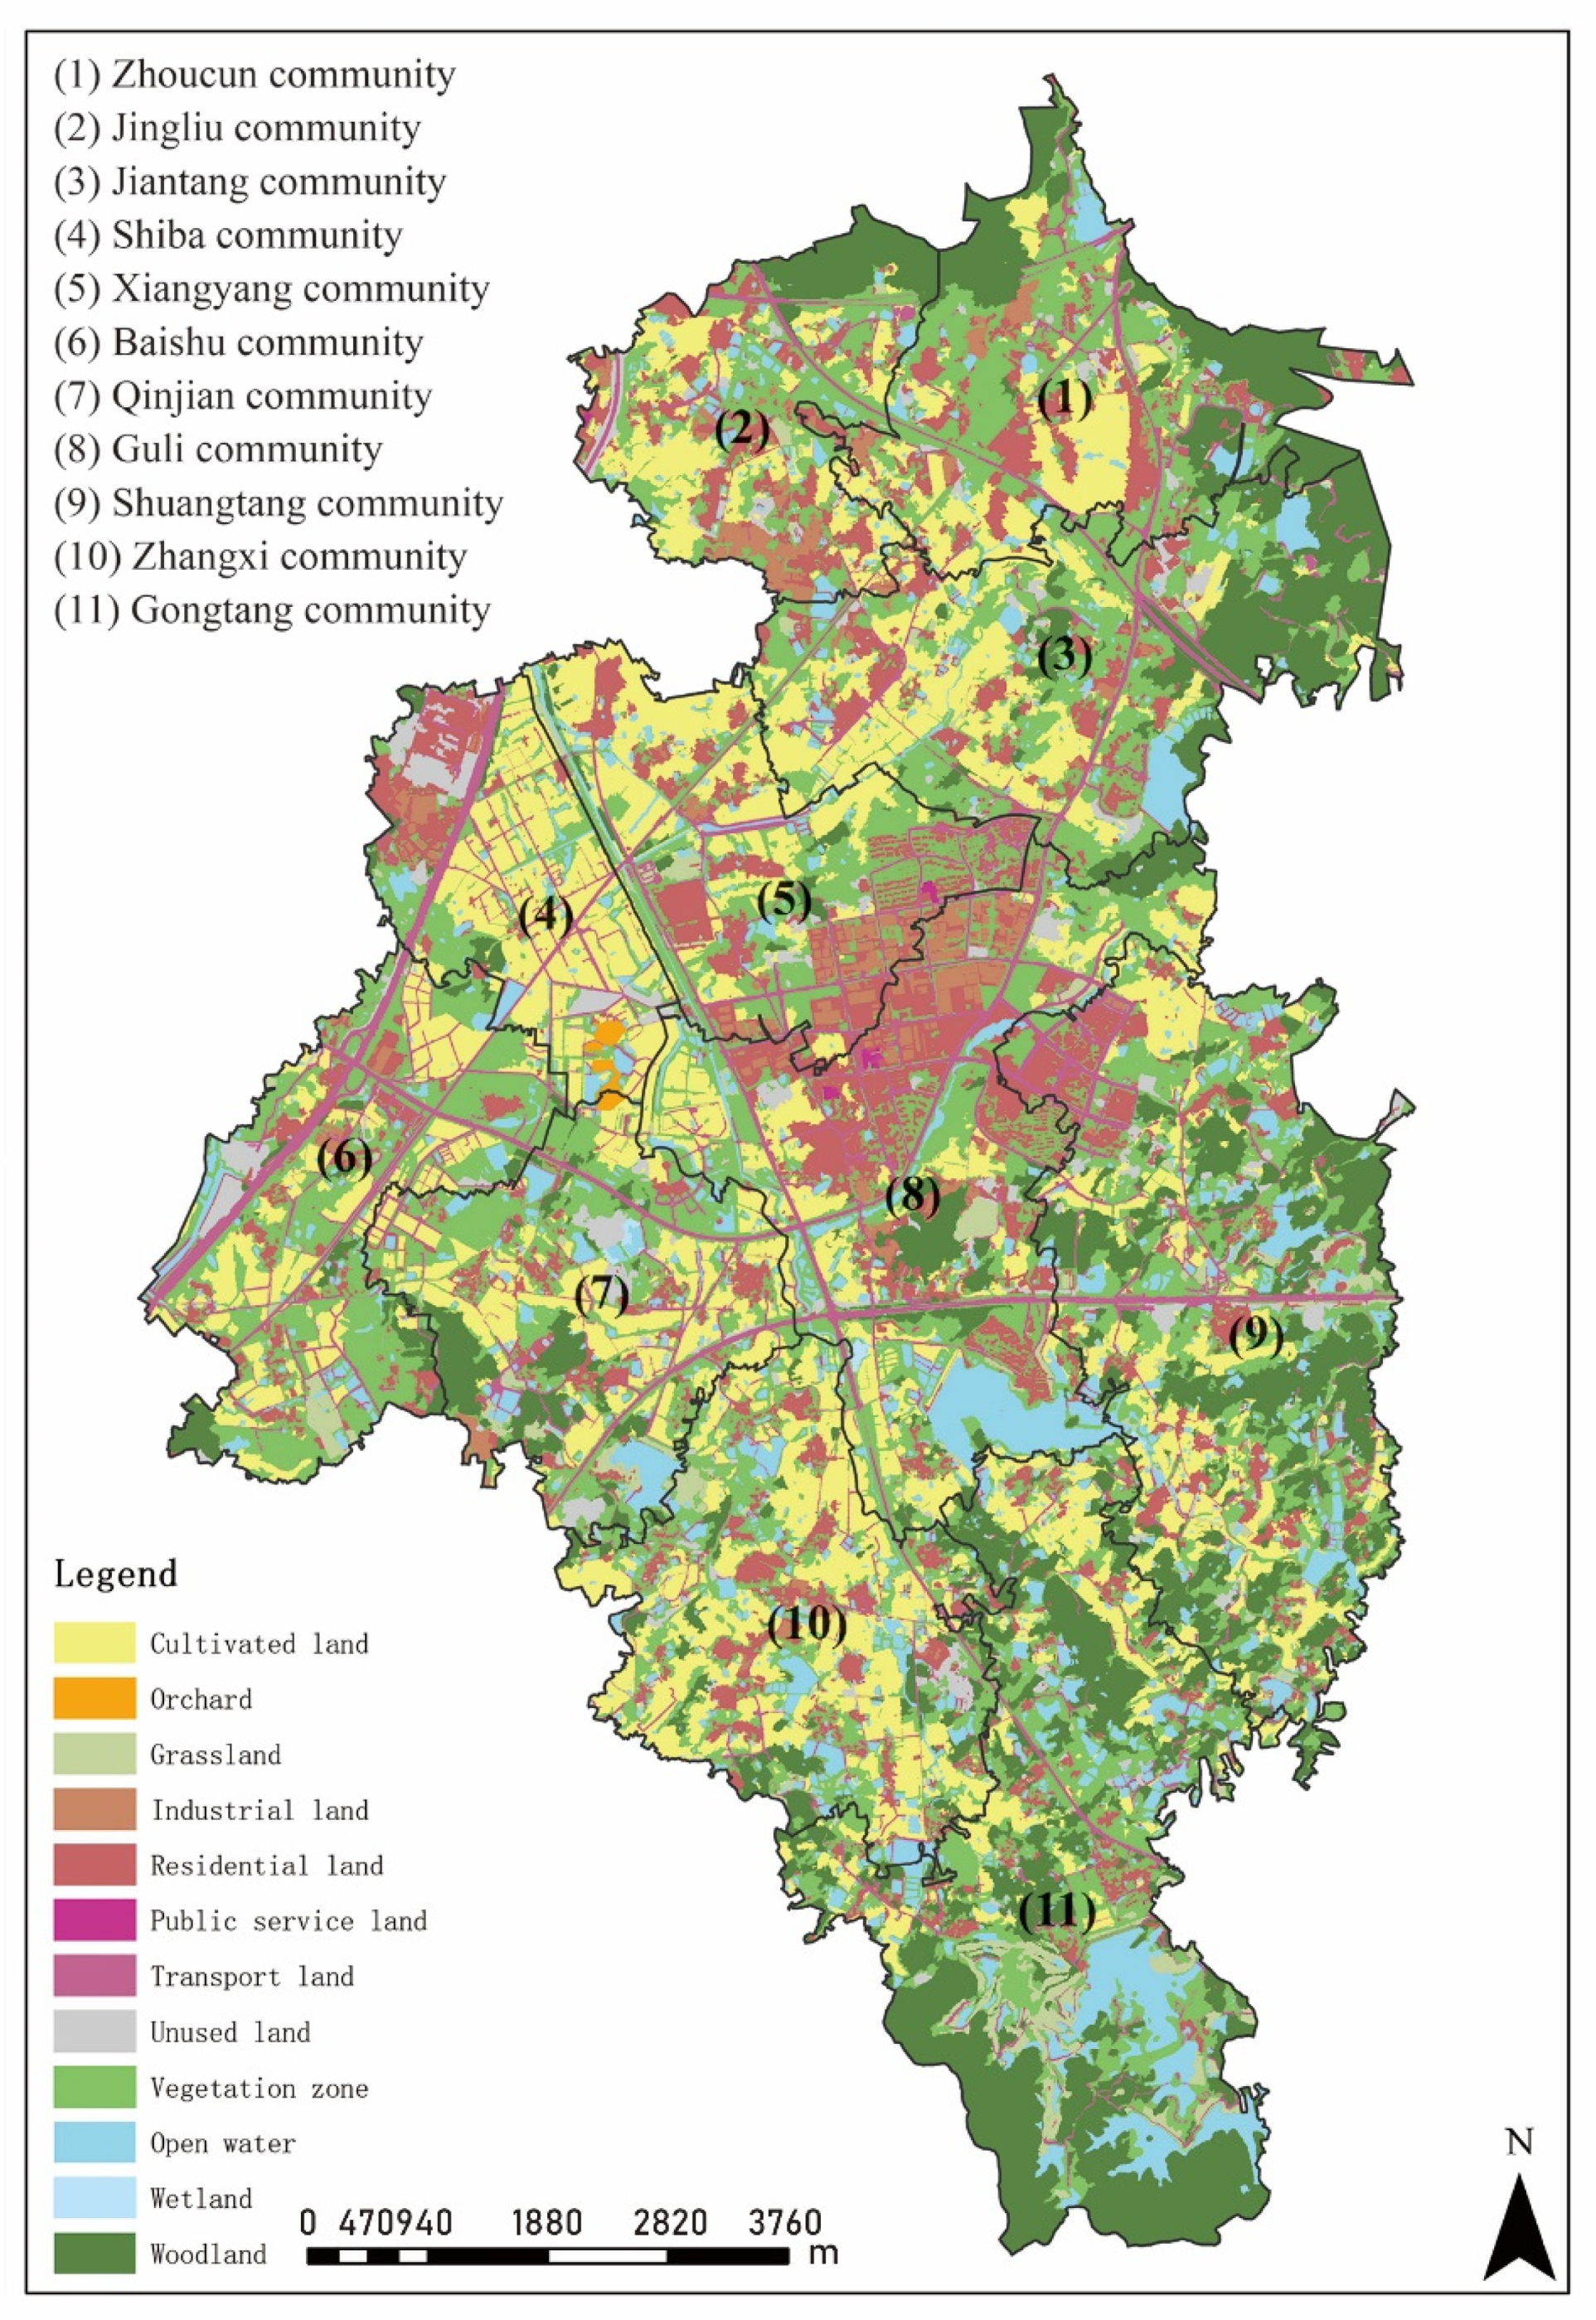
2.2.2. Land-Use Classification Data of Guli Street

The land-use classification results of Guli Street in Jiangning District in this study area were derived from GF-2 remote sensing image data collected by the PMS1 sensor on 12 October 2020, with a resolution of 3.2 m. After the image was preprocessed, including radiometric calibration, atmospheric correction, ortho-correction, and image fusion, the spatial information of the high-resolution remote sensing image was interpreted by object-oriented eCognition software, and the optimal segmentation scale was established by a heterogeneous parameter experiment using the ESP2 plug-in [48]. The spectral, texture, shape, spatial topology, and exponential features of the object were combined to delimit the ground objects’ classification level. Using the membership function method, the ground object information was divided into 11 first-level classes according to the Current Land Use Classification revised by the Ministry of Land and Resources of the People’s Republic of China in 2017 (GB/T21010-2017). They included cultivated land, garden land, forest land, grassland, industrial and mining warehouse land, residential land, public service and management land, transport land, water and water conservancy facilities land, other land, and wetlands. Eighty random sample points were selected and combined with visual interpretation of the real features of ground objects. The TTA MASK evaluation method was used to evaluate the accuracy of ground object information. The overall accuracy evaluation coefficient was 0.9272, and the Kappa coefficient confusion matrix evaluation was 0.908 (Figure 2).

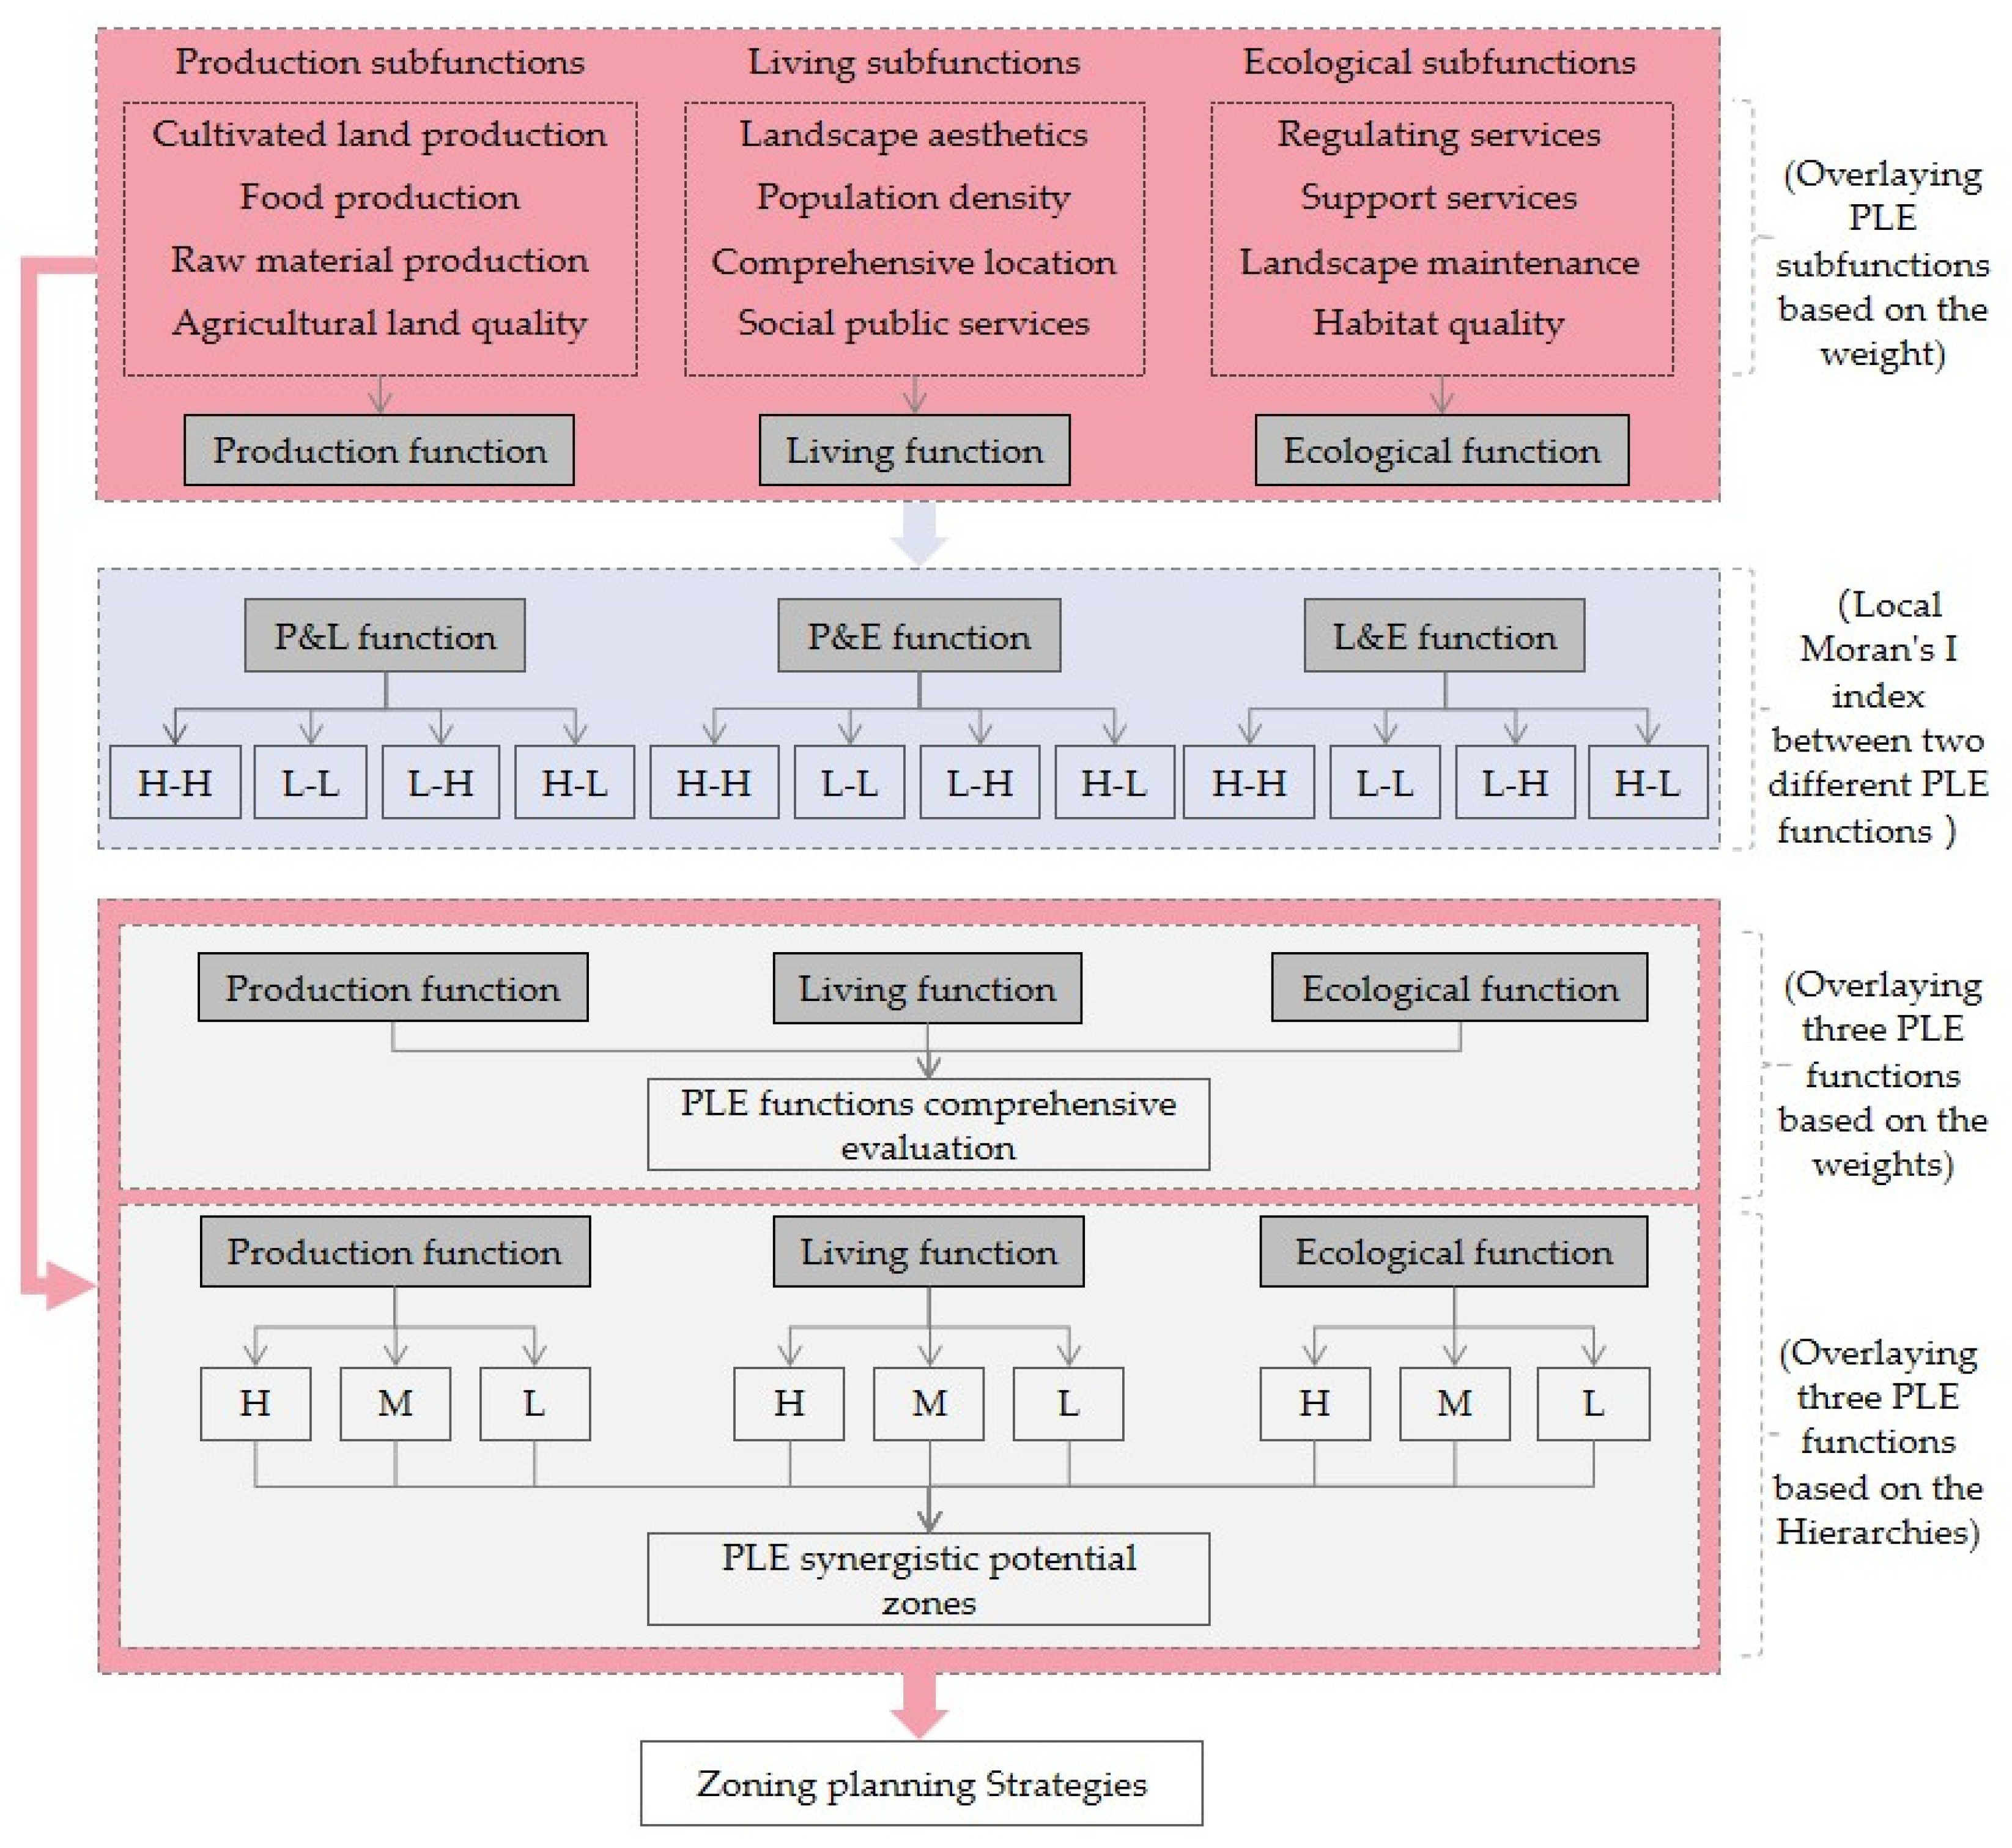
2.3. Research Framework

In view of the Guli Street area, the PLE functions were divided into 12 subfunctions, and each PLE function was composed of four subfunctions. The evaluation system of the subfunction indexes of PLE spaces was constructed, to identify the spatial characteristics of PLE subfunctions, and explore the synergistic and tradeoff relationship of PLE subfunctions. On this basis, the PLE space function indexes were constructed, and the autocorrelation of spatial patterns (Local Moran’s I) of two different PLE functions was studied. On the one hand, a comprehensive evaluation of the three PLE functions was carried out based on the weights. On the other hand, the spatial classification discrimination of the intensity of PLE functions was carried out. The classification of PLE function spaces was classified as high, medium, and low, and different grades were grouped and classified to distinguish the degree of synergies. The final evaluation was divided into seven types of synergistic potential areas of the PLE, which were used as the basis for the formulation of planning strategies (Figure 3).

2.4. Construction of the PLE Space Function Evaluation System

2.4.1. The Ecosystem Service Value-Equivalent Measurement

For the study of rural areas, the value-equivalent conversion method is relatively weak in precision and spatial heterogeneity but has strong adaptability and operability. As a township-level administrative region, the Guli Street area in Nanjing city lacks systematic statistical yearbook data. Therefore, in the study of subfunctions of PLE spaces, some subfunction indicators were calculated using the value-equivalent conversion method to measure by integrating multiple factors. According to “The Value of The World’s Ecosystem Services and Natural Capital” by Costanza et al. in Nature [49], using a global static partial equilibrium model, the global biosphere was divided into 16 ecosystem types and 17 ecosystem service values, and the principles and methods of ecosystem service value estimation were clarified scientifically. Xie Gaodi [50] undertook a study based on the research of Costanza, relative to the food production value of the relative importance of cultivated land (value-equivalent factor) of different land-use types in the China ecological system per unit area ecosystem service value equivalent survey. Based on the research results of Xie Gaodi, this study determined the ecosystem service value generated by different land use types (Table 2).

2.4.2. Construction of Subfunction Indexes of PLE Spaces

Due to the small Guli Street scale, the land-use data precision demand was high, so in reference to the UN Millennium Ecosystem Assessment (MA), the accuracy of the value-equivalent conversion method alone was difficult to guarantee. Therefore, in this paper, the biophysical process measurement method, model method, and gradient analysis method were used for comprehensive calculation. Referring to previous research classifications [28,51], 12 subfunctional indicators were finally divided into the subfunctional index evaluation system of PLE spaces. In this study, raster data with different resolutions were resampled using the Resample module in ArcGIS. The resampling technique was used to unify raster data with a unit of 5 × 5 m using BILINEAR interpolation. The analytic hierarchy process (AHP) was used to determine the weight of four subfunctions in each PLE function, which further improved the scientific calculation of the PLE space functions based on a town in rural areas (Table 3).
In setting up the production of the subfunction indexes, in view of the rural areas, because of its space particularity, which was different from the traditional production function that contains the function of the industrial production indexes calculation and based on a natural ecological background with the principle of the priority of rural local regional characteristics, only the production indexes of the primary industry were calculated, while the nonagricultural production indexes were excluded. (1) The subfunction of cultivated land production was measured using the GAEZ (global agro-ecological zones) model, which mainly considered five crops: wheat, corn, rice, soybean, and sweet potato. (2) The subfunction of food production was obtained by multiplying the patch area of woodland, grassland, wetland, water, and unused land by the corresponding value-equivalent coefficients without considering food production. (3) The subfunction of raw material production was obtained by multiplying the corresponding value-equivalent coefficients of woodland, grassland, cultivated land, wetland, water, and unused land patches. (4) The subfunction of agricultural land quality was mainly for rice and wheat. Surface soil texture, effective soil layer thickness, soil pH, soil organic matter, soil erosion, slope, and irrigation distance data were comprehensively evaluated by the stacked graph method. According to the Regulation for gradation on agriculture land quality (GB/T 28407-2012), the indexes of photothermal soil and water productivity were introduced to grade agricultural land.
In setting up the living of subfunction indexes, (1) the subfunction of population density could be obtained from the total population of each administrative village divided by the area of the administrative village. (2) The comprehensive location adopted the European distance method, combined with the research scale of rural area and Guli Street, and it was classified and delimited by the buffer zone, which was a certain distance from the residential area, transport land, and water. (3) The subfunction of social services was classified and delimited in the buffer zone, which was a certain distance from public service land and industrial land in Guli Street [52]. (4) The subfunction of landscape aesthetics was obtained by multiplying the patch area of woodland, grassland, cultivated land, wetland, water, and unused land by the corresponding value-equivalent coefficients.
In setting up the ecological subfunction indexes, (1) the subfunction of regulating services was analyzed through the average superposition of the area of woodland, grassland, cultivated land, wetland, water, and unused land patches multiplied by equivalent factors of gas, climate, hydrology, and waste treatment regulation. (2) The subfunction of support services was analyzed through the superposition of woodland, grassland, cultivated land, wetland, water, and unused land patches multiplied by equivalent factors of biodiversity and soil conservation. (3) The subfunction of landscape fragmentation was to comprehensively analyze the average superposition of the aggregation index (AI), contagion index (CONTAG), mean patch size (MPS), and largest patch index (LPI) in the landscape patterns [53], which was obtained by the moving window method of Fragstats4.2.1. (4) The subfunction of habitat quality undertook a comprehensive analysis of the average superposition of habitat quality and habitat scarcity, which was obtained from the habitat quality module of the InVEST 3.8.0 model.

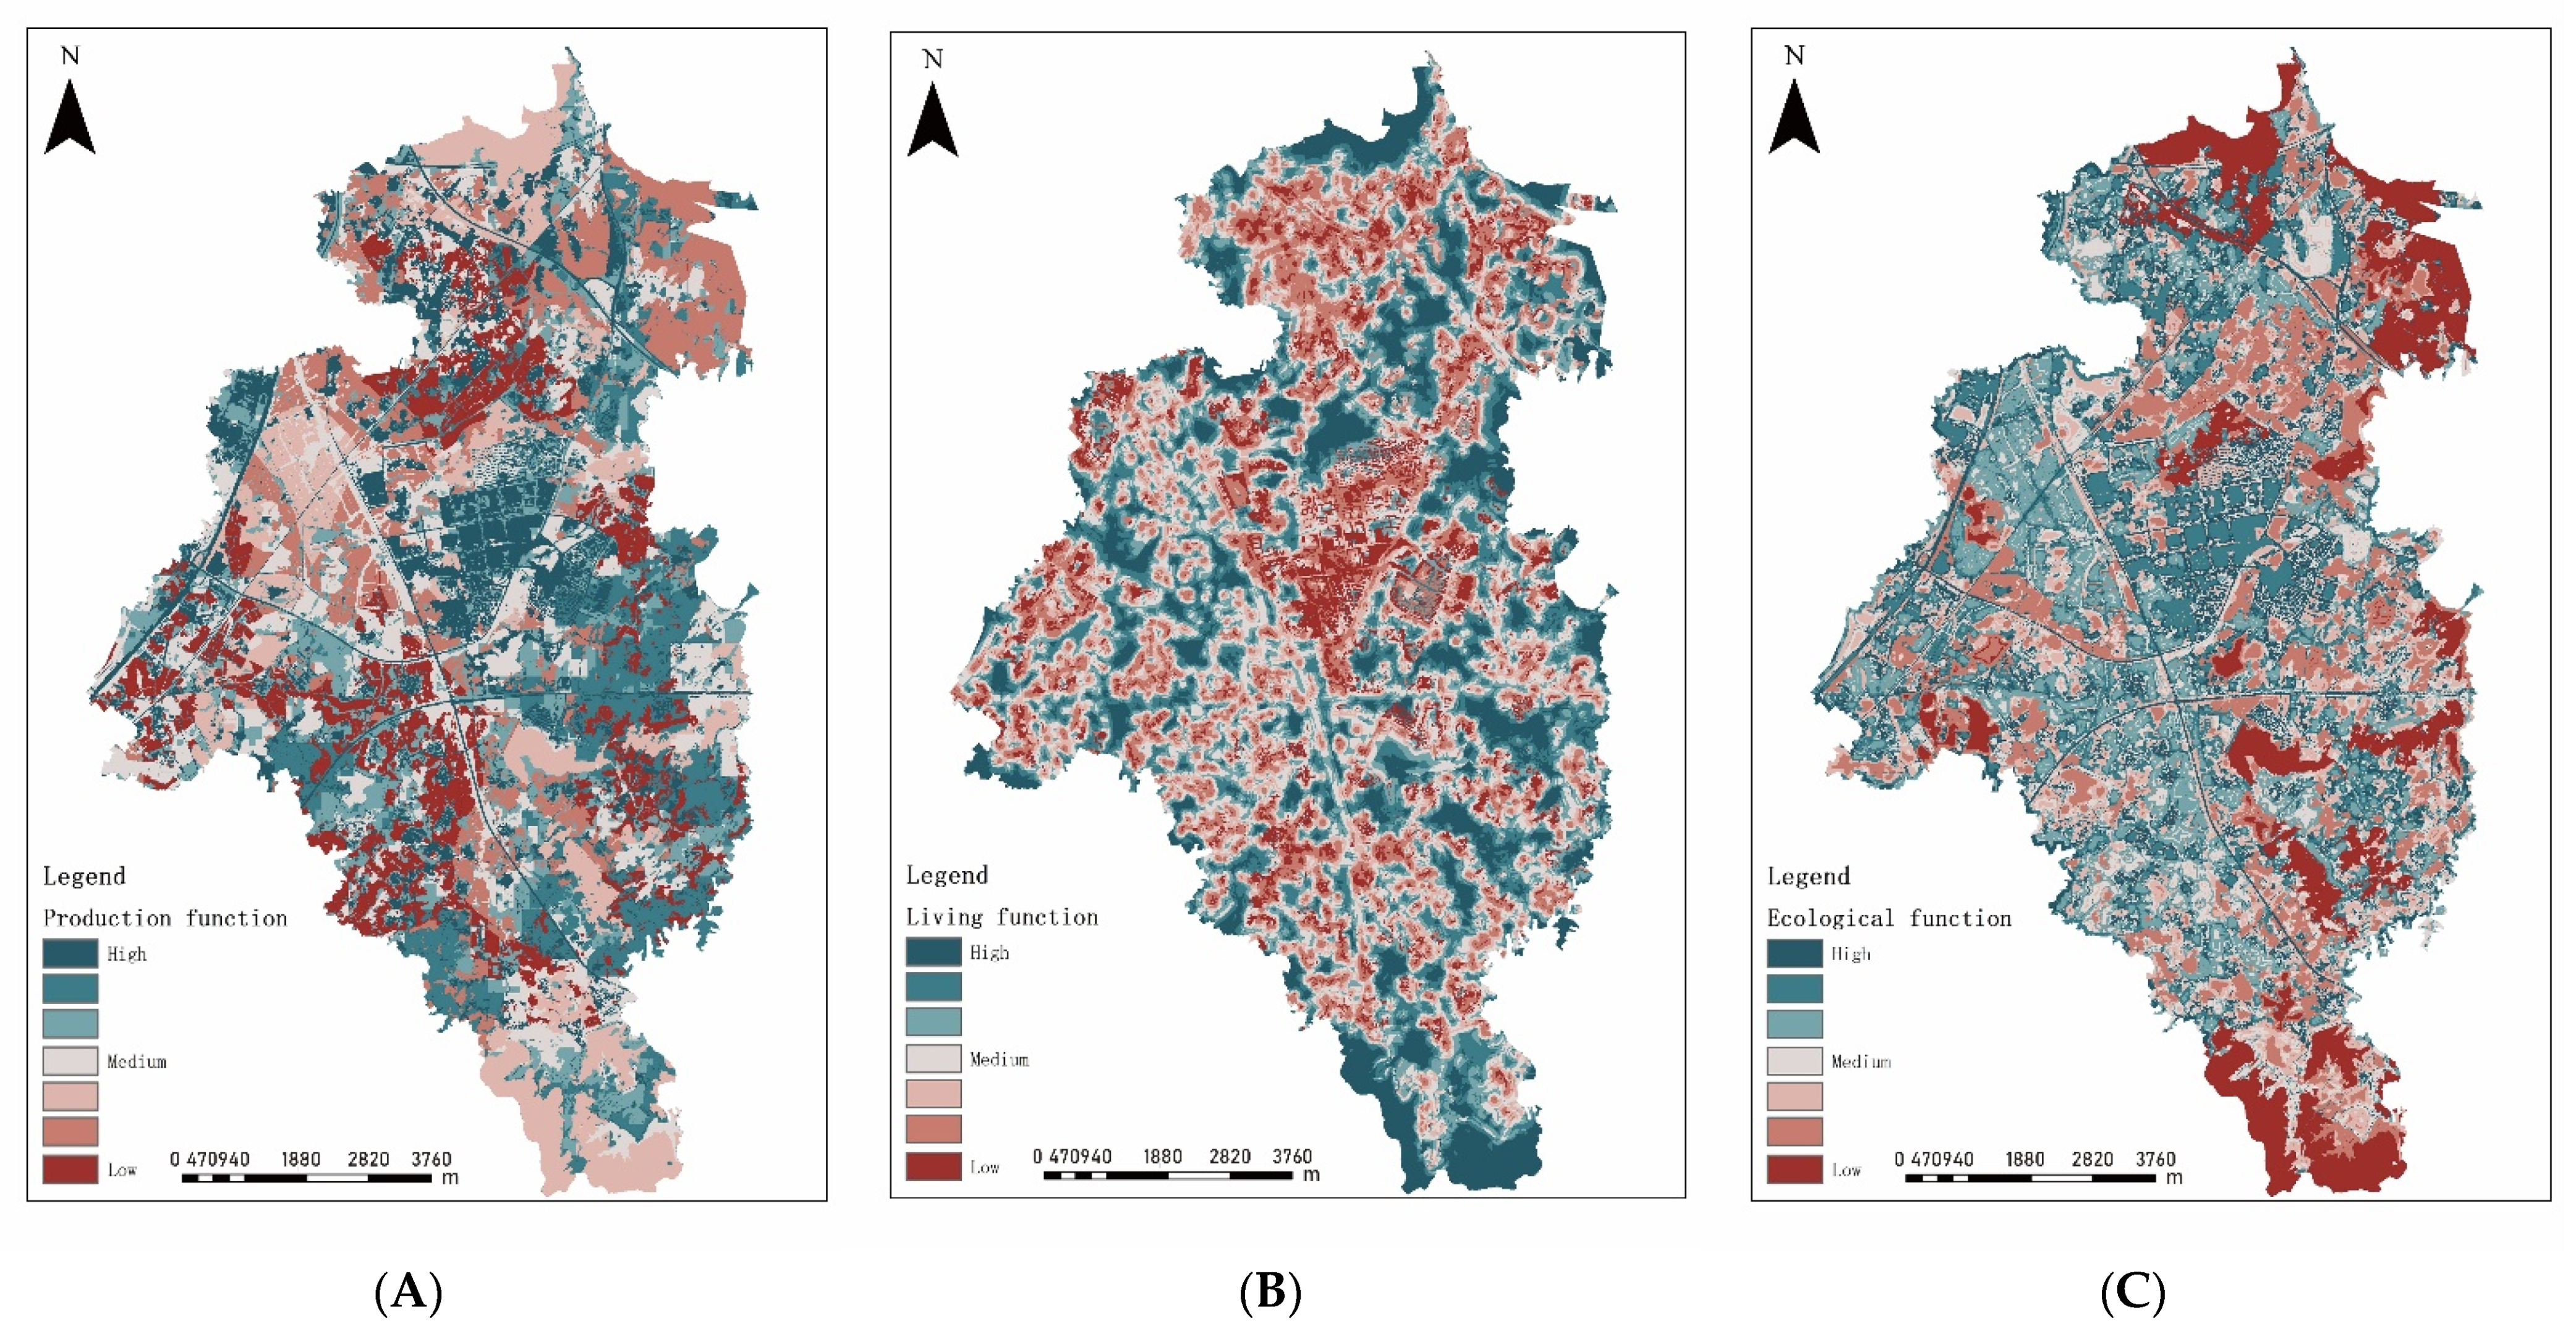
2.4.3. Construction of Function Indexes of PLE Spaces

For rural areas, the production spaces in this study refer to the spaces where humans directly obtain various materials (primary industry) by taking land as the object of labor to provide material guarantees for human life. Living spaces were the space carrying capacity of human living, consumption, entertainment, medical treatment, education, and other activities generated in the process of land use. It has the function of material and spiritual guarantee. Ecological spaces were the spaces that undertook the formation of an ecological system and ecological process and maintained the natural conditions and the utility of human existence [38].
The production function index (PFI), living function index (LFI), and ecological function index (EFI) constituted the “production–living–space function index” (PLEFI). Considering the proportion of land-use area distribution in the study area, construction land (residential land, public service land, industrial land, and transport land) in Guli Street accounted for approximately 18.2%, which is the output land of main living functions. The area of agricultural land (cultivated land, orchard, woodland, and other agricultural lands) was 42.21%, and the area of natural area (grassland, unused land, vegetation area, open water, and wetland) was 39.59%. However, based on the important characteristics of rural areas’ dependence on the production function, this paper concluded that the weight of the production function is slightly greater than that of the ecological function, and the weight of the living function is the lowest due to the area of construction land.
The PLEFI was constructed to comprehensively evaluate PLE functions and analyze the spatial differentiation and other heterogeneity pattern characteristics of PLE functions. The calculation formula is as follows:
PLEFI = 0.36 × PFI + 0.30 × LFI + 0.34 × EFI ,
In the Formula (1), the larger the PLEFI index value, the higher the functional level of Guli Street, and vice versa.

2.5. Data Analysis and Visualization

2.5.1. Spearman Rank Correlation Analysis

In order to deeply understand the tradeoff and synergistic effect among subfunctions of PLE spaces, the subfunctional areas of PLE spaces were managed comprehensively. In this paper, the average index of 12 types of PLE subfunctions in all patches in the study area was statistically analyzed. On this basis, the OriginPro 2021 software (9.8.version, OriginLab Corporation, Northampton, MA, USA) was used to carry out a visual analysis of the Spearman rank correlation coefficient among 12 types of PLE subfunctions, to eliminate the difference of orders of magnitude in the calculation of different functional factors. The complex interactions between subfunctions of PLE spaces were simplified, which is difficult to describe quantitatively. Due to the high precision of land patches interpreted by remote sensing, patches less than 5 m2 per unit area were removed from the calculation to improve accuracy.
When the Spearman correlation coefficient is positive, there may be synergies between subfunctions of PLE, which means that improvement in one function will lead to an increase in another function. When the Spearman correlation coefficient is negative, there may be tradeoffs between subfunctions of PLE, and improvement in one function is at the expense of another function, which means that there is a tradeoff between the two functions [54].

2.5.2. Spatial Autocorrelation Analysis

In order to further study the spatial distribution characteristics of the correlation between PLE functions, in this paper, the spatial autocorrelation analysis method was mainly used to detect the dependence of spatial distribution patterns of things and phenomena and judge the diffusion, polarization, or randomness of spatial distribution to reveal the interaction mechanism between PLE functions [55]. The bivariate Local Moran’s I index analysis of PLE space functions can identify the spatial functions clustering relationship between land patches and make the direction of spatial planning land use clearer at the village level. Local Moran’s I can be decomposed into agglomeration areas at the same ecological niche level (i.e., high–high area (HH) and low–low area (LL)), presenting spatial synergistic relationships. The heterogeneous agglomeration areas (i.e., low–high area (LH) and high–low area (HL)) show spatial tradeoff relationships. Deoda1.14.0 software (Dr. Luc Anselin and his team, University of Illinois System, Urbana, USA) was used in the study, and the spatial weight was determined by the principle of Rook adjacency. The formula is as follows:
I = X i k X k ¯ σ k j = 1 n [ W i j X j I X I ¯ σ I ] ,
In Formula (2), I represents the bivariate local space autocorrelation coefficient; X i k represents the function value of the kth item of grid i ; X j I represents the observed value of the Ith function of grid j ; X k ¯ and X I ¯ represent the average of the kth and Ith functions, respectively; σ k and σ I represent the variance of the function value of the kth and Ith, respectively; n is the number of grids in the study area; W i j is the weight matrix.

2.5.3. Cold Spot and Hot Spot Identification in Space

In this study, the Getis-Ord Gi* index [56], the core of hot spot analysis, was used for comprehensive evaluation of the PLE functions, namely, identifying local high-value aggregation areas and low-value aggregation areas through cold/hot spot detection. In the more complex analysis of PLE space functions’ superposition, the spatial relationships between high value and low value could be identified, identifying hot and cold spots. The specific formula is as follows:
G i * = j = 1 n w i j X j X ¯ j = 1 n w i j s n j = 1 n w i j 2 ( j = 1 n w i j ) 2 n 1 ,
S = j = 1 n X j 2 n ( X ¯ ) 2 ,
In Formula (3), G i * is the z score; X j is the attribute value of element j ; w i j is the spatial weight between elements i and j ; n is the total number of elements; X ¯ is the average. If G i * > 0 and through a significance test the higher the G i * , the higher the observed value of unit i of PLE comprehensive function, which is called a hot spot. If G i * < 0 and through a significance test the lower G i * is, this indicates that the attribute value of unit i toward PLE comprehensive functions is lower than that of surrounding units, which is called a cold spot.

2.5.4. Construction of the Identification Model of the PLE Functional Feature Areas

In this study, land-use functional areas were divided based on PLE functions. By referring to relevant research methods, 27 types of classification and combination methods were used to evaluate the high (H), medium (M), and low (L) levels of PLE functions. The 23 combination types were superimposed, and the study area was finally integrated into 7 types of PLE synergistic potential areas (Table 4) to identify the multifunction of PLE spaces, diagnose the degree of synergies, and discuss the dominant degree and importance ranking of multiple functions on the same patch unit. PLE synergistic potential represents the different synergistic degrees among the three functional intensities, that is, the smaller the difference between different intensities of the three functions, the higher the synergistic degrees; the larger the difference between different intensities, the lower the synergistic degrees. Since the grade classification used the natural breakpoint method, it maximized the difference between high (H), medium (M), and low (L). For example, the difference between M and L is smaller than that between H and M, that is, the degree of synergy between M and L is higher than that between H and M. Raster Calculator module in ArcGIS was used to calculate the identification model of PLE functional feature areas.

2.5.5. Standardization and Spatial Mapping Format

The different indexes of the PLE functions had different dimensions and orders of magnitudes. To ensure the reliability of the evaluation results and avoid units and orders of magnitudes affecting the evaluation results, it was necessary to standardize the original value of each index system. Through the Fuzzy Membership module of the ArcGIS 10.6 platform, the subfunctional indicators and functional indicators of PLE spaces were normalized. After stacking according to rules, the evaluation and recognition results of PLE spaces were mapped in space. The vector and raster datasets were unified into 5 × 5 m units, and the final output was in raster format spatial graphics. The geographic coordinate system is unified as the universal WGS84. The normalization formula is as follows:
y i j = x i j j = 1 n x i j ,
In Formula (4), y i j represents the index value of the j index of the i th evaluation unit after normalization; x i j represents the original value of the j index of the i th evaluation unit.

3. Results

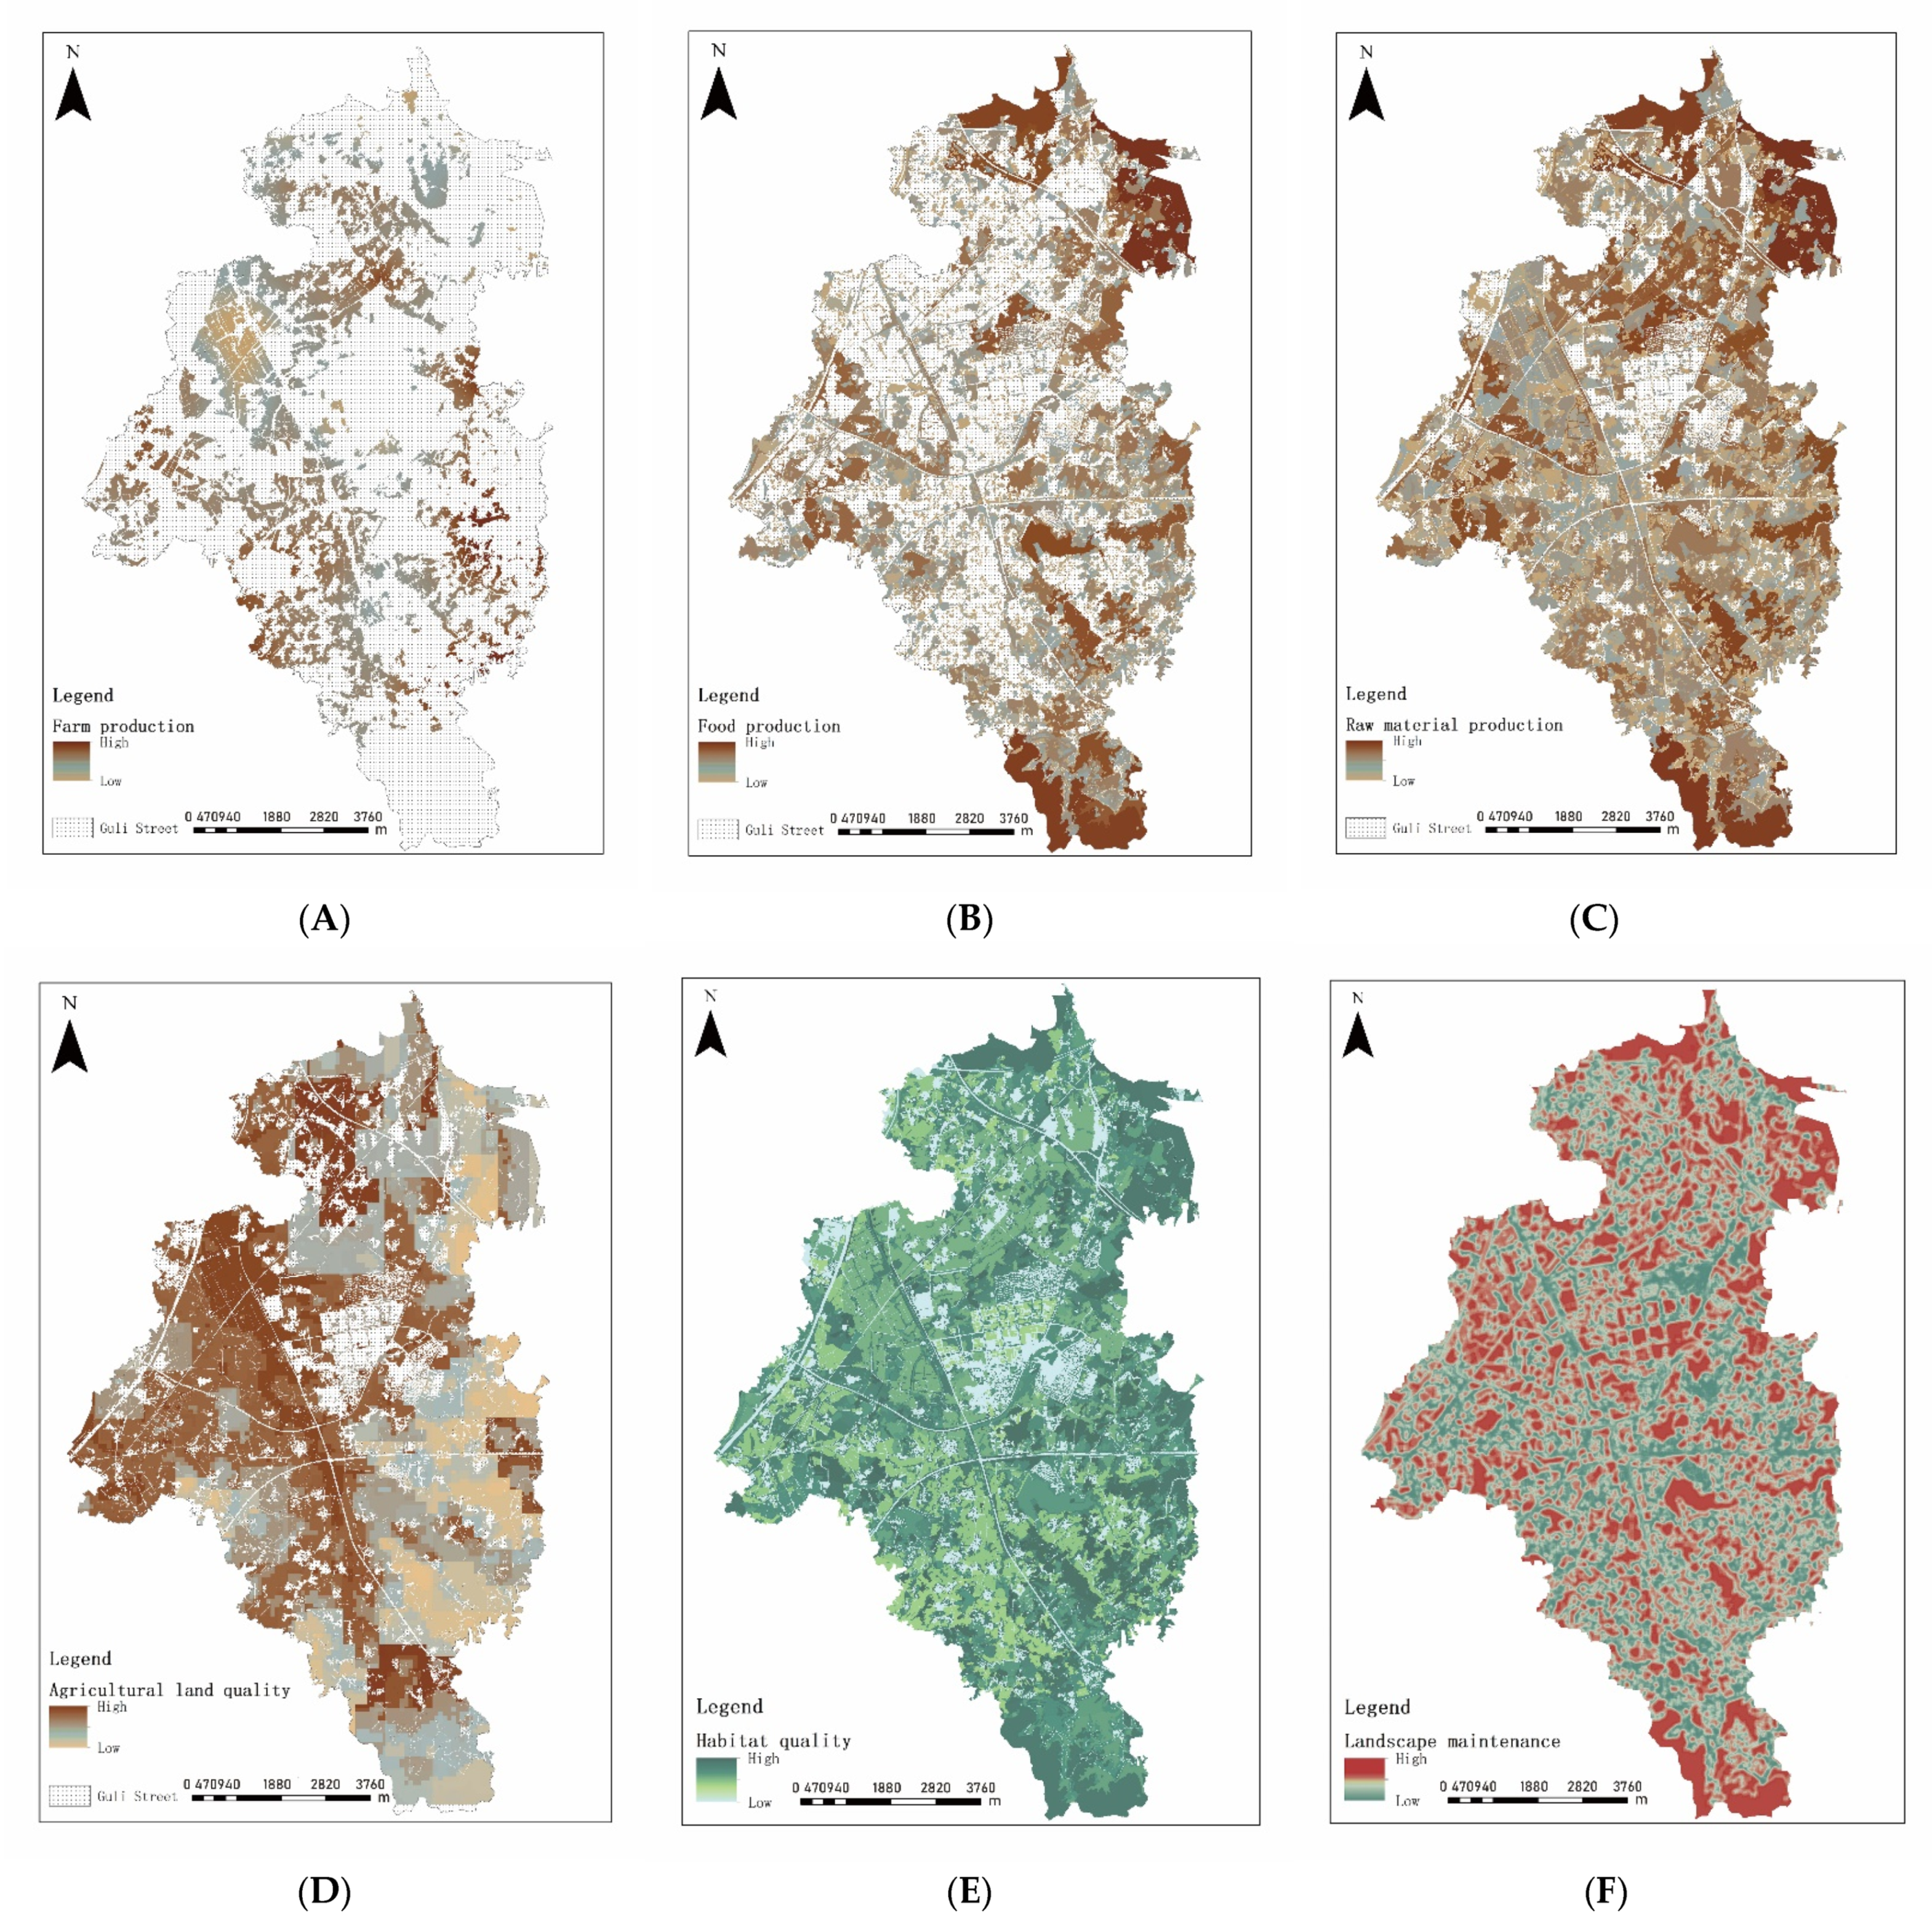
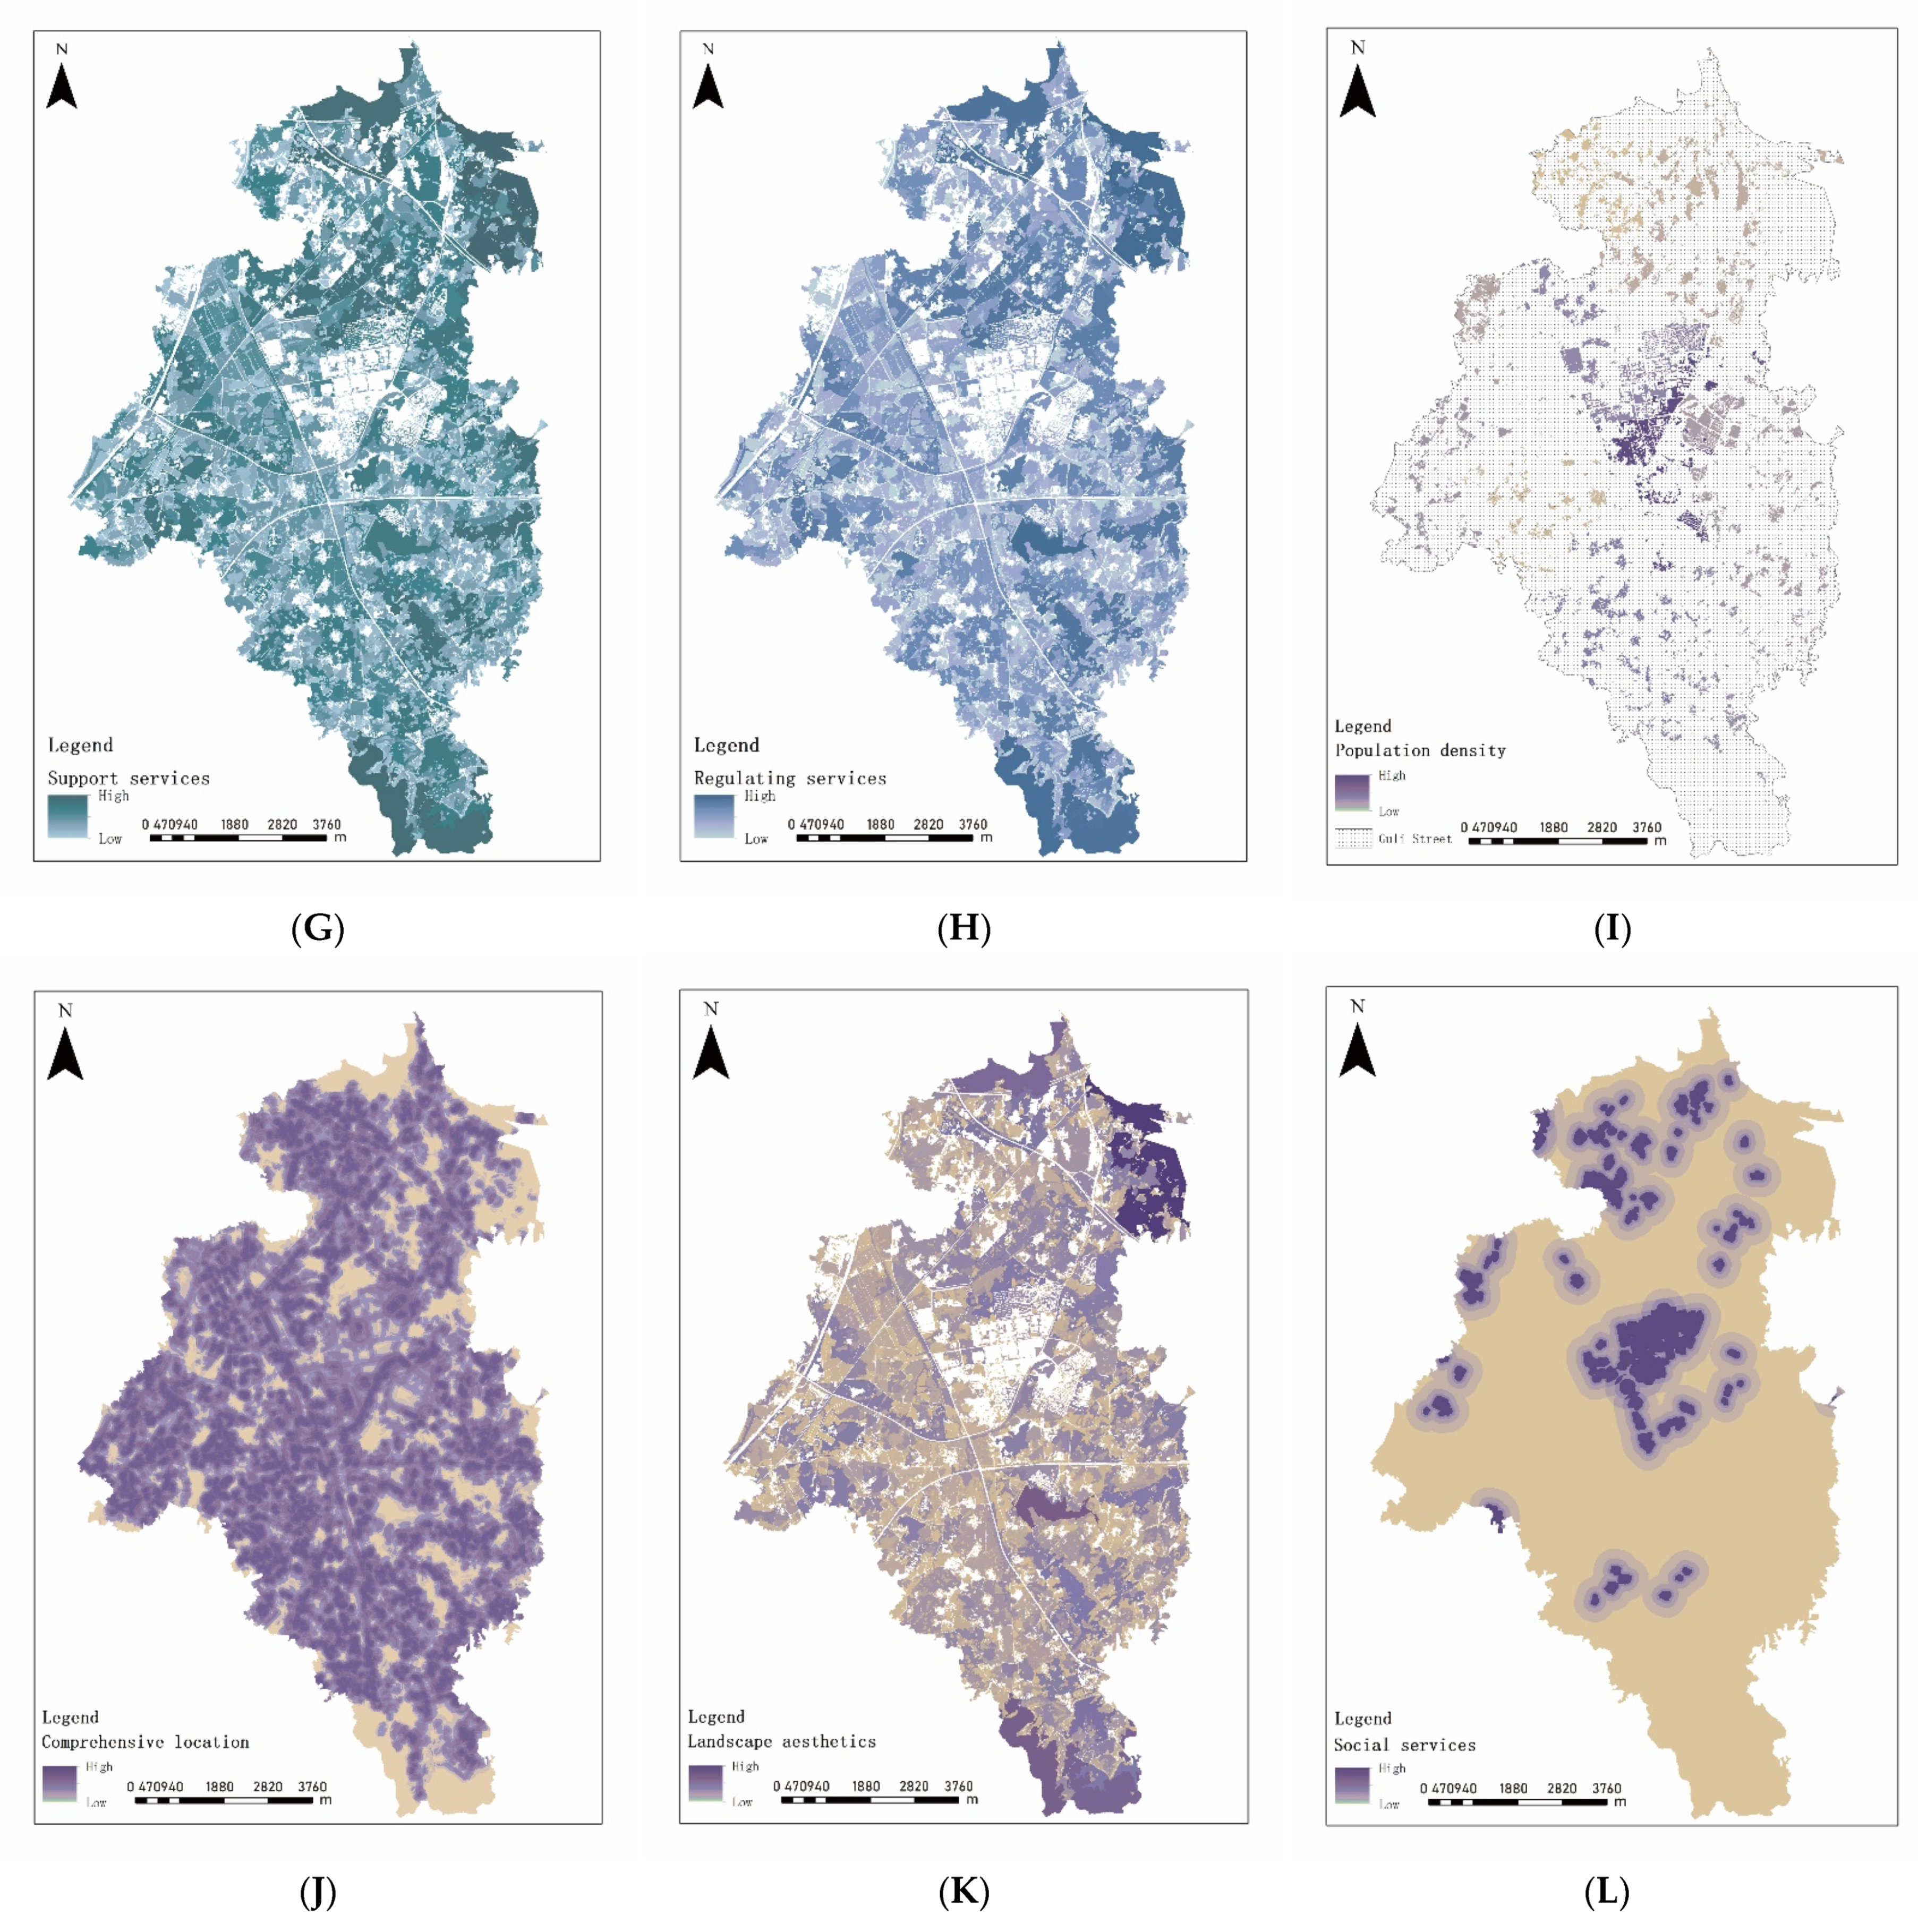
3.1. Spatial Characteristics of Subfunctions of PLE

In this paper, the spatial distribution patterns of 12 subfunctions were obtained by constructing and calculating the subfunction indexes of PLE spaces (Figure 4). In general, most of the subfunctions had similar spatial distribution rules, while a small number of subfunctions had complementary and opposite distribution rules.
Among the subfunctions of production, it is worth noting that the overall distribution pattern of agricultural land quality (D) was opposite to that of food production (B) and raw material production (C), indicating that farmland is basically distributed in areas with high agricultural land quality, while the distribution characteristics of cultivated land production (A) and agricultural land quality (D) were not consistent. This indicates that the use of farmland in the study area was not efficient enough. Among the subfunctions of ecology, the distribution patterns of support services (G), regulating services (H), and habitat quality (E) were highly similar. This shows that the type of natural landscape had a decisive influence on ecological function. Landscape maintenance (F) indicated that patch sizes and low heterogeneity of land use type also increased the ecological function. The distribution of population density (I), comprehensive location (J), and social public service (L) in the subfunctions of living were highly correlated with the distribution of construction land, but the distribution pattern of landscape aesthetics (K) was the opposite, indicating that the human living function is inseparable from ecology. In addition, the distribution of comprehensive location (J) overlapped with that of productive high-function area, indicating that cultivated land was closely related to the distribution of living subfunctions.
To sum up, the 12 subfunctions in the study area had the same rule in the same PLE functions, and different PLE functions were also mutually inseparable.

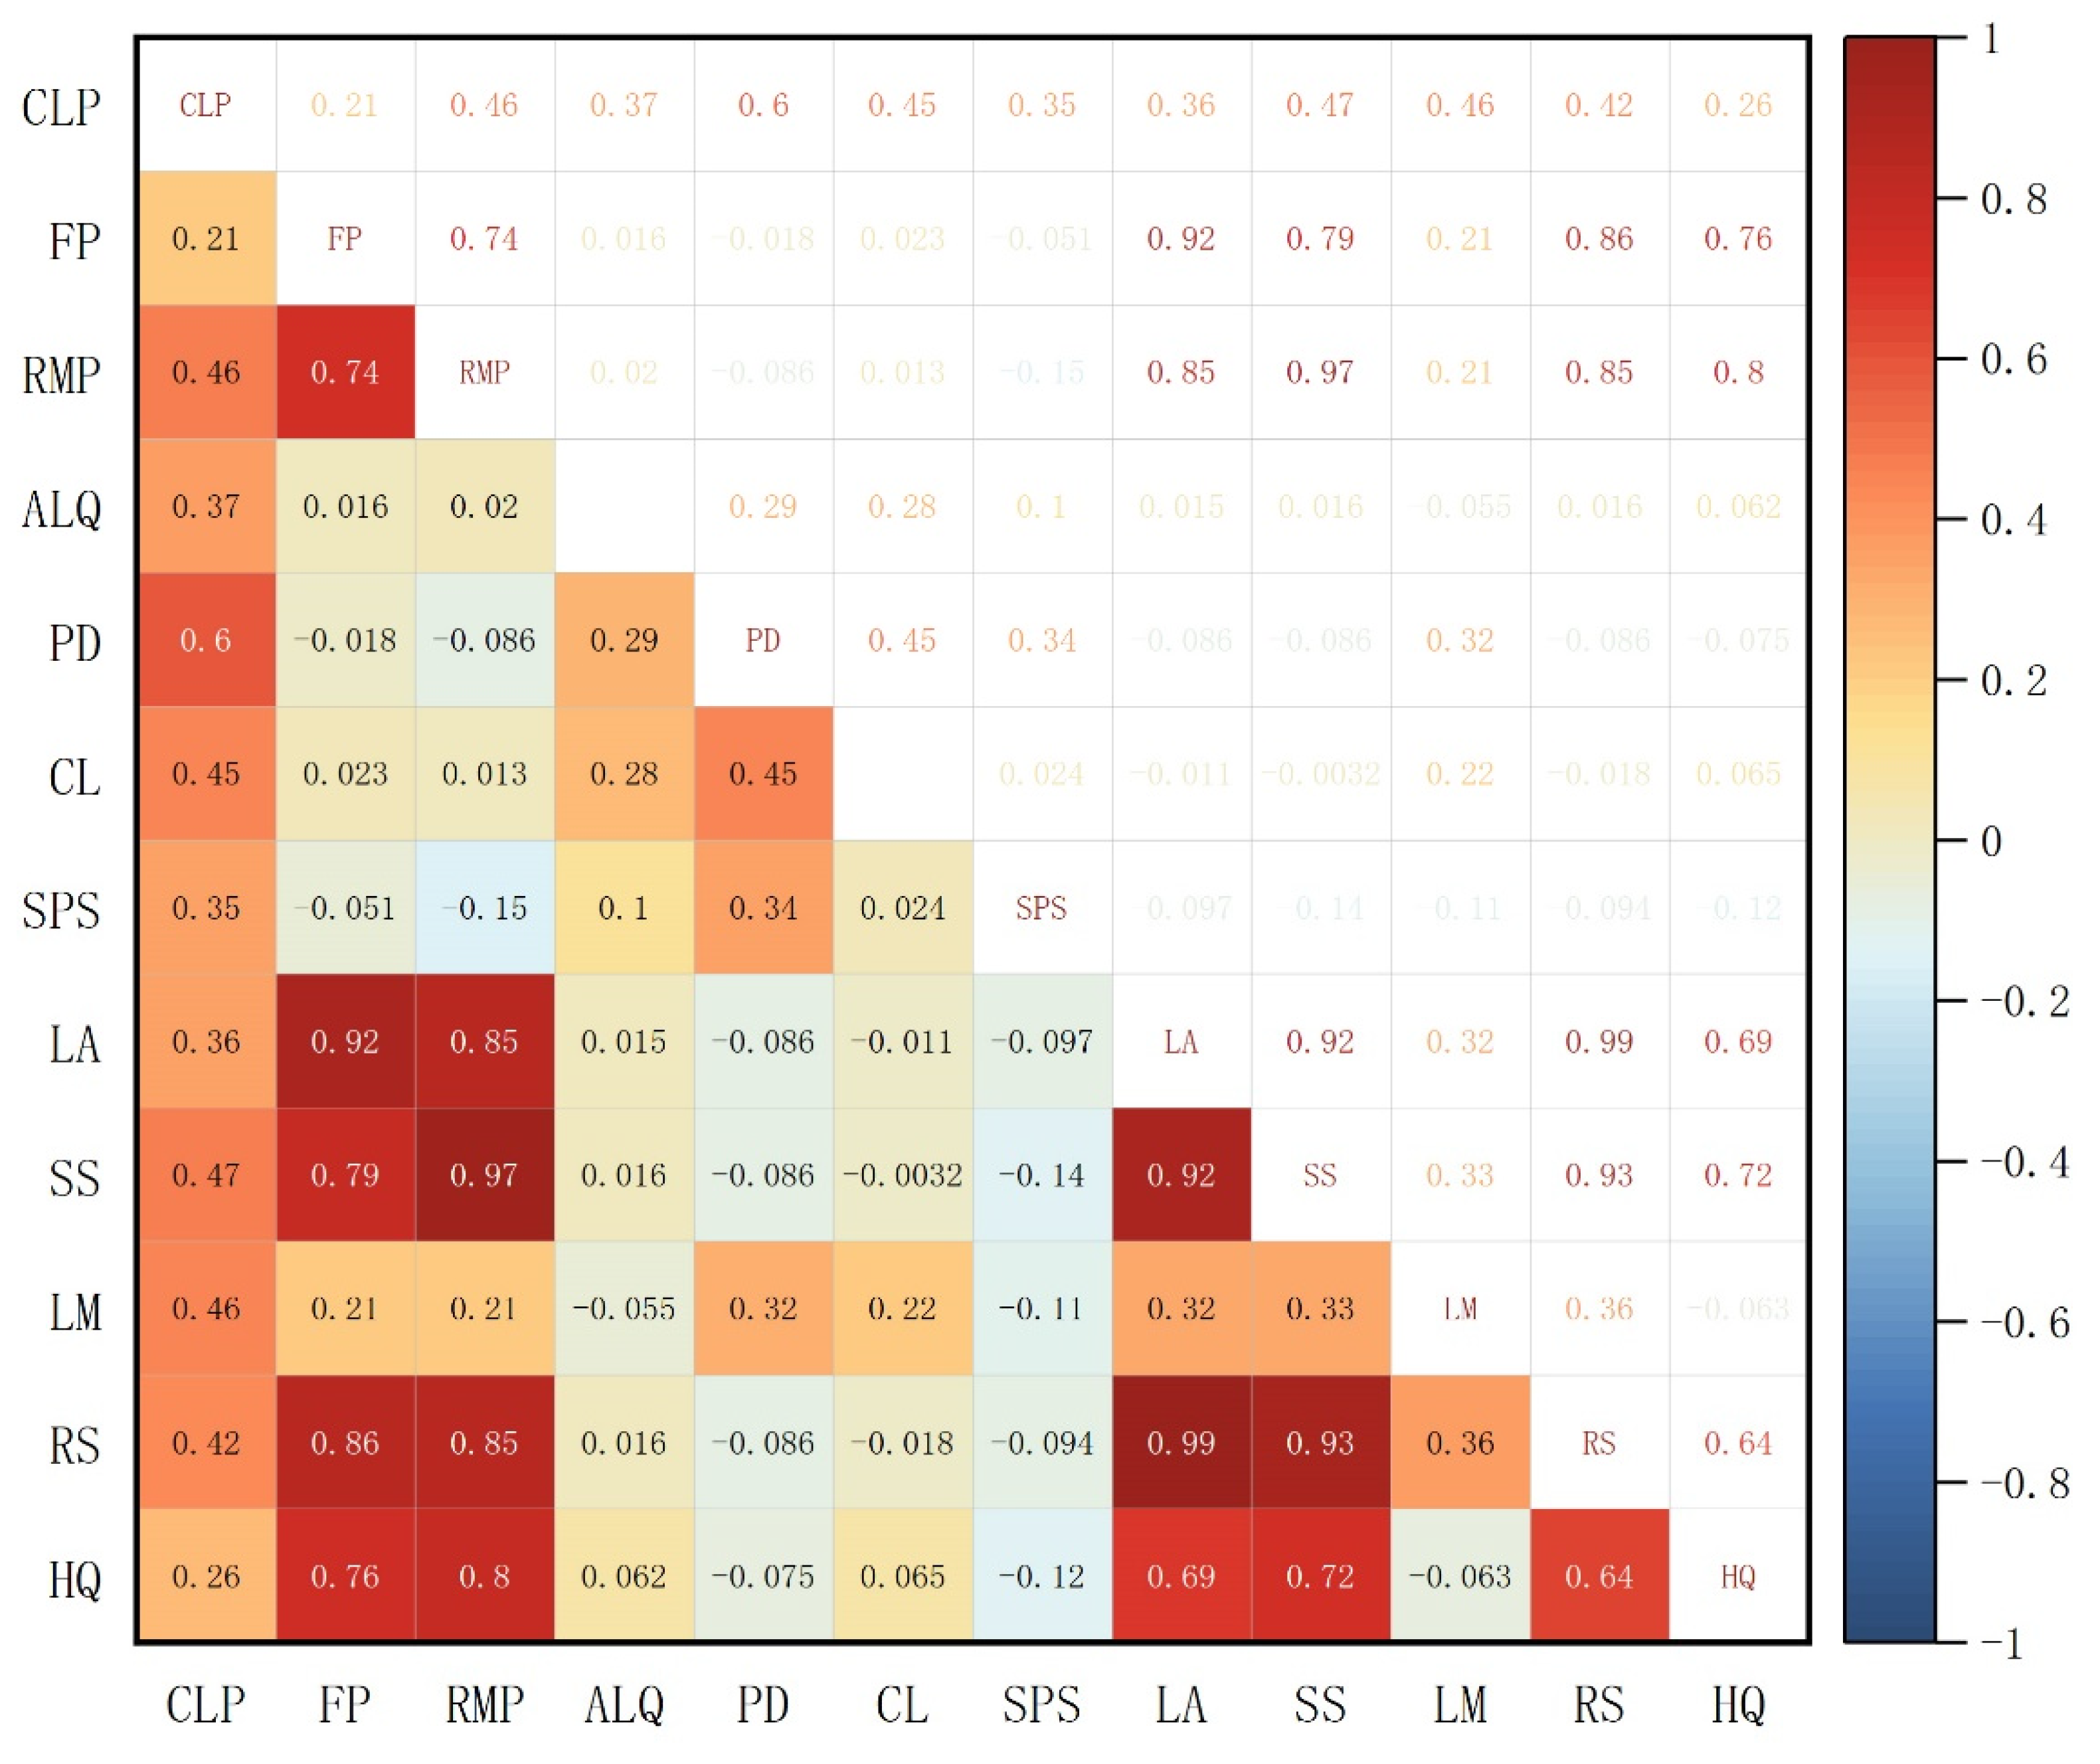
3.2. Synergies and Tradeoffs of Subfunctions of PLE

By evaluating the average intensity levels of subfunctions of PLE among different land-use patches, the Spearman correlations among 12 subfunctions of PLE were analyzed and the correlation coefficients were obtained. Overall, of the 66 components of the 12 subfunctions paired by two factors, 48 pairs were positively correlated, and 18 pairs were negatively correlated (Figure 5). The group with the highest correlation was LA and RS, while the group with the lowest correlation was RMP and SPS.
In the production functions and living functions, FP and RMP were highly correlated with LA, while CLP was highly correlated with PD. This shows that people’s demand for aesthetic culture is consistent with the productivity of agriculture, forestry, fishing, and animal husbandry in the primary industry. In terms of production functions and ecological functions, RMP and FP were highly correlated with SS and RS, respectively, and also with HQ. The results showed that the non-construction land-use types, such as forest, water area, and grassland, had a great impact on the ecological and productive effects. In terms of living functions and ecological functions, LA had a strong correlation with SS and a high correlation with HQ, while SPS had a weak negative correlation with SS and LM. The results showed that the areas with high land cover rates and biological diversity in natural areas were considered to have more aesthetic value. In addition, the construction land affected the integrity of patches to a certain extent.

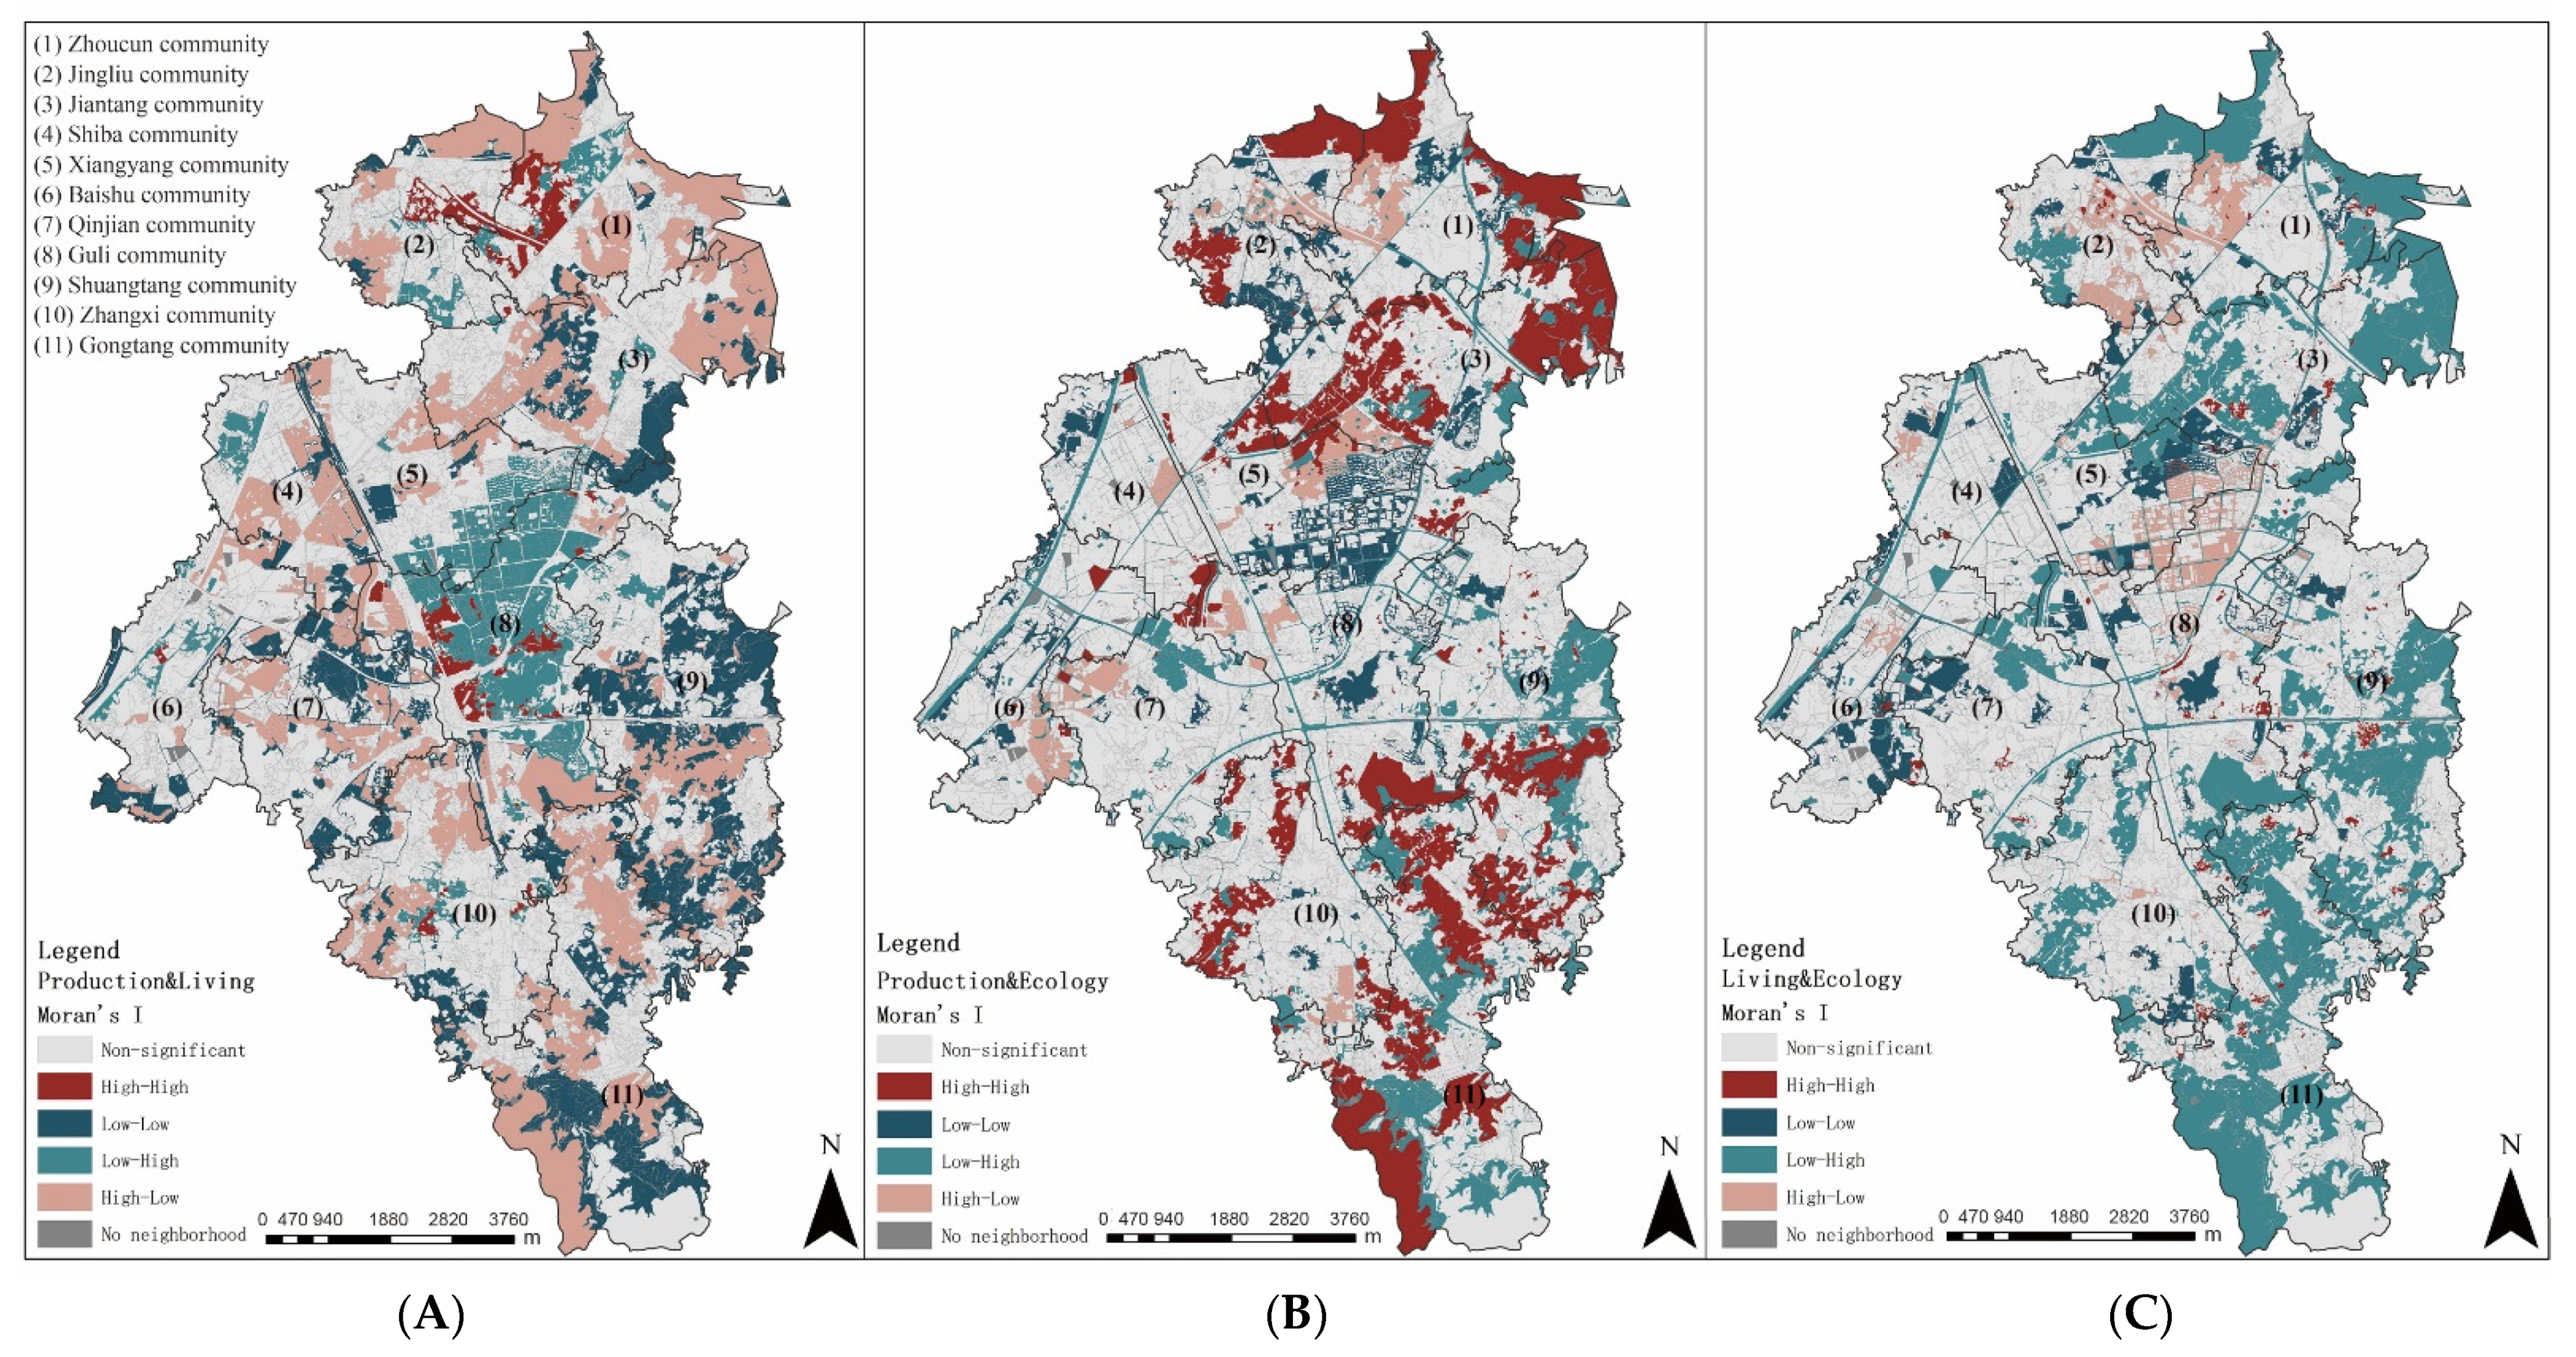
3.3. Autocorrelation Analysis of PLE Function Spatial Patterns

According to the subfunctions of PLE space intensity evaluation, the indexes after normalization processing, through the analytic hierarchy process (AHP), were used to determine the weight. Finally, the spatial distribution patterns of production, living, and ecological functions were obtained (Figure 6), which were divided into high, medium, and low levels. It could be seen that the overall distribution patterns of PLE function intensity were complementary.
The high-intensity areas of production functions (Figure 6A) were located in the west, showing a fragmented distribution pattern, and were mainly adjacent to small residential areas. The main land-use types were arable land and forest, indicating that agricultural production did not have the characteristics of scale. The areas with strong living functions (Figure 6B) were distributed in scattered clusters, except for the industrial areas in the central part. The areas with high functional intensity accounted for 1.51%, which were related to the small residential area in the study area. The main types of land use were residential land and forests. The high ecological functions (Figure 6C) of the areas were mainly distributed in the north and the south, the present state of large-area distribution, the forests and vegetation areas were larger, and the regions accounted for 6.66%. As the forests were large and had good patch integrity, the ecological functions of the forests were relatively high in the study.
Based on the functional intensity grading evaluation of PLE spaces, the autocorrelations of two functional spaces in the PLE functions were studied, and the average PLE function indexes among different patches were compared. The analysis results of spatial bivariate Local Moran’s I indexes for the patch morphology of PLE spaces were obtained (Figure 7) and the area proportion in village-level administrative regions (Table 5).
Production and living functions: Guli community had the main HH areas and LH areas at the same time, accounting for 38.38% and 52.99% of the area, and they were adjacent to each other. The cultivated land was adjacent to large residential areas and industrial areas. LL areas were mainly located in Shuangtang community, which were the natural vegetation and water areas with a high landscape fragmentation degree. HL areas were located in the Gongtang community, which were mainly the forests and water areas with high landscape integrity in a large area.
Production and ecological functions: HH areas were mainly in Gongtang, accounting for 25%, mainly for large areas and the high landscape integrity of forests and water areas. The LL area was mainly located in the Guli, accounting for 23.58%, mainly for the high concentration of settlement, and the LH and HL areas were mainly located in Shuangtang and Zhoucun. Most of them were natural areas with high landscape fragmentation and sporadic residential areas, and areas with large landscape patches and high connectivity but dense residential areas.
Living and ecological functions: The area of HH areas was small, mainly located in Shuangtang, accounting for 21.39%. There were residential areas with a moderate area and aggregation degree, with a high heterogeneity of surrounding landscape, and surrounded by large areas of nonconstruction land. The LL areas were mainly located in Baishu, which were low-cover forested areas around dense transportation land. The LH areas were mainly located in Shuangtang, accounting for 25.38%, which were the natural landscape areas with high landscape integrity and large areas. LH areas were mainly located in Jingliu, accounting for 25.62%, which were mainly densely inhabited land and public service land, or the large-area high-connectivity land cover rate vegetation located between densely inhabited land.
To sum up, there were obvious synergies and tradeoffs among the PLE functions in the Guli, Shuangtang, and Gongtang communities, which were closely related to each other and had strong conflicts. The three communities were the communities with the highest density of residents and the highest degree of naturalness. The landscape heterogeneity was high, showing strong relationships of self-correlation conflicts between the PLE. There were few harmonious areas of overall life and ecology in Guli Street.

3.4. Identification of PLE Synergistic Functional Areas

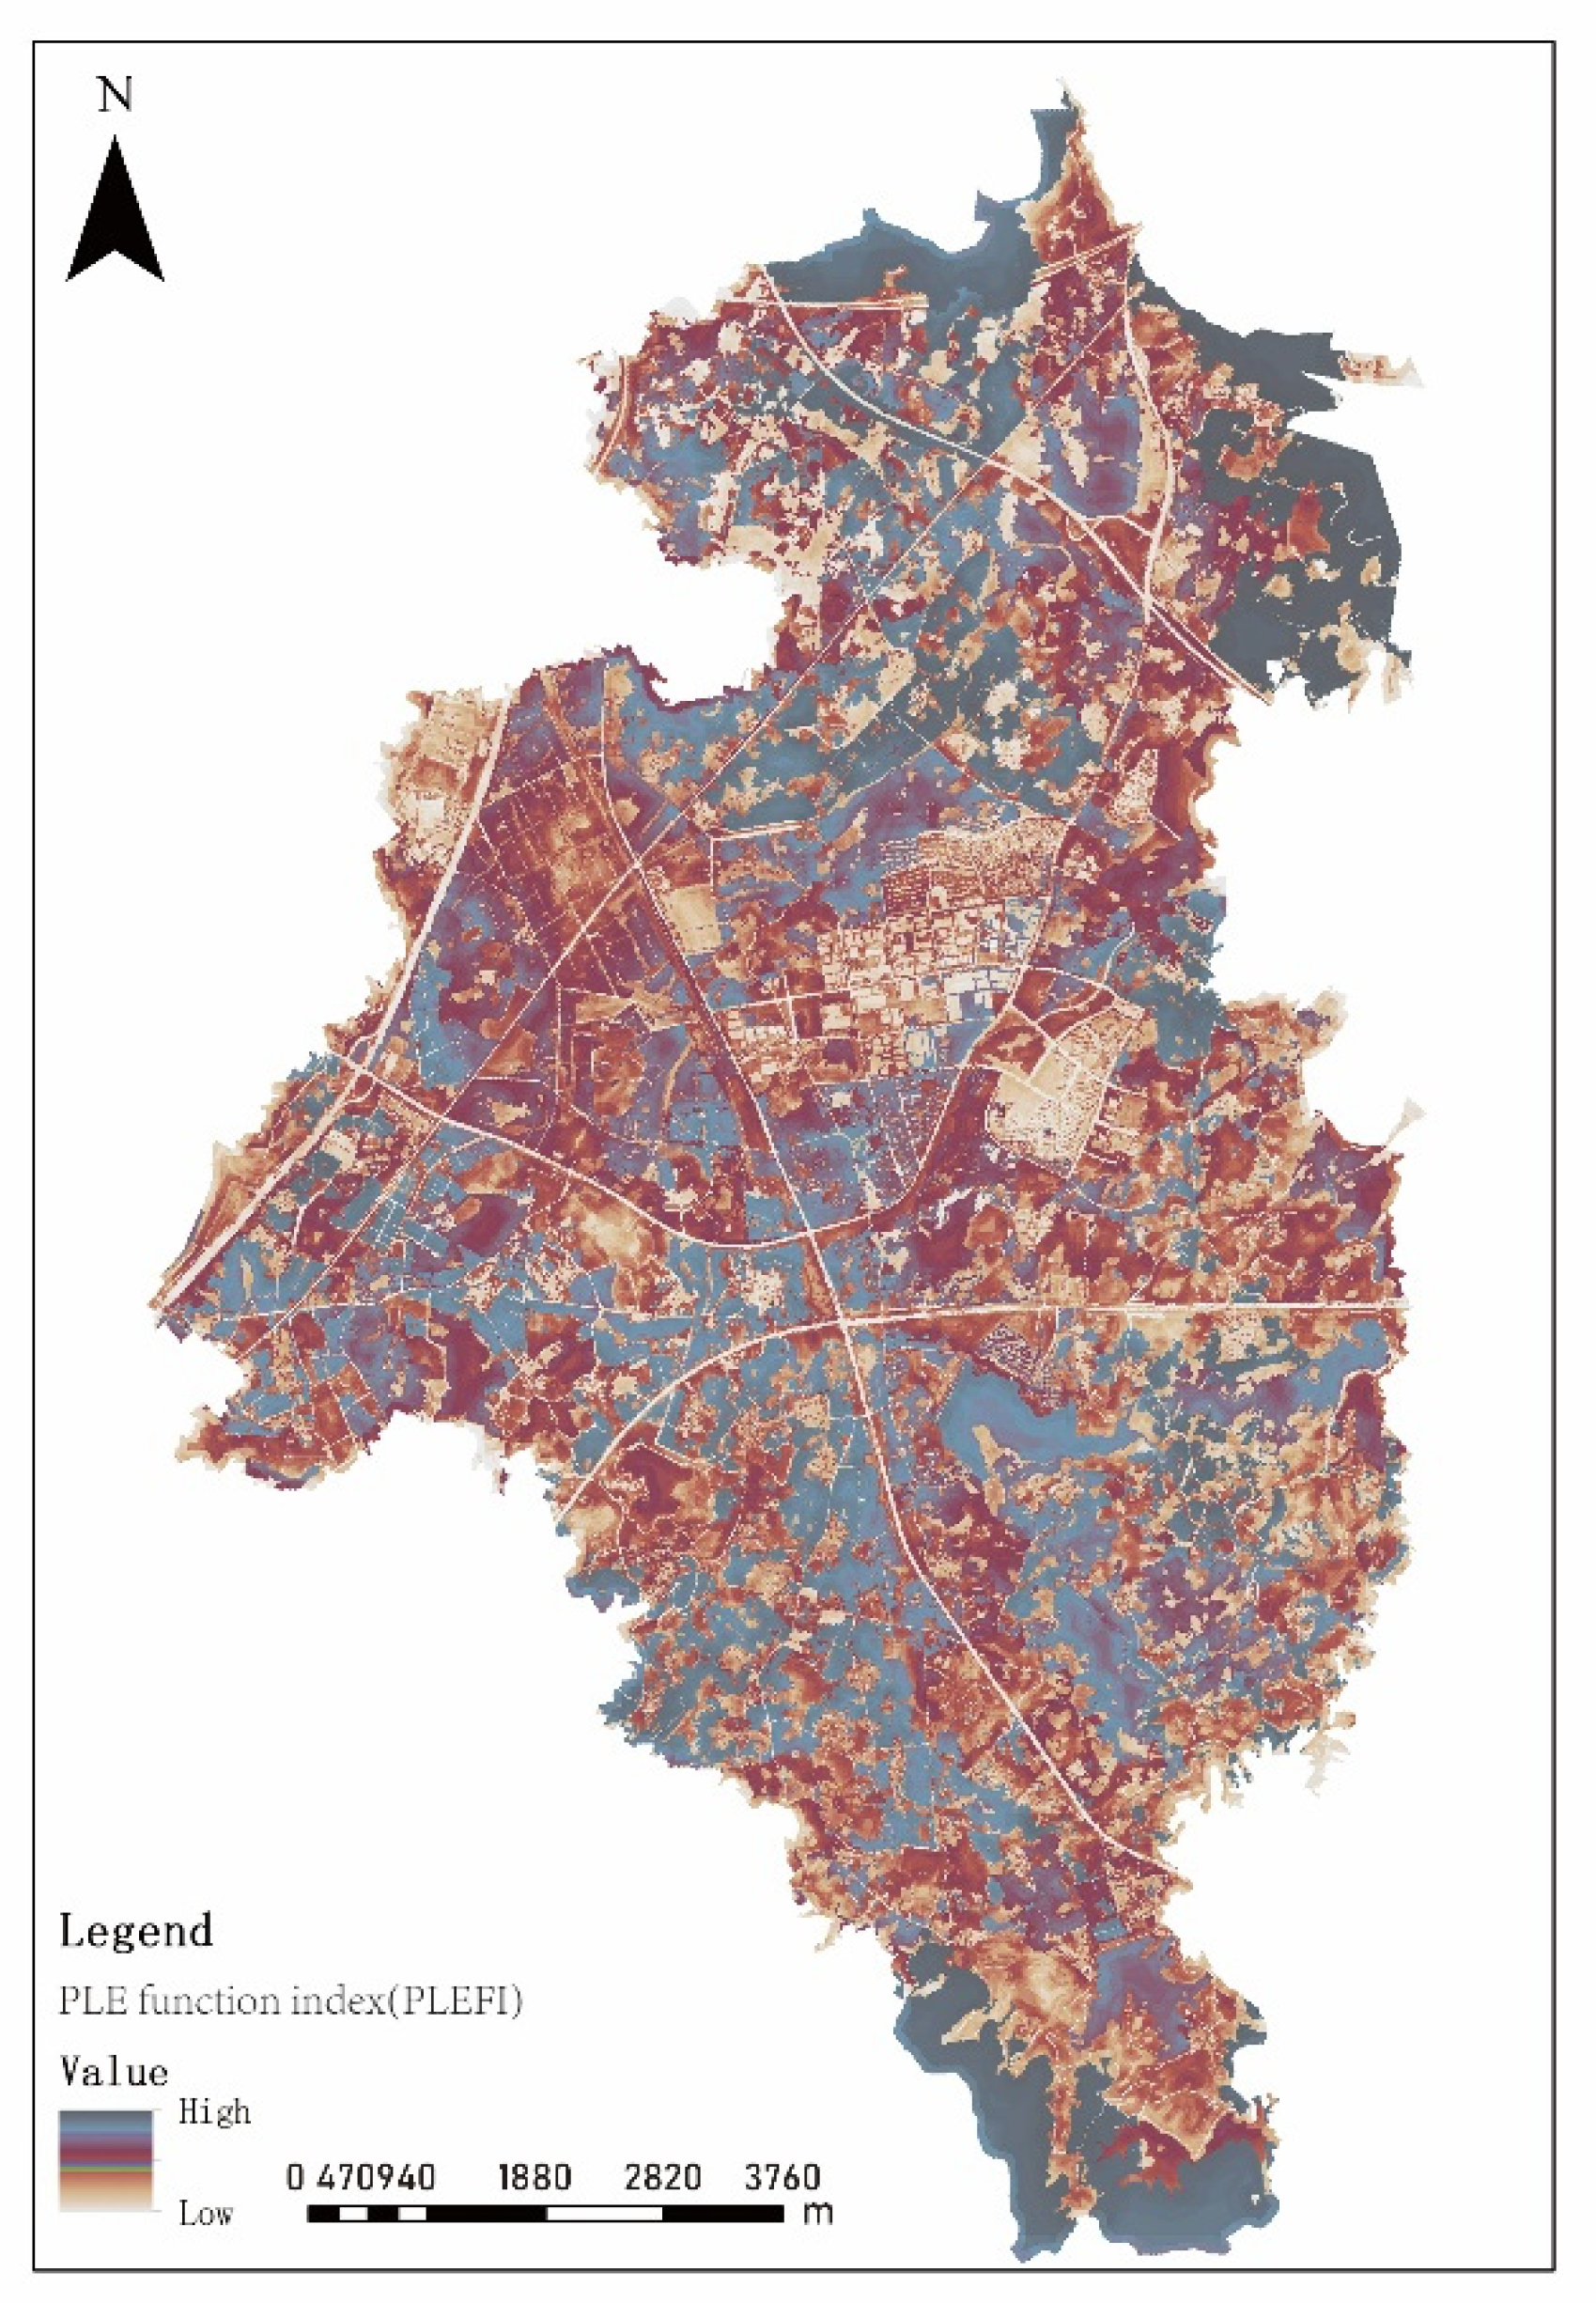
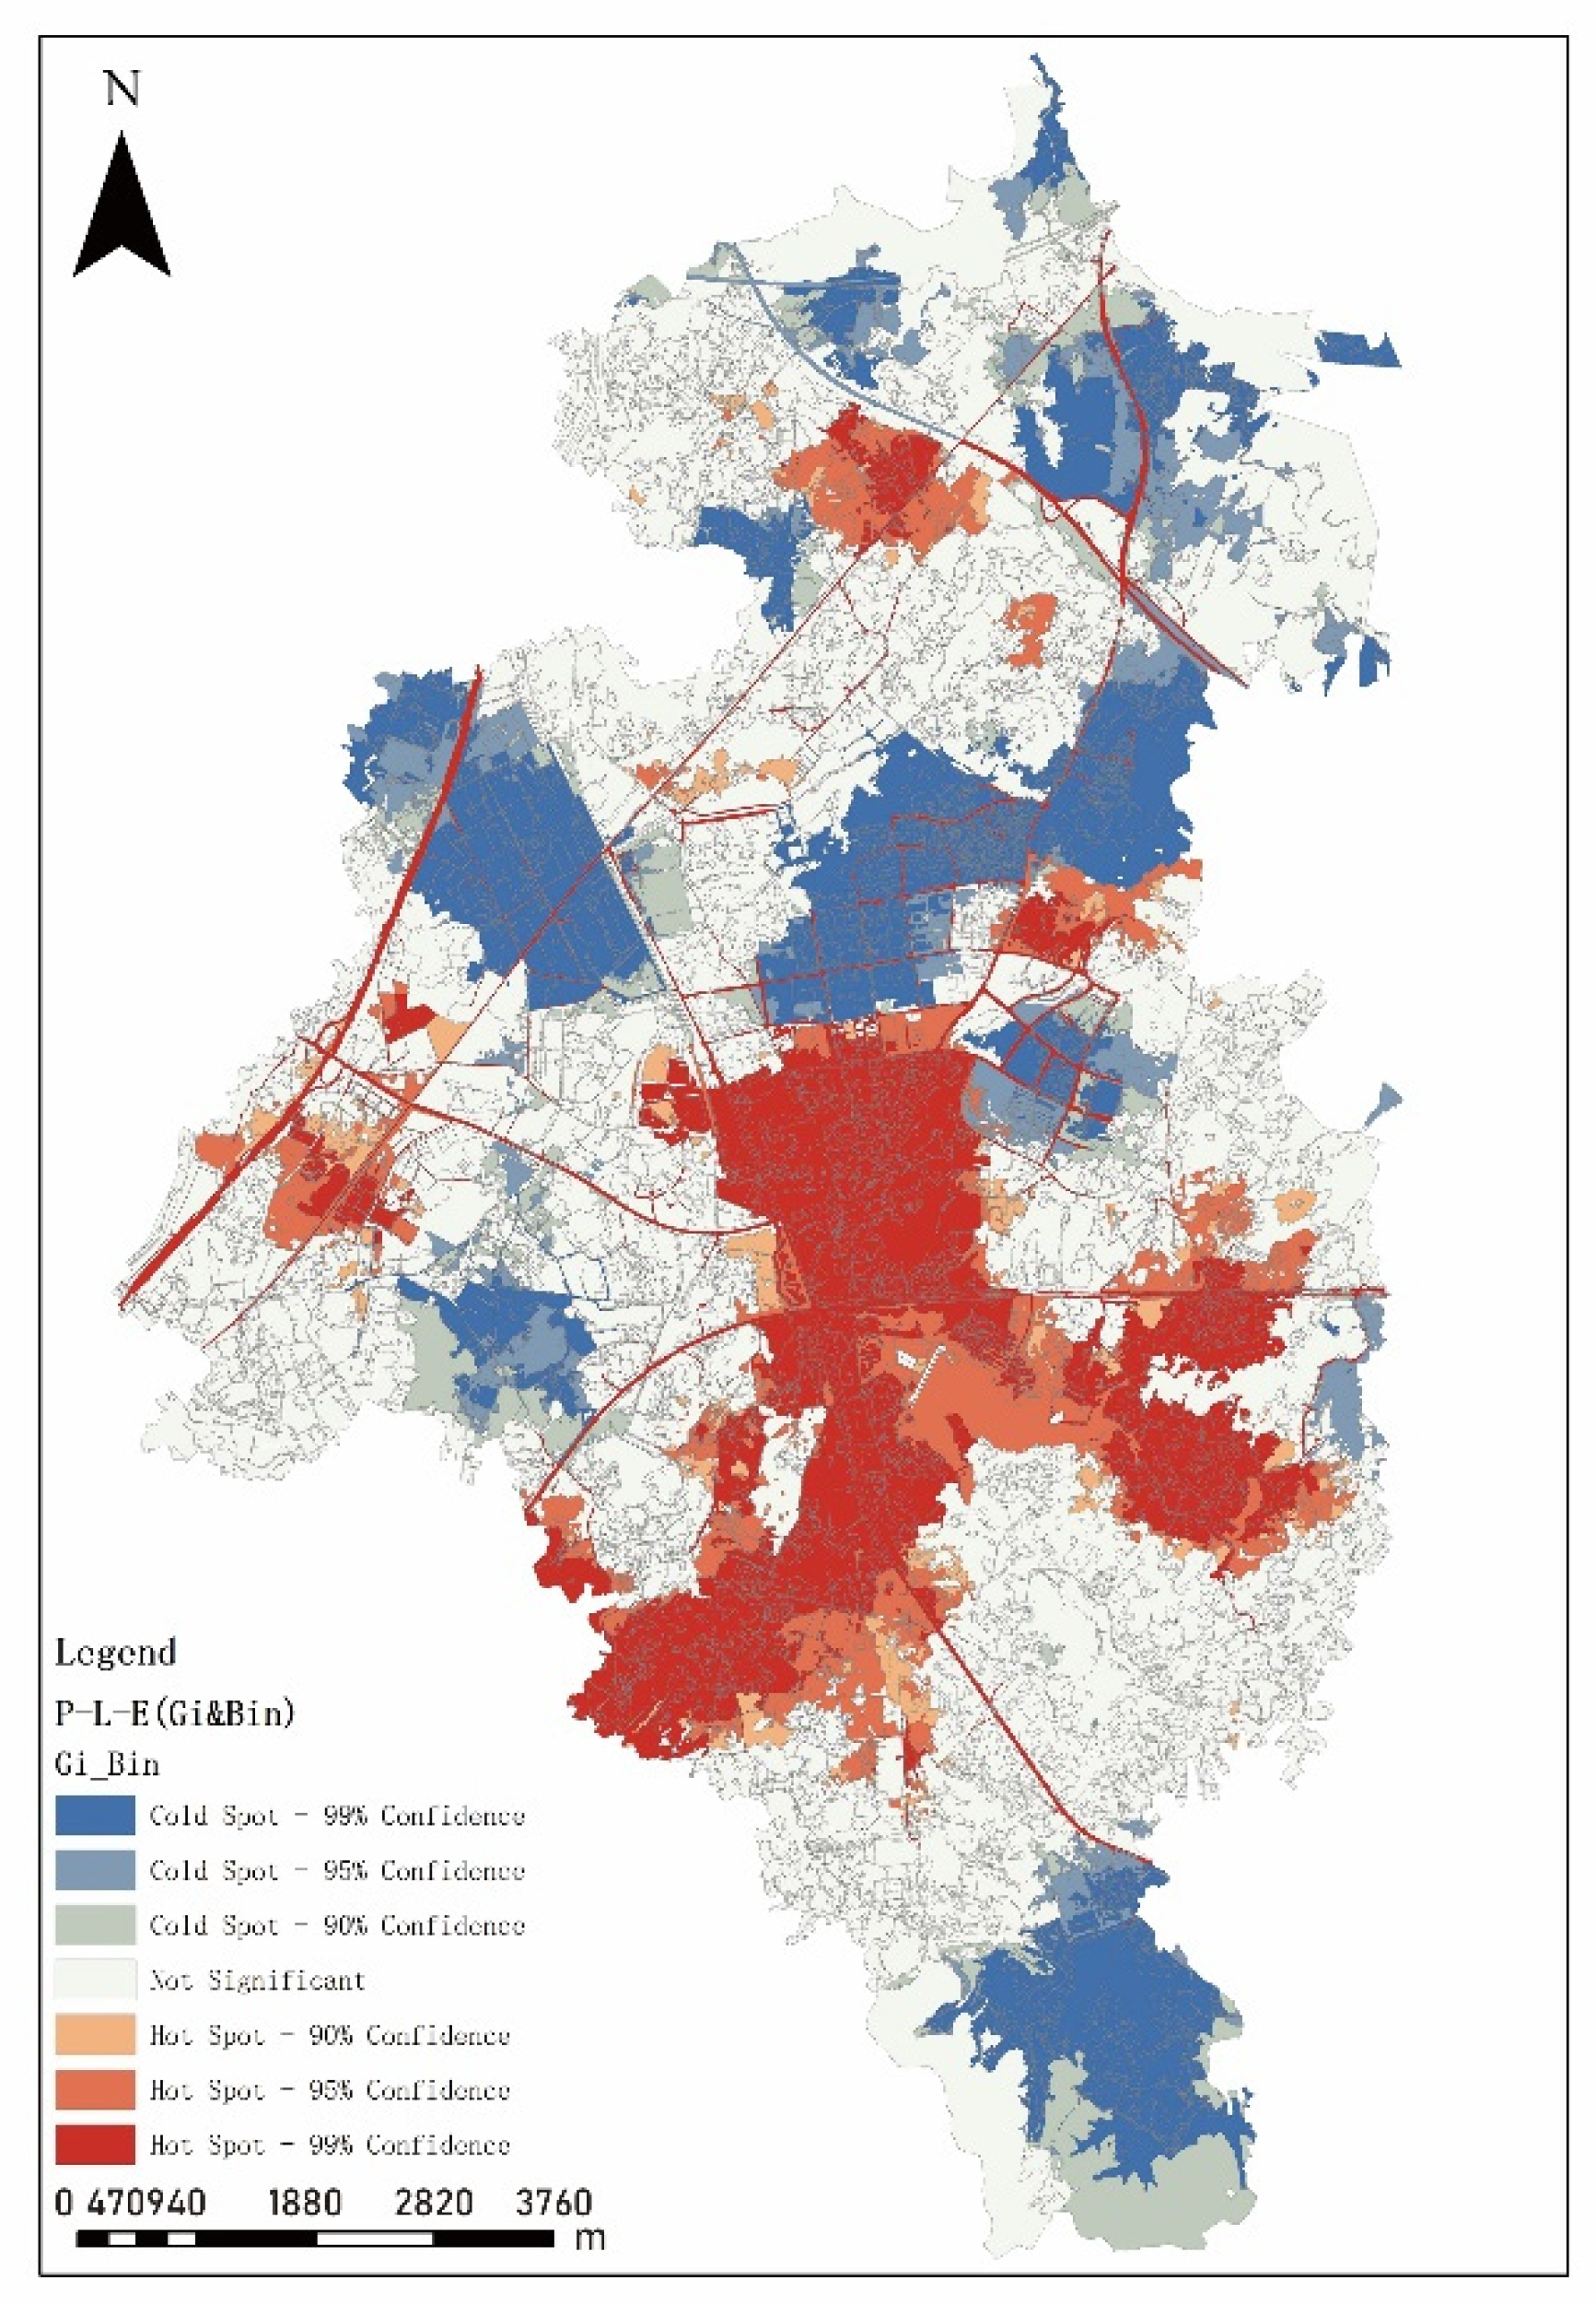
3.4.1. PLE Comprehensive Functional Areas and Cold/Hot Spot Identification

After evaluating the spatial pattern of each PLE function, a weight was assigned after standardized treatment of each function intensity to conduct a comprehensive evaluation of PLE functions and obtain the distribution pattern of the comprehensive intensity of PLE functions (Figure 8). The highest comprehensive intensity was located in the large continuous distribution areas in the north and south, while the lowest intensity was located in the middle and main traffic roads. The hot spots of PLE comprehensive functions were located in the middle and lower parts of the research area, which had high spatial heterogeneity and mixed functions of various land use. The cold spots of the PLE comprehensive functions were relatively scattered, with large plane-like regions in the south, north, and west, and a relatively single land type and large area (Figure 9).

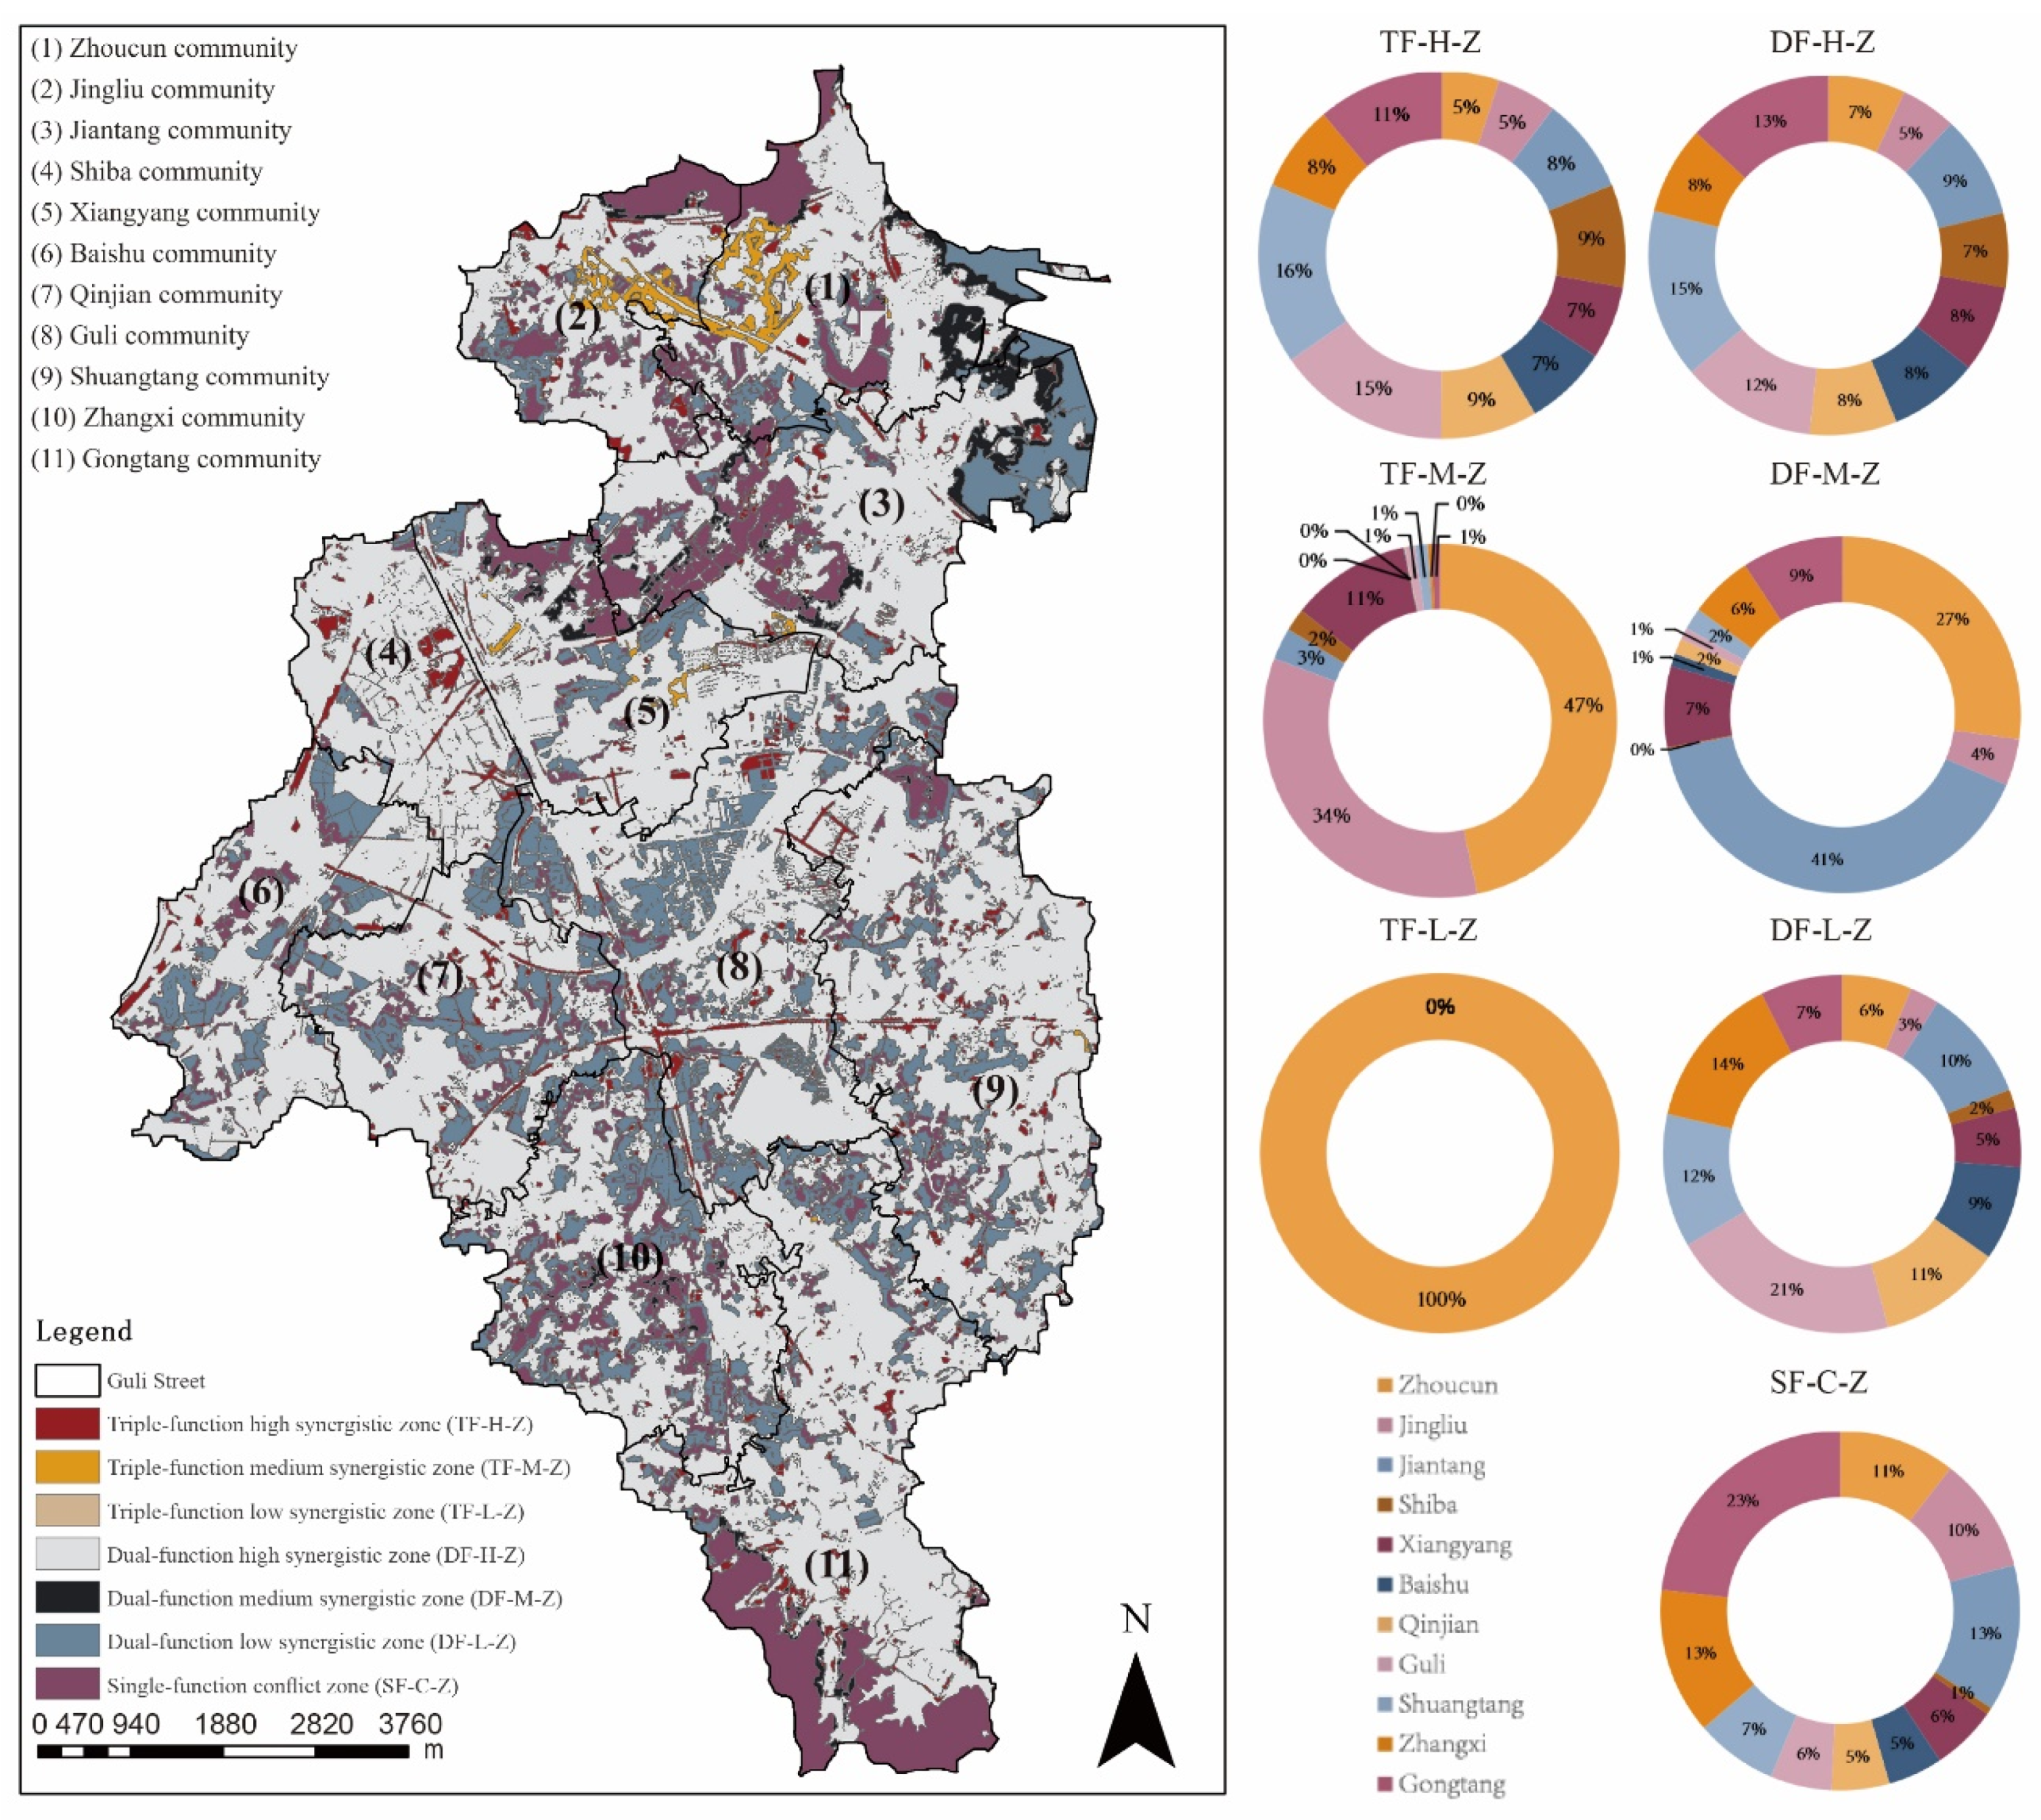
3.4.2. Identification of Potential Areas of PLE Synergies

Starting from administrative villages, this paper performed analyses on the area proportion of seven types of PLE synergistic areas and formulated planning strategies for PLE functions in zoning areas. Due to the small scale of the study area, the data accuracy was at the patch scale. Therefore, the areas of the seven types of PLE synergistic potential areas were significantly different. The DF-H-Z had the largest in the study area, while the DF-L-Z had only one minimal patch, which can be ignored as per the study area scale (Figure 10).
The TF-H-Z accounted for 5.83%, which mainly consisted of transport land adjacent to natural and semi-natural areas and small patches with high heterogeneity. TF-M-Z accounted for 1.02%, mainly distributed in Zhoucun, accounting for 47%. The patch features were obvious, and there were corridor-like forests, with high connectivity and large areas; they were also close to large and concentrated residential areas. DF-H-Z accounted for 65.44% and was distributed evenly in all communities, with woodland 18%, farmland 24.18%, vegetation areas 25.52%, water 9.91%, and residential 11.24, etc. The land patch area was large and distributed evenly in all communities. DF-M-Z accounted for 2.27%, and Jiantang accounted for 41%. The mainland was distributed along the edges of large patches, such as large forests and large farmlands, in strips. The DF-L-Z, accounting for 13.34%, was dominated by farmland, accounting for 30.74%, and it was densely distributed in clusters with a high degree of fragmentation, mostly in Guli with the highest population density. The SF-NF-Z was also large, accounting for 12.11%, and closely embedded with the DF-L-Z, which was mainly fragmented forest land and farmland. It was mainly distributed in Gongtang, because it had the largest forest area with the least man-made disturbance in Gongtang.
In Guli Street, the proportion of the areas of PLE synergistic functions in different communities were different, and the differences were great. This phenomenon was closely related to natural geographical conditions, human-induced disturbance intensity, and landscape patterns, and it was necessary to make targeted planning schemes based on the zoning of PLE synergies.

4. Discussion

4.1. Application of Rural PLE Synergistic Functional Areas

The identification of PLE synergistic functional areas in rural space is the basis for realizing the coordinated development of production, living, and ecological functions led by the rural revitalization strategy, and provides detailed planning strategies and scientific guidance for the imbalance of rural development at the regional scale. “Take politics to highly enhance the concept of ecological civilization, sustainable development in harmony with nature and new achievements oriented by green development” as the concept of governance. President Xi made important instructions to “make overall plans for territorial space development, scientifically arrange production space, living space and ecological space, and leave more space for nature to repair [57].”.
The identification of PLE synergistic functional areas determined the priority for the formulation of land use planning strategies and is a supplement to the existing research on PLE functional relations from the perspective of functional conflict [29]. Existing studies believed that PLE function overlap is a kind of conflict, and the solution to land-use conflict focuses on guidance and weakening [58]. The PLE functions had symbiotic integration and restriction, and the synergistic effect of PLE functions was greater than the sum of its parts [11]. Compared with existing studies that focused on one function as a priority in the form of zoning [28], this study delineated seven types of characteristic regions with the degree of synergy as a priority. The demarcation of the synergistic areas focused on the coordination and protection between functions, which was the way to realize rural sustainable development. The research took ecosystem sustainability as the priority, as the premise of sustainable economic and social development. Under the policy of “integrating multiple plans into one” in the national spatial planning system, the boundary lines of permanent basic farmland and ecological protection lines outside the boundaries of urban development in townships and towns will be demarcated. The protection of highly synergistic areas (TF-H-Z, TF-M-Z, and TF-L-Z), balance of moderate synergistic areas (DF-H-Z and DF-M-Z), and renovation of low synergistic areas (DF-L-Z and SF-NF-Z) are the minimization methods to maximize the interests of all parties, pay attention to the association between various functions, and realize the sustainability of Guli Streets. It is also the key to improving the hollowing out of rural areas.
Fine-scale functional zoning and identification mapping of synergistic characteristics of rural PLE spaces make planning and governance more directional. Compared with the calculation of the synergistic effect between PLE spaces based on the coupling coordination degree, the calculation and comparison of PLE functions are mainly focused on macro administrative areas [59]. The results show that there is no obvious spatial agglomeration in the identification of PLE cooperation, which is caused by the differentiation of spatial scale. It is the key to understanding the synergistic effects of PLE function on the social process and land function in rural areas by clarifying the precise distribution pattern of PLE functions at the village scale, taking the land patch scale as an evaluation unit, and clarifying the impact of land patch pattern distribution.

4.2. Discussion on the Strategies of Synergies and Tradeoffs of PLE Function Area

The synergy and tradeoff evaluation of PLE function zones provide strategies for land-use management. The root of the conflict and game of land-use function is the multi-function of land. Since any land may have a combination of production, living, and ecological functions, it is necessary to give prominence to its dominant function and give consideration to its subfunctions in the division of PLE spaces [60]. The autocorrelation calculation of PLE function spaces helps planners to understand the specific correlation and conflict between functions to make detailed adjustments. Through the research of synergies and trade-offs between two functions in the function of PLE, in the PLE functions, there exist obvious synergies between any two functions, and the tradeoff between the third one and any of the two functions. The highly concentrated residential areas, industrial areas, and public service land in the Guli community show the law of production and ecological function synergies, living and ecological function tradeoffs, and production and living function tradeoffs. The correlation between the landscape aesthetic and support services of Guli Street reaches 0.99. It is suggested to increase the layout of small green patches in such living areas to enrich vegetation resources. The forest areas of the Gongtang community belong to the synergies of production and ecology, the tradeoffs between production and life, and the tradeoffs between life and ecology. To protect natural or semi-natural ecosystems such as “mountains, rivers, forests, fields, lakes and grass” as the starting point of ecological civilization construction, the study suggests that such areas should be controlled and protected to improve their ecosystem service capacity.
The tradeoffs and synergies of PLE subfunctions complement the specific control path in the PLE synergistic functional areas. The index system measurement method used in this paper combines the methods with a high degree of data accuracy and magnitude dependence, such as the biophysical measurement method and index method, with the methods with strong adaptability and operability, such as the value equivalent method and model method, to adapt to the micro scale and reflect the quality and quantity characteristics of space. At present, the commonly used land-use type merging method has difficulty describing the strength and weaknesses of PLE spatial functions and various subfunctions. The results show that the largest proportion of DF-H-Z land is the vegetable area, accounting for 25.52%; the largest proportions of DF-M-Z, DF-L-Z, and SF-C-Z land are cultivated land, with the proportions of 33.08%, 30.74%, and 28.83%. The distribution pattern of cultivated land production and agricultural land quality is not consistent. Research thought is important for controlling the Guli Street low synergistic area’s main contradiction in the use of cultivated land. The production function of the fragmentation distribution pattern shown here does not have the scale of agricultural production characteristics. In terms of strategy, the cultivated land should be regulated to increase the effective cultivated land area, improve the soil, and improve the quality of cultivated land. However, the cultivated land with extremely dense distribution and large area, which destroys the ecological balance, should be demarcated to crack down on the illegal use of land. DF-H-Z has the highest proportion of industrial land, accounting for 1.92, indicating that most of the industrial spatial distribution in Guli Street is in a reasonable distribution state. Supplementary balance is suggested to carry out small-scale land-use change, increase spatial heterogeneity, and avoid the situation of high regional land-use homogeneity.

4.3. Limitations

In the process of measuring the functions of PLE spaces and identifying the synergistic features of PLE spaces, the following problems need to be solved. (1) The effects of the study area scale: Due to the small regional area, rich land-use types, and great differences in geographical conditions, the function measurement based on land patches was greatly affected by the patch areas. In this paper, the natural breakpoint method was used to grade the PLE functions, and a large gap in the area of different grades appeared. As for the division result of PLE synergistic functional areas, a phenomenon appeared that a certain type was rare. Scale also had some limitations on the construction of the indexes system. In addition, due to the large difference in the number of land patches of different types, the correlation analysis of all patches in the study area may be biased, and the blocks with smaller land patches may be neglected. (2) In the calculation of ecosystem service value, landscape aesthetic function is perceived by human subjects, which is closely related to human physiological, psychological, and spiritual consciousness. Although studies showed that aesthetic value is positively correlated with ecological value [61], aesthetic preference is not completely consistent with the importance of natural ecological processes and functions. In the quantification of habitat quality, the InVEST model only considered the cumulative effects of various stress factors on the habitat but ignored the effects of the superposition of comprehensive factors and other stress factors outside the study area boundaries. The direct monitoring method can be combined with a comprehensive evaluation in future studies. (3) The feature recognition of PLE synergistic functional areas aims to measure the differences among PLE functions. However, there is a lack of detailed guidance on land-use optimization measures adopted in specific function zoning, which leads to the dominant land use policy of “compensation balance of farmland requisition”, which is unique to China, in planning methods. Therefore, the PLE synergistic zones need to formulate land-use planning strategies according to local conditions.

5. Conclusions

The results of this case study showed that Guli Street was generally located in the (DF-H-Z)-dominated PLE intermediate synergistic area, and the planning strategy is mainly supplementary balance. The main contradiction lay in the utilization efficiency of cultivated land and the fragmentation of its distribution pattern. Secondly, we should focus on the protection of ecological regions, add green patches to the construction land, and fine-tune the layout of industrial land. Different priority governance strategies can be used to coordinate the uneven development of Guli Streets and coordinate the PLE functions to achieve the sustainable development of space resources.
The identification of PLE synergistic functional areas provides a new perspective and method for the spatial reconstruction of rural areas. The evaluation system of PLE space functions constructed in this study can identify the spatial distribution pattern of subfunctions with a high level of accuracy. The correlation results between subfunctions indicate the logical basis of PLE space functions, as well as the rules and inseparable correlation between constituent factors. The analysis of the synergistic and tradeoff distribution of the patch morphological layout of the two functions of PLE functions. The identification of PLE comprehensive functional areas, as well as the synergistic areas representing PLE tradeoffs and synergies, delimits the different characteristics of each village-level administrative area and ultimately provides strategies and guidance for zoning land-use planning and space control.
This case study can show that the natural ecological background and human activities in rural areas of conflicts and synergies are very complicated; therefore, the combination of the fine mapping of land patch scale and various index measurement methods makes up for the lack of research on the scale and accuracy of towns in rural PLE spaces and makes the spatial governance of these small rural areas more accurately oriented and scientifically controllable. The case study of Guli Street provides the basis and guidance for the input of various elements in the optimization of PLE spaces between different areas in rural areas and has important practical value for solving the contradiction between the sustainable and coordinated development of rural development, ecological environment, and spatial resources.

Author Contributions

Methodology, software, validation, formal analysis, investigation, resources, data curation, writing—original draft preparation, visualization, T.Z.; software, T.Z. and X.F.; conceptualization, writing—review and editing, supervision, T.Z., Y.C. and Y.F.; project administration, funding acquisition, Y.C. All authors have read and agreed to the published version of the manuscript.

Funding

This research was funded by the National Key Research and Development Program of China (No. 2019YFD1100405). The funder is Yuning Cheng.

Institutional Review Board Statement

Not applicable.

Informed Consent Statement

Not applicable.

Data Availability Statement

Not applicable.

Conflicts of Interest

The authors declare no conflict of interest.

References

  1. Li, K.Y.; Jin, X.L.; Ma, D.X.; Jiang, P.H. Evaluation of Resource and Environmental Carrying Capacity of China’s Rapid-Urbanization AreasA Case Study of Xinbei District, Changzhou. Land 2019, 8, 69. [Google Scholar] [CrossRef] [Green Version]
  2. Tang, C.L.; He, Y.H.; Zhou, G.H.; Zeng, S.S.; Xiao, L.Y. Optimizing the spatial organization of rural settlements based on life quality. J. Geogr. Sci. 2018, 28, 685–704. [Google Scholar] [CrossRef] [Green Version]
  3. Long, H.L.; Liu, Y.Q.; Hou, X.G.; Li, T.T.; Li, Y.R. Effects of land use transitions due to rapid urbanization on ecosystem services: Implications for urban planning in the new developing area of China. Habitat Int. 2014, 44, 536–544. [Google Scholar] [CrossRef]
  4. Ye, Q.Q.; Wei, R.; Zhang, P.P. A Conflict Identification Method of Urban, Agricultural and Ecological Spaces Based on the Space Conversion Matrix. Sustainability 2018, 10, 3502. [Google Scholar] [CrossRef] [Green Version]
  5. Shen, J.; Chou, R.J. Cultural Landscape Development Integrated with Rural Revitalization: A Case Study of Songkou Ancient Town. Land 2021, 10, 406. [Google Scholar] [CrossRef]
  6. Long, H.L.; Tu, S.S.; Ge, D.Z.; Li, T.T.; Liu, Y.S. The allocation and management of critical resources in rural China under restructuring: Problems and prospects. J. Rural. Stud. 2016, 47, 392–412. [Google Scholar] [CrossRef] [Green Version]
  7. Yang, Z.; Yang, F. Effects of non-agricultural landscape on forest fragmentation. J. Cent. South Univ. For. Technol. 2012, 32, 94–97. [Google Scholar]
  8. Li, Y.H.; Westlund, H.; Liu, Y.S. Why some rural areas decline while some others not: An overview of rural evolution in the world. J. Rural. Stud. 2019, 68, 135–143. [Google Scholar] [CrossRef]
  9. Zhou, Y.; Li, Y.; Xu, C. Land consolidation and rural revitalization in China: Mechanisms and paths. Land Use Policy 2020, 91, 104379. [Google Scholar] [CrossRef]
  10. Yang, Y.Y.; Bao, W.K.; Liu, Y.S. Coupling coordination analysis of rural production-living-ecological space in the Beijing-Tianjin-Hebei region. Ecol. Indic. 2020, 117, 106512. [Google Scholar] [CrossRef]
  11. Lin, G.; Jiang, D.; Fu, J.; Zhao, Y. A Review on the Overall Optimization of Production-Living-Ecological Space: Theoretical Basis and Conceptual Framework. Land 2022, 11, 345. [Google Scholar] [CrossRef]
  12. Jiang, X.T.; Zhai, S.Y.; Liu, H.; Chen, J.; Zhu, Y.Y.; Wang, Z. Multi-scenario simulation of production-living-ecological space and ecological effects based on shared socioeconomic pathways in Zhengzhou, China. Ecol. Indic. 2022, 137, 108750. [Google Scholar] [CrossRef]
  13. Lennon, B. What next for sustainable development? Our Common Future at Thirty. Eurasian Geogr. Econ. 2019, 61, 338–340. [Google Scholar] [CrossRef]
  14. Jinchuan, H.; Haoxi, L.I.N.; Xiaoxiao, Q.I. Research progress of production-living-ecological space for territorial space optimization. Prog. Geogr. 2017, 36, 378–391. [Google Scholar] [CrossRef] [Green Version]
  15. Yin, Z.Y.; Liu, Y.; Pan, Y.C. Evaluation and Classification of Rural Multifunction at a Grid Scale: A Case Study of Miyun District, Beijing. Sustainability 2021, 13, 6362. [Google Scholar] [CrossRef]
  16. Shi, N. Taiwan’s “production-living-ecological” agriculture. Agric. Explor. Taiwan 1996, 4, 3–6. [Google Scholar]
  17. Mollison, B. Introduction to Permaculture; Jiangsu University Press: Zhenjiang, China, 2014. [Google Scholar]
  18. Sarapatka, B.; Sterba, O. Optimization of agriculture in relation to the multifunctional role of the landscape. Landsc. Urban Plan. 1998, 41, 145–148. [Google Scholar] [CrossRef]
  19. Gilman, R.; Gilman, D. Eco-Villages and Sustainable Communities: A Report for Gaia Trust by Context Institute; Context Institute: Langley, WA, USA, 1991. [Google Scholar]
  20. Kates, R.W.; Clark, W.C. Sustainability Science. Science 2001, 292, 641–642. [Google Scholar] [CrossRef]
  21. Mander, Ü.; Wiggering, H.; Helming, K.e. Multifunctional Land Use: Meeting Future Demands for Landscape Goods and Services; Springer: Berlin/Heidelberg, Germany, 2007; pp. 369–385. [Google Scholar]
  22. Willemen, L.; Hein, L.; van Mensvoort, M.E.F.; Verburg, P.H. Space for people, plants, and livestock? Quantifying interactions among multiple landscape functions in a Dutch rural region. Ecol. Indic. 2010, 10, 62–73. [Google Scholar] [CrossRef]
  23. Long, H. Land consolidation: An indispensable way of spatial restructuring in rural China. J. Geogr. Sci. 2014, 24, 211–225. [Google Scholar] [CrossRef]
  24. Chen, H.J.; Yang, Q.Y.; Su, K.C.; Zhang, H.Z.; Lu, D.; Xiang, H.; Zhou, L.L. Identification and Optimization of Production-Living-Ecological Space in an Ecological Foundation Area in the Upper Reaches of the Yangtze River: A Case Study of Jiangjin District of Chongqing, China. Land 2021, 10, 836. [Google Scholar] [CrossRef]
  25. Duan, Y.M.; Wang, H.; Huang, A.; Xu, Y.Q.; Lu, L.H.; Ji, Z.X. Identification and spatial-temporal evolution of rural “production-living-ecological” space from the perspective of villagers’ behavior-A case study of Ertai Town, Zhangjiakou City. Land Use Policy 2021, 106, 105457. [Google Scholar] [CrossRef]
  26. Kong, L.Y.; Xu, X.D.; Wang, W.; Wu, J.X.; Zhang, M.Y. Comprehensive Evaluation and Quantitative Research on the Living Protection of Traditional Villages from the Perspective of “Production-Living-Ecology”. Land 2021, 10, 570. [Google Scholar] [CrossRef]
  27. Yu, S.H.; Deng, W.; Xu, Y.X.; Zhang, X.; Xiang, H.L. Evaluation of the production-living-ecology space function suitability of Pingshan County in the Taihang mountainous area, China. J. Mt. Sci. 2020, 17, 2562–2576. [Google Scholar] [CrossRef]
  28. Lyu, Y.F.; Wang, M.J.; Zou, Y.N.; Wu, C.F. Mapping trade-offs among urban fringe land use functions to accurately support spatial planning. Sci. Total Environ. 2022, 802, 149915. [Google Scholar] [CrossRef]
  29. Zou, L.L.; Liu, Y.S.; Wang, J.Y.; Yang, Y.Y. An analysis of land use conflict potentials based on ecological-production-living function in the southeast coastal area of China. Ecol. Indic. 2021, 122, 107297. [Google Scholar] [CrossRef]
  30. Wu, Z.Y.; Shan, J.J. A Study on the Evolution and Optimization of Production Ecological Living Space Structure in Chinese Cities. Chin. J. Urban Environ. Stud. 2019, 7, 1950018. [Google Scholar] [CrossRef]
  31. Yang, Y.Y.; Bao, W.K.; Li, Y.H.; Wang, Y.S.; Chen, Z.F. Land Use Transition and Its Eco-Environmental Effects in the Beijing-Tianjin-Hebei Urban Agglomeration: A Production-Living-Ecological Perspective. Land 2020, 9, 285. [Google Scholar] [CrossRef]
  32. Zhang, L.; Zhao, Y.N.; Zhang, X.L.; Du, H.R. Effect Mechanisms of Peasant Relocation Decision-making Behaviours in the Process of Rural Spatial Restructuring: The case of Hotan region, China. Sustain. Cities Soc. 2020, 63, 102429. [Google Scholar] [CrossRef]
  33. Li, X.; Lv, X.; Yin, R.M.; Fang, B.; Jin, T. Spatial Equilibrium State and Its Time Evolution of the Multi-functionalization of Regional Land Use in the Eastern China. Pol. J. Environ. Stud. 2021, 30, 2827–2841. [Google Scholar] [CrossRef]
  34. Liao, T.; Li, D.; Wan, Q. Tradeoff of Exploitation-protection and Suitability Evaluation of Low-slope hilly from the perspective of "production-living-ecological" optimization. Phys. Chem. Earth 2020, 120, 102943. [Google Scholar] [CrossRef]
  35. Wang, D.; Jiang, D.; Fu, J.Y.; Lin, G.; Zhang, J.L. Comprehensive Assessment of Production-Living-Ecological Space Based on the Coupling Coordination Degree Model. Sustainability 2020, 12, 9. [Google Scholar] [CrossRef] [Green Version]
  36. Zhang, X.S.; Xu, Z.J. Functional Coupling Degree and Human Activity Intensity of Production-Living-Ecological Space in Underdeveloped Regions in China: Case Study of Guizhou Province. Land 2021, 10, 56. [Google Scholar] [CrossRef]
  37. Wang, C.; Tang, N. Spatio-temporal characteristics and pattern evolution of rural production-living-ecological spatial function coupling coordination in Chongqing. Geogr. Res. 2018, 36, 1100–1114. [Google Scholar] [CrossRef]
  38. Fu, X.X.; Wang, X.F.; Zhou, J.T.; Ma, J.H. Optimizing the Production-Living-Ecological Space for Reducing the Ecosystem Services Deficit. Land 2021, 10, 1001. [Google Scholar] [CrossRef]
  39. Liu, C.; Xu, Y.Q.; Lu, X.H.; Han, J. Trade-offs and driving forces of land use functions in ecologically fragile areas of northern Hebei Province: Spatiotemporal analysis. Land Use Policy 2021, 104, 105387. [Google Scholar] [CrossRef]
  40. Liu, C.; Xu, Y.Q.; Huang, A.; Li, Y.X.; Wang, H.; Lu, L.H.; Sun, P.L.; Zheng, W. Spatial identification of land use multifunctionality at grid scale in farming-pastoral area: A case study of Zhangjiakou City, China. Habitat Int. 2018, 76, 48–61. [Google Scholar] [CrossRef]
  41. Wiggering, H.; Dalchow, C.; Glemnitz, M.; Helming, K.; Muller, K.; Schultz, A.; Stachow, U.; Zander, P. Indicators for multifunctional land use-Linking socio-economic requirements with landscape potentials. Ecol. Indic. 2006, 6, 238–249. [Google Scholar] [CrossRef]
  42. Bagstad, K.J.; Villa, F.; Batker, D.; Harrison-Cox, J.; Voigt, B.; Johnson, G.W. From theoretical to actual ecosystem services: Mapping beneficiaries and spatial flows in ecosystem service assessments. Ecol. Soc. 2014, 19, 64. [Google Scholar] [CrossRef] [Green Version]
  43. de Groot, R. Function-analysis and valuation as a tool to assess land use conflicts in planning for sustainable, multi-functional landscapes. Landsc. Urban Plan. 2006, 75, 175–186. [Google Scholar] [CrossRef]
  44. Jiang, W. Ecosystem services research in China: A critical review. Ecosyst. Serv. 2017, 26, 10–16. [Google Scholar] [CrossRef]
  45. Yang, M.H.; Xie, Y. Spatial Pattern Change and Ecosystem Service Value Dynamics of Ecological and Non-Ecological Redline Areas in Nanjing, China. Int. J. Environ. Res. Public Health 2021, 18, 4224. [Google Scholar] [CrossRef] [PubMed]
  46. Zheng, J.; Na, L.S.; Liu, B.L.; Zhang, T.T.; Wang, H. An Ecological Service System Based Study on Suburban Rural Landscape Multifunction. Land 2021, 10, 232. [Google Scholar] [CrossRef]
  47. Statistical Yearbook of Jiangning; Jiangning Yearbook Compilation Committee: Nanjing, China, 2020; Volume 3, ISBN 978-7-214-25498-6. [CrossRef]
  48. Gao, Y.; Mas, J.F.; Kerle, N.; Pacheco, J.A.N. Optimal region growing segmentation and its effect on classification accuracy. Int. J. Remote Sens. 2011, 32, 3747–3763. [Google Scholar] [CrossRef]
  49. Costanza, R.; dArge, R.; deGroot, R.; Farber, S.; Grasso, M.; Hannon, B.; Limburg, K.; Naeem, S.; Oneill, R.V.; Paruelo, J.; et al. The value of the world’s ecosystem services and natural capital. Nature 1997, 387, 253–260. [Google Scholar] [CrossRef]
  50. Xie, G.; Zhen, L.; Lu, C.; Xiao, Y.; Cheng, C. An expert knowledge-based approach to ecosystem service valuation. J. Nat. Resour. 2008, 23, 911–917. [Google Scholar]
  51. He, T.Q.; Qiao, W.F.; Jia, K.Y.; Chai, Y.B.; Hu, Y.; Sun, P.; Wang, Y.H.; Feng, T. Selecting Rural Development Paths Based on Village Multifunction: A Case of Jingjiang City, China. Complexity 2020, 2020, 7590942. [Google Scholar] [CrossRef]
  52. Barbosa, O.; Tratalos, J.A.; Armsworth, P.R.; Davies, R.G.; Fuller, R.A.; Johnson, P.; Gaston, K.J. Who benefits from access to green space? A case study from Sheffield, UK. Landsc. Urban Plan. 2007, 83, 187–195. [Google Scholar] [CrossRef]
  53. Munroe, D.K.; Croissant, C.; York, A.M. Land use policy and landscape fragmentation in an urbanizing region: Assessing the impact of zoning. Appl. Geogr. 2005, 25, 121–141. [Google Scholar] [CrossRef]
  54. Vallet, A.; Locatelli, B.; Levrel, H.; Wunder, S.; Seppelt, R.; Scholes, R.J.; Oszwald, J. Relationships Between Ecosystem Services: Comparing Methods for Assessing Tradeoffs and Synergies. Ecol. Econ. 2018, 150, 96–106. [Google Scholar] [CrossRef]
  55. Anselin, L. Quantile local spatial autocorrelation. Lett. Spat. Resour. Sci. 2019, 12, 155–166. [Google Scholar] [CrossRef]
  56. Getis, A.; Ord, J.K. The analysis of spatial association by use of distance statistics (vol 23, pg 189, 1991). Geogr. Anal. 1993, 25, 276. [Google Scholar]
  57. Xi, J. Xi Jinping: The Governance of China; Foreign Languages Press: Beijing, China, 2014. [Google Scholar]
  58. Bircol, G.A.C.; Souza, M.P.d.; Fontes, A.T.; Chiarello, A.G.; Ranieri, V.E.L. Planning by the rules: A fair chance for the environment in a land-use conflict area. Land Use Policy 2018, 76, 103–112. [Google Scholar] [CrossRef]
  59. Fu, J.C.; Zhang, S.L. Functional Assessment and Coordination Characteristics of Production, Living, Ecological Function-A Case Study of Henan Province, China. Int. J. Environ. Res. Public Health 2021, 18, 8051. [Google Scholar] [CrossRef] [PubMed]
  60. Nelson, E.; Mendoza, G.; Regetz, J.; Polasky, S.; Tallis, H.; Cameron, D.; Chan, K.M.A.; Daily, G.C.; Goldstein, J.; Kareiva, P.M.; et al. Modeling multiple ecosystem services, biodiversity conservation, commodity production, and tradeoffs at landscape scales. Front. Ecol. Environ. 2009, 7, 4–11. [Google Scholar] [CrossRef]
  61. Dramstad, W.E.; Tveit, M.S.; Fjellstad, W.J.; Fry, G.L.A. Relationships between visual landscape preferences and map-based indicators of landscape structure. Landsc. Urban Plan. 2006, 78, 465–474. [Google Scholar] [CrossRef]
Figure 1. The geographical location and administrative division of Guli Street.
Land 11 01103 g001
Figure 2. Land-use classification of Guli Street in Nanjing city.
Land 11 01103 g002
Figure 3. Research framework. (Pink represents the relationship between the three functions of the PLE, and lavender represents the relationship between the two functions of the PLE).
Land 11 01103 g003
Figure 4. Subfunction distribution patterns of PLE. (A) Cultivated land production (CLP); (B) Food production (FP); (C) Raw material production (RMP); (D) Agricultural land quality (ALQ); (E) Habitat quality (HQ); (F) Landscape maintenance (LM); (G) Support services (SS); (H) Regulating services (RS); (I) Population density (PD); (J) Comprehensive location (CL); (K) Landscape aesthetics (LA); (L) Social public services (SPS).
Land 11 01103 g004aLand 11 01103 g004b
Figure 5. Spearman correlation analysis of subfunctions of PLE.
Land 11 01103 g005
Figure 6. Distribution patterns of the PLE functions. (A) Production function; (B) Living function; (C) Ecological function.
Land 11 01103 g006
Figure 7. Function autocorrelations of PLE spaces. (A) Production & Living functions; (B) Production & Ecological functions; (C) Living & Ecological functions.
Land 11 01103 g007
Figure 8. Comprehensive evaluation of PLE functions.
Land 11 01103 g008
Figure 9. Identification of cold/hot spots of PLE functions.
Land 11 01103 g009
Figure 10. Identification of potential areas of PLE synergies and identification of village-specific areas.
Land 11 01103 g010
Table 1. Data sources and categories.
Data DescriptionData SourcesFormat
Chinese administrative boundary data (2015)Resource and Environment Science and Data Center, Chinese Academy of Sciences (http://www.resdc.cn, accessed on 22 March 2022)Vector
Effective soil layer thickness (90 m) (2010–2018), soil pH (90 m) (2010–2018)National Earth System Science Data Center (http://soil.geodata.cn, accessed on 22 March 2022)Raster
Surface sand/clay/silt particles (1 km) (1995), soil organic matter (250 m) (1990), soil erosion (1 km) (1995)Resource and Environment Science and Data Center, Chinese Academy of Sciences (http://www.resdc.cn, accessed on 22 March 2022)Raster
Cultivated land production (1 km) (2010)Resource and Environment Science and Data Center, Chinese Academy of Sciences (http://www.resdc.cn/DOI, accessed on 22 March 2022), 2017. (DOI:10.12078/2017122301)Raster
Digital elevation model (DEM) (12.5 m) (2011)ALOS (Advanced Land Observing Satellite) https://search.asf.alaska.edu/#, accessed on 31 July 2021Raster
GF-2 remote sensing image data (3.2 m) (12 October 2020)The National Key Research and Development Program of China (No. 2019YFD1100405)Raster
Table 2. Value-equivalent of ecosystem services per unit area in China (2007).
Level I TypeLevel II TypeForest LandGrasslandCultivated LandWetlandWatersUnused Land
Provision servicesFood production0.330.431.00 10.360.530.02
Raw material production2.980.360.390.240.350.04
Regulating servicesGas regulation4.321.500.722.410.510.06
Climate regulation4.071.560.9713.552.060.13
Hydrological regulation4.091.520.7713.4418.770.07
Waste disposal1.721.321.3914.4014.850.26
Support servicesSoil conservation4.022.241.471.990.410.17
Maintaining biodiversity4.511.871.023.693.430.40
Culture functionProvision of aesthetics2.080.870.174.694.440.24
1 The ecological service value equivalent of cultivated land food production was set as 1, the value (utility) of other ecological services provided by the ecosystem relative to the annual welfare of cultivated land food production. According to Costanza’s study, the economic value of one ecological service equivalent factor is USD 54 hm−2.
Table 3. Function types, subindicators, subindex classification, indicator description, and weights of the PLE evaluation.
Function TypesSubindicatorsSubindex ClassificationIndicator DescriptionWeights
Production Function Index (PFI)Cultivated land production (CLP)Grain productionGrain output per unit area (kg/ha)0.5982
Food production (FP) (except cultivated land)Food production (woodland)Food available from the total primary production of woodland including animal and plant products0.1611
Food production (grassland)Food available from the total primary production of grassland including animal and plant products
Food production (wetland)Food available from the total primary production of wetland including animal and plant products
Food production (water)Food available from the total primary production of water including animal and plant products
Food production (unused land)Food available from the total primary production of unused land including animal and plant products
Raw material production (RMP)Raw material production (woodland)Raw materials extracted from primary woodland production, used as building materials, etc.0.1611
Raw material production (grassland)Raw materials extracted from primary grassland production
Raw material production (cultivated land)Raw materials extracted from primary cultivated land production
Raw material production (wetland)Raw materials extracted from primary wetland production
Raw material production (water)Raw materials extracted from primary water production
Raw material production (unused land)Raw materials extracted from primary unused land production
Agricultural land quality (ALQ)Surface soil textureComprehensive grading and evaluation of agricultural land quality0.0796
Effective soil thicknessThe thickness of the soil (cm)
Soil organic matterThe content of organic matter
Soil pHSoil pH: scale factor of 100
Soil erosionSoil erosion thickness per unit period, unit: mm per year (mm/a)
Topographic slopeThe slope of the surface topography
Irrigation distanceThe Euclidean distance from water
Living Function Index (LFI)Landscape aesthetics (LA)Cultural services (woodland)The ability of woodland to provide aesthetic appreciation0.1036
Cultural services (grassland)The ability of grassland to provide aesthetic appreciation
Cultural services (cultivated land)The ability of the cultivated land to provide aesthetic appreciation
Cultural services (wetland)The ability of the wetland to provide aesthetic appreciation
Cultural services (water)The ability of the water to provide aesthetic appreciation
Cultural services (unused land)The ability of the unused land to provide aesthetic appreciation
Population density (PD)The village populationThe number of people in a village district0.4393
Comprehensive location (CL)Distance from residential areaEuclidean distance from the residential area (buffer distance of 300 m)0.3107
Distance from transportation (county road)Euclidean distance from county-level transport land (buffer distance of 1000 m)
Distance from transportation (village road)Euclidean distance from village-level transport land (buffer distance 500 m)
Distance from water Euclidean distance from the water land (buffer distance of 300 m)
Social public services (SPS)Public serviceCoverage of public services (buffer distance of 300 m)0.1464
Industrial and mining landCoverage of industrial and mining land (buffer distance of 300 m)
Ecological Function Index (EFI)Regulating services (RS)Gas regulationEcosystems maintain a balance of atmospheric chemistry0.2707
Climate regulationRegulation of regional climates such as increasing precipitation and lowering temperature
Hydrological regulationFreshwater filtration, retention, and storage functions of ecosystems and freshwater supply
Waste disposalThe role of vegetation and organisms in the removal and decomposition of excess nutrients and compounds
Support services (SS)Maintaining biodiversityOrigin and evolution of wild plant and animal genes and wild plant and animal habitats0.4182
Soil conservationOrganic matter accumulation and the role of vegetation root matter and organisms in soil conservation
Landscape maintenance (LM)Aggregation index (AI)The probability of the adjacent appearance of different patch types in the landscape pattern0.1205
Mean patch size (MPS)Mean patch size in the landscape pattern
Largest patch index (LPI)A landscape pattern measures what percentage of the landscape area consists of the largest patches of that patch type
Contagion index (CONTAG)Aggregation trend of patch types in the spatial distribution of the landscape pattern
Habitat quality (HQ)Habitat quality Combined with land cover and biodiversity threat factors0.1906
Habitat scarcityDegree of vegetation type degradation
Table 4. Classification evaluation of PLE functions and division of synergistic potential areas of PLE functions.
Category IDProduction Functional IntensityLiving Functional IntensityEcological Function IntensityClassification DescriptionPLE Synergistic Potential Areas
11LLLThe PLE functions have the same intensity.Triple-function high synergistic zone (TF-H-Z)
22MMMTriple-function medium synergistic zone (TF-M-Z)
33HHHTriple-function low synergistic zone (TF-L-Z)
4 14MLLIn PLE functions, there are two PLE functional levels that are low, one PLE functional level that is medium; or two of the PLE functional levels are medium, and one of the PLE functional levels is low.Dual-function high synergistic zone (DF-H-Z)
5LML
6LLM
7LMM
8MLM
9MML
5 210HMMIn the PLE functions, there are two PLE functional levels that are medium, and one PLE functional level is high; or two of the PLE functional levels are high, and one of the PLE functional levels is medium.Dual-function medium synergistic zone (DF-M-Z)
11MHM
12MMH
13MHH
14HMH
15HHM
6 316HLLIn the PLE functions, two of the PLE functional levels are low, and one of the PLE functional levels is high; or two of the PLE functional levels are high, and one of the PLE functional levels is low.Dual-function low synergistic zone (DF-L-Z)
17LHL
18LLH
19LHH
20HLH
21HHL
722HMLEach PEL function intensity is different.Single-function conflict zone (SF-C-Z)
23HLM
24MHL
25MLH
26LHM
27LMH
1 Only the functional strength of M and L, and the combination of M and L, represent a high degree of synergy due to the small difference between the two strengths. 2 Only M and H have functional strengths. The combination of M and H has a greater difference between the two strengths than M and L, so it represents the moderate synergy degree. 3 Only H and L are functional intensities, and the combination of H and L represents low synergy because the difference between the two intensities is greater than that of M and H.
Table 5. Proportion of the autocorrelation indexes of PLE functions at village-level administrative areas; unit: percentage.
Spatial AutocorrelationLiving and EcologyProduction and EcologyProduction and Living
Local Moran’s IH-HL-LL-HH-LH-HL-LL-HH-LH-HL-LL-HH-L
(1) Zhoucun8.047.469.2221.0112.639.74.3718.1736.992.116.5312.59
(2) Jingliu5.027.254.3825.627.0815.590.7212.7717.111.614.716.3
(3) Jiantang13.5511.3216.373.1121.448.479.487.080.7410.912.0616.47
(4) Shiba0.946.491.653.310.885.142.745.150.112.554.347.1
(5) Xiangyang2.8613.533.7418.353.6216.263.8113.260.003.1615.674.15
(6) Baishu7.2617.382.652.980.7410.425.7113.431.235.594.862.86
(7) Qinjian6.4110.364.000.010.982.458.4912.570.0010.070.007.56
(8) Guli12.5813.838.0822.826.8923.5810.549.3738.384.9252.996.67
(9) Shuangtang21.395.3917.710.7412.524.8723.930.590.1230.604.179.07
(10) Zhangxi7.246.076.811.968.213.255.056.675.015.284.478.08
(11) Gongtang14.710.9225.380.0825.000.2625.150.940.3123.200.2019.13
Publisher’s Note: MDPI stays neutral with regard to jurisdictional claims in published maps and institutional affiliations.

