2. Background
The concept of the digital divide was created to refer to the difference between people who access or do not access the Internet [
3] that is, to refer to the differences between different social groups according to the percentage with Internet access. Although the first studies of the digital divide focused on access, it began to be evident that access did not imply use [
4], so priority attention stemmed from access to use. Some authors who claimed to focus on use preferred the concept of digital inequalities [
5] to differentiate their approach from the previous one. This was applied to analyze the differences between different Internet users due to different uses.
Other authors preferred to continue using the term digital divide, but differentiating between a first access gap versus a second uses gap [
6,
7] and also digital skills and competencies [
4,
8]. The thesis of this line of studies is that inequalities have not been reduced with the increase in digitization, but have diversified as digital uses are increasingly present in daily life, benefiting more people with a better socioeconomic position [
9].
Our analysis is framed within the concept of the second digital divide or digital inequalities and argues the special digital vulnerability of seniors in two dimensions of digitization: uses and skills. A vulnerability that, according to this theoretical framework, would not only be digital but would also lead to social disadvantages and a more general social vulnerability. Following Spark’s thesis [
9,
10], digital exclusion-a very frequent phenomenon among seniors-could lead to social exclusion since more and more access to social resources occurs through Information and Communication Technologies (ICTs).
In accordance with this theoretical framework, we present below a bibliographic review aimed at seeing the variables and factors that influence the levels of digitization (in uses and skills) or the digital exclusion of Spanish seniors in particular and also in other countries.
There is extensive empirical evidence of the limited digitization of older people. The following are just a few examples: Friemel finds that while Internet use stands at 80–90% of the population in Western societies, those over 65 years of age achieve much lower levels of use [
6]. Other authors also find striking differences between the older persons’ digitization and the rest of the population [
11,
12]. In addition, older persons make up the greatest proportion of the information-weak classes [
13].
In Spanish society, we find that Internet access among older people is growing and at a faster rate than in society as a whole, albeit still at a very low level and far behind all other age groups [
9,
14].
Despite this overwhelming evidence, there are few studies that explore the position of this group and the causes and factors behind it [
15]. Studies on older persons by Spanish authors are also considered very limited [
16]. Moreover, there are practically no studies that address the role of socio-spatial variables in the low digitization of the senior population. In this aspect, the contribution of this work is original.
Most studies are restricted to describing the situation, presenting the group as disconnected or poorly connected, but do not look further at the causes, with the dominant shared stereotype being that older persons are not involved in technology [
17,
18].
Specifically in Spain, the scarcity and limitations of studies on the causes of the older people’s great digital inequality provide strong justification for this work. Previous studies conducted in Spain are small in number, partial, and limited, although they have pointed to the following causes, factors, and explanations [
19].
In 2012, a study tried to identify the technological resources, their use, and types of uses among seniors, although with an excessively small sample (n = 215) that did not allow the authors to find significant differences by gender or even by age, although it did find a difference by education level [
20]. It is the main reference of rural seniors and the main contribution from the geospatial perspective.
In 2015, Pino Juste and Rodríguez López [
16] conducted a survey on a small sample of fifty-two people who had taken courses for seniors, the results of which are not considered in this study due to the precariousness of the sample.
In 2016, there was a mixed methodology, qualitative and quantitative, study on rural seniors in the autonomous community of Castile and Leon, one of the most rural parts of Spain [
20]. This study showed the multi-exclusion of seniors, finding that it is not due to a single cause and highlighting that the highest exclusion rates are found in the smallest municipalities and among the oldest seniors, although there are other variables that also have an influence, such as the distance to provincial capitals or larger municipalities. It also found that the role played by the ‘support generation’ (the children of the seniors, who are more digitized) is key in the digitization level of seniors.
The main Spanish reference for understanding the causes of exclusion or lower digitization of seniors is from 2017 [
17]. The use of the Internet and its applications was studied on the basis of socio-demographic variables. This study found noticeable differences between seniors aged from 65 to 74 and those aged 75 and over, finding that younger seniors use the Internet much more and confirming the existence of seniors who are fully integrated into the use of the Internet. In this respect, the authors criticize the shared stereotype that seniors are cut off from technology and conclude that there is a need for a more detailed segmentation of the group in order to overcome the single uniform vision that studies have offered up to now. They also concluded that age is not sufficient to understand the group and point to other factors, such as psychological variables, that really explain the differences in the use of online banking and social networks.
Outside of Spain, other studies have contributed to the background on the digitization of seniors. One of the pioneering works is that of Wicks [
21], which established the differences between old and young seniors that other subsequent studies have also highlighted and that will also be examined here. The study suggested that access barriers are not the only problem and pointed to reluctance as another significant barrier observed among seniors.
Another study from 2016 conducted in Switzerland on a sample of 1105 seniors [
6] highlighted the influence of education, income, interest in technology, having worked with computers before retiring, and marital status. It also confirmed that gender-based differences disappear when controlling for the aforementioned variables.
Another noteworthy study is that conducted in the United Kingdom in 2018 [
15], which studied the ownership and use of smartphones. This study highlighted the importance of variables such as social influence, facilitation conditions, service expectations, effort, and enjoyment.
The argument that the lower use and acceptance of ICT among seniors is caused by a lack of interest and the absence of social pressure has also been highlighted as a reason why seniors have lower digitization [
11,
18,
22,
23]. The importance of a self-perception of low skills has also been highlighted [
23]. There are also less innovative [
24] and have less need to search for information. [
13,
25]. Geospatial variables have been little used to date in order to explain the low digitization of seniors. In the bibliography in English and Spanish, we have not detected any relevant studies.
Other studies on digitization that are not specific to this age group are also useful for determining the relevant variables, at least in the digitization levels of the general population. In Spain, it is worth highlighting a study from 2011 [
26] that verified, through a logistic regression model, the high explanatory capacity of education, age, and employment status. In contrast, gender and the characteristics of the geographical environment made minimal explanatory contributions. The study emphasized the explanatory capacity of social variables over geographic ones. The rural-urban dichotomy was also emphasized as an important variable in explaining the digital divide in another Spanish study [
27]. Outside of Spain, Warf [
28] found that Internet providers tend to provide less coverage in rural areas and highlighted the variable as one component of digital inequality, among others (age, education, income, gender, etc.). The contribution of this variable also appears in other studies [
6]. However, the studies by Hindman [
29] at the start of this century concluded that the differences between metropolitan and non-metropolitan areas were small and more limited than those for variables such as income, age, and education, which these authors demonstrated in Spain [
26].
The first studies on digitization at the end of the 20th century and the beginning of the 21st put the emphasis on the great geographical inequalities that were fundamentally appreciated between countries [
30]. The economistic interpretation prevailed in the explanation of the differences in infrastructure and access devices, so that digitization was largely explained by the level of territorial development [
9,
26,
31]. In the early days, what was mediated was access to the Internet and these differences in access were reduced as the use of the Internet expanded, but big inequalities linked to the quality and modes of access available to users continued to be evident [
9].
Since the first decade of the 21st century, the perspective of analysis has been changing towards a second level of the digital gap, beyond the access gap, in which it was important to examine the levels of competence and forms of use [
9]. This change in perspective was associated with a lesser role in the analyzes of geographical aspects and a greater interest in other relevant variables of the social structure, such as age, sex, studies, or family income. Underlying the theoretical approach is that inequalities in the social structure determine digital inequalities. Digital inequality is considered to reproduce the old classical inequalities in the digital society [
32].
Among the various authors who highlight this new overview, Dimaggio stands out [
4,
26]. He criticized the perspective of geographic politics and the “connected/non-connected” dichotomization that prevailed until then. Dimaggio argued that the expansion of the Internet among the population, as well as its services and infrastructures, did not guarantee the reduction of the digital gap, demonstrating that in those territories in which there was universal access to the Internet, important inequalities persisted. This causes academic interest to shift from having or not having access to the differences in digital uses and skills. From the new perspective, the explanatory interest of social variables increases compared to geographic ones, evidencing the great influence of variables such as race, gender, education, age, etc.
However, although in terms of Internet access, the geographical and spatial differences have decreased a lot with the expansion of the Internet, this has also decreased a lot in other social variables. And yet, although great differences are also appreciated in the uses and competencies in social variables, important geographical differences continue to be appreciated (in competencies and uses) also in the geographical variables. On the one hand, this is due to the theoretical interest having shifted from the geographical to the social. On the other hand, causal analyzes in surveys of digital uses are giving a more secondary role to geographical variables than to social ones.
If the causal studies indicate (despite the importance of these differences) a lower explanatory capacity of the socio-spatial variables compared to other social variables, it could be due to inequalities in the social structure are not only determining digital inequalities, but also the special segregation of the population, further contributing to the digital exclusion of the seniors. This is our main hypothesis, and it will have to be examined by studying the interactions of social variables with geographical ones.
In accordance with this bibliography and also considering the possibilities and limitations of the available data source, we have selected the variables or factors that are worth exploring in our research to look in more detail at the reasons behind the lower digitization of seniors in Spain:
Age. The importance of this variable is sufficiently demonstrated in the specialized literature [
5,
9,
11,
12,
14,
24,
33], etc. This is the first variable to consider since, as we have seen, significant differences between older people and younger age groups have been identified. Differences have also been found between young and old seniors. There are two ways in which age can have an impact and cause lower digitization: one as a cohort effect and another as a life-cycle effect. In the first, it is explained by differences in the socialization and learning of the different generational groups. The second relates to physical limitations or adaptations to age-appropriate lifestyles. According to Friemel [
6], most authors tend to interpret the age effect as a temporal cohort effect. While the author confirmed this effect, he found that those over 85 years of age do not use the Internet due to vision and hearing limitations. The age variable is also correlated to other variables, such as education or income level, which can be reflected in differences between age groups if the intervening effects of these variables are not eliminated.
Education. The numerous studies of Spanish society demonstrate its great explanatory power, which is also seen in most previous studies [
9,
27,
33,
34].
Income. With regard to the household income variable, we find that this is one of the determining variables in Spain, along with age, education, and gender [
35].
Sex/Gender. There are many studies that address the gender digital divide. Although differences have been narrowing since the start of this century [
27], they still exist between men and women in terms of uses and skills [
7,
27]. As a counterpoint to the importance of the differences always found through bivariate analyzes, in which women have lower digitization, we find that multivariate causal approaches minimize or eliminate the explanatory importance of this variable, on being controlled for by others or by including independent variables with greater explanatory power in the models [
6,
19]. Alternatively, this can be largely explained as a reflection and reinforcement of educational inequalities [
7,
27].
Geospatial variables. There are also many bibliographical references to territorial or geospatial inequalities [
14,
29,
35]. In Spain, for example, big differences can be seen among autonomous regions, and also others not so great by the size of the municipality [
26]. These variables, however, have a lower explanatory power than such social variables as age, education, and income. This is true in both Spain and other developed countries [
29]. We have explored different variables: the size of the municipality, demographic density, and territorial division by province.
Other variables of explanatory interest that will not be considered due to the limitations of the source are the following: psychological, attitudes, the influence of the social environment, and socio-cultural variables. Given the limitations of the available source, we can only consider those mentioned above. These are variables relating to social structure commonly used in other studies analyzing the second digital divide or social inequalities [
16,
27], and which have served to confirm that the inequalities seen in the social structure prior to digitization also have an impact on it [
9,
33]. According to some authors, the risk of digital and social exclusion among the most disadvantaged groups, largely made up of seniors, increases as a greater diversity of activities and services move over to the digital world [
9,
10].
Employment occupation has often been considered as another explanatory variable, although we have not taken it into account because the vast majority of seniors are retired and in the available data there is no information on occupation before retirement.
The group of seniors is not only affected by inequality as an age group but is also affected by the confluence of inequalities that can be seen in the variables mentioned above and that constitute a multiple digital divide: older age, lower education level, lower income level, greater presence of women and rural inhabitants.
The digitization variables or dimensions still need to be explained and substantiated and this is what we will explore. We will focus on what has been called the second digital divide, or digital inequalities, placing less emphasis on Internet access, which has reached high levels of coverage, and instead focusing on two factors. First, the skills and competencies required in the digital world [
4,
8,
36]. Second, is what the Internet is used for [
6,
7,
36]. These are important aspects of the analysis of the so-called second digital divide or digital inequalities [
5]. More specifically, we will make operational the variables that define the concepts of digital skills and the intensity and diversity of uses.
Ageism, understood as negative age stereotypes and negative self-perceptions about aging [
37], would be another hypothetical factor to explain the lower digitization of seniors. There is evidence that the mechanisms of websites limit the participation of older people, which is explained by the homophily of corporate teams, mechanisms that deprioritize, neglect, or exclude older people [
38]. Also, the lack of awareness and understanding of the needs and difficulties of older people by web designers has been proven [
39]. But this negative prejudice not only stems from younger people but also from seniors when they internalize their limitations and lack of aptitude, based on the dominant social perception [
37]. In this way, it is closely related to other previously mentioned limitations-psychological, attitudinal, or the influence of the sociocultural environment.
3. Materials and Methods
We analyzed the 2020 microdata file, from the Survey on Equipment and Use of Information and Communication Technologies in Households, conducting an original statistical study of this data (Survey of the Spanish Statistical Office (INE) and coordinated at the European level with Eurostat). The fieldwork was conducted between 2 March and 15 September, concentrated in recent months due to the lockdowns resulting from the pandemic during the months of March to June. This survey partially reflects the progress in digitization that took place in Spain following the lockdowns during the COVID-19 pandemic, and also partially reflects the progress in public policies to support the digitization of rural areas. It is a self-weighted sample of 15,343 cases for the total population and 5247 for those over 65 years of age (older people population). These sample sizes allow segmentations to be made that are appropriate to the research objectives (The random error limit for all older people is +/− 1.38% for p = q = 50% at a confidence level of the order of two-sigma).
The older people population has been identified as those aged sixty-five and over, an age very close to the real retirement age in Spain and after which the proportion of employed people becomes insignificant.
In order to empirically make the two proposed digitization dimensions operational (uses and skills), the following procedure was performed: to obtain a digital skills variable, the INE methodology was followed, approved by Eurostat, based on four levels among those who have used the Internet with a frequency equal to or greater than the last three months: No skills, Low, Basic and Advanced. In addition to preparing the indicator following the indications from the INE, we have added the ‘cannot be assessed’ category due to the importance of including all those who do not use the Internet or do so less frequently than in the last three months in order to detect digital exclusion. The result is a variable with five categories coded from 0 to 4, in ascending order of skills. For further information please consult Annex 4 in the study methodology in:
https://www.ine.es/metodologia/t25/t25304506620.pdf Also can be seen:
https://digital-strategy.ec.europa.eu/en/library/new-comprehensive-digital-skills-indicator (accessed on 7 June 2022).
In order to obtain a digital uses variable, which allows us to calibrate both: The frequency of use and the variety of types of digital uses (aspects highly correlated with each other), an index was created through a factor analysis of principal components, forcing the extraction of a single factor, because we wanted to create a single index of variety and intensity of uses. This was applied to a representative set of twenty-one items available in the questionnaire recoded for the analysis with: code 1 for mentions and 0 for no-mentions and non-responses (non-responses were very scarce and attributable to non-use). The result was a standardized variable with a mean of 0 and standard deviation of 1, with negative values for values below the mean for the Spanish population as a whole and positive values for values above this mean. The index obtained was reviewed and validated with excellent results, through the analysis of Cronbach’s Alpha statistic (which measures the consistency of the index based on the degree of correlation between the items), finding a value for the final selection of items of A = 0.943 (very high consistency). The goodness of fit for the factor in the principal component analysis was very high: Kaiser Meyer Olkin (KMO) = 0.962 (Excellent). For some tabulations, the factor scores were grouped into quintiles, taking the total sample as a reference for obtaining the quintiles. In this way, each quintile in the sub-sample of seniors obtained a similar skills level to the total sample.
In order to identify the influence of the explanatory variables on the two digitization dimensions (uses and skills), we prepared causal models through a path analysis (using AMOS, software for modeling through structural equations, in the statistical package for social sciences SPSS). A model was prepared to explain uses and another to explain skills, both of these being dependent variables in each model. Moreover, to better understand the specifics of the older people population, for each explained variable, the results of the models for the senior population were compared to the total population. The explanatory variables in all the models were the same, although their parameters logically varied. These were: age, education, income, rural, and gender. Parameters and covariances were estimated using the maximum likelihood method, adjusting the saturated and independence model. In all the models, we obtained an optimum fit of the data to the modeling proposed (Chi-Square = 0) in all the models presented.
The choice of modeling method reflects the interest in identifying the effects of all the variables that identify the coming together of various digital inequalities in the seniors’ group while considering collinearity between the explanatory variables, which is sometimes very strong. Path analysis fits this situation well, and estimation by the maximum likelihood method is reasonably robust when working with variables for which the criteria of univariate and multivariate normality are not met, without this significantly affecting the estimators.
The characteristics and transformations of the explanatory variables are explained below. There was no need for any processing of the age variable, a metric variable with no missing or unclassified cases. Education was recorded as follows: 0 = No education or incomplete primary education. 1 = Complete primary education. 1.5 = Not classifiable (there were only 36 in the total sample). This value was given after verifying, through a simple correspondence analysis, that they were between primary and secondary education). 2 = Secondary (first or second stage of secondary education and similar). 3 = Vocational Training (VT: VT1 and VT2). 4 = Higher Education (University). Income means net family income, divided into fourteen payments per year, which is common in Spain. Starting from the original intervals in the questionnaire, in order to transform the variable into a scale we have recalculated the means of each income interval, or an estimation by approximation of the highest and lowest (taking other national surveys in 2020 as a reference). Non-response for income, which is high, has been estimated through a simple correspondence analysis based on the distance with the closest intervals. The estimation is needed to run the models with the AMOS software because it does allow the introduction of variables with missing cases. The values for each interval were as follows: 800 = Less than €900. 1250 = From 900 to less than 1650. 1675 = Don’t know. 2050 = From 1600 to less than 2500. 2750 = From 2500 to less than 3000. 3300 = From €3000. The gender variable was recoded as follows: 1 = Men, 0 = Women. The rural variable was subject to various considerations before being made operational, considering the limitations of the survey. The use of the habitat size variable was ruled out because it grouped municipalities with fewer than 10,000 inhabitants into the lowest population interval. Instead, the demographic density variable was used, whose category ‘sparsely populated areas’ (or scattered) corresponds mainly to the smallest municipalities and has a much closer relationship with the digital divide, precisely because these are the areas with less Internet coverage (lower coverage of ADSL, fiber, and mobile telephony). It also corresponds better to the ‘rural’ concept of municipalities with fewer than 10,000 inhabitants (91.2% of these areas are located in municipalities with fewer than 10,000 inhabitants). Therefore, sparsely populated areas, which we will call ‘rural’ here, were coded with 1 and the rest with 0 (densely populated areas and intermediate areas).
As a complement to the causal analysis of survey data, a causal analysis of the territorial differences between provinces is also carried out, to determine to what extent the social variables explain the geographical differences. It is carried out from the perspective of aggregate data, considering as cases or records (52) each of the 50 provinces and the 2 autonomous cities (Ceuta and Melilla) and combining potentially explanatory variables of the differences in the data file and in other external sources, such as GPD, GPD per capita, and various Internet access indicators: Long Term Evolution (LTE) coverage for mobile phone data and fiber optic coverage Fiber To The Home (FHTT). The source of information for the economic data is the National Institute of Statistics (2020 data). The Source on Internet coverage infrastructures, a report from the Ministry of Economic Affairs and Digital Transformation, referring to 2020 [
40].
It has been decided to present the provincial perspective instead of the grouping in 17 autonomous communities because more differences are observed by provinces than by communities and the large size of the sample offers statistically significant results.
Once the effects of the different digital divides on older people had been identified, we performed a segmentation of the older people group and adapted it to differentiate between the various digitization levels. To do this, we used the relevant variables coming out from the previous analysis and the CHAID segmentation method (Chi-Square Automatic Interaction Detector). This technique allowed us to create a segmentation tree of the dependent variable (digitization), starting from a set of variables that will be segmented according to the interactions detected for the best description of the dependent variable.
Although this technique allows us to work with non-categorical variables, in order to simplify the solutions and seek a better fit, we first dichotomized the segmentation variables trying to dichotomize each variable with the most discriminating category or interval possible according to previous explorations: Age: from 65 to 75 years vs. 76 and over. (The age categories respond to two criteria: make better use of the possibilities of the sample and distinguish between younger and older seniors). Education: low vs. not low (low included no education, incomplete and primary education, the rest: not low). Income: Low vs. not low (low = less than €900, the rest were not low). The urban and gender variables were already dichotomous. For the recordings, the values of the digitization variables in each category have been used to achieve the most discriminating dichotomization possible.
As criteria for configuring the segmentation, based on the possibilities of the sample for n = 5247 older people, we have limited the segmentation to three branching levels and a minimum of 200 cases for each final node. The result was a classification of seniors into eight final segments. Two segmentations were performed, one for digital uses and another for digital skills. The resulting classification was exactly the same in each case.
4. Results
4.1. Differences between Seniors and the General Population
Although previous studies have identified differences between seniors and the general population [
4,
5,
6,
14,
15,
26,
28,
33,
34], we consider it important to make at least a brief reference to the differences identified using our information source. This is in the form of a summary and allows us to discuss these differences and introduce the main variables we are going to analyze. We have considered all variables for which previous studies have detected digital divides, with the sole exception of occupation, as the older people group is mostly retired. Shown below is a table that compares seniors to the rest of the population and the total population.
Table 1 shows the variables accounting for the main digital divides and the digitization dimensions studied here.
The data confirm that seniors have much lower education and income levels than the rest of the population and the population as a whole, with clearly higher percentages for women and inhabitants in rural areas. (Studies Chi-square: 4078, fd 5 p = 0.000. Income Chisquare: 706 df 5 p = 0.000).
We also confirm that their digital skills and digital uses are much lower than those of the rest of the population and the population as a whole. (Digital Uses Chi-square: 6533 df 4 p = 0.000. Digital Skills Chi-square: 6187 df 4 p = 0.000). These variables for the two digital dimensions presented here will be explained in the next section. With the data presented, we illustrate that the seniors profile includes the characteristic features of the various and most important digital divides.
4.2. Digitization Variables and Their Relationship with Digital Divides
Following the criteria set forth in
Section 2 Materials and methods, the two digitization dimensions we set out to study have been made operational: uses (intensity and variety of uses) and skills, creating two variables that can be examined empirically to establish a relationship with the variables causing the digital divide. Below (see
Table 2) is a table with the descriptive statistics for the resulting variables, in both the general population (as they were constructed with reference to the total sample) and the senior group. The digital skills variable is presented in both a standardized and non-standardized way (both ways have been used in the analyzes).
It can be seen that digital uses (a standardized variable from a factor analysis of twenty-one types of uses) have a mean of 0 and a standard deviation of 1 in the total population, whereas, in the seniors’ group, there is a much lower mean of −0.8773. This already indicates that seniors score much lower than the population as a whole in intensity and variety of digital uses. The result is very similar for digital skills if we consider the standardized version of the variable, whose zero mean in the population as a whole becomes a mean of −0.8624. The non-standardized digital skills variable adopts four scale values (from 0 to 4) according to the following categories: not applicable (does not use the Internet), none (no skills), low, basic, and advanced. While the average for the population is 2.3 (between low and basic), that of seniors is 1 (no skills on average for the group).
In order to cross-correlate the variables constituting the digital divides, the non-standardized scale of digital skills has been used, and, in addition, the digital uses variable has been recoded into five quintiles, taking the total sample as a reference. Shown below is a table of results (
Table 3) that compares seniors with the sample as a whole.
It can be seen that most seniors are concentrated in the lower digital uses intervals (74.9%) and that they completely lack digital skills (58.4%). However, there is a small minority who scored high in uses (2.3%, or 9.1% if we add together the high and medium-high scores) or profess advanced skills (4.7%). The differences between these figures and those for the entire sample are huge.
Shown below is a table listing all items that have been considered when preparing the digital uses variable. The results for the seniors’ group are shown, although it should be remembered that the variable was obtained for the entire sample. In addition to presenting the items and examining the mentions in the group, data cross-referenced by the regrouping of factor scores are presented, which will allow us to make some interesting observations.
The main uses have a minor presence within the group. These are: using instant messaging (39%), phoning or making video calls over the Internet (30%), reading the news online (29%), searching for information on goods and services (26%), or on health issues (25%). The average number of uses is 3.4, mainly those mentioned. However, the majority (54.9%) do not use the Internet and do not mention its uses. For this reason, the level of medium-low uses (second quintile in the sample as a whole) is higher than the average: 3.9. The intermediate level is 9.6 uses, the medium-high level is fourteen and the high level is 17.9 (out of a total of 21 uses). The table (
Table 4) shows the correspondence between the means of uses and the means of the factor scores, giving a less abstract idea of what the factor scores represent in terms of the diversity of uses. The results support the construct validity of the variable, in terms of diversity of uses. In terms of intensity, this is demonstrated by correlating it with the frequency of use of the Internet, which is r = 0.797 among seniors and r = 0.787 in the total sample.
Now that we have identified the digitization variables, we can study the relationships between these and the digital divides in the seniors group. We obtain a first approximation from the following cross tables (See
Table 5).
The table shows the correspondence between low levels of digital uses in the senior group and: low educational levels, older age, low income, rural residences, and female gender. And vice-versa, there is correspondence between high levels of digital uses and high education levels, lower age, high income, and non-rural residence. (Cramer’s V: 0.443 for age, 0.573 for studies, 0.463 for income, 0.128 for rural and 0.114 for sex. Always p = 0.000). All the variables examined show a close relationship with digital uses, particularly studies, income, and age.
Table 6 shows the correspondence between low levels of digital skills and: low educational levels, older age, low income, rural residences, and female gender. And vice-versa, there is correspondence between high levels of digital skills and high education levels, lower age, high income, and non-rural residence. (Cramer’s V: 0.443 for age, 0.590 for studies, 0.469 for income, 0.128 for rural and 0.161 for sex. Always
p = 0.000). All the variables examined show a close relationship with digital skills, particularly studies, income, and age, as it happens with digital uses.
The data examined confirmed that the five variables constituting digital divides clearly differentiate the digitization levels of the seniors group. We have also verified that in the sample examined (and in keeping with the existing literature), notable differences are seen in these variables if we compare seniors to the total sample. In the next section, we will analyze the explanatory weight or contribution of these five variables to the low digitization levels of seniors.
The spatial variables available in the questionnaire were the following: habitat size, demographic density, and territorial division by autonomous communities and provinces.
Table 7 presents data on the senior population according to habitat size and demographic density. Disaggregated data at the provincial level is also available in
Appendix B.
Digital uses and skills decrease as habitat size and population density decrease. The differences in these means are significant both in the senior population and in the general population according to the Kruskall-Wallis test (p < 0.001). With the same test, the differences in digital uses and skills are also significant when compared by province. By provinces, moreover, the differences are greater. This information is interesting because, as we will explain later in the causal analysis, the geographical variables do not stand out. If the relationship of geographic variables with digitalization is much stronger in a bivariate analysis than in a multivariate causal analysis, it could be due to the unequal spatial distribution of social variables, such as age, studies, or income. This is our hypothesis that we will prove later.
We have paid special attention to the rural-non-rural dichotomy, within the possibilities of the survey. The category of less than 10,000 inhabitants as an indicator for rural areas was ruled out. The ‘sparsely populated’ category of the demographic density variable was more consistent with the concept and more discriminating in the causal analysis, after verifying that these areas are far from urban centers and 93% belong to municipalities with fewer than 10,000 inhabitants. They are rural areas far from representative services of what is popularly called ‘España vaciada’ (empty Spain). So, the variable called ‘Rural’ responds to the dichotomy of living or not in these scattered areas.
4.3. The Explanatory Weight of Digital Divides
To identify the explanatory weight of the different digital divides, four explanatory models have been prepared using path analysis, allowing us to examine the interrelationships between the independent variables and the direct effects of the explanatory variables on the variable being explained. The explanatory models for each of the digitization dimensions, uses, and digital skills, are represented below. In turn, for each of the two dimensions, the results obtained for the population as a whole (16 and over) and for the senior population (65 and over) are compared. The comparison between seniors and the general population allows us to better understand the specific characteristics of seniors. The models present standardized estimates, which measure the strength of the relationships between variables. The direct effects of the explanatory variables on the dependent variable are standardized regression coefficients, whereas the relationships between the explanatory variables are covariances (to see the values of the estimates and statistical significances of the path analysis models, see
Appendix A).
A larger number of variables than those finally presented in the models have been explored. Those that were not significant have been eliminated, with the exception of the sex/gender variable, to which we pay special attention (
p > 0.05 for digital uses models, see
Appendix A). Habitat size was not significant after having incorporated the ‘rural-non-rural’ variable into the model, which is more discriminating and with which it is closely correlated (Spearman’s Rho = 0.657 for Senior Population). The close correlation between both variables explains why habitat size is not significant in the model when we include ‘rural-non-rural’. On the other hand, the territorial variables were not included in these models and were subject to a special treatment that is presented in the following
Section 4.4.
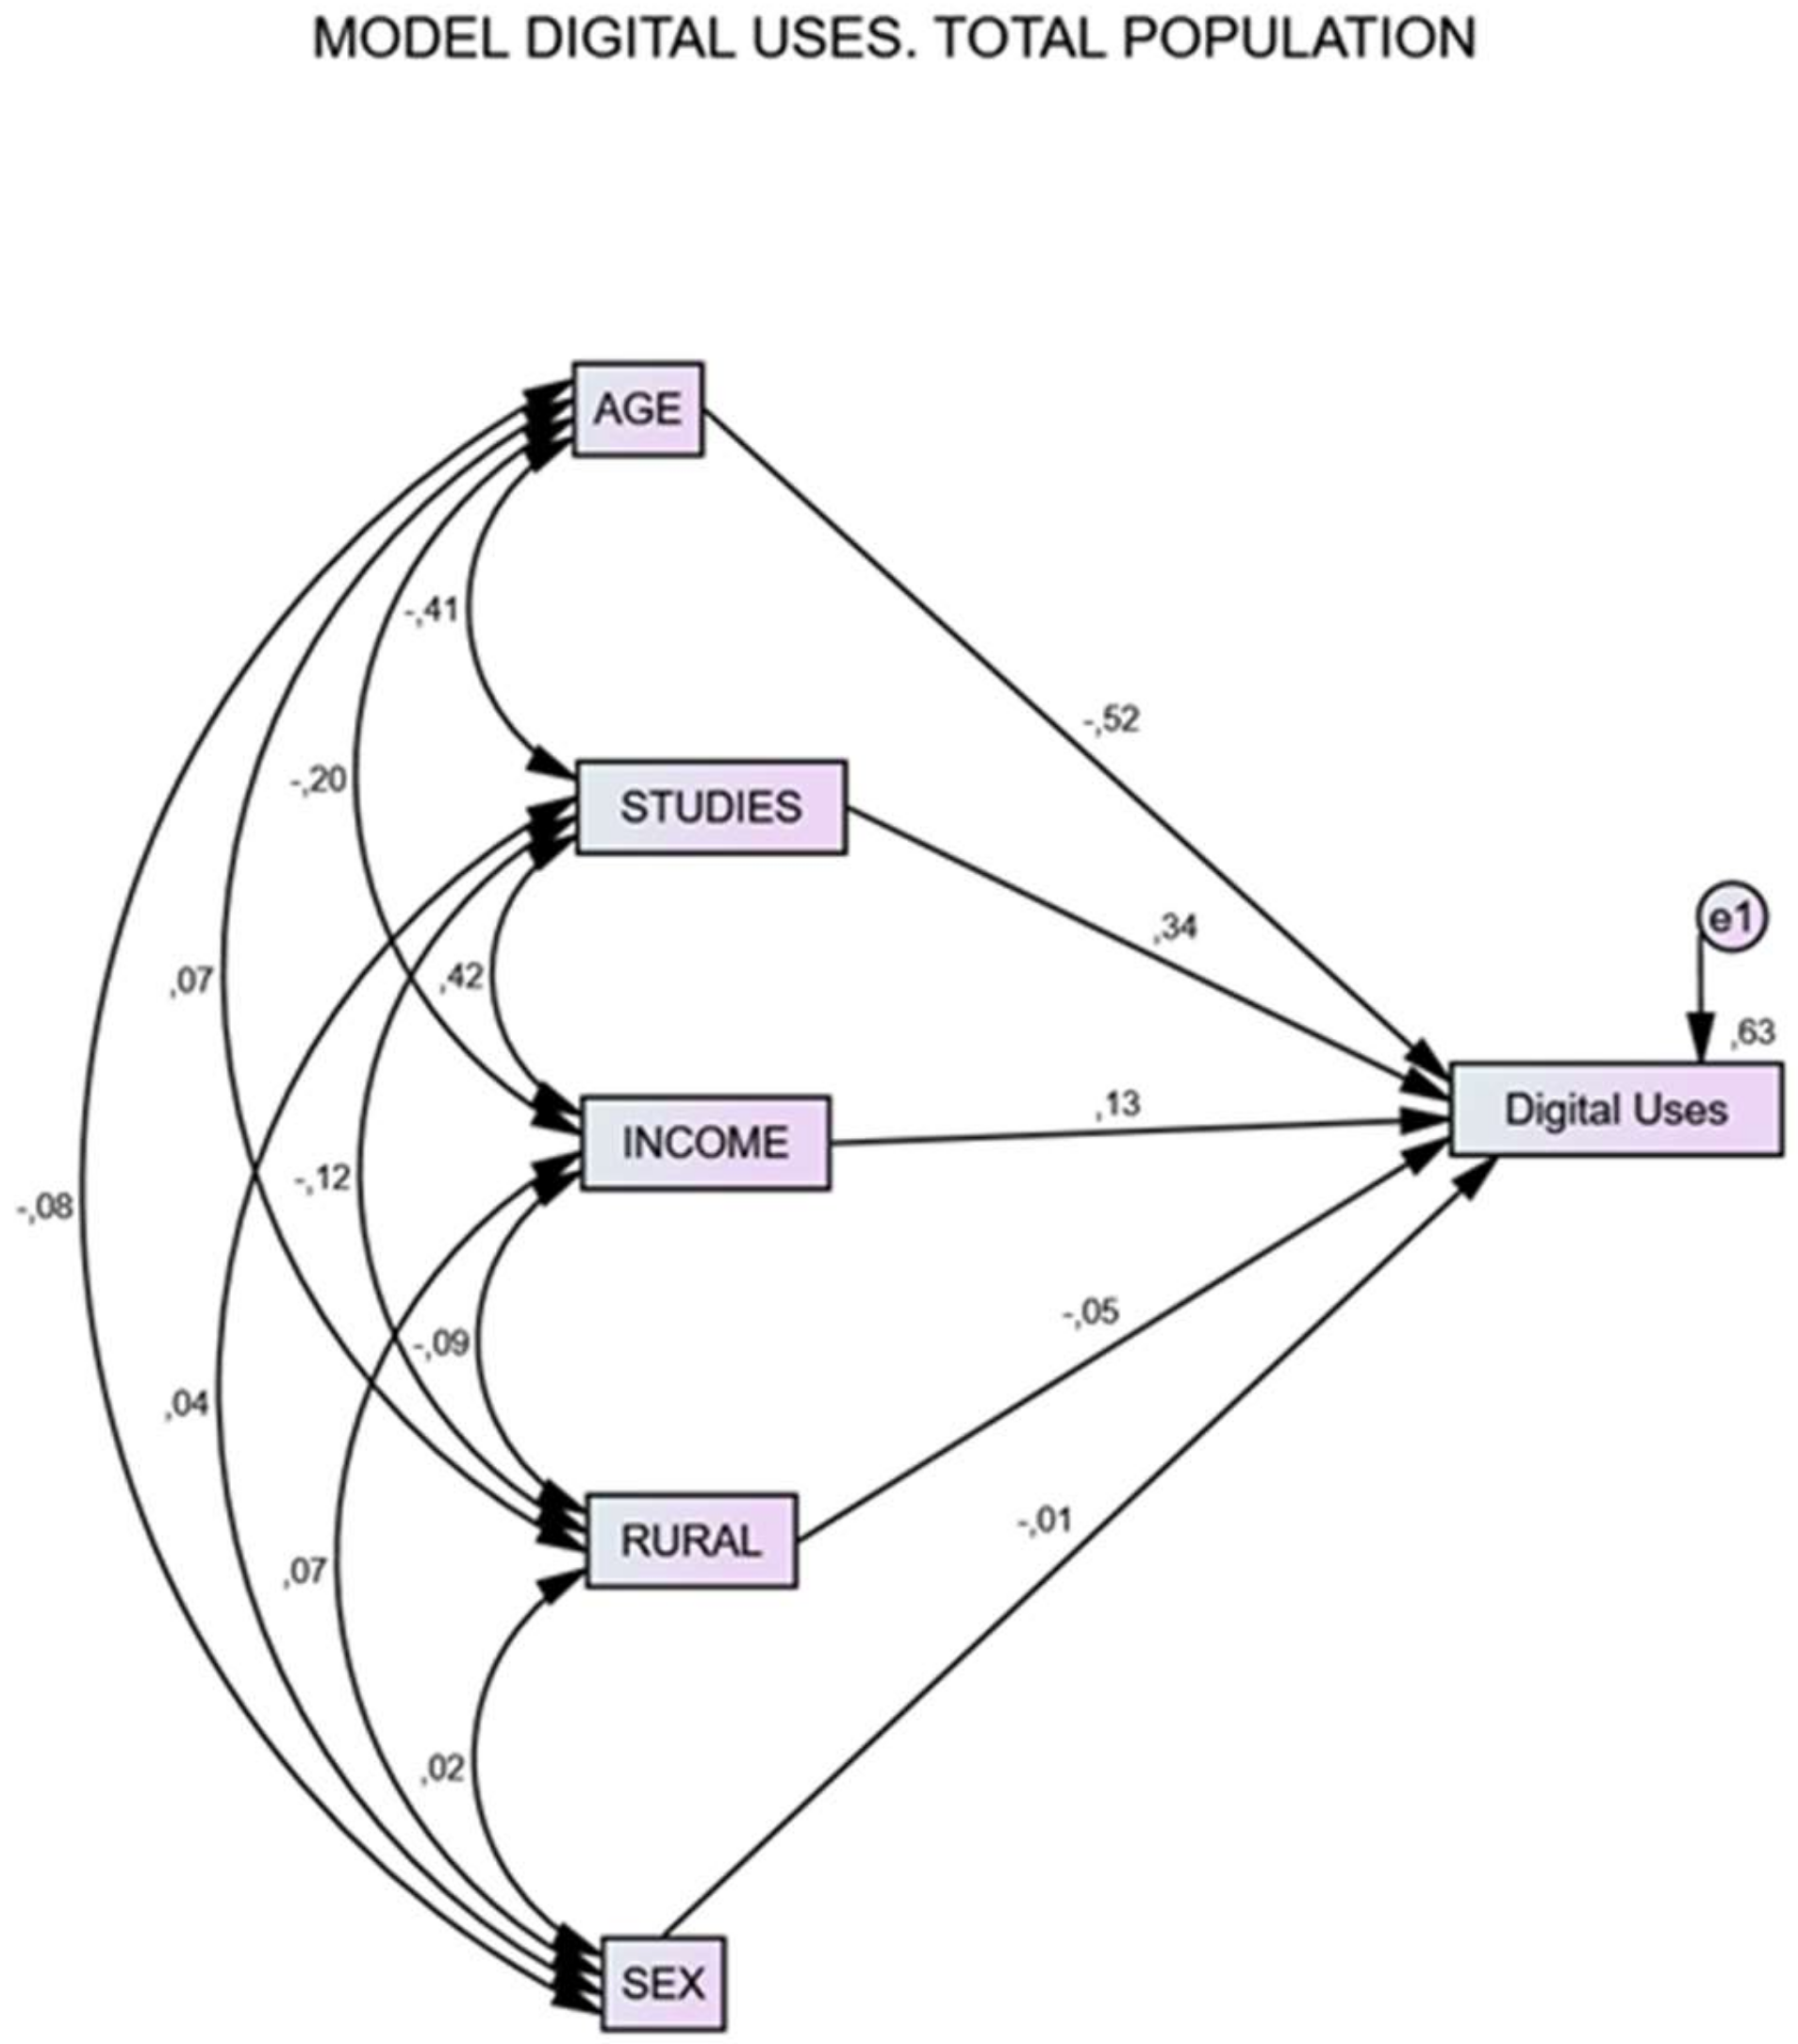
When we examine digital uses in the total population (
Figure 1), we see that the variable with the greatest explanatory power is age. This is the most significant digital divide. It is followed by education and, to a lesser extent, income. The rural/urban dichotomy has a low but statistically significant explanatory power. However, the influence of the gender variable, with a standardized coefficient close to zero, is not statistically significant, so its explanatory contribution is not shown. The most digitized are: the youngest, those with more education and more income, and those in non-rural areas. Vice versa, the least digitized are the oldest, those who have more studies, less income, and those who live in rural areas.
As can be seen, if we look at the covariances between gender and other variables, gender differences in digital uses are influenced by interactions with other variables, mainly age (women live longer and are older in Spain, according to the INE time series), income (they live in households with a lower family income) and education (they are less educated than men).
Another interesting observation in the comparison between seniors and the entire sample is that the residual error of the model for seniors is lower than that for the entire sample, which we interpret as seniors being less affected by other variables not included in the model, perhaps because they are a more homogeneous group than the population as a whole.
The main interrelationships between explanatory variables can be seen to be between education and age, education, and income, and, to a lesser extent, income and age. The others are less important. The higher age, the lower education. The higher education, the higher income, and the higher income, the lower age.
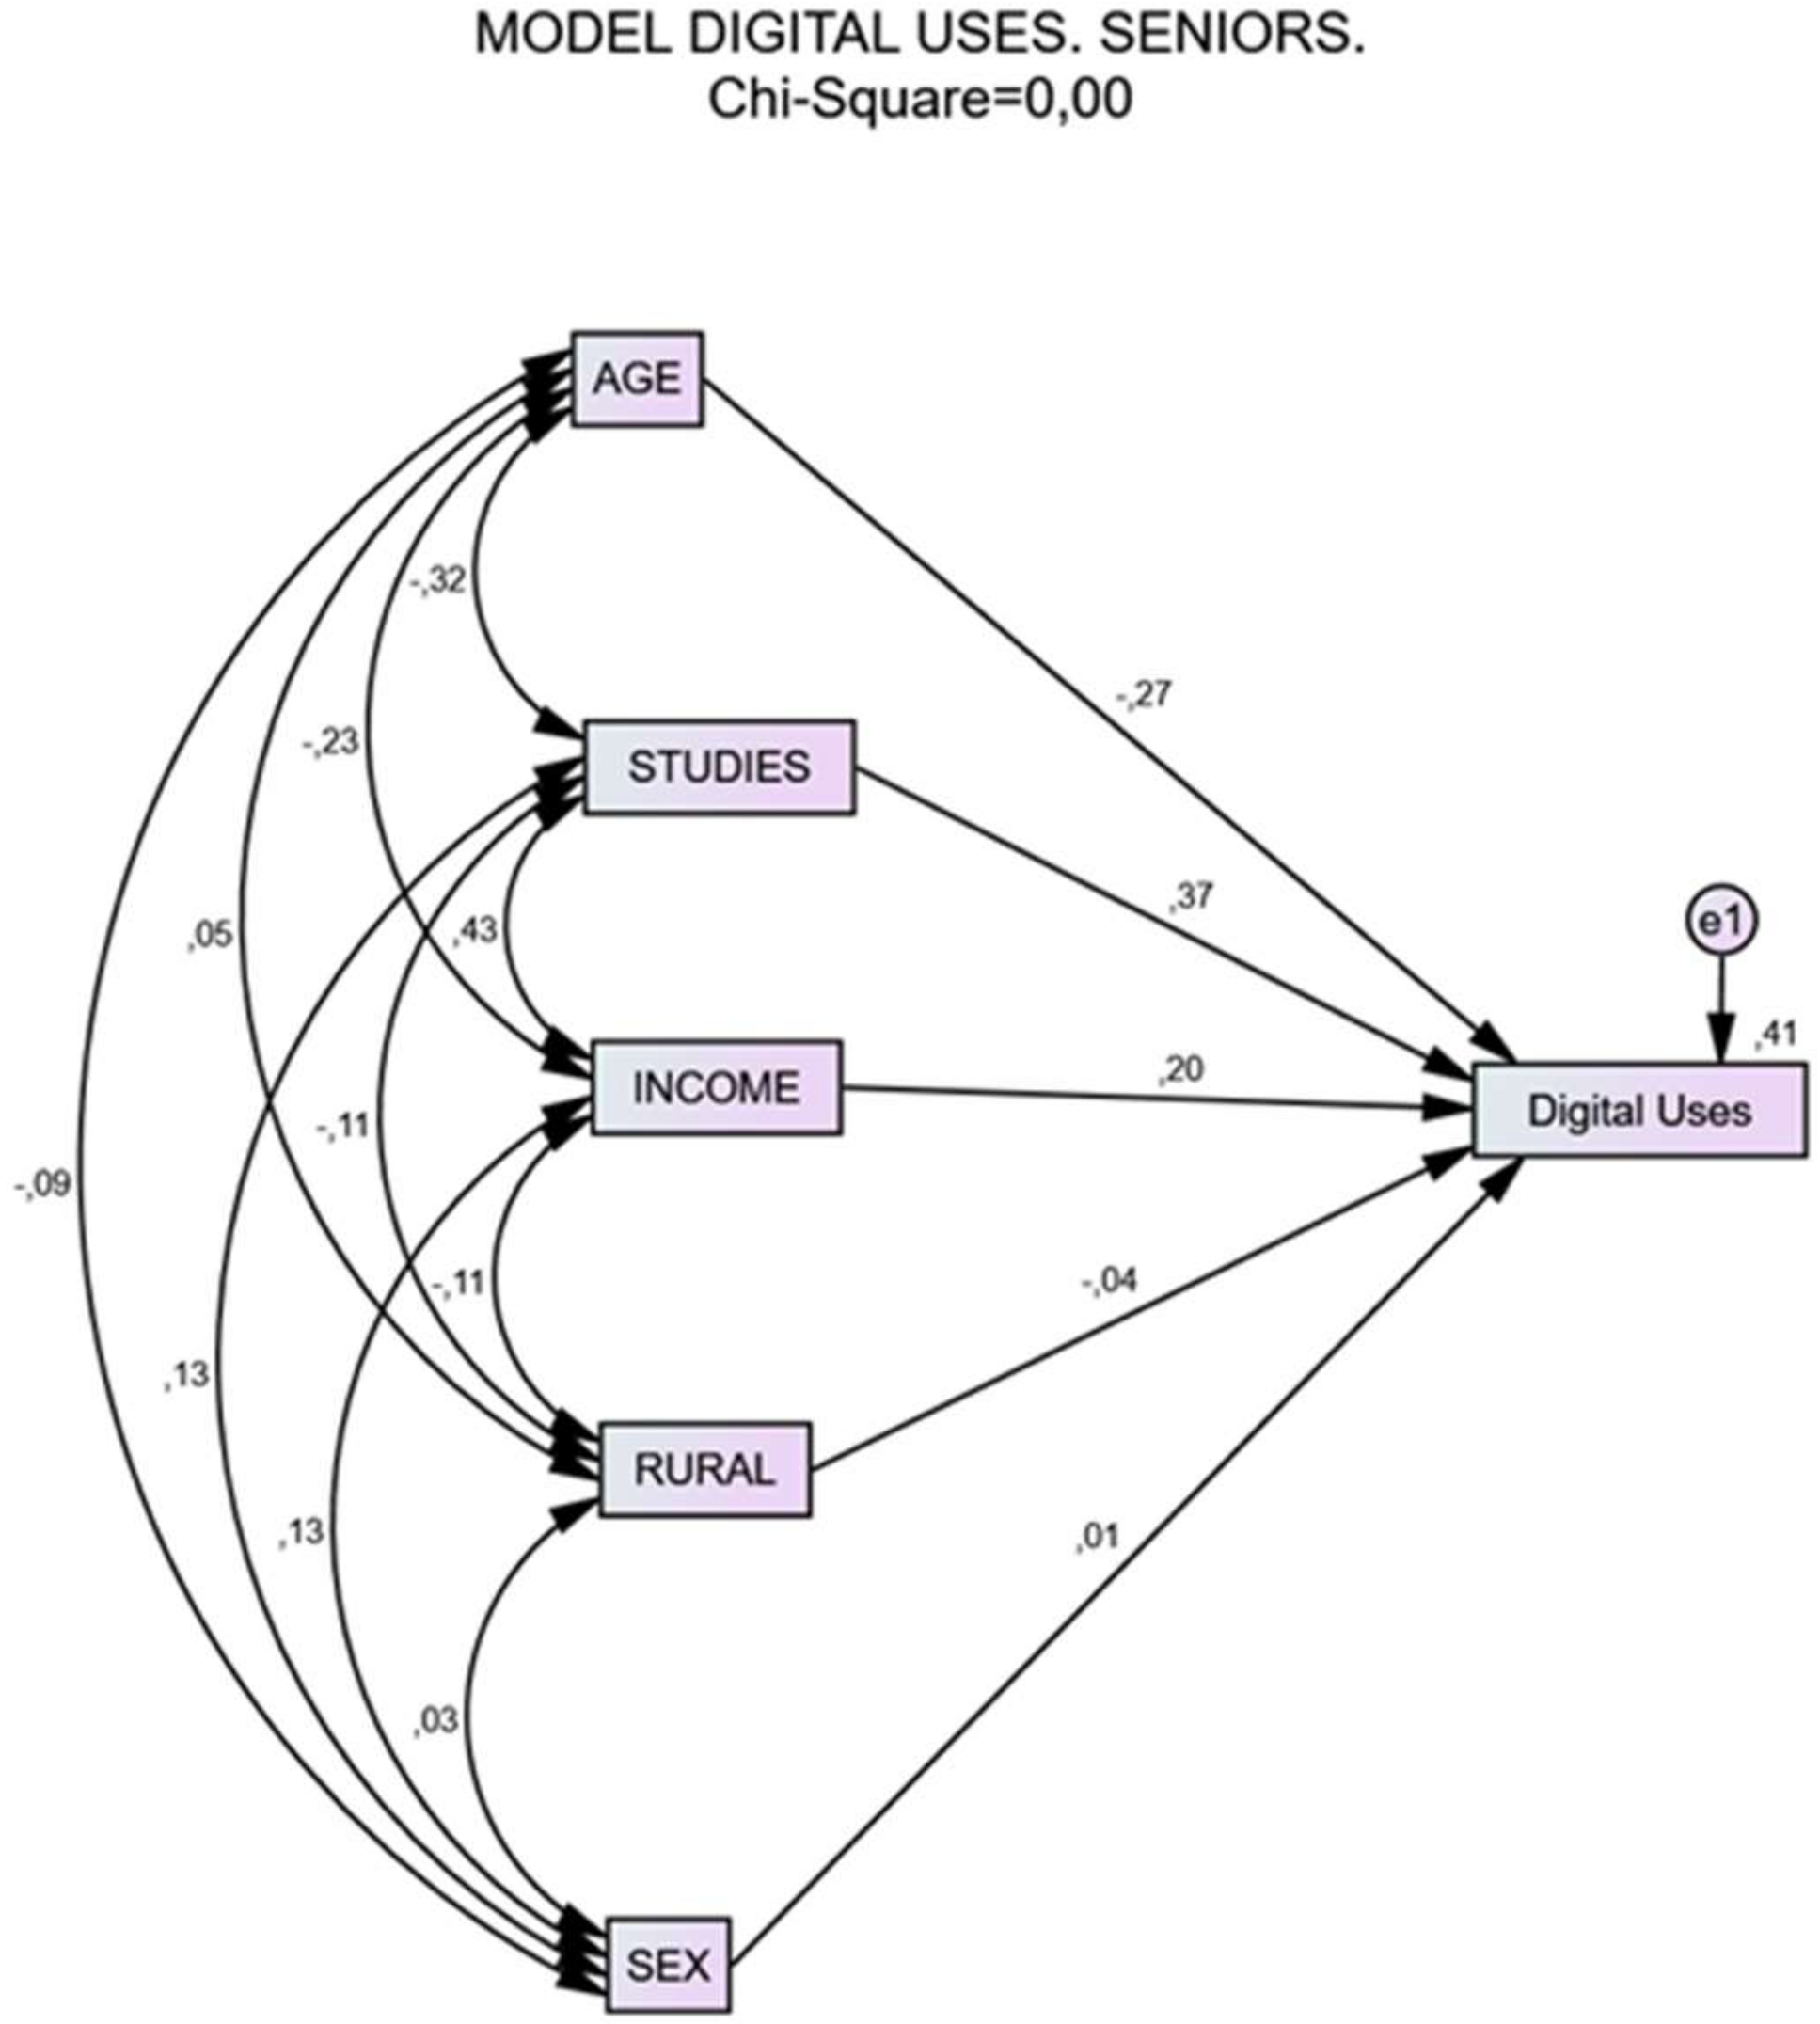
In the model that explains digital uses in the population of seniors (
Figure 2), we find that the variable with the greatest weight is education level, followed by age, and then income, whereas the explanatory weight of gender and rural remain low, at levels similar to those for the total population. The gender variable is not statistically significant for seniors either, so we cannot state that it explains digital uses, in either the total population or among seniors. However, the effect of the rural variable, while small, is statistically significant (see
Appendix A for more details). Therefore, the profile of those who score low in digital uses is: low education, high age, low income, and rural residence
The fact that age ceases to be the main digital divide in the seniors’ group is because the range for the variable is much more concentrated than it is in the population as a whole, so it is less discriminating of digital uses. However, despite this, age is the second divide, above income level. The differences in the three main divides are smaller in the population of seniors and they are more similar to each other.
Examining the models that explain differences in digital skills among the total population and among seniors, we reach very similar conclusions, with small nuances. This strong similarity in the results is due to the high correlation between the two indices (Spearman’s rho = 0.881 in the seniors’ group and rho = 0.964 in the total population. Spearman’s correlation is presented instead of Pearson’s because the digitization variables do not fit a normal distribution).
They are two closely related digitization dimensions: the greater the intensity and variety of digital uses, the more skills are developed, and vice-versa, the more skills, the greater the likelihood of use.
In the total sample (
Figure 3), the main explanatory variable for digital skills is by far age, followed in second place by education, and in third place by income. Being rural appears but has low explanatory power and gender is very low. Despite this, the weak explanatory power of gender in terms of differences in digital skills in the total population is apparently significant (
p = 0.002: in the digital skills models, it was not significant). Although the lower digital skills of women seem to be explained mainly by their lower income, lower education, and older age, a very weak but significant explanatory power persists that is independent of the interactions between gender and other variables considered in the models. We can confirm that, although no significant gender differences are observed in digital uses (as measured), they are seen, albeit very weakly, in the lower digital skills of women (see
Appendix A for the statistical significance).
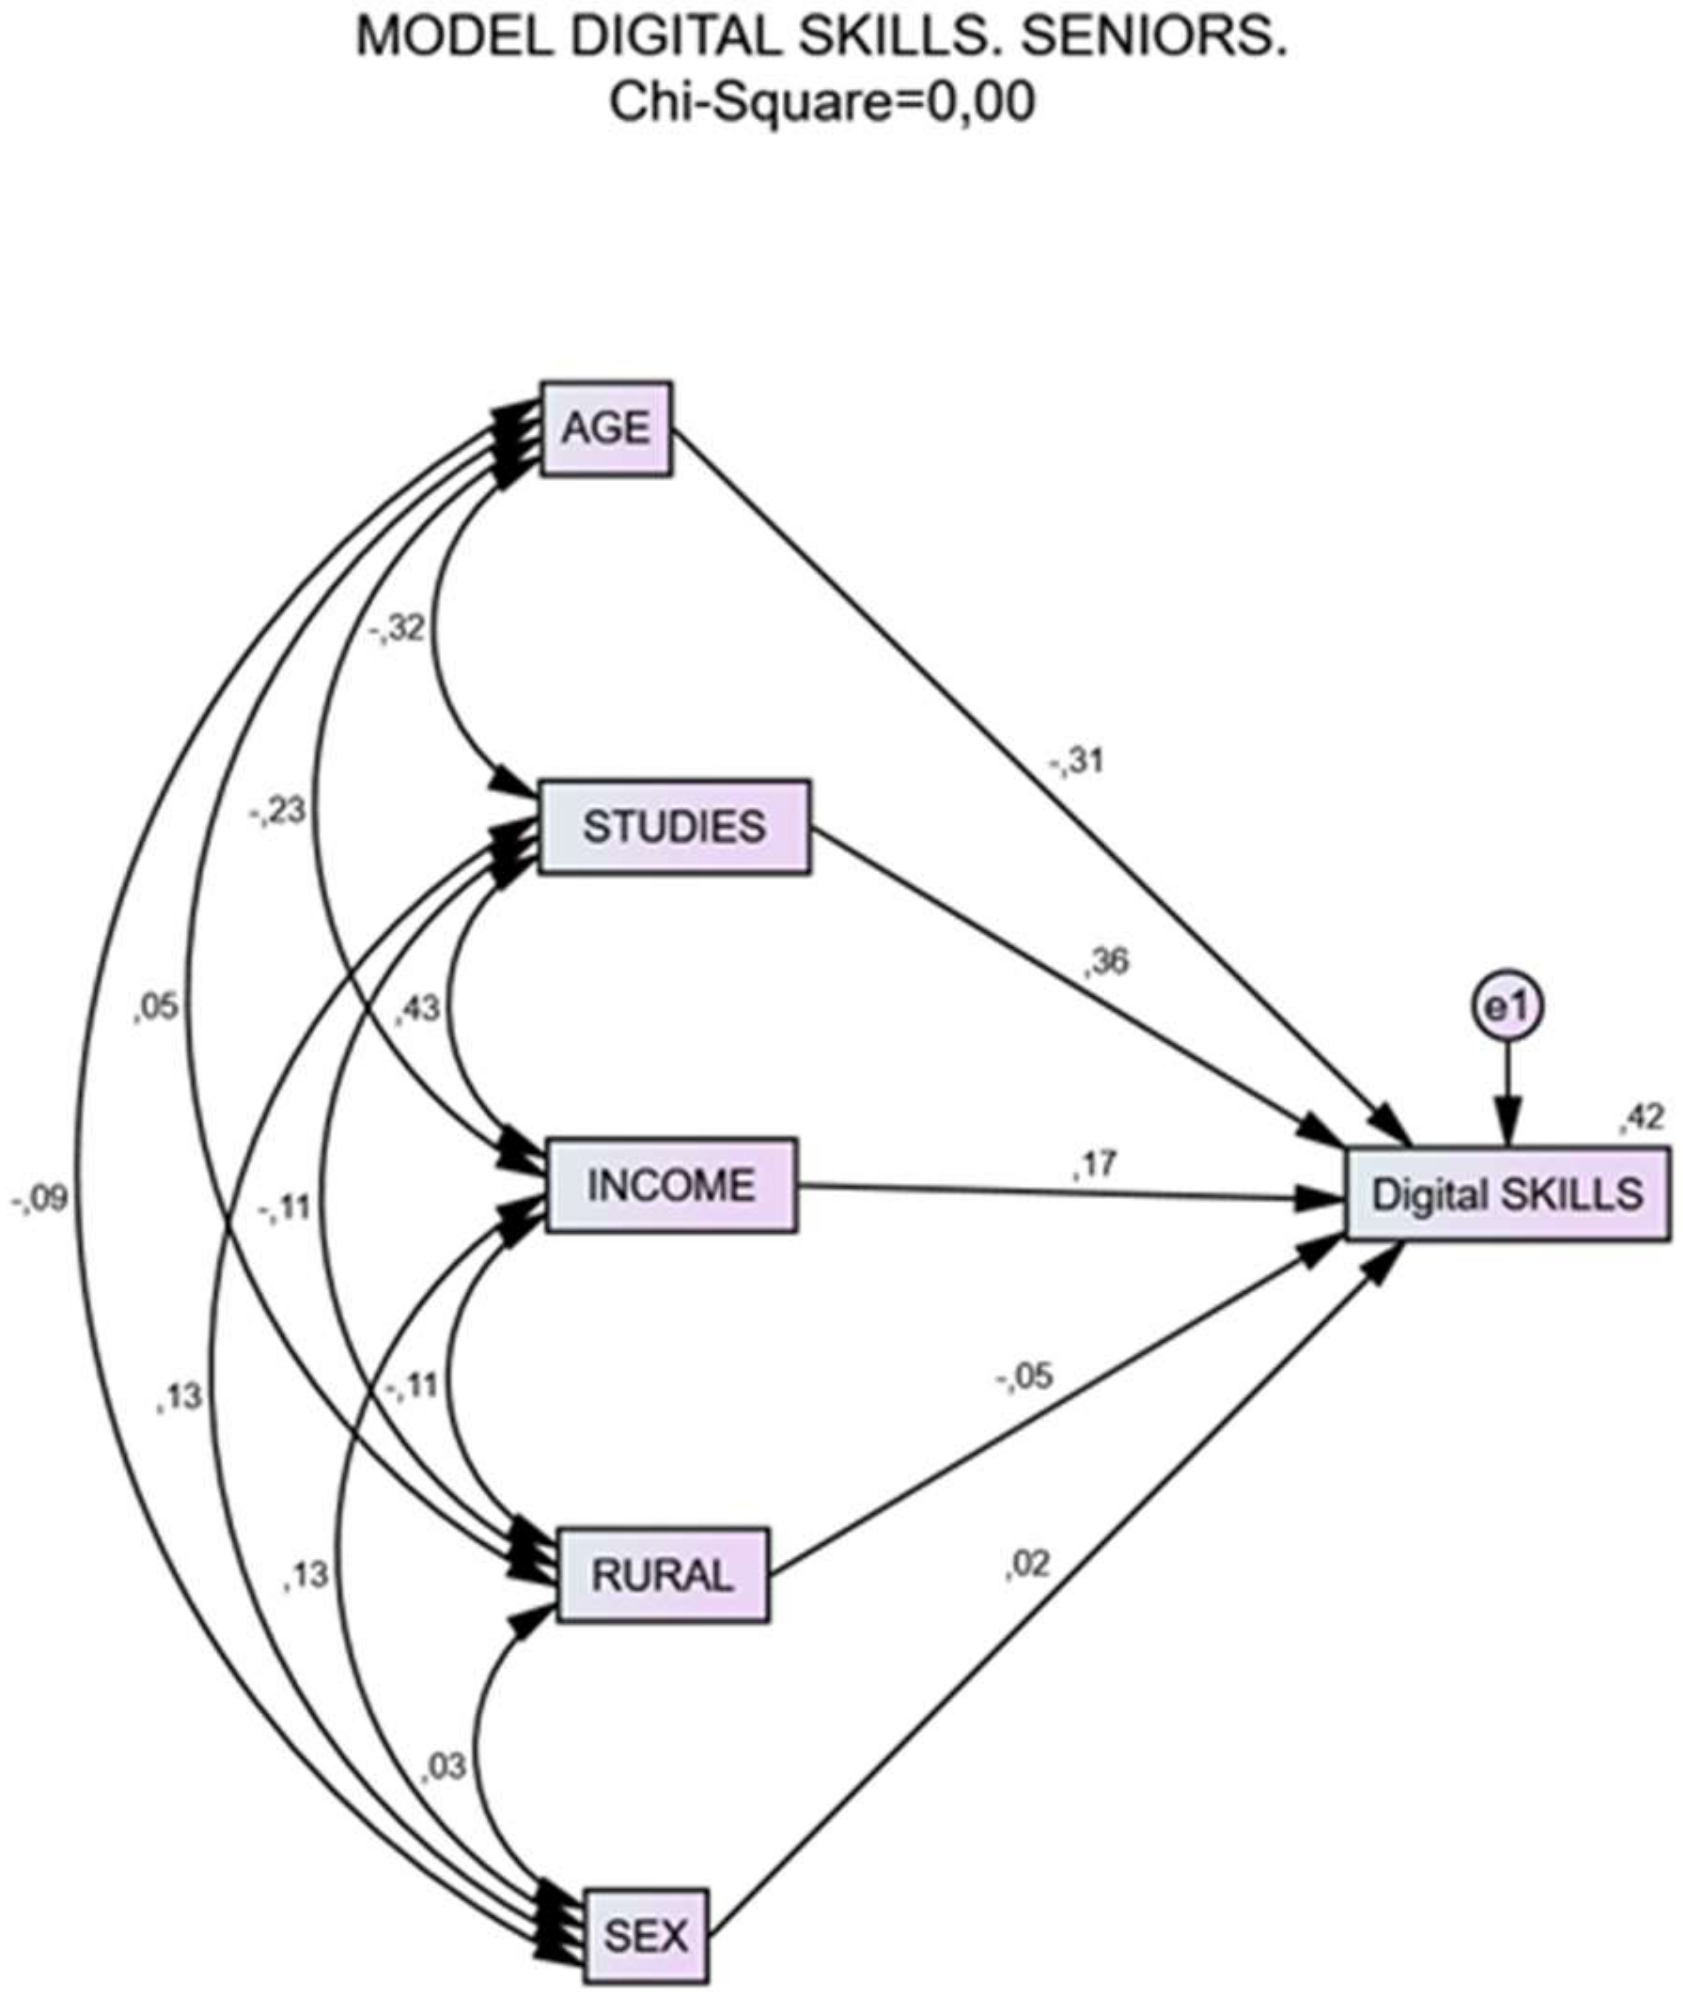
If we examine the model that explains digital skills among the seniors’ group (
Figure 4), we find that the first digital divide is education, followed by age, and in third place income. With a much lower impact, we continue to find being rural and gender. The nuances between the results among seniors for skills and for uses consist mainly of the fact that the influence of age is somewhat more important and income somewhat less important. Therefore, the profile of those who score low in digital skills is the same as those who score low in digital uses: low education, high age, low income, and rural residence.
An additional analysis through partial correlations allows us to verify, through the triangulation of methods, the interpretive hypothesis suggested by the path analysis models, that the gender or rural residence differences could be due to these variables interacting with other variables, included mainly age, education, and income. (See
Table 8).
The initial positive correlations between the digitization dimensions and the gender and rural variables decrease considerably when controlled for simultaneously by age, education, and income. However, they do not disappear completely. They continue to be small but statistically significant for the rural variable, both in the sample as a whole and among seniors. However, for the gender variable, the correlation with digital skills is only statistically significant in the total population, not among seniors, which is fully consistent with what the path analysis models reveal.
These results confirm that the differences we see between women and men in terms of digital uses are almost fully explained by the fact that women are older and have lower education and income levels. However, these differences, albeit important, do not fully explain the lesser digital habits of women in the population as a whole, without the same being true when we analyze the seniors’ group.
4.4. Explaining Differences between Provinces
From previous studies and from the data examined here, we already know that there are important territorial variations in Internet use by autonomous regions, greater than those observed in the variable size of the municipality [
20]. However, a logistic regression analysis of the aforementioned study revealed that the territorial differences by autonomous region had less explanatory power than social variables, such as age or education. The differences by province are greater than by autonomous region, examining digital uses and skills and having obtained statistically-significant results, we have preferred to address the territorial differences between provinces (in Spain, most autonomous regions are made up of several provinces and the level of territorial disaggregation is greater in the provinces).
Table 9 presents a summary of the variability by the province of digital uses and skills. The most interesting statistic is the range, which oscillates around 0.7 standard deviations between the maximum and minimum values observed in the 52 territories. This range of variations is quite high, which indicates that the provinces are a fairly discriminating variable of digital uses and skills.
The provinces with the highest scores in digital uses coincide with being the most urban and also often the richest (Barcelona, Madrid, Melilla, Valencia…) while those that score the lowest are the less urban and often less affluent provinces (Lugo, León, Ourense, Zamora…). For more details, consult
Appendix B where detailed data are offered at the provincial level of these and other variables.
The objective of the analysis in this section is to find out to what extent territorial variations in digitization are due to differences in the composition of the social structure of the territories (in non-spatial variables such as sex, age, studies, or family income) or whether they are due to other causes that we have managed to operationalize for this analysis: weight of the rural population, GPD and GPD per capita as indicators of economic development in the territory, degree of implementation of fiber optics (FTTH) and degree of implementation of quality data in mobile telephony (LTE) as indicators of quality Internet access infrastructures [
35]. Underlying the hypothesis that territorial differences would be explained by differences in access to infrastructure and economic development as well as in part by the differences in the sociological and sociodemographic composition of the territories.
The prominence of the so-called social variables compared with spatial variables suggests an important weight of these in the territorial variations. However, the variables available in the surveys do not allow the causal weight of hypothetically explanatory variables such as those mentioned on economic wealth and Internet access infrastructure to be adequately explored.
To integrate and be able to establish the explanatory weights of these two sets of variables, we have adopted the perspective of aggregate data, so that the analysis matrix prepared consists of 52 records (50 provinces and the two autonomous cities of Ceuta and Melilla). We have introduced as variables the average values in each province of some survey variables as well as the data available at a provincial level from other secondary sources. For more details,
Appendix B presents the analysis matrix, with detailed scores by province for all the variables explored.
In the explanatory models, we will only present results on digital uses but not on skills. The final models are included below, in which only the statistically-significant variables (p ≤ 0.05) are included and have been developed following criteria of parsimony and the greatest possible explanatory adjustment.
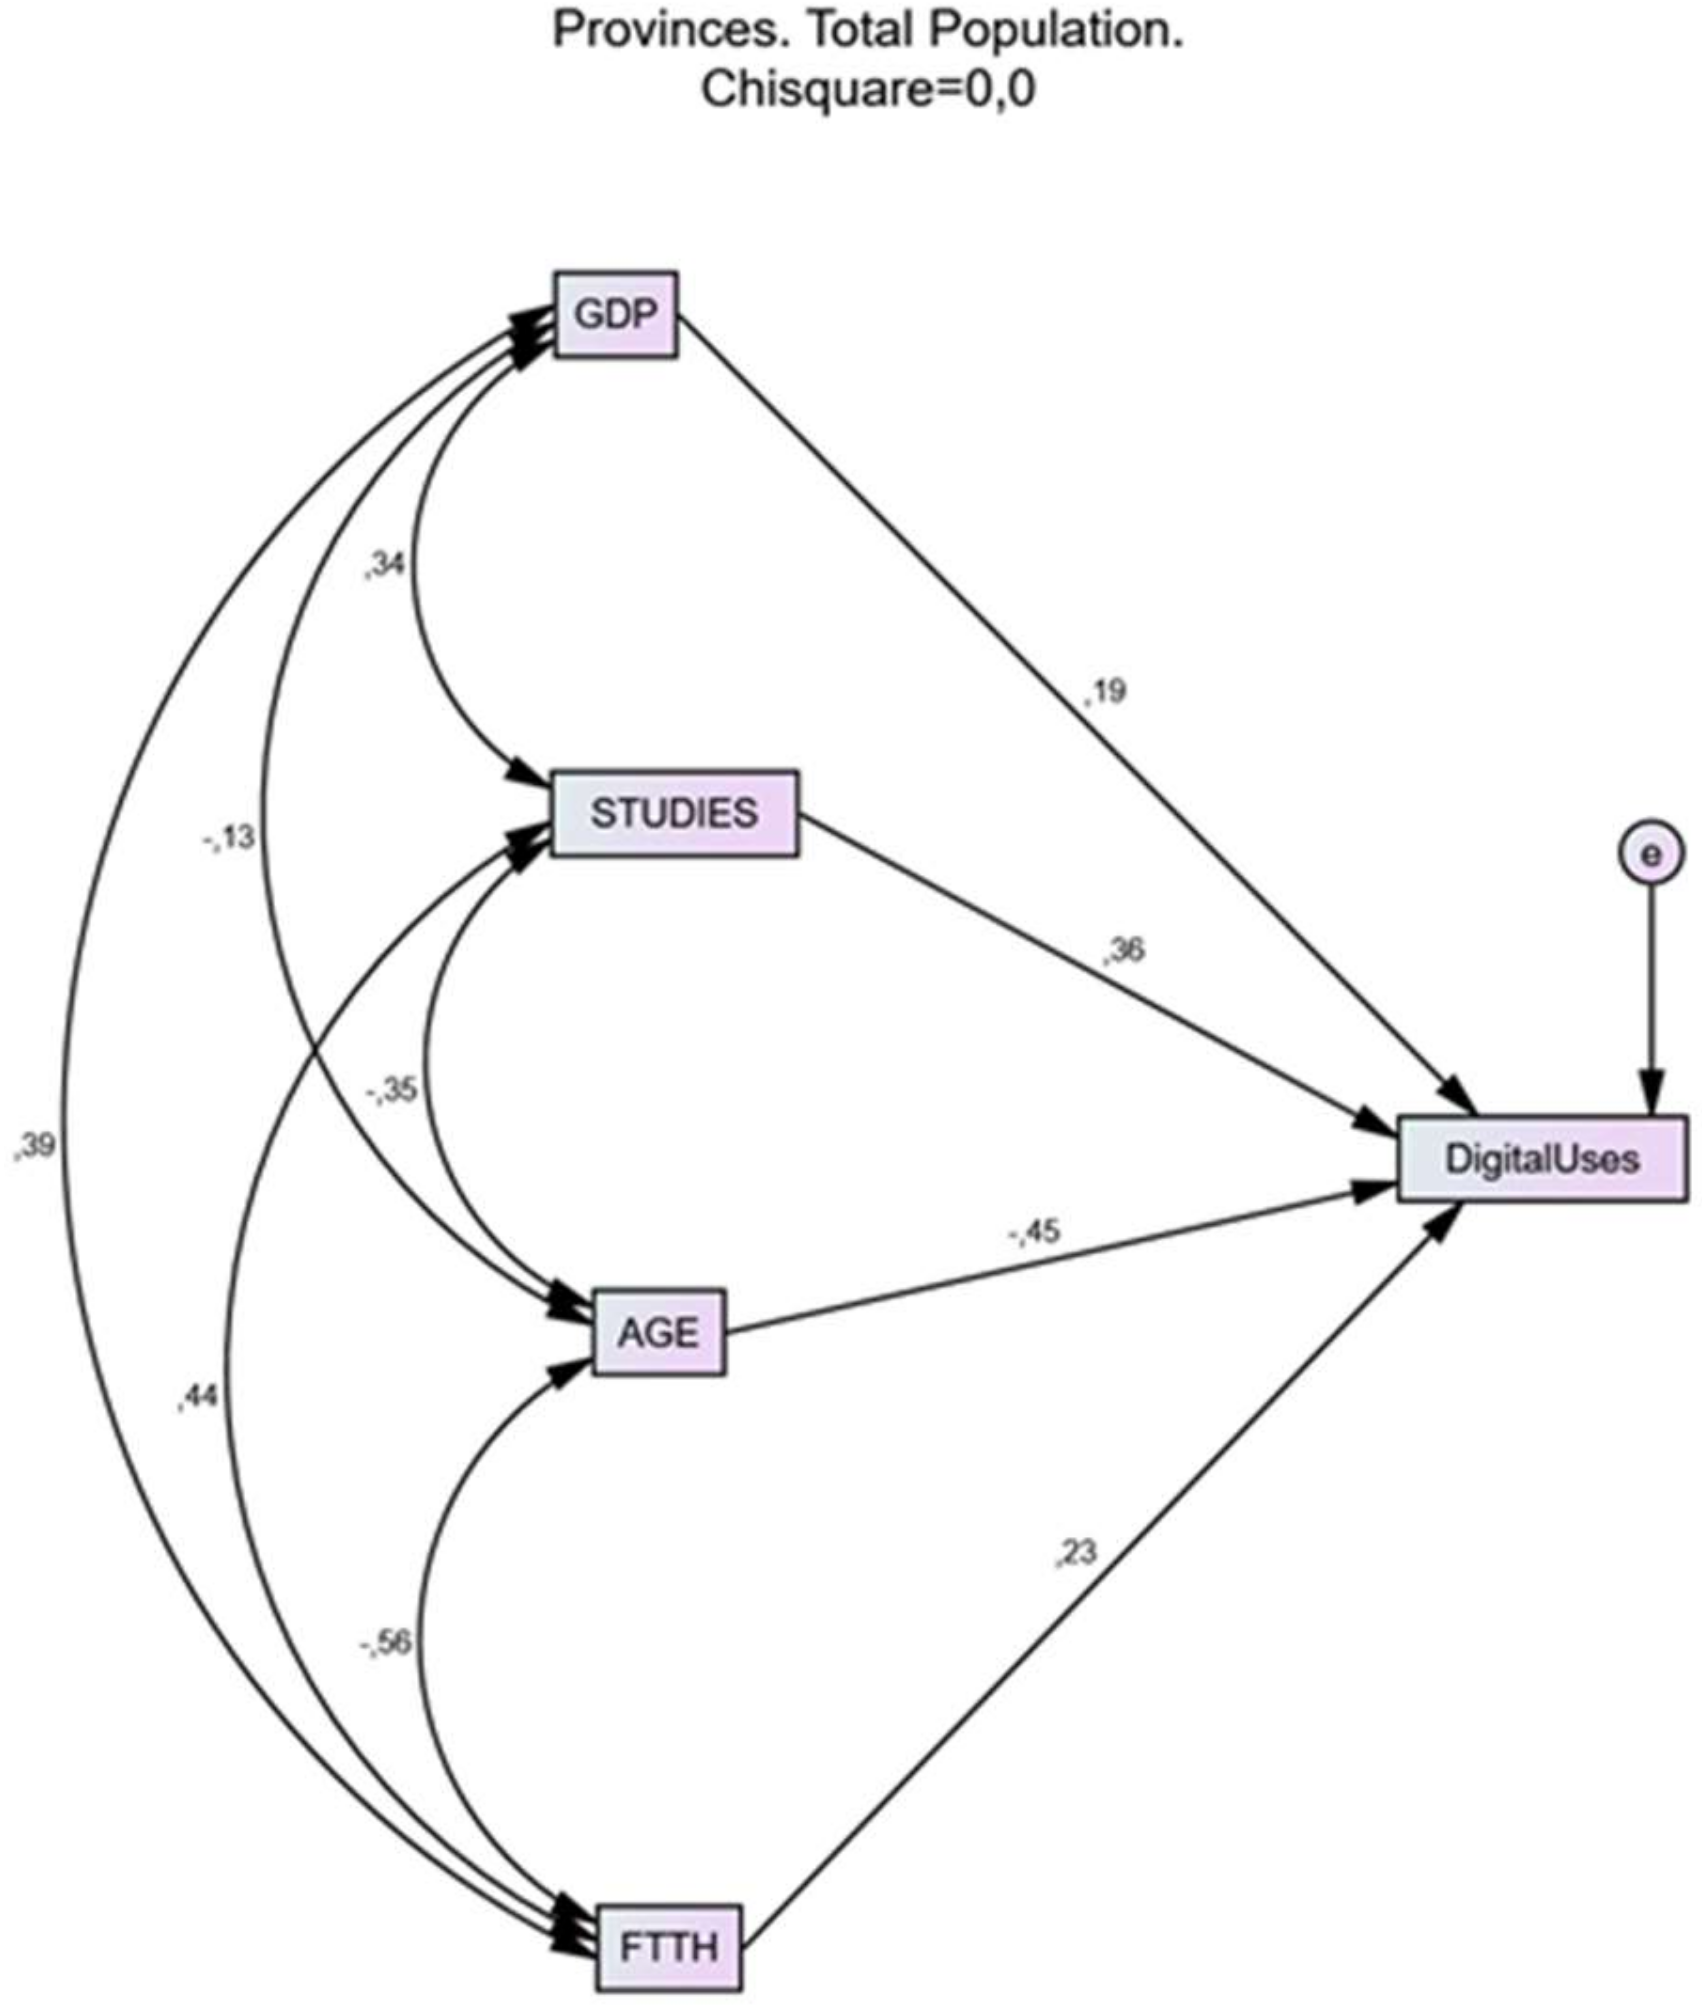
In the model of the total population (
Figure 5), the main variables that explain the differences between provinces in digital uses are age and studies. These two variables explain as much as the others: fiber optic rollout (FHTT) and GDP.
These data confirm the suspicion that an important cause of the territorial differences must be sought in the spatial segregation of the sociological and sociodemographic characteristics of the population. This hypothesis is at least confirmed by the explanatory weight of studies and age, since they are the variables that best explain the differences in digital uses between provinces. On the other hand, the results confirm that economic wealth and access to infrastructure are also important explanatory factors, although minor, of the territorial differences.
Significant covariances are also seen between the explanatory variables, especially between fiber optics for people of a younger age, higher education, and higher GDP. Our interpretation is that the spatial segregation favors the younger and more educated population to concentrate in well-connected areas with greater wealth and vice versa, those who are older and with less education tend to be concentrated more in territories with a lower GPD and less Internet connection. This interpretation is supported by the strong covariation of the fiber optic with the variables of age, studies, and GPD.
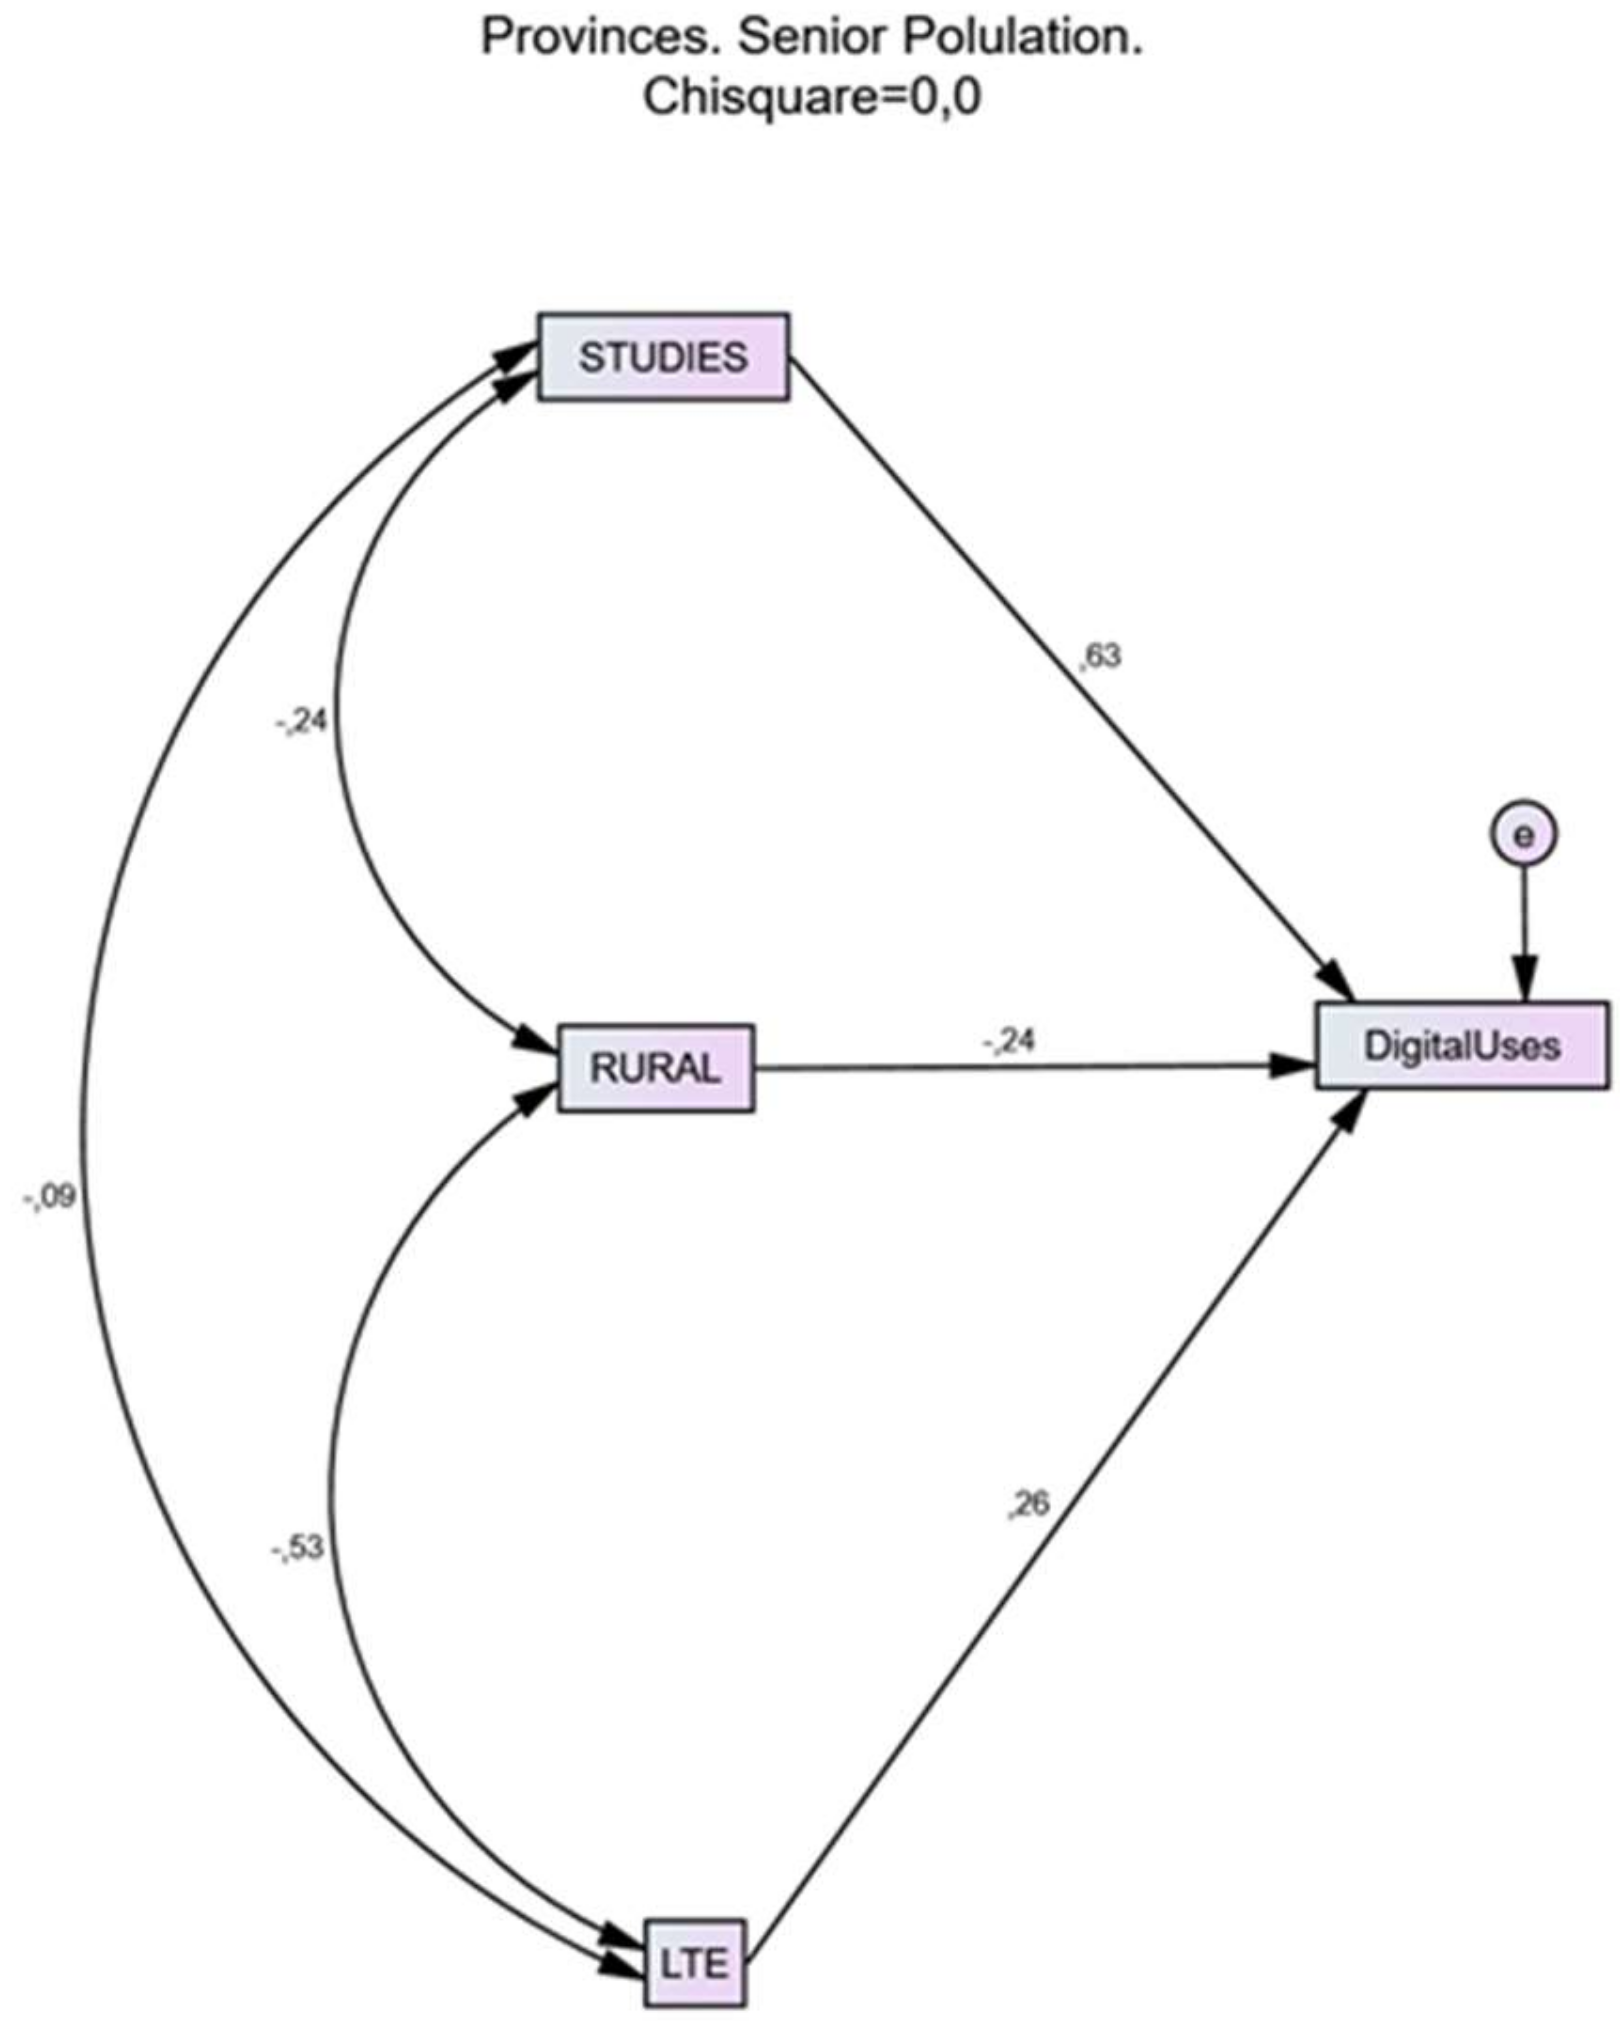
The model of the senior population (
Figure 6) is somewhat different. Partly for methodological reasons, since the smaller sample has conditioned that only three variables have been statistically significant. But it is also due to the differential specificities of the group.
The variable that explains the most by far is studies, the explanatory effect of this variable being greater than the sum of the other two. The absence in the model of economic variables is striking, since they seem to be less determinant of the territorial differences in the group. However, we already know that the studies variable is correlated with income, so the study implicitly indicates personal status, although this is much less decisive in explaining digital uses than qualification. The weight of the rural population is also important to a lesser extent, given that in the provinces with a greater relative weight of the rural population, less Internet use can be very clearly appreciated. This variable is not significant in the general population model, but it is in the senior population. The indicator of connection infrastructure that best territorially differentiates the uses of seniors is not fiber but the LTE connection (which allows access to 4G data in mobile telephony). This is due to the fact that the elderly mainly connect to the Internet through their smartphones and much less through PCs. Specifically, 37% of seniors indicate that there is a personal computer in their homes, while ownership of mobile phones is 90%. On the other hand, the proportion of the rural population in each territory is another significant variable in this model. Its weight in explaining territorial variations is important, and it is closely related to the availability of LTE connections, which are less accessible in rural areas with a low population density.
Among the seniors, the data also confirm the suspicion that an important cause of the territorial differences must be sought in the spatial segregation of at least the level of studies, although the results are not as resounding as in the whole of the population. Its greater presence in provinces with a greater rural component and the differences in access to mobile data suggest that in this group the geospatial dimension has a more direct weight than in the general population.
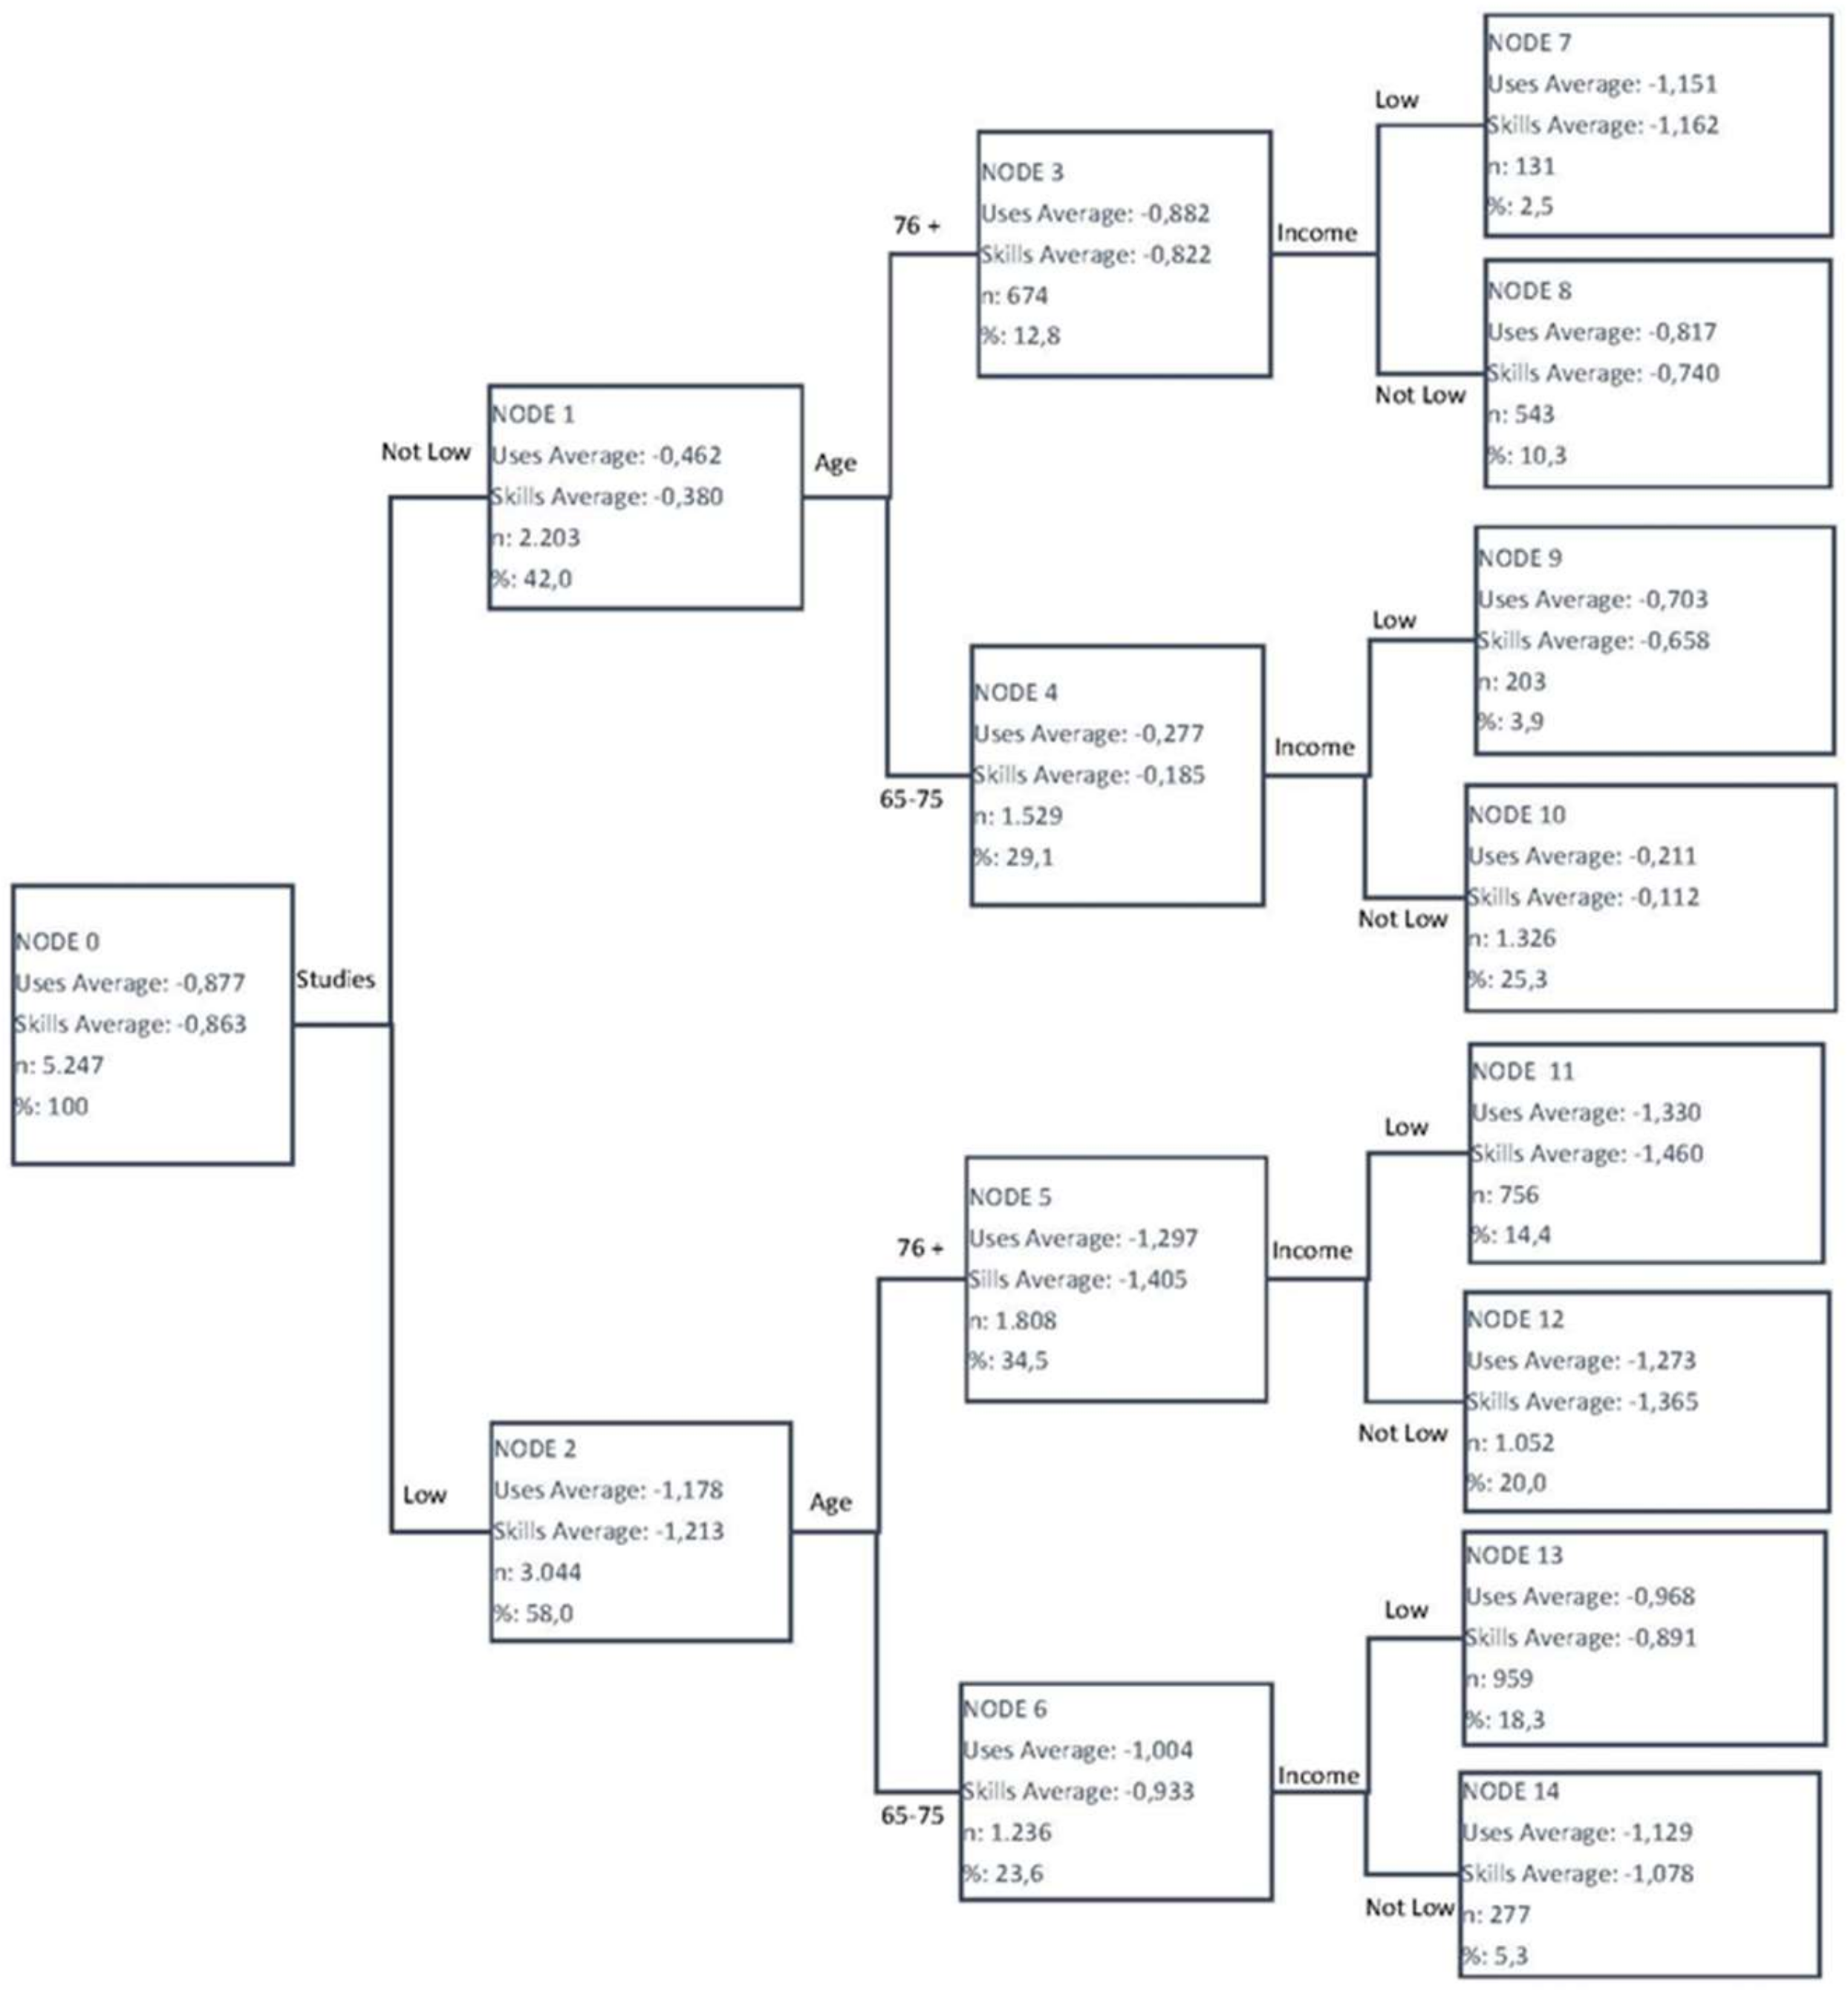
4.5. The Senior Population’s Segmentation
Once the weights of the different digital divides had been identified, our objective was to examine the digitization differences between the main segments of the seniors’ group. To identify these segmentation criteria and determine the segments, it was appropriate to use the CHAID (Chi-Square Automatic Interaction Detection) segmentation technique. Presented below are the results of this segmentation. Remember that it has been limited to three branching levels and a minimum of 200 cases for each final node. Two segmentations were performed, one with the uses variable as a dependent variable and another with the digital skills variable as a dependent variable. In both cases, the segments are identical in the three-level segmentation tree. The digital skills variable has been standardized so that the results are comparable with those for digital uses, also a standardized variable. The methodological procedure used for this segmentation ensures that we can configure the relevant segments in order to analyze the different degrees of digitization among seniors, differentiating between them on the basis of relevance. See the results in
Table 10 and
Figure 7.
Firstly, we see that the values for uses and digital skills are negative in all segments. This means that they remain below the population mean, which is equal to zero. On the one hand, this is due to the strong impact of the confluence of various inequalities in the group, and on the other, it is because we have prioritized the less-digitized categories over the higher ones, focusing our approach on lower digitization. For this reason, there are categories above the mean, such as university education and income over €3000.
To compensate for possible biases from the recoding performed in the CHAID segmentation, we have conducted a simple segmentation of the means for uses and digital skills, with the five variables examined, without regrouping the response categories. The results of this analysis are outlined below. The mean factor score for digital skills in seniors who went to university is +0.1145, a value that is slightly above the mean, but not by much. The mean score for seniors with incomes over €3000 is +0.0841, that is, they are at the population mean. In digital uses, those who have higher education scored 0.01 and those with incomes over €3000 scored 0.05. These segments with non-negative values are very small, accounting for 11% and 4% of seniors, respectively. When we jointly segment through education and income, by age we see that among those aged under 75, those with incomes over €2500 achieve non-negative mean scores in both digitization variables, but all those who do not have university education continue to have negative means. In contrast, when we segment education with income, we see that university graduates with incomes over €1600 have non-negative means (also in uses and digital skills). No other segmentation of the five variables considered allows us to obtain non-negative means, in either uses or skills (with two segmentation levels, exhausting the possibilities of the sample when contemplating all the response categories for the variables).
Secondly, returning to the CHAID segmentation, we see that the scores for digital uses and skills do not differ much. Any differences are nuances that still allow us to reach the same overall conclusions. The main difference is a slightly higher variability in skill levels than in uses.
It is also interesting to note that the first segmentation level is determined by the education variable, the second level by the age variable, and in the third level, income differences dominate, although the rural/urban dichotomy also appears. This is highly consistent with the conclusions on the explanatory weights for digital divides examined in the previous section. Note that the rural variable has a modest presence in the segmentation and the gender variable does not appear as a discriminant variable. The results of both analyzes provide support for each other. The perspective of the CHAID segmentation serves to confirm, through the triangulation of methods, the results of the causal analysis obtained through path analysis, in terms of ranking the importance of the explanatory variables.
We find the lowest scores in all low education segments, which have negative scores below one standard deviation, with the sole exception of those under 76 years in urban locations, with a somewhat lower score, similar to all seniors. Those with low education and over 76 years of age are particularly low, regardless of their income levels. This combination of education and age is the most determinant of low levels of digitization and accounts for just over a third of the group (34.4%).
We find the highest digitization levels in the segment of high education, under 75 years of age, and high income, which accounts for 25.3% of seniors.
The following segments are clearly below the mean for seniors and appear in order: 11 (low education, over 76, low income), 12 (low education, over 76, high income), 7 (high education, over 76, high income), 14 (low education, under 75, rural). Around the mean are those who have low education, aged under 75 and in an urban location, and those who have a high education, aged under 75 and have a high income. Those who have a high education, aged over 76, and a high income are clearly above the mean, along with those who have a high education, aged under 75, and a low income.
Although the results of the segmentation are presented for a segmentation level of three variables, we have explored up to a fourth level, restricting the configuration of final nodes to 100 cases. When doing this, we have found some additional segmentations with significant differences in means, which are the four below (graph and tables not presented due to space issues):
Differences between women and men, with high income, young seniors with a high education (Uses and skills).
Differences between rural and urban, with high income, old seniors with a low education (Uses and skills).
Differences between women and men, urban, young seniors with a low education (Uses and skills).
Differences between women and men, rural, young, low education (Only skills, in uses, the differences are not significant).
In the fourth segmentation level, there are differences by age and residence. Bear in mind that the differences in means do not necessarily imply causality. In this segmentation level, the differences are small (albeit significant) and they always have negative scores, lower than the mean of the population as a whole. Skills generally differ more than uses.
4.6. Profiles and Divide Weights of the Digitally Excluded
A complementary perspective to that outlined so far consists of characterizing the profile and dimensioning the digital divides of the digitally excluded, who are mostly seniors. The clearest criterion for differentiating between them is found in the ‘low’ category of the digital uses variable, which includes all those who do not use the Internet or do so less frequently than in the last three months and therefore do not mention any Internet use. Moreover, 100% of these completely lack digital skills. While in the general population they represent the lowest quintile (21.7%) and in those aged under 65, this falls to a minority of 4.5%, among seniors they account for 54.9%. In addition, a vast majority of the digitally excluded in the general population are seniors: 86.3%.
According to the tables already presented (see
Table 3,
Table 5 and
Table 6), the most distinctive features of the profile of the digitally excluded are as follows:
77% have primary or incomplete education.
67% are aged over 76.
63% are women.
58% have a low or medium-low income.
25% are in a rural location.
The measure of the over-representation of those excluded compared to the mean for seniors in each of these groups of variables was calculated using index numbers over 100, in which 100 is equal to the mean for seniors, above 100 is higher, and below this is lower. These are, from the highest to the lowest figures:
The indices allow us to identify the categories where we find the main differences, with age being the most prominent, followed by education, income, rural, and finally women, with the latter category differing little from the mean. In all these categories or groups of variables, those excluded stand out as being above the mean for seniors.
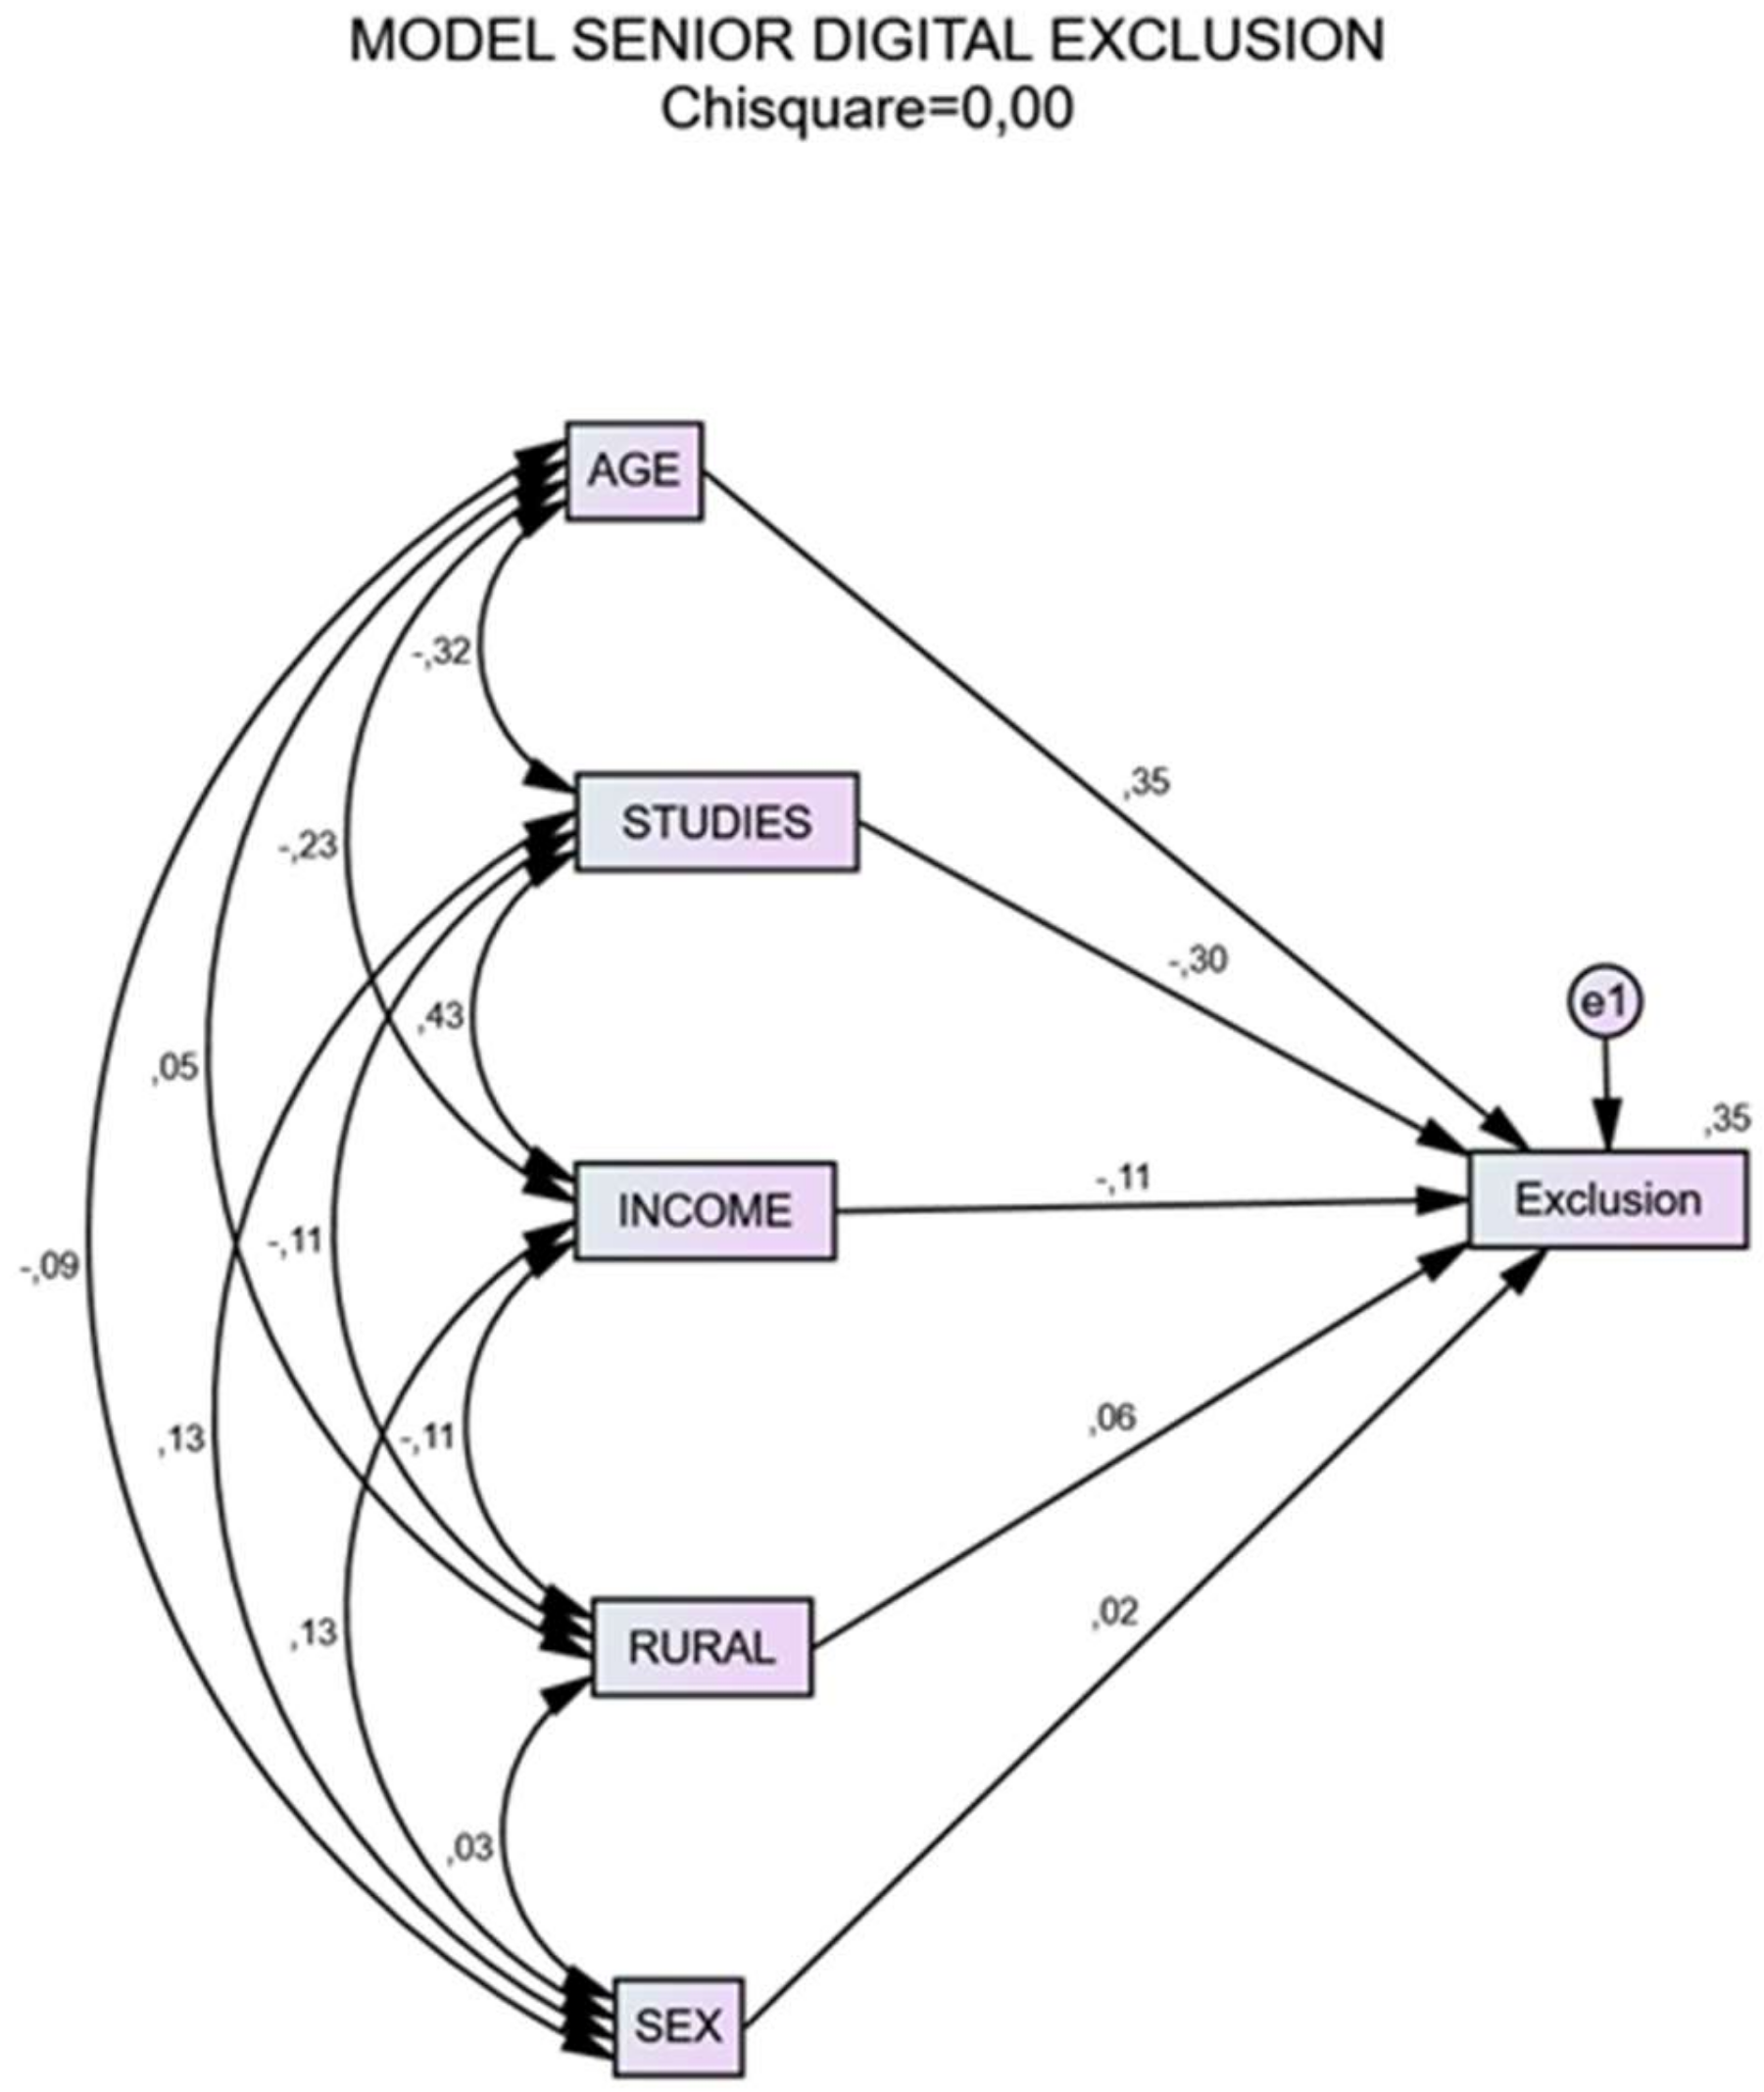
The indices are not sufficient to estimate the impact of the variables that represent the categories examined for digital exclusion. To identify the effects with greater accuracy, a new path analysis model has been developed with the five explanatory variables and one dependent variable, digital exclusion, with a value of 1 for those excluded and 0 for the rest. The results are shown in
Figure 8 (standardized estimates):
The variables that most explain digital exclusion among seniors are age and education, much more similar in terms of direct effects on the dependent than in previous models, although age has a little more weight. Income appears at a clearly secondary level, and in the third level of importance, with low weights, are the rural and gender variables. Examining the statistical significance of the regression coefficients, we verify that the contribution of the rural variable to the dependent variable is statistically significant (
p = 0.000), whereas the almost zero contribution of the gender variable is not (
p = 0.136). The other higher contributions are all highly significant (see significances in
Appendix A).
This means that digital exclusion is explained mainly and with much difference from other variables by age and studies. In addition, the explanatory weight of both is very similar. Income appears as the third variable, more distant and to a lesser extent, the rural habitat also provides explanatory power. The results of the exclusion analysis are partly similar to those that explain digital uses and skills, as is logical. But they differ in the greater explanatory importance of age and studies.
5. Discussion
In relation to the digital skills and digital uses variables, we see a great similarity in results and very small differences, just nuances. We interpret this as a consequence of the close relationship between uses and skills that is reflected in the high correlation between these variables. Other studies had already found very similar correlations between the various digitization variables and suggested that there is a latent dimension when we study digitization [
41].
Whether we look at uses or skills, the variables that most explain the digitization levels of Spanish seniors are firstly education, followed closely by age. The explanatory weight of these two variables is very high. In third place is income, and in a distant fourth place is rural habitat. The age variable has insignificant or zero explanatory power.
What differentiates seniors from the general population both in uses and in digital skills is mainly the lower explanatory importance of age, and the greater importance of educational level. Income level is also somewhat more important among seniors than in the general population. However, there are hardly any differences in relation to the explanatory power of habitat and gender, despite the fact that before conducting the statistical tests, we thought that these variables would differentiate seniors more.
Therefore, those who use digital media more and have more digital skills are younger seniors, with a higher level of education, high incomes, and residing in non-rural areas. Vice versa, those who use the least and have the least skills are the older seniors, with low education, low income, and residing in rural areas.
The scarce or zero explanatory power of the gender variable contrasts with the extensive literature on the gender divide. However, we had seen previous evidence that the relationship between gender and certain digitization variables disappears when controlled for by other more explanatory variables, in studies on Spanish society [
17,
18,
19] and other countries [
6]. This is exactly what we find in this study. But it would not be correct to think that there are no gender differences. These differences are evident. Our study finds that digitization differences between Spanish men and women, seniors, and non-seniors (in the digitization variables we studied), are explained almost entirely by the lower education level of women, lower income, and older age. There is practically no difference between the general population and the senior population, despite the fact that among seniors, the differences are greater than in the general population. We found that this is due to the fact that there are greater differences in education, income, and age among seniors.
However, we also find that while the rural-urban variable has a small explanatory role, the explanatory power of this variable does not disappear (although it logically decreases) when controlled for by other explanatory variables, meaning that there are specific causes (spatial or geographic) that explain lower digitization in rural areas, both in the population as a whole and among seniors (to a similar extent and not greater among seniors than in the population as a whole). Other studies had previously confirmed the weak effect of geographic variables, with less impact than other social variables [
14,
29,
30]. Therefore, the Spanish case follows this pattern.
It is striking that the important differences that can be seen in the geographical variables become secondary from the multivariate causal perspective, both in our research and in the previous ones. The analysis of the differences in digital uses by provinces in the population as a whole allows us to verify that it is mainly due to the fact that the territories segregate the populations unequally based on other variables, such as age, educational level, family income, and sex. The different provinces have different sociodemographic and socioeconomic compositions of their populations, and these variations are what mainly explain the territorial differences. The causal models ‘punish’ the implicit redundancy in the geographical variables with lower regression coefficients, sometimes not significant. Another second reason is the limitation of the survey method to incorporate other variables that explain territorial differences, such as those related to connection infrastructure, economic wealth, or public policies, with a more evident spatial projection. However, it has been proven that the territorial differences in the levels of Internet use have much more to do with variations in age and inter-territorial study than with other variables such as connection coverage or the GPD. The spatial segregation of population is the main explanation.
This explanation is also valid in general for the seniors, although less strongly than the total population and with some nuances. The variable that mainly explains the territorial differences in the use of the Internet between the seniors is the level of studies, with a resounding role with respect to other explanatory variables. To a lesser extent, variations in rural population and mobile data coverage (LTE) are also relevant variables. This last discovery is important because it confirms that the most relevant infrastructure to favor digital uses among seniors is the development of access to quality data in mobile telephony, much more than the expansion of fiber and ADSL, which are the ones that have prioritized public policies to universalize digital connection.
In summary, it is evident that the main variables that explain the low digitization of seniors are education, age, and income. The geographical differences largely depend on the spatial distribution of the senior population and its characteristics in terms of age, studies, and income. That is primarily why they are more present in rural areas and provinces with a low demographic density and less urbanized, in which there is an older population, with less income and a lower level of education.
If the main reason behind the differences found by age is differences in socialization between generational groups [
6], it is likely that these differences will diminish in the future. It is highly likely that a lack of interest and absence of a social presence [
11,
17,
23] is related to generational socialization, along with the self-perception of low skills [
5].
The lower education level of seniors is a generational characteristic, which could perhaps also ease over time to the extent that access to education has been more widespread for younger generations. However, the education variable, despite weighing less in the population as a whole, is very important in it, establishing differences in digital uses and skills among the younger generations [
42]. We must also consider the great persistence of the effect of variables such as age and income [
43].
What we do not find in this study, despite the large sample size and our exploiting of the advantages of the extensive sample size, is confirmation of the diversity within the seniors’ group, in terms of digitization, as referred to by other authors. [
17,
20]. There are hardly any segments with digitization levels above the mean for the Spanish population as a whole, and these segments are among the seniors who are very much in the minority: seniors with a university education or with family incomes of over €3000 per month, basically. We can confirm in this regard that there is a relative diversity, but digitization levels clearly below the population mean generally predominate. The main segmentation shows differences between low and very low digitization levels, and these differences relate to the most explanatory variables: education, age, and income. What can be seen is the very low digitization of the low education level segments in general and those over 75 years of age, also in general, with some exceptions. This incredibly low digitization does contrast with other segments that are close to the mean but do not reach it.
The digitally excluded (do not use the Internet and do not have digital skills) among seniors represent 54.9%. Seniors comprise a large majority of all the excluded in the population as a whole since they account for 86.3% of the total number of excluded people in Spain. With these figures, we can confirm that in Spain, digital exclusion as a phenomenon is almost entirely exclusive to seniors, affecting more than half of this group. The determining variables of this exclusion are mainly education and age, followed at a lower level by income, and rural residence. The impacts of education and age are very similar when explaining exclusion. Income and rural residence emerge as secondary variables, both also significant.
We do not know to what extent this situation of low digitization of the elderly will ease over time when future cohorts of the seniors have more studies, or whether it will continue or increase when future technological applications require new learning. But it is very worrying because the Internet and digital media are increasingly the gateway to services and benefits and not using them places seniors at a disadvantage in terms of their social status. A greater awareness of ageism and homophilic prejudices in the design of applications and devices, a greater knowledge and concern for the difficulties of seniors, and the promotion of intergenerational learning strategies could contribute to reducing or closing this digital divide. As regards this, studies conducted on intergenerational digital learning programs, from grandchildren to grandparents, demonstrate the success of such programs [
44,
45,
46]. They all demonstrate success in the digital learning of the elderly and some significant changes of perception and attitude toward the elderly by younger people, such as children [
46] and students [
47] are also appreciated.
It is necessary to act to increase the digitization of seniors, which is excessively low and unequal.


