
Quantifying Dynamic Coupling Coordination Degree of Human–Environmental Interactions during Urban–Rural Land Transitions of China


Abstract
:1. Introduction
2. Study Area and Materials
2.1. Study Area
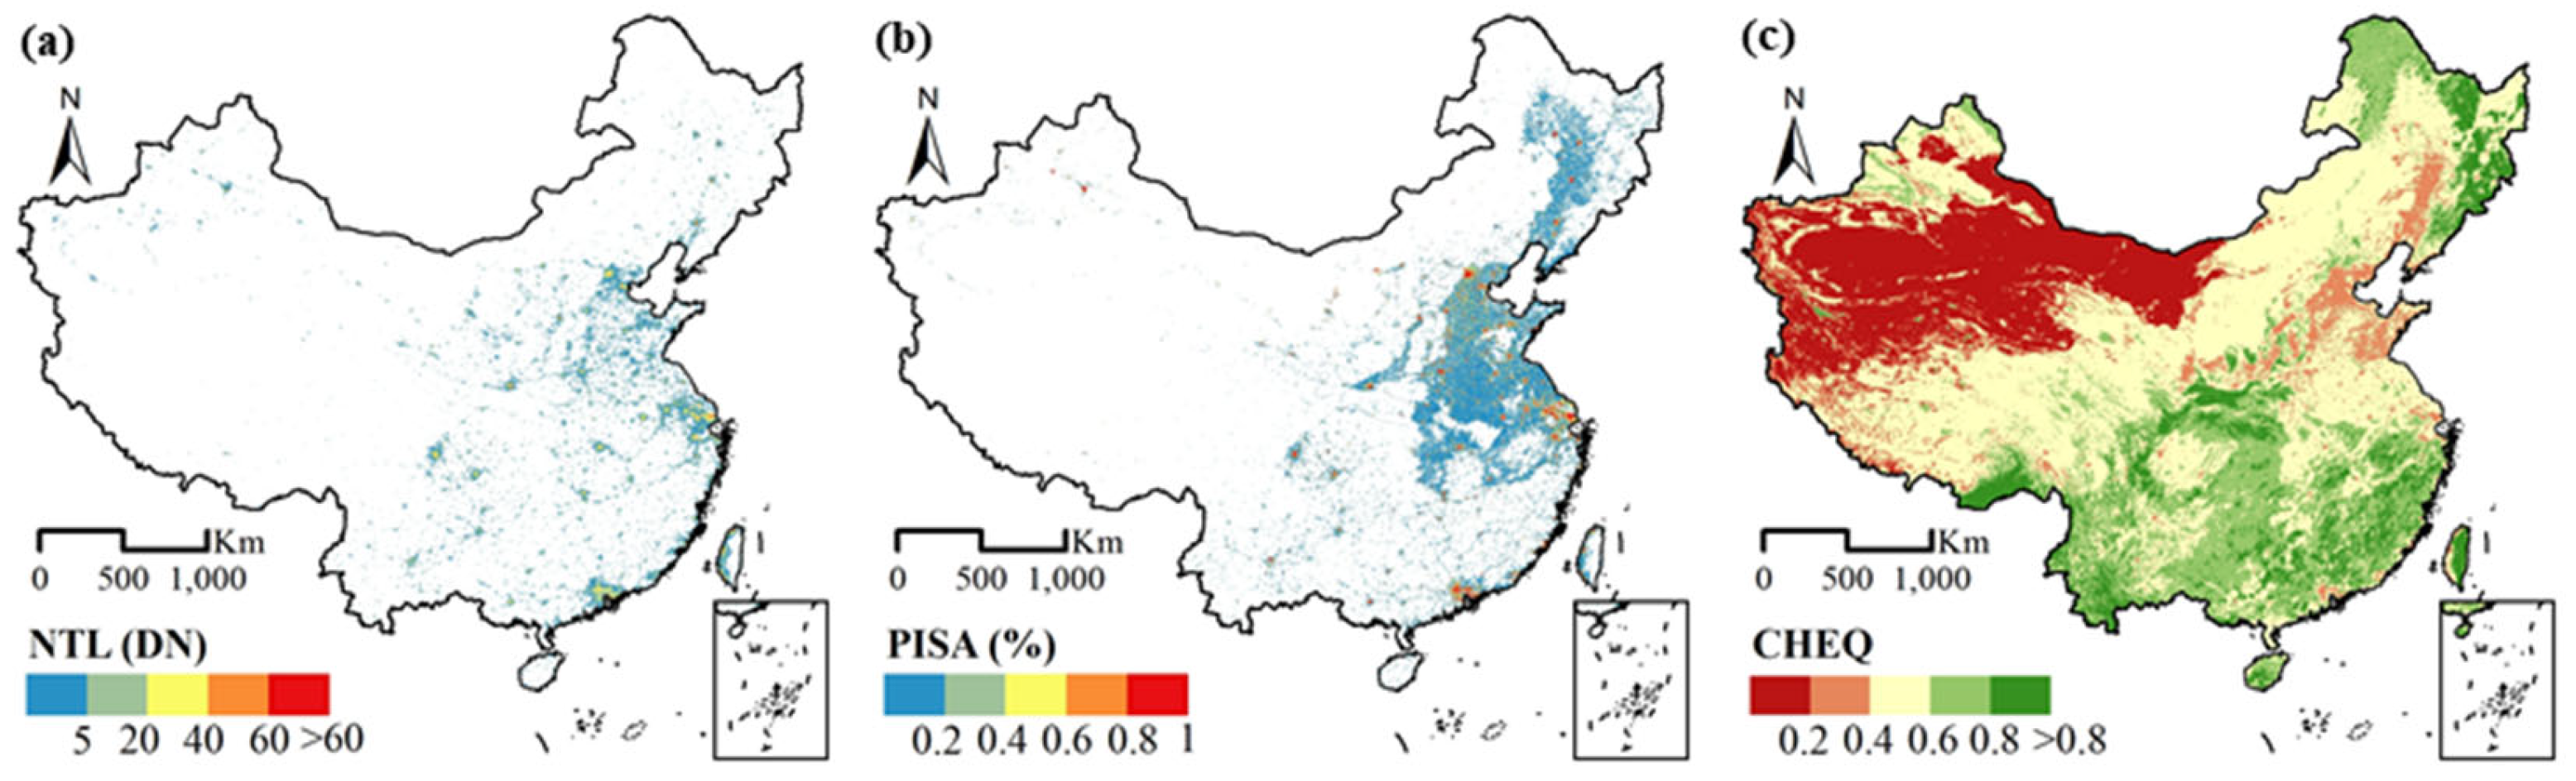
2.2. Materials
3. Methods
3.1. Identifying Urban–Rural Land Transitions
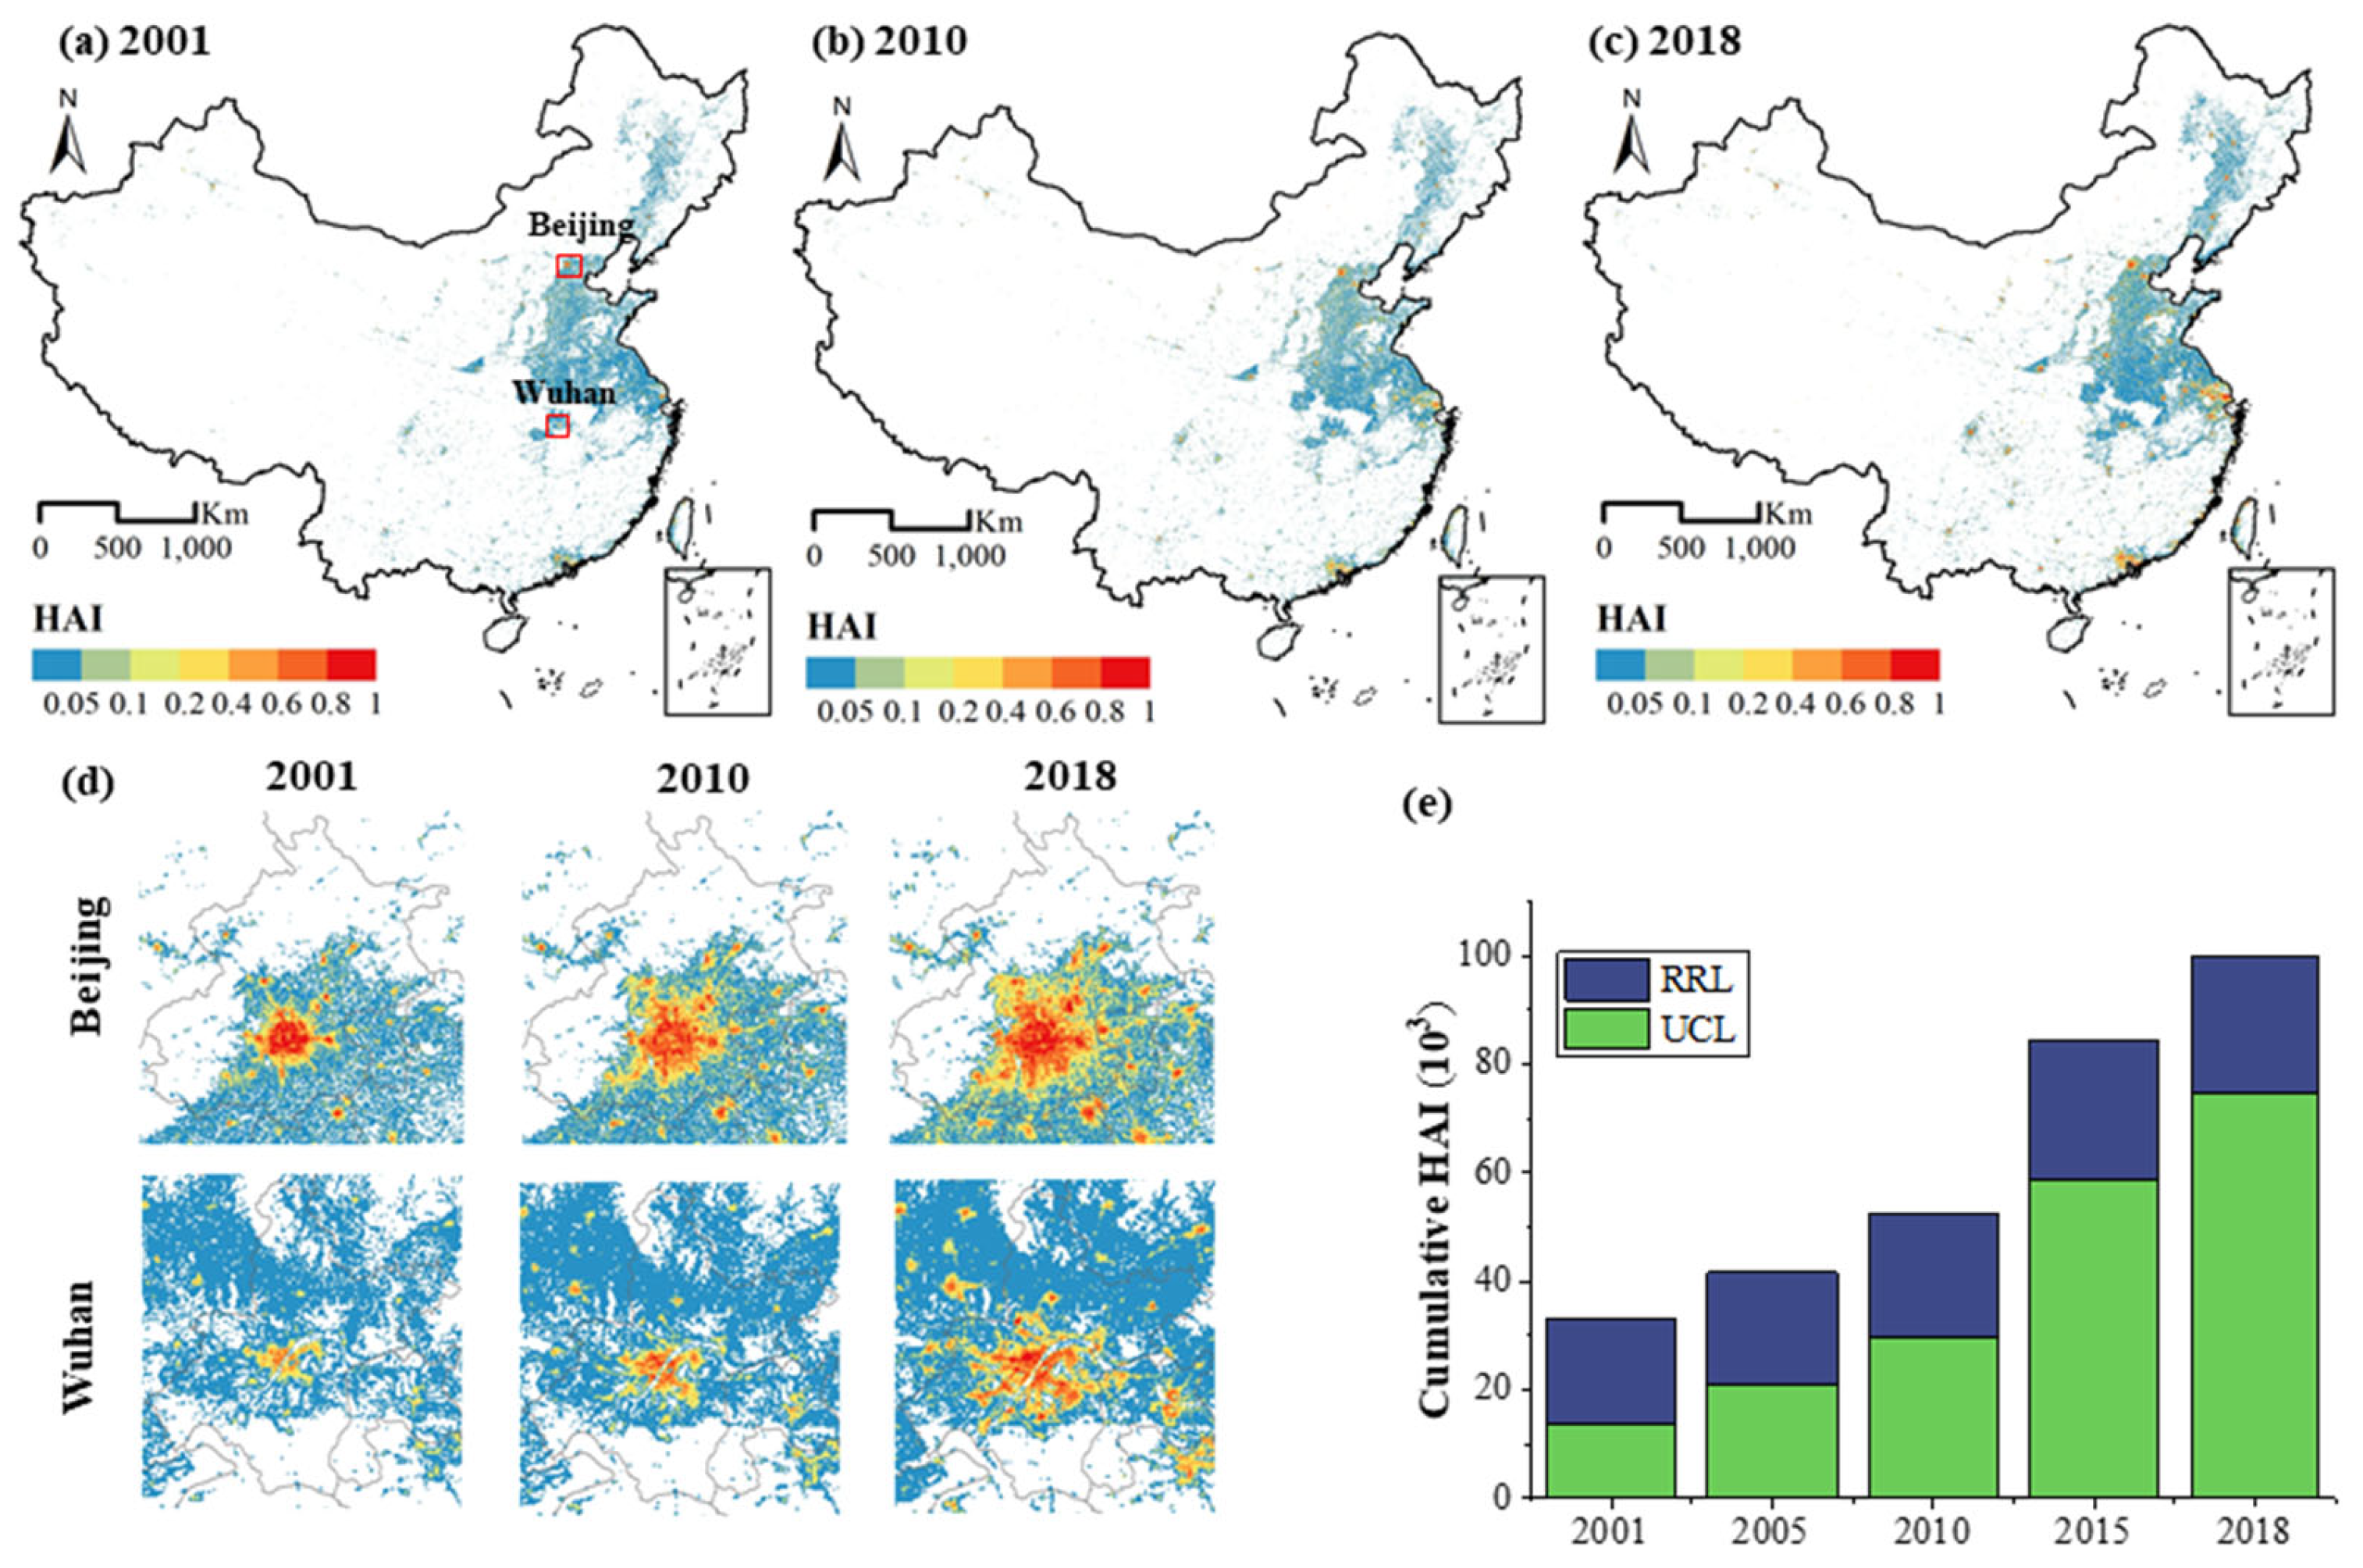
3.2. Human Activity Intensity Assessment
3.3. Coupling Coordination Degree Model
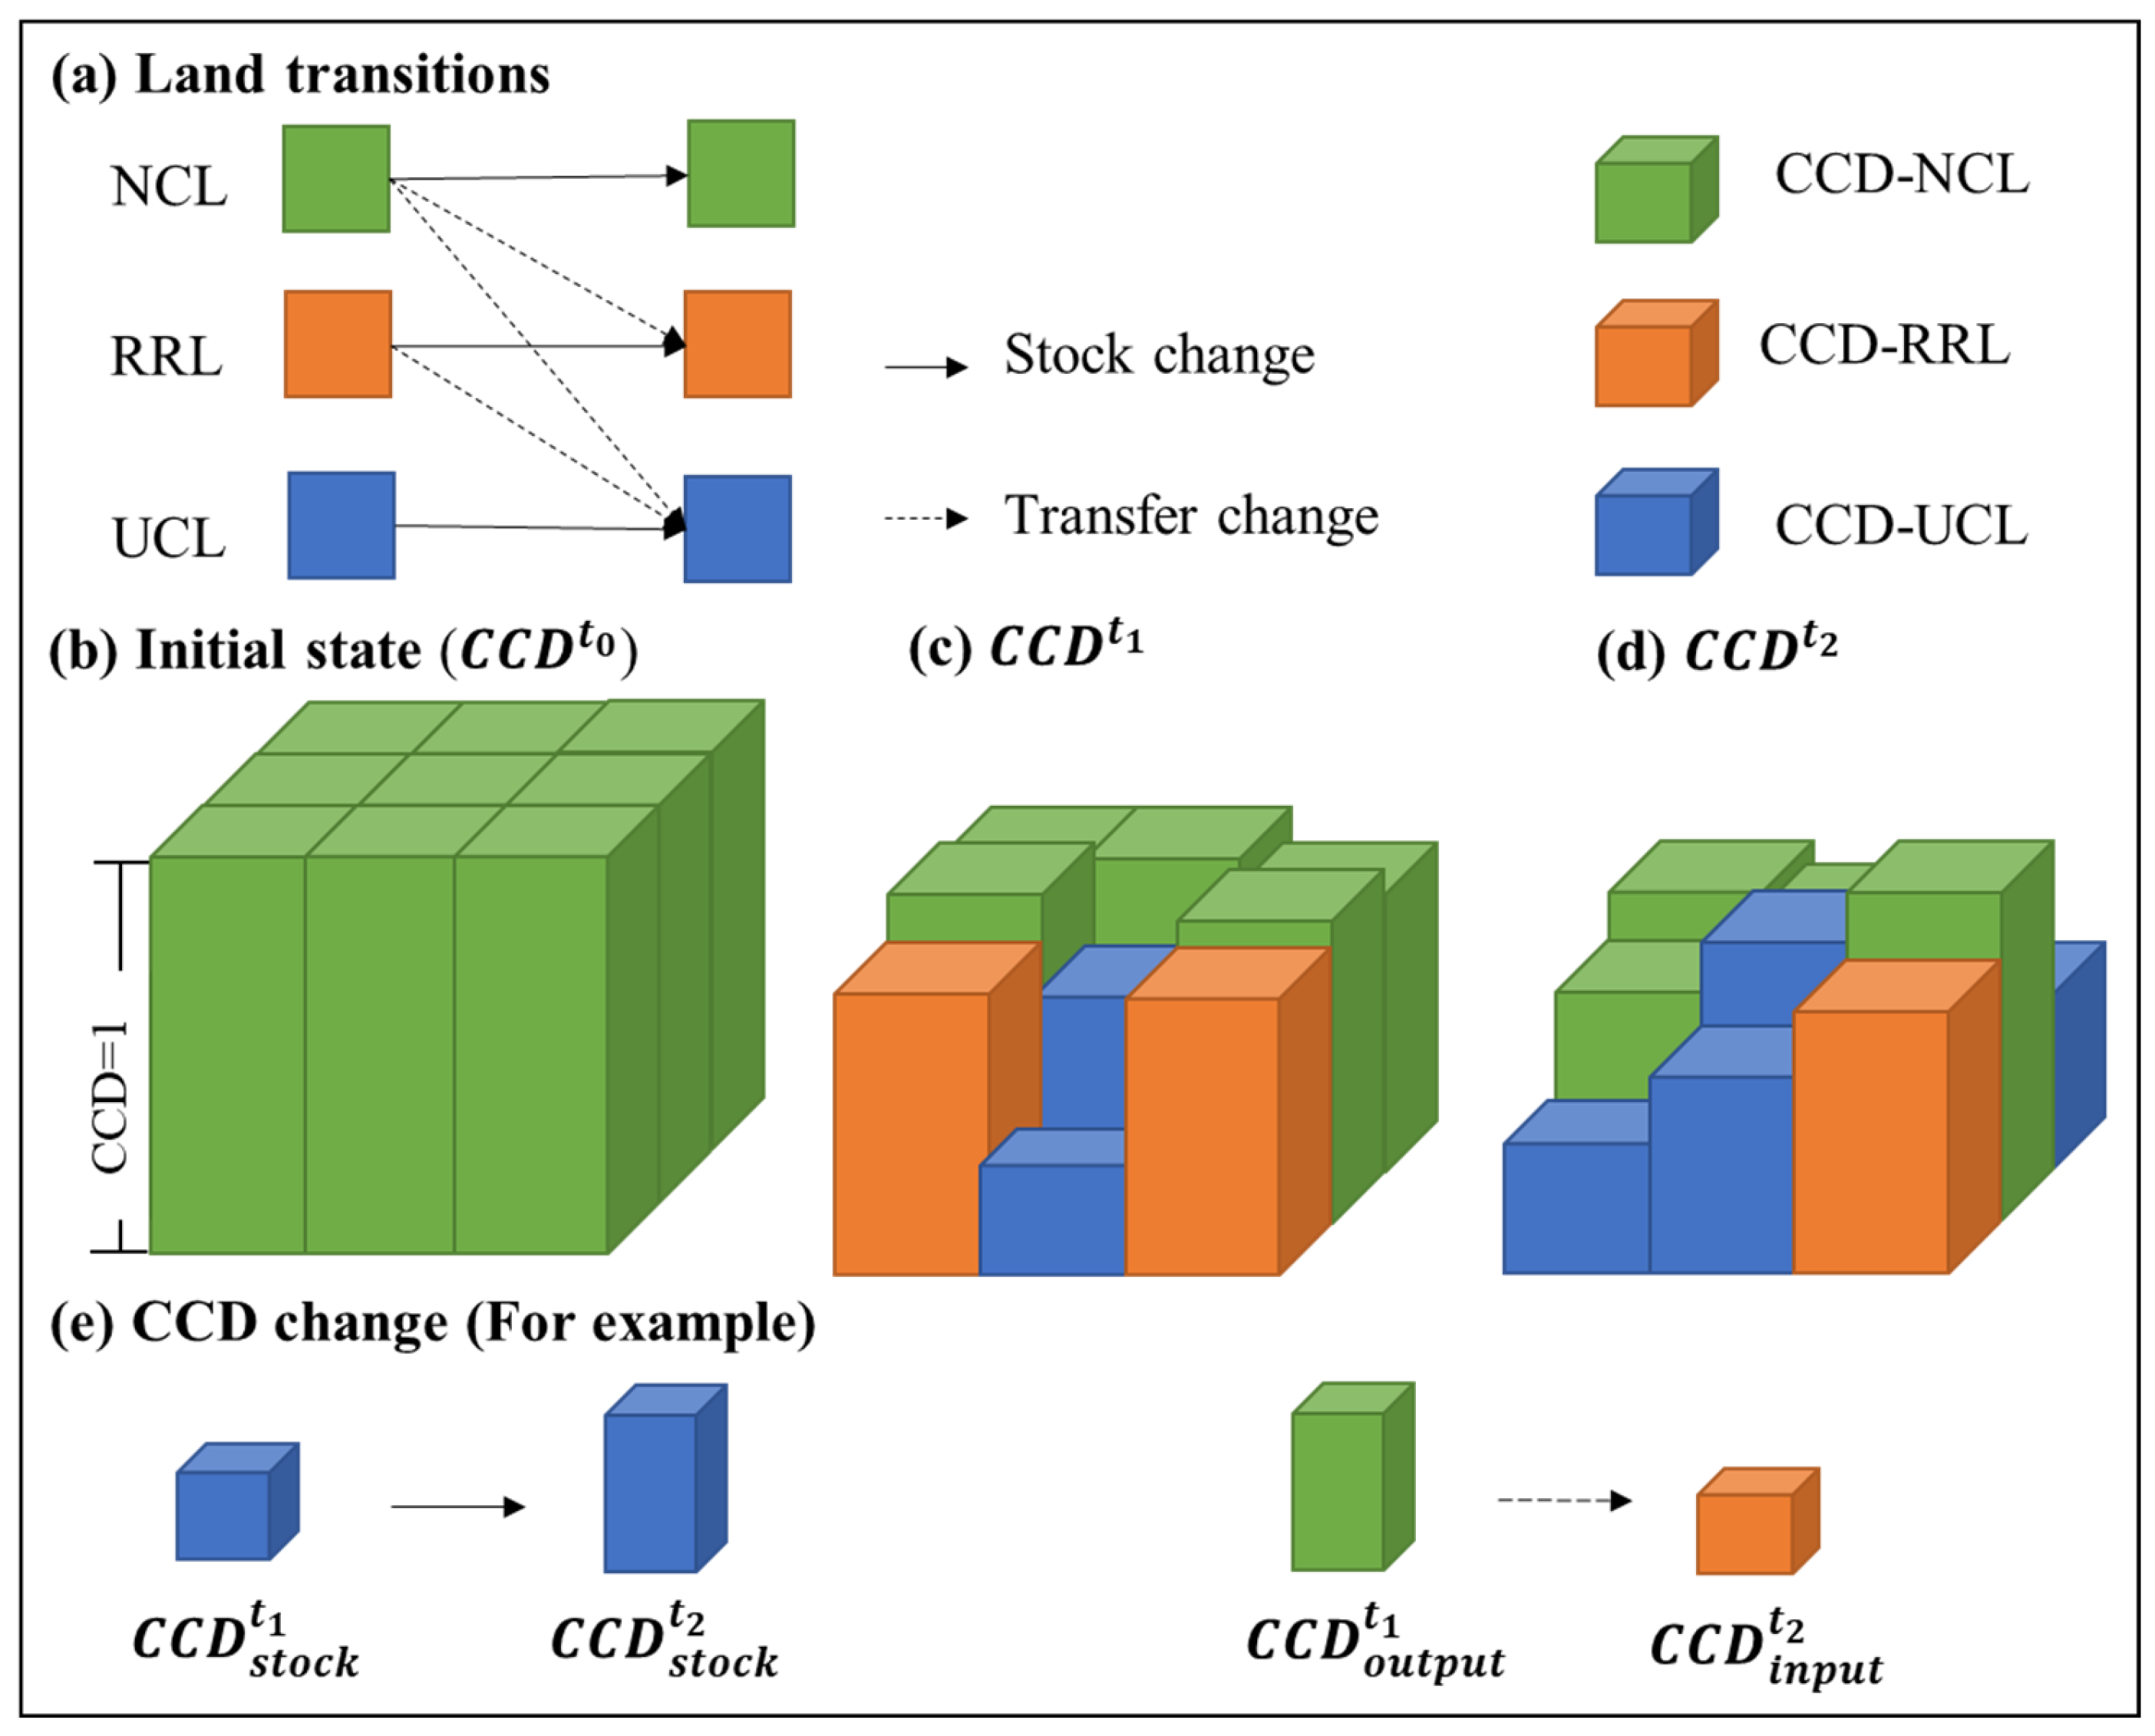
3.4. The CCD Transfer Model
4. Results
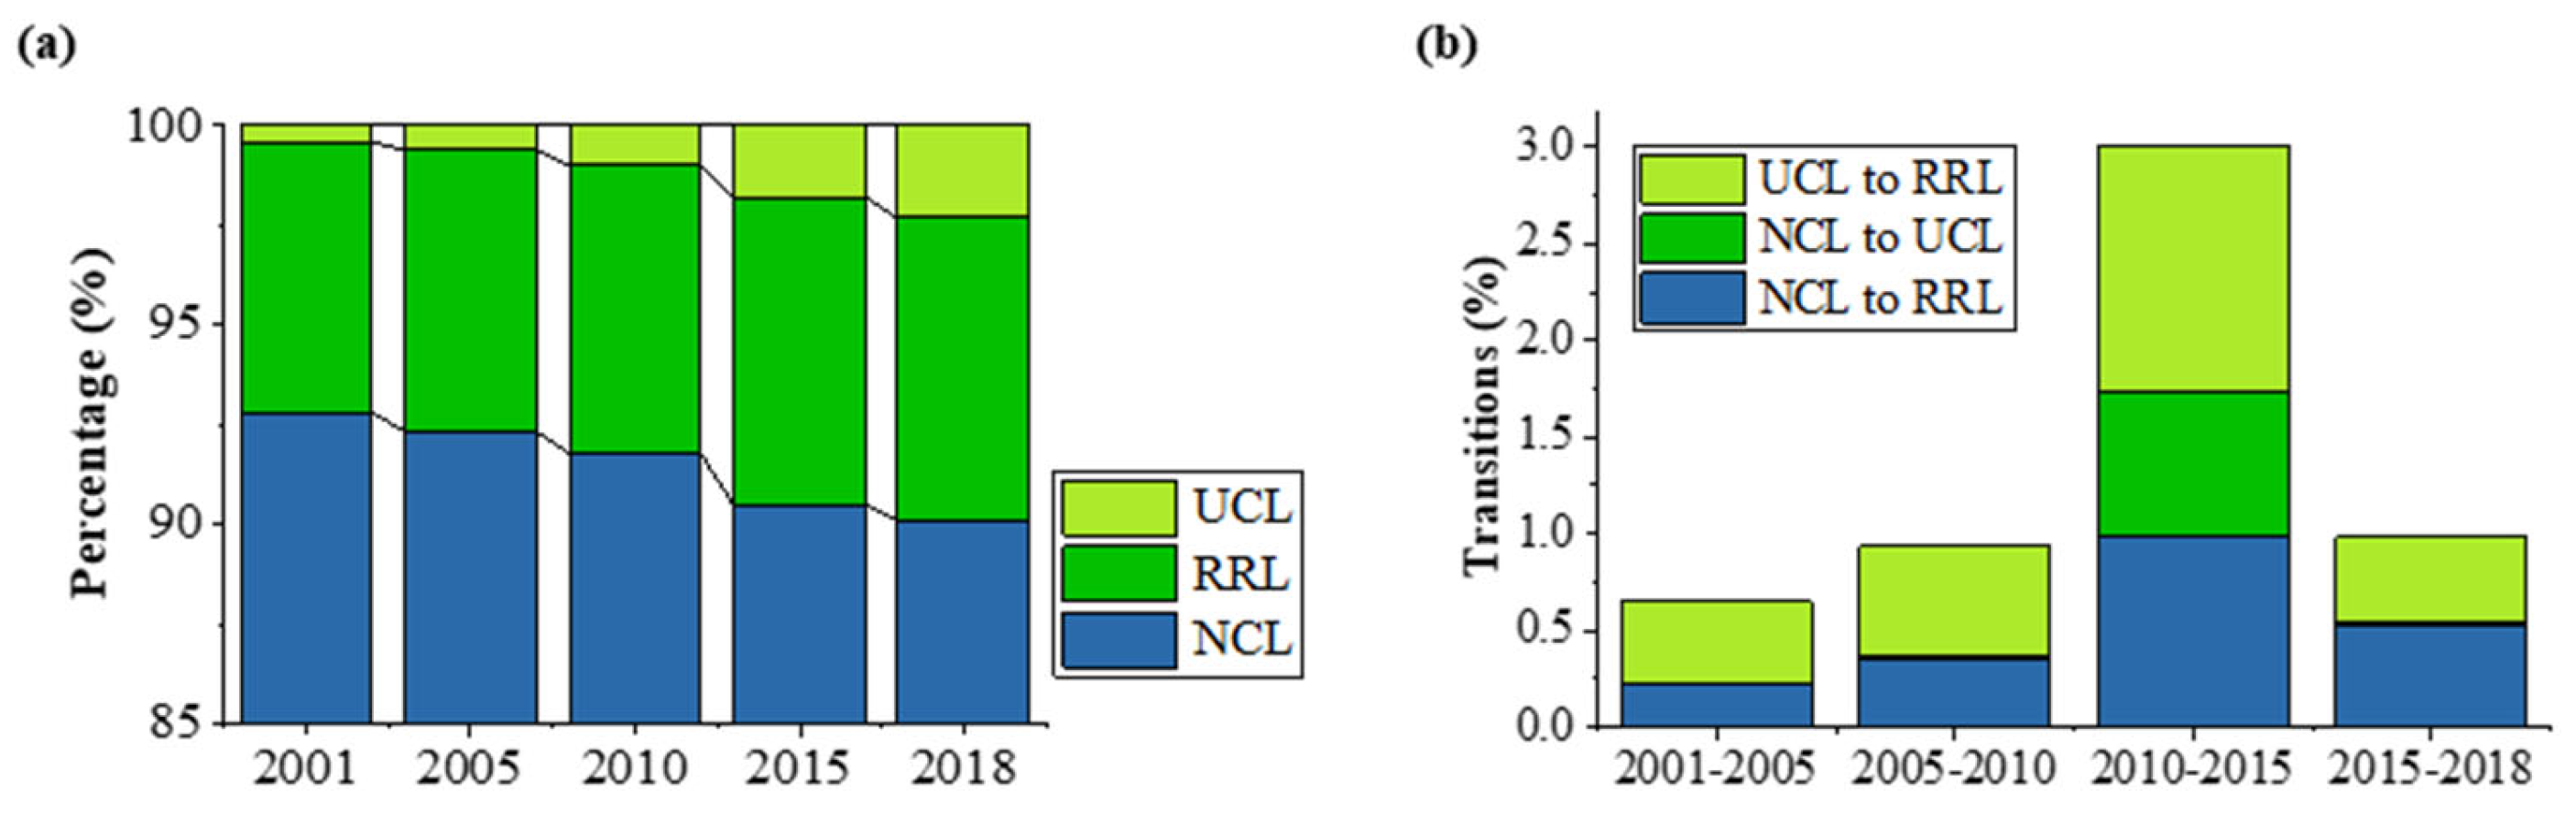
4.1. Land Transitions and Human Activity Intensity
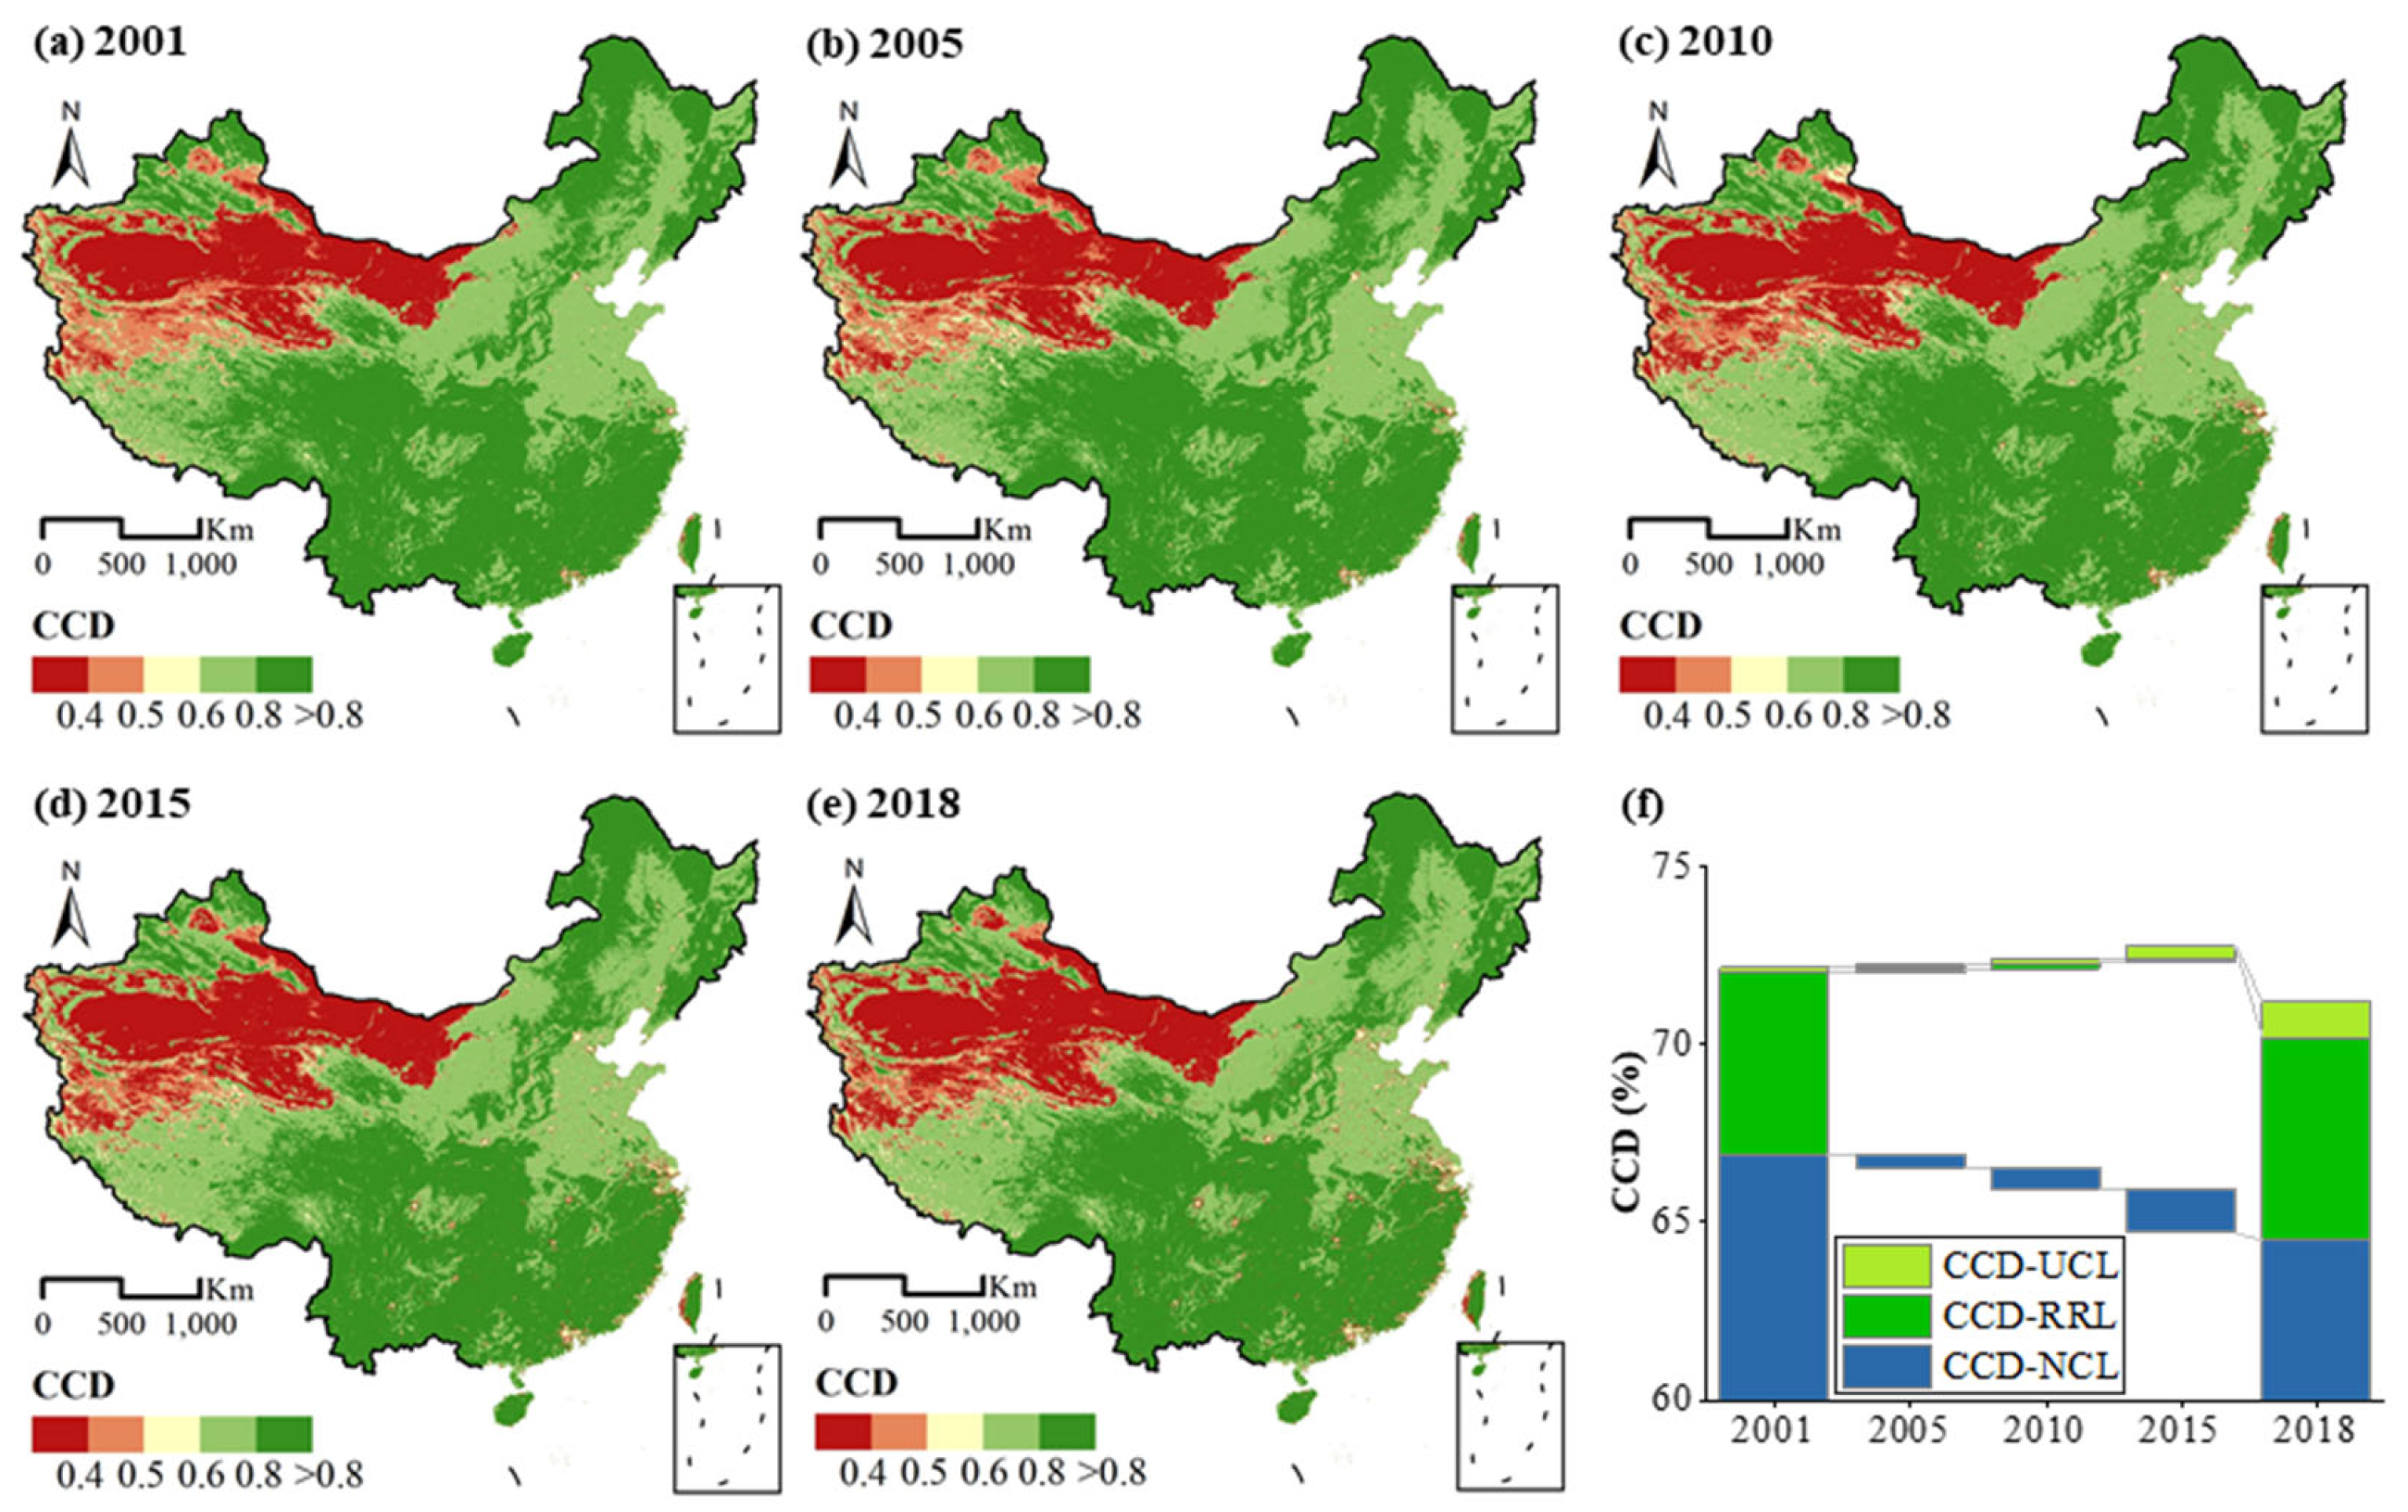
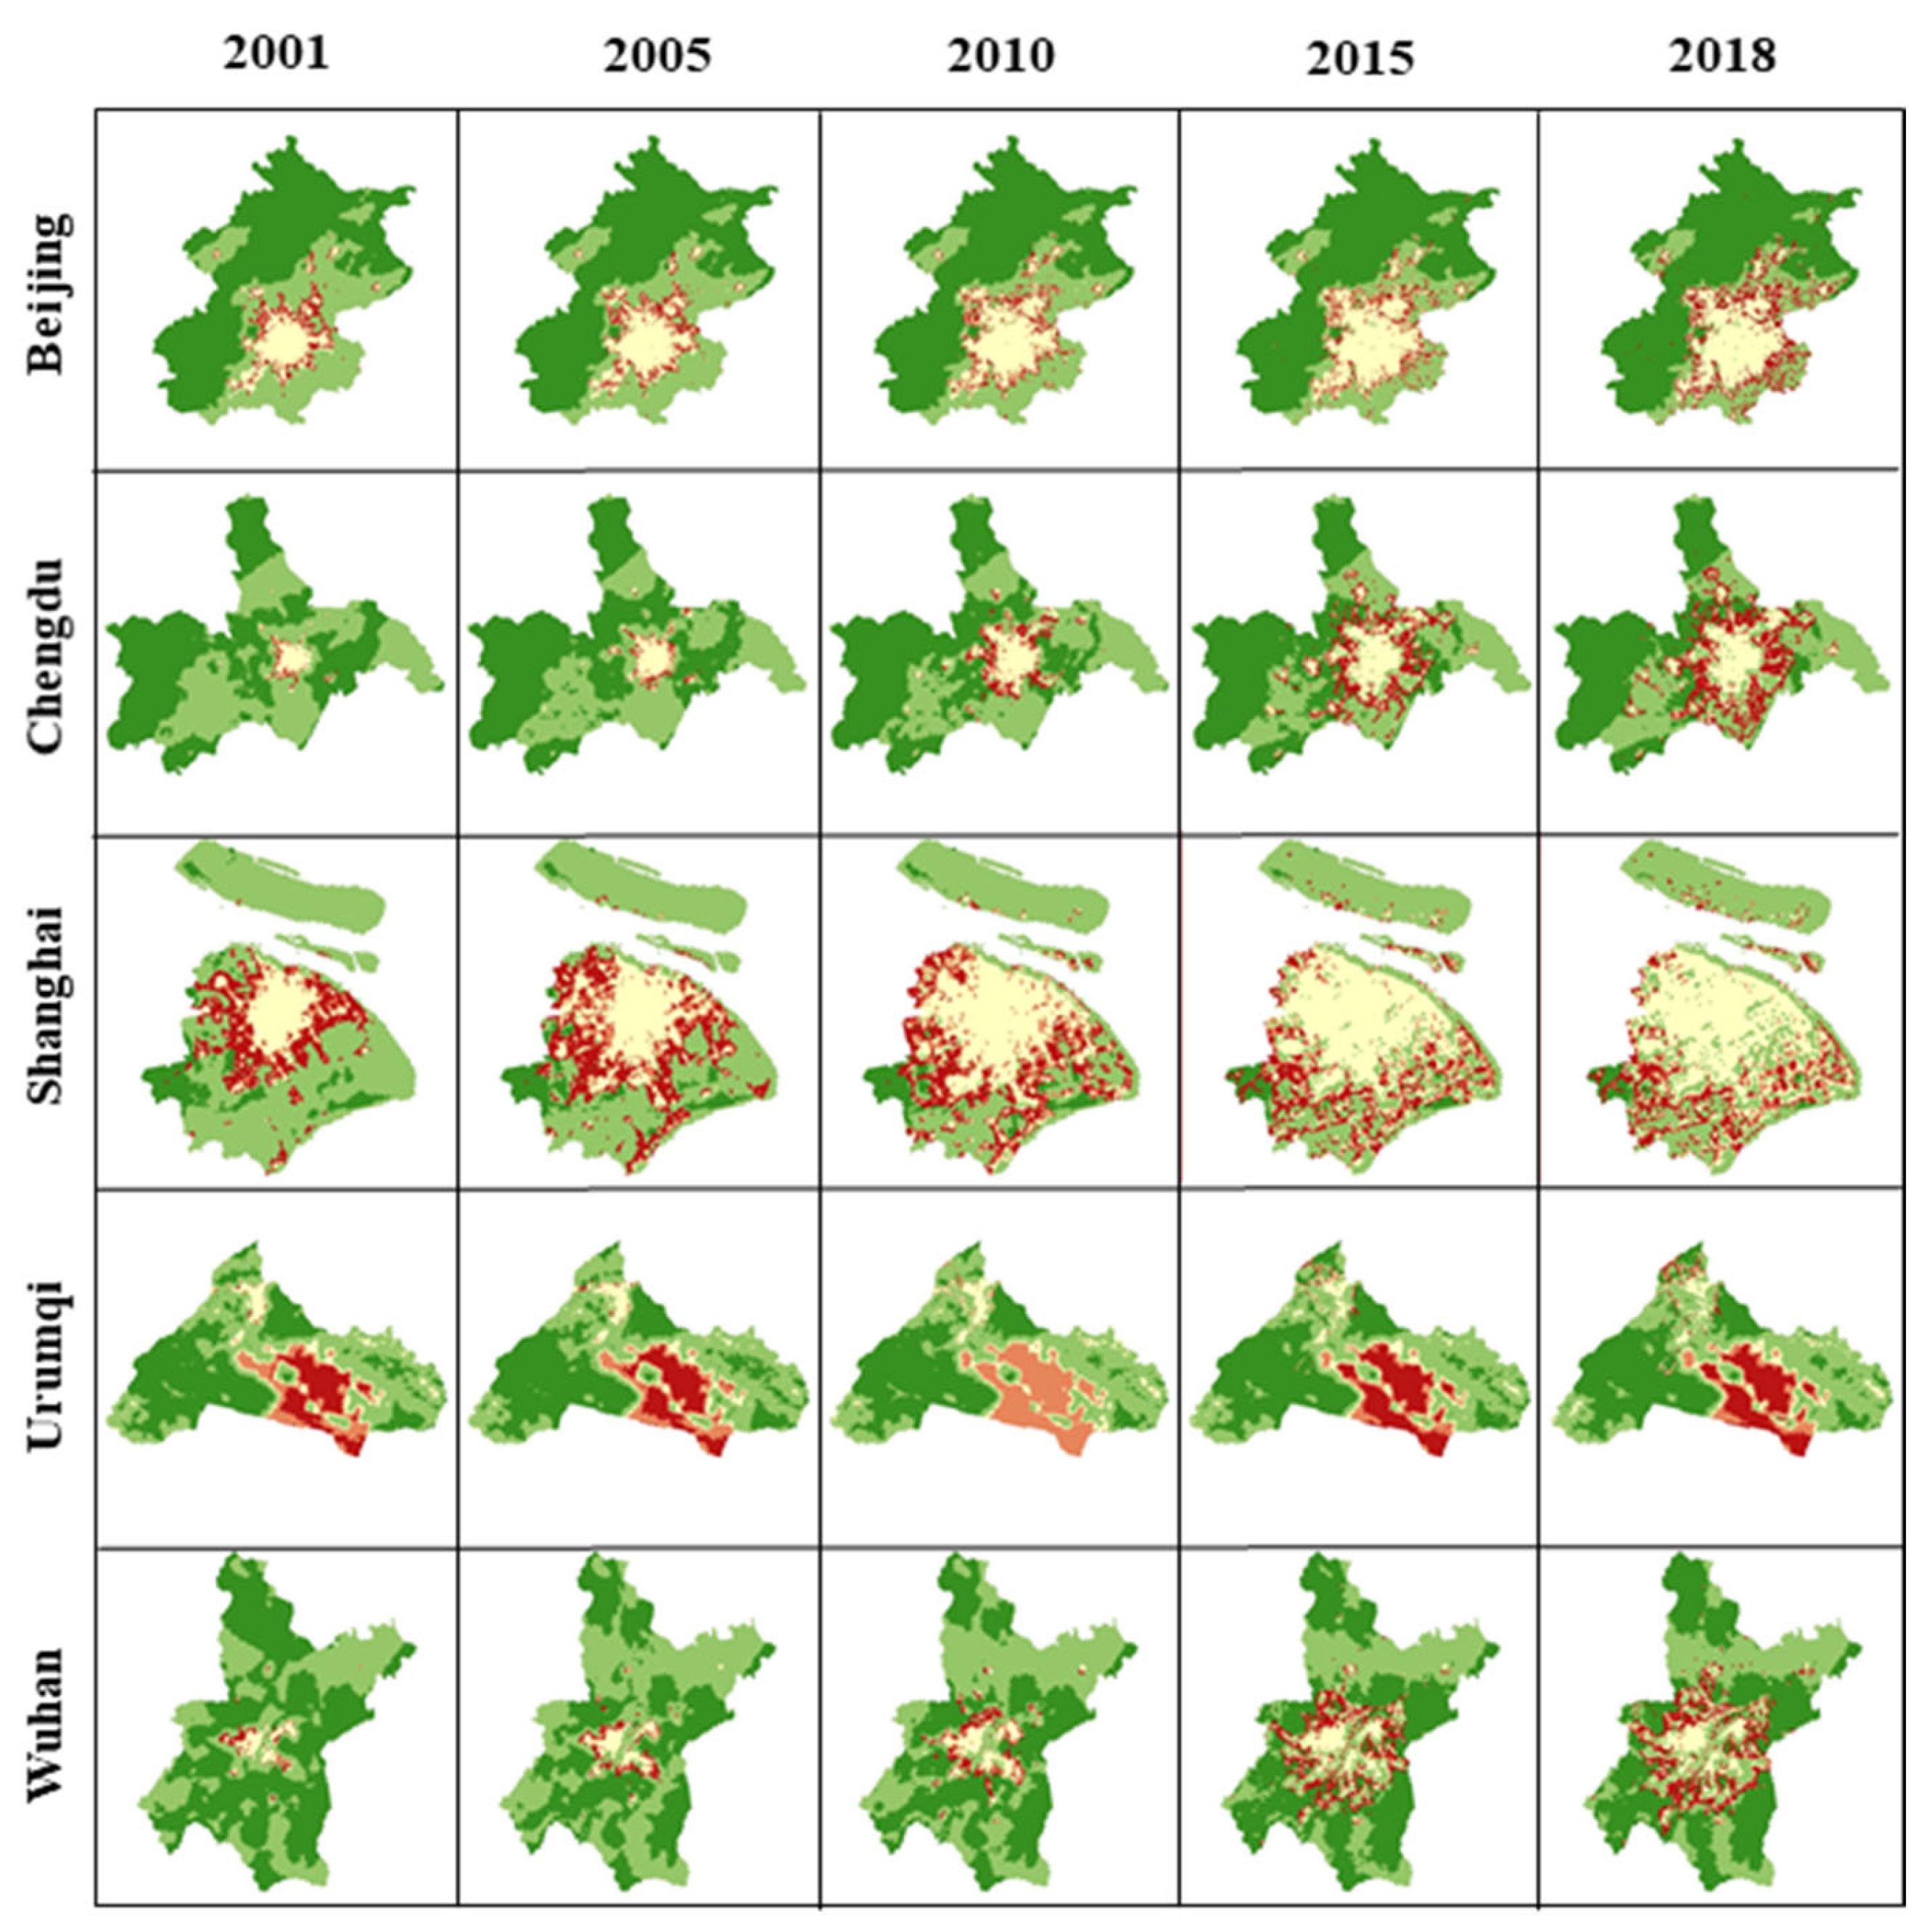
4.2. The Spatial–Temporal Pattern of CCD
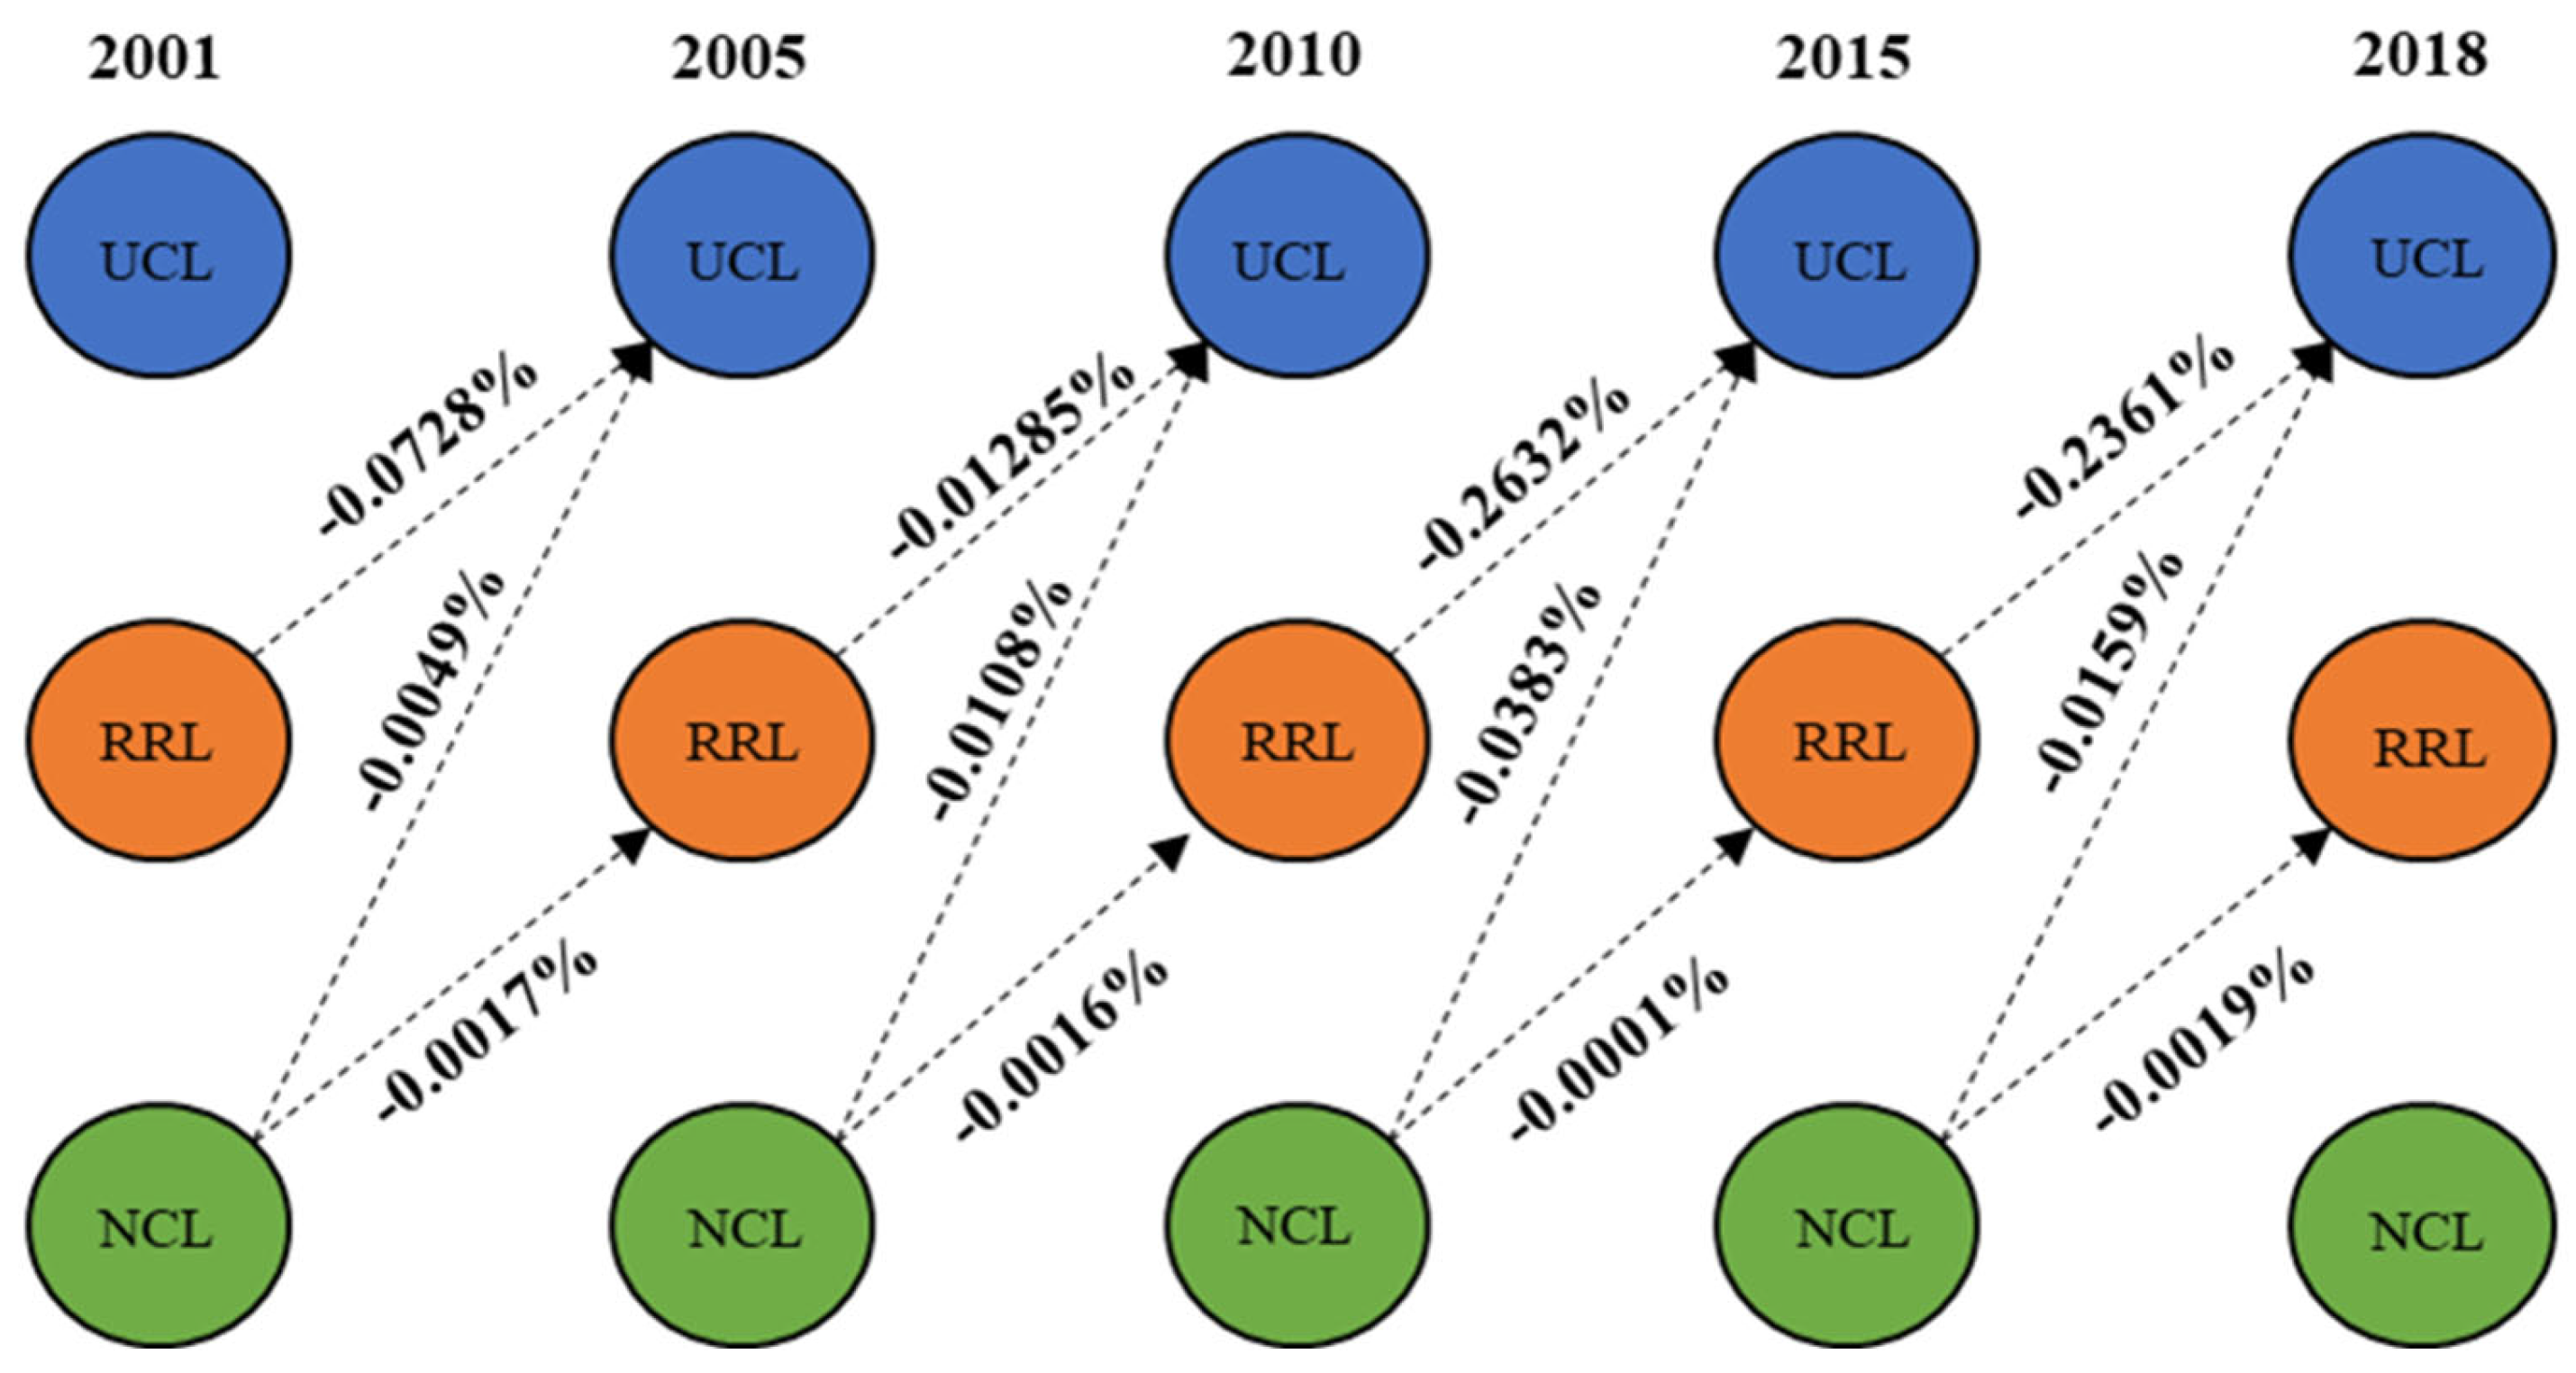
4.3. Quantifying the Transfer Process of CCD
5. Discussion
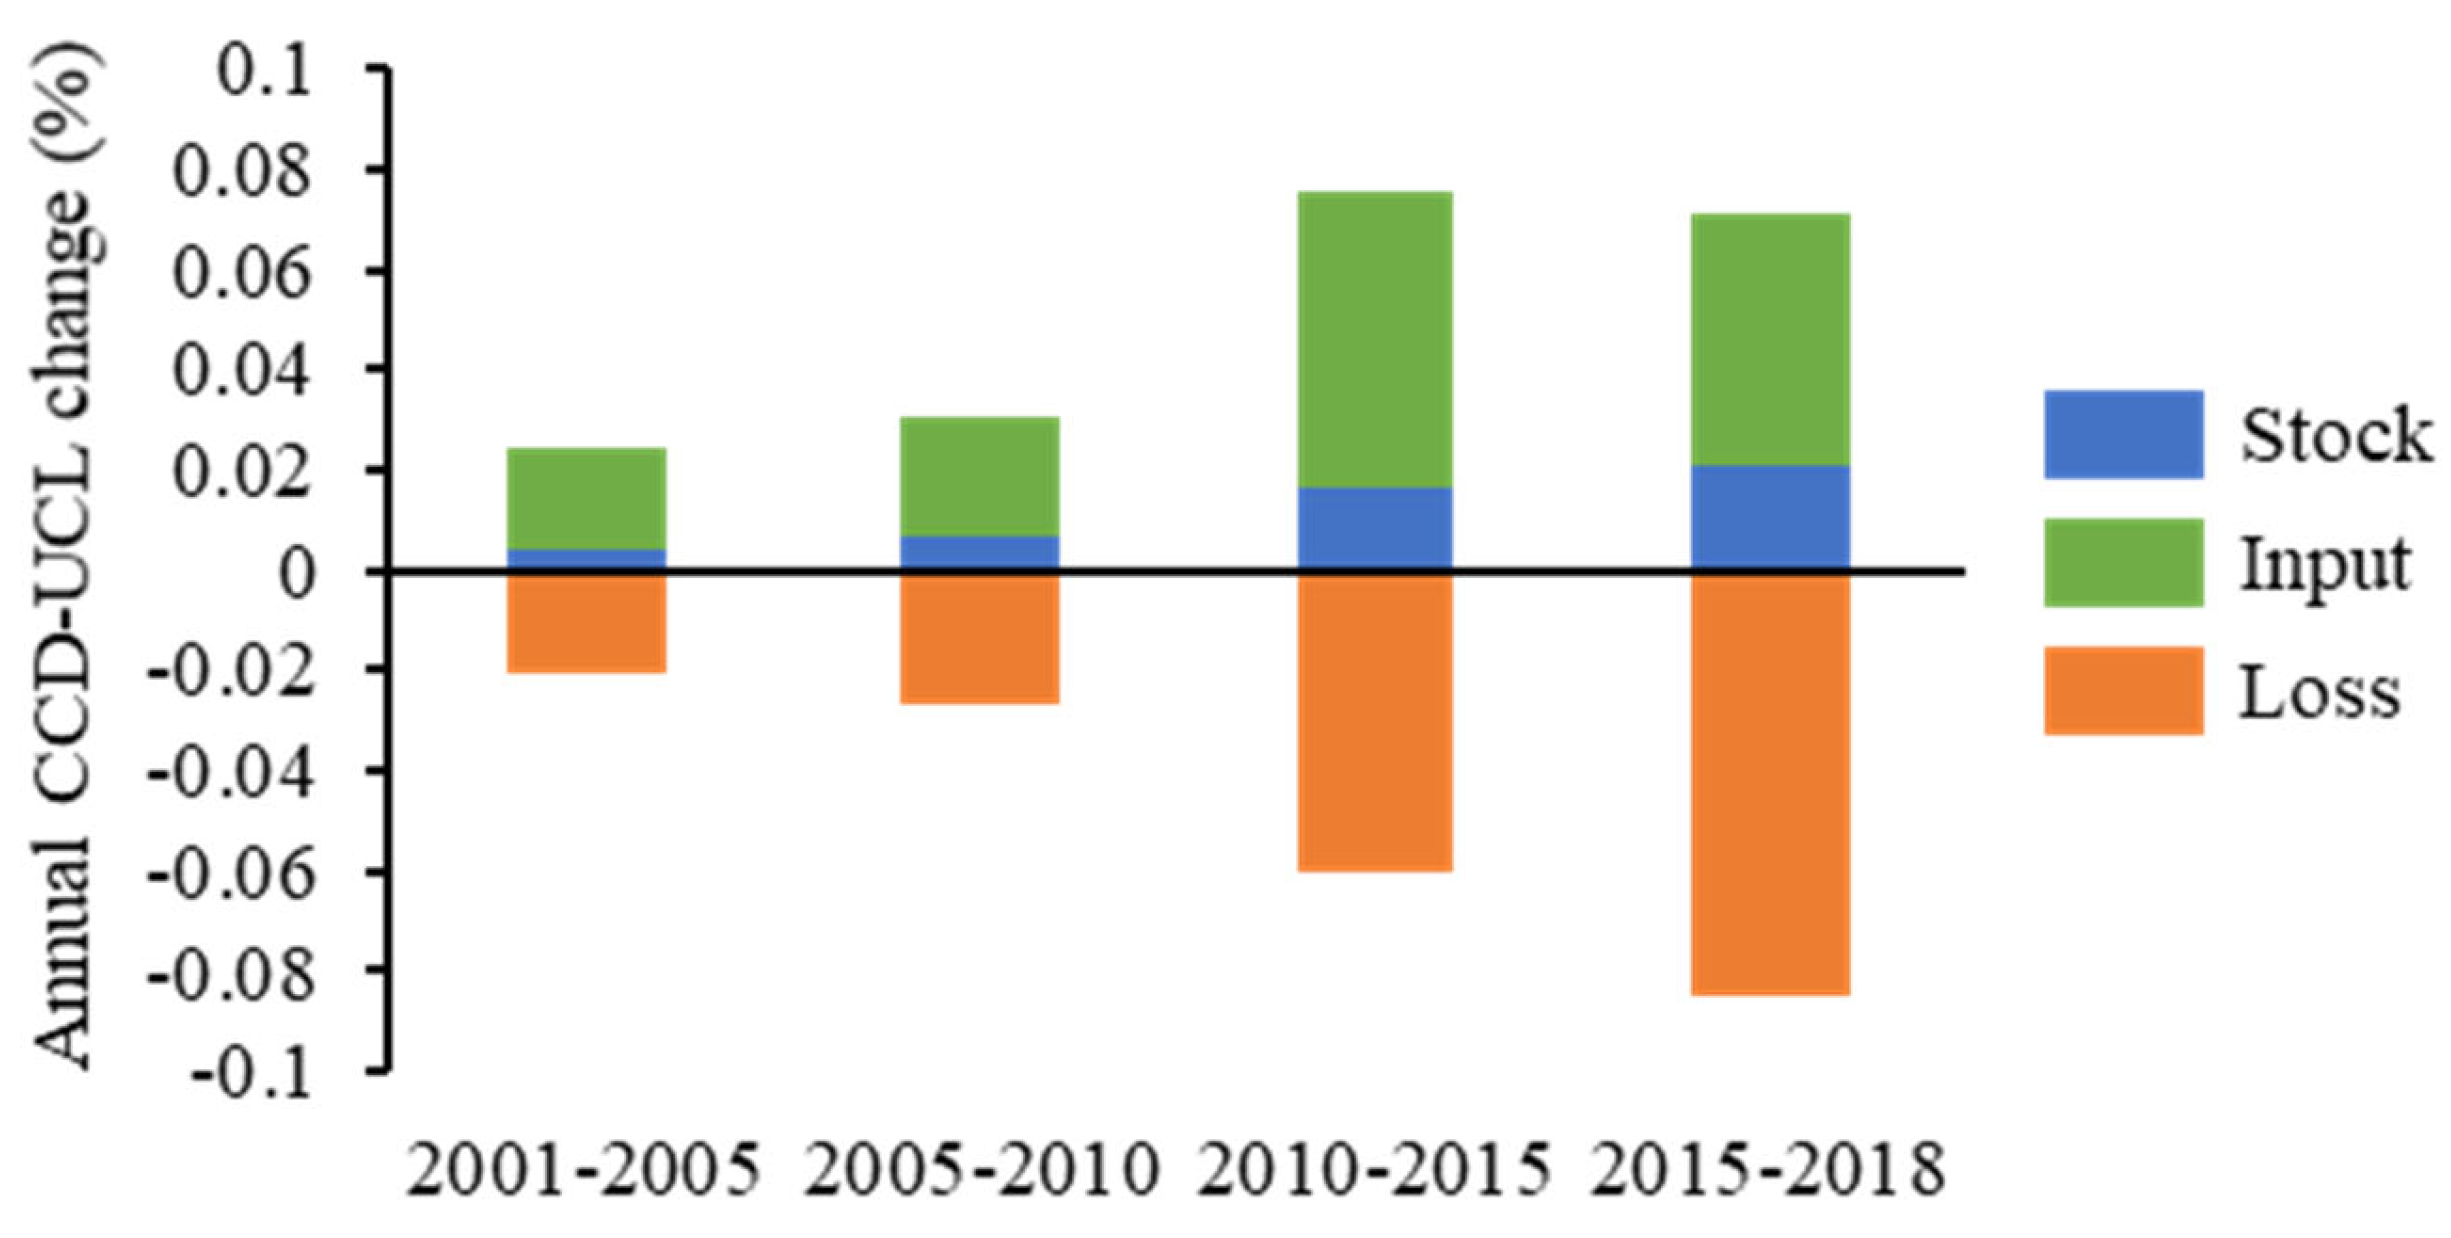
5.1. Changes and Losses of CCD Related to UCL
5.2. Sustainable Development Strategies
5.3. Future Work
6. Conclusions
Author Contributions
Funding
Institutional Review Board Statement
Informed Consent Statement
Data Availability Statement
Conflicts of Interest
References
- Liu, J.; Dietz, T.; Carpenter, S.R.; Alberti, M.; Folke, C.; Moran, E.; Pell, A.N.; Deadman, P.; Kratz, T.; Lubchenco, J.; et al. Complexity of Coupled Human and Natural Systems. Science 2007, 317, 1513–1516. [Google Scholar] [CrossRef] [PubMed] [Green Version]
- Guan, X.; Wei, H.; Lu, S.; Dai, Q.; Su, H. Assessment on the Urbanization Strategy in China: Achievements, Challenges and Reflections. Habitat Int. 2018, 71, 97–109. [Google Scholar] [CrossRef]
- Wei, C.; Shenglu, Z.; Shaohua, W. Measuring Smart Land Use in Urban–Rural Regions of China: A Case Study of Pukou, Nanjing City. Growth Change 2018, 49, 189–202. [Google Scholar] [CrossRef]
- Liu, H.; Huang, B.; Yang, C. Assessing the Coordination between Economic Growth and Urban Climate Change in China from 2000 to 2015. Sci. Total Environ. 2020, 732, 139283. [Google Scholar] [CrossRef]
- Bai, X.; Shi, P.; Liu, Y. Realizing China’s Urban Dream. Nature 2014, 509, 158–160. [Google Scholar] [CrossRef] [Green Version]
- Ding, Q.; Shao, Z.; Huang, X.; Altan, O.; Zhuang, Q.; Hu, B. Monitoring, Analyzing and Predicting Urban Surface Subsidence: A Case Study of Wuhan City, China. Int. J. Appl. Earth Obs. Geoinf. 2021, 102, 102422. [Google Scholar] [CrossRef]
- Li, Z.; Shi, P.; Chen, J.; Toshiaki, I. Human Activity Intensity of Land Surface: Concept, Methods and Application in China. J. Geogr. Sci. 2016, 26, 1349–1361. [Google Scholar] [CrossRef]
- Liu, L.; Fang, X.; Wu, J. How Does the Local-Scale Relationship between Ecosystem Services and Human Wellbeing Vary across Broad Regions? Sci. Total Environ. 2021, 816, 151493. [Google Scholar] [CrossRef]
- Wang, S.; Fu, B.; Zhao, W.; Liu, Y.; Wei, F. Structure, Function, and Dynamic Mechanisms of Coupled Human–Natural Systems. Curr. Opin. Environ. Sustain. 2018, 33, 87–91. [Google Scholar] [CrossRef]
- Yang, Y.; Bao, W.; Wang, Y.; Liu, Y. Measurement of Urban-Rural Integration Level and Its Spatial Differentiation in China in the New Century. Habitat Int. 2021, 117, 102420. [Google Scholar] [CrossRef]
- van Vliet, J.; Birch-Thomsen, T.; Gallardo, M.; Hemerijckx, L.M.; Hersperger, A.M.; Li, M.; Tumwesigye, S.; Twongyirwe, R.; van Rompaey, A. Bridging the Rural-Urban Dichotomy in Land Use Science. J. Land Use Sci. 2020, 15, 585–591. [Google Scholar] [CrossRef]
- Yang, Y.; Liu, Y.; Li, Y.; Du, G. Quantifying Spatio-Temporal Patterns of Urban Expansion in Beijing during 1985–2013 with Rural-Urban Development Transformation. Land Use Policy 2018, 74, 220–230. [Google Scholar] [CrossRef]
- Qu, Y.; Long, H. The Economic and Environmental Effects of Land Use Transitions under Rapid Urbanization and the Implications for Land Use Management. Habitat Int. 2018, 82, 113–121. [Google Scholar] [CrossRef]
- Yanbo, Q.; Guanghui, J.; Yaya, T.; Shang, R.; Shuwen, W.; Yuling, L. Urban–Rural Construction Land Transition(URCLT) in Shandong Province of China: Features Measurement and Mechanism Exploration. Habitat Int. 2019, 86, 101–115. [Google Scholar] [CrossRef]
- Yang, R.; Zhang, J.; Xu, Q.; Luo, X. Urban-Rural Spatial Transformation Process and Influences from the Perspective of Land Use: A Case Study of the Pearl River Delta Region. Habitat Int. 2020, 104, 102234. [Google Scholar] [CrossRef]
- Zhu, C.; Zhang, X.; Wang, K.; Yuan, S.; Yang, L.; Skitmore, M. Urban–Rural Construction Land Transition and Its Coupling Relationship with Population Flow in China’s Urban Agglomeration Region. Cities 2020, 101, 102701. [Google Scholar] [CrossRef]
- Ferraro, P.J.; Sanchirico, J.N.; Smith, M.D. Causal Inference in Coupled Human and Natural Systems. Proc. Natl. Acad. Sci. USA 2019, 116, 5311–5318. [Google Scholar] [CrossRef] [Green Version]
- Fang, C.; Liu, H.; Wang, S. The Coupling Curve between Urbanization and the Eco-Environment: China’ s Urban Agglomeration as a Case Study. Ecol. Indic. 2021, 130, 108107. [Google Scholar] [CrossRef]
- Liu, H.; Fang, C.; Fang, K. Coupled Human and Natural Cube: A Novel Framework for Analyzing the Multiple Interactions between Humans and Nature. J. Geogr. Sci. 2020, 30, 355–377. [Google Scholar] [CrossRef]
- Tang, P.; Huang, J.; Zhou, H.; Fang, C.; Zhan, Y.; Huang, W. Local and Telecoupling Coordination Degree Model of Urbanization and the Eco-Environment Based on RS and GIS: A Case Study in the Wuhan Urban Agglomeration. Sustain. Cities Soc. 2021, 75, 103405. [Google Scholar] [CrossRef]
- Cai, B.; Shao, Z.; Fang, S.; Huang, X.; Huq, M.E.; Tang, Y.; Li, Y.; Zhuang, Q. Finer-Scale Spatiotemporal Coupling Coordination Model between Socioeconomic Activity and Eco-Environment: A Case Study of Beijing, China. Ecol. Indic. 2021, 131, 108165. [Google Scholar] [CrossRef]
- Wang, Z.; Fang, C.; Cheng, S.; Wang, J. Evolution of Coordination Degree of Eco-Economic System and Early-Warning in the Yangtze River Delta. J. Geogr. Sci. 2013, 23, 147–162. [Google Scholar] [CrossRef]
- Zuo, Y.; Shi, Y.-L.; Zhang, Y.-Z. Research on the Sustainable Development of an Economic-Energy-Environment (3E) System Based on System Dynamics (SD): A Case Study of the Beijing-Tianjin-Hebei Region in China. Sustainability 2017, 9, 1727. [Google Scholar] [CrossRef] [Green Version]
- Zheng, Z.; Wu, Z.; Chen, Y.; Yang, Z.; Marinello, F. Exploration of Eco-Environment and Urbanization Changes in Coastal Zones: A Case Study in China over the Past 20 Years. Ecol. Indic. 2020, 119, 106847. [Google Scholar] [CrossRef]
- Zhao, Y.; Wang, S.; Zhou, C. Understanding the Relation between Urbanization and the Eco-Environment in China’s Yangtze River Delta Using an Improved EKC Model and Coupling Analysis. Sci. Total Environ. 2016, 571, 862–875. [Google Scholar] [CrossRef]
- Liu, Y.; Yang, L.; Jiang, W. Coupling Coordination and Spatiotemporal Dynamic Evolution between Social Economy and Water Environmental Quality—A Case Study from Nansi Lake Catchment, China. Ecol. Indic. 2020, 119, 106870. [Google Scholar] [CrossRef]
- Fang, X.; Shi, X.; Phillips, T.K.; Du, P.; Gao, W. The Coupling Coordinated Development of Urban Environment towards Sustainable Urbanization: An Empirical Study of Shandong Peninsula, China. Ecol. Indic. 2021, 129, 107864. [Google Scholar] [CrossRef]
- Liu, H.; Gong, P.; Wang, J.; Wang, X.; Ning, G.; Xu, B. Production of Global Daily Seamless Data Cubes and Quantification of Global Land Cover Change from 1985 to 2020—IMap World 1.0. Remote Sens. Environ. 2021, 258, 112364. [Google Scholar] [CrossRef]
- Gao, B.; Huang, Q.; He, C.; Ma, Q. Dynamics of Urbanization Levels in China from 1992 to 2012: Perspective from DMSP/OLS Nighttime Light Data. Remote Sens. 2015, 7, 1721–1735. [Google Scholar] [CrossRef] [Green Version]
- Zhu, Z.; Zhou, Y.; Seto, K.C.; Stokes, E.C.; Deng, C.; Pickett, S.T.A.; Taubenböck, H. Understanding an Urbanizing Planet: Strategic Directions for Remote Sensing. Remote Sens. Environ. 2019, 228, 164–182. [Google Scholar] [CrossRef]
- Ma, Q.; Wu, J.; He, C.; Hu, G. Reprint of “Spatial Scaling of Urban Impervious Surfaces across Evolving Landscapes: From Cities to Urban Regions”. Landsc. Urban Plan. 2019, 187, 132–144. [Google Scholar] [CrossRef]
- Liu, C.; Huang, X.; Zhu, Z.; Chen, H.; Tang, X.; Gong, J. Automatic Extraction of Built-up Area from ZY3 Multi-View Satellite Imagery: Analysis of 45 Global Cities. Remote Sens. Environ. 2019, 226, 51–73. [Google Scholar] [CrossRef]
- Zhu, D.; Chen, T.; Zhen, N.; Niu, R. Monitoring the Effects of Open-Pit Mining on the Eco-Environment Using a Moving Window-Based Remote Sensing Ecological Index. Environ. Sci. Pollut. Res. 2020, 27, 15716–15728. [Google Scholar] [CrossRef] [PubMed]
- Firozjaei, M.K.; Fathololoumi, S.; Weng, Q.; Kiavarz, M.; Alavipanah, S.K. Remotely Sensed Urban Surface Ecological Index (RSUSEI): An Analytical Framework for Assessing the Surface Ecological Status in Urban Environments. Remote Sens. 2020, 12, 2029. [Google Scholar] [CrossRef]
- Xu, D.; Yang, F.; Yu, L.; Zhou, Y.; Li, H.; Ma, J.; Huang, J.; Wei, J.; Xu, Y.; Zhang, C.; et al. Quantization of the Coupling Mechanism between Eco-Environmental Quality and Urbanization from Multisource Remote Sensing Data. J. Clean. Prod. 2021, 321, 128948. [Google Scholar] [CrossRef]
- Li, X.; Gong, P.; Zhou, Y.; Wang, J.; Bai, Y.; Chen, B.; Hu, T.; Xiao, Y.; Xu, B.; Yang, J.; et al. Mapping Global Urban Boundaries from the Global Artificial Impervious Area (GAIA) Data. Environ. Res. Lett. 2020, 15, 094044. [Google Scholar] [CrossRef]
- Xu, Z.; Jiao, L.; Lan, T.; Zhou, Z.; Cui, H.; Li, C.; Xu, G.; Liu, Y. Mapping Hierarchical Urban Boundaries for Global Urban Settlements. Int. J. Appl. Earth Obs. Geoinf. 2021, 103, 102480. [Google Scholar] [CrossRef]
- Liu, Y.; Zhang, X.; Kong, X.; Wang, R.; Chen, L. Identifying the Relationship between Urban Land Expansion and Human Activities in the Yangtze River Economic Belt, China. Appl. Geogr. 2018, 94, 163–177. [Google Scholar] [CrossRef]
- Chen, Y.; Chen, Z.; Xu, G.; Tian, Z. Built-up Land Efficiency in Urban China: Insights from the General Land Use Plan (2006–2020). Habitat Int. 2016, 51, 31–38. [Google Scholar] [CrossRef]
- Wei, W.; Guo, Z.; Xie, B.; Zhou, J.; Li, C. Quantitative Simulation of Socio-Economic Effects in Mainland China from 1980 to 2015: A Perspective of Environmental Interference. J. Clean. Prod. 2020, 253, 119939. [Google Scholar] [CrossRef]
- Ge, Q.; Fang, C.; Jiang, D. Geographical Missions and Coupling Ways between Human and Nature for the Beautiful China Initiative. Dili Xuebao/Acta Geogr. Sin. 2020, 75, 1109–1119. [Google Scholar] [CrossRef]
- Lu, L.; Guo, H.; Corbane, C.; Li, Q. Urban Sprawl in Provincial Capital Cities in China: Evidence from Multi-Temporal Urban Land Products Using Landsat Data. Sci. Bull. 2019, 64, 955–957. [Google Scholar] [CrossRef] [Green Version]
- Kuang, W. 70 Years of Urban Expansion across China: Trajectory, Pattern, and National Policies. Sci. Bull. 2020, 65, 1970–1974. [Google Scholar] [CrossRef]
- Chen, M.; Liang, L.; Wang, Z.; Zhang, W.; Yu, J.; Liang, Y. Geographical Thoughts on the Relationship between ‘Beautiful China’ and Land Spatial Planning. J. Geogr. Sci. 2020, 30, 705–723. [Google Scholar] [CrossRef]
- Hua, Y.-d.; Hu, K.-m.; Qiu, L.-y.; Dong, H.-a.; Ding, L.; Lo, S.-L. Exploring the Interaction Relationship between Beautiful China-SciTech Innovation Using Coupling Coordination and Predictive Analysis: A Case Study of Zhejiang; Springer: Dordrecht, The Netherlands, 2021; ISBN 0123456789. [Google Scholar]
- Zhuang, Q.; Wu, S.; Huang, X.; Kong, L.; Yan, Y.; Xiao, H.; Li, Y.; Cai, P. Monitoring the Impacts of Cultivated Land Quality on Crop Production Capacity in Arid Regions. Catena 2022, 214, 106263. [Google Scholar] [CrossRef]
- Fang, C.; Wang, Z.; Liu, H. Beautiful China Initiative: Human-Nature Harmony Theory, Evaluation Index System and Application. J. Geogr. Sci. 2020, 30, 691–704. [Google Scholar] [CrossRef]
- Chen, Z.; Yu, B.; Yang, C.; Zhou, Y.; Yao, S.; Qian, X.; Wang, C.; Wu, B.; Wu, J. An Extended Time Series (2000–2018) of Global NPP-VIIRS-like Nighttime Light Data from a Cross-Sensor Calibration. Earth Syst. Sci. Data 2021, 13, 889–906. [Google Scholar] [CrossRef]
- Gong, P.; Li, X.; Wang, J.; Bai, Y.; Chen, B.; Hu, T.; Liu, X.; Xu, B.; Yang, J.; Zhang, W.; et al. Annual Maps of Global Artificial Impervious Area (GAIA) between 1985 and 2018. Remote Sens. Environ. 2020, 236, 111510. [Google Scholar] [CrossRef]
- Xu, H.; Wang, M.; Shi, T.; Guan, H.; Fang, C.; Lin, Z. Prediction of Ecological Effects of Potential Population and Impervious Surface Increases Using a Remote Sensing Based Ecological Index (RSEI). Ecol. Indic. 2018, 93, 730–740. [Google Scholar] [CrossRef]
- Liang, X.; Ji, X.; Guo, N.; Meng, L. Assessment of Urban Heat Islands for Land Use Based on Urban Planning: A Case Study in the Main Urban Area of Xuzhou City, China. Environ. Earth Sci. 2021, 80, 308. [Google Scholar] [CrossRef]
- Chu, L.; Oloo, F.; Sudmanns, M.; Tiede, D.; Hölbling, D.; Blaschke, T.; Teleoaca, I. Monitoring Long-Term Shoreline Dynamics and Human Activities in the Hangzhou Bay, China, Combining Daytime and Nighttime EO Data. Big Earth Data 2020, 4, 242–264. [Google Scholar] [CrossRef]
- Cheon, S.H.; Kim, J.A. Quantifying the Influence of Urban Sources on Night Light Emissions. Landsc. Urban Plan. 2020, 204, 103936. [Google Scholar] [CrossRef]
- Li, Z.; Peijun, S.; Jin, C.; Toshiaki, I. Application of Compound Night Light Index Derived from DMSP/OLS Data to Urbanization Analysis in China in the 1990s. Acta Geogr. Sin. 2003, 58, 893–902. [Google Scholar]
- Zhang, B. The Dynamic Coupling Model and Its Application of Urbanization and Eco-Environment in Hexi Corridor. J. Geogr. Sci. 2005, 15, 491. [Google Scholar] [CrossRef]
- Fang, C.; Liu, H.; Li, G. International Progress and Evaluation on Interactive Coupling Effects between Urbanization and the Eco-Environment. J. Geogr. Sci. 2016, 26, 1081–1116. [Google Scholar] [CrossRef]
- Shen, L.; Huang, Y.; Huang, Z.; Lou, Y.; Ye, G.; Wong, S.W. Improved Coupling Analysis on the Coordination between Socio-Economy and Carbon Emission. Ecol. Indic. 2018, 94, 357–366. [Google Scholar] [CrossRef]


| Parameters | Dataset | Spatial Resolution | Temporal Resolution |
|---|---|---|---|
| NTL | Global NPP-VIIRS-like nighttime light data 1 | 500m | Annual |
| GAIA | Annual maps of global artificial impervious area dataset 2 | 30m | Annual |
| CHEQ | China’s historical eco-environmental quality data 3 | 1km | Annual |
| Land Transition | 2001–2005 | 2005–2010 | 2010–2015 | 2015–2018 | |
|---|---|---|---|---|---|
| CCD−NCL | NCL to NCL | −0.04% | −0.15% | −0.22% | 0.08% |
| NCL to UCL | −0.01% | −0.01% | −0.05% | −0.02% | |
| NCL to RRL | −0.32% | −0.43% | −0.96% | −0.29% | |
| CCD−RRL | RRL to RRL | −0.02% | 0.02% | 0.00% | −0.04% |
| NCL to RRL | 0.32% | 0.43% | 0.96% | 0.29% | |
| RRL to UCL | −0.15% | −0.25% | −0.55% | −0.39% | |
| CCD−UCL | UCL to UCL | 0.02% | 0.03% | 0.08% | 0.06% |
| RCL to UCL | 0.08% | 0.12% | 0.29% | 0.15% | |
| NCL to UCL | 0.00% | 0.00% | 0.01% | 0.00% |
Publisher’s Note: MDPI stays neutral with regard to jurisdictional claims in published maps and institutional affiliations. |
© 2022 by the authors. Licensee MDPI, Basel, Switzerland. This article is an open access article distributed under the terms and conditions of the Creative Commons Attribution (CC BY) license (https://creativecommons.org/licenses/by/4.0/).
Share and Cite
Cai, B.; Shao, Z.; Fang, S.; Huang, X. Quantifying Dynamic Coupling Coordination Degree of Human–Environmental Interactions during Urban–Rural Land Transitions of China. Land 2022, 11, 935. https://doi.org/10.3390/land11060935
Cai B, Shao Z, Fang S, Huang X. Quantifying Dynamic Coupling Coordination Degree of Human–Environmental Interactions during Urban–Rural Land Transitions of China. Land. 2022; 11(6):935. https://doi.org/10.3390/land11060935
Chicago/Turabian StyleCai, Bowen, Zhenfeng Shao, Shenghui Fang, and Xiao Huang. 2022. "Quantifying Dynamic Coupling Coordination Degree of Human–Environmental Interactions during Urban–Rural Land Transitions of China" Land 11, no. 6: 935. https://doi.org/10.3390/land11060935