Article

Impacts of Historical Land Use Changes on Ecosystem Services in Guangdong Province, China

1
Ningbo Institute of Surveying, Mapping and Remote Sensing, Ningbo 315042, China
2
Ningbo Alatu Digital Technology Co., Ltd., Ningbo 315042, China
3
Yinzhou District Institute of Surveying and Mapping of Ningbo City, Ningbo 315042, China
4
School of Soil and Water Conservation, Beijing Forestry University, Beijing 100083, China
5
Key Laboratory of Land Surface Pattern and Simulation, Institute of Geographic Sciences and Natural Resources Research, Chinese Academy of Sciences, Beijing 100101, China
6
University of Chinese Academy of Sciences, Beijing 100049, China
*
Author to whom correspondence should be addressed.
Land 2022, 11(6), 809; https://doi.org/10.3390/land11060809
Submission received: 2 May 2022 / Revised: 19 May 2022 / Accepted: 27 May 2022 / Published: 30 May 2022

Abstract

:
Assessing land use change and its impacts on ecosystem services is of great significance for optimizing land use management and enhancing ecosystem sustainability. This study explores land use changes and their impacts on five typical ecosystem services, namely grain production (GP), water yield (WY), soil conservation (SC), habitat quality (HQ), and carbon sequestration (CS), during 1990–2020 using the Integrated Valuation of Ecosystem Services and Trade-offs (InVEST) model in Guangdong province, which has experienced substantial land use change. During the study period, cultivated land, forest land, grassland, water areas, built-up land, and unused land correspondingly had changed by −10.7%, −1.9%, −5.1%, 13.7%, 97.9%, and −38.8%. For ecosystem services, the GP, SC, and HQ averagely decreased by −8.66% (−12.3 t·km−2), −0.02% (−2 t·km−2), and−2.74% (−0.02), respectively, while WY and CS increased by 3.10% (22 mm) and 20.70% (515 t·km−2), respectively. Land use changes that had the greatest average negative impacts on GP, WY, SC, HQ, and CS were cultivated land to built-up land (−150.9 t·km−2), unused land to water areas (−1072 mm), grassland to unused land (−10,166 t·km−2), forest land to built-up land (−0.65), and forest land to water areas (−2974 t·km−2) respectively, and that had the greatest average positive impacts were grassland to cultivated land (78.8 t·km−2), water areas to built-up land (943 mm), unused land to forest land (3552 t·km−2), built-up land to forest land (0.40), and water areas to forest land (3338 t·km−2), respectively. The results indicated that land use and its changes had a significant impact on ecosystem services.

1. Introduction

As the benefits that humans derive from the structures, functions, and processes of ecosystems, ecosystem services play a critical role in achieving sustainable development goals [1,2,3]. The terrestrial ecosystem is the closest ecosystem to human activities, providing ecosystem services such as fresh water, soil, and biological resources. It is also the spatial basis and material guarantee for sustainable development of human society [4]. With rapid urbanization, the terrestrial ecosystem is increasingly modified, which has both negative and positive effects on the ability of the terrestrial ecosystem to provide services [5]. The specific investigation of such effects will have a positive impact on the rational formulation of regional development plans, as well as the achievement of sustainable social development goals.
Land use changes can directly reflect the interaction between human activities and the terrestrial ecosystem in the process of socioeconomic development, especially in the context of the trade-off between rapid urban expansion and sustainable development in recent years [6]. On the one hand, human destruction and interference with the natural environment have become more and more obvious [7]. For example, human beings have expanded many cities to increase living space. The means include occupying the natural space and destroying the continuity of the natural environment, which makes them fragmented [8]. At the same time, the transitional demand for resources in the ecosystem exceeds its ability to recover (such as excessive cutting of trees and excessive fishing), leading to irreversible damage to some ecosystems [9,10]. However, on the other hand, appropriate policies and actions promote the restoration and protection of the natural environment [11]. For example, China’s Three Northern Protected Forests Project has provided a significant contribution to improving the environment in northern China [12]. The United Nations Sustainable Development Agenda has also become an important guide for countries to balance environmental protection with development [13]. Due to specific environments, species, resource types, and social values, land use types play different roles in ecosystems, with indispensable meanings in exploring regional ecosystem services [14,15,16].
Research on the relationship between land use and ecosystem services has been a hot topic in related fields. Many scholars have done relevant research. For example, Xie et al., used the improved unit-value-based method to evaluate the ecosystem service values of arid inland watershed, with the conclusion that grassland has the greatest ecosystem service value among all land use/cover types in arid inland watershed [17]. Muhammad et al. assessed the dynamics of land use/cover change and associated ecosystem service values of coastal Bangladesh during 1999–2019 by analyzing historical Landsat land use/cover images and economic valuation techniques [18]. Morshed et al. built the model of future ecosystem service value with land use/cover dynamics by using machine learning-based artificial neural network model for Jashore city, Bangladesh [19]. Most of this research focused on the calculation and change analyses of ecosystem services under land use change background, while fewer studies looked into the ecosystem services induced by different land use conversions. Various complex mathematical and spatial models are used to quantify the impacts of land use on ecosystem services. Research interests include analyzing the history, linking the present, and predicting the future of ecosystem services. For example, the Integrated Valuation of Ecosystem Services and Tradeoffs (InVEST) model spatializes the quantitative valuation of ecosystem services by simulating changes in the quantity and value of ecosystem goods under land cover scenarios [20]. Cellular automata (CA) can simulate spatial patterns of land use changes, from the microscopic level to the macroscopic, by combining with GIS to establish interlinkages between land use categories and drivers [21]. Multi-criteria decision analysis addresses the impacts of potential land use conversions on ecosystem services [22]. The Land Change Modeler (LCM), as a mean of predicting likely future ecosystem conditions, enables good prediction of future land use uncertainty [23]. The GLOBIO model is widely used to assess anthropogenic changes in biodiversity [24]. Among the models, the InVEST model is widely applied all over the world to assess the impacts of land use change on ecosystem services [25], which is appropriate for reliably assessing multiple ecosystem services.
Short-term land use changes are highly susceptible to policy influence, and the benefits of land use changes can greatly influence policy makers’ decision-making [26]. Therefore, exploring the impacts of land use changes on ecosystem services can provide a clear reference for policy makers, which promotes the achievement of sustainable development goals. In view of this, this study applied the InVEST model to assess how land use changes impacted on ecosystem services from 1990 to 2020 in Guadong province. Considering the significance of ecosystem services and data availability, this study selected grain production (GP), water yield (WY), soil conservation (SC), habitat quality (HQ), and carbon sequestration (CS) services as typical representatives of ecosystem services. Guangdong province was chosen as an example since it is one of the most rapidly developing provinces in China that has experienced rapid urbanization, and most of its natural lands had been changed and developed to satisfy the needs of socioeconomic development [27]. This study is expected to help policy makers to better understand the impacts of land use changes on ecosystem services, and to provide references for research in related fields.

2. Materials and Methods
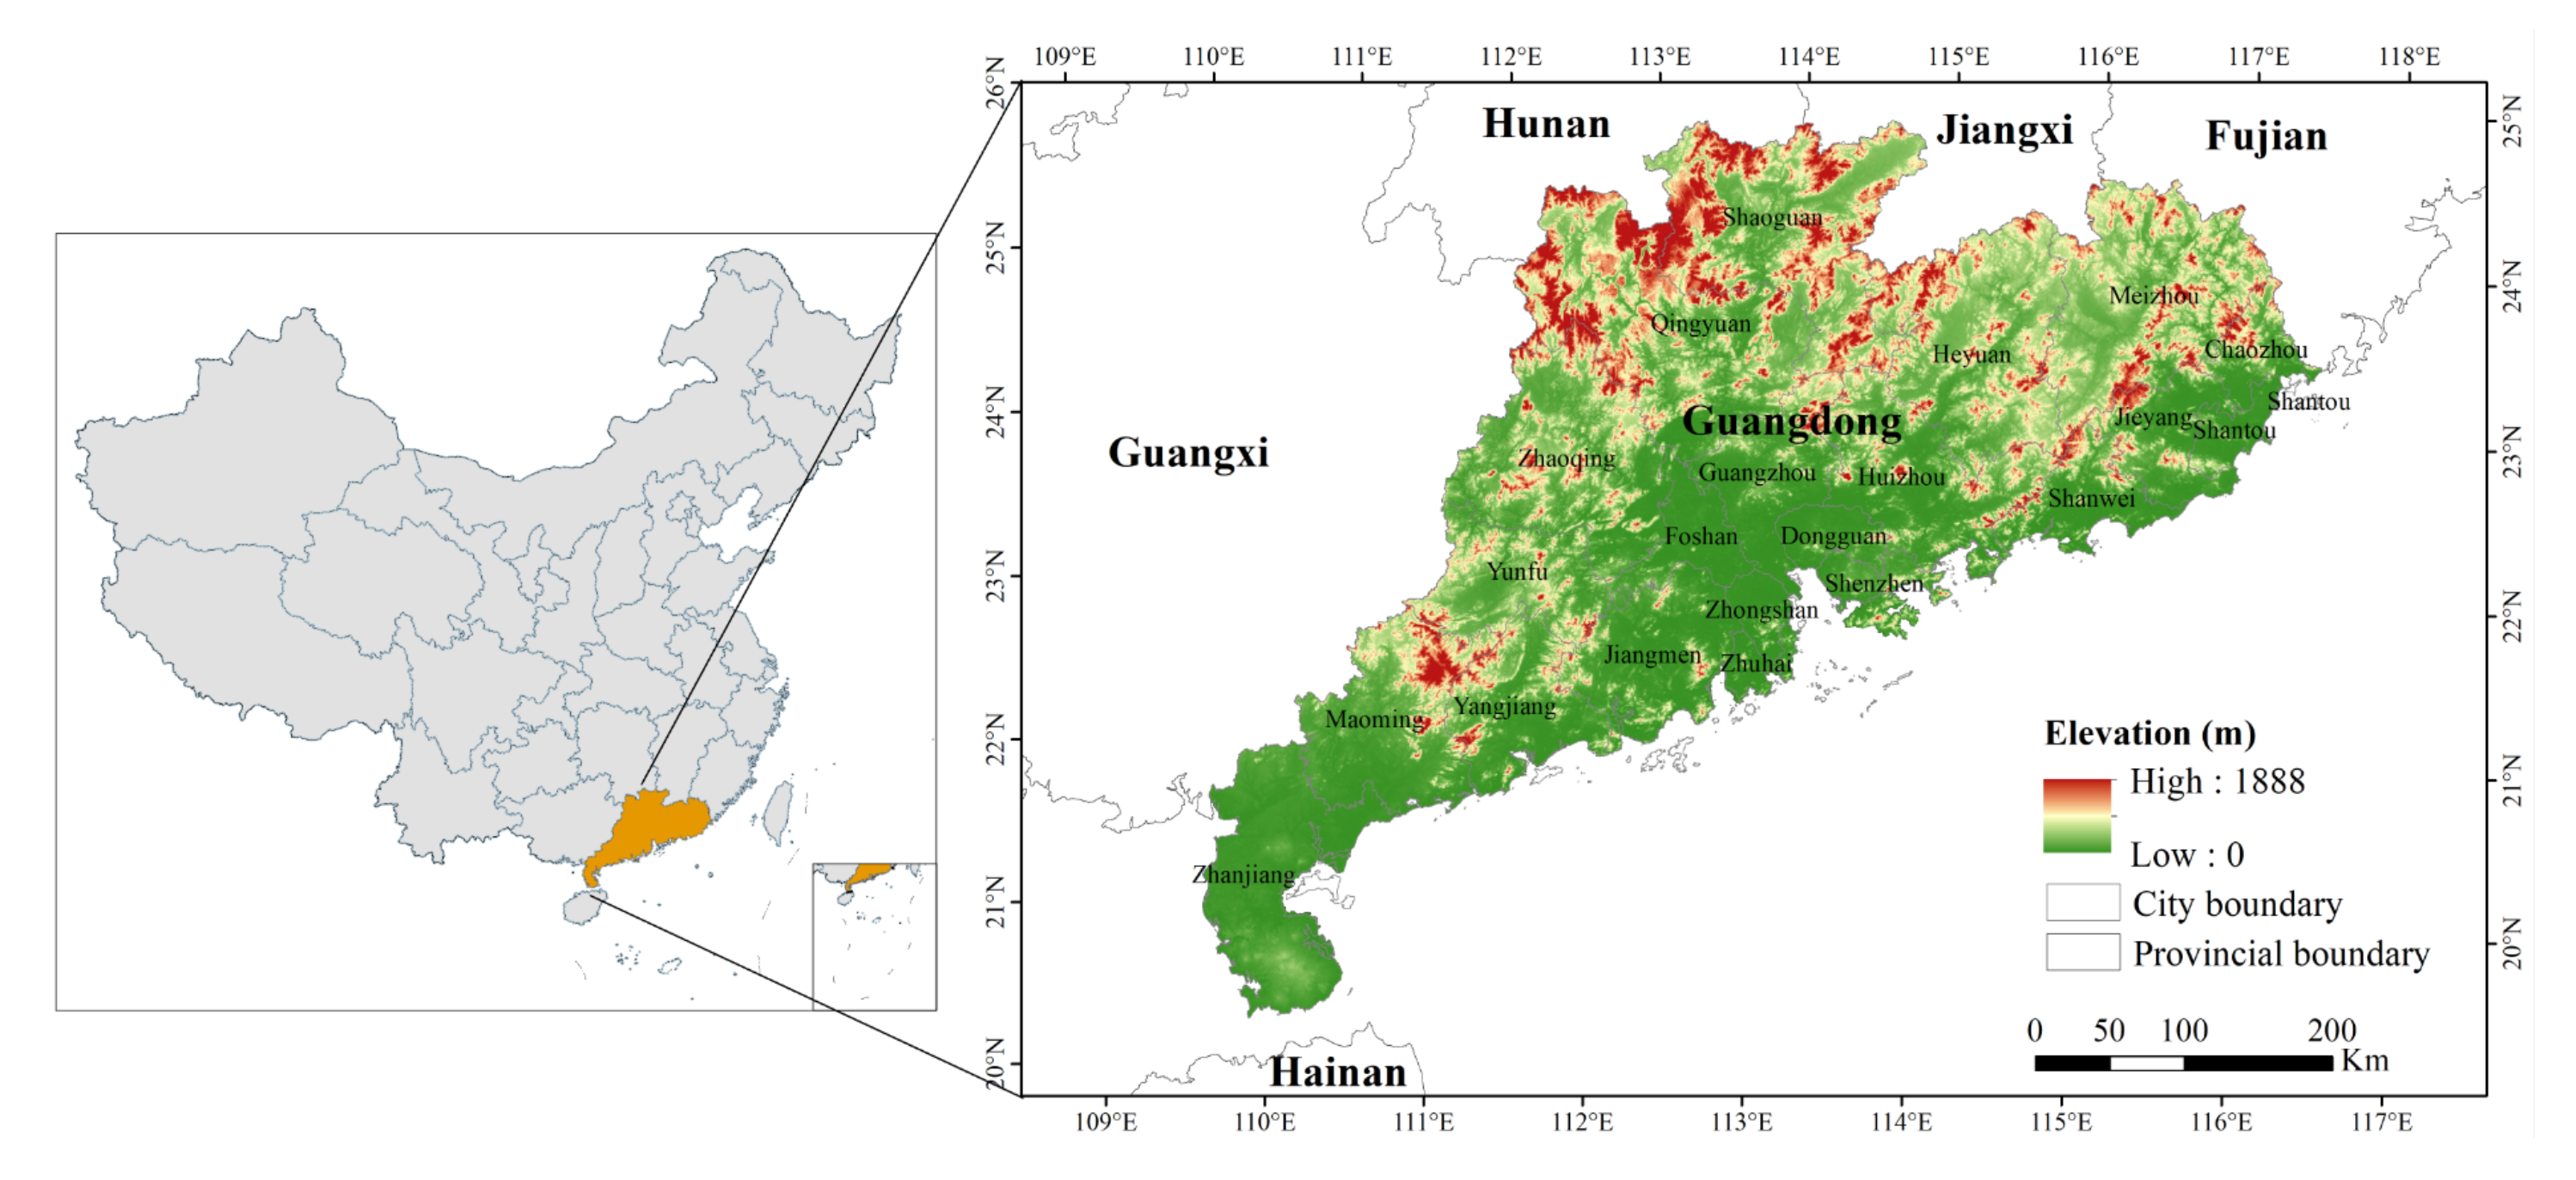
2.1. Study Area

Guangdong province (20°13′ N–25°31′ N, 109°39′ E–117°19′ E), located at the southern part of mainland China, consists of four geographic and economic regions (Pearl River Delta, east Guangdong, west Guangdong, and north Guangdong), and has 21 cities. It is bordered by Hong Kong, Macau, Fujian, Guangxi, Jiangxi, and Hunan province, and is separated from Hainan province by the sea (Figure 1). The area of Guangdong province accounts for around 1.87% of China’s total land area, and its average elevation is 198 m. The northern part is mostly hilly, while the southern part is mostly plain and tableland. The climate type of Guangdong province is mainly a subtropical monsoon climate, and the forest type is mainly a subtropical evergreen broad-leaved forest. As the southern gate of China, Guangdong province is the earliest birthplace of the Maritime Silk Road, located in the South China Sea shipping hub. Since the reform and opening-up of policies in 1978, Guangdong province has experienced rapid urbanization process and economic development, and it has become the most developed province in China [28]. In 2021, Guangdong had the highest urbanization rate and gross domestic product (GDP), with its urbanization rate reaching 72.7% and its GDP reaching CNY 12.4 trillion, ranking the first in China. For more than 30 years, Guangdong province has been the most rapidly developing region in China, leading to its status as the province with the most typical land use change characteristics.

2.2. Data

The assessment of ecosystem services was based on multisource data, including land use data, meteorological data, socioeconomic data, soil property data, and topography data (DEM) etc., during the period 1990–2020. The details of the data required for this study are shown in Table 1. In order to leave land use change as the sole driver affecting ecosystem services changes, this study calculated the multi-year average meteorological indicators to keep climate constant from 1990–2020. Then, Kriging spatial interpolation was used to convert the meteorological data into raster data with a resolution of 1 km. The other raster data were also converted to a uniform resolution of 1 km. Data related to grain production were mainly from the statistical yearbooks of Guangdong province.

2.3. Methods

Guangdong province experienced rapid urbanization during 1990–2020, with built-up land expansion occupying the cultivated land, forest land, and water bodies, which had a great impact on the ecosystems. Referring to related studies and the principles of importance and data availability [14,30,31], five key ecosystem services (Table 2), including GP, WY, SC, HQ, and CS, were selected to analyze their spatiotemporal dynamics and responses to land use changes in Guangdong province during 1990–2020. Details about the methods used are as follows.

2.3.1. Calculation of Grain Production

GP is mainly limited by cultivated land area and cultivation conditions. The cultivated land area was obtained by using the grid image of the proportion of cultivated land. Cultivation conditions were characterized by grain yield per unit area of each city. GP service in the study area was calculated using the following formula [29]:
P xy = g = 1 G × A xy × Y g C
where P x y is the total GP of the cell ( x , y ) in cultivated land in units of tons; A x y is the area of cultivated land in the cell ( x , y ); and Y g C is the yield per unit area for grains on cultivated land (t/km2).

2.3.2. Calculation of Water Yield

The water yield module of the InVEST is based on GIS raster data, and its core algorithm calculates the water production for each raster cell in a watershed using the water balance method in combination with climate, topography, soil characteristics, and land use parameters. The WY is the amount of rainfall for each grid cell in the area minus the actual evapotranspiration without upstream runoff recharge, where climatic elements, topographic factors, soil characteristics, and land use types mainly influence the balance between rainfall and evapotranspiration. The water yield module is based on the Budyko curve and the average annual rainfall. The annual WY of raster cells of different land use types Y i j is calculated as follows:
Y i j = 1 A E T i j P i + P i  
where Y i j is the annual WY of land use type j in raster cell i ; A E T i j is the actual annual average evapotranspiration of land use type j in grid cell i ; and P i is the average annual rainfall of raster cell i .
Since the actual annual evapotranspiration cannot be obtained by direct measurement, it can be approximated by Budkyo curves for A E T i j P i . The approximate calculation is performed. A E T i j P i is an approximation of the Budkyo curve, which is calculated as follows:
A E T i j P i = 1 + ω i R i j 1 + ω i R i j + 1 R i j    
where R i j is the Budkyo dimensionless drying index for land use type j in raster cell i , which is the ratio of reference evapotranspiration to rainfall; and ω i is the ratio of the corrected annual available water for vegetation to the expected rainfall. The Budkyo drying index, R i j , is calculated by the following formula:
R i j = K i j E T O i P i      
where K i j is the vegetation evapotranspiration coefficient of land use type j in raster cell i ; and E T O i is the potential evapotranspiration of raster cell i , also called the reference crop evapotranspiration, reflecting the evapotranspiration capacity determined by the climatic conditions.
ω i is defined as a non-physical parameter describing natural climate-soil properties, and it is calculated as follows:
ω i = Z A W C i P i      
where Z is the Zhang coefficient, which is used as a parameter representing seasonal rainfall distribution and rainfall depth, and is determined by regional rainfall characteristics; A W C i is the effective soil water content, also known as the vegetation available water content, and its value is determined by the soil texture and effective soil depth.

2.3.3. Calculation of Soil Conservation

The SDR sediment delivery ratio module of the InVEST model uses the US general soil loss equation for soil erosion (USLE), considering parameters such as rainfall erosion force (R), soil erodibility (K), slope length and slope gradient (LS), vegetation cover and management measures (C), and soil and water conservation measures (P). Using the land use type as the assessment unit, the SC amount of each assessment unit is obtained by subtracting the actual soil erosion amount from the potential soil erosion amount. The difference between the potential soil erosion amount and the actual soil erosion amount is that the former does not take into consideration the effect of vegetation cover and management factor, nor the soil and water conservation measure factor on soil erosion sequestration. That is, they have the same expression, but to calculate the potential soil erosion amount, the soil and water conservation measure factor (P) and vegetation cover and management factor (C) are assigned to 1. The potential soil erosion and actual soil erosion are calculated as follows:
R K L S = R × K × L S × C × P   C = 1 , P = 1
U S L E = R × K × L S × C × P
where R K L S is the potential soil erosion; U S L E is the actual soil erosion; R is the rainfall erosion force, MJ·mm·hm−2·h−1·a−1; K is the soil erodibility factor, t·km2·h·MJ−1·mm−1·hm−2; L S is the slope length and slope gradient factor; C is the vegetation cover and management factor; and P is soil and water conservation measure factor. SC quantity is the amount of RKLS minus USLE:
S C = R K L S U S L E    
where S C is the annual soil retention, t·km−2·a−1.

2.3.4. Calculation of Habitat Quality

The HQ module of the InVEST model was selected for the assessment. The calculation of HQ includes two parts: grid external stress and grid habitat suitability. The grid external stress D x j is calculated as follows:
D xj = r = 1 R y = 1 Y r W r r = 1 R W r r y i rxy β x S jr
where D x j is the level of habitat stress in raster x in land cover (or habitat type) j ; w r is the weight of the stressor, indicating the relative destructive power of a stressor to all habitats; r y is used to determine whether raster y is the source of the threat factor r ; i r x y is the coercive effect of the stressor r x y in raster y on the habitats in raster x ; β x is the accessibility of raster x under social, legal, and other protection states; and S j r is the sensitivity of land cover j to the stressor r , with higher values indicating high accessibility.
i r x y = 1 d x y d r m a x
i r x y = e x p 2.99 d r m a x d x y
where d x y is the linear distance between grid x and grid y , and d r m a x is the maximum influence distance of stress factor r . After considering the grid habitat suitability, the HQ was calculated as follows:
Q x j = H j 1 D x j   2 D x j 2 + k z      
where, Q x j is the HQ of raster x in land cover j ; H j is the habitat suitability of land cover j for the species, with values from 0 to 1, with 1 indicating the strongest habitat suitability; k is the half-saturation constant, and when 1 D x j   2 D x j 2 + k z = 0.5 , the value of k equals the value of D ; and the default value of z is 2.5.

2.3.5. Calculation of Carbon Sequestration

The carbon module of InVEST model was used to calculate CS. Its core algorithm applies the inventory method to assign a minimum estimated amount of carbon to each land use type for the four basic carbon pools (aboveground biomass ( C a b o v e ) , belowground biomass ( C b e l o w ), soil ( C s o i l ), and dead organic matter ( C d e a d )), and measures the CS capacity of the region by counting the total estimated amount of carbon assigned to each land use type per unit area [37]. The carbon pool values assigned for each land use type were obtained from the InVEST model. The carbon density ( C i ) for land use type i is equal to the sum of aboveground, belowground, soil carbon, and dead carbon densities for land use type i , represented as follows.
C i = C i   a b o v e + C i   b e l o w + C i   s o i l + C i   d e a d      
The total carbon storage ( C t o t a l ) is equal to the sum of carbon density for land use type i multiplied by the area ( A i ) for land use type i , with n as the number of land use types.
C t o t a l = i n C i A i      

3. Results

3.1. Land Use Changes in Guangdong Province from 1990 to 2020

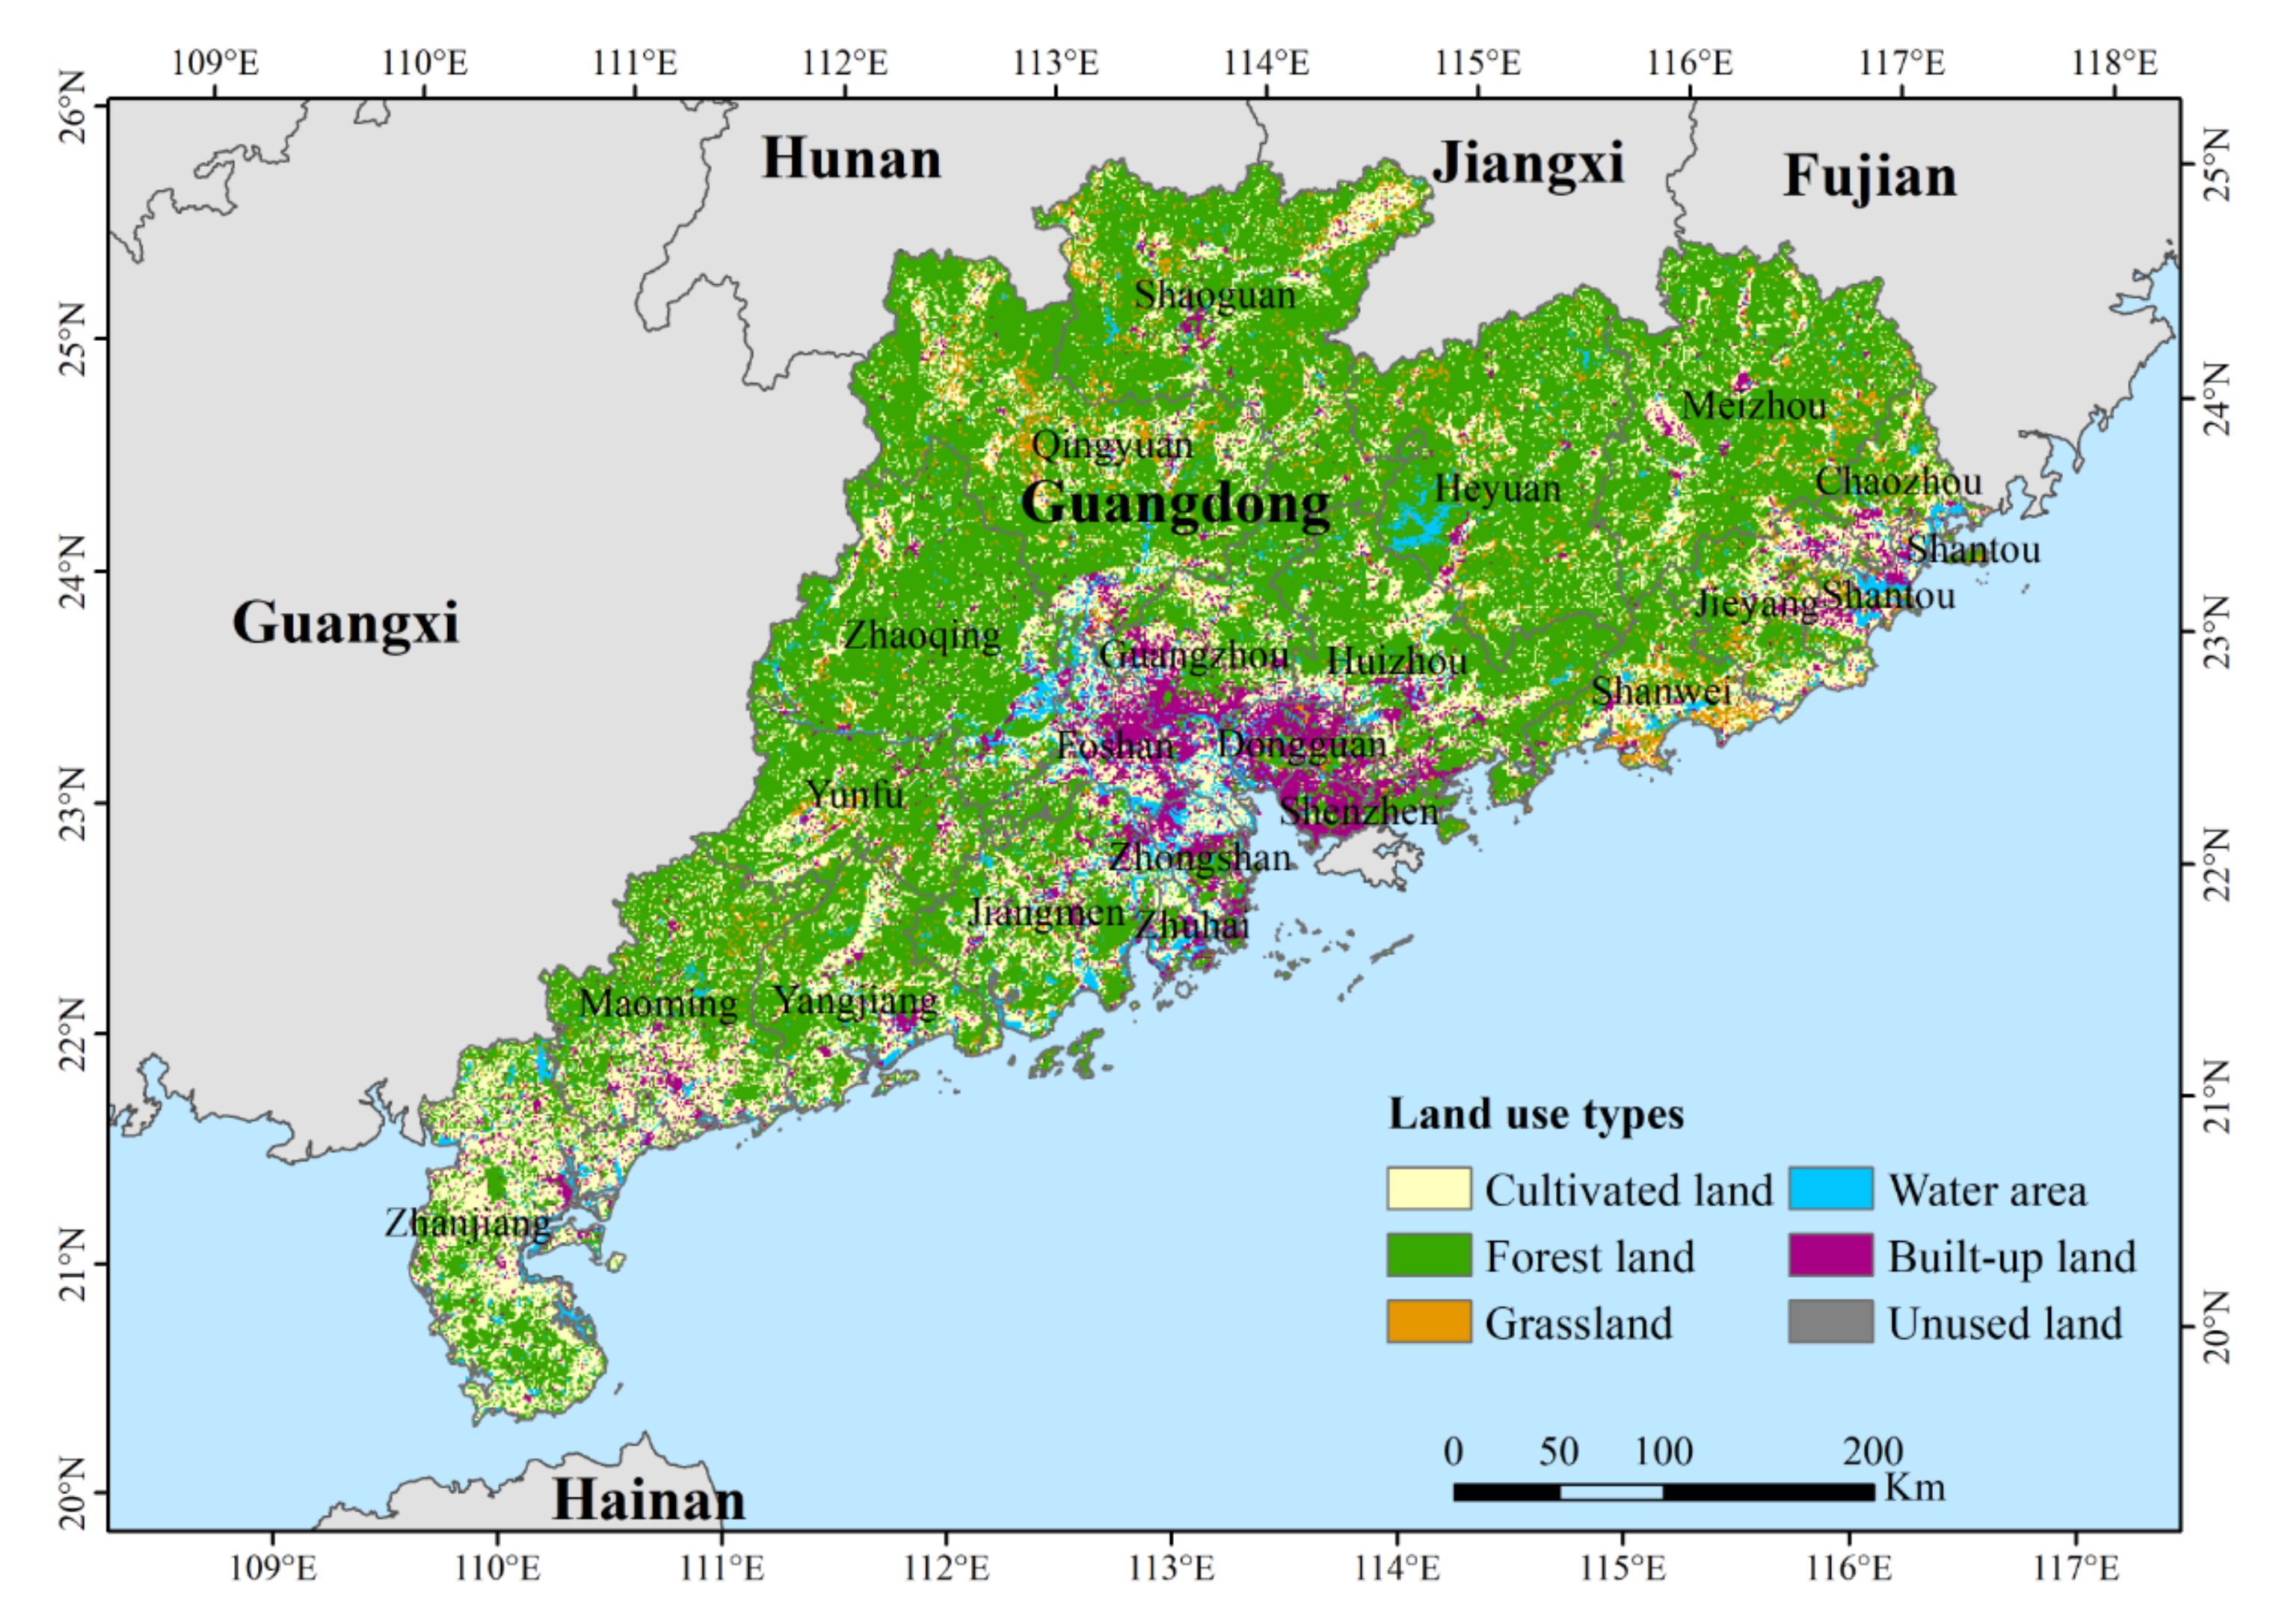
3.1.1. Characteristics of Land Use Pattern in Guangdong Province

In this study, seven phases of land use data of Guangdong province based on remote sensing image interpretation in 1990, 1995, 2000, 2005, 2010, 2015, and 2020 were used to explore the characteristics of dynamic changes of land use. Forest land and cultivated land are the main land use types in Guangdong province, which accounted for 59.87% and 23.81% of the total land area in 2020, respectively. Following were built-up land (7.57%) and water areas (4.40%). Concerning the spatial pattern of land use, forest land and grassland were mainly concentrated in Zhaoqing, Qingyuan, and Heyuan, which are located in the middle and upper reaches of Xijiang River, Suijiang River and Dongjiang River. Among them, forest land is mainly distributed in the low mountainous and hilly areas, while grassland is distributed in the transition zone between cultivated land and forest land. Cultivated land and built-up land, showing a trinuclear distribution pattern, are concentrated in the urban cluster in the Pearl River Delta (Guangzhou, Shenzhen, Dongguan, Zhongshan, Zhuhai, and Foshan), the southwestern part of Guangdong (Maoming and Zhanjiang), and the northeastern part of Guangdong (Shantou). Furthermore, there is extraordinarily little unused land (Figure 2). The quantitative structure and spatial patterns of land use in Guangdong province reflect its regional landscape pattern of “forests and grasslands in low hills, cultivated land, and built-up land in plains” with high exploitation rate.

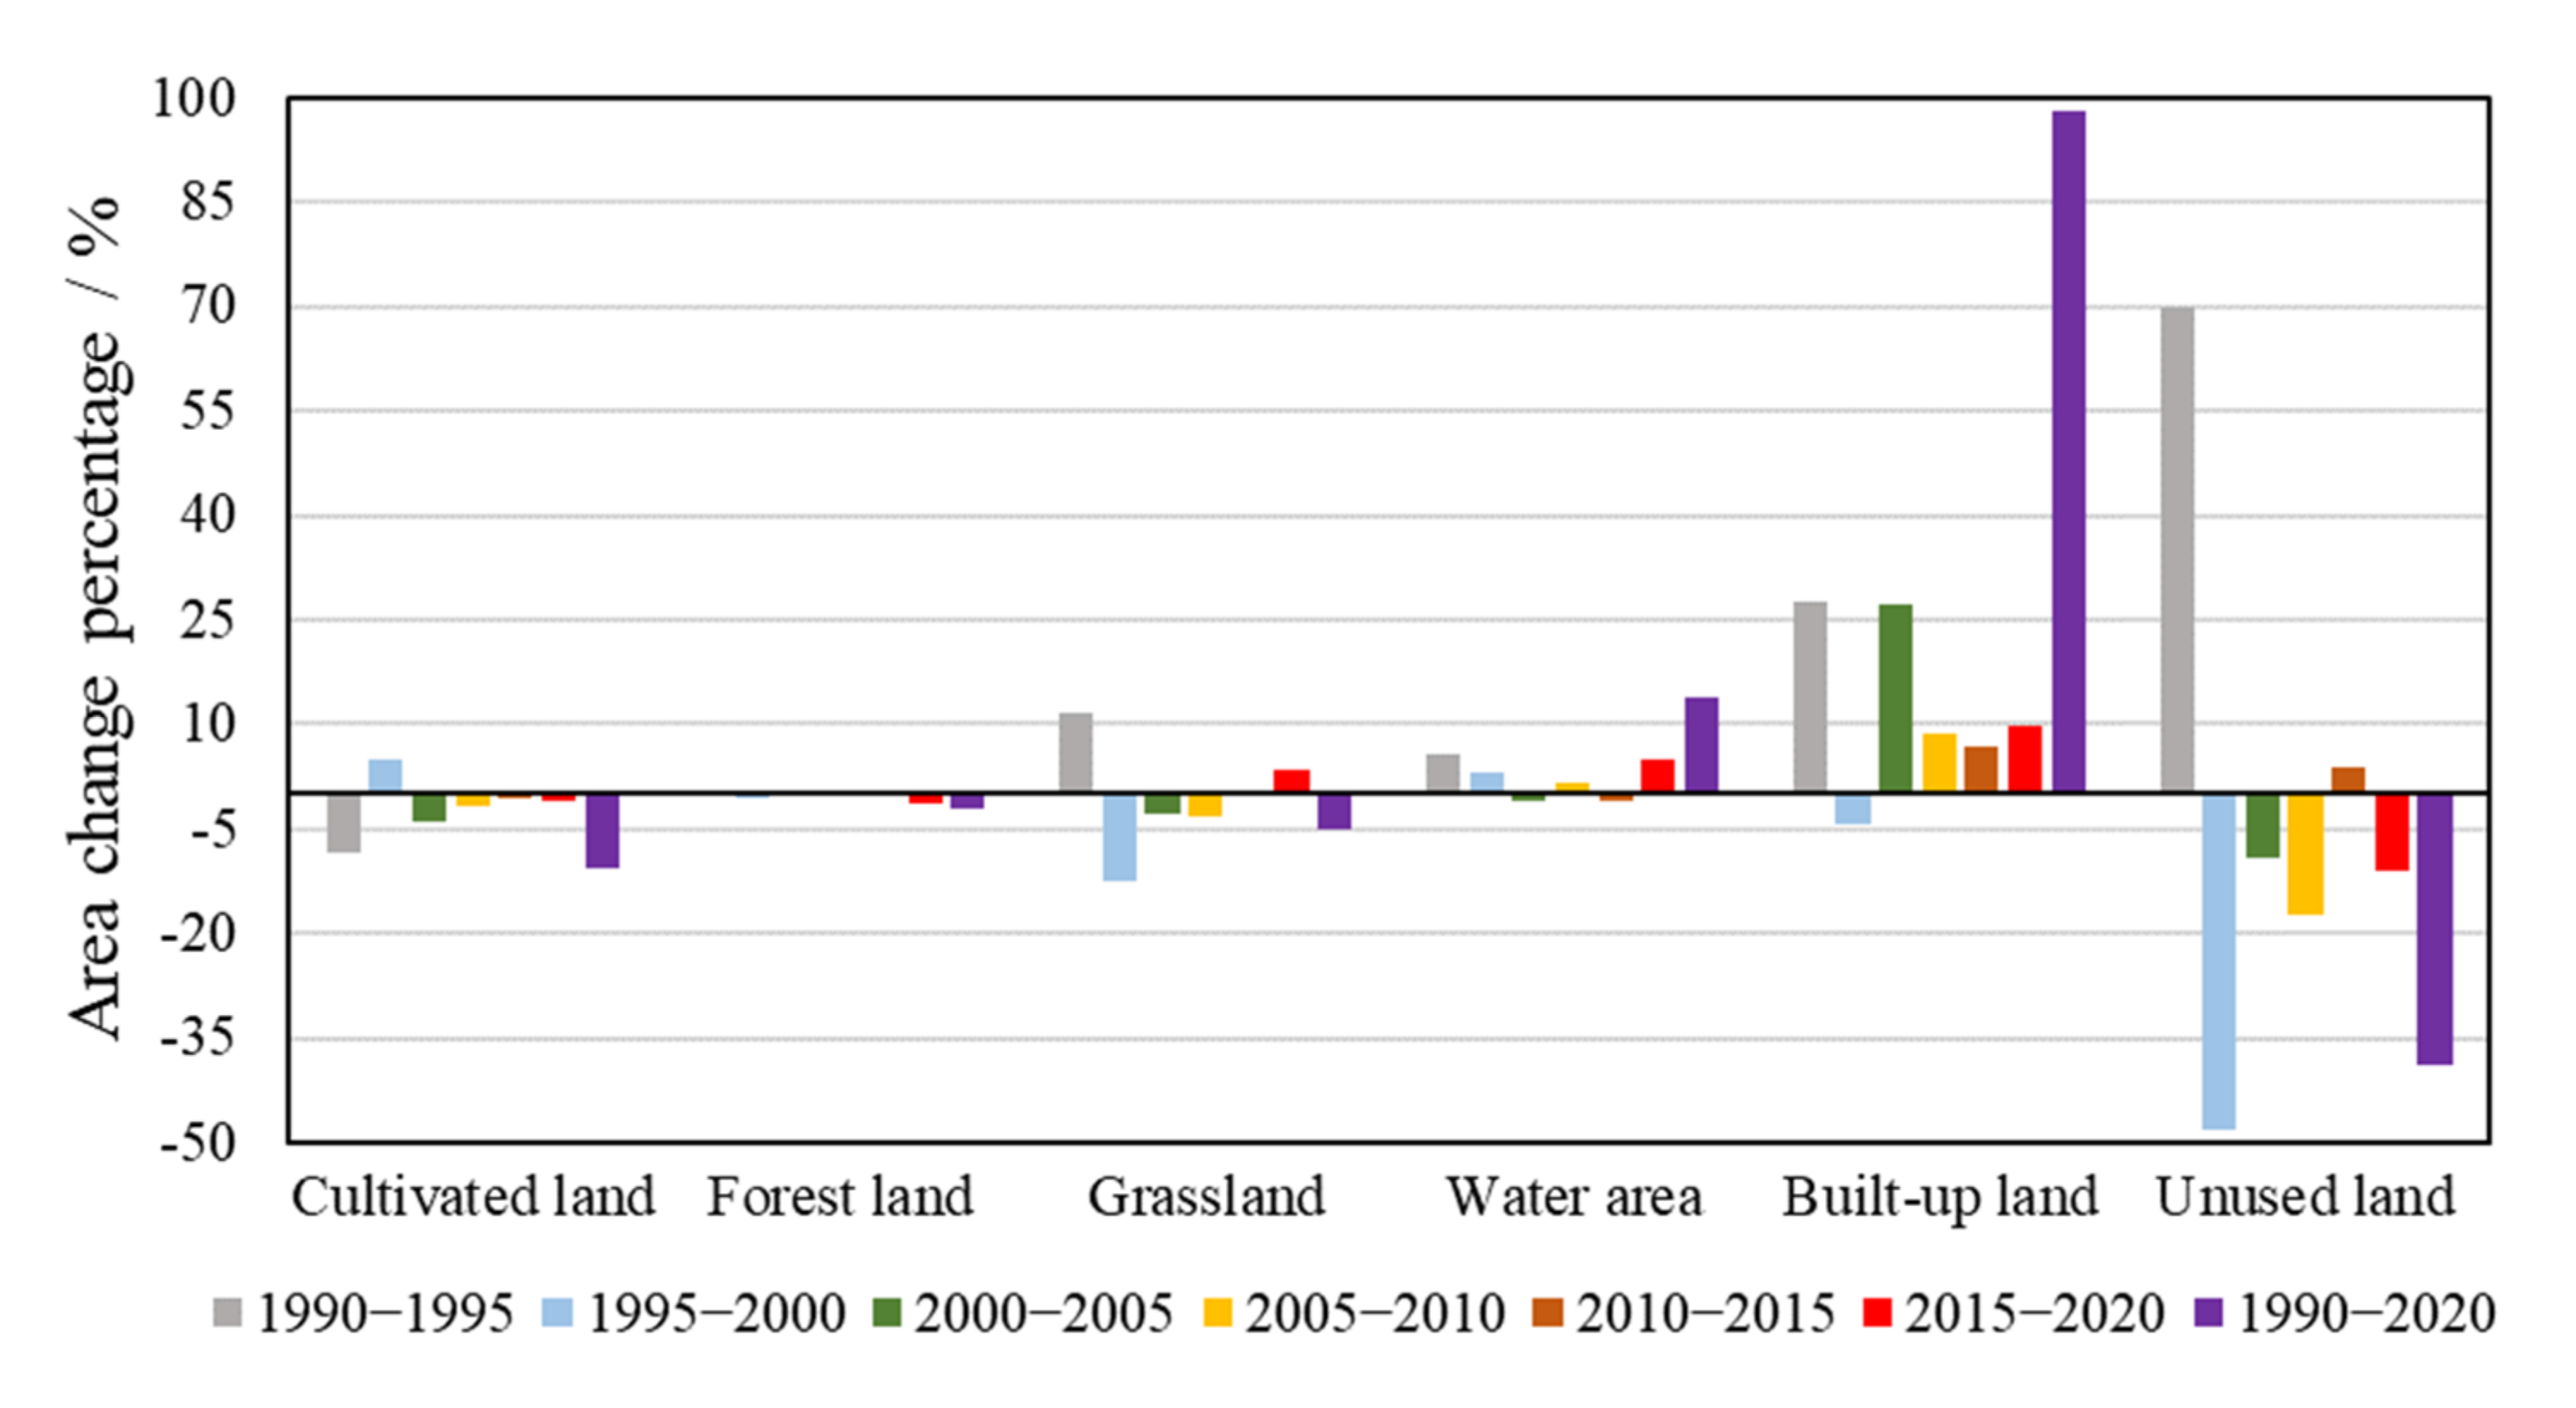
3.1.2. Analysis of Land Use Changes in Guangdong Province

With the development of social economy over the past 30 years, the intensity of human production activities had continued to increase, resulting in significant changes in land use. The analysis about changes of areas of land use types can provide the general change trend of land use and its structure. In general, land use changes in Guangdong province from 1990 to 2020 mainly showed a significant expansion of built-up land and water areas, with the area of built-up land almost doubling in size, while the area of cultivated land, forest land, grassland, and unused land decreased in different degrees (Table 3).
Considering the development stages of periods, the changes of land use structure in Guangdong province had the following characteristics. Over the past 30 years of rapid economic development, Guangdong has rapidly expanded its cities. As shown in Figure 3 and Figure 4, from 1990–2020, the area of built-up land has been continuously expanding, and the expansion rate has been stable at a high level. From 1990–1995, 2000–2005, 2005–2010, 2010–2015, and 2015–2020, the area expanded by 1875 km2 (27.7%), 2251 km2 (27.2%), 900 km2 (8. 5%), 784 km2 (6.9%), and 1193 km2 (9.8%), respectively (Figure 3). Only within the period 1995–2000 did the area of built-up land decrease, by 366 km2 (−4.2%). In the past 30 years, the overall expansion rate of built-up land in Guangdong province has reached 97.9%, indicating that the urban area has been continuously expanding, and the intensity of human activities, as well as the impact on the local natural environment, has been continuously increasing. Water areas is another land use type that had expanded to a certain extent. The water areas increased by 941 km2 (13.7%) from 1990–2020, but its performance fluctuated significantly. The water areas increased from 1990–1995, 1995–2000, 2005–2010, and 2015–2020. The increase (area change rate) was 390 km2 (5.7%), 217 km2 (3.0%), 128 km2 (1.7%), and 356 km2 (4.8%), respectively. However, during the periods 2000–2005 and 2010–2015, the water areas decreased by 81 km2 (−1.1%) and 69 km2 (−0.9%), respectively. Forest land and cultivated land are the largest land use types in Guangdong. The area of forest land only increased slightly during 1990–1995, and the increase (area change rate) was 683 km2 (0.6%). It decreased during the periods 1995–2010, 2000–2005, 2005–2010, 2010–2015, and 2015–2020, and the corresponding decreased areas were 725 km2, 225 km2, 70 km2, 393 km2, and 1336 km2. However, due to the large base area of forest land, the area change rates of the corresponding five stages were only −0.7%, −0.2%, −0.1%, −0.4%, and −1.2%. At the same time, the area of cultivated land decreased by 3996 km2, 1705 km2, 687 km2, 331 km2, and 444 km2, respectively, from 1990–1995, 2000–2005, 2005–2010, 2010–2015, and 2015–2020. The decreasing rate gradually slowed down, and a corresponding area change rate of −8.5%, −3.8%, −1.6%, −0.8%, and −1.0%, respectively, occurred. Only during 1995–2000 did the area of cultivated land increase slightly, while the increase (area change rate) was 2126 km2 (4.9%). It was clear that cultivated land in Guangdong was gradually developed into built-up land over these years. The grassland area decreased by 405 km2 (−5.1%) over the past 30 years. To be specific, it increased in the three periods from 1990–1995, 2010–2015, and 2015–2020, and the increase in area (area change rate) was 920 km2 (11.5%), 4 km2 (0.1%), and 245 km2 (3.3%), respectively. However, it decreased during 1995–2000, 2000–2005, and 2005–2010, while the decrease in area (area change rate) was −1102 km2 (−12.4%), −225 km2 (−2.9%) and −248 km2 (−3.3%), respectively. In addition, unused land occupies only around 0.10% of the total area.

3.2. Changes of Ecosystem Services in Guangdong Province from 1990 to 2020

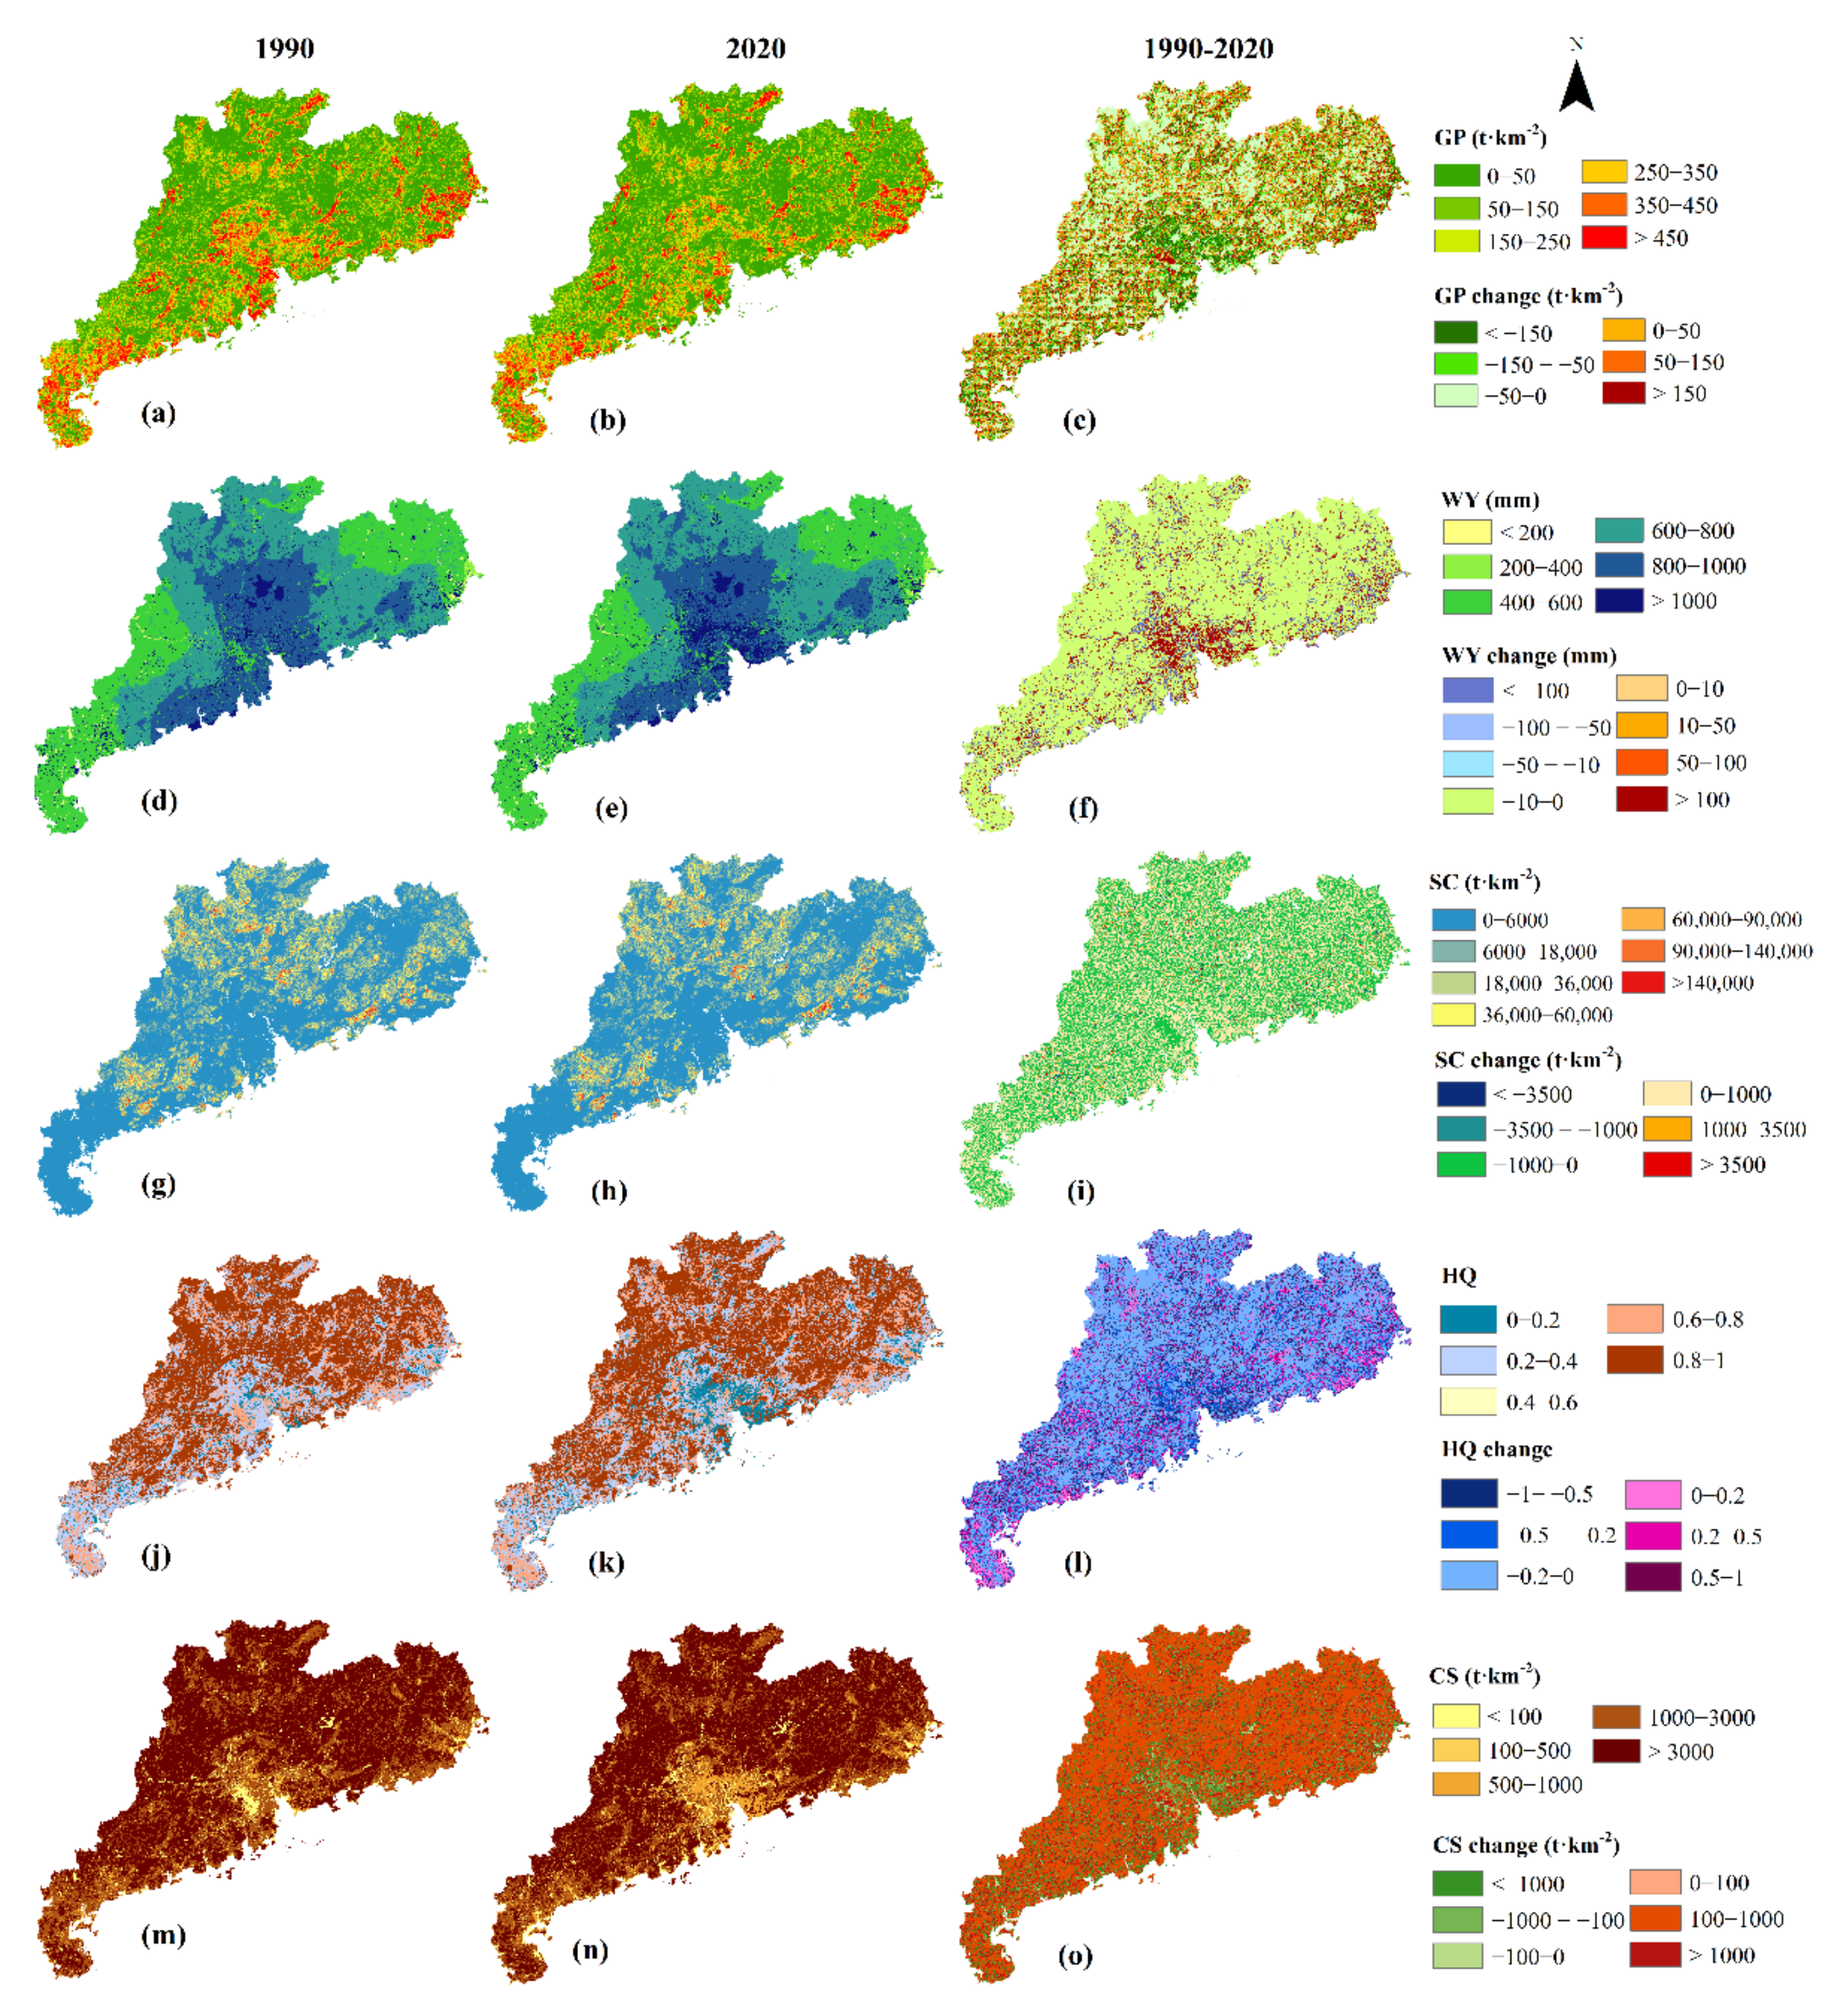
3.2.1. Changes of Grain Production

Grain is one of the essential elements for human survival and development, and GP serves the most important supply service of the ecosystem. On the one hand, grain output can reflect the comprehensive situation of the regional ecological environment. On the other hand, the change in GP can also reflect the human attitude towards the use of the ecosystem. GP services and changes in Guangdong province from 1990–2020 are shown in Figure 5a–c. From the perspective of spatial distribution, Shenzhen (74.8 t·km−2), Heyuan (81.2 t·km−2), and Zhaoqing (95.3 t·km−2) had the lowest average GP service in 1990–2020. The top three cities were Zhanjiang (255.4 t·km−2), Shantou (243.7 t·km−2), and Jieyang (220.3 t·km−2). From the perspective of time, the average GP in Guangdong province decreased from 142.3 t·km−2 in 1990 to 130.0 t·km−2 in 2020. The avearge grain produciton decreased the most in Shenzhen (−67.0%), followed by Dongguan and Zhuhai, with decreases of −63.0% and −40.8%, respectively. Only Jieyang, Shanwei, and Maoming showed a slight increase in average grain production.

3.2.2. Changes of Water Yield

The ability to provide sufficient freshwater is a key element in evaluating whether the regional ecological environment is excellent. WY depends on the regional rainfall and water harvesting capacity. Changes in land use patterns affect climate and water distribution by altering the water cycle (e.g., urban construction hardens the subsurface, resulting in less infiltration and more water being retained and collected), while the construction of reservoirs and other water storage facilities can enhance water collection capacity to alter regional WY. The WY and its change in Guangdong province from 1990–2020 are shown in Figure 5d–f. From the perspective of spatial distribution, the WY from 1990–2020 generally followed the distribution pattern of rainfall, showing a gradual decrease from coastal areas to inland areas, while the results also clearly indicated that the WY had a close relationship with the nature of the underlying surface. Since most of the area was an impermeable urban hardening surface, the WY in the central urban agglomeration area breaks the laws of the following rainfall distribution, and is significantly higher than that in the surrounding forest land and grassland areas. Moreover, since most of the area was cultivated land with high infiltration and high-water consumption intensity, the WY in Zhanjiang was significantly lower than that in other areas with the same rainfall conditions. Specifically, the three cities with the lowest average WY from 1990–2020 were Chaozhou (502 mm), Zhanjiang (504 mm), and Meizhou (555 mm), and the three cities with the highest values were Dongguan (1097 mm), Shenzhen (1075 mm), and Guangzhou (1037 mm). From a temporal perspective, the average WY increased slightly from 716 mm in 1990 to 738 mm in 2020, and all cities in Guangdong province except Shantou and Zhanjiang showed increase trend with different magnitudes. Among them, Shenzhen had the largest growth rate of 24.59%, followed by Dongguan and Zhongshan, with an increase rate of 24.29% and 20.62%, respectively. Shantou and Zhanjiang had a very low decline of 0.73% and 0.22%, respectively. The regions with rapid growth in WY were mainly concentrated in areas with high precipitation and rapid expansion of urban hardened subsurface, such as the Pearl River Delta urban agglomeration. The regions with unchanged or decreasing WY were mainly scattered in the surrounding areas of forest land and cultivated land, and the area was originally used for construction.

3.2.3. Changes of Soil Conservation

Soil is an important cornerstone of ecosystem service delivery, closely inferenced by climate change, food production, and vegetation growth. SC capacity is limited by the relative relationship between soil erodibility and environmental erodibility, and changes in land use types will cause changes in the relative relationship between this pair of influencing factors. SC and its change from 1990 to 2020 are shown in Figure 5g–i. From the perspective of spatial distribution, the SC clearly showed a high distribution pattern o in forest land and grassland, and a low distribution in built-up land. Specifically, urban hard substrates had almost no SC capacity, and the small amount of SC was mainly provided by urban green areas, such as parks and urban forests. Forest land and grassland benefited from the soil-fixing capacity of plant roots, and had better SC capacity. Specifically, the three cities with the lowest average SC from 1990–2020 were Zhanjiang (462 t·km−2), Foshan (1735 t·km−2), and Zhongshan (2569 t·km−2), and the three cities with the highest average SC were Shanwei (17,713 t·km−2), Qingyuan (17,038 t·km−2), and Shaoguan (14,324 t·km−2). From a temporal perspective, the average SC in Guangdong province decreased slightly from 10,531 t·km−2 in 1990 to 10,529 t·km−2 in 2020, with a total of 9 cities showing a decreasing trend, and the remaining 12 cities showing an increasing trend. The changes were extremely small, concretely all less than 1.5%. Among them, Zhanjiang had the largest increase of 1.28%, followed by Dongguan and Zhuhai with 0.67% and 0.47%, respectively. The largest decreases were in Chaozhou and Shanwei, with 0.48% and 0.32%, respectively. Over the past 30 years, most of the regions in Guangdong province had experienced a slight decrease in SC, with some mountainous areas sporadically distributed with obvious decreasing areas. The areas with rising SC mainly occured in areas with rapid urban development.

3.2.4. Changes of Habit Quality

The continuous development of cities will change the regional land use pattern, and the reduction of forest land and grassland will reduce the suitable space for maintaining biodiversity, resulting in the deterioration of HQ. The HQ and its change in Guangdong province from 1990–2020 are shown in Figure 5j–l. From the perspective of spatial distribution, the HQ showed a distribution pattern of low in the east and high in the west and north, with the rapid development of core cities leading to the continuous increase in the destructive effect of human activities on the ecological environment, thereby leading to a decrease in HQ. Specifically, the three cities with the lowest average HQ in 1990–2020 were Dongguan (0.42), Zhongshan (0.47), and Foshan (0.48), while the three cities with the highest average HQ were Heyuan (0.86), Zhaoqing (0.83), and Meizhou (0.83). On the urban scale, the HQ in the core urban areas was much lower than that in the suburban areas. Taking Guangzhou as an example, we used the third ring of Guangzhou as the boundary between core urban areas and suburban areas. The average HQ of core urban areas in Guangzhou was 0.26, which was much lower than that of suburban areas at 0.89. From a temporal perspective, the average HQ in Guangdong province decreaseed slightly from 0.73 in 1990 to 0.71 in 2020. All cities in Guangdong except for Maoming, Zhanjiang, and Shantou showed different magnitudes of decrease. Among them, Dongguan had the largest decrease rate of 34.62%, followed by Shenzhen and Foshan with a decrease rate of 32.81% and 24.53%, respectively. Maoming, Zhanjiang, and Shantou had extremely low increases of less than 1%. The areas with dramatic deterioration in HQ were mainly concentrated in areas with rapid urban development and built-up land expansion, such as the Pearl River Delta urban agglomeration. At the same time, the areas with improved HQ were mainly scattered in forest land areas or clustered in cultivated land expansion areas (e.g., Zhanjiang).

3.2.5. Changes of Carbon Sequestration

Ecosystems regulate regional climate conditions by increasing or decreasing atmospheric greenhouse gases (e.g., carbon dioxide). Therefore, the CS capacity of regions has an important impact on the local ecological environment. Forest land and grassland are the most important carbon pools, and changes in land use types will significantly alter the regional CS service. The CS and its change in Guangdong province from 1990–2020 are shown in Figure 5m–o. From the perspective of spatial distribution, the CS generally showed high values in forest land, followed by grassland and cropland, and low values in built-up land and water areas. It indicated that vegetation and soil were the most important carbon pools in the ecosystem [38,39]. Forest land had a strong CS capacity due to its large amount of vegetation and deep soil, while grassland and cultivated land also had a certain amount of vegetation and soil with strong CS capacity. Most of the built-up land were hard substrates with almost zero CS capacity, while water areas relies almost only on water to absorb carbon dioxide to provide a little CS. Thus, their CS values were much lower than those of forest land, grassland, and cultivated land. Specifically, the three cities with the lowest average CS from 1990–2020 were Zhongshan (1437 t·km−2), Foshan (1463 t·km−2), and Dongguan (1535 t·km−2), and the three cities with the highest average CS were Heyuan (2897 t·km−2), Meizhou (2864 t·km−2), and Zhaoqing (2827 t·km−2). From a temporal perspective, the average CS increased from 2486 t·km−2 in 1990 to 3001 t·km−2 in 2020, and all cities in Guangdong province except for Dongguan and Shenzhen showed an increasing trend. Among them, Meizhou had the largest growth rate of 23.44%, followed by Yunfu and Shaoguan, with values of 23.38% and 23.02%, respectively. The CS in Dongguan and Shenzhen had decreased by 6.94% and 4.26%, respectively. Over the past 30 years, the rise of CS in most regions of Guangdong was within the range of 100–1000 t·km−2, and there were significant decreases (>1000 t·km−2) in new areas of urban expansion. However, in existing urban areas, CS may increase as well as decrease.

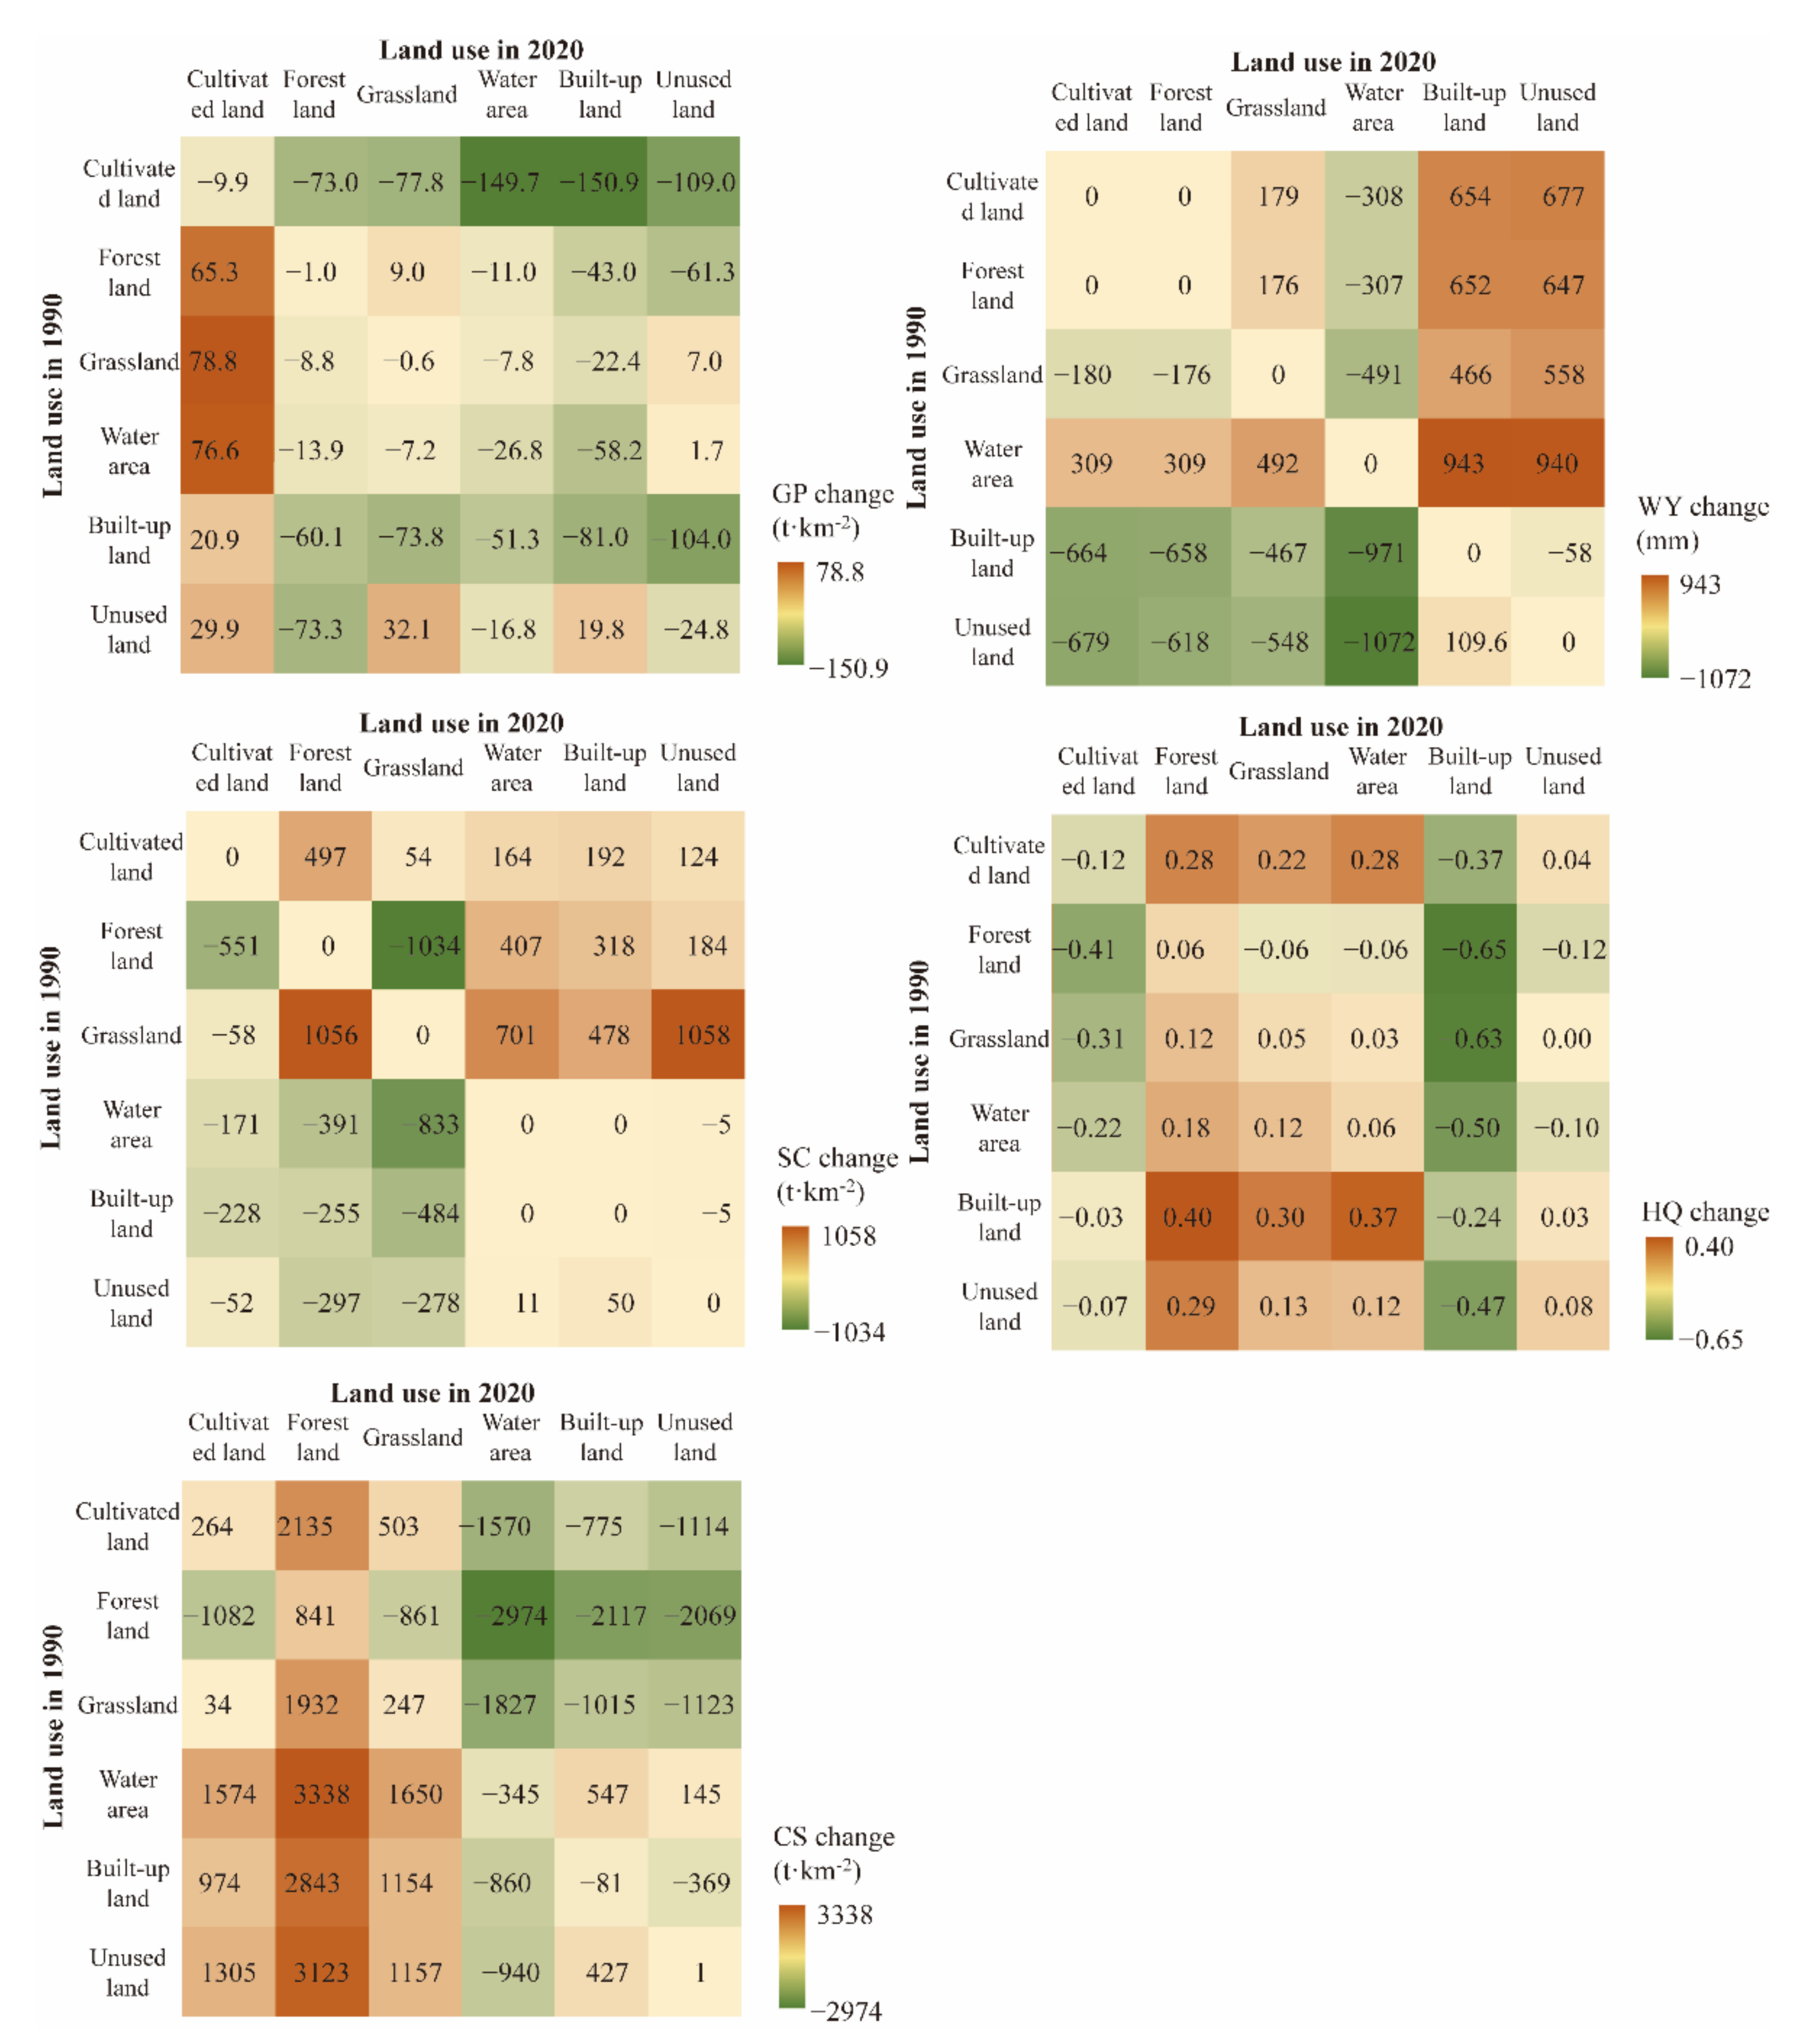
3.3. Impact of Land Use Change on Ecosystem Services

In order to further analyze the impact of land use change on the five key ecosystem services, our study superimposed the spatial distribution of land use conversions during the period 1990–2020 with the spatial distribution of ecosystem service changes during the same time. Based on spatial statistical analysis tools, we obtained the statistical information of ecosystem service changes corresponding to different land use conversion types (Figure 6).
GP increased in the areas converted from other land use types to cultivated land, while in the areas with cultivated land converted to other types, it showed a decreasing trend. In the area of conversion from cultivated land to built-up land, grain production was the most deteriorated (−150.9 t·km−2), and in areas of conversion from grassland to cultivated land, GP was the most optimized (78.8 t·km−2). GP was directly restricted by the area of cultivated land and farming conditions. Over the past 30 years, the rapid urbanization in Guangdong province with the rapid decrease of cultivated land area has led to the general decline of regional grain output. Cultivated land which was converted from grassland, forest land, and water areas had better GP values. This is due to the fact that grassland, forest land, and water areas themselves have relatively deep soil and moisture conditions, providing a good foundation for cultivated land after conversion.
WY it mostly showed an overall decreasing trend in areas converted to cultivated land, forest land, and water areas, while showed an overall increasing trend in areas converted to built-up land and unused land. Among them, the WY values in the areas that were converted from unused land to water areas were the most deteriorated (−1072 mm), and in the areas that were converted from water areas to built-up land, it was the most optimized (943 mm). It is worth noting that the WY in our study is mainly used to evaluate the ability of WY based on natural precipitation, that is, the ability to retain precipitation in situ. WY in water areas is the lowest because natural precipitation leaves the site in a short time with runoff, or evaporates violently in lakes. In cultivated land and forest land, precipitation infiltrates into the soil rapidly and is used by plants, thus maintaining a low WY. In built-up land, hard substrates prevent the infiltration and loss of precipitation. In addition, WY can be effectively improved by the city’s well-developed water diversion and storage projects, such as sewers and cisterns.
For SC, there was an overall decreasing trend in areas converted to cultivated land and unused land, and an increasing trend in areas converted to forest land, water areas, and built-up land. The conversion from grassland to unused land is the most deteriorated (−10,166 t·km−2), and the conversion from unused land to forest land is the most optimized (3552 t·km−2) among all the conversion types. Overall, as forest land, water areas, and built-up land had higher soil retention capacity, the conversion from other land use to them would help to increase SC. In addition, for the mutual conversion between two land use types, the degree of change of SC was different. For example, the conversion from unused land to grassland led to an average SC increase of 2672 t·km−2, while the conversion from grassland to unused land led to an average SC decrease of 10,166 t·km−2. The main reason may be that land use conversion occurred at different positions, where the SC capacity would be influenced by its topography, soil texture, and regional climate conditions.
HQ it showed an overall decreasing trend in areas converted to cultivated land, built-up land, and unused land, while showing an overall increasing trend in areas converted to forest land, grassland, and water areas. The HQ in the areas converted from forest land to built-up land was the most deteriorated (−0.65), and the areas which were converted from built-up land to forest land was the most optimized (0.40). Forest land has excellent natural conditions, where a large number of plants, animals, and microorganisms living in a stress-free environment, leading to a high HQ rating. However, in the process of urban development and expansion, a large amount of forest land was converted to built-up land, and the original natural environment was deteriorated, along with its ecosystem structure being destroyed. This resulted in a sharp decline in HQ evaluation. However, some of the built-up land, such as abandoned industrial and mining areas, has been restored to forest land, which can significantly improve the local HQ on the contrary.
CS decreased in the areas converted to water areas, built-up land, and unused land, while increased in the areas converted to cultivated land, forest land, and grassland. The CS in the areas converted from forest land to water areas was the most deteriorated (−2974 t·km−2), and most optimized in the areas converted from water areas to forest land (3338 t·km−2). Cultivated land and grassland also have better CS values for the same reason. In water areas, water is the main carrier of CS, but in conventional environments water has little capacity to sequester carbon. In built-up land, a large amount of concrete, asphalt, and other major constituent materials have little CS capacity. Therefore, both of them have very poor CS values.

4. Discussion

Our study finds that land use and its change has had an extremely important influence on ecosystem services, and this influence was particularly evident in the changes of forest land and built-up land. In the context of rapid urbanization, built-up land changed the most dramatically. Followed by two distinct policies of deforestation and afforestation in different regions, it led to significant spatial heterogeneity in the change of forested land. The difference above had profound impacts on ecosystem services. The study of Liu et al. concerning the PRD urban agglomeration has similar findings [14]. However, our study found that forest land in Guangdong Province has the best performance in the evaluation of ecosystem service values, while the study of Xie et al., shows that grassland is the best in the Aksu Basin [17]. We believe that land use/cover contributes differently to the value of ecosystem services under natural conditions (e.g., climate, topography, etc.), which is closely related to the area of various land use/cover patterns in the region and the degree of interaction with other natural elements. It is important to note that our study only considered the “natural” component of ecosystem service value. In fact, humans’ social, cultural, and emotional needs concerning the natural environment are also an important part of the value. The study of Tasser et al., included a questionnaire survey on the social value of ecosystem services, which is instructive for our subsequent research [40].
Ecosystem services respond differently to land use change, exhibiting local environmental influences. In this study, GP, SC, and HQ all tended to deteriorate overall over the 30-year period, deteriorating or optimizing locally (GP and HQ deteriorated particularly in urban built-up lands, while SC was optimized in urban built-up lands). WY and CS tended to be optimized overall over the 30-year period, with a significant trend of deterioration locally (WY decreased mainly in the surrounding areas of forest land and cultivated land, while CS significantly decreased in new areas of urban expansion). This kind of change in ecosystem services suggests that land use change does not simply change the landscape pattern of the terrestrial surface, but may also affect important natural cycles, such as the water cycle, the energy cycle, and the material cycle, thus changing the overall ecological environment, and causing an overall deterioration or optimization of ecosystem services. Hasan et al. integrated an analysis of studies related to land use and ecosystem services, and concluded that land use can greatly influence various elements of ecosystems, from biodiversity to climate, and, in this way, affect ecosystem services [41]. Our study does not specifically analyze the effects of land use on various elements of ecosystems, but our results of changes in ecosystem services support the conclusions of Hasan et al.
It is worth noting that we did not make a qualitative judgment of “need to maintain or improve”, since ecosystem services are defined as the “benefits” that humans can derive from ecosystems [42,43,44]. This means that the value of ecosystem services should be comprehensively decided upon with consideration of human needs, and not just considered as a combination of natural attributes. Therefore, we cannot ignore the needs of economic and social development to pursue better ecosystem services, but we should make more reasonable development plans to achieve sustainable development while meeting our own economic and social development needs.
Our study area is Guangdong province, the most rapidly urbanized and developed province in China. As such, the quantitative results of the study are distinctly geographic in nature, and the conclusions drawn are not fully applicable to other regions. Moreover, we only considered the direct impacts of land use and its change on ecosystem services, and did not include socioeconomic factors in the analysis. Thus, we were not able to show the socio-economically driven land use changes and their impacts on ecosystem services. Future studies can introduce socioeconomic factors to explore the impacts of land use change on ecosystem services in a more integrated and comprehensive manner.

5. Conclusions

In this study, our aim was to assess changes of land use and its impacts on typical ecosystem services (GP, WY, SC, HQ and CS) in Guangdong province in 1990, 1995, 2000, 2005, 2010, 2015, and 2020. The results of the analysis indicated that there had been significant changes in land use. Specifically, cultivated land, forest land, grassland, water areas, built-up land, and unused land correspondingly changed at a rate of −10.7%, −1.9%, −5.1%, 13.7%, 97.9%, and −38.8% from 1990 to 2020, indicating that Guangdong province had experienced rapid urban area expansion. Responding to land use changes, the average GP, WY, SC, HQ, and CS had correspondingly changed by −8.66% (−12.3 t·km−2), 3.10% (22 mm), −0.02% (−2 t·km−2), −2.74% (−0.02), and 20.70% (515 t·km−2) from 1990 to 2020, showing different spatial heterogeneity characteristics. Land use changed dramatically in relation to the increasing of urbanization in Guangdong province, and affected the ecosystem services directly. Among them, the types of land use conversion with the average greatest negative impacts on GP, WY, SC, HQ, and CS were cultivated land to built-up land (−150.9 t·km−2), unused land to water areas (−1072 mm), grassland to unused land (−10,166 t·km−2), forest land to built-up land (−0.65), and forest land to water areas (−2974 t·km−2), respectively, and with average greatest positive impacts were grassland to cultivated land (78.8 t·km−2), water areas to built-up land (943 mm), unused land to forest land (3552 t·km−2), built-up land to forest land (0.40), and water areas to forest land (3338 t·km−2), respectively. Therefore, it is evident that land serves as a cornerstone for the provision of ecosystem services that meet human requirements. In other words, land use patterns have unignorable impacts on ecosystem services. In future studies, we will add the social element of ecosystem services into the value evaluation, and the balance between the value of ecosystem services and the coordination of socioeconomic development will also be considered.

Author Contributions

Conceptualization, Z.L. and H.C.; methodology, Y.C. and H.W.; formal analysis, Z.L. and H.W.; data curation, X.C. and X.Z.; writing—original draft preparation, H.C. and H.W.; writing—review and editing, Z.L. and Y.C.; visualization, X.C. and X.Z.; supervision, H.C. All authors have read and agreed to the published version of the manuscript.

Funding

This research was funded by Ningbo Science and Technology Bureau (Grant No. 2022Z032) and the National Natural Science Foundation of China (Grant No. 41890824 and 71804175).

Institutional Review Board Statement

Not applicable.

Informed Consent Statement

Not applicable.

Data Availability Statement

All data and materials are available upon request.

Acknowledgments

We would like to thank the reviewers for their thoughtful comments that helped improve the quality of this work.

Conflicts of Interest

The authors declare no conflict of interest.

References

  1. Cochran, F.; Daniel, J.; Jackson, L.; Neale, A. Earth observation-based ecosystem services indicators for national and subnational reporting of the sustainable development goals. Remote Sens. Environ. 2020, 244, 111796. [Google Scholar] [CrossRef] [PubMed]
  2. Deng, X.; Li, Z.; Gibson, J. A review on trade-off analysis of ecosystem services for sustainable land-use management. J. Geogr. Sci. 2016, 26, 953–968. [Google Scholar] [CrossRef] [Green Version]
  3. Zheng, H.; Wang, L.; Peng, W.; Zhang, C.; Li, C.; Robinson Brian, E.; Wu, X.; Kong, L.; Li, R.; Xiao, Y.; et al. Realizing the values of natural capital for inclusive, sustainable development: Informing China’s new ecological development strategy. Proc. Natl. Acad. Sci. USA 2019, 116, 8623–8628. [Google Scholar] [CrossRef] [PubMed] [Green Version]
  4. Peng, K.; Jiang, W.; Ling, Z.; Hou, P.; Deng, Y. Evaluating the potential impacts of land use changes on ecosystem service value under multiple scenarios in support of SDG reporting: A case study of the Wuhan urban agglomeration. J. Clean. Prod. 2021, 307, 127321. [Google Scholar] [CrossRef]
  5. Schäfer, R.B.; Bundschuh, M.; Rouch, D.A.; Szöcs, E.; Peter, C.; Pettigrove, V.; Schulz, R.; Nugegoda, D.; Kefford, B.J. Effects of pesticide toxicity, salinity and other environmental variables on selected ecosystem functions in streams and the relevance for ecosystem services. Sci. Total Environ. 2012, 415, 69–78. [Google Scholar] [CrossRef]
  6. Arowolo, A.O.; Deng, X.; Olatunji, O.A.; Obayelu, A.E. Assessing changes in the value of ecosystem services in response to land-use/land-cover dynamics in Nigeria. Sci. Total Environ. 2018, 636, 597–609. [Google Scholar] [CrossRef]
  7. Deng, X.; Huang, J.; Rozelle, S.; Zhang, J.; Li, Z. Impact of urbanization on cultivated land changes in China. Land Use Policy 2015, 45, 1–7. [Google Scholar] [CrossRef]
  8. Mononen, L.; Auvinen, A.P.; Ahokumpu, A.L.; Rönkä, M.; Aarras, N.; Tolvanen, H.; Kamppinen, M.; Viirret, E.; Kumpula, T.; Vihervaara, P. National ecosystem service indicators: Measures of social–ecological sustainability. Ecol. Indic. 2016, 61, 27–37. [Google Scholar] [CrossRef]
  9. Fugère, V.; Nyboer, E.A.; Bleecker, J.C.; Chapman, L.J. Impacts of forest loss on inland waters: Identifying critical research zones based on deforestation rates, aquatic ecosystem services, and past research effort. Biol. Conserv. 2016, 201, 277–283. [Google Scholar] [CrossRef]
  10. McGlue, M.M.; Yeager, K.M.; Soreghan, M.J.; Behm, M.; Kimirei, I.A.; Cohen, A.S.; Apse, C.; Limbu, P.; Smiley, R.A.; Doering, D.; et al. Spatial variability in nearshore sediment pollution in Lake Tanganyika (East Africa) and implications for fisheries conservation. Anthropocene 2021, 33, 100281. [Google Scholar] [CrossRef]
  11. Cardinale, B.J.; Duffy, J.E.; Gonzalez, A.; Hooper, D.U.; Perrings, C.; Venail, P.; Narwani, A.; Mace, G.M.; Tilman, D.; Wardle, D.A.; et al. Biodiversity loss and its impact on humanity. Nature 2012, 486, 59–67. [Google Scholar] [CrossRef] [PubMed]
  12. Mu, H.; Li, X.; Ma, H.; Du, X.; Huang, J.; Su, W.; Yu, Z.; Xu, C.; Liu, H.; Yin, D.; et al. Evaluation of the policy-driven ecological network in the Three-North Shelterbelt region of China. Landsc. Urban Plan. 2022, 218, 104305. [Google Scholar] [CrossRef]
  13. United Nations. Transforming Our World: The 2030 Agenda for Sustainable Development; United Nations, Department of Economic and Social Affairs: New York, NY, USA, 2015. [Google Scholar]
  14. Liu, W.; Zhan, J.; Zhao, F.; Yan, H.; Zhang, F.; Wei, X. Impacts of urbanization-induced land-use changes on ecosystem services: A case study of the Pearl River Delta Metropolitan Region, China. Ecol. Indic. 2019, 98, 228–238. [Google Scholar] [CrossRef]
  15. Cai, Y.; Zhang, H.; Pan, W.; Chen, Y.; Wang, X. Land use pattern, socio-economic development, and assessment of their impacts on ecosystem service value: Study on natural wetlands distribution area (NWDA) in Fuzhou city, southeastern China. Environ. Monit. Assess. 2013, 185, 5111–5123. [Google Scholar] [CrossRef]
  16. Polasky, S.; Nelson, E.; Pennington, D.; Johnson, K.A. The impact of land-use change on ecosystem services, biodiversity and returns to landowners: A case study in the state of Minnesota. Environ. Resour. Econ. 2011, 48, 219–242. [Google Scholar] [CrossRef]
  17. Xie, L.; Wang, H.; Liu, S. The ecosystem service values simulation and driving force analysis based on land use/land cover: A case study in inland rivers in arid areas of the Aksu River Basin, China. Ecol. Indic. 2022, 138, 108828. [Google Scholar] [CrossRef]
  18. Hoque, M.Z.; Islam, I.; Ahmed, M.; Hasan, S.S.; Prodhan, F.A. Spatio-temporal changes of land use land cover and ecosystem service values in coastal Bangladesh. Egypt. J. Remote Sens. Space Sci. 2022, 25, 173–180. [Google Scholar] [CrossRef]
  19. Morshed, S.R.; Fattah, M.A.; Haque, M.N.; Morshed, S.Y. Future ecosystem service value modeling with land cover dynamics by using machine learning based Artificial Neural Network model for Jashore city, Bangladesh. Phys. Chem. Earth Parts A/B/C 2021, 126, 103021. [Google Scholar] [CrossRef]
  20. Grafius, D.R.; Corstanje, R.; Warren, P.H.; Evans, K.L.; Hancock, S.; Harris, J.A. The impact of land use/land cover scale on modelling urban ecosystem services. Landsc. Ecol. 2016, 31, 1509–1522. [Google Scholar] [CrossRef] [Green Version]
  21. Boavida-Portugal, I.; Rocha, J.; Ferreira, C.C. Exploring the impacts of future tourism development on land use/cover changes. Appl. Geogr. 2016, 77, 82–91. [Google Scholar] [CrossRef]
  22. Romano, G.; Dal Sasso, P.; Liuzzi, G.T.; Gentile, F. Multi-criteria decision analysis for land suitability mapping in a rural area of Southern Italy. Land Use Policy 2015, 48, 131–143. [Google Scholar] [CrossRef]
  23. Sharma, R.; Nehren, U.; Rahman, S.A.; Meyer, M.; Rimal, B.; Aria Seta, G.; Baral, H. Modeling land use and land cover changes and their effects on biodiversity in Central Kalimantan, Indonesia. Land 2018, 7, 57. [Google Scholar] [CrossRef] [Green Version]
  24. Alkemade, R.; Van Oorschot, M.; Miles, L.; Nellemann, C.; Bakkenes, M.; Ten Brink, B. GLOBIO3: A framework to investigate options for reducing global terrestrial biodiversity loss. Ecosystems 2009, 12, 374–390. [Google Scholar] [CrossRef] [Green Version]
  25. Gao, J.; Li, F.; Gao, H.; Zhou, C.; Zhang, X. The impact of land-use change on water-related ecosystem services: A study of the Guishui River Basin, Beijing, China. J. Clean. Prod. 2017, 163, S148–S155. [Google Scholar] [CrossRef]
  26. Daily, G.C.; Polasky, S.; Goldstein, J.; Kareiva, P.M.; Mooney, H.A.; Pejchar, L.; Ricketts, T.H.; Salzman, J.; Shallenberger, R. Ecosystem services in decision making: Time to deliver. Front. Ecol. Environ. 2009, 7, 21–28. [Google Scholar] [CrossRef] [Green Version]
  27. Yang, J.; Tan, Y.; Xue, D. The impacts of globalization on city environments in developing countries: A case study of 21 cities in Guangdong Province, China. J. Clean. Prod. 2019, 240, 118273. [Google Scholar] [CrossRef]
  28. Wang, J.; Wang, S.; Li, S.; Feng, K. Coupling analysis of urbanization and energy-environment efficiency: Evidence from Guangdong province. Appl. Energy 2019, 254, 113650. [Google Scholar] [CrossRef]
  29. Nachtergaele, F.; Velthuizen, H.; Verelst, L.; Wiberg, D. Harmonized World Soil Database (HWSD); Food and Agriculture Organization of the United Nations: Rome, Italy, 2009. [Google Scholar]
  30. Liu, W.; Zhan, J.; Zhao, F.; Wang, C.; Zhang, F.; Teng, Y.; Chu, X.; Kumi, M.A. Spatio-temporal variations of ecosystem services and their drivers in the Pearl River Delta, China. J. Clean. Prod. 2022, 337, 130466. [Google Scholar] [CrossRef]
  31. Ye, Y.; Zhang, J.; Wang, T.; Bai, H.; Wang, X.; Zhao, W. Changes in land-use and ecosystem service value in guangdong province, southern China, from 1990 to 2018. Land 2021, 10, 426. [Google Scholar] [CrossRef]
  32. Rimal, B.; Sharma, R.; Kunwar, R.; Keshtkar, H.; Stork, N.E.; Rijal, S.; Rahman, S.A.; Baral, H. Effects of land use and land cover change on ecosystem services in the Koshi River Basin, Eastern Nepal. Ecosyst. Serv. 2019, 38, 100963. [Google Scholar] [CrossRef]
  33. Deng, C.; Zhu, D.; Nie, X.; Liu, C.; Zhang, G.; Liu, Y.; Li, Z.; Wang, S.; Ma, Y. Precipitation and urban expansion caused jointly the spatiotemporal dislocation between supply and demand of water provision service. J. Environ. Manag. 2021, 299, 113660. [Google Scholar] [CrossRef] [PubMed]
  34. Yin, C.; Zhao, W.; Pereira, P. Soil conservation service underpins sustainable development goals. Glob. Ecol. Conserv. 2022, 33, e01974. [Google Scholar] [CrossRef]
  35. Terrado, M.; Sabater, S.; Chaplin-Kramer, B.; Mandle, L.; Ziv, G.; Acuña, V. Model development for the assessment of terrestrial and aquatic habitat quality in conservation planning. Sci. Total Environ. 2016, 540, 63–70. [Google Scholar] [CrossRef] [PubMed] [Green Version]
  36. Liang, Y.; Hashimoto, S.; Liu, L. Integrated assessment of land-use/land-cover dynamics on carbon storage services in the Loess Plateau of China from 1995 to 2050. Ecol. Indic. 2021, 120, 106939. [Google Scholar] [CrossRef]
  37. Garrastazú, M.C.; Mendonça, S.D.; Horokoski, T.T.; Cardoso, D.J.; Rosot, M.A.; Nimmo, E.R.; Lacerda, A.E. Carbon sequestration and riparian zones: Assessing the impacts of changing regulatory practices in Southern Brazil. Land Use Policy 2015, 42, 329–339. [Google Scholar] [CrossRef]
  38. Stockmann, U.; Adams, M.A.; Crawford, J.W.; Field, D.J.; Henakaarchchi, N.; Jenkins, M.; Minasny, B.; McBratney, A.B.; Courcelles, V.d.R.d.; Singh, K.; et al. The knowns, known unknowns and unknowns of sequestration of soil organic carbon. Agric. Ecosyst. Environ. 2013, 164, 80–99. [Google Scholar] [CrossRef]
  39. Güner, Ş.T.; Erkan, N.; Karataş, R. Effects of afforestation with different species on carbon pools and soil and forest floor properties. Catena 2021, 196, 104871. [Google Scholar] [CrossRef]
  40. Tasser, E.; Schirpke, U.; Zoderer, B.M.; Tappeiner, U. Towards an integrative assessment of land-use type values from the perspective of ecosystem services. Ecosyst. Serv. 2020, 42, 101082. [Google Scholar] [CrossRef]
  41. Hasan, S.S.; Zhen, L.; Miah, M.G.; Ahamed, T.; Samie, A. Impact of land use change on ecosystem services: A review. Environ. Dev. 2020, 34, 100527. [Google Scholar] [CrossRef]
  42. Díaz, S.; Demissew, S.; Carabias, J.; Joly, C.; Lonsdale, M.; Ash, N.; Larigauderie, A.; Adhikari, J.R.; Arico, S.; Báldi, A. The IPBES Conceptual Framework—connecting nature and people. Curr. Opin. Environ. Sustain. 2015, 14, 1–16. [Google Scholar] [CrossRef] [Green Version]
  43. Gómez-Baggethun, E.; Barton, D.N. Classifying and valuing ecosystem services for urban planning. Ecol. Econ. 2013, 86, 235–245. [Google Scholar] [CrossRef]
  44. Silvestri, S.; Zaibet, L.; Said, M.Y.; Kifugo, S.C. Valuing ecosystem services for conservation and development purposes: A case study from Kenya. Environ. Sci. Policy 2013, 31, 23–33. [Google Scholar] [CrossRef]
Figure 1. Geographical location of Guangdong province, China.
Land 11 00809 g001
Figure 2. Land use of Guangdong province in 2020.
Land 11 00809 g002
Figure 3. Area changes of each land use type in Guangdong, 1990–2020.
Land 11 00809 g003
Figure 4. Area change rates of each land use type in Guangdong, 1990–2020.
Land 11 00809 g004
Figure 5. Spatial distribution and changes of the five key ecosystem services in Guangdong province, 1990–2020 ((ac): grain production in 1990, 2020 and its changes during 1990–2020; (df): water yield in 1990, 2020 and its changes during 1990–2020; (gi): soil conservation in 1990, 2020 and its changes during 1990–2020; (jl): habit quality in 1990, 2020 and its changes during 1990–2020; (mo): carbon sequestration in 1990, 2020 and its changes during 1990–2020.)
Land 11 00809 g005
Figure 6. Average change of the five key ecosystem services corresponding to different land use conversion types in Guangdong province, 1990–2020.
Land 11 00809 g006
Table 1. Input data for ecosystem services assessment in Guangdong province.
DataDescriptionData Source
Land useLand use in 1990, 1995, 2000, 2005, 2010, 2015 and 2020 with a resolution of 1 km.The Data Center for Resources and Environmental Sciences, Chinese Academy of Sciences (http://www.resdc.cn/) (accessed on 12 March 2022).
Topography dataDigital elevation model (DEM) with a resolution of 1 km.
Meteorological dataDaily meteorological data, including precipitation, temperature, evapotranspiration, and solar radiation etc., during 1990–2020The National Meteorological Information Center (http://data.cma.cn/) (accessed on 14 February 2022)
Soil tyeps and propertiesSoil data, including soil depth, clay content, silt content, sand content, clay content, organic carbon content, gravel content, and electrical conductivity, with a resolution of 1 km.The Harmonized World Soil Database [29].
Grain production dataGrain production per unit area of cities in Guangdong province from 2013 to 2020Statistical Yearbook of Guangdong Province
Table 2. Descriptions of the selected ecosystem services.
Ecosystem ServicesDescription
Grain production (GP)GP is one of the most basic supply services of ecosystem and provides material guarantee for human survival and development [32].
Water yield (WY)The provision of freshwater is one of the ecosystem service functions that plays a crucial role in promoting biological survival and ensuring ecological security [33].
Soil conservation (SC)SC is one of the important ecosystem services, representing the ability of ecosystems to protect soil and control erosion [34].
Habitat quality (HQ)Biodiversity is closely linked to the production of ecosystem services, and HQ is an expression of the ability of ecosystems to provide permanent living conditions for organisms [35].
Carbon sequestration (CS)CS is considered as one of the most critical ecosystem services for assessing the response of productive capacity and ecological resilience to climate change [36].
Table 3. Land use structure changes in Guangdong province, 1990–2020.
Land Use Type199020201990–2020
Area (km2)Percentage (%)Area (km2)Percentage (%)Amount and Rate of Change (km2/%)
Cultivated land47,23626.6542,19923.81−5037 (−10.7)
Forest land108,17561.03106,11059.87−2065 (−1.9)
Grassland80104.5276054.29−405 (−5.1)
Water areas68563.8777974.40941 (13.7)
Built-up land67803.8313,4177.576637 (97.9)
Unused land1830.101120.06−71 (−38.8)
Publisher’s Note: MDPI stays neutral with regard to jurisdictional claims in published maps and institutional affiliations.

